
CALCULUS I
Solutions to Practice Problems
Applications of Integrals
Paul Dawkins
Calculus I
© 2007 Paul Dawkins
i
http://tutorial.math.lamar.edu/terms.aspx
Table of Contents
Preface ............................................................................................................................................ 1
Applications of Integrals ............................................................................................................... 1
Average Function Value ........................................................................................................................... 1
Area Between Curves ............................................................................................................................... 3
Volumes of Solids of Revolution / Method of Rings ..............................................................................21
Volumes of Solids of Revolution / Method of Cylinders .......................................................................47
More Volume Problems ...........................................................................................................................73
Work .........................................................................................................................................................86
Preface
Here are the solutions to the practice problems for my Calculus I notes. Some solutions will have
more or less detail than other solutions. The level of detail in each solution will depend up on
several issues. If the section is a review section, this mostly applies to problems in the first
chapter, there will probably not be as much detail to the solutions given that the problems really
should be review. As the difficulty level of the problems increases less detail will go into the
basics of the solution under the assumption that if you’ve reached the level of working the harder
problems then you will probably already understand the basics fairly well and won’t need all the
explanation.
This document was written with presentation on the web in mind. On the web most solutions are
broken down into steps and many of the steps have hints. Each hint on the web is given as a
popup however in this document they are listed prior to each step. Also, on the web each step can
be viewed individually by clicking on links while in this document they are all showing. Also,
there are liable to be some formatting parts in this document intended for help in generating the
web pages that haven’t been removed here. These issues may make the solutions a little difficult
to follow at times, but they should still be readable.
Applications of Integrals
Average Function Value
1. Determine
avg
f
for
( )
2
8
3 5
x
f x
x
−
=
− + e
on
[ ]
0, 2
.
Solution
Calculus I
© 2007 Paul Dawkins
2
http://tutorial.math.lamar.edu/terms.aspx
There really isn’t all that much to this problem other than use the formula given in the notes for
this section.
(
)
(
)
2
2
2
2
2
2
1
1
1
avg
2 0
2
2
0
0
8
3 5
4
3
5
5 5
x
x
f
x
dx
x
x
−
−
−
=
− +
=
−
−
=
+
∫
e
e
e
Note that we are assuming your integration skills are pretty good at this point and won’t be
showing many details of the actual integration process. This includes not showing substitutions
such as the substitution needed for the third term (you did catch that correct?).
2. Determine
avg
f
for
( )
( )
( )
2
cos 2
sin
x
f x
x
=
−
on
2
,
π
π
−
.
Solution
There really isn’t all that much to this problem other than use the formula given in the notes for
this section.
( )
( )
( )
( )
( )
(
)
2
2
2
2 2
1
2
1
avg
2
3
2
2
3
cos 2
sin
sin 2
2 cos
x
x
f
x
dx
x
π
π
π
π
π
π
π
π
− −
−
−
=
−
=
+
= −
∫
Note that we are assuming your integration skills are pretty good at this point and won’t be
showing many details of the actual integration process. This includes not showing either of the
substitutions needed for the integral (you did catch both of them correct?).
3. Find
avg
f
for
( )
2
4
5
f x
x
x
=
− +
on
[
]
2, 3
−
and determine the value(s) of c in
[
]
2, 3
−
for
which
( )
avg
f c
f
=
.
Step 1
First we need to use the formula for the notes in this section to find
avg
f
.
( )
(
)
3
3
2
3
2
83
1
1
4
1
avg
5
3
2
6
3
2
2
2
4
5
5
f
x
x
dx
x
x
x
− −
−
−
=
− +
=
−
+
=
∫
Step 2
Note that for the second part of this problem we are really just asking to find the value of c that
satisfies the Mean Value Theorem for Integrals.
Calculus I
© 2007 Paul Dawkins
3
http://tutorial.math.lamar.edu/terms.aspx
There really isn’t much to do here other than solve
( )
avg
f c
f
=
.
( )
( )
( )
( )
53
427
6
3
2
83
6
1
1 4 4
1
2
53
6
2 4
2 4
4
5
4
0
1.3663, 1.6163
c
c
c
c
c
± −
−
±
− + =
− − =
⇒
=
=
= −
So, unlike the example from the notes both of the numbers that we found here are in the interval
and so are both included in the answer.
Area Between Curves
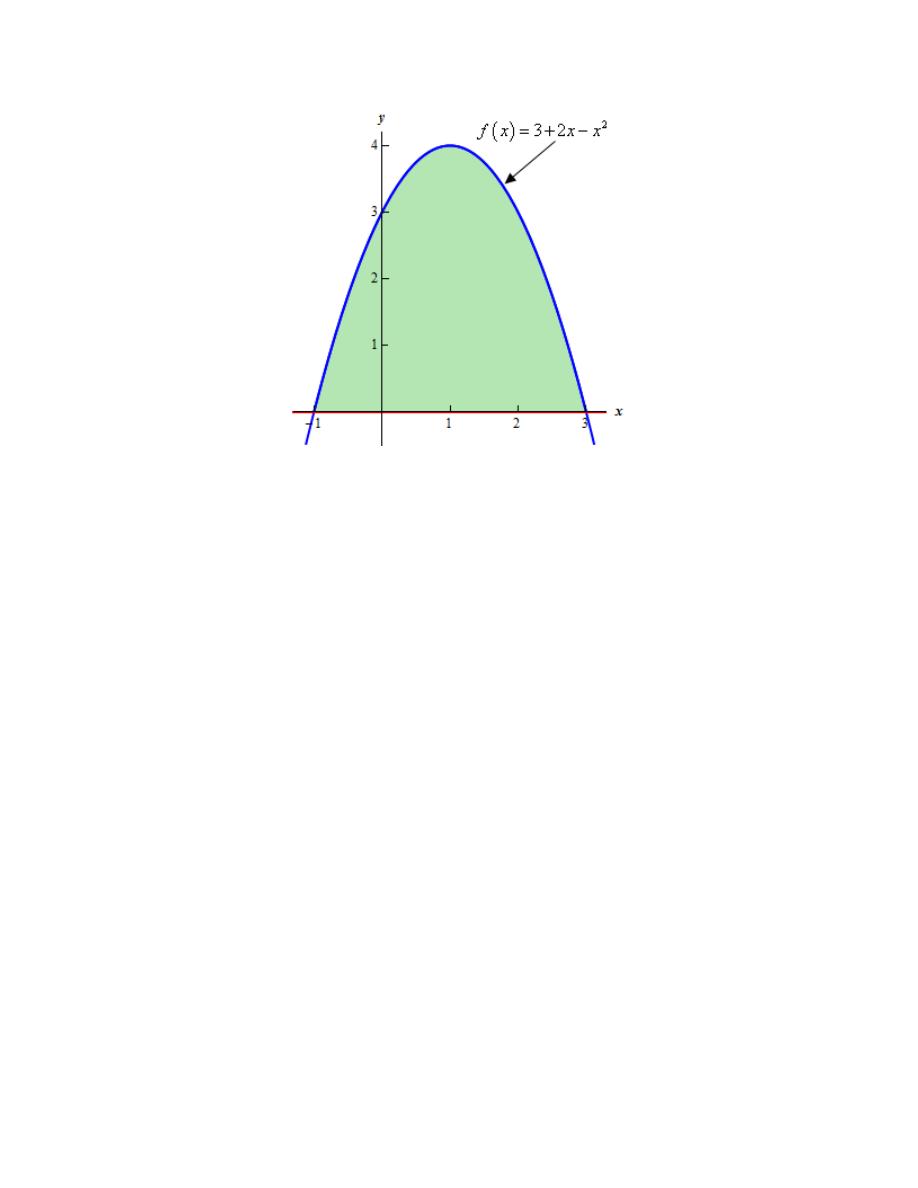
1. Determine the area below
( )
2
3 2
f x
x
x
= +
−
and above the x-axis.
Hint : It’s generally best to sketch the bounded region that we want to find the area of before
starting the actual problem. Having the sketch of the graph will usually help with determining the
upper/lower functions and the limits for the integral.
Step 1
Let’s start off with getting a sketch of the region we want to find the area of.
We are assuming that, at this point, you are capable of graphing most of the basic functions that
we’re dealing with in these problems and so we won’t be showing any of the graphing work here.
Here is a sketch of the bounded region we want to find the area of.
Calculus I
© 2007 Paul Dawkins
4
http://tutorial.math.lamar.edu/terms.aspx
Step 2
It should be clear from the graph that the upper function is the parabola (i.e.
2
3 2
y
x
x
= +
−
) and
the lower function is the x-axis (i.e.
0
y
=
).
Since we weren’t given any limits on x in the problem statement we’ll need to get those. From
the graph it looks like the limits are (probably)
1
3
x
− ≤ ≤
. However, we should never just
assume that our graph is accurate or that we were able to read it accurately. For all we know the
limits are close to those we guessed from the graph but are in fact slightly different.
So, to determine if we guessed the limits correctly from the graph let’s find them directly. The
limits are where the parabola crosses the x-axis and so all we need to do is set the parabola equal
to zero (i.e. where it crosses the line
0
y
=
) and solve. Doing this gives,
(
)(
)
2
3 2
0
1
3
0
1,
3
x
x
x
x
x
x
+
−
=
→
− +
− =
→
= −
=
So, we did guess correctly, but it never hurts to be sure. That is especially true here where
finding them directly takes almost no time.
Step 3
At this point there isn’t much to do other than step up the integral and evaluate it.
We are assuming that you are comfortable with basic integration techniques so we’ll not be
including any discussion of the actual integration process here and we will be skipping some of
the intermediate steps.
The area is,
Calculus I
© 2007 Paul Dawkins
5
http://tutorial.math.lamar.edu/terms.aspx
(
)
3
3
2
2
3
32
1
3
3
1
1
3 2
3
A
x
x dx
x
x
x
−
−
=
+
−
=
+
−
=
∫
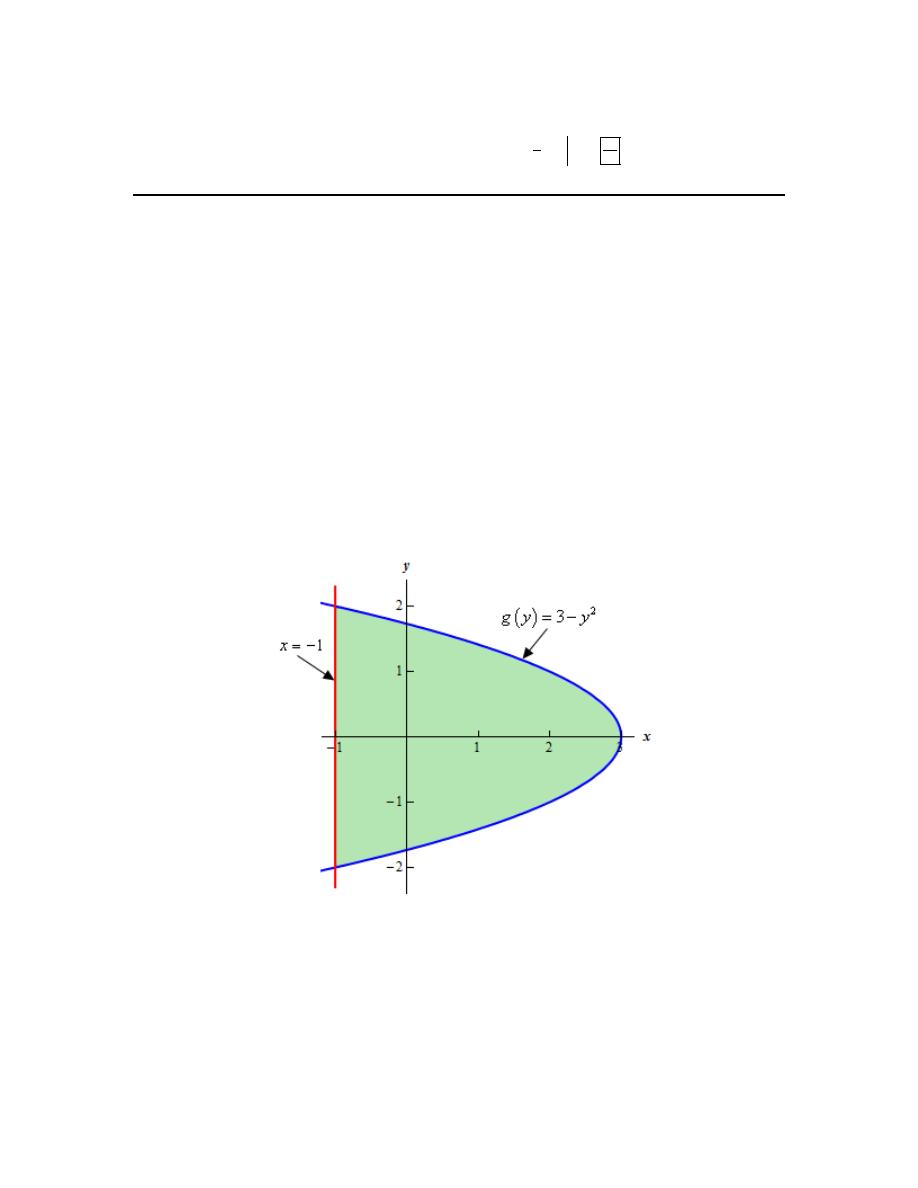
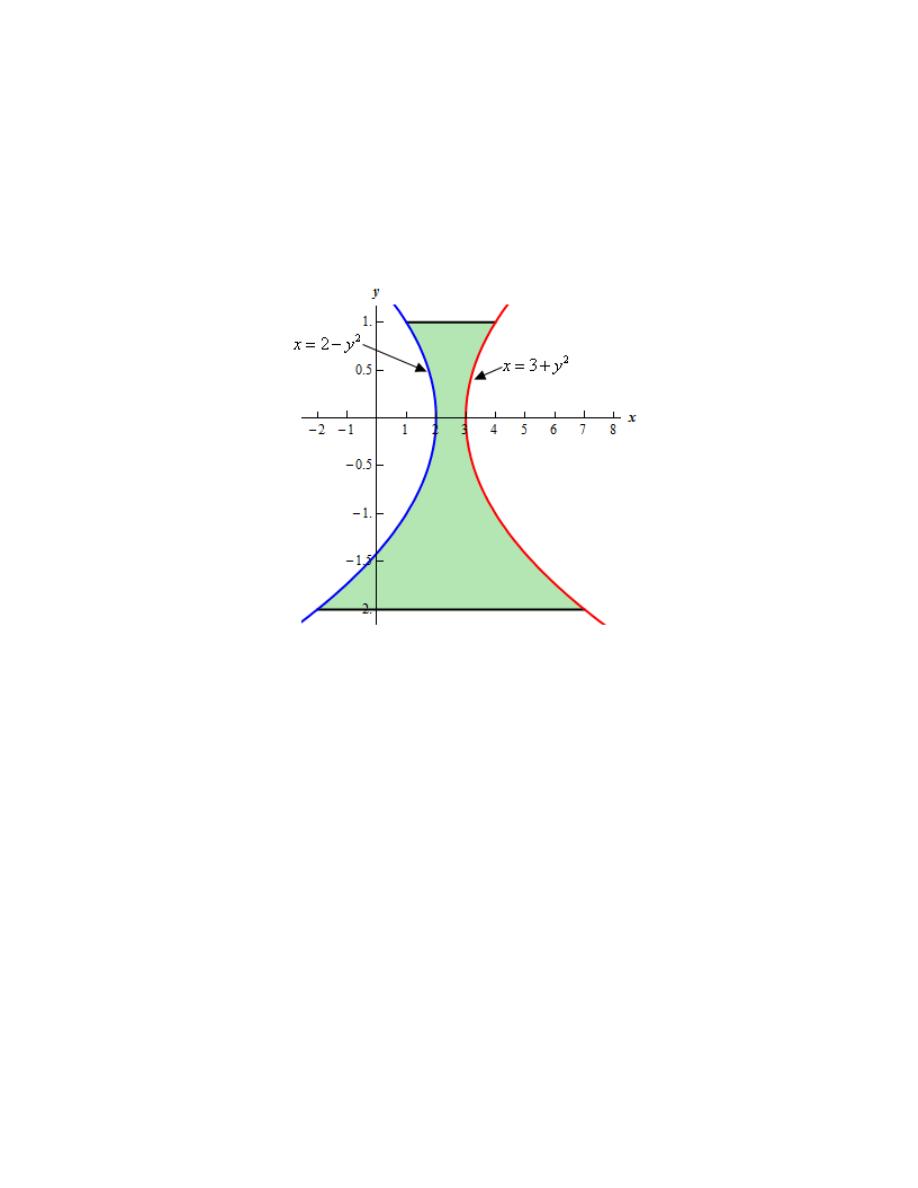
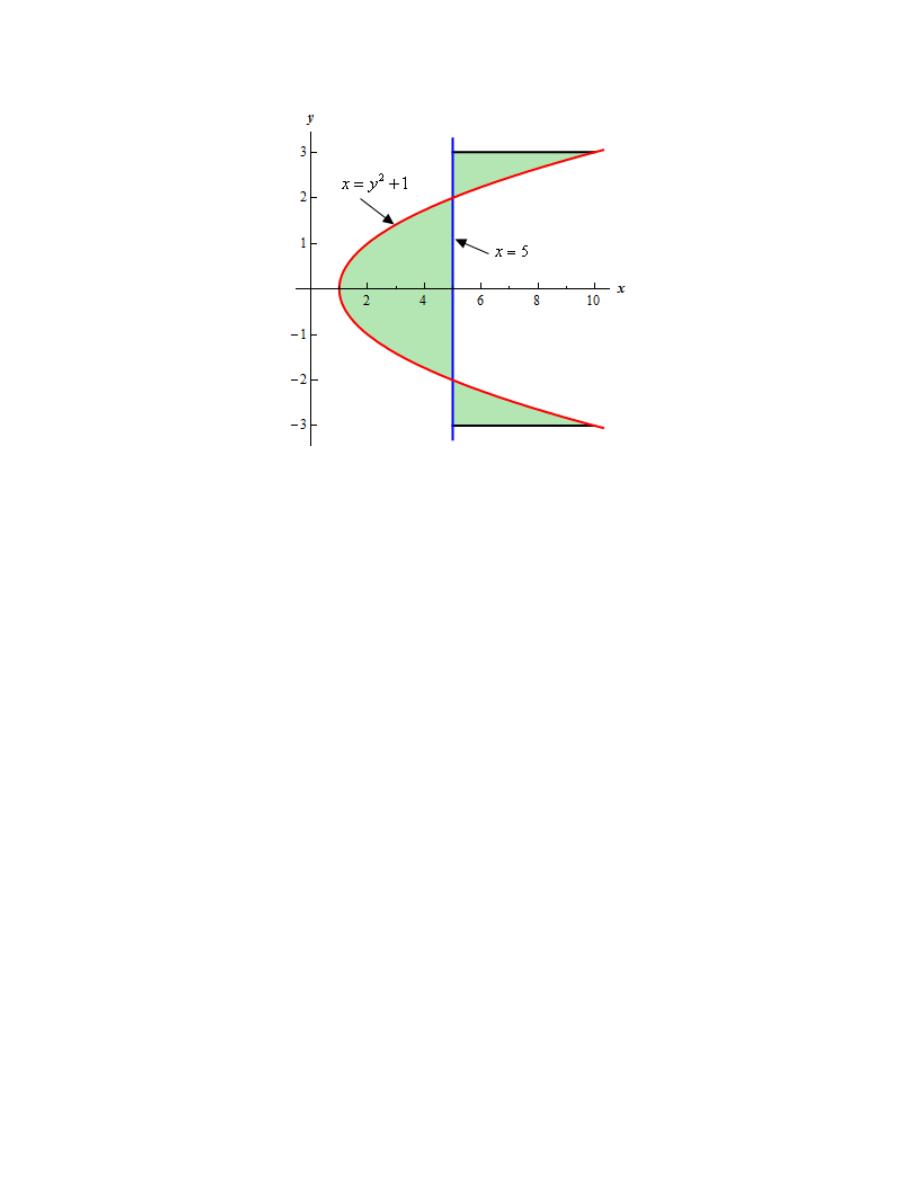
2. Determine the area to the left of
( )
2
3
g y
y
= −
and to the right of
1
x
= −
.
Hint : It’s generally best to sketch the bounded region that we want to find the area of before
starting the actual problem. Having the sketch of the graph will usually help with determining the
right/left functions and the limits for the integral.
Step 1
Let’s start off with getting a sketch of the region we want to find the area of.
We are assuming that, at this point, you are capable of graphing most of the basic functions that
we’re dealing with in these problems and so we won’t be showing any of the graphing work here.
Here is a sketch of the bounded region we want to find the area of.
Step 2
It should be clear from the graph that the right function is the parabola (i.e.
2
3
x
y
= −
) and the
left function is the line
1
x
= −
.
Since we weren’t given any limits on y in the problem statement we’ll need to get those.
However, we should never just assume that our graph is accurate or that we will be able to read it
accurately enough to guess the limits from the graph. This is especially true when the
Calculus I
© 2007 Paul Dawkins
6
http://tutorial.math.lamar.edu/terms.aspx
intersection points of the two curves (i.e. the limits on y that we need) do not occur on an axis (as
they don’t in this case).
So, to determine the intersection points correctly we’ll need to find them directly. The
intersection points are where the two curves intersect and so all we need to do is set the two
equations equal and solve. Doing this gives,
2
2
3
1
4
2,
2
y
y
y
y
−
= −
→
=
→
= −
=
So, the limits on y are :
2
2
y
− ≤ ≤
.
Step 3
At this point there isn’t much to do other than step up the integral and evaluate it.
We are assuming that you are comfortable with basic integration techniques so we’ll not be
including any discussion of the actual integration process here and we will be skipping some of
the intermediate steps.
The area is,
( )
(
)
2
2
2
2
2
3
32
1
3
3
2
2
2
3
1
4
4
A
y
dy
y dy
y
y
−
−
−
=
−
− −
=
−
=
−
=
∫
∫
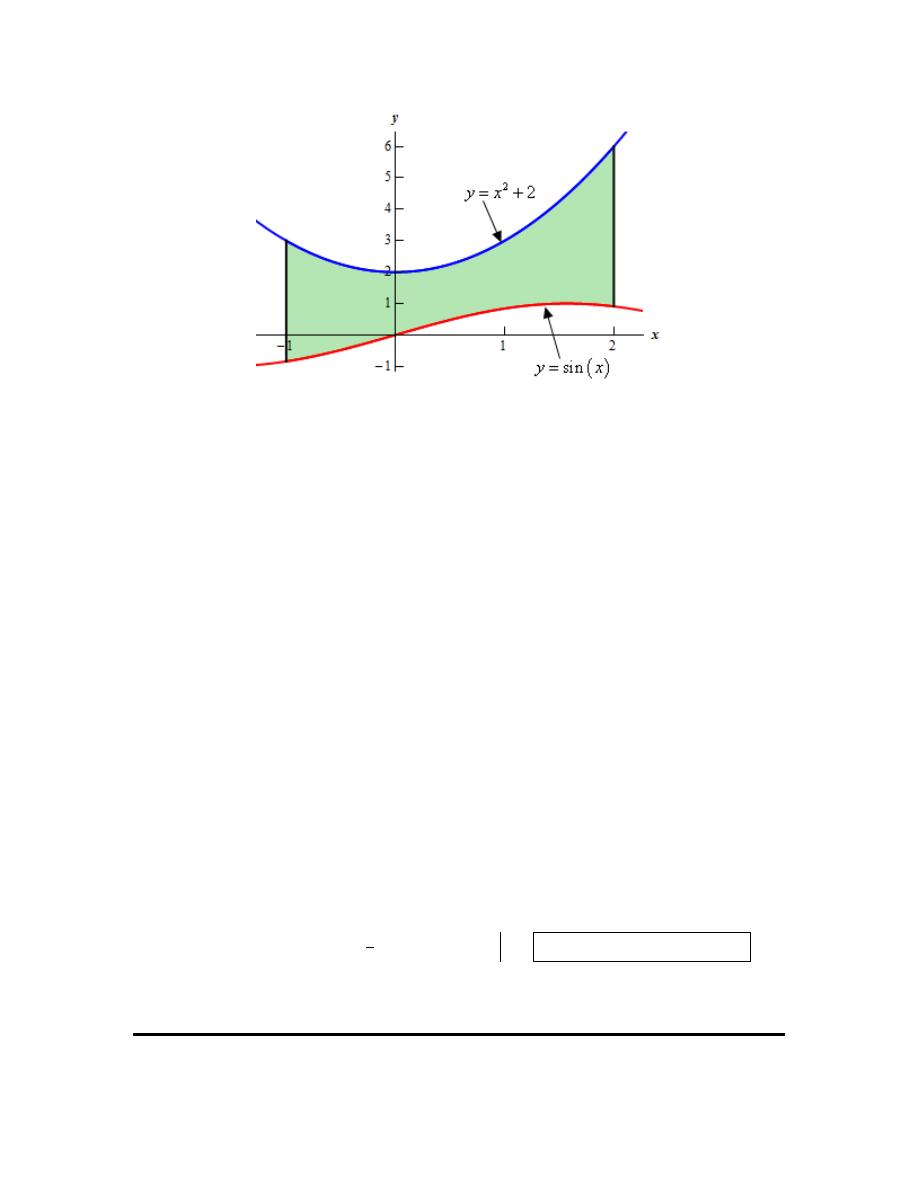
3. Determine the area of the region bounded by
2
2
y
x
=
+
,
( )
sin
y
x
=
,
1
x
= −
and
2
x
=
.
Hint : It’s generally best to sketch the bounded region that we want to find the area of before
starting the actual problem. Having the sketch of the graph will usually help with determining the
upper/lower functions and the limits for the integral.
Step 1
Let’s start off with getting a sketch of the region we want to find the area of.
We are assuming that, at this point, you are capable of graphing most of the basic functions that
we’re dealing with in these problems and so we won’t be showing any of the graphing work here.
Here is a sketch of the bounded region we want to find the area of.
Calculus I
© 2007 Paul Dawkins
7
http://tutorial.math.lamar.edu/terms.aspx
Step 2
It should be clear from the graph that the upper function is
2
2
y
x
=
+
and the lower function is
( )
sin
y
x
=
.
Next, we were given limits on x in the problem statement and we can see that the two curves do
not intersect in that range. Note that this is something that we can’t always guarantee and so we
need the graph to verify if the curves intersect or not. We should never just assume that because
limits on x were given in the problem statement that the curves will not intersect anywhere
between the given limits.
So, because the curves do not intersect we will be able to find the area with a single integral using
the limits :
1
2
x
− ≤ ≤
.
Step 3
At this point there isn’t much to do other than step up the integral and evaluate it.
We are assuming that you are comfortable with basic integration techniques so we’ll not be
including any discussion of the actual integration process here and we will be skipping some of
the intermediate steps.
The area is,
( )
( )
(
)
( )
( )
2
2
2
3
1
3
1
1
2 sin
2
cos
9 cos 2
cos 1
8.04355
A
x
x dx
x
x
x
−
−
=
+ −
=
+
+
= +
−
=
∫
Don’t forget to set your calculator to radians if you take the answer to a decimal.

Calculus I
© 2007 Paul Dawkins
8
http://tutorial.math.lamar.edu/terms.aspx
4. Determine the area of the region bounded by
8
y
x
=
,
2
y
x
=
and
4
x
=
.
Hint : It’s generally best to sketch the bounded region that we want to find the area of before
starting the actual problem. Having the sketch of the graph will usually help with determining the
upper/lower functions and the limits for the integral.
Step 1
Let’s start off with getting a sketch of the region we want to find the area of.
We are assuming that, at this point, you are capable of graphing most of the basic functions that
we’re dealing with in these problems and so we won’t be showing any of the graphing work here.
Here is a sketch of the bounded region we want to find the area of.
For this problem we were only given one limit on x (i.e.
4
x
=
). To determine just what the
region we are after recall that we are after a bounded region. This means that one of the given
curves must be on each boundary of the region.
Therefore we can’t use any portion of the region to the right of the line
4
x
=
because there will
never be a boundary on the right of that region.
We also can’t take any portion of the region to the left of the intersection point. Because the first
function is not continuous at
0
x
=
we can’t use any region that includes
0
x
=
. Therefore any
portion of the region to the left of the intersection point would have to stop prior to the y-axis and
any region like that would not have any of the given curves on the left boundary.
The region is then the one shown in graph above. We will take the region to the left of the line
4
x
=
and to the right of the intersection point.
Calculus I
© 2007 Paul Dawkins
9
http://tutorial.math.lamar.edu/terms.aspx
Step 2
We now need to determine the intersection point. However, we should never just assume that our
graph is accurate or that we will be able to read it accurately enough to guess the coordinates
from the graph. This is especially true when the intersection point of the two curves does not
occur on an axis (as they don’t in this case).
So, to determine the intersection point correctly we’ll need to find it directly. The intersection
point is where the two curves intersect and so all we need to do is set the two equations equal and
solve. Doing this gives,
2
8
2
4
2,
2
x
x
x
x
x
=
→
=
→
= −
=
Note that while we got two answers here the negative value does not make any sense because to
get to that value we would have to go through
0
x
=
and as we discussed above the bounded
region cannot contain
0
x
=
.
Therefore the limits on x are :
2
4
x
≤ ≤
.
It should also be clear from the graph and the limits above that the upper function is
2
y
x
=
and
the lower function is
8
y
x
=
.
Step 3
At this point there isn’t much to do other than step up the integral and evaluate it.
We are assuming that you are comfortable with basic integration techniques so we’ll not be
including any discussion of the actual integration process here and we will be skipping some of
the intermediate steps.
The area is,
(
)
( )
( )
4
4
2
2
2
8
2
8 ln
12 8 ln 4
8 ln 2
6.4548
A
x
dx
x
x
x
=
−
=
−
=
−
+
=
⌠
⌡
5. Determine the area of the region bounded by
2
3
x
y
= +
,
2
2
x
y
= −
,
1
y
=
and
2
y
= −
.
Hint : It’s generally best to sketch the bounded region that we want to find the area of before
starting the actual problem. Having the sketch of the graph will usually help with determining the
right/left functions and the limits for the integral.
Calculus I
© 2007 Paul Dawkins
10
http://tutorial.math.lamar.edu/terms.aspx
Step 1
Let’s start off with getting a sketch of the region we want to find the area of.
We are assuming that, at this point, you are capable of graphing most of the basic functions that
we’re dealing with in these problems and so we won’t be showing any of the graphing work here.
Here is a sketch of the bounded region we want to find the area of.
Step 2
It should be clear from the graph that the right function is
2
3
x
y
= +
and the left function is
2
2
x
y
= −
.
Next, we were given limits on y in the problem statement and we can see that the two curves do
not intersect in that range. Note that this is something that we can’t always guarantee and so we
need the graph to verify if the curves intersect or not. We should never just assume that because
limits on y were given in the problem statement that the curves will not intersect anywhere
between the given limits.
So, because the curves do not intersect we will be able to find the area with a single integral using
the limits :
2
1
y
− ≤ ≤
.
Step 3
At this point there isn’t much to do other than step up the integral and evaluate it.
Calculus I
© 2007 Paul Dawkins
11
http://tutorial.math.lamar.edu/terms.aspx
We are assuming that you are comfortable with basic integration techniques so we’ll not be
including any discussion of the actual integration process here and we will be skipping some of
the intermediate steps.
The area is,
(
)
(
)
1
1
1
2
2
2
3
2
3
2
2
2
3
2
1 2
9
A
y
y
dy
y dy
y
y
−
−
−
=
+
− −
=
+
=
+
=
∫
∫
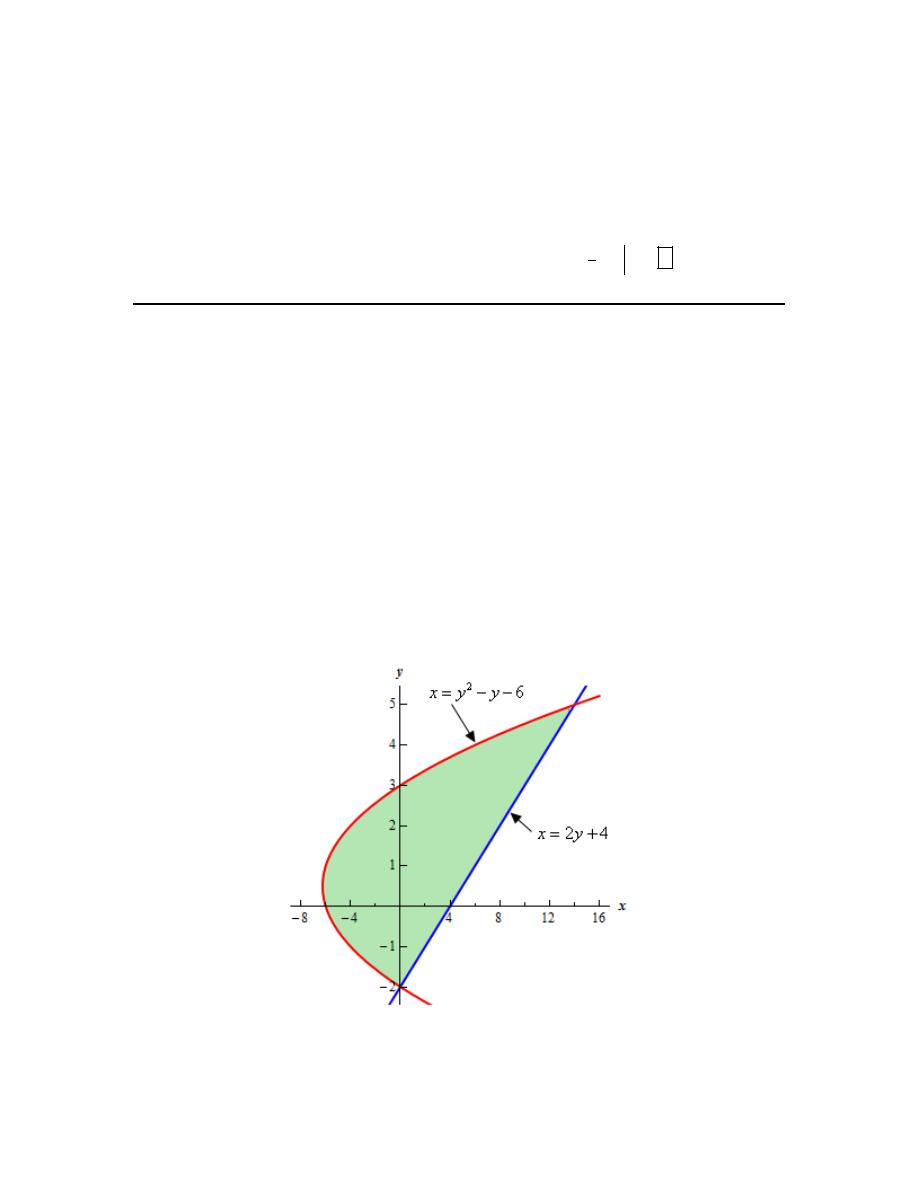
6. Determine the area of the region bounded by
2
6
x
y
y
=
− −
and
2
4
x
y
=
+
.
Hint : It’s generally best to sketch the bounded region that we want to find the area of before
starting the actual problem. Having the sketch of the graph will usually help with determining the
right/left functions and the limits for the integral.
Step 1
Let’s start off with getting a sketch of the region we want to find the area of.
We are assuming that, at this point, you are capable of graphing most of the basic functions that
we’re dealing with in these problems and so we won’t be showing any of the graphing work here.
Here is a sketch of the bounded region we want to find the area of.
Note that we won’t include any portion of the region above the top intersection point or below the
bottom intersection point. The region needs to be bounded by one of the given curves on each
Calculus I
© 2007 Paul Dawkins
12
http://tutorial.math.lamar.edu/terms.aspx
boundary. If we went past the top intersection point we would not have an upper bound on the
region. Likewise, if we went past the bottom intersection point we would not have a lower bound
on the region.
Step 2
It should be clear from the graph that the right function is
2
4
x
y
=
+
and the left function is
2
6
x
y
y
=
− −
.
Since we weren’t given any limits on y in the problem statement we’ll need to get those.
However, we should never just assume that our graph is accurate or that we will be able to read it
accurately enough to guess the coordinates from the graph. This is especially true when the
intersection points of the two curves (i.e. the limits on y that we need) do not occur on an axis (as
they don’t in this case).
So, to determine the intersection points correctly we’ll need to find them directly. The
intersection points are where the two curves intersect and so all we need to do is set the two
equations equal and solve. Doing this gives,
(
)(
)
2
2
6
2
4
3
10
5
2
0
2,
5
y
y
y
y
y
y
y
y
y
− − =
+
→
−
−
=
−
+
=
→
= −
=
Therefore the limits on y are :
2
5
y
− ≤ ≤
.
Note that you may well have found the intersection points in the first step to help with the graph
if you were graphing by hand which is not a bad idea with faced with graphing this kind of
region.
Step 3
At this point there isn’t much to do other than step up the integral and evaluate it.
We are assuming that you are comfortable with basic integration techniques so we’ll not be
including any discussion of the actual integration process here and we will be skipping some of
the intermediate steps.
The area is,
(
)
(
)
5
5
5
2
2
2
3
3
343
1
2
3
6
2
2
2
2
4
6
10 3
10
A
y
y
y
dy
y
y dy
y
y
y
−
−
−
=
+ −
− −
=
+
−
=
+
−
=
∫
∫
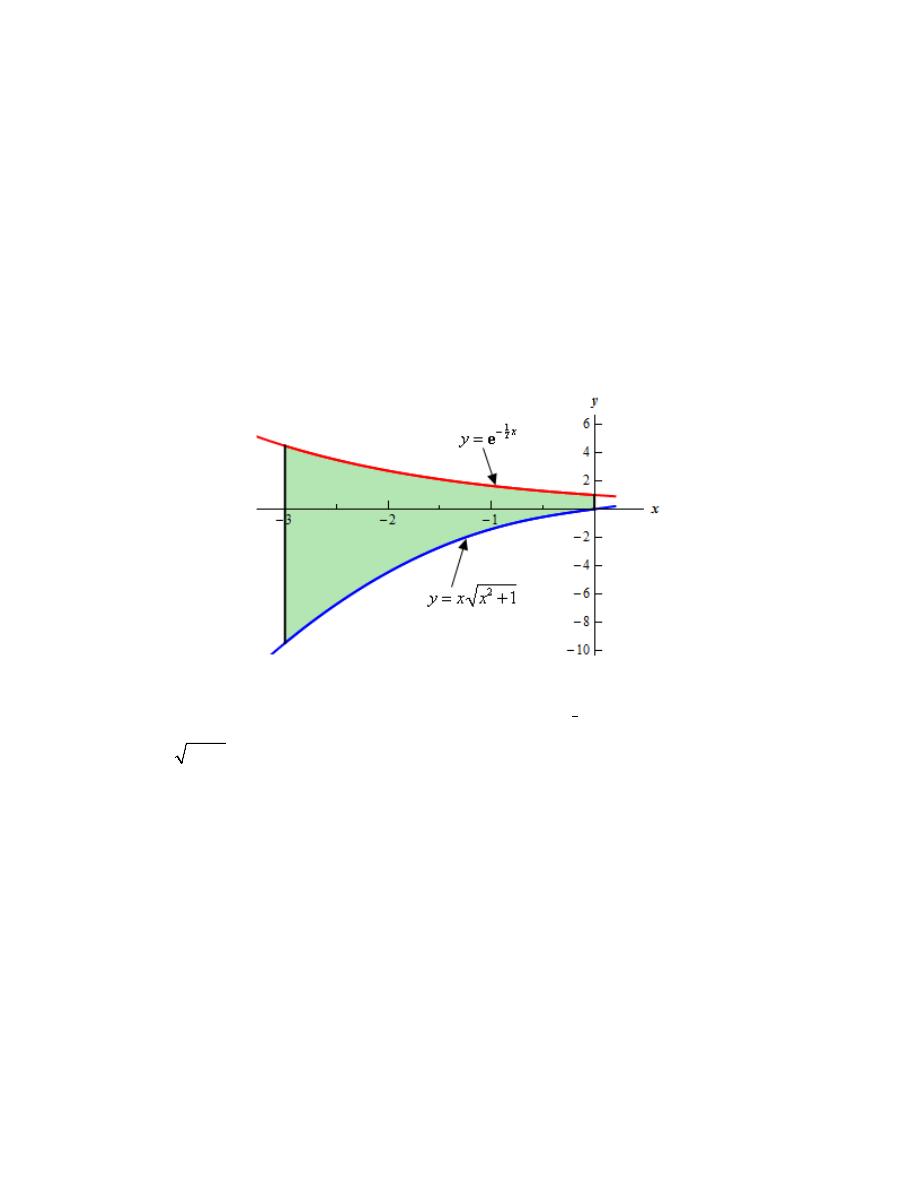
7. Determine the area of the region bounded by
2
1
y
x x
=
+
,
1
2
x
y
−
= e
,
3
x
= −
and the y-
axis.
Calculus I
© 2007 Paul Dawkins
13
http://tutorial.math.lamar.edu/terms.aspx
Hint : It’s generally best to sketch the bounded region that we want to find the area of before
starting the actual problem. Having the sketch of the graph will usually help with determining the
upper/lower functions and the limits for the integral.
Step 1
Let’s start off with getting a sketch of the region we want to find the area of.
Note that using a graphing calculator or computer may be needed to deal with the first equation,
however you should be able to sketch the graph of the second equation by hand.
Here is a sketch of the bounded region we want to find the area of.
Step 2
It should be clear from the graph that the upper function is
1
2
x
y
−
= e
and the lower function is
2
1
y
x x
=
+
.
Next, we were given limits on x in the problem statement (recall that the y-axis is just the line
0
x
=
!) and we can see that the two curves do not intersect in that range. Note that this is
something that we can’t always guarantee and so we need the graph to verify if the curves
intersect or not. We should never just assume that because limits on x were given in the problem
statement that the curves will not intersect anywhere between the given limits.
So, because the curves do not intersect we will be able to find the area with a single integral using
the limits :
3
0
x
− ≤ ≤
.
Step 3
At this point there isn’t much to do other than step up the integral and evaluate it.
Calculus I
© 2007 Paul Dawkins
14
http://tutorial.math.lamar.edu/terms.aspx
We are assuming that you are comfortable with basic integration techniques, including
substitution since that will be needed here, so we’ll not be including any discussion of the actual
integration process here and we will be skipping some of the intermediate steps.
The area is,
(
)
(
)
3
3
3
1
1
2
2
2
2
2
0
0
2
2
7
1
1
3
3
3
3
3
1
2
1
2
10
17.17097
x
x
A
x x
dx
x
−
−
−
−
=
−
+
= −
−
+
= − +
+
=
∫
e
e
e
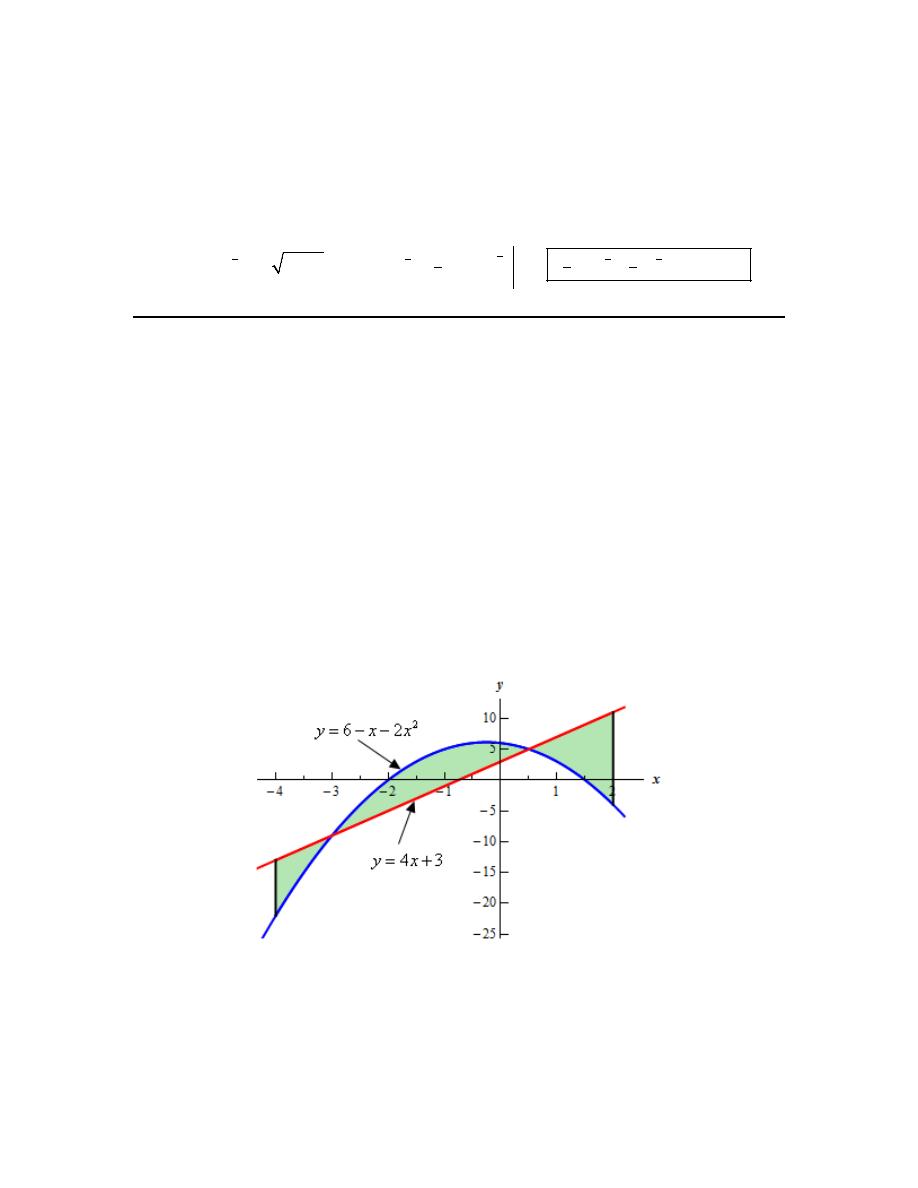
8. Determine the area of the region bounded by
4
3
y
x
=
+
,
2
6
2
y
x
x
= − −
,
4
x
= −
and
2
x
=
.
Hint : It’s generally best to sketch the bounded region that we want to find the area of before
starting the actual problem. Having the sketch of the graph will usually help with determining the
upper/lower functions and the limits for the integral.
Step 1
Let’s start off with getting a sketch of the region we want to find the area of.
We are assuming that, at this point, you are capable of graphing most of the basic functions that
we’re dealing with in these problems and so we won’t be showing any of the graphing work here.
Here is a sketch of the bounded region we want to find the area of.
Step 2
In the problem statement we were given two limits on x. However, as seen in the sketch of the
graph above the curves intersect in this region and the upper/lower functions differ depending on
what range of x’s we are looking for.
Calculus I
© 2007 Paul Dawkins
15
http://tutorial.math.lamar.edu/terms.aspx
Therefore we’ll need to find the intersection points. However, we should never just assume that
our graph is accurate or that we will be able to read it accurately enough to guess the coordinates
from the graph. This is especially true when the intersection points of the two curves do not
occur on an axis (as they don’t in this case).
So, to determine the intersection points correctly we’ll need to find them directly. The
intersection points are where the two curves intersect and so all we need to do is set the two
equations equal and solve. Doing this gives,
(
)(
)
2
2
1
2
6
2
4
3
2
5
3
2
1
3
0
3,
x
x
x
x
x
x
x
x
x
− −
=
+
→
+
− =
−
+
=
→
= −
=
Note that you may well have found the intersection points in the first step to help with the graph
if you were graphing by hand which is not a bad idea with faced with graphing this kind of
region.
So, from the graph then it looks like we’ll need three integrals since there are three ranges of x (
4
3
x
− ≤ ≤ −
,
1
2
3
x
− ≤ ≤
and
1
2
2
x
≤ ≤
) for which the upper/lower functions are different.
Step 3
At this point there isn’t much to do other than step up the integrals and evaluate them.
We are assuming that you are comfortable with basic integration techniques so we’ll not be
including any discussion of the actual integration process here and we will be skipping some of
the intermediate steps.
The area is,
(
)
(
)
(
)
(
) (
) (
)
1
2
1
2
1
2
1
2
1
2
1
2
3
2
2
2
2
4
3
3
2
2
2
2
4
3
3
2
3
2
2
3
3
2
5
5
5
2
2
2
3
2
2
3
3
2
4
3
25
343
81
343
6
24
8
12
4
3
6
2
6
2
4
3
4
3
6
2
2
5
3
3 5
2
2
5
3
3
3
3
A
x
x
x
dx
x
x
x
dx
x
x
x
dx
x
x
dx
x
x dx
x
x
dx
x
x
x
x
x
x
x
x
x
−
−
−
−
−
−
−
−
−
=
+ − − −
+
− −
−
+
+
+ − − −
=
+
−
+
−
−
+
+
−
=
+
−
+
−
−
+
+
−
= +
+ =
∫
∫
∫
∫
∫
∫
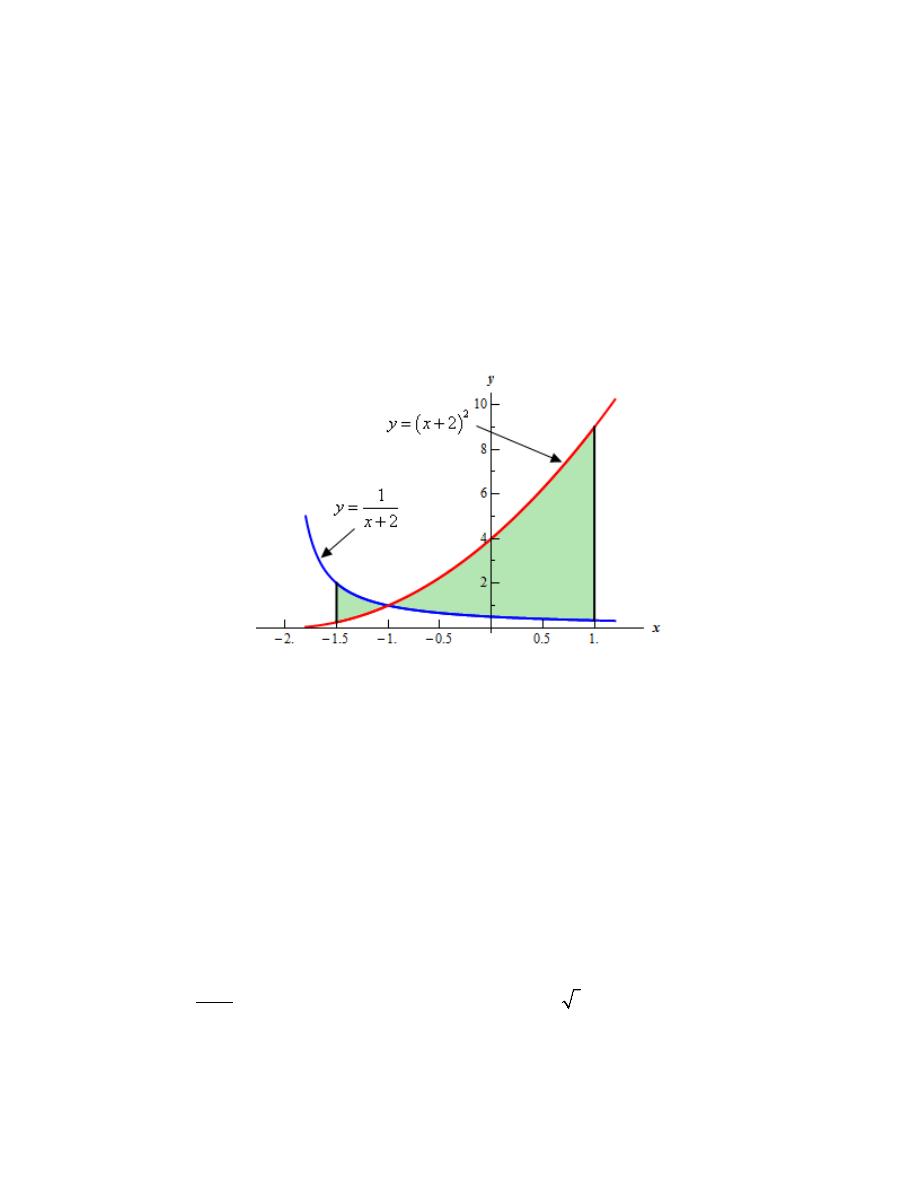
9. Determine the area of the region bounded by
1
2
y
x
=
+
,
(
)
2
2
y
x
=
+
,
3
2
x
= −
,
1
x
=
.
Calculus I
© 2007 Paul Dawkins
16
http://tutorial.math.lamar.edu/terms.aspx
Hint : It’s generally best to sketch the bounded region that we want to find the area of before
starting the actual problem. Having the sketch of the graph will usually help with determining the
upper/lower functions and the limits for the integral.
Step 1
Let’s start off with getting a sketch of the region we want to find the area of.
We are assuming that, at this point, you are capable of graphing most of the basic functions that
we’re dealing with in these problems and so we won’t be showing any of the graphing work here.
Here is a sketch of the bounded region we want to find the area of.
Step 2
In the problem statement we were given two limits on x. However, as seen in the sketch of the
graph above the curves intersect in this region and the upper/lower functions differ depending on
what range of x’s we are looking for.
Therefore we’ll need to find the intersection point. However, we should never just assume that
our graph is accurate or that we will be able to read it accurately enough to guess the coordinates
from the graph. This is especially true when the intersection point of the two curves does not
occur on an axis (as they don’t in this case).
So, to determine the intersection points correctly we’ll need to find it directly. The intersection
point is where the two curves intersect and so all we need to do is set the two equations equal and
solve. Doing this gives,
(
)
(
)
2
3
3
1
2
2
1
2
1
1
1
2
x
x
x
x
x
=
+
→
+
=
→
+ =
=
→
= −
+
Calculus I
© 2007 Paul Dawkins
17
http://tutorial.math.lamar.edu/terms.aspx
So, from the graph then it looks like we’ll need two integrals since there are two ranges of x (
3
2
1
x
− ≤ ≤ −
and
1
1
x
− ≤ ≤
) for which the upper/lower functions are different.
Step 3
At this point there isn’t much to do other than step up the integrals and evaluate them.
We are assuming that you are comfortable with basic integration techniques so we’ll not be
including any discussion of the actual integration process here and we will be skipping some of
the intermediate steps.
The area is,
(
)
(
)
(
)
(
)
(
)
(
)
( )
( )
( )
( )
3
2
3
2
1
1
2
2
1
1
1
3
3
1
1
3
3
1
7
26
67
1
1
24
2
3
8
2
1
1
2
2
2
2
ln
2
2
2
ln
2
ln
ln 3
ln
ln 3
7.9695
A
x
dx
x
dx
x
x
x
x
x
x
−
−
−
−
−
−
=
−
+
+
+
−
+
+
=
+ −
+
+
+
−
+
= − −
+
−
=
−
−
=
⌠
⌠
⌡
⌡
10. Determine the area of the region bounded by
2
1
x
y
=
+
,
5
x
=
,
3
y
= −
and
3
y
=
.
Hint : It’s generally best to sketch the bounded region that we want to find the area of before
starting the actual problem. Having the sketch of the graph will usually help with determining the
right/left functions and the limits for the integral.
Step 1
Let’s start off with getting a sketch of the region we want to find the area of.
We are assuming that, at this point, you are capable of graphing most of the basic functions that
we’re dealing with in these problems and so we won’t be showing any of the graphing work here.
Here is a sketch of the bounded region we want to find the area of.
Calculus I
© 2007 Paul Dawkins
18
http://tutorial.math.lamar.edu/terms.aspx
Step 2
In the problem statement we were given two limits on y. However, as seen in the sketch of the
graph above the curves intersect in this region and the right/left functions differ depending on
what range of y’s we are looking for.
Therefore we’ll need to find the intersection points. However, we should never just assume that
our graph is accurate or that we will be able to read it accurately enough to guess the coordinates
from the graph. This is especially true when the intersection points of the two curves do not
occur on an axis (as they don’t in this case).
So, to determine the intersection points correctly we’ll need to find them directly. The
intersection points are where the two curves intersect and so all we need to do is set the two
equations equal and solve. Doing this gives,
2
2
1
5
4
2,
2
y
y
y
y
+ =
→
=
→
= −
=
Note that you may well have found the intersection points in the first step to help with the graph
if you were graphing by hand which is not a bad idea with faced with graphing this kind of
region.
So, from the graph then it looks like we’ll need three integrals since there are three ranges of x (
3
2
x
− ≤ ≤ −
,
2
2
x
− ≤ ≤
and
2
3
x
≤ ≤
) for which the right/left functions are different.
Step 3
At this point there isn’t much to do other than step up the integrals and evaluate them.
Calculus I
© 2007 Paul Dawkins
19
http://tutorial.math.lamar.edu/terms.aspx
We are assuming that you are comfortable with basic integration techniques so we’ll not be
including any discussion of the actual integration process here and we will be skipping some of
the intermediate steps.
The area is,
(
)
(
) (
) (
)
2
2
3
2
2
2
3
2
2
2
2
3
2
2
2
3
2
2
2
2
3
3
3
3
1
1
1
3
3
3
3
2
2
7
32
7
46
3
3
3
3
1 5
5
1
1 5
4
4
4
4
4
4
A
y
dy
y
dy
y
dy
y
dy
y dy
y
dy
y
y
y
y
y
y
−
−
−
−
−
−
−
−
−
−
=
+ −
+
−
+
+
+ −
=
−
+
−
+
−
=
−
+
−
+
−
= + + =
∫
∫
∫
∫
∫
∫
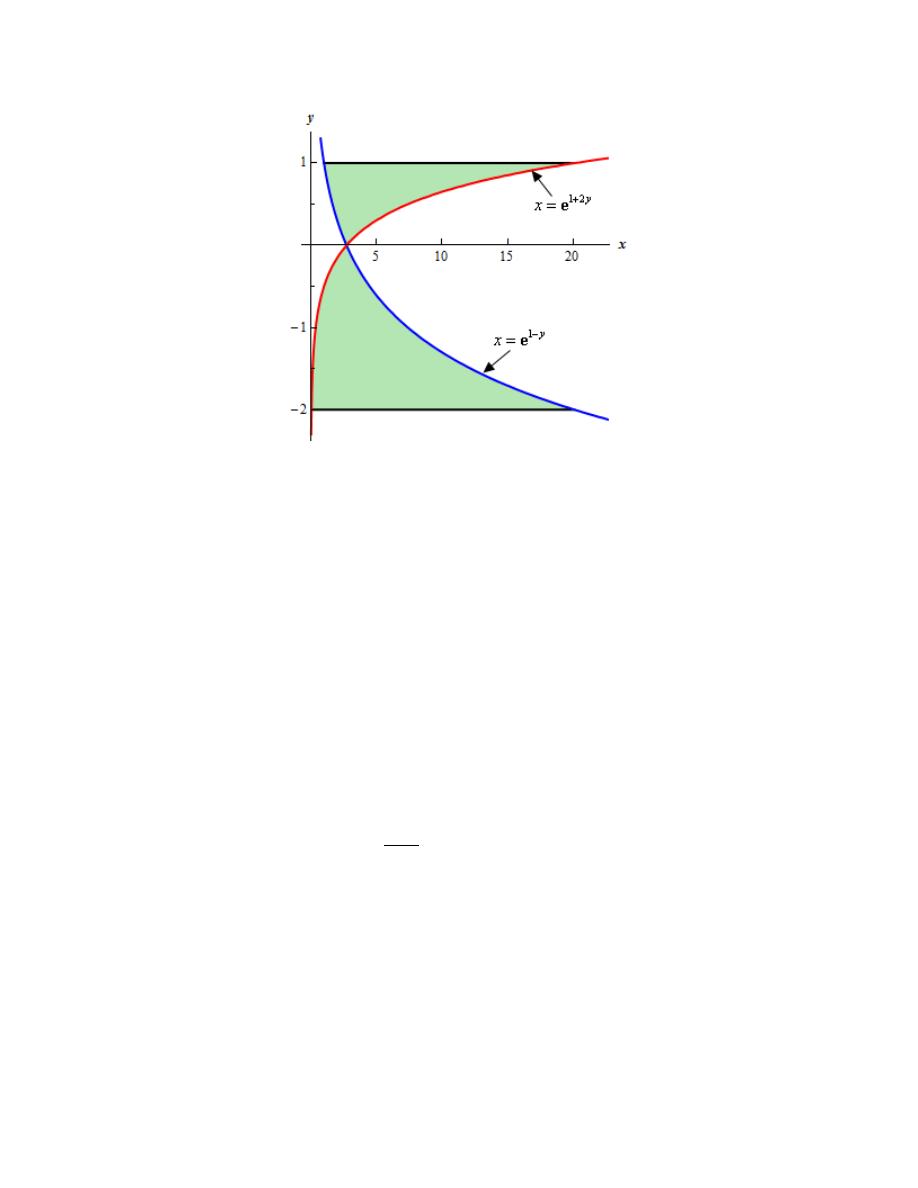
11. Determine the area of the region bounded by
1 2
y
x
+
= e
,
1
y
x
−
= e
,
2
y
= −
and
1
y
=
.
Hint : It’s generally best to sketch the bounded region that we want to find the area of before
starting the actual problem. Having the sketch of the graph will usually help with determining the
right/left functions and the limits for the integral.
Step 1
Let’s start off with getting a sketch of the region we want to find the area of.
We are assuming that, at this point, you are capable of graphing most of the basic functions that
we’re dealing with in these problems and so we won’t be showing any of the graphing work here.
Here is a sketch of the bounded region we want to find the area of.
Calculus I
© 2007 Paul Dawkins
20
http://tutorial.math.lamar.edu/terms.aspx
Step 2
In the problem statement we were given two limits on y. However, as seen in the sketch of the
graph above the curves intersect in this region and the right/left functions differ depending on
what range of y’s we are looking for.
Therefore we’ll need to find the intersection point. However, we should never just assume that
our graph is accurate or that we will be able to read it accurately enough to guess the coordinates
from the graph. In this case it seems pretty clear from the graph that the intersection point lies on
the x-axis (and so we can guess the point we need is
0
y
=
). However, for all we know the actual
intersection point is slightly above or slightly below the x-axis and the scale of the graph just
makes this hard to see.
So, to determine the intersection points correctly we’ll need to find it directly. The intersection
point is where the two curves intersect and so all we need to do is set the two equations equal and
solve. Doing this gives,
1 2
1 2
1
3
1
1
1
0
y
y
y
y
y
y
+
+
−
−
=
→
=
→
=
→
=
e
e
e
e
e
So, from the graph then it looks like we’ll need two integrals since there are two ranges of x (
2
0
x
− ≤ ≤
and
0
1
x
≤ ≤
) for which the right/left functions are different.
Step 3
At this point there isn’t much to do other than step up the integrals and evaluate them.
Calculus I
© 2007 Paul Dawkins
21
http://tutorial.math.lamar.edu/terms.aspx
We are assuming that you are comfortable with basic integration techniques so we’ll not be
including any discussion of the actual integration process here and we will be skipping some of
the intermediate steps.
The area is,
(
) (
)
0
1
1
1 2
1 2
1
2
0
0
1
1
1 2
1 2
1
1
1
2
2
2
0
3
3
3
3
3
1
1
2
2
2
2
1
22.9983
y
y
y
y
y
y
y
y
A
dy
dy
−
+
+
−
−
−
+
+
−
−
−
=
−
+
−
= −
−
+
+
=
+
−
+ +
−
=
∫
∫
e
e
e
e
e
e
e
e
e
e
e
e
e
Volumes of Solids of Revolution / Method of Rings
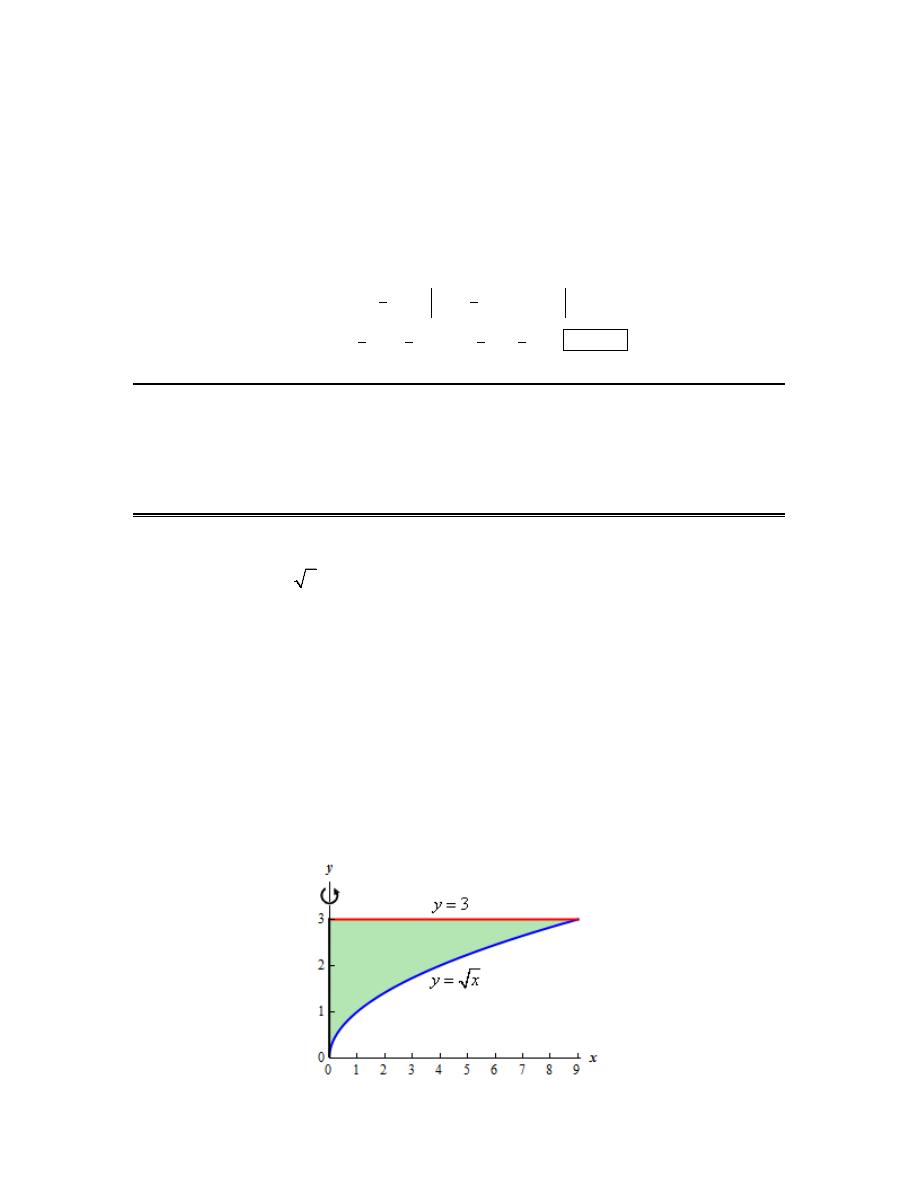
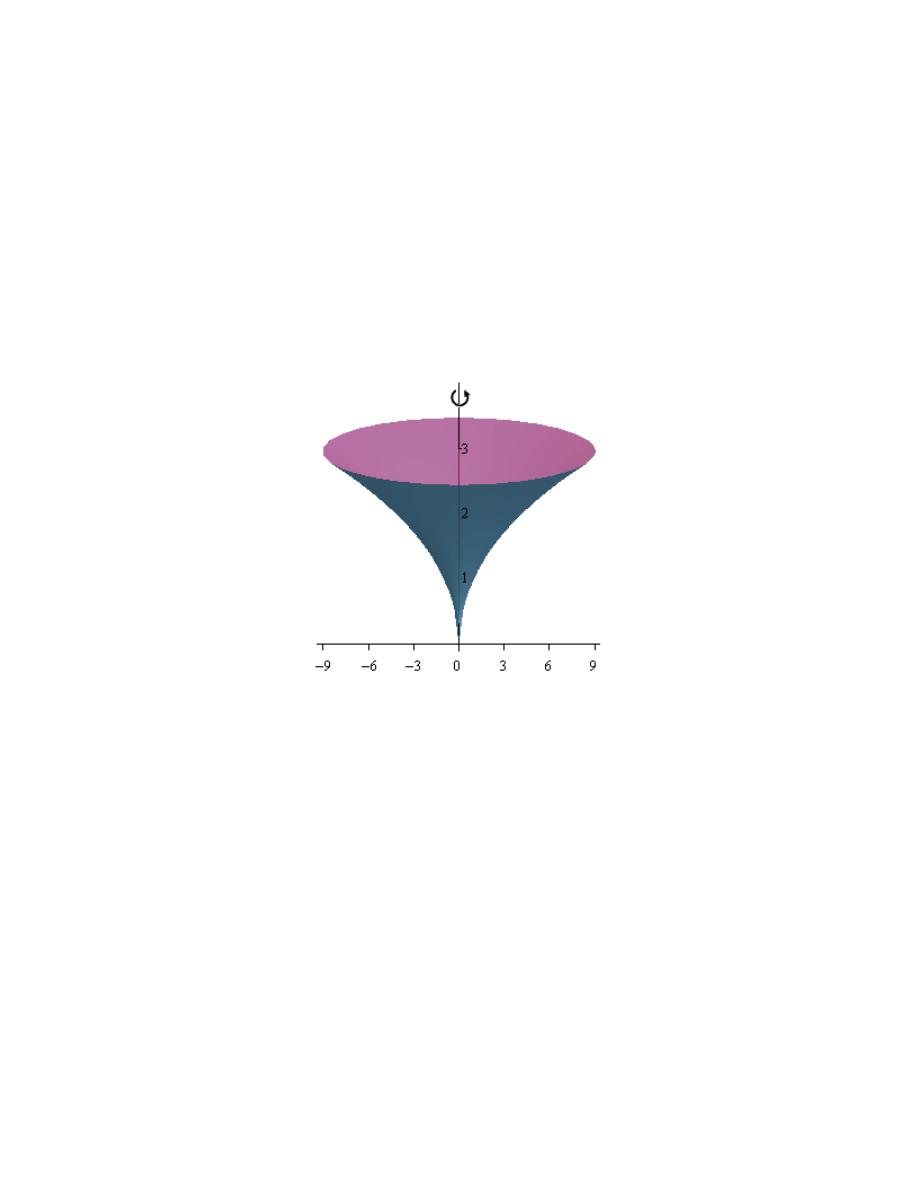
1. Use the method of disks/rings to determine the volume of the solid obtained by rotating the
region bounded by
y
x
=
,
3
y
=
and the y-axis about the y-axis.
Hint : Start with sketching the bounded region.
Step 1
We need to start the problem somewhere so let’s start “simple”.
Knowing what the bounded region looks like will definitely help for most of these types of
problems since we need to know how all the curves relate to each other when we go to set up the
area formula and we’ll need limits for the integral which the graph will often help with.
Here is a sketch of the bounded region with the axis of rotation shown.
Calculus I
© 2007 Paul Dawkins
22
http://tutorial.math.lamar.edu/terms.aspx
Hint : Give a good attempt at sketching what the solid of revolution looks like and sketch in a
representative disk.
Note that this can be a difficult thing to do especially if you aren’t a very visual person.
However, having a representative disk can be of great help when we go to write down the area
formula. Also, getting the representative disk can be difficult without a sketch of the solid of
revolution. So, do the best you can at getting these sketches.
Step 2
Here is a sketch of the solid of revolution.
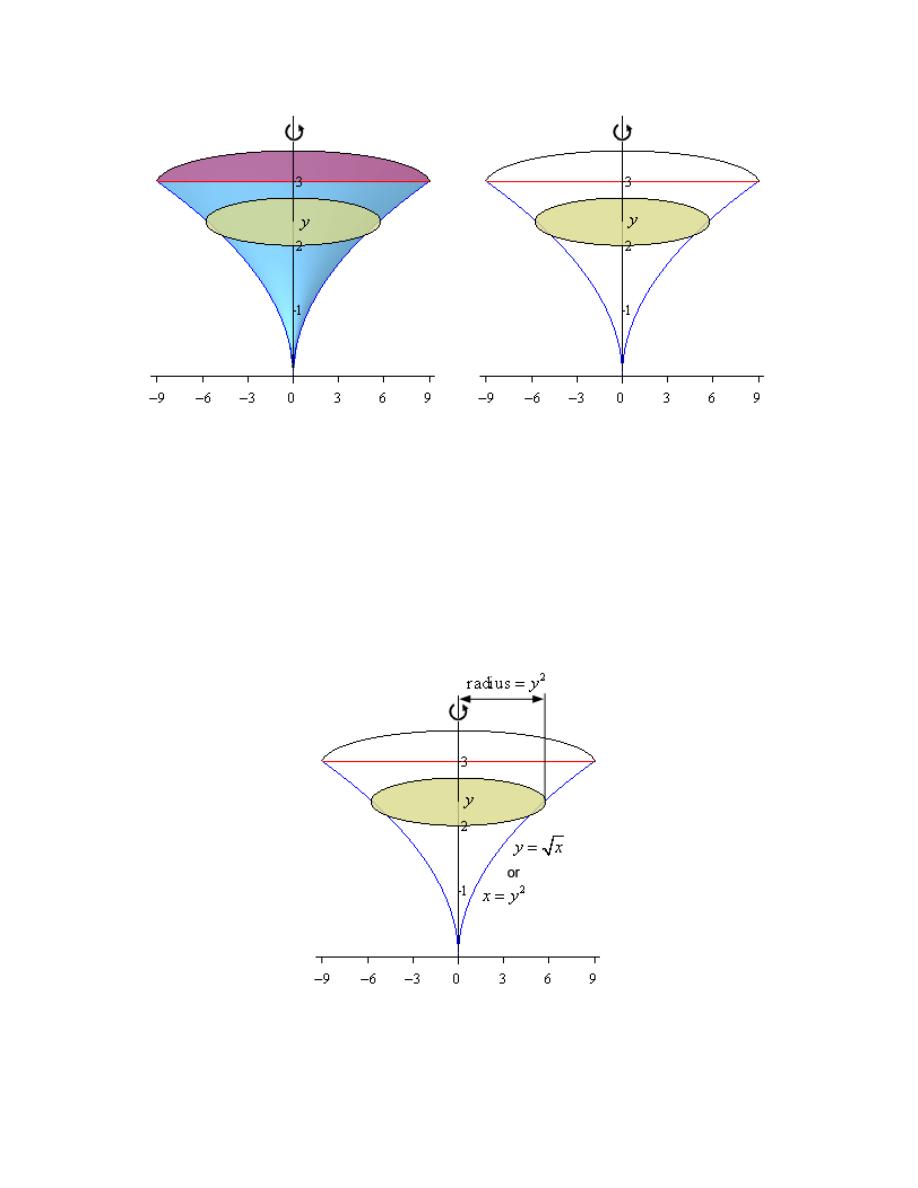
Here are a couple of sketches of a representative disk. The image on the left shows a
representative disk with the front half of the solid cut away and the image on the right shows a
representative disk with a “wire frame” of the back half of the solid (i.e. the curves representing
the edges of the of the back half of the solid).
Calculus I
© 2007 Paul Dawkins
23
http://tutorial.math.lamar.edu/terms.aspx
Hint : Determine a formula for the area of the disk.
Step 3
We now need to find a formula for the area of the disk. Because we are using disks that are
centered on the y-axis we know that the area formula will need to be in terms of y. This in turn
means that we’ll need to rewrite the equation of the boundary curve to get into terms of y.
Here is another sketch of a representative disk with all of the various quantities we need put into
it.
Calculus I
© 2007 Paul Dawkins
24
http://tutorial.math.lamar.edu/terms.aspx
As we can see from the sketch the disk is centered on the y-axis and placed at some y. The radius
of the disk is the distance from the y-axis to the curve defining the edge of the solid. In other
words,
2
Radius
y
=
The area of the disk is then,
( )
(
)
( )
2
2
2
4
Radius
A y
y
y
π
π
π
=
=
=
Step 4
The final step is to then set up the integral for the volume and evaluate it.
For the limits on the integral we can see that the “first” disk in the solid would occur at
0
y
=
and
the “last” disk would occur at
3
y
=
. Our limits are then :
0
3
y
≤ ≤
.
The volume is then,
3
3
4
5
243
1
5
5
0
0
V
y dy
y
π
π
π
=
=
=
∫
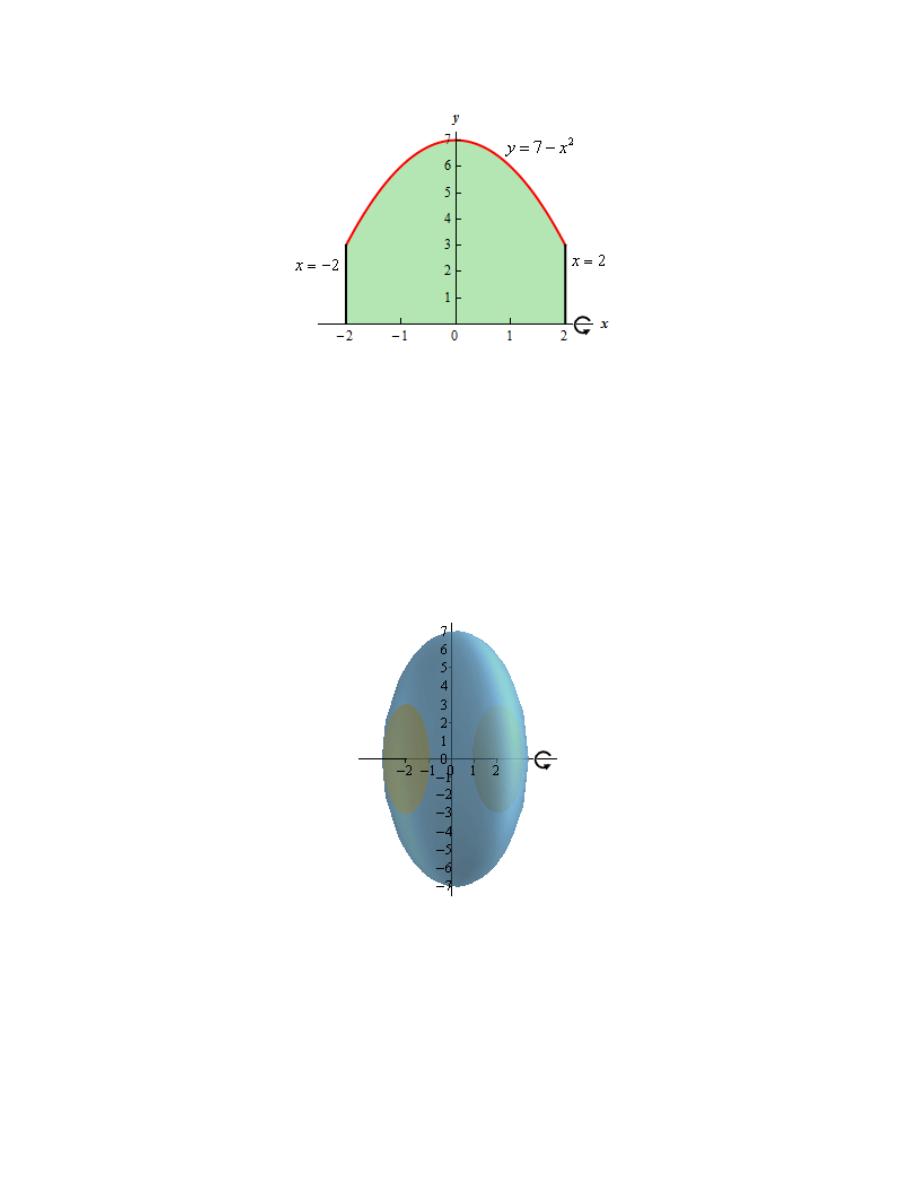
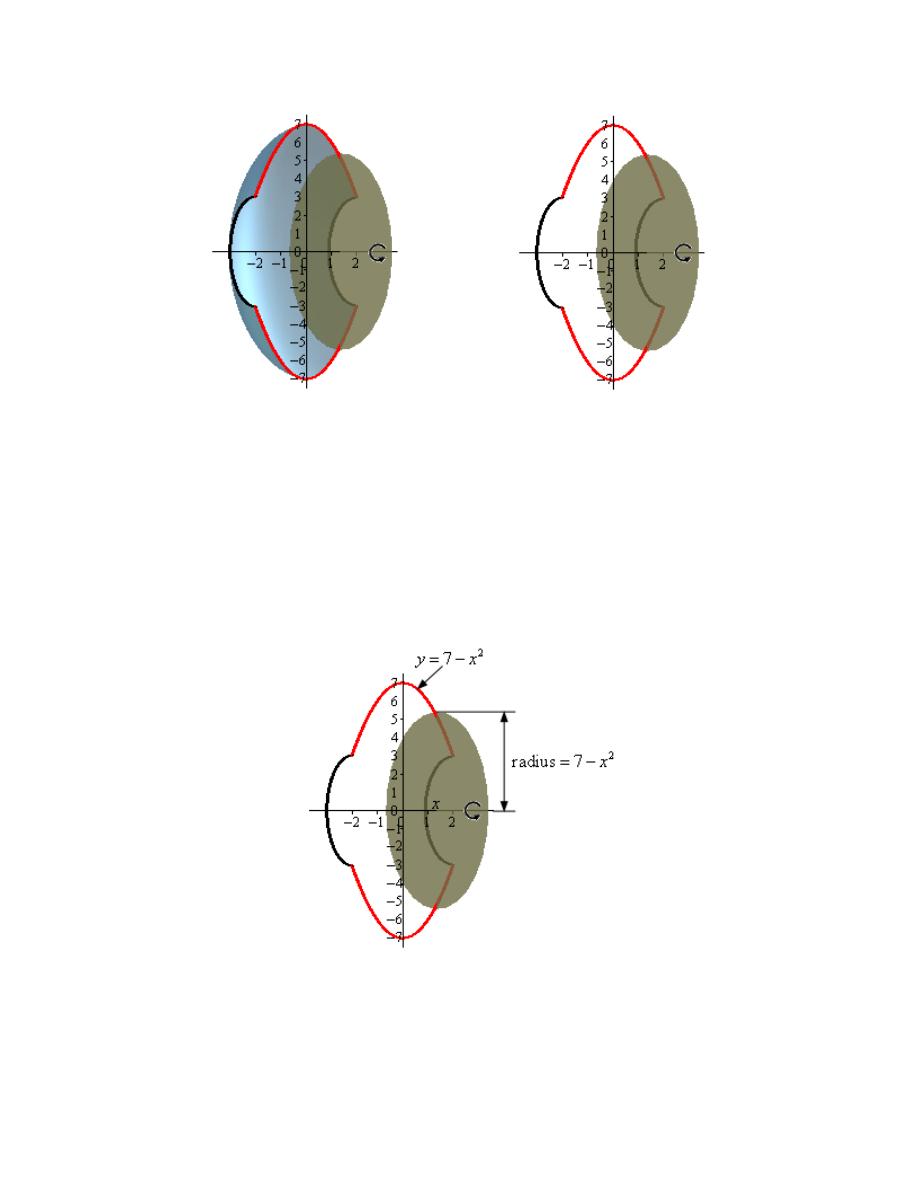
2. Use the method of disks/rings to determine the volume of the solid obtained by rotating the
region bounded by
2
7
y
x
= −
,
2
x
= −
,
2
x
=
and the x-axis about the x-axis.
Hint : Start with sketching the bounded region.
Step 1
We need to start the problem somewhere so let’s start “simple”.
Knowing what the bounded region looks like will definitely help for most of these types of
problems since we need to know how all the curves relate to each other when we go to set up the
area formula and we’ll need limits for the integral which the graph will often help with.
Here is a sketch of the bounded region with the axis of rotation shown.
Calculus I
© 2007 Paul Dawkins
25
http://tutorial.math.lamar.edu/terms.aspx
Hint : Give a good attempt at sketching what the solid of revolution looks like and sketch in a
representative disk.
Note that this can be a difficult thing to do especially if you aren’t a very visual person.
However, having a representative disk can be of great help when we go to write down the area
formula. Also, getting the representative disk can be difficult without a sketch of the solid of
revolution. So, do the best you can at getting these sketches.
Step 2
Here is a sketch of the solid of revolution.
Here are a couple of sketches of a representative disk. The image on the left shows a
representative disk with the front half of the solid cut away and the image on the right shows a
representative disk with a “wire frame” of the back half of the solid (i.e. the curves representing
the edges of the of the back half of the solid).
Calculus I
© 2007 Paul Dawkins
26
http://tutorial.math.lamar.edu/terms.aspx
Hint : Determine a formula for the area of the disk.
Step 3
We now need to find a formula for the area of the disk. Because we are using disks that are
centered on the x-axis we know that the area formula will need to be in terms of x. Therefore the
equation of the curve will need to be in terms of x (which in this case it already is).
Here is another sketch of a representative disk with all of the various quantities we need put into
it.
As we can see from the sketch the disk is centered on the x-axis and placed at some x. The radius
of the disk is the distance from the x-axis to the curve defining the edge of the solid. In other
words,
Calculus I
© 2007 Paul Dawkins
27
http://tutorial.math.lamar.edu/terms.aspx
2
Radius 7
x
= −
The area of the disk is then,
( )
(
)
(
)
(
)
2
2
2
2
4
Radius
7
49 14
A x
x
x
x
π
π
π
=
=
−
=
−
+
Step 4
The final step is to then set up the integral for the volume and evaluate it.
For the limits on the integral we can see that the “first” disk in the solid would occur at
2
x
= −
and the “last” disk would occur at
2
x
=
. Our limits are then :
2
2
x
− ≤ ≤
.
The volume is then,
(
)
(
)
2
2
2
4
3
5
2012
14
1
3
5
15
2
2
49 14
49
V
x
x
dx
x
x
x
π
π
π
−
−
=
−
+
=
−
+
=
∫
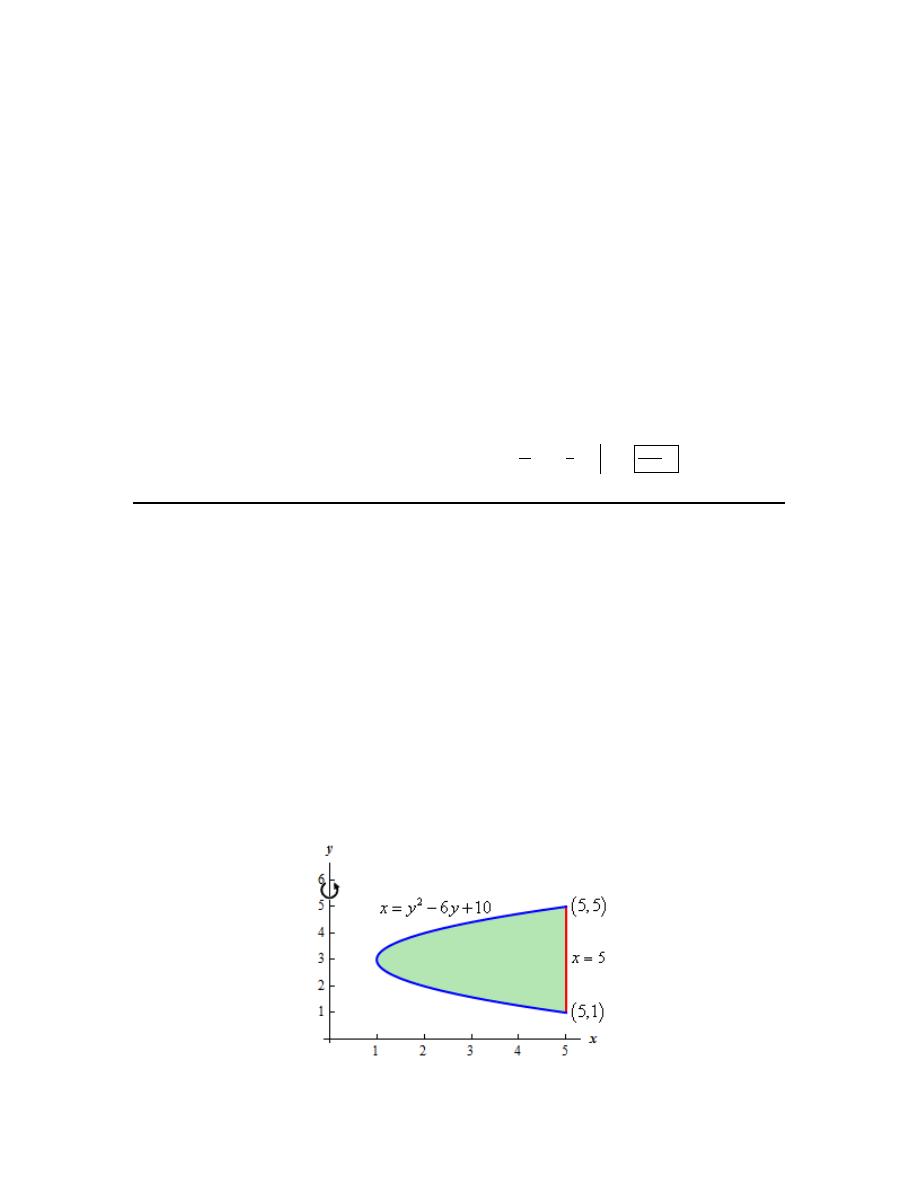
3. Use the method of disks/rings to determine the volume of the solid obtained by rotating the
region bounded by
2
6
10
x
y
y
=
−
+
and
5
x
=
about the y-axis.
Hint : Start with sketching the bounded region.
Step 1
We need to start the problem somewhere so let’s start “simple”.
Knowing what the bounded region looks like will definitely help for most of these types of
problems since we need to know how all the curves relate to each other when we go to set up the
area formula and we’ll need limits for the integral which the graph will often help with.
Here is a sketch of the bounded region with the axis of rotation shown.
Calculus I
© 2007 Paul Dawkins
28
http://tutorial.math.lamar.edu/terms.aspx
Here is the work used to determine the intersection points (we’ll need these later).
(
)(
)
( )
( )
2
2
6
10
5
6
5
0
5
1
0
1,
5
5,1 &
5, 5
y
y
y
y
y
y
y
y
−
+
=
−
+ =
−
− =
⇒
=
=
⇒
Hint : Give a good attempt at sketching what the solid of revolution looks like and sketch in a
representative ring.
Note that this can be a difficult thing to do especially if you aren’t a very visual person.
However, having a representative ring can be of great help when we go to write down the area
formula. Also, getting the representative ring can be difficult without a sketch of the solid of
revolution. So, do the best you can at getting these sketches.
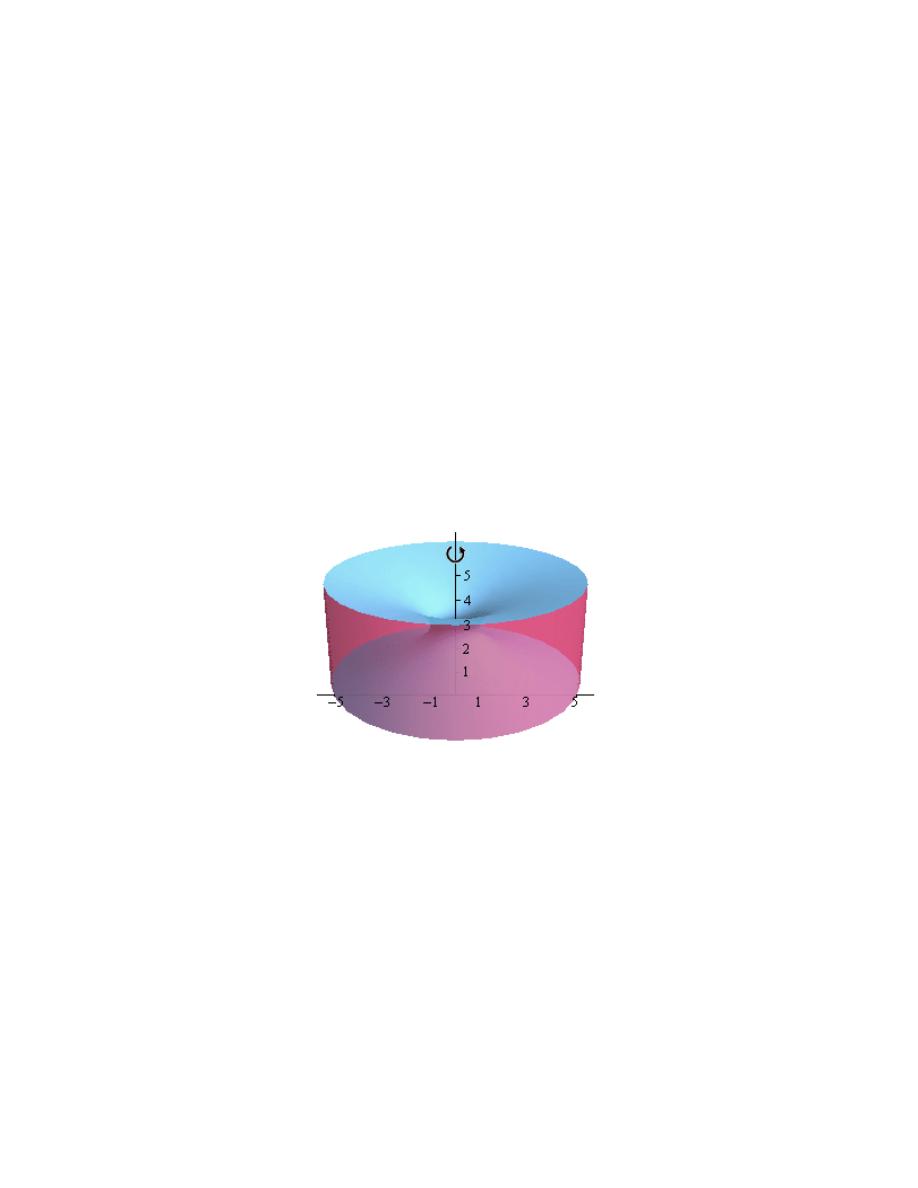
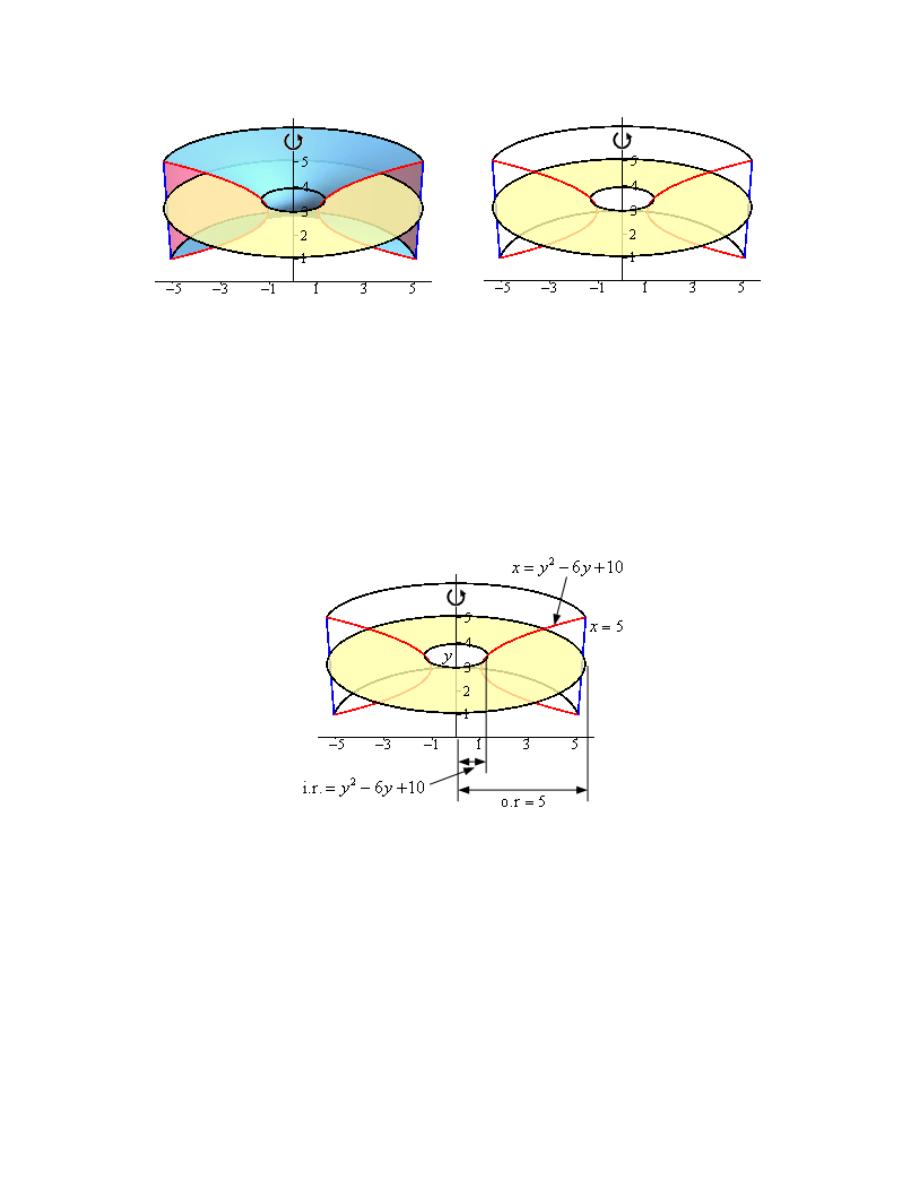
Step 2
Here is a sketch of the solid of revolution.
Here are a couple of sketches of a representative ring. The image on the left shows a
representative ring with the front half of the solid cut away and the image on the right shows a
representative ring with a “wire frame” of the back half of the solid (i.e. the curves representing
the edges of the of the back half of the solid).
Calculus I
© 2007 Paul Dawkins
29
http://tutorial.math.lamar.edu/terms.aspx
Hint : Determine a formula for the area of the ring.
Step 3
We now need to find a formula for the area of the ring. Because we are using rings that are
centered on the y-axis we know that the area formula will need to be in terms of y. Therefore the
equation of the curves will need to be in terms of y (which in this case they already are).
Here is another sketch of a representative ring with all of the various quantities we need put into
it.
As we can see from the sketch the ring is centered on the y-axis and placed at some y. The inner
radius of the ring is the distance from the y-axis to the curve defining the inner edge of the solid.
The outer radius of the ring is the distance from the y-axis to the curve defining the outer edge of
the solid. In other words,
2
Inner Radius
6
10
Outer Radius
5
y
y
=
−
+
=
The area of the ring is then,
Calculus I
© 2007 Paul Dawkins
30
http://tutorial.math.lamar.edu/terms.aspx
( )
(
) (
)
( )
(
)
(
)
2
2
2
2
2
2
3
4
Outer Radius
Inner Radius
5
6
10
75 120
56
12
A x
y
y
y
y
y
y
π
π
π
=
−
=
−
−
+
=
− +
−
+
−
Step 4
The final step is to then set up the integral for the volume and evaluate it.
From the intersection points shown in the graph from Step 1 we can see that the “first” ring in the
solid would occur at
1
y
=
and the “last” ring would occur at
5
y
=
. Our limits are then :
1
5
y
≤ ≤
.
The volume is then,
(
)
(
)
5
2
3
4
1
5
2
3
4
5
56
1088
1
3
5
15
1
75 120
56
12
75
60
3
V
y
y
y
y
dy
y
y
y
y
y
π
π
π
=
− +
−
+
−
=
−
+
−
+
−
=
∫
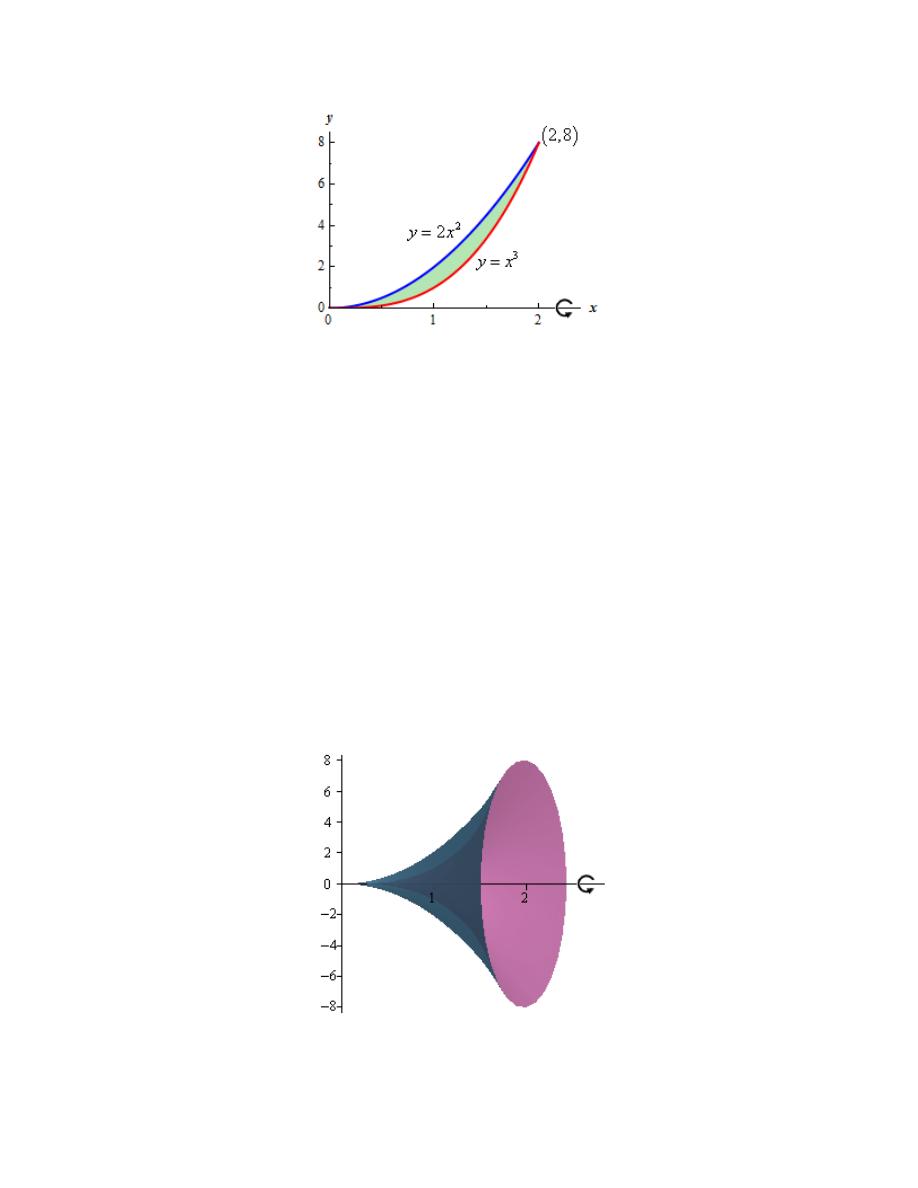
4. Use the method of disks/rings to determine the volume of the solid obtained by rotating the
region bounded by
2
2
y
x
=
and
3
y
x
=
about the x-axis.
Hint : Start with sketching the bounded region.
Step 1
We need to start the problem somewhere so let’s start “simple”.
Knowing what the bounded region looks like will definitely help for most of these types of
problems since we need to know how all the curves relate to each other when we go to set up the
area formula and we’ll need limits for the integral which the graph will often help with.
Here is a sketch of the bounded region with the axis of rotation shown.
Calculus I
© 2007 Paul Dawkins
31
http://tutorial.math.lamar.edu/terms.aspx
Here is the work used to determine the intersection points (we’ll need these later).
(
)
( )
( )
3
2
3
2
2
2
2
0
2
0
0,
2
0, 0 &
2,8
x
x
x
x
x
x
x
x
=
−
=
−
=
⇒
=
=
⇒
Hint : Give a good attempt at sketching what the solid of revolution looks like and sketch in a
representative ring.
Note that this can be a difficult thing to do especially if you aren’t a very visual person.
However, having a representative ring can be of great help when we go to write down the area
formula. Also, getting the representative ring can be difficult without a sketch of the solid of
revolution. So, do the best you can at getting these sketches.
Step 2
Here is a sketch of the solid of revolution.
Calculus I
© 2007 Paul Dawkins
32
http://tutorial.math.lamar.edu/terms.aspx
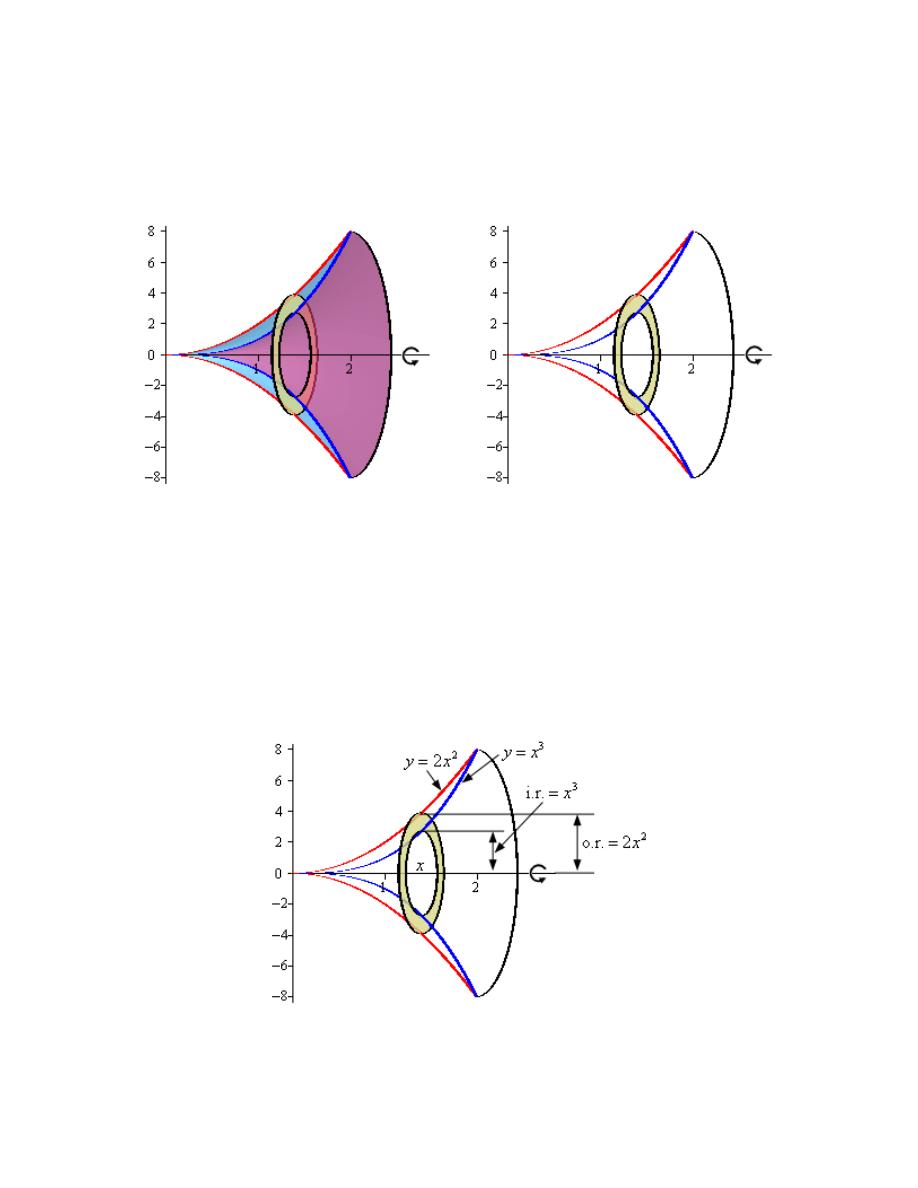
Here are a couple of sketches of a representative ring. The image on the left shows a
representative ring with the front half of the solid cut away and the image on the right shows a
representative ring with a “wire frame” of the back half of the solid (i.e. the curves representing
the edges of the of the back half of the solid).
Hint : Determine a formula for the area of the ring.
Step 3
We now need to find a formula for the area of the ring. Because we are using rings that are
centered on the x-axis we know that the area formula will need to be in terms of x. Therefore the
equation of the curves will need to be in terms of x (which in this case they already are).
Here is another sketch of a representative ring with all of the various quantities we need put into
it.
As we can see from the sketch the ring is centered on the x-axis and placed at some x. The inner
radius of the ring is the distance from the x-axis to the curve defining the inner edge of the solid.
Calculus I
© 2007 Paul Dawkins
33
http://tutorial.math.lamar.edu/terms.aspx
The outer radius of the ring is the distance from the x-axis to the curve defining the outer edge of
the solid. In other words,
3
2
Inner Radius
Outer Radius
2
x
x
=
=
The area of the ring is then,
( )
(
) (
)
( ) ( )
(
)
2
2
2
2
2
3
4
6
Outer Radius
Inner Radius
2
4
A x
x
x
x
x
π
π
π
=
−
=
−
=
−
Step 4
The final step is to then set up the integral for the volume and evaluate it.
From the intersection points shown in the graph from Step 1 we can see that the “first” ring in the
solid would occur at
0
x
=
and the “last” ring would occur at
2
x
=
. Our limits are then :
0
2
x
≤ ≤
.
The volume is then,
(
)
(
)
2
2
4
6
5
7
256
4
1
5
7
35
0
0
4
V
x
x
dx
x
x
π
π
π
=
−
=
−
=
∫
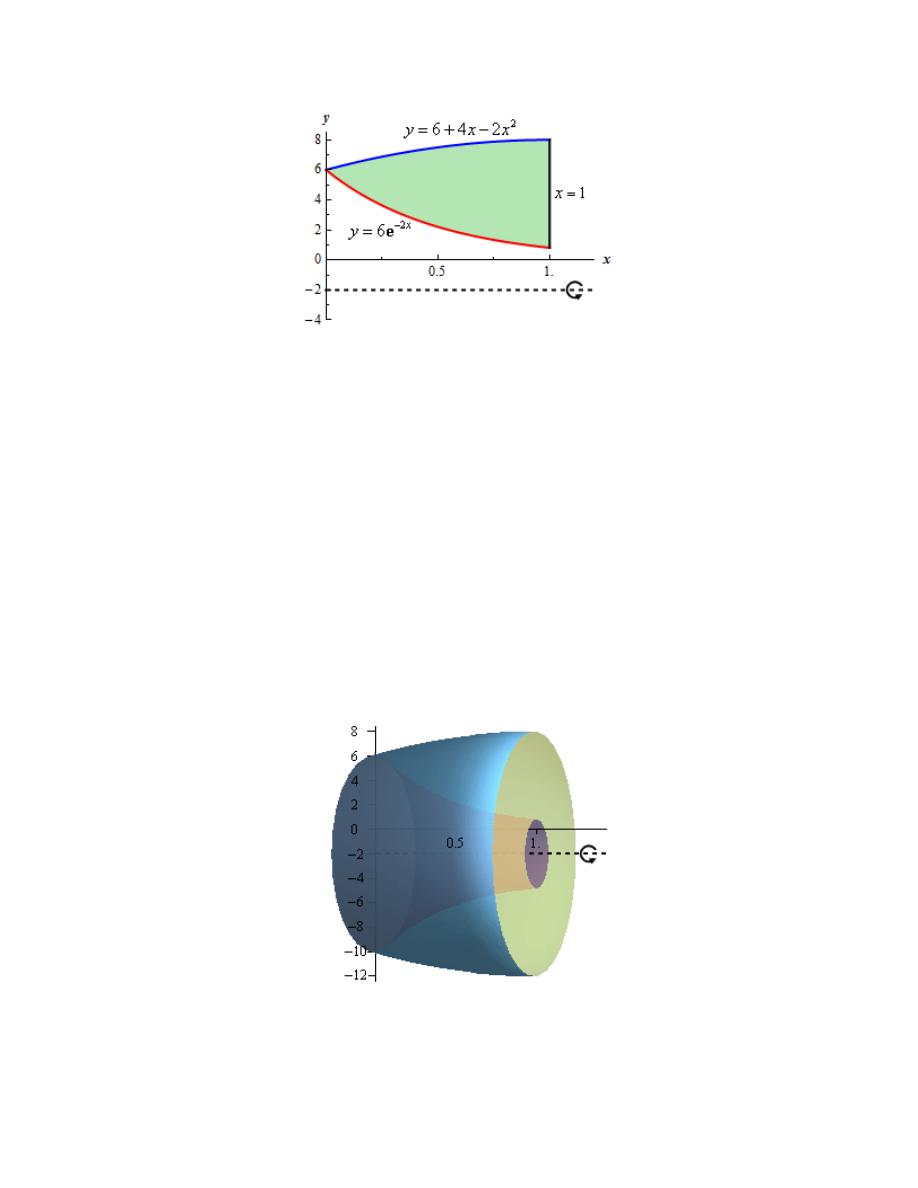
5. Use the method of disks/rings to determine the volume of the solid obtained by rotating the
region bounded by
2
6
x
y
−
= e
and
2
6 4
2
y
x
x
= +
−
between
0
x
=
and
1
x
=
about the line
2
y
= −
.
Hint : Start with sketching the bounded region.
Step 1
We need to start the problem somewhere so let’s start “simple”.
Knowing what the bounded region looks like will definitely help for most of these types of
problems since we need to know how all the curves relate to each other when we go to set up the
area formula and we’ll need limits for the integral which the graph will often help with.
Here is a sketch of the bounded region with the axis of rotation shown.
Calculus I
© 2007 Paul Dawkins
34
http://tutorial.math.lamar.edu/terms.aspx
For the intersection point on the left a quick check by plugging
0
x
=
into both equations shows
that the intersection point is in fact
( )
0, 6
as we might have guessed from the graph. We’ll be
needing this point in a bit. From the sketch of the region it is also clear that there is no
intersection point on the right.
Hint : Give a good attempt at sketching what the solid of revolution looks like and sketch in a
representative ring.
Note that this can be a difficult thing to do especially if you aren’t a very visual person.
However, having a representative ring can be of great help when we go to write down the area
formula. Also, getting the representative ring can be difficult without a sketch of the solid of
revolution. So, do the best you can at getting these sketches.
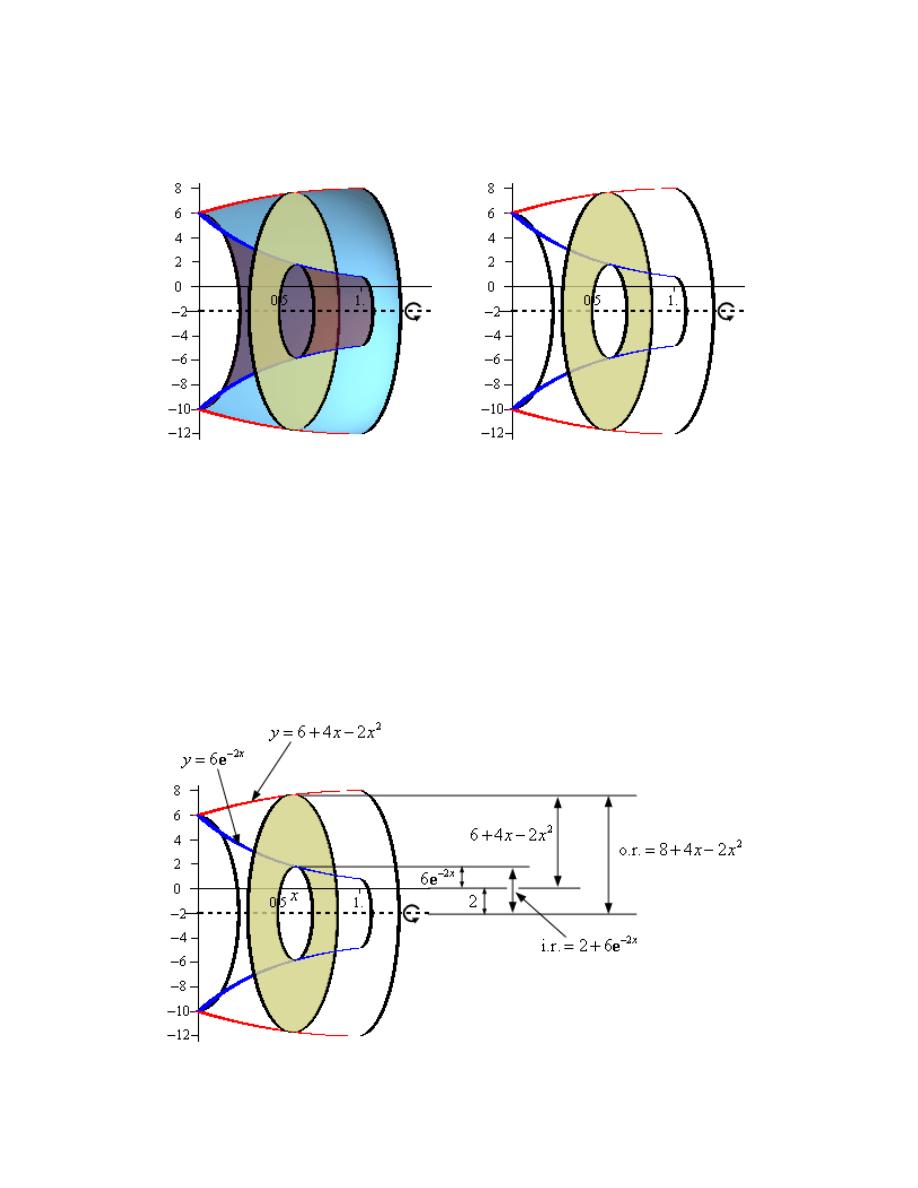
Step 2
Here is a sketch of the solid of revolution.
Here are a couple of sketches of a representative ring. The image on the left shows a
representative ring with the front half of the solid cut away and the image on the right shows a
Calculus I
© 2007 Paul Dawkins
35
http://tutorial.math.lamar.edu/terms.aspx
representative ring with a “wire frame” of the back half of the solid (i.e. the curves representing
the edges of the of the back half of the solid).
Hint : Determine a formula for the area of the ring.
Step 3
We now need to find a formula for the area of the ring. Because we are using rings that are
centered on a horizontal axis (i.e. parallel to the x-axis) we know that the area formula will need
to be in terms of x. Therefore the equations of the curves will need to be in terms of x (which in
this case they already are).
Here is another sketch of a representative ring with all of the various quantities we need put into
it.
Calculus I
© 2007 Paul Dawkins
36
http://tutorial.math.lamar.edu/terms.aspx
From the sketch we can see the ring is centered on the line
2
y
= −
and placed at some x.
The inner radius of the ring is the distance from the axis of rotation to the x-axis (a distance of 2)
followed by the distance from the x-axis to the curve defining the inner edge of the solid (a
distance of
2
6
x
−
e
).
Likewise, the outer radius of the ring is the distance from the axis of rotation to the x-axis (again,
a distance of 2) followed by the distance from the x-axis to the curve defining the outer edge of
the solid (a distance of
2
6
4
2
x
x
+
−
).
So the inner and outer radii are,
2
2
2
Inner Radius
2 6
Outer Radius
2 6
4
2
8 4
2
x
x
x
x
x
−
= +
= + +
−
= +
−
e
The area of the ring is then,
( )
(
) (
)
(
) (
)
(
)
2
2
2
2
2
2
2
3
4
2
4
Outer Radius
Inner Radius
8 4
2
2 6
60 64
16
16
4
24
36
x
x
x
A x
x
x
x
x
x
x
π
π
π
−
−
−
=
−
=
+
−
− +
=
+
−
−
+
−
−
e
e
e
Step 4
The final step is to then set up the integral for the volume and evaluate it.
From the graph from Step 1 we can see that the “first” ring in the solid would occur at
0
x
=
and
the “last” ring would occur at
1
x
=
. Our limits are then :
0
1
x
≤ ≤
.
The volume is then,
(
)
(
) (
)
1
2
3
4
2
4
0
1
2
3
4
5
2
4
2
4
16
937
4
3
5
15
0
60 64
16
16
4
24
36
60
32
4
12
9
12
9
x
x
x
x
V
x
x
x
x
dx
x
x
x
x
x
π
π
π
−
−
−
−
−
−
=
+
−
−
+
−
−
=
+
−
−
+
+
+
=
+
+
∫
e
e
e
e
e
e
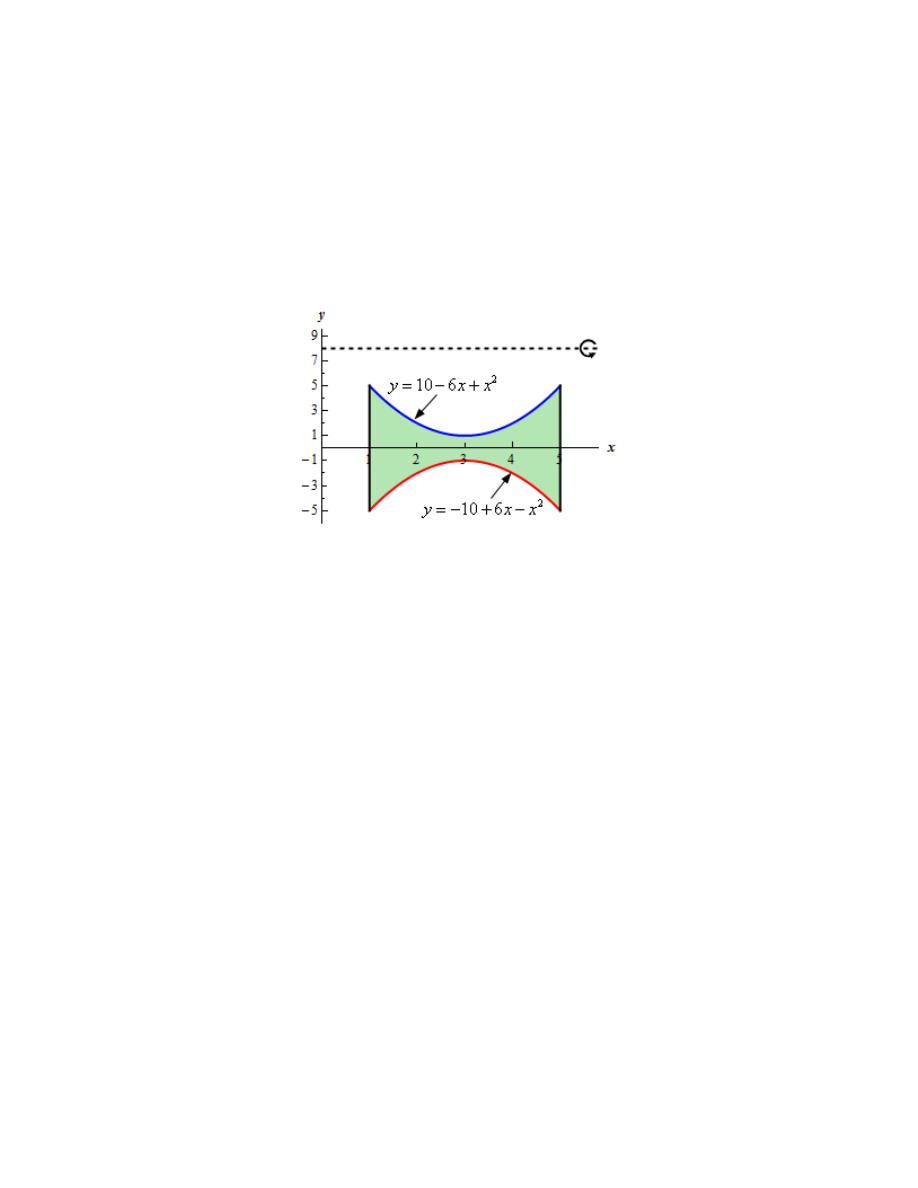
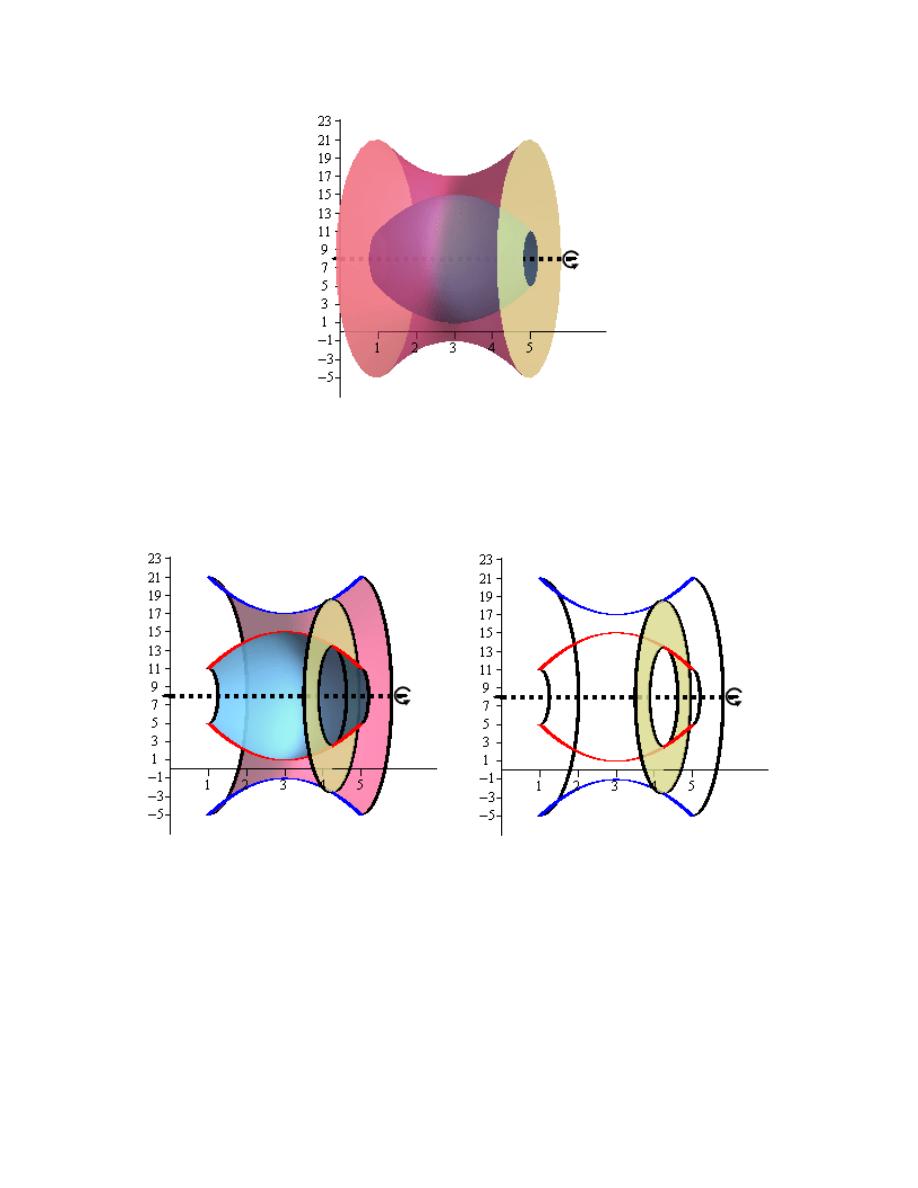
6. Use the method of disks/rings to determine the volume of the solid obtained by rotating the
region bounded by
2
10 6
y
x
x
=
−
+
,
2
10 6
y
x
x
= − +
−
,
1
x
=
and
5
x
=
about the line
8
y
=
.
Hint : Start with sketching the bounded region.
Calculus I
© 2007 Paul Dawkins
37
http://tutorial.math.lamar.edu/terms.aspx
Step 1
We need to start the problem somewhere so let’s start “simple”.
Knowing what the bounded region looks like will definitely help for most of these types of
problems since we need to know how all the curves relate to each other when we go to set up the
area formula and we’ll need limits for the integral which the graph will often help with.
Here is a sketch of the bounded region with the axis of rotation shown.
Hint : Give a good attempt at sketching what the solid of revolution looks like and sketch in a
representative ring.
Note that this can be a difficult thing to do especially if you aren’t a very visual person.
However, having a representative ring can be of great help when we go to write down the area
formula. Also, getting the representative ring can be difficult without a sketch of the solid of
revolution. So, do the best you can at getting these sketches.
Step 2
Here is a sketch of the solid of revolution.
Calculus I
© 2007 Paul Dawkins
38
http://tutorial.math.lamar.edu/terms.aspx
Here are a couple of sketches of a representative ring. The image on the left shows a
representative ring with the front half of the solid cut away and the image on the right shows a
representative ring with a “wire frame” of the back half of the solid (i.e. the curves representing
the edges of the of the back half of the solid).
Hint : Determine a formula for the area of the ring.
Step 3
We now need to find a formula for the area of the ring. Because we are using rings that are
centered on a horizontal axis (i.e. parallel to the x-axis) we know that the area formula will need
to be in terms of x. Therefore the equations of the curves will need to be in terms of x (which in
this case they already are).
Calculus I
© 2007 Paul Dawkins
39
http://tutorial.math.lamar.edu/terms.aspx
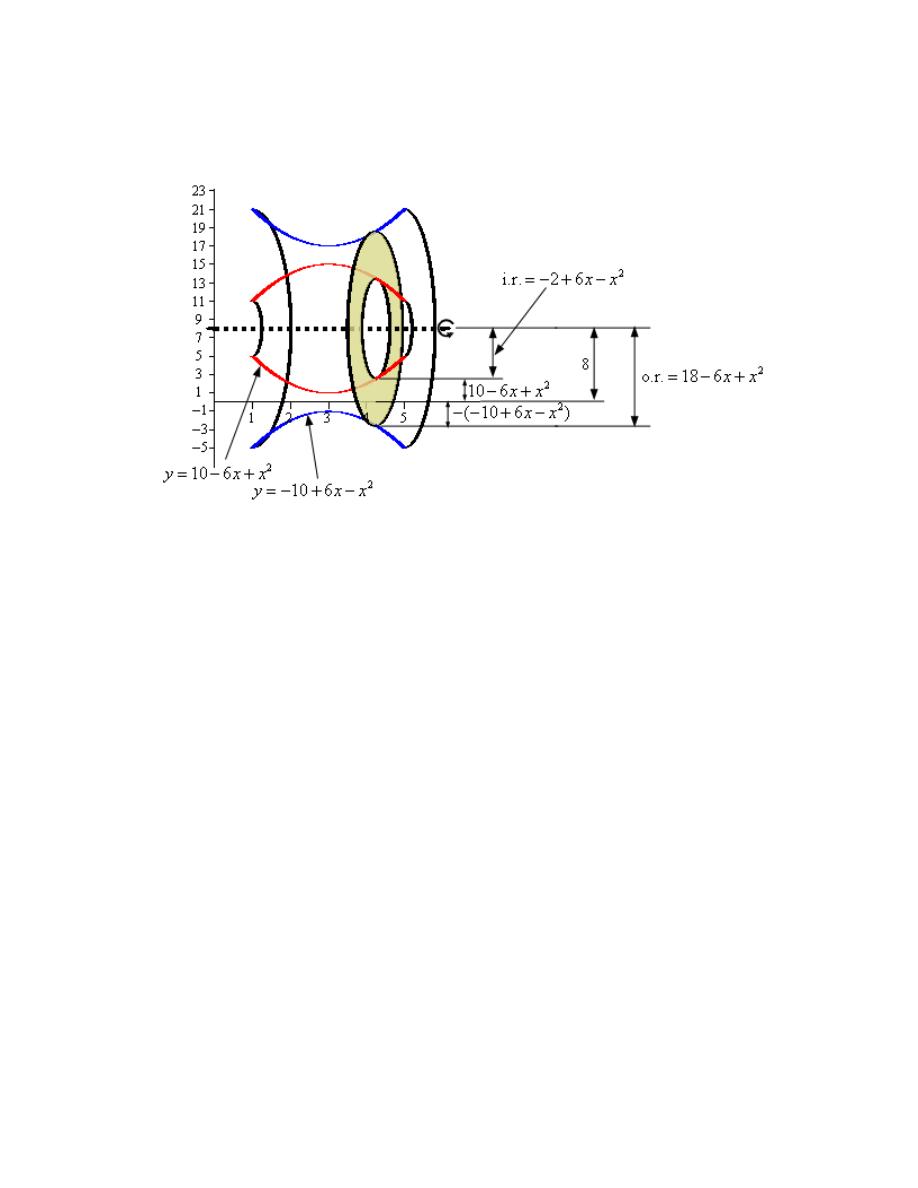
Here is another sketch of a representative ring with all of the various quantities we need put into
it.
From the sketch we can see the ring is centered on the line
8
y
=
and placed at some x.
The inner radius of the ring is then the distance from the axis of rotation to the curve defining the
inner edge of the solid. To determine a formula for this first notice that the axis of rotation is a
distance of 8 from the x-axis. Next, the curve defining the inner edge of the solid is a distance of
2
10 6
y
x
x
=
−
+
from the x-axis. The inner radius is then the difference between these two
distances or,
(
)
2
2
Inner Radius
8
10 6
2 6
x
x
x
x
= −
−
+
= − +
−
The outer radius is computed in a similar manner. It is the distance from the axis of rotation to
the x-axis (a distance of 8) and then it continues below the x-axis until it reaches the curve
defining the outer edge of the solid. So, we need to add these two distances but we need to be
careful because the “lower” function is in fact negative value and so the distance of the point on
the lower function from the x-axis is in fact :
(
)
2
10 6x
x
− − +
−
as is shown on the sketch. The
negative in front of the equation makes sure that the negative value of the function is turned into a
positive quantity (which we need for our distance). The outer radius is then the sum of these two
distances or,
(
)
2
2
Outer Radius
8
10 6
18 6
x
x
x
x
= − − +
−
=
−
+
The area of the ring is then,
Calculus I
© 2007 Paul Dawkins
40
http://tutorial.math.lamar.edu/terms.aspx
( )
(
) (
)
(
) (
)
(
)
2
2
2
2
2
2
2
Outer Radius
Inner Radius
18 6
2 6
320 192
32
A x
x
x
x
x
x
x
π
π
π
=
−
=
−
+
− − +
−
=
−
+
Step 4
The final step is to then set up the integral for the volume and evaluate it.
From the graph from Step 1 we can see that the “first” ring in the solid would occur at
1
x
=
and
the “last” ring would occur at
5
x
=
. Our limits are then :
1
5
x
≤ ≤
.
The volume is then,
(
)
(
)
5
5
2
2
3
32
896
3
3
1
1
320 192
32
320
96
V
x
x
dx
x
x
x
π
π
π
=
−
+
=
−
+
=
∫
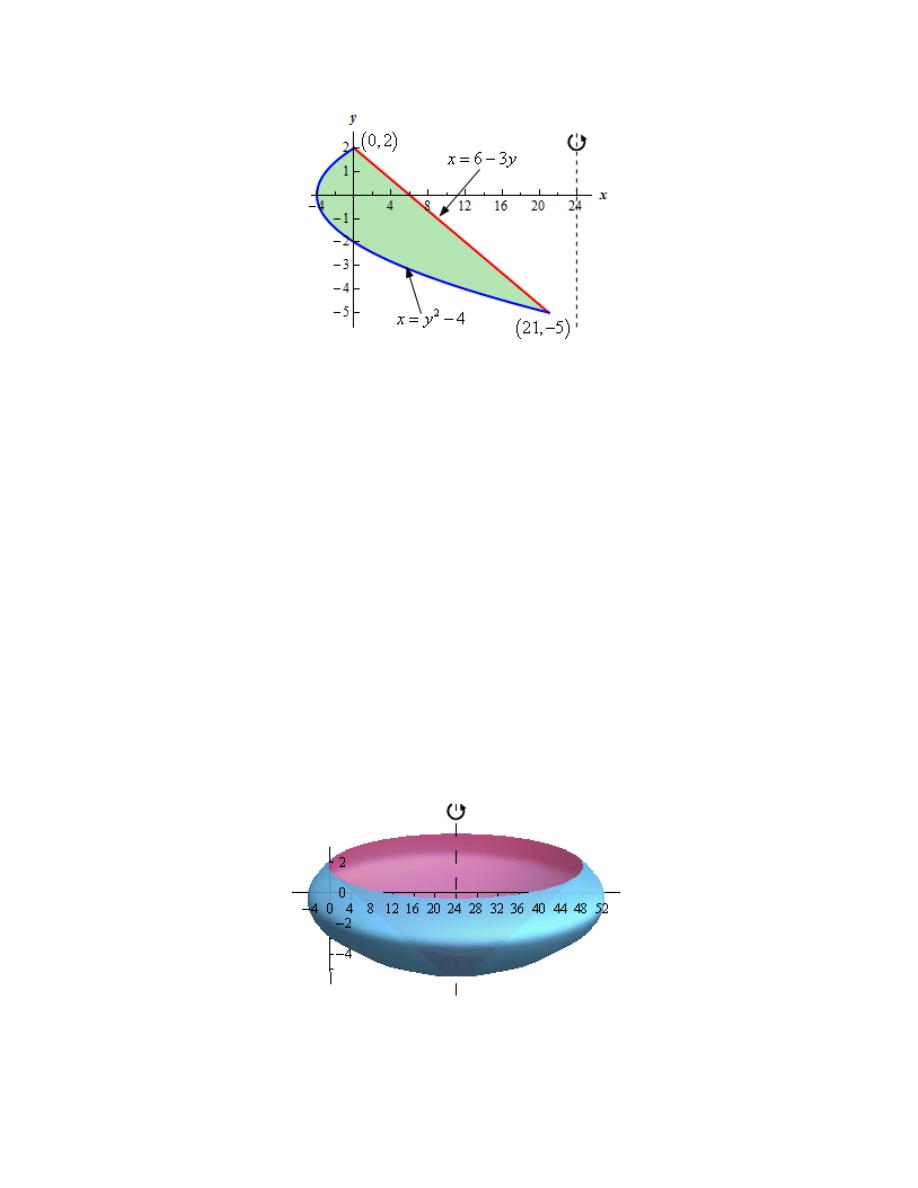
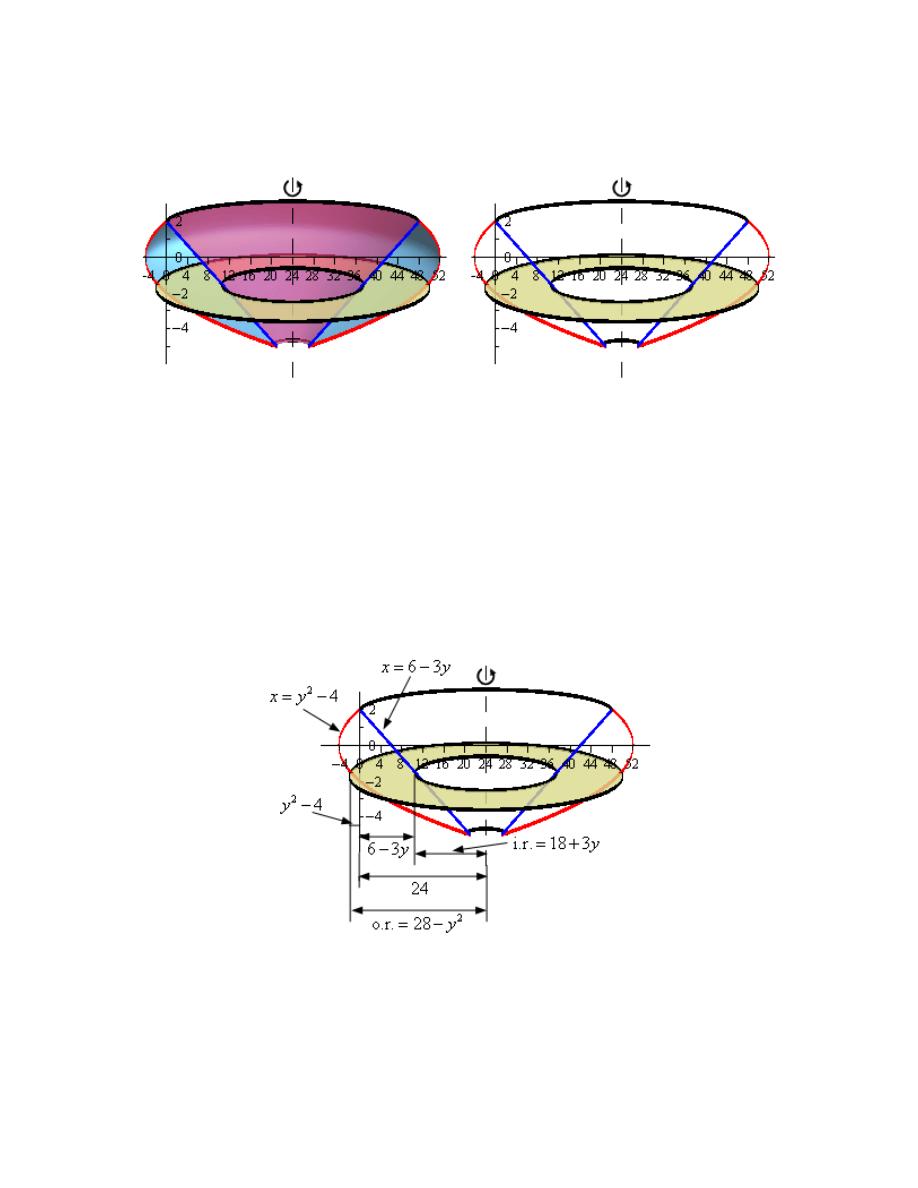
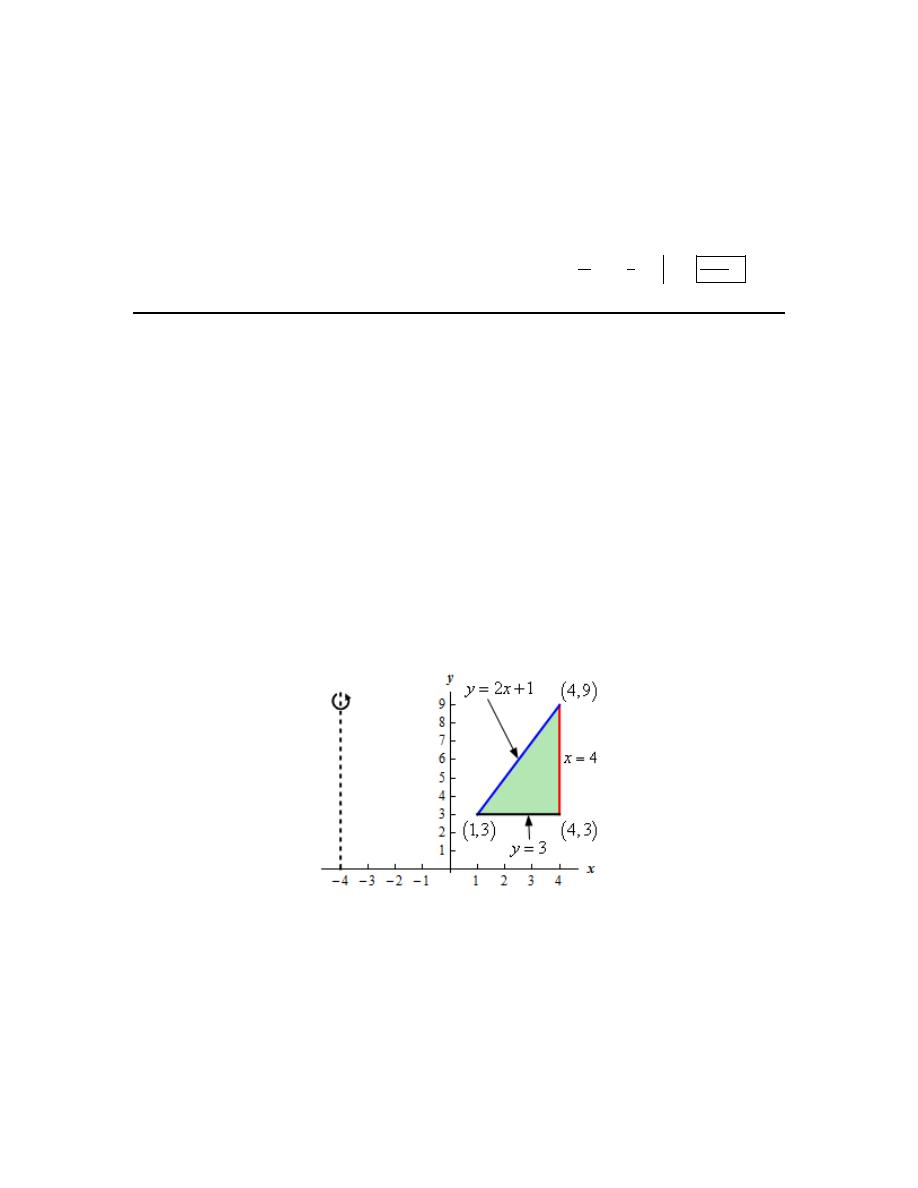
7. Use the method of disks/rings to determine the volume of the solid obtained by rotating the
region bounded by
2
4
x
y
=
−
and
6 3
x
y
= −
about the line
24
x
=
.
Hint : Start with sketching the bounded region.
Step 1
We need to start the problem somewhere so let’s start “simple”.
Knowing what the bounded region looks like will definitely help for most of these types of
problems since we need to know how all the curves relate to each other when we go to set up the
area formula and we’ll need limits for the integral which the graph will often help with.
Here is a sketch of the bounded region with the axis of rotation shown.
Calculus I
© 2007 Paul Dawkins
41
http://tutorial.math.lamar.edu/terms.aspx
To get the intersection points shown on the sketch all we need to do is set the two equations equal
and solve (we’ll need these in a bit).
(
)(
)
(
)
( )
2
2
4
6 3
3
10
0
5
2
0
5,
2
5, 21 & 2, 0
y
y
y
y
y
y
y
y
− = −
+
−
=
+
−
=
⇒
= −
=
⇒
−
Hint : Give a good attempt at sketching what the solid of revolution looks like and sketch in a
representative ring.
Note that this can be a difficult thing to do especially if you aren’t a very visual person.
However, having a representative ring can be of great help when we go to write down the area
formula. Also, getting the representative ring can be difficult without a sketch of the solid of
revolution. So, do the best you can at getting these sketches.
Step 2
Here is a sketch of the solid of revolution.
Here are a couple of sketches of a representative ring. The image on the left shows a
representative ring with the front half of the solid cut away and the image on the right shows a
Calculus I
© 2007 Paul Dawkins
42
http://tutorial.math.lamar.edu/terms.aspx
representative ring with a “wire frame” of the back half of the solid (i.e. the curves representing
the edges of the of the back half of the solid).
Hint : Determine a formula for the area of the ring.
Step 3
We now need to find a formula for the area of the ring. Because we are using rings that are
centered on a vertical axis (i.e. parallel to the y-axis) we know that the area formula will need to
be in terms of y. Therefore the equation of the curves will need to be in terms of y (which in this
case they already are).
Here is another sketch of a representative ring with all of the various quantities we need put into
it.
From the sketch we can see the ring is centered on the line
24
x
=
and placed at some y.
The inner radius of the ring is then the distance from the axis of rotation to the curve defining the
inner edge of the solid. To determine a formula for this first notice that the axis of rotation is a
distance of 24 from the y-axis. Next, the curve defining the inner edge of the solid is a distance of

Calculus I
© 2007 Paul Dawkins
43
http://tutorial.math.lamar.edu/terms.aspx
6 3
x
y
= −
from the y-axis. The inner radius is then the difference between these two distances
or,
(
)
Inner Radius
24
6 3
18 3
y
y
=
− −
=
+
The outer radius is computed in a similar manner but is a little trickier. In this case the curve
defining the outer edge of the solid occurs on both the left and right of the y-axis.
Let’s first look at the case as shown in the sketch above. In this case the value of the function
defining the outer edge of the solid is to the left of the y-axis and so has a negative value. The
distance of this point from the y-axis is then
(
)
2
4
y
−
−
where the minus sign turns the negative
function value into a positive value that we need for distance. The outer radius for this case is
then the sum of the distance of the axis of rotation to the y-axis (a distance of 24) and the distance
of the curve defining the outer edge to the y-axis (which we found above).
If the curve defining the outer edge of the solid is to the right of the y-axis then it will have a
positive value and so the distance of points on the curve and the y-axis is just
2
4
y
−
. We don’t
need the minus sign in this case because the function value is already positive, which we need for
distance. The outer radius in this case is then the distance from the axis of rotation to the y-axis
(a distance of 24) minus this new distance.
Nicely enough in either case the outer radius is then,
(
)
2
2
Outer Radius
24
4
28
y
y
=
−
−
=
−
Note that in cases like this where the curve defining an edge has both positive and negative values
the final equation of the radius (inner or outer depending on the problem) will be the same. You
just need to be careful in setting up the case you choose to look at. If you get the first case set up
correctly you won’t need to do the second as the formula will be the same.
The area of the ring is then,
( )
(
) (
)
(
)
(
)
(
)
2
2
2
2
2
2
4
Outer Radius
Inner Radius
28
18 3
460 108
65
A x
y
y
y
y
y
π
π
π
=
−
=
−
−
+
=
−
−
+
Step 4
The final step is to then set up the integral for the volume and evaluate it.
Calculus I
© 2007 Paul Dawkins
44
http://tutorial.math.lamar.edu/terms.aspx
From the intersection points of the two curves we found in Step 1 we can see that the “first” ring
in the solid would occur at
5
y
= −
and the “last” ring would occur at
2
y
=
. Our limits are then
:
5
2
y
− ≤ ≤
.
The volume is then,
(
)
(
)
2
2
2
4
2
3
5
65
31556
1
3
5
15
5
5
460 108
65
460
54
V
y
y
y
dy
y
y
y
y
π
π
π
−
−
=
−
−
+
=
−
−
+
=
∫
8. Use the method of disks/rings to determine the volume of the solid obtained by rotating the
region bounded by
2
1
y
x
=
+
,
4
x
=
and
3
y
=
about the line
4
x
= −
.
Hint : Start with sketching the bounded region.
Step 1
We need to start the problem somewhere so let’s start “simple”.
Knowing what the bounded region looks like will definitely help for most of these types of
problems since we need to know how all the curves relate to each other when we go to set up the
area formula and we’ll need limits for the integral which the graph will often help with.
Here is a sketch of the bounded region with the axis of rotation shown.
Hint : Give a good attempt at sketching what the solid of revolution looks like and sketch in a
representative ring.
Note that this can be a difficult thing to do especially if you aren’t a very visual person.
However, having a representative ring can be of great help when we go to write down the area
formula. Also, getting the representative ring can be difficult without a sketch of the solid of
revolution. So, do the best you can at getting these sketches.
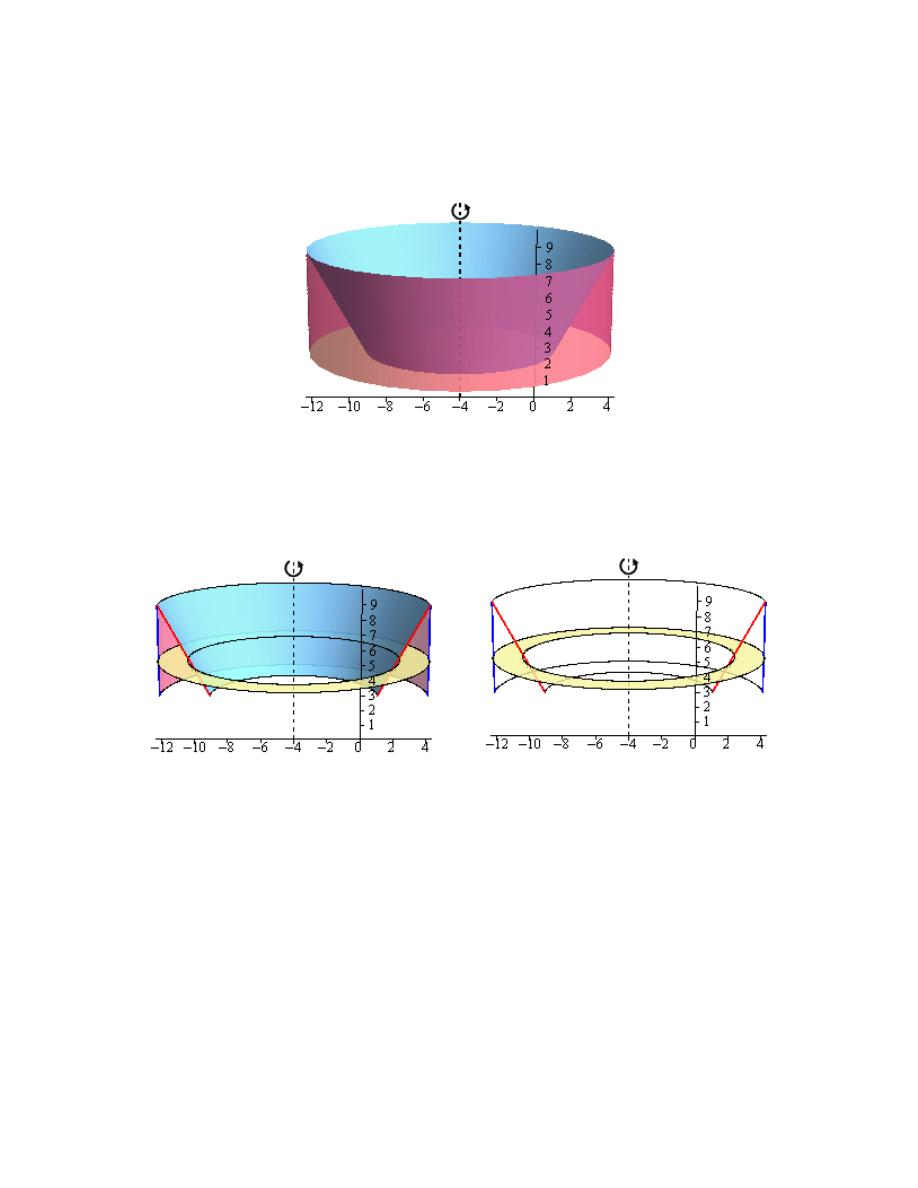
Calculus I
© 2007 Paul Dawkins
45
http://tutorial.math.lamar.edu/terms.aspx
Step 2
Here is a sketch of the solid of revolution.
Here are a couple of sketches of a representative ring. The image on the left shows a
representative ring with the front half of the solid cut away and the image on the right shows a
representative ring with a “wire frame” of the back half of the solid (i.e. the curves representing
the edges of the of the back half of the solid).
Hint : Determine a formula for the area of the ring.
Step 3
We now need to find a formula for the area of the ring. Because we are using rings that are
centered on a vertical axis (i.e. parallel to the y-axis) we know that the area formula will need to
be in terms of y. Therefore the equations of the curves will need to be in terms of y and so we’ll
need to rewrite the equation of the line to be in terms of y.
Here is another sketch of a representative ring with all of the various quantities we need put into
it.
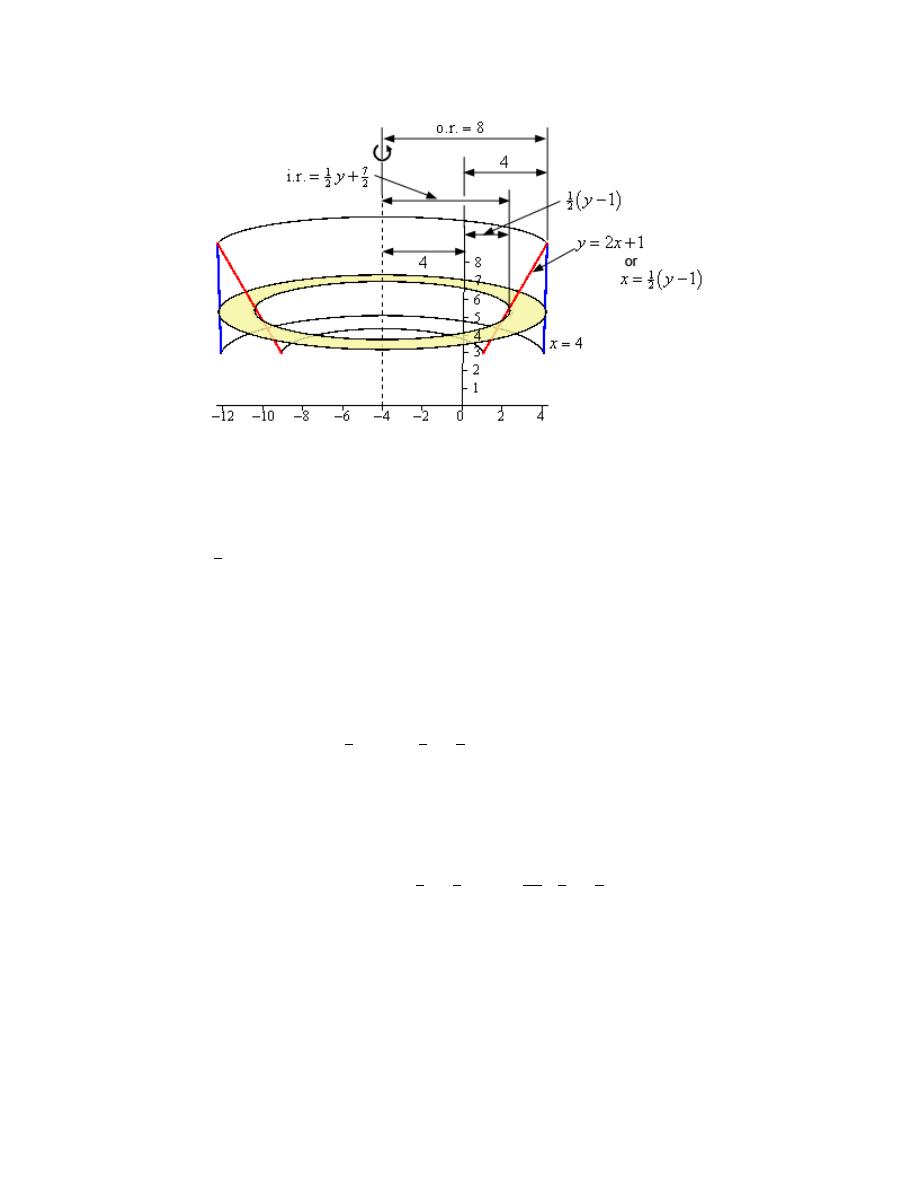
Calculus I
© 2007 Paul Dawkins
46
http://tutorial.math.lamar.edu/terms.aspx
From the sketch we can see the ring is centered on the line
4
x
= −
and placed at some y.
The inner radius of the ring is the distance from the axis of rotation to the y-axis (a distance of 4)
followed by the distance from the y-axis to the curve defining the inner edge of the solid (a
distance of
(
)
1
2
1
y
−
).
Likewise, the outer radius of the ring is the distance from the axis of rotation to the y-axis (again,
a distance of 4) followed by the distance from the y-axis to the curve defining the outer edge of
the solid (a distance of 4).
So the inner and outer radii are,
(
)
7
1
1
2
2
2
Inner Radius
4
1
Outer Radius
4 4
8
y
y
= +
− =
+
= + =
The area of the ring is then,
( )
(
) (
)
( )
(
)
(
)
2
2
2
2
2
7
207
7
1
1
2
2
4
2
4
Outer Radius
Inner Radius
8
A x
y
y
y
π
π
π
=
−
=
−
+
=
−
−
Step 4
The final step is to then set up the integral for the volume and evaluate it.
From the intersection points of the two curves we found in Step 1 we can see that the “first” ring
in the solid would occur at
3
y
=
and the “last” ring would occur at
9
y
=
. Our limits are then :
3
9
y
≤ ≤
.
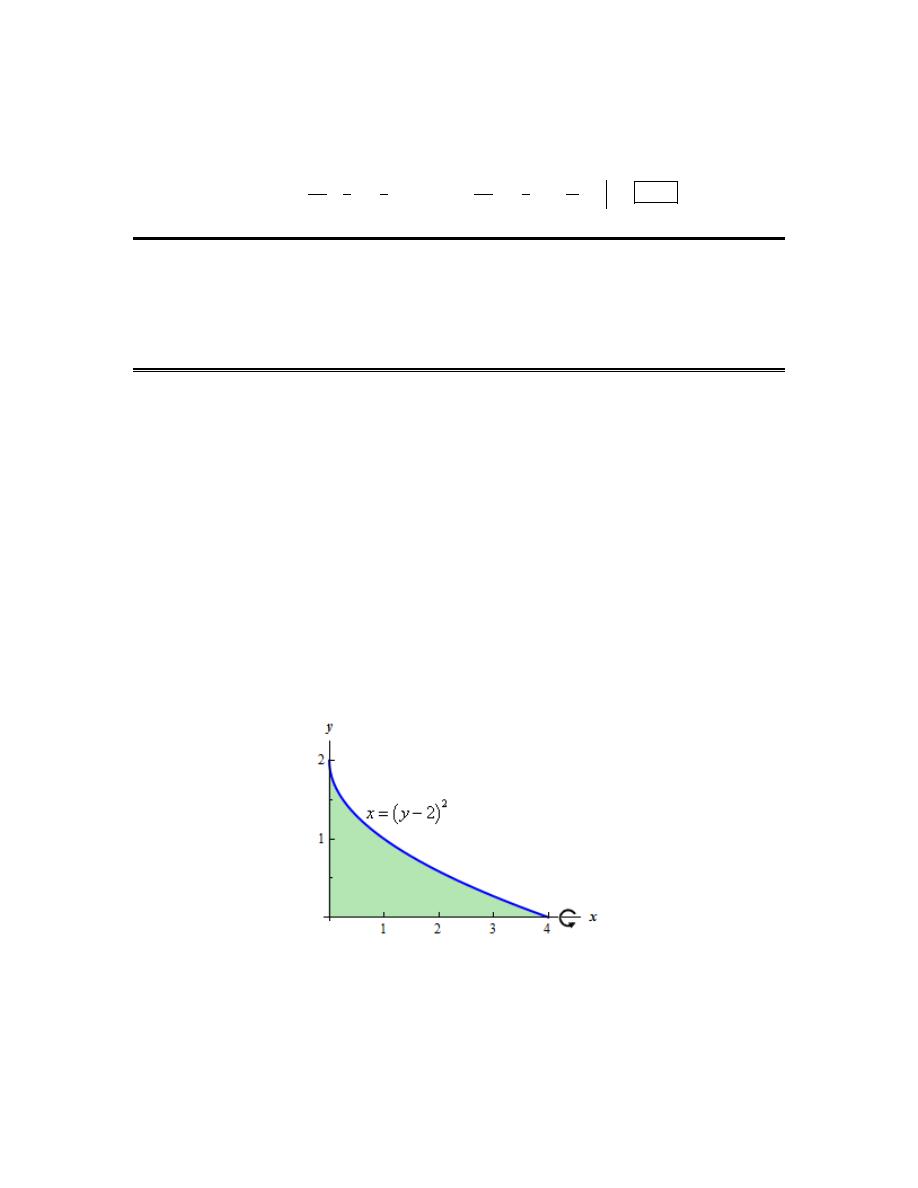
Calculus I
© 2007 Paul Dawkins
47
http://tutorial.math.lamar.edu/terms.aspx
The volume is then,
(
)
(
)
9
9
2
2
3
207
7
207
7
1
1
4
2
4
4
4
12
3
3
126
V
y
y
dx
y
y
y
π
π
π
=
−
−
=
−
−
=
∫
Volumes of Solids of Revolution / Method of Cylinders
1. Use the method of cylinders to determine the volume of the solid obtained by rotating the
region bounded by
(
)
2
2
x
y
=
−
, the x-axis and the y-axis about the x-axis.
Hint : Start with sketching the bounded region.
Step 1
We need to start the problem somewhere so let’s start “simple”.
Knowing what the bounded region looks like will definitely help for most of these types of
problems since we need to know how all the curves relate to each other when we go to set up the
area formula and we’ll need limits for the integral which the graph will often help with.
Here is a sketch of the bounded region with the axis of rotation shown.
Note that we only used the lower half of the parabola here because if we also included the upper
half there would be nothing to bound the region above it. Therefore, in order for the x-axis and y-
axis to be bounding curves we have to use the portion below the lower half of the parabola.
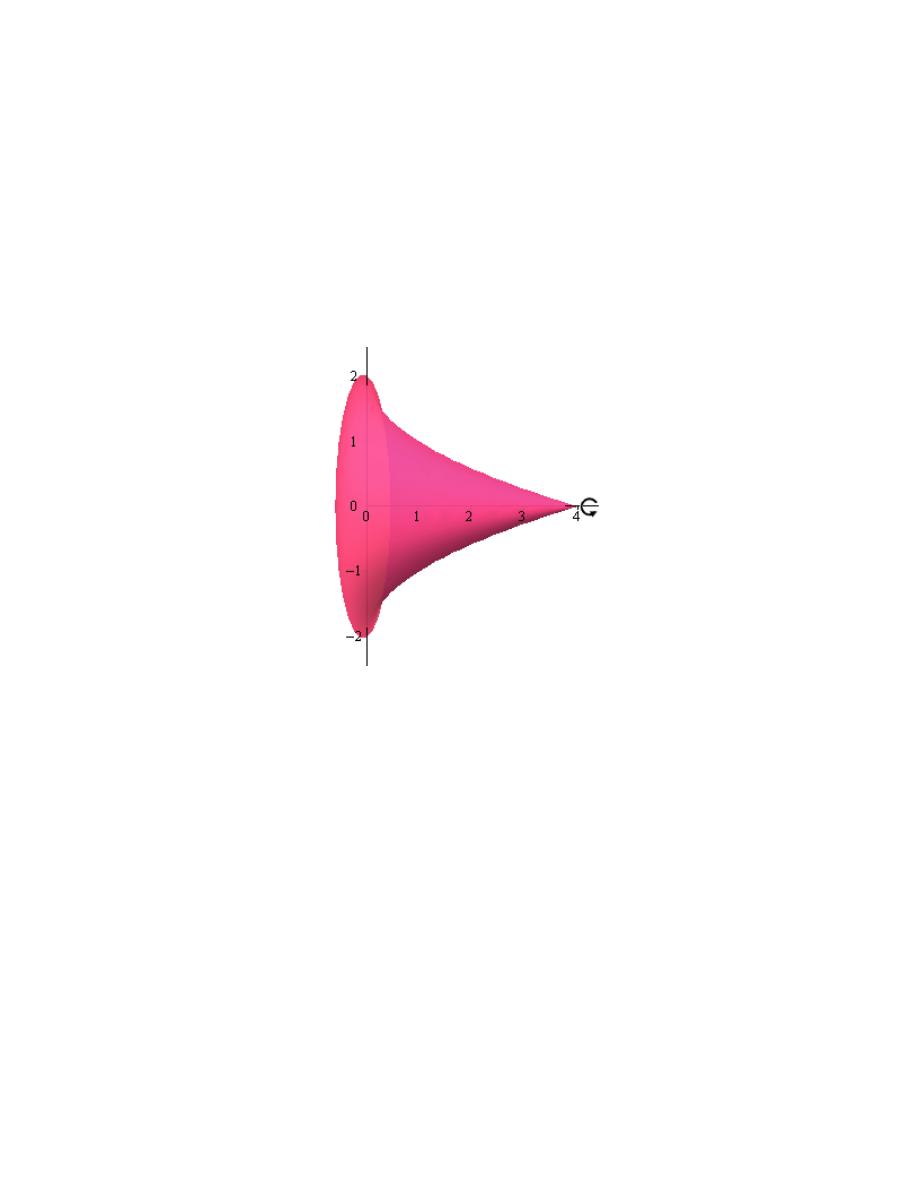
Calculus I
© 2007 Paul Dawkins
48
http://tutorial.math.lamar.edu/terms.aspx
Hint : Give a good attempt at sketching what the solid of revolution looks like and sketch in a
representative cylinder.
Note that this can be a difficult thing to do especially if you aren’t a very visual person.
However, having a representative cylinder can be of great help when we go to write down the
area formula. Also, getting the representative cylinder can be difficult without a sketch of the
solid of revolution. So, do the best you can at getting these sketches.
Step 2
Here is a sketch of the solid of revolution.
Here are a couple of sketches of a representative cylinder. The image on the left shows a
representative cylinder with the front half of the solid cut away and the image on the right shows
a representative cylinder with a “wire frame” of the back half of the solid (i.e. the curves
representing the edges of the of the back half of the solid).
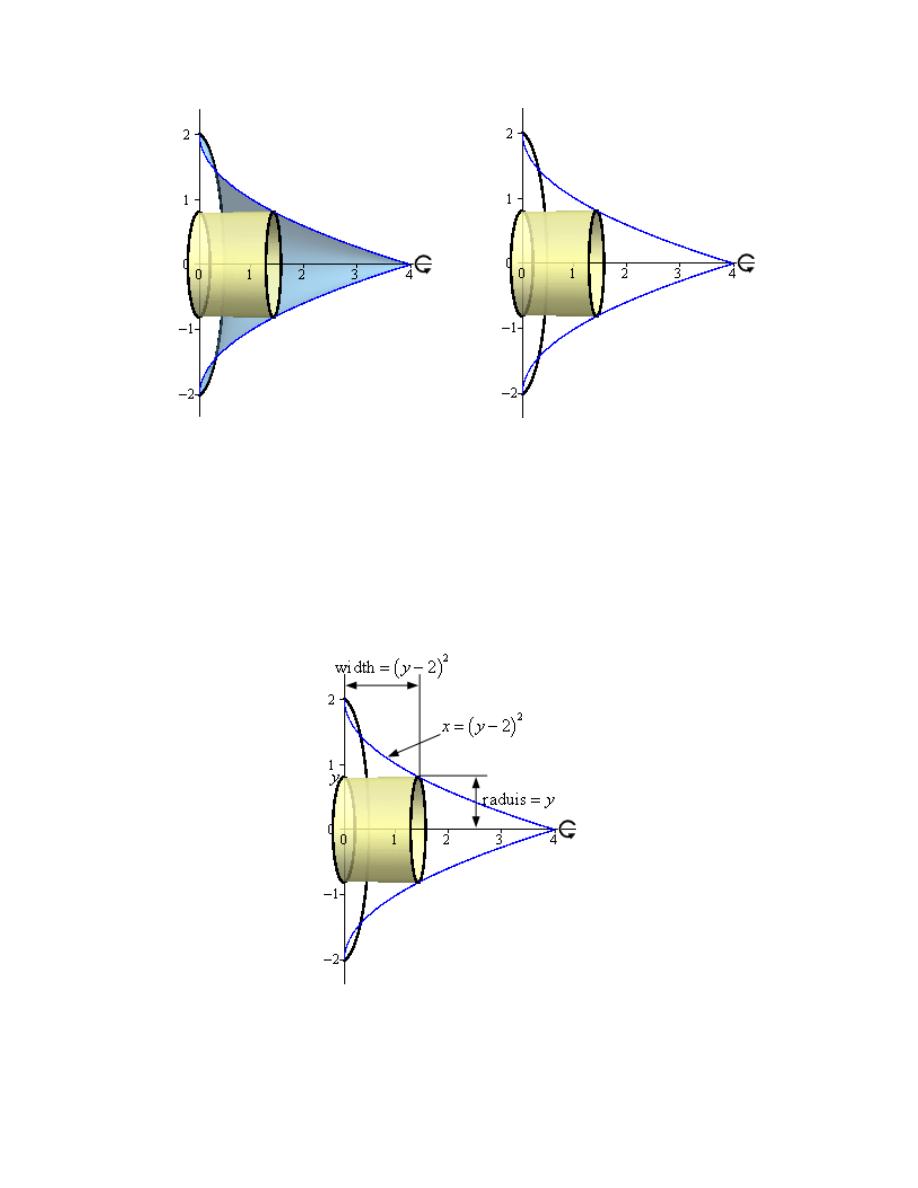
Calculus I
© 2007 Paul Dawkins
49
http://tutorial.math.lamar.edu/terms.aspx
Hint : Determine a formula for the area of the cylinder.
Step 3
We now need to find a formula for the area of the cylinder. Because we are using cylinders that
are centered on the x-axis we know that the area formula will need to be in terms of y. Therefore
the equation of the curves will need to be in terms of y (which in this case they already are).
Here is another sketch of a representative cylinder with all of the various quantities we need put
into it.
From the sketch we can see the cylinder is centered on the x-axis and the upper edge of the
cylinder is at some y.
Calculus I
© 2007 Paul Dawkins
50
http://tutorial.math.lamar.edu/terms.aspx
The radius of the cylinder is just the distance from the x-axis to the upper edge of the cylinder
(i.e. y). The width of the cylinder is the distance from the y-axis to the curve defining the edge of
the solid (a distance of
(
)
2
2
y
−
).
So the radius and width of the cylinder are,
(
)
2
Radius
Width
2
y
y
=
=
−
The area of the cylinder is then,
( )
(
)(
)
( )(
)
(
)
2
2
3
2
Radius
Width
2
2
2
4
4
A y
y
y
y
y
y
π
π
π
=
=
−
=
−
+
Step 4
The final step is to then set up the integral for the volume and evaluate it.
From the graph from Step 1 we can see that the “first” cylinder in the solid would occur at
0
y
=
and the “last” cylinder would occur at
2
y
=
. Our limits are then :
0
2
y
≤ ≤
.
The volume is then,
(
)
(
)
2
2
2
3
2
3
4
8
4
1
3
4
3
0
0
2
4
4
2
2
V
y
y
y
dy
y
y
y
π
π
π
=
−
+
=
−
+
=
∫
2. Use the method of cylinders to determine the volume of the solid obtained by rotating the
region bounded by
1
y
x
=
,
1
2
x
=
,
4
x
=
and the x-axis about the y-axis.
Hint : Start with sketching the bounded region.
Step 1
We need to start the problem somewhere so let’s start “simple”.
Knowing what the bounded region looks like will definitely help for most of these types of
problems since we need to know how all the curves relate to each other when we go to set up the
area formula and we’ll need limits for the integral which the graph will often help with.
Here is a sketch of the bounded region with the axis of rotation shown.
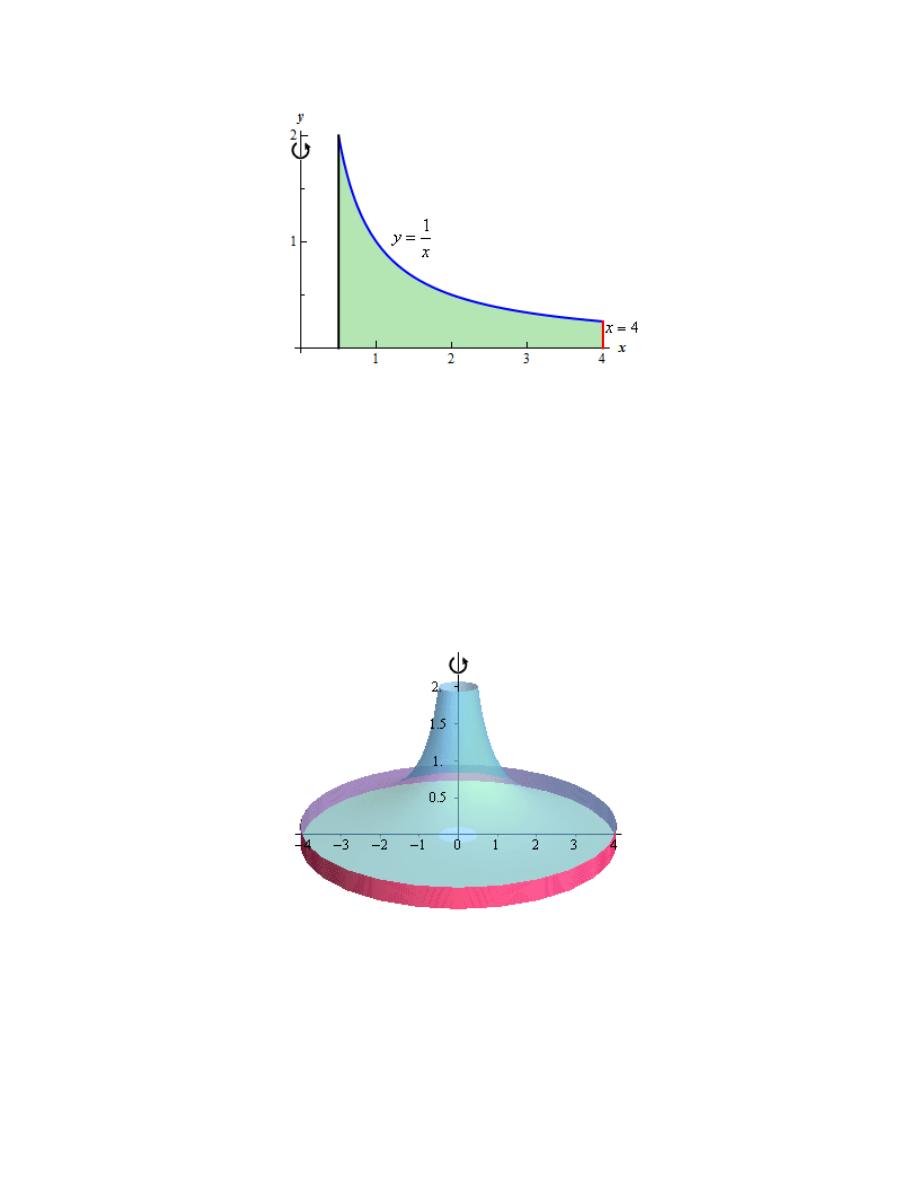
Calculus I
© 2007 Paul Dawkins
51
http://tutorial.math.lamar.edu/terms.aspx
Hint : Give a good attempt at sketching what the solid of revolution looks like and sketch in a
representative cylinder.
Note that this can be a difficult thing to do especially if you aren’t a very visual person.
However, having a representative cylinder can be of great help when we go to write down the
area formula. Also, getting the representative cylinder can be difficult without a sketch of the
solid of revolution. So, do the best you can at getting these sketches.
Step 2
Here is a sketch of the solid of revolution.
Here are a couple of sketches of a representative cylinder. The image on the left shows a
representative cylinder with the front half of the solid cut away and the image on the right shows
a representative cylinder with a “wire frame” of the back half of the solid (i.e. the curves
representing the edges of the of the back half of the solid).
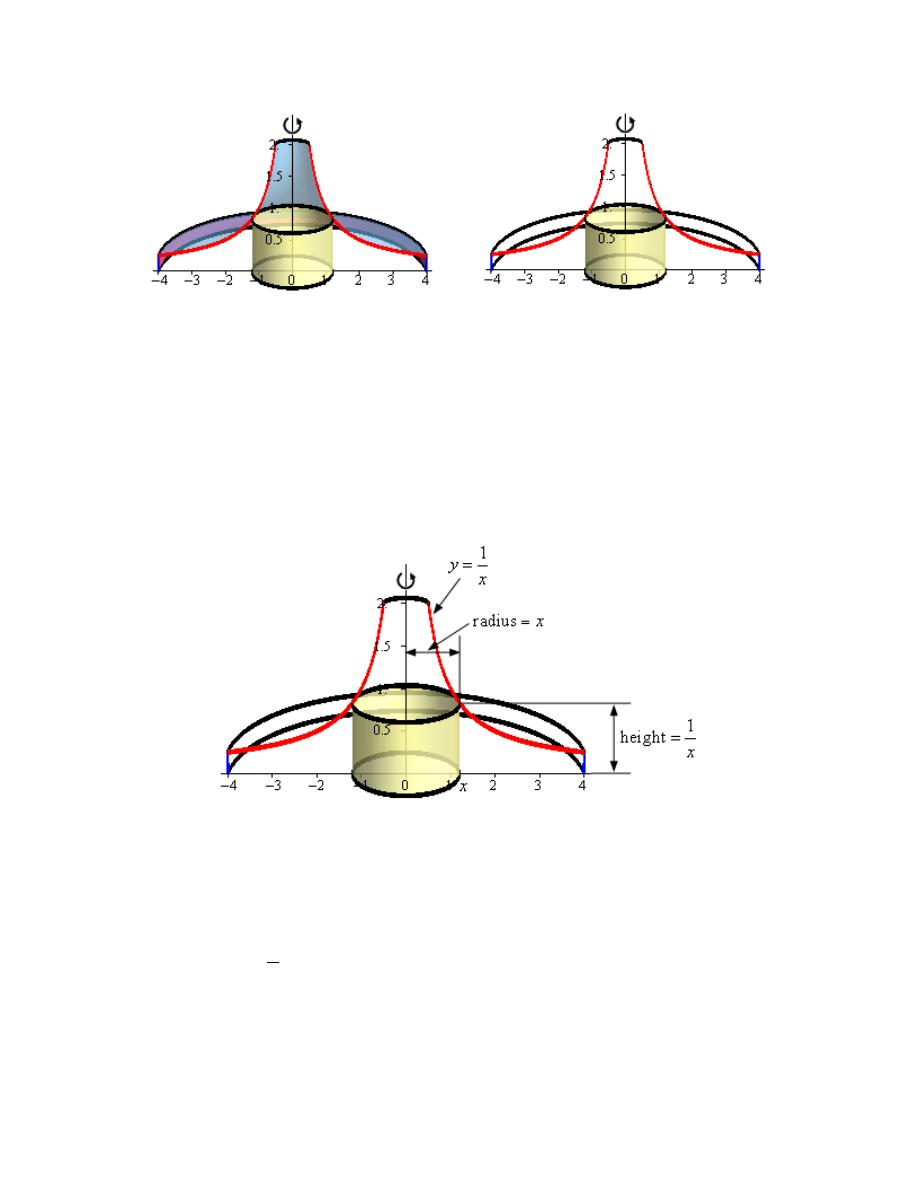
Calculus I
© 2007 Paul Dawkins
52
http://tutorial.math.lamar.edu/terms.aspx
Hint : Determine a formula for the area of the cylinder.
Step 3
We now need to find a formula for the area of the cylinder. Because we are using cylinders that
are centered on the y-axis we know that the area formula will need to be in terms of x. Therefore
the equation of the curves will need to be in terms of x (which in this case they already are).
Here is another sketch of a representative cylinder with all of the various quantities we need put
into it.
From the sketch we can see the cylinder is centered on the y-axis and the right edge of the
cylinder is at some x.
The radius of the cylinder is just the distance from the y-axis to the right edge of the cylinder (i.e.
x). The height of the cylinder is the distance from the x-axis to the curve defining the edge of the
solid (a distance of
1
x
).
So the radius and width of the cylinder are,
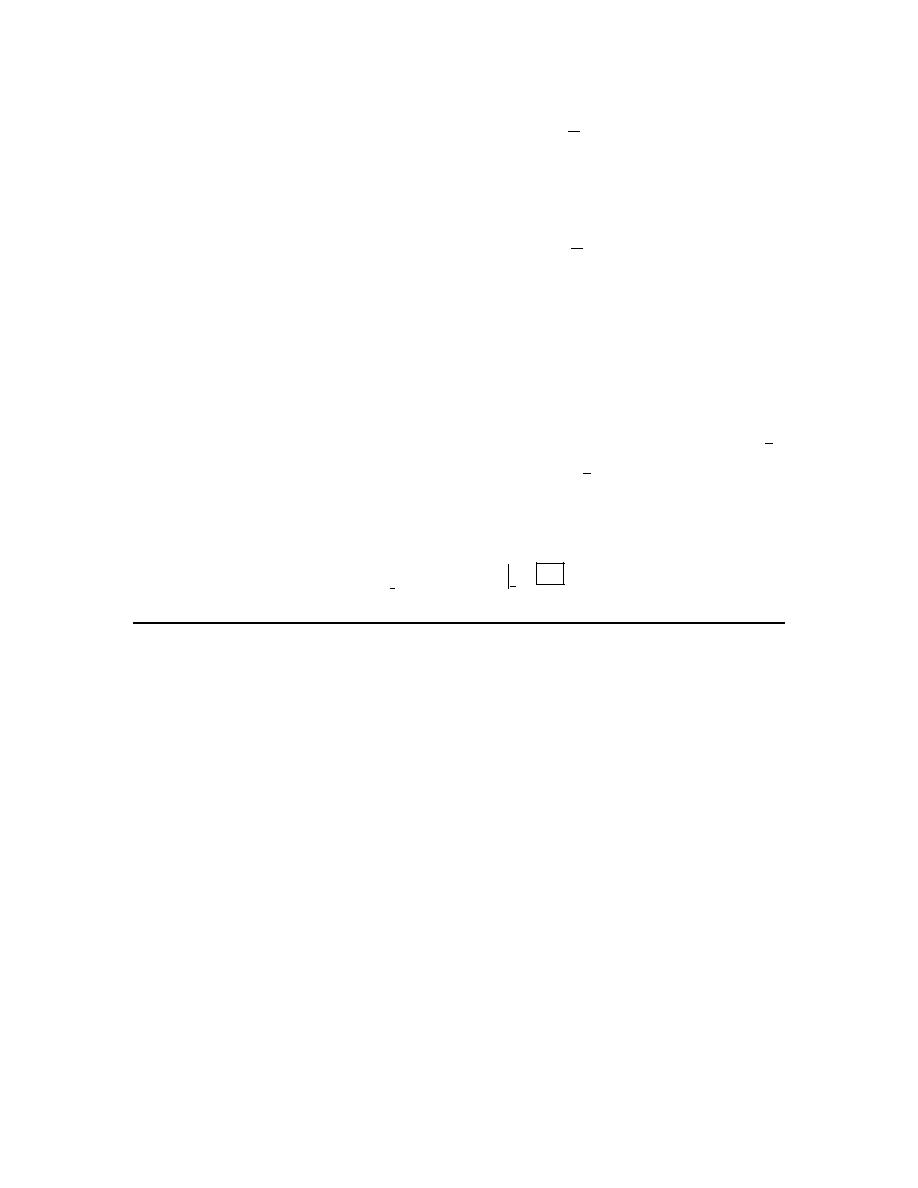
Calculus I
© 2007 Paul Dawkins
53
http://tutorial.math.lamar.edu/terms.aspx
1
Radius
Height
x
x
=
=
The area of the cylinder is then,
( )
(
)(
)
( )
1
2
Radius Height
2
2
A x
x
x
π
π
π
=
=
=
Do not expect all the variables to cancel out in the area formula. It may happen on occasion, as it
did here, but it is rare with it does.
Step 4
The final step is to then set up the integral for the volume and evaluate it.
From the graph from Step 1 we can see that the “first” cylinder in the solid would occur at
1
2
x
=
and the “last” cylinder would occur at
4
x
=
. Our limits are then :
1
2
4
x
≤ ≤
.
The volume is then,
( )
1
1
2
2
4
4
2
2
7
V
dx
x
π
π
π
=
=
=
∫
3. Use the method of cylinders to determine the volume of the solid obtained by rotating the
region bounded by
4
y
x
=
and
3
y
x
=
about the y-axis. For this problem assume that
0
x
≥
.
Hint : Start with sketching the bounded region.
Step 1
We need to start the problem somewhere so let’s start “simple”.
Knowing what the bounded region looks like will definitely help for most of these types of
problems since we need to know how all the curves relate to each other when we go to set up the
area formula and we’ll need limits for the integral which the graph will often help with.
Here is a sketch of the bounded region with the axis of rotation shown.
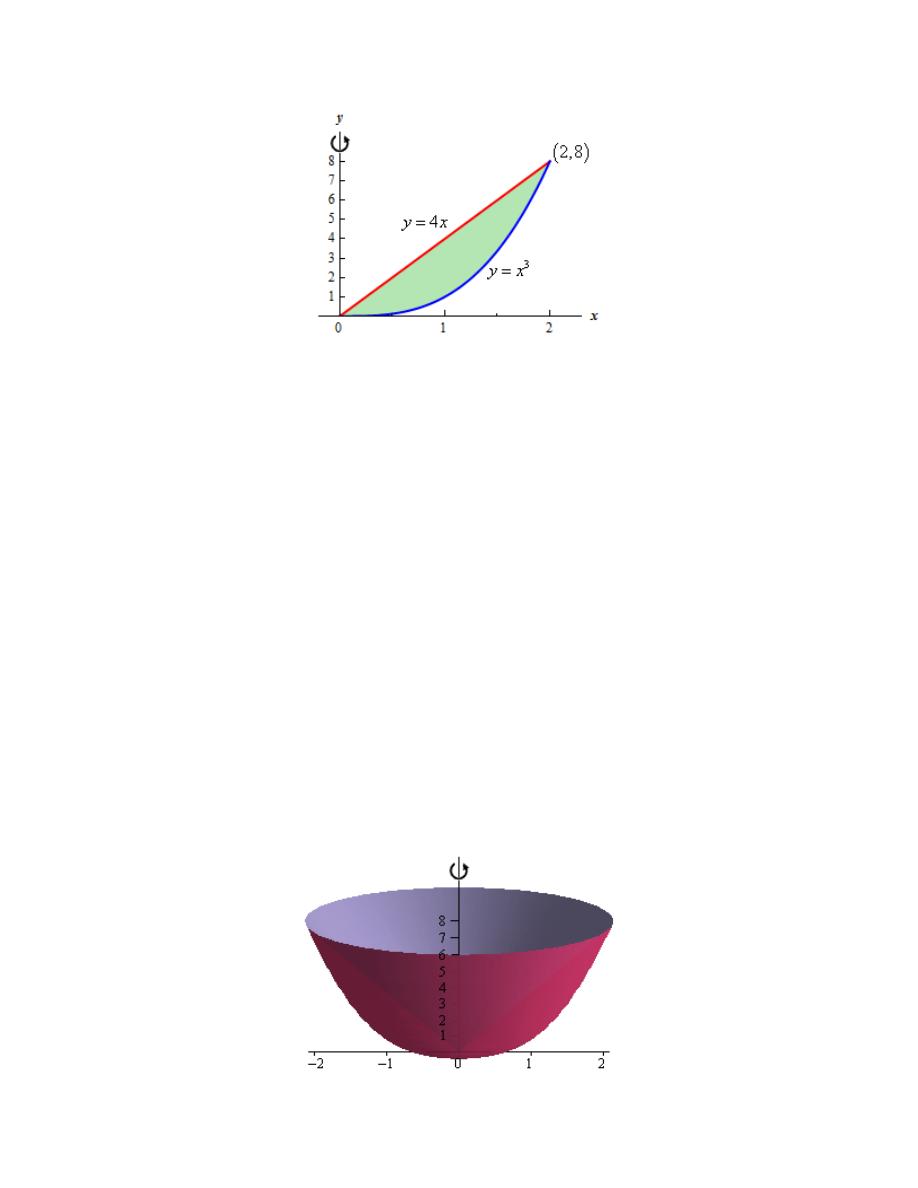
Calculus I
© 2007 Paul Dawkins
54
http://tutorial.math.lamar.edu/terms.aspx
To get the intersection points shown on the graph, which we’ll need in a bit, all we need to do is
set the equations equal to each other and solve.
(
)
( )
( )
3
3
2
4
4
0
4
0
0,
2
0, 0
&
2,8
x
x
x
x
x x
x
x
=
−
=
−
=
⇒
=
= ±
⇒
Note that the problem statement said to assume that
0
x
≥
and so we won’t use the
2
x
= −
intersection point.
Hint : Give a good attempt at sketching what the solid of revolution looks like and sketch in a
representative cylinder.
Note that this can be a difficult thing to do especially if you aren’t a very visual person.
However, having a representative cylinder can be of great help when we go to write down the
area formula. Also, getting the representative cylinder can be difficult without a sketch of the
solid of revolution. So, do the best you can at getting these sketches.
Step 2
Here is a sketch of the solid of revolution.
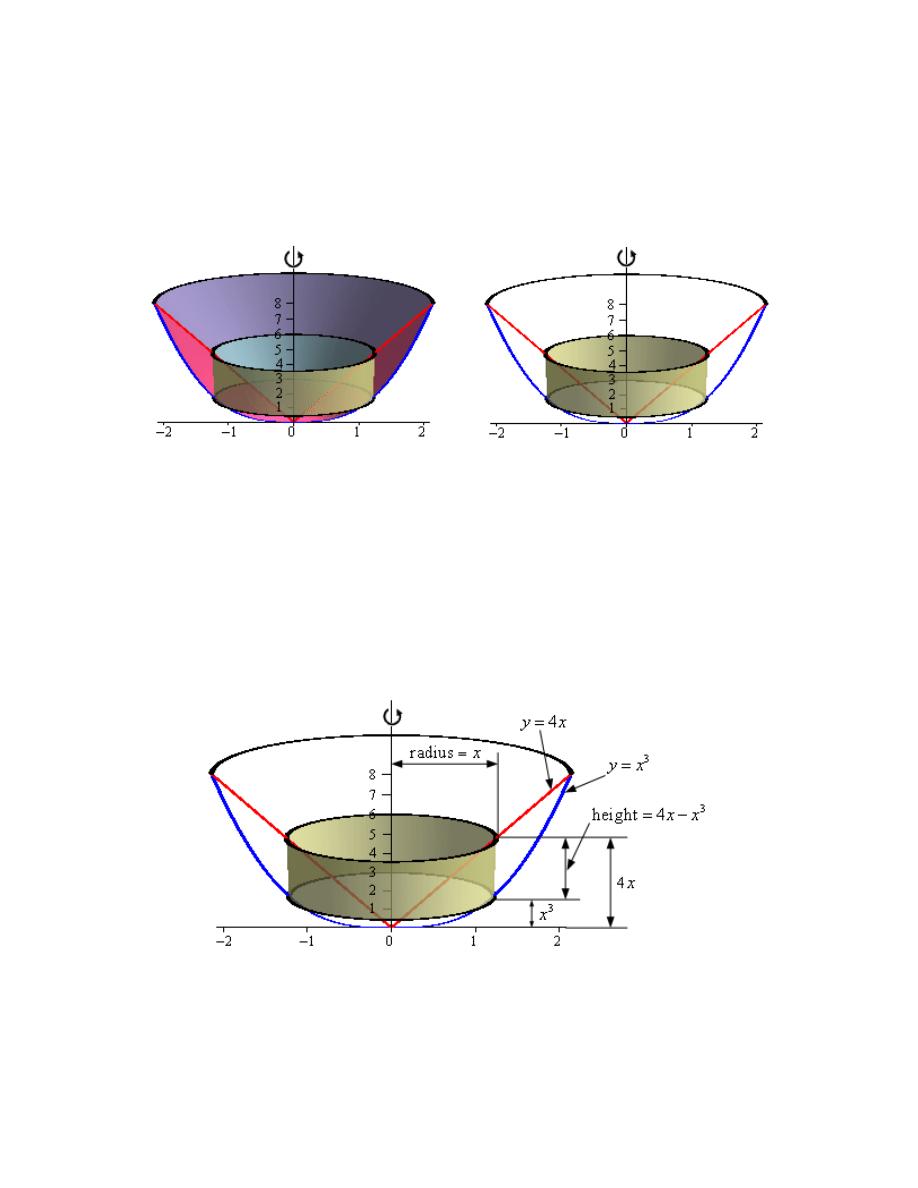
Calculus I
© 2007 Paul Dawkins
55
http://tutorial.math.lamar.edu/terms.aspx
Here are a couple of sketches of a representative cylinder. The image on the left shows a
representative cylinder with the front half of the solid cut away and the image on the right shows
a representative cylinder with a “wire frame” of the back half of the solid (i.e. the curves
representing the edges of the of the back half of the solid).
Hint : Determine a formula for the area of the cylinder.
Step 3
We now need to find a formula for the area of the cylinder. Because we are using cylinders that
are centered on the y-axis we know that the area formula will need to be in terms of x. Therefore
the equation of the curves will need to be in terms of x (which in this case they already are).
Here is another sketch of a representative cylinder with all of the various quantities we need put
into it.
From the sketch we can see the cylinder is centered on the y-axis and the right edge of the
cylinder is at some x.
Calculus I
© 2007 Paul Dawkins
56
http://tutorial.math.lamar.edu/terms.aspx
The radius of the cylinder is just the distance from the y-axis to the right edge of the cylinder (i.e.
x).
The top of the cylinder is on the curve defining the upper portion of the solid and is a distance of
4x
from the x-axis. The bottom of the cylinder is on the curve defining the lower portion of the
solid and is a distance of
3
x
from the x-axis. The height then is the difference of these two.
So the radius and height of the cylinder are,
3
Radius
Height
4
x
x
x
=
=
−
The area of the cylinder is then,
( )
(
)(
)
( )
(
)
(
)
3
2
4
2
Radius Height
2
4
2
4
A x
x
x
x
x
x
π
π
π
=
=
−
=
−
Step 4
The final step is to then set up the integral for the volume and evaluate it.
From the graph from Step 1 we can see that the “first” cylinder in the solid would occur at
0
x
=
and the “last” cylinder would occur at
2
x
=
. Our limits are then :
0
2
x
≤ ≤
.
The volume is then,
(
)
(
)
2
2
2
4
3
5
128
4
1
3
5
15
0
0
2
4
2
V
x
x
dx
x
x
π
π
π
=
−
=
−
=
∫
4. Use the method of cylinders to determine the volume of the solid obtained by rotating the
region bounded by
4
y
x
=
and
3
y
x
=
about the x-axis. For this problem assume that
0
x
≥
.
Hint : Start with sketching the bounded region.
Step 1
We need to start the problem somewhere so let’s start “simple”.
Knowing what the bounded region looks like will definitely help for most of these types of
problems since we need to know how all the curves relate to each other when we go to set up the
area formula and we’ll need limits for the integral which the graph will often help with.
Here is a sketch of the bounded region with the axis of rotation shown.
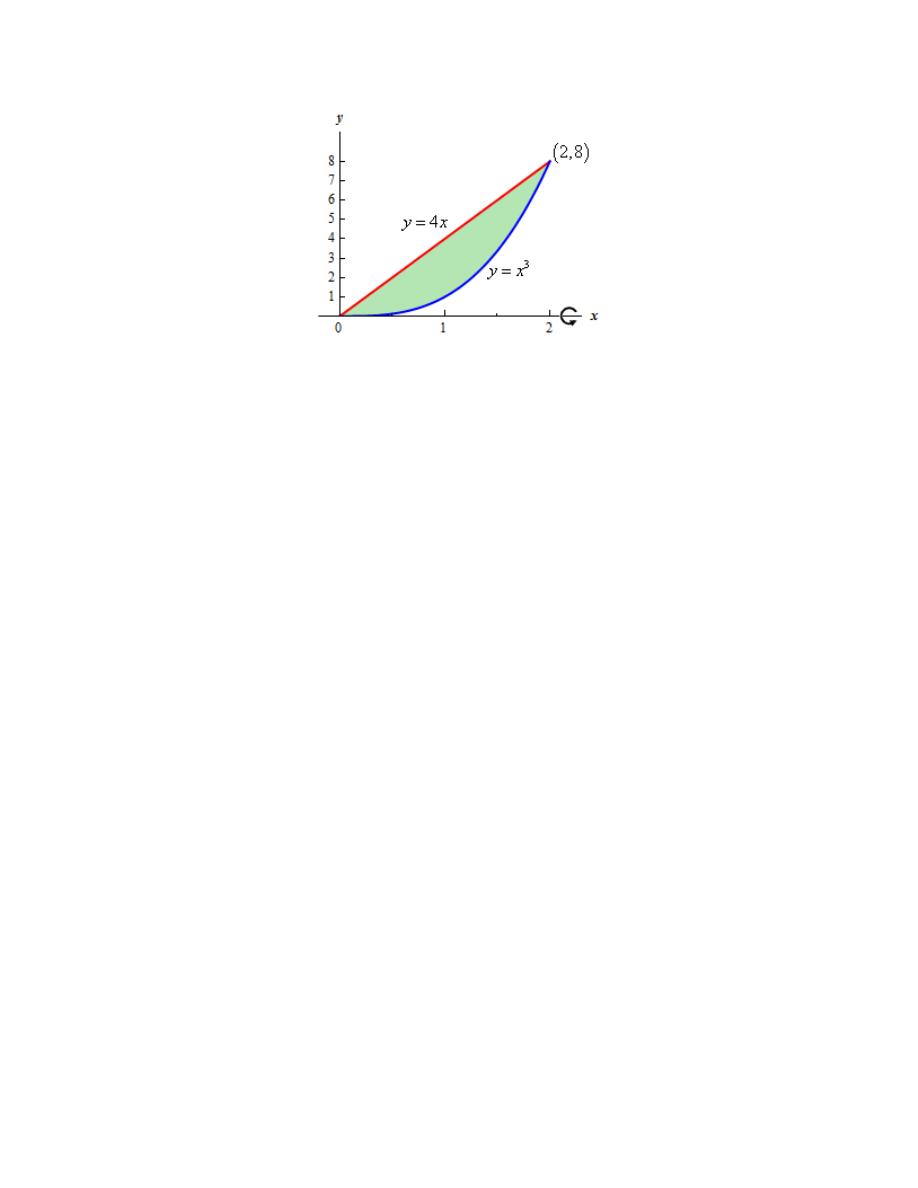
Calculus I
© 2007 Paul Dawkins
57
http://tutorial.math.lamar.edu/terms.aspx
To get the intersection points shown on the graph, which we’ll need in a bit, all we need to do is
set the equations equal to each other and solve.
(
)
( )
( )
3
3
2
4
4
0
4
0
0,
2
0, 0
&
2,8
x
x
x
x
x x
x
x
=
−
=
−
=
⇒
=
= ±
⇒
Note that the problem statement said to assume that
0
x
≥
and so we won’t use the
2
x
= −
intersection point.
Hint : Give a good attempt at sketching what the solid of revolution looks like and sketch in a
representative cylinder.
Note that this can be a difficult thing to do especially if you aren’t a very visual person.
However, having a representative cylinder can be of great help when we go to write down the
area formula. Also, getting the representative cylinder can be difficult without a sketch of the
solid of revolution. So, do the best you can at getting these sketches.
Step 2
Here is a sketch of the solid of revolution.
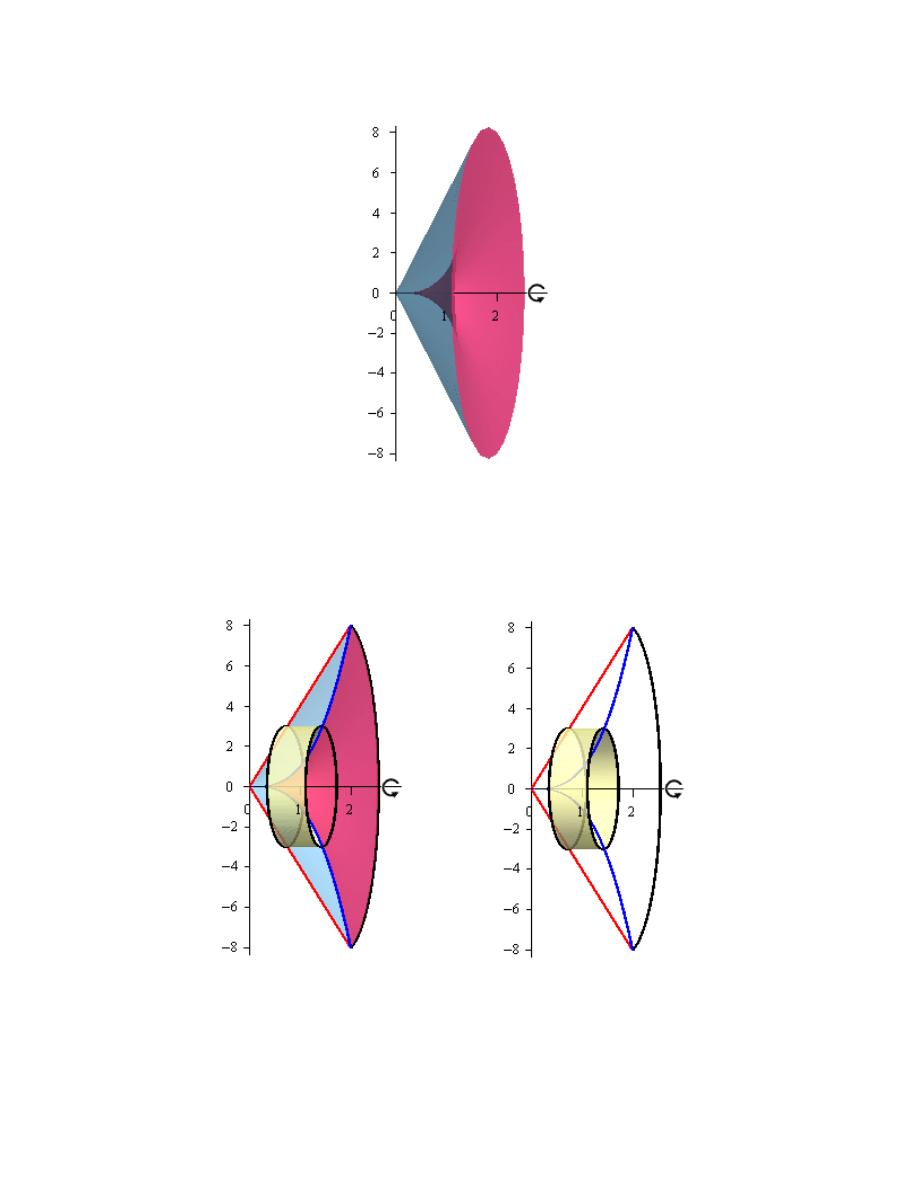
Calculus I
© 2007 Paul Dawkins
58
http://tutorial.math.lamar.edu/terms.aspx
Here are a couple of sketches of a representative cylinder. The image on the left shows a
representative cylinder with the front half of the solid cut away and the image on the right shows
a representative cylinder with a “wire frame” of the back half of the solid (i.e. the curves
representing the edges of the of the back half of the solid).
Hint : Determine a formula for the area of the cylinder.
Step 3
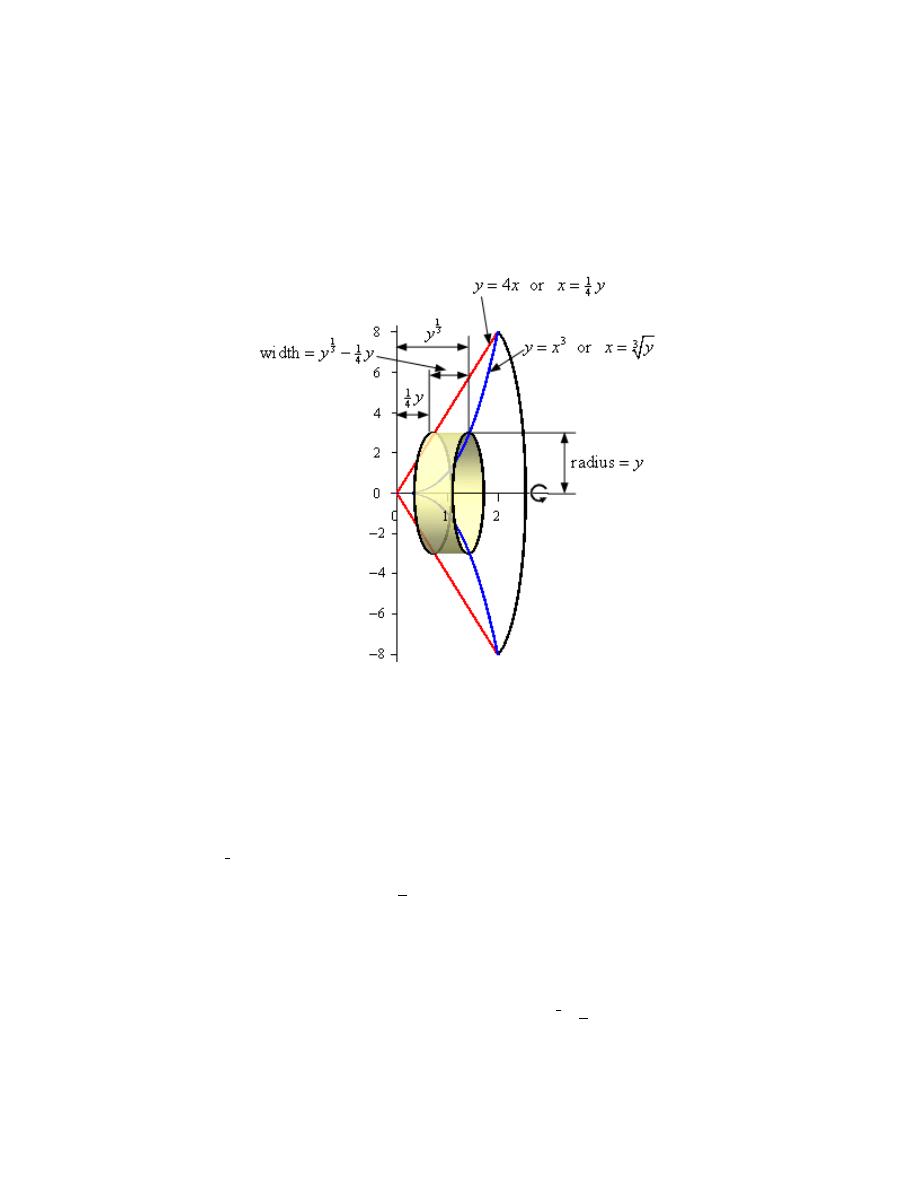
Calculus I
© 2007 Paul Dawkins
59
http://tutorial.math.lamar.edu/terms.aspx
We now need to find a formula for the area of the cylinder. Because we are using cylinders that
are centered on the x-axis we know that the area formula will need to be in terms of y. Therefore
we’ll need to rewrite the equations of the curves in terms of y.
Here is another sketch of a representative cylinder with all of the various quantities we need put
into it.
From the sketch we can see the cylinder is centered on the x-axis and the upper edge of the
cylinder is at some y.
The radius of the cylinder is just the distance from the x-axis to the upper edge of the cylinder
(i.e. y).
The right edge of the cylinder is on the curve defining the right portion of the solid and is a
distance of
1
3
y
from the y-axis. The left edge of the cylinder is on the curve defining the left
portion of the solid and is a distance of
1
4
y
from the y-axis. The height then is the difference of
these two.
So the radius and width of the cylinder are,
1
3
1
4
Radius
Width
y
y
y
=
=
−
The area of the cylinder is then,
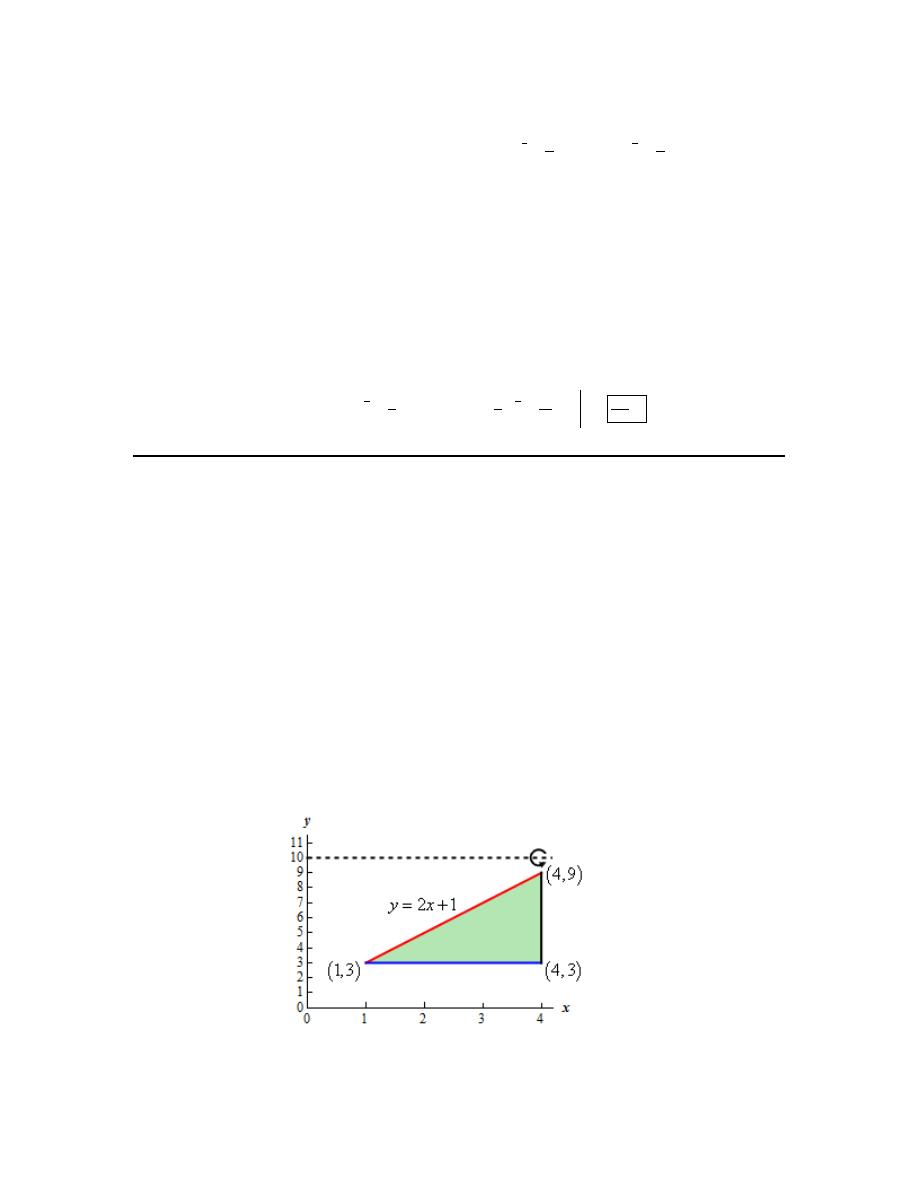
Calculus I
© 2007 Paul Dawkins
60
http://tutorial.math.lamar.edu/terms.aspx
( )
(
)(
)
( )
(
) (
)
1
4
3
3
2
1
1
4
4
2
Radius Height
2
2
A y
y
y
y
y
y
π
π
π
=
=
−
=
−
Step 4
The final step is to then set up the integral for the volume and evaluate it.
From the graph from Step 1 we can see that the “first” cylinder in the solid would occur at
0
y
=
and the “last” cylinder would occur at
8
y
=
. Our limits are then :
0
8
y
≤ ≤
.
The volume is then,
(
)
(
)
7
4
3
3
8
8
2
3
3
512
1
1
4
7
12
21
0
0
2
2
V
y
y
dy
y
y
π
π
π
=
−
=
−
=
⌠
⌡
5. Use the method of cylinders to determine the volume of the solid obtained by rotating the
region bounded by
2
1
y
x
=
+
,
3
y
=
and
4
x
=
about the line
10
y
=
.
Hint : Start with sketching the bounded region.
Step 1
We need to start the problem somewhere so let’s start “simple”.
Knowing what the bounded region looks like will definitely help for most of these types of
problems since we need to know how all the curves relate to each other when we go to set up the
area formula and we’ll need limits for the integral which the graph will often help with.
Here is a sketch of the bounded region with the axis of rotation shown.
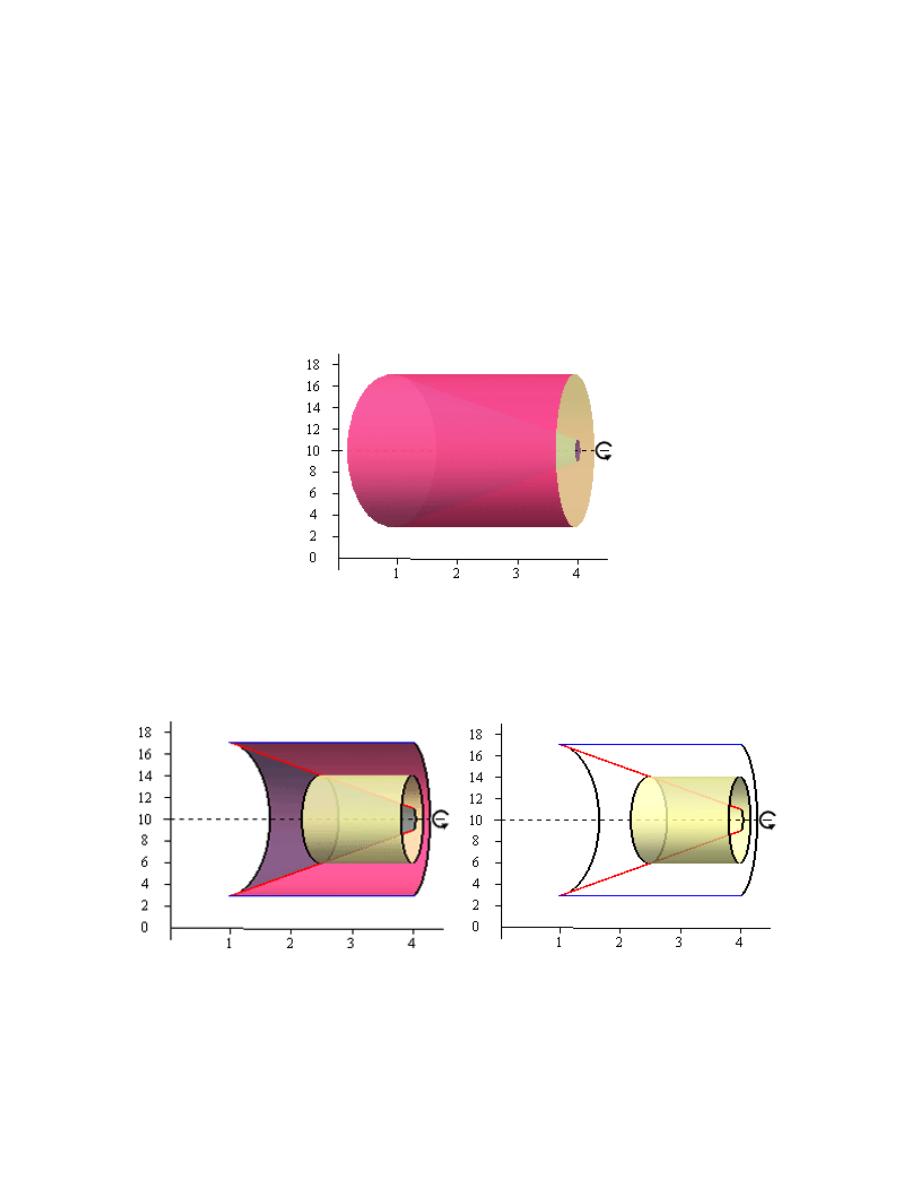
Calculus I
© 2007 Paul Dawkins
61
http://tutorial.math.lamar.edu/terms.aspx
Hint : Give a good attempt at sketching what the solid of revolution looks like and sketch in a
representative cylinder.
Note that this can be a difficult thing to do especially if you aren’t a very visual person.
However, having a representative cylinder can be of great help when we go to write down the
area formula. Also, getting the representative cylinder can be difficult without a sketch of the
solid of revolution. So, do the best you can at getting these sketches.
Step 2
Here is a sketch of the solid of revolution.
Here are a couple of sketches of a representative cylinder. The image on the left shows a
representative cylinder with the front half of the solid cut away and the image on the right shows
a representative cylinder with a “wire frame” of the back half of the solid (i.e. the curves
representing the edges of the of the back half of the solid).
Hint : Determine a formula for the area of the cylinder.
Step 3
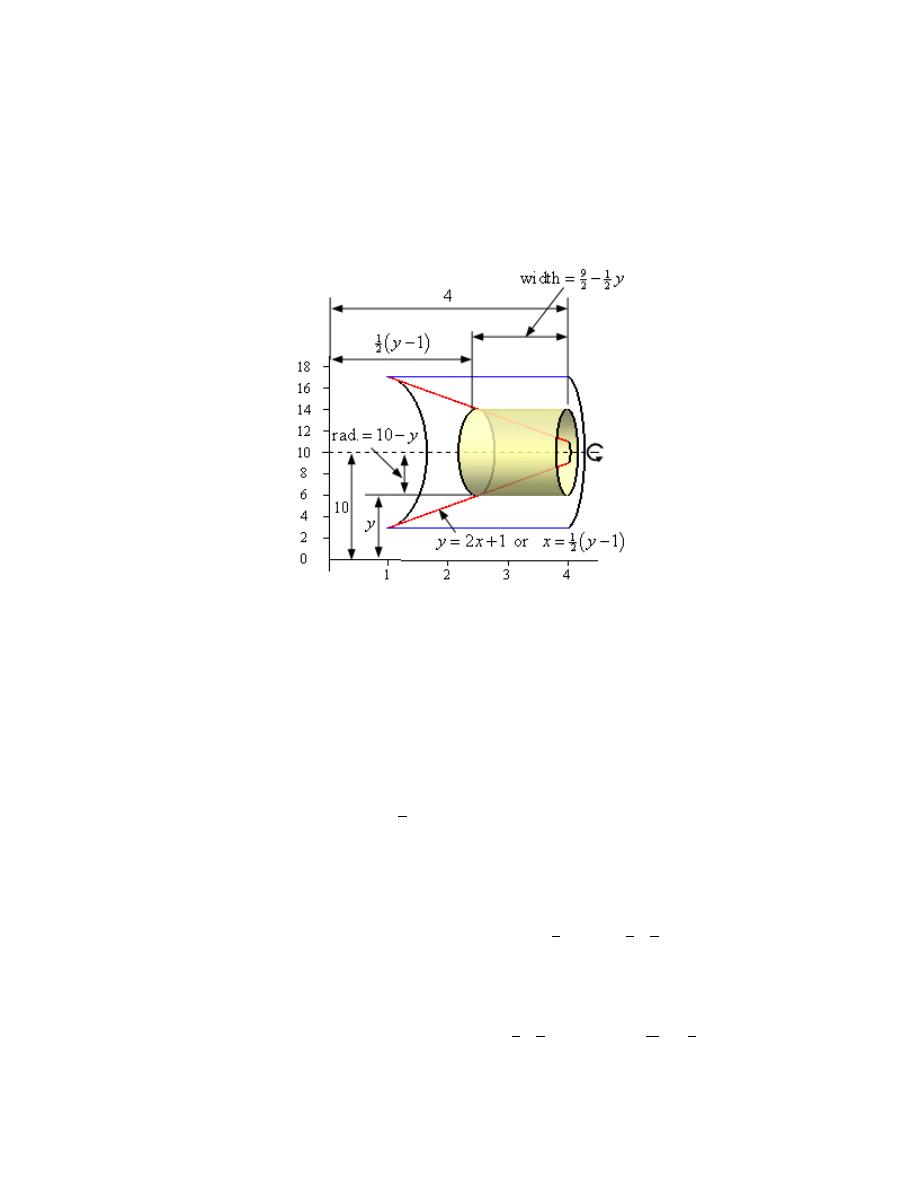
Calculus I
© 2007 Paul Dawkins
62
http://tutorial.math.lamar.edu/terms.aspx
We now need to find a formula for the area of the cylinder. Because we are using cylinders that
are centered on a horizontal axis (i.e. parallel to the x-axis) we know that the area formula will
need to be in terms of y. Therefore we’ll need to rewrite the equations of the curves in terms of y.
Here is another sketch of a representative cylinder with all of the various quantities we need put
into it.
From the sketch we can see the cylinder is centered on the line
10
y
=
and the lower edge of the
cylinder is at some y.
The radius of the cylinder is just the distance from the axis of rotation to the lower edge of the
cylinder (i.e.
10
y
−
).
The right edge of the cylinder is on the curve defining the right portion of the solid and is a
distance of 4 from the y-axis. The left edge of the cylinder is on the curve defining the left
portion of the solid and is a distance of
(
)
1
2
1
y
−
from the y-axis. The width then is the
difference of these two.
So the radius and width of the cylinder are,
(
)
9
1
1
2
2
2
Radius
10
Width
4
1
y
y
y
=
−
= −
− = −
The area of the cylinder is then,
( )
(
)(
)
(
)
(
)
(
)
2
9
19
1
1
2
2
2
2
2
Radius Height
2
10
2
45
A y
y
y
y
y
π
π
π
=
=
−
−
=
−
+
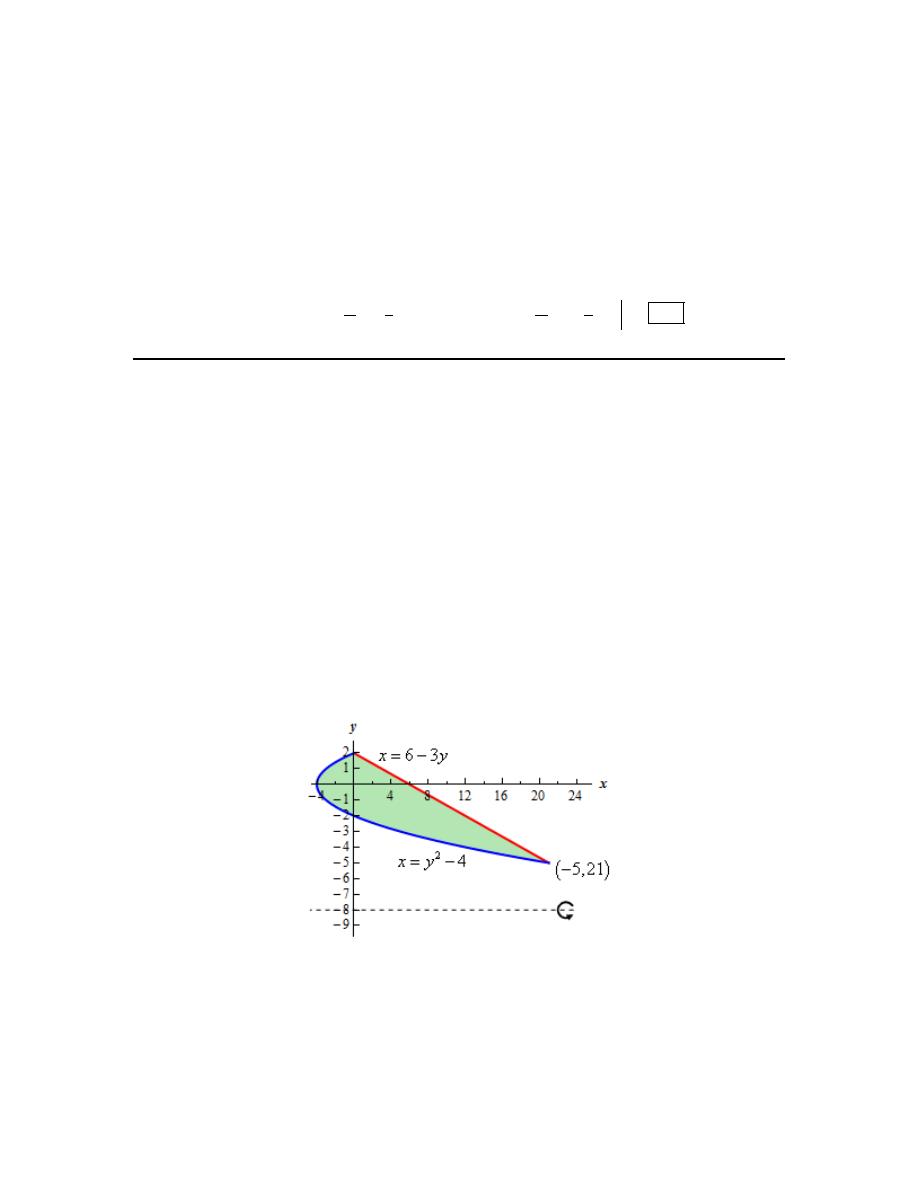
Calculus I
© 2007 Paul Dawkins
63
http://tutorial.math.lamar.edu/terms.aspx
Step 4
The final step is to then set up the integral for the volume and evaluate it.
From the graph from Step 1 we can see that the “first” cylinder in the solid would occur at
3
y
=
and the “last” cylinder would occur at
9
y
=
. Our limits are then :
3
9
y
≤ ≤
.
The volume is then,
(
)
(
)
9
9
2
2
3
19
19
1
1
2
2
4
6
3
3
2
45
2
45
90
V
y
y
dy
y
y
y
π
π
π
=
−
+
=
−
+
=
∫
6. Use the method of cylinders to determine the volume of the solid obtained by rotating the
region bounded by
2
4
x
y
=
−
and
6 3
x
y
= −
about the line
8
y
= −
.
Hint : Start with sketching the bounded region.
Step 1
We need to start the problem somewhere so let’s start “simple”.
Knowing what the bounded region looks like will definitely help for most of these types of
problems since we need to know how all the curves relate to each other when we go to set up the
area formula and we’ll need limits for the integral which the graph will often help with.
Here is a sketch of the bounded region with the axis of rotation shown.
To get the intersection points shown above, which we’ll need in a bit, all we need to do is set the
two equations equal and solve.
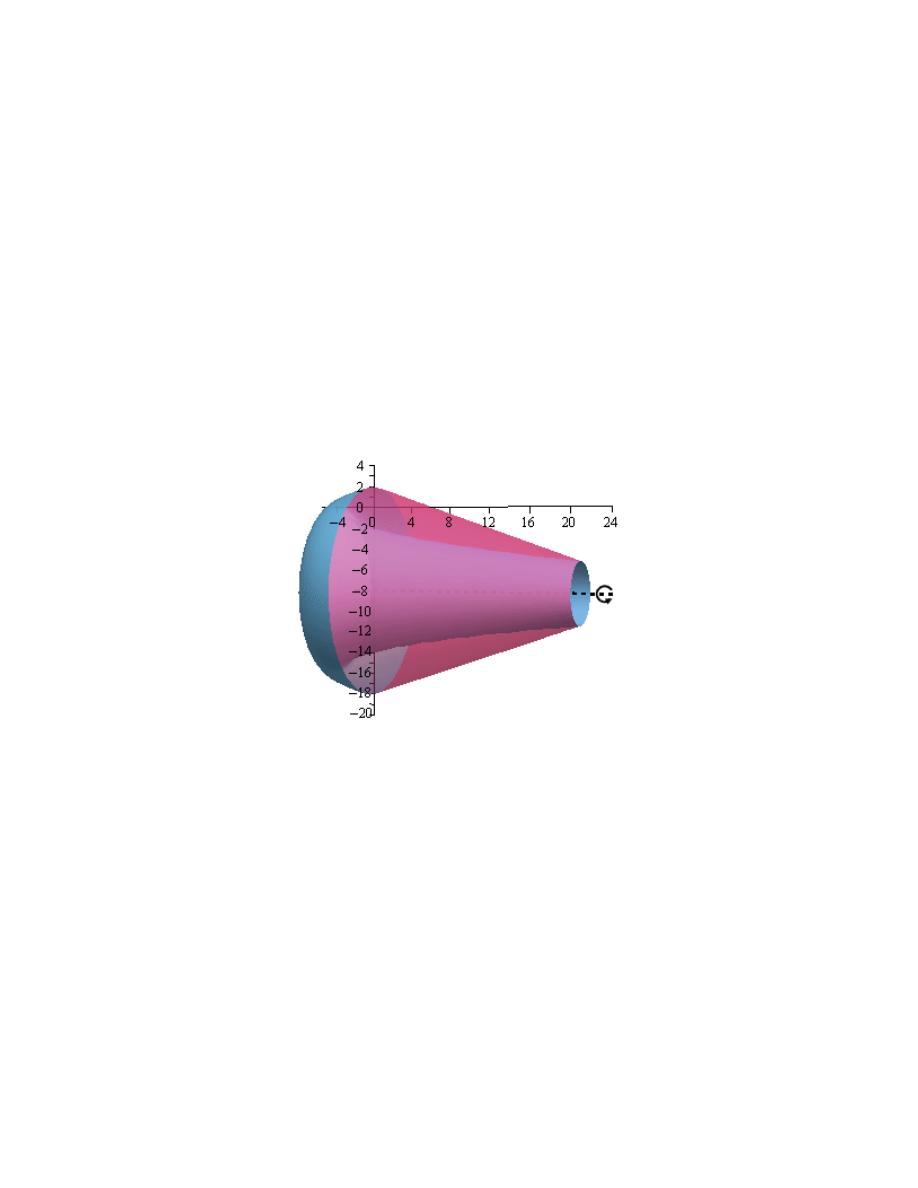
Calculus I
© 2007 Paul Dawkins
64
http://tutorial.math.lamar.edu/terms.aspx
(
)(
)
(
)
( )
2
2
4
6 3
3
10
0
5
2
0
5,
2
5, 21
&
2, 0
y
y
y
y
y
y
y
y
− = −
+
−
=
+
−
=
⇒
= −
=
⇒
−
Hint : Give a good attempt at sketching what the solid of revolution looks like and sketch in a
representative cylinder.
Note that this can be a difficult thing to do especially if you aren’t a very visual person.
However, having a representative cylinder can be of great help when we go to write down the
area formula. Also, getting the representative cylinder can be difficult without a sketch of the
solid of revolution. So, do the best you can at getting these sketches.
Step 2
Here is a sketch of the solid of revolution.
Here are a couple of sketches of a representative cylinder. The image on the left shows a
representative cylinder with the front half of the solid cut away and the image on the right shows
a representative cylinder with a “wire frame” of the back half of the solid (i.e. the curves
representing the edges of the of the back half of the solid).
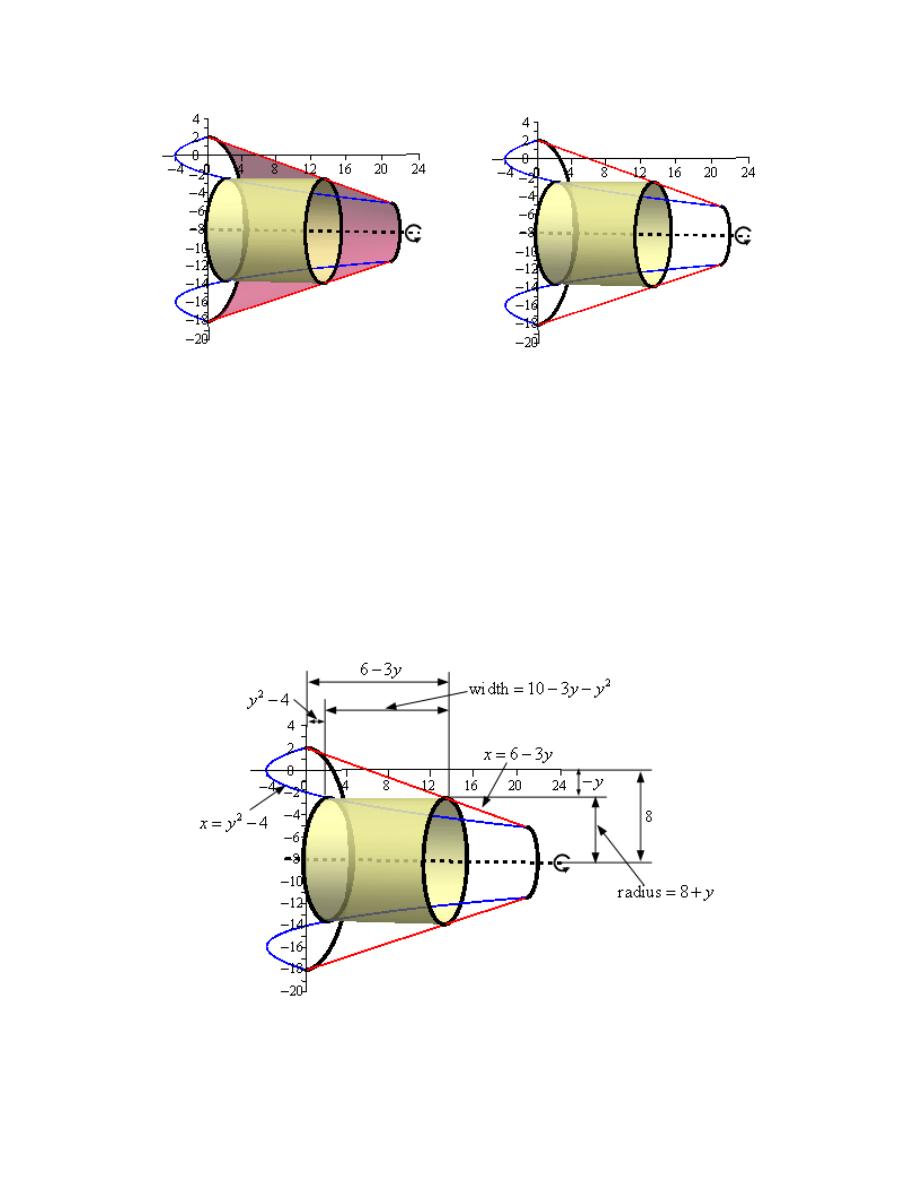
Calculus I
© 2007 Paul Dawkins
65
http://tutorial.math.lamar.edu/terms.aspx
Hint : Determine a formula for the area of the cylinder.
Step 3
We now need to find a formula for the area of the cylinder. Because we are using cylinders that
are centered on a horizontal axis (i.e. parallel to the x-axis) we know that the area formula will
need to be in terms of y. Therefore the equations of the curves will need to be in terms of y
(which in this case they already are).
Here is another sketch of a representative cylinder with all of the various quantities we need put
into it.
From the sketch we can see the cylinder is centered on the line
8
y
= −
and the upper edge of the
cylinder is at some y.

Calculus I
© 2007 Paul Dawkins
66
http://tutorial.math.lamar.edu/terms.aspx
The radius of the cylinder is a little tricky for this problem.
First, notice that the axis of rotation is a distance of 8 below the x-axis. Next, the upper edge of
the cylinder is at some y however because y is negative at the point where we drew the cylinder
that means that the distance of the upper edge below the x-axis is in fact
y
−
. The minus in
needed to turn this into a positive quantity that we need for distance. The radius for this cylinder
is then the difference of these two distances or,
( )
8
8
y
y
− − = +
Now, note that when the upper edge of the cylinder rises above the x-axis the distance of the
upper edge above the x-axis will be just y. This time because y is positive we don’t need the
minus sign (and in fact don’t want it because that would turn the distance into a negative
quantity). The radius is then the distance of the axis of rotation from the x-axis (still a distance of
8) plus by the distance of the upper edge above the x-axis (which is y) or,
8
y
+
In either case we get the same radius.
The right edge of the cylinder is on the curve defining the right portion of the solid and is a
distance of
6 3y
−
from the y-axis. The left edge of the cylinder is on the curve defining the left
portion of the solid and is a distance of
2
4
y
−
from the y-axis. The width then is the difference
of these two.
So the radius and width of the cylinder are,
(
)
2
2
Radius
8
Width
6 3
4
10 3
y
y
y
y
y
= +
= −
−
−
=
−
−
The area of the cylinder is then,
( )
(
)(
)
(
)
(
)
(
)
2
2
3
2
Radius Height
2
8
10 3
2
80 14
11
A y
y
y
y
y
y
y
π
π
π
=
=
+
−
−
=
−
−
−
Step 4
The final step is to then set up the integral for the volume and evaluate it.
From the graph from Step 1 we can see that the “first” cylinder in the solid would occur at
5
y
= −
and the “last” cylinder would occur at
2
y
=
. Our limits are then :
5
2
y
− ≤ ≤
.
The volume is then,
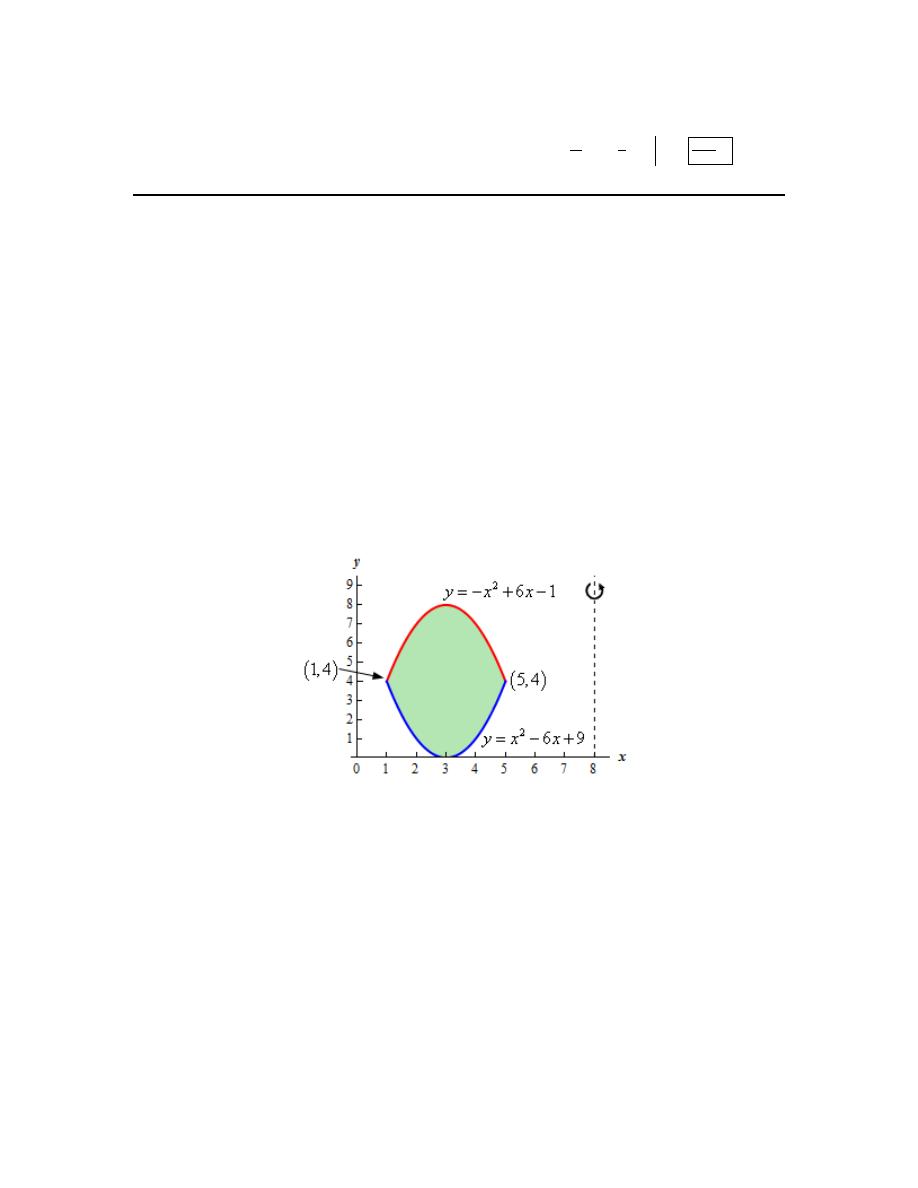
Calculus I
© 2007 Paul Dawkins
67
http://tutorial.math.lamar.edu/terms.aspx
(
)
(
)
2
2
2
3
2
3
4
4459
11
1
3
4
6
5
5
2
80 14
11
2
80
7
V
y
y
y
dy
y
y
y
y
π
π
π
−
−
=
−
−
−
=
−
−
−
=
∫
7. Use the method of cylinders to determine the volume of the solid obtained by rotating the
region bounded by
2
6
9
y
x
x
=
−
+
and
2
6
1
y
x
x
= − +
−
about the line
8
x
=
.
Hint : Start with sketching the bounded region.
Step 1
We need to start the problem somewhere so let’s start “simple”.
Knowing what the bounded region looks like will definitely help for most of these types of
problems since we need to know how all the curves relate to each other when we go to set up the
area formula and we’ll need limits for the integral which the graph will often help with.
Here is a sketch of the bounded region with the axis of rotation shown.
To get the intersection points shown above, which we’ll need in a bit, all we need to do is set the
two equations equal and solve.
(
)(
)
( )
( )
2
2
2
6
9
6
1
2
12
10
0
2
1
5
0
1,
5
1, 4
&
5, 4
x
x
x
x
x
x
x
x
x
x
−
+ = − +
−
−
+
=
−
−
=
⇒
=
=
⇒
Hint : Give a good attempt at sketching what the solid of revolution looks like and sketch in a
representative cylinder.
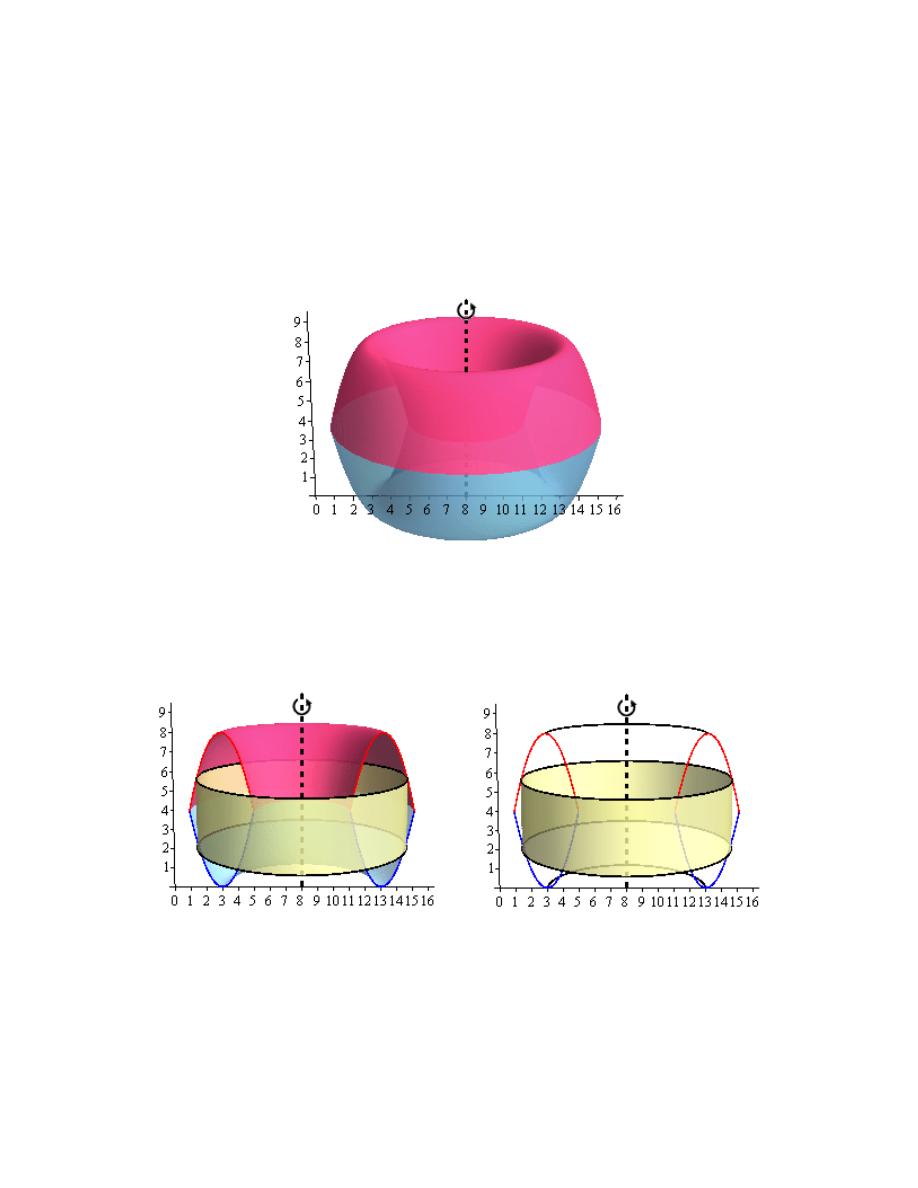
Calculus I
© 2007 Paul Dawkins
68
http://tutorial.math.lamar.edu/terms.aspx
Note that this can be a difficult thing to do especially if you aren’t a very visual person.
However, having a representative cylinder can be of great help when we go to write down the
area formula. Also, getting the representative cylinder can be difficult without a sketch of the
solid of revolution. So, do the best you can at getting these sketches.
Step 2
Here is a sketch of the solid of revolution.
Here are a couple of sketches of a representative cylinder. The image on the left shows a
representative cylinder with the front half of the solid cut away and the image on the right shows
a representative cylinder with a “wire frame” of the back half of the solid (i.e. the curves
representing the edges of the of the back half of the solid).
Hint : Determine a formula for the area of the cylinder.
Step 3
We now need to find a formula for the area of the cylinder. Because we are using cylinders that
are centered on a vertical axis (i.e. parallel to the y-axis) we know that the area formula will need
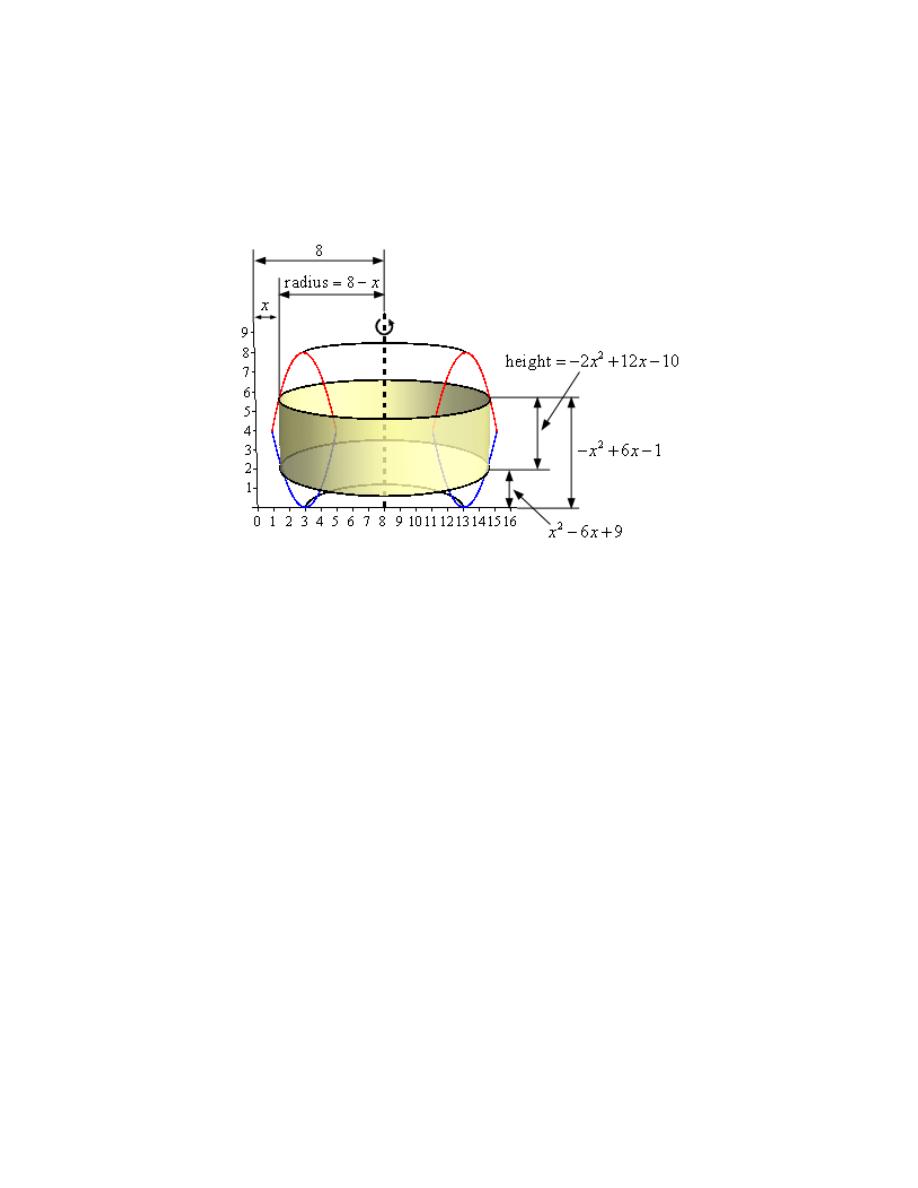
Calculus I
© 2007 Paul Dawkins
69
http://tutorial.math.lamar.edu/terms.aspx
to be in terms of x. Therefore the equations of the curves will need to be in terms of x (which in
this case they already are).
Here is another sketch of a representative cylinder with all of the various quantities we need put
into it.
Note that we put all the height “lines” on the mirrored curves and not the actual curves. This was
done so we could put them in a place that didn’t interfere with the y-axis.
From the sketch we can see the cylinder is centered on the line
8
x
=
and the left edge of the
cylinder is at some x.
The radius of the cylinder is just the distance from the axis of rotation to the left edge of the
cylinder (i.e.
8
x
−
).
The upper edge of the cylinder is on the curve defining the upper portion of the solid and is a
distance of
2
6
1
x
x
− +
−
from the x-axis. The lower edge of the cylinder is on the curve defining
the lower portion of the solid and is a distance of
2
6
9
x
x
−
+
from the x-axis. The height then is
the difference of these two.
So the radius and width of the cylinder are,
(
)
2
2
2
Radius
8
Width
6
1
6
9
2
12
10
x
x
x
x
x
x
x
= −
= − +
− −
−
+
= −
+
−
The area of the cylinder is then,
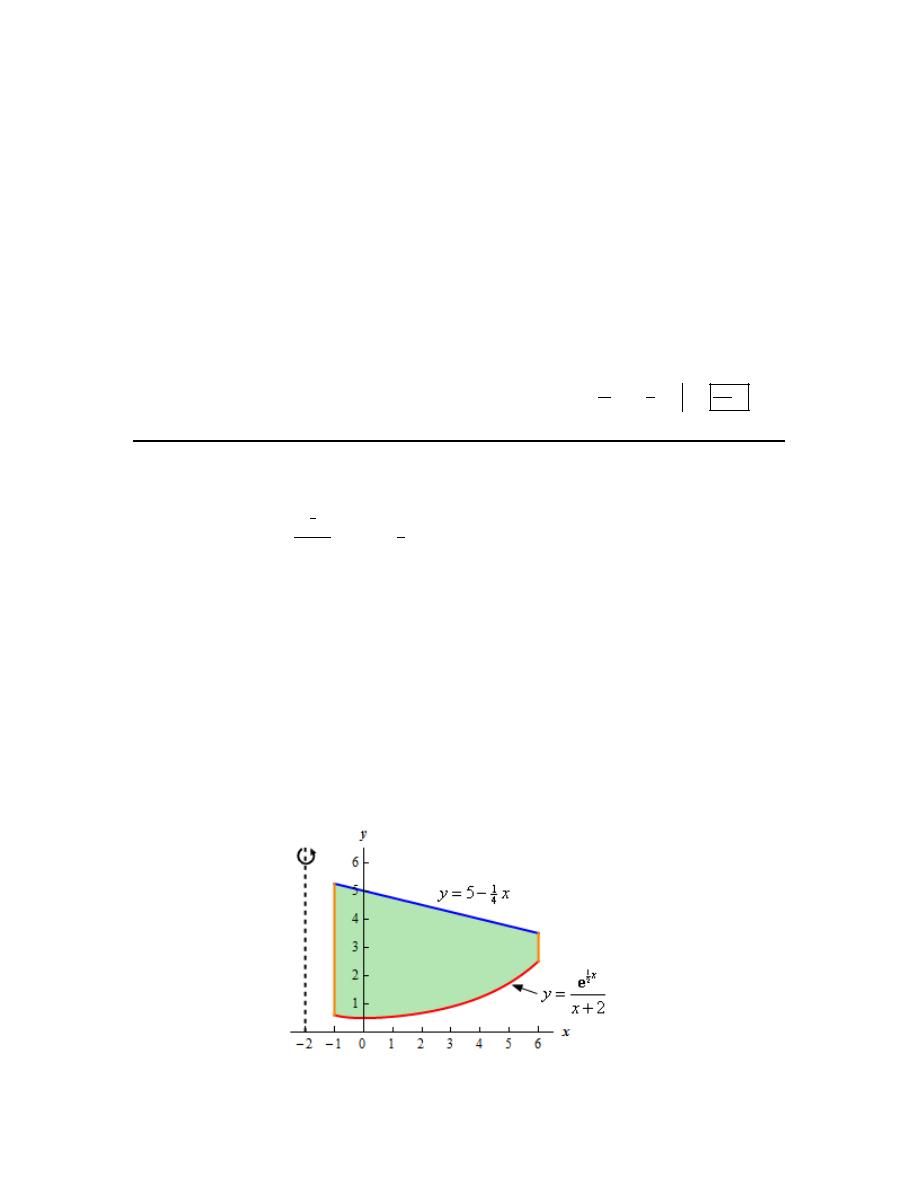
Calculus I
© 2007 Paul Dawkins
70
http://tutorial.math.lamar.edu/terms.aspx
( )
(
)(
)
(
)
(
)
(
)
2
2
3
2
Radius Height
2
8
2
12
10
2
80 106
28
2
A x
x
x
x
x
x
x
π
π
π
=
=
−
−
+
−
=
− +
−
+
Step 4
The final step is to then set up the integral for the volume and evaluate it.
From the graph from Step 1 we can see that the “first” cylinder in the solid would occur at
1
x
=
and the “last” cylinder would occur at
5
x
=
. Our limits are then :
1
5
x
≤ ≤
.
The volume is then,
(
)
(
)
5
5
2
3
2
3
4
28
640
1
3
2
3
1
1
2
80 106
28
2
2
80
53
V
x
x
x
dy
x
x
x
x
π
π
π
=
− +
−
+
=
−
+
−
+
=
∫
8. Use the method of cylinders to determine the volume of the solid obtained by rotating the
region bounded by
1
2
2
x
y
x
=
+
e
,
1
4
5
y
x
= −
,
1
x
= −
and
6
x
=
about the line
2
x
= −
.
Hint : Start with sketching the bounded region.
Step 1
We need to start the problem somewhere so let’s start “simple”.
Knowing what the bounded region looks like will definitely help for most of these types of
problems since we need to know how all the curves relate to each other when we go to set up the
area formula and we’ll need limits for the integral which the graph will often help with.
Here is a sketch of the bounded region with the axis of rotation shown.
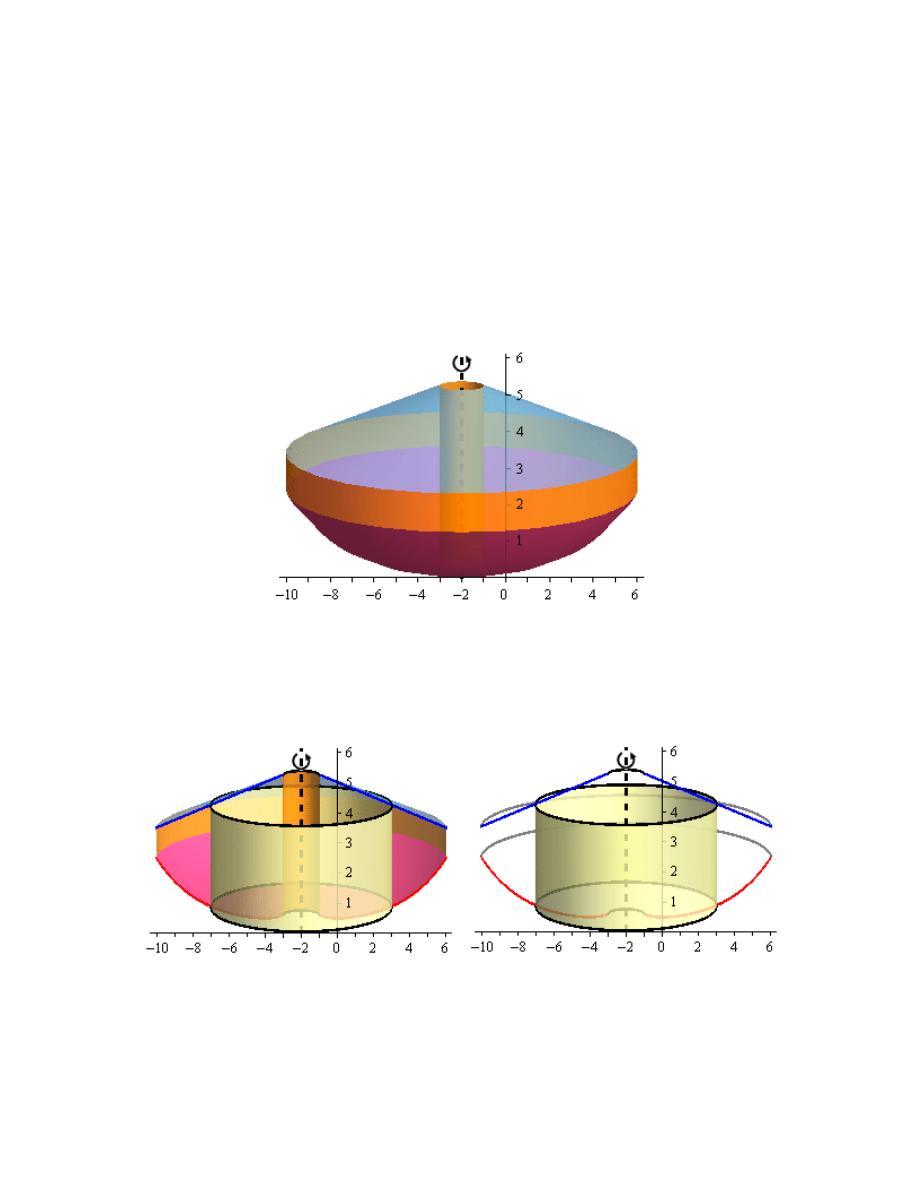
Calculus I
© 2007 Paul Dawkins
71
http://tutorial.math.lamar.edu/terms.aspx
Hint : Give a good attempt at sketching what the solid of revolution looks like and sketch in a
representative cylinder.
Note that this can be a difficult thing to do especially if you aren’t a very visual person.
However, having a representative cylinder can be of great help when we go to write down the
area formula. Also, getting the representative cylinder can be difficult without a sketch of the
solid of revolution. So, do the best you can at getting these sketches.
Step 2
Here is a sketch of the solid of revolution.
Here are a couple of sketches of a representative cylinder. The image on the left shows a
representative cylinder with the front half of the solid cut away and the image on the right shows
a representative cylinder with a “wire frame” of the back half of the solid (i.e. the curves
representing the edges of the of the back half of the solid).
Hint : Determine a formula for the area of the cylinder.
Step 3
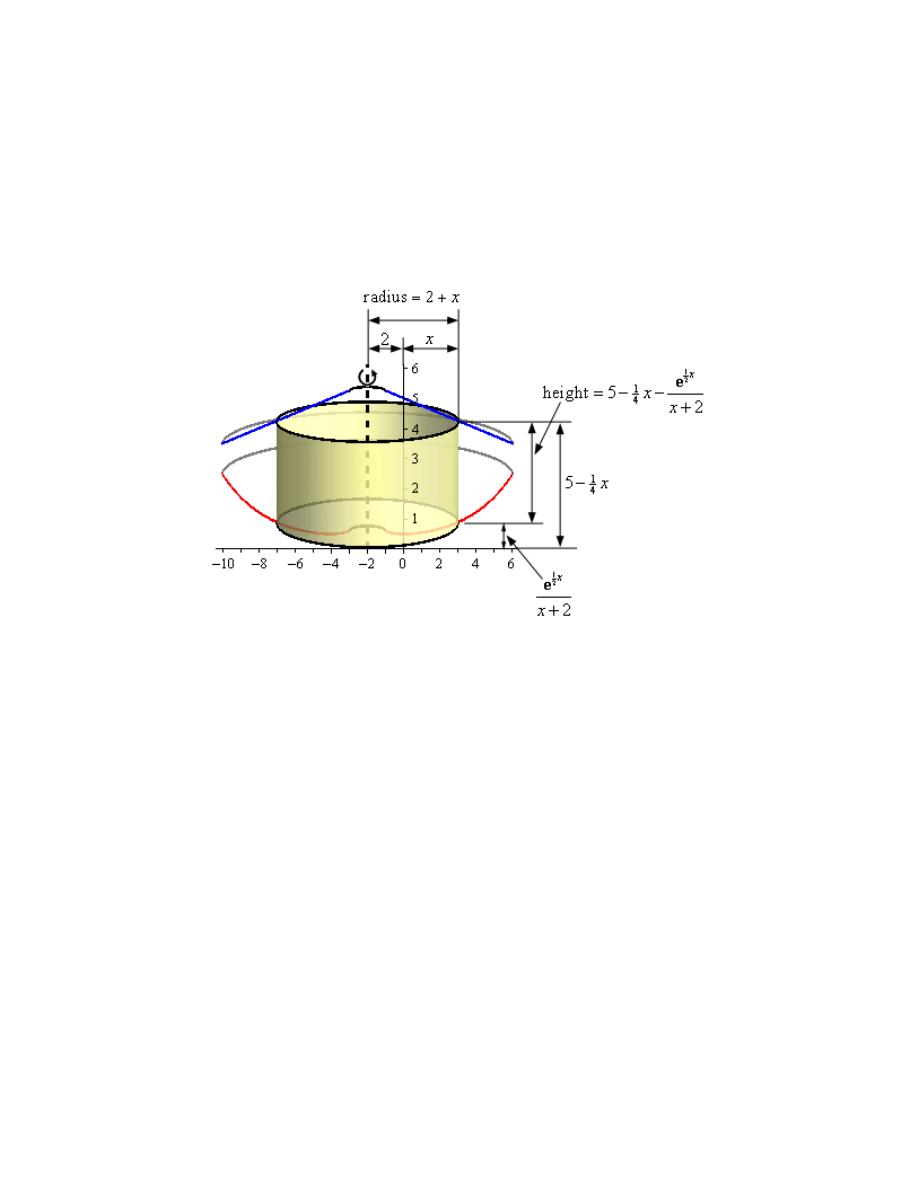
Calculus I
© 2007 Paul Dawkins
72
http://tutorial.math.lamar.edu/terms.aspx
We now need to find a formula for the area of the cylinder. Because we are using cylinders that
are centered on a vertical axis (i.e. parallel to the y-axis) we know that the area formula will need
to be in terms of x. Therefore the equations of the curves will need to be in terms of x (which in
this case they already are).
Here is another sketch of a representative cylinder with all of the various quantities we need put
into it.
From the sketch we can see the cylinder is centered on the line
2
x
= −
and the right edge of the
cylinder is at some x.
We need to be a little careful with the radius here since the right edge of the cylinder can be on
both the left and right side of the y-axis depending on where it cuts into the solid.
If the right edge of the cylinder cuts into the object to the right of the y-axis, as shown in the
sketch above, then the radius is the distance of the axis of rotation to the y-axis (a distance of 2)
plus the distance from the y-axis to the right edge of the cylinder (a distance of x). Therefore, in
this case, the radius is
2
x
+
.
On the other hand, if the right edge of the cylinder cuts into the solid to the left of the y-axis then
the radius will be the distance from the axis of rotation to the y-axis (a distance of 2) minus the
distance of the right edge of the cylinder to the y-axis. However, in this case, the value of the x
that defines the right edge is a negative value and so the distance of the right edge of the cylinder
to the y-axis must be
x
−
. The minus sign in needed to turn this into a positive quantity.
Therefore the radius in this case is
( )
2
2
x
x
− − = +
, the same as in the first case.
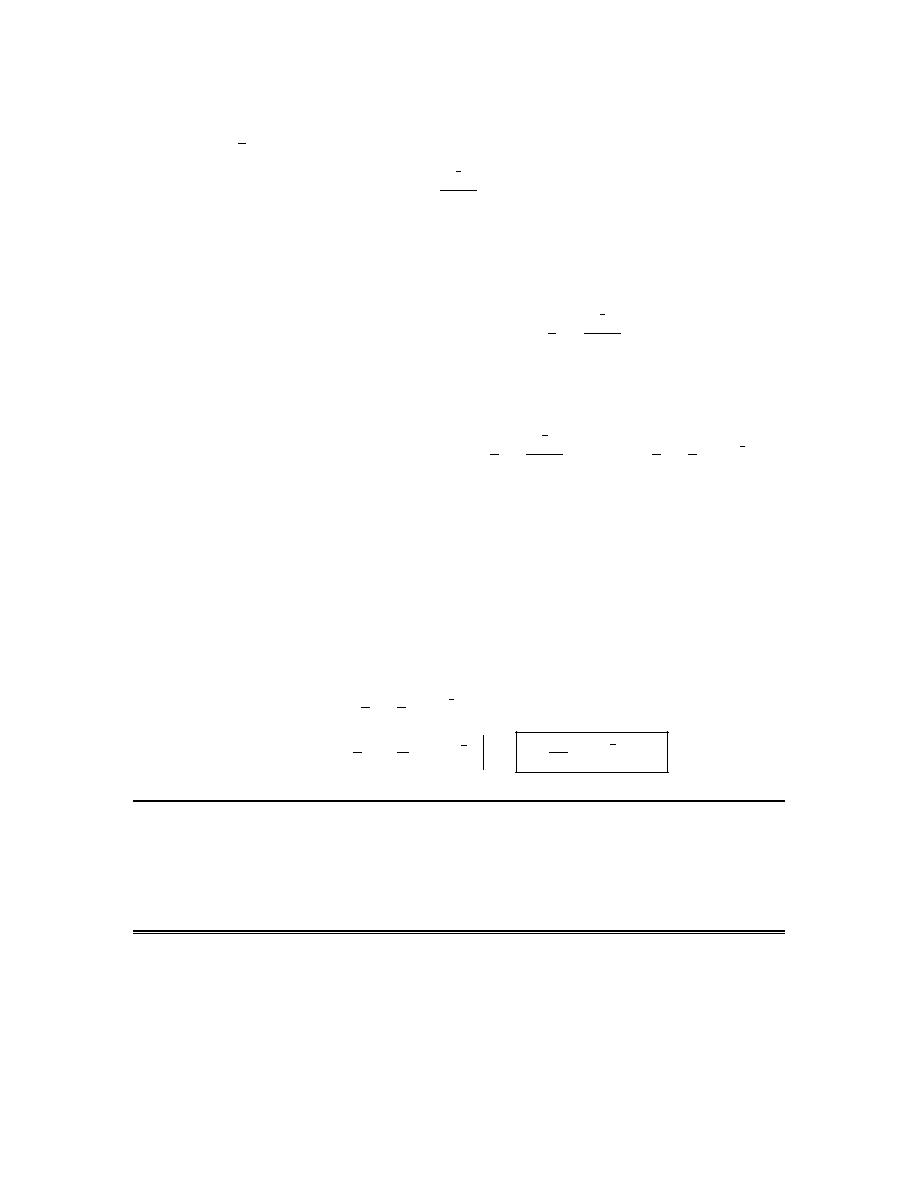
Calculus I
© 2007 Paul Dawkins
73
http://tutorial.math.lamar.edu/terms.aspx
The upper edge of the cylinder is on the curve defining the upper portion of the solid and is a
distance of
1
4
5
x
−
from the x-axis. The lower edge of the cylinder is on the curve defining the
lower portion of the solid and is a distance of
1
2
2
x
x
+
e
from the x-axis. The height then is the
difference of these two.
So the radius and width of the cylinder are,
1
2
1
4
Radius
2
Width
5
2
x
x
x
x
= +
= −
−
+
e
The area of the cylinder is then,
( )
(
)(
)
(
)
(
)
1
2
1
2
2
9
1
1
4
2
4
2
Radius Height
2
2
5
2
10
2
x
x
A x
x
x
x
x
x
π
π
π
=
=
+
−
−
=
+
−
−
+
e
e
Step 4
The final step is to then set up the integral for the volume and evaluate it.
From the graph from Step 1 we can see that the “first” cylinder in the solid would occur at
1
x
= −
and the “last” cylinder would occur at
6
x
=
. Our limits are then :
1
6
x
− ≤ ≤
.
The volume is then,
(
)
(
)
(
)
1
2
1
2
1
2
6
2
9
1
2
4
1
6
2
3
3
9
392
1
4
12
3
1
2
10
2
10
2
2
2
2
x
x
V
x
x
dy
x
x
x
π
π
π
−
−
−
=
+
−
−
=
+
−
−
=
+
−
∫
e
e
e
e
More Volume Problems
1. Find the volume of a pyramid of height h whose base is an equilateral triangle of length L.
Hint : If possible, try to get a sketch of what the pyramid looks like. These can be difficult to
sketch on occasion but if we can get a sketch it will help to set up the problem.
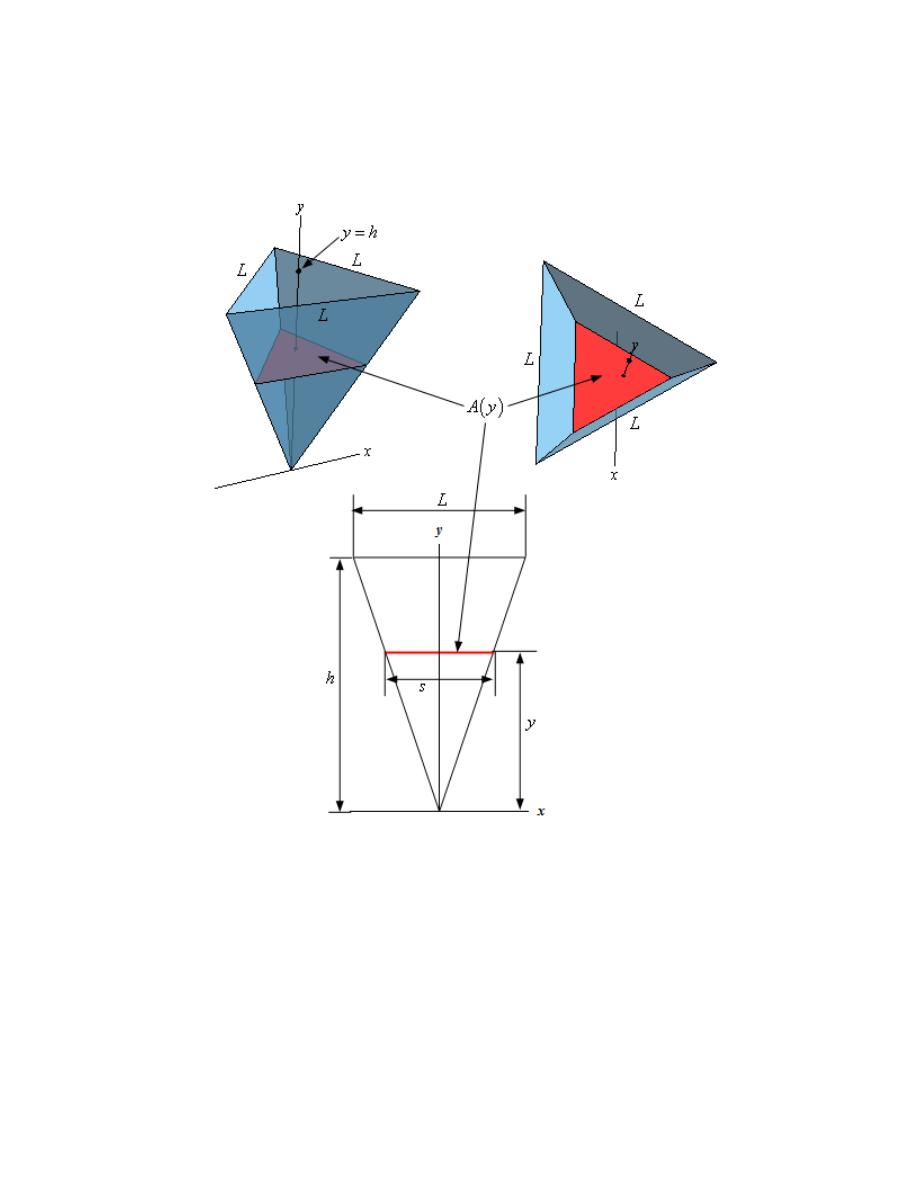
Calculus I
© 2007 Paul Dawkins
74
http://tutorial.math.lamar.edu/terms.aspx
Step 1
Okay, let’s start with a sketch of the pyramid. These can be difficult to sketch, but having the
sketch will help greatly with the set up portion of the problem.
We’ve got several sketches here. In each sketch we’ve shown a representative cross-sectional
area (shown in red). Because the cross-section can be placed at any point on the y-axis the area of
the cross-section will be a function of y as indicated in the image.
The sketch in the upper right we see the pyramid from the “front” and the sketch in the upper left
we see pyramid from the “top”. Note that we set the point of the pyramid at the origin and drew
the pyramid upwards. This was done to make the set up for the problem a little easier. Also we
sketched the pyramid so that one of the sides of the pyramid was parallel to the x-axis. This was
done only so we could draw in the bottom sketch (which we’ll get to in a second) and have the
images match up, so to speak.
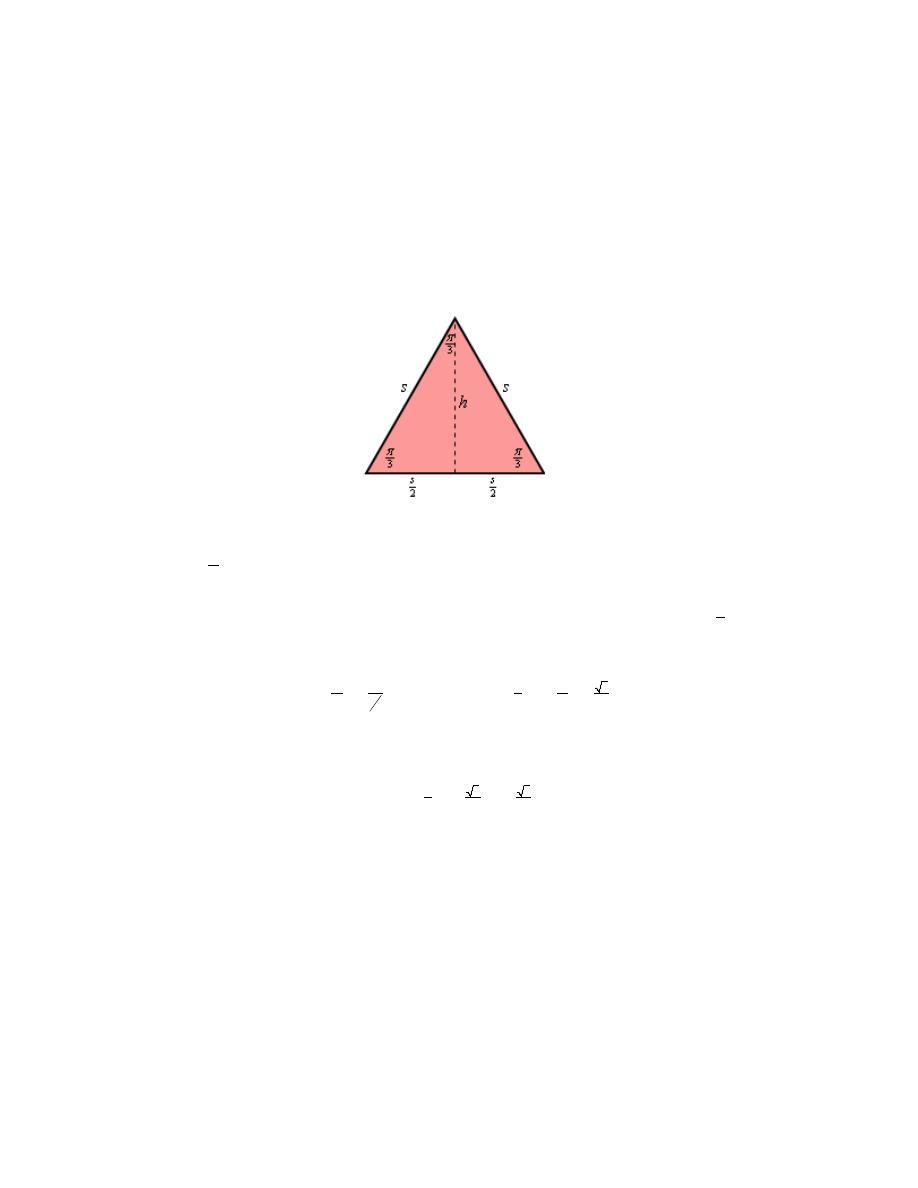
Calculus I
© 2007 Paul Dawkins
75
http://tutorial.math.lamar.edu/terms.aspx
The bottom sketch is a sketch of the side of the pyramid that is parallel to the x-axis. It also has
all of the various quantities that we’ll need shown. The representative cross-section here is
indicated by the red line on the sketch.
Hint : Determine a formula for the cross-sectional area in terms of y.
Step 2
Let’s start off with a sketch of what a typical cross-section looks like.
In this case we know that the cross-sections are equilateral triangles and so all of the interior
angles are
3
π
and we know that all the sides are the same length, let’s say s. In the sketch above
notice that since we have an equilateral triangle we know that the dashed line (representing the
height of the triangle) will divide the base of the triangle into equal length portions, i.e.
2
s
. Also
from basic right triangle trig (each “half” of the cross-section is a right triangle right?) we can see
that we can write the height in terms of s as follows,
( )
( )
3
3
2
3
2
2
tan
tan
h
s
s
h
s
π
π
=
⇒
=
=
Therefore, in terms of s the area of each cross-section is,
( )
( )
2
3
3
1
2
2
4
Area
s
s
s
=
=
Now, we know from the sketches in Step 1 that the cross-sectional area should be a function of y.
So, if we could determine a relationship between s and y we’d have what we need. Let’s revisit
one of the sketches from Step 1.
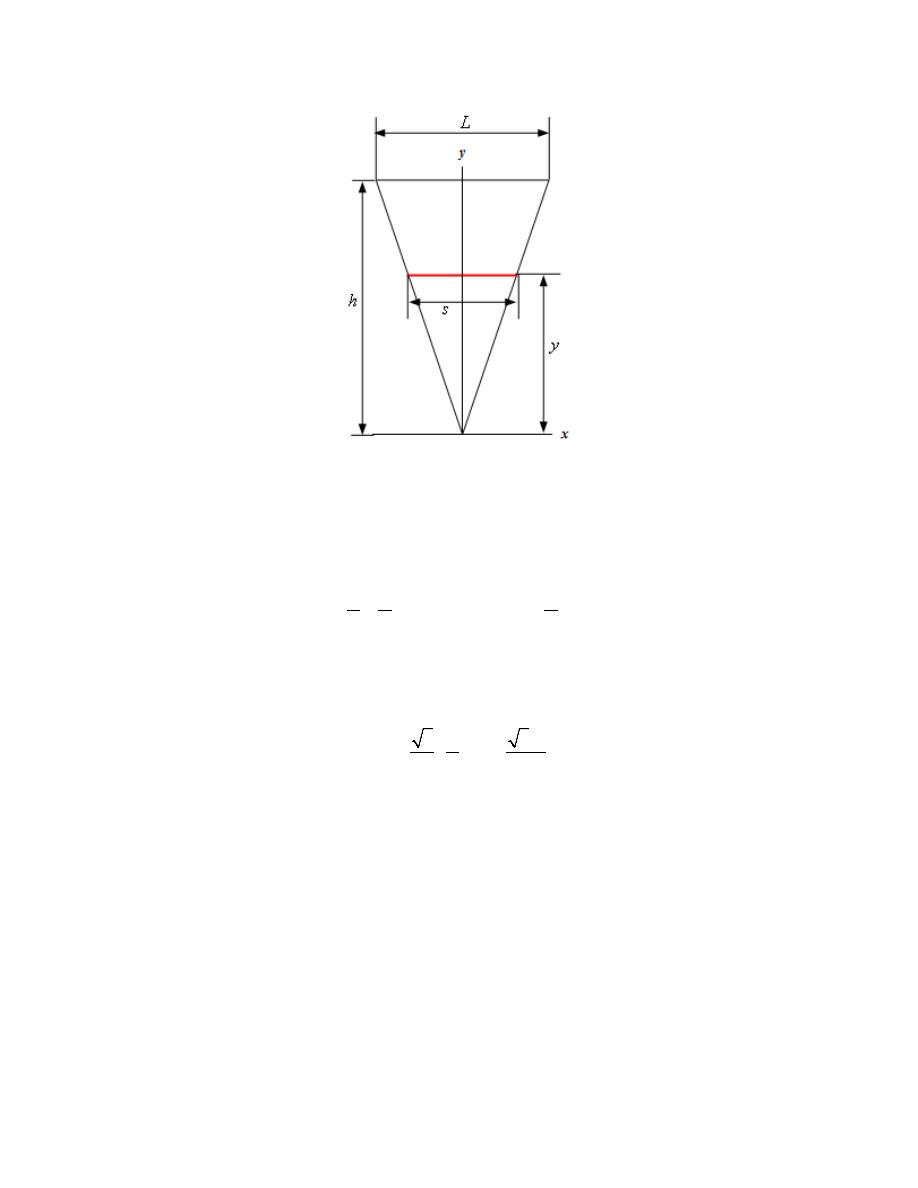
Calculus I
© 2007 Paul Dawkins
76
http://tutorial.math.lamar.edu/terms.aspx
From this we can see that we have two similar triangles. The overall side (base L and height h) as
well as the “lower” portion formed by the red line representing the cross-sectional area (base s
and height y).
Because these two triangles are similar triangles we know the following ratios must be equal.
s
L
L
s
y
y
h
h
=
⇒
=
We now have a relationship between s and y so plug this into the area formula from above to get
the area of the cross-section in terms of y.
( )
2
2
2
2
3
3
4
4
L
L
A y
y
y
h
h
=
=
Hint : All we need to do now is determine the volume itself.
Step 3
Finally we need the volume itself. We know that the volume is found by evaluating the following
integral.
( )
d
c
V
A y dy
=
∫
We already have a formula for
( )
A y
from Step 2 and from the sketches in Step 1 we can see that
the “first” cross-section will occur at
0
y
=
and that the “last” cross-section will occur at
y
h
=
and so these are the limits for the integral.
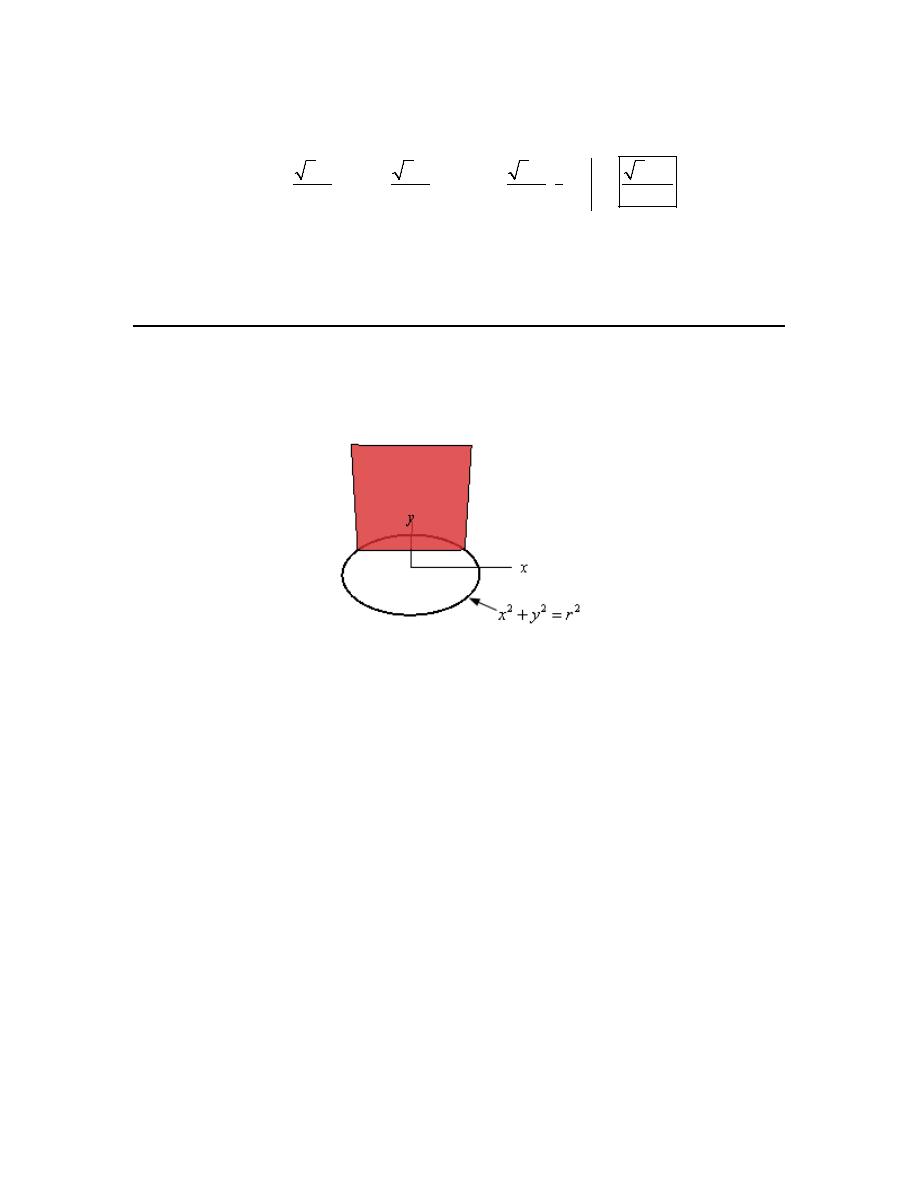
Calculus I
© 2007 Paul Dawkins
77
http://tutorial.math.lamar.edu/terms.aspx
The volume is then,
( )
2
2
2
2
2
2
3
1
3
2
2
2
0
0
0
3
3
3
3
4
4
4
12
h
h
h
L
L
L
L h
V
y dy
y dy
y
h
h
h
=
=
=
=
⌠
⌡
∫
Do not get excited about the h and L in the integral and area formula. These are just constants.
The only letter that is actually changing is y. Because the h and L are constants we can factor
them out of the integral as we did with the actual numbers.
2. Find the volume of the solid whose base is a disk of radius r and whose cross-sections are
squares. See figure below to see a sketch of the cross-sections.
Hint : While it’s not strictly needed for this problem a sketch of the solid might be interesting to
see just what the solid looks like.
Step 1
Here are a couple of sketches of the solid from three different angles. For reference the positive
x-axis and positive y-axis are shown.
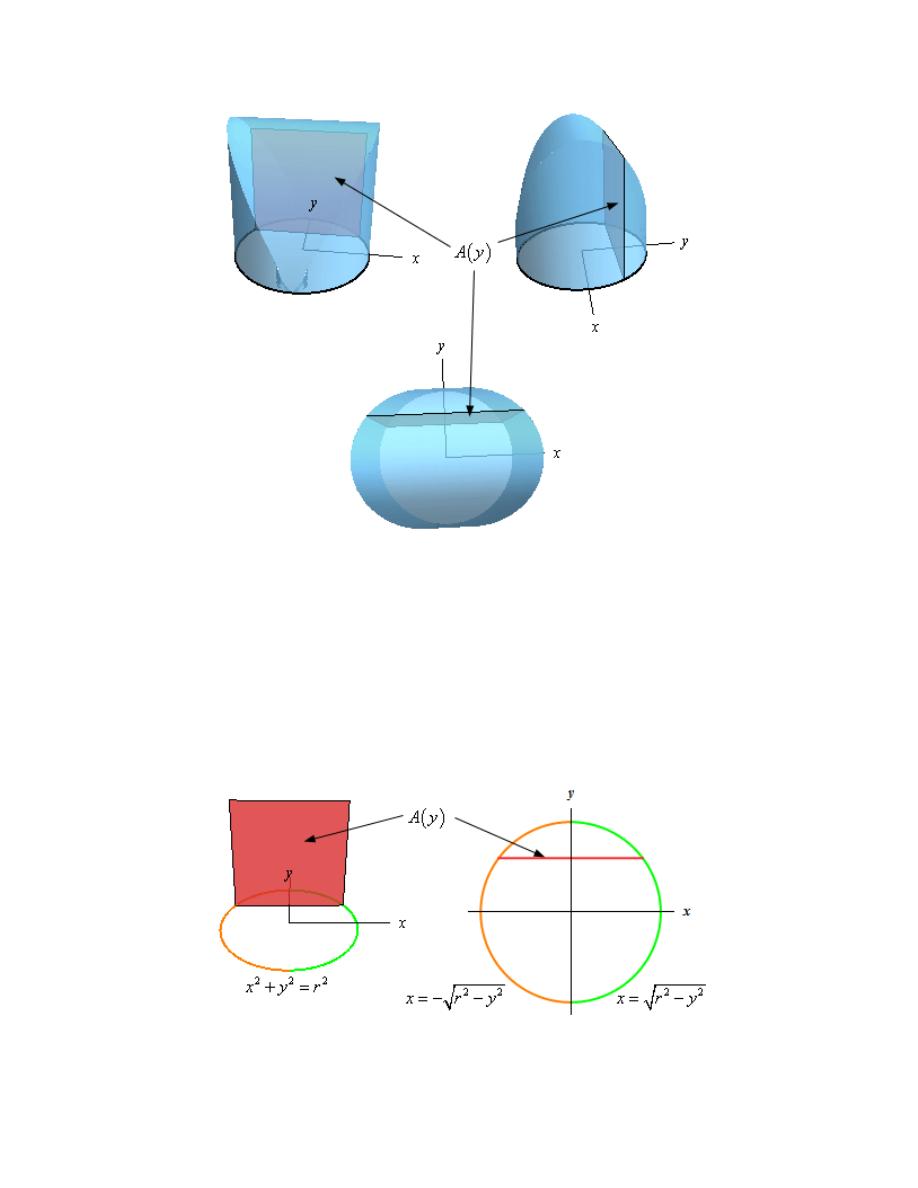
Calculus I
© 2007 Paul Dawkins
78
http://tutorial.math.lamar.edu/terms.aspx
Because the cross-section is perpendicular to the y-axis as we move the cross-section along the y-
axis we’ll change its area and so the cross-sectional area will be a function of y, i.e.
( )
A y
.
Hint : Determine a formula for the cross-sectional area in terms of y.
Step 2
While the sketches above are nice to get a feel for what the solid looks like, what we really need
is just a sketch of the cross-section. So, here’s a couple of sketches of the cross-sectional area.
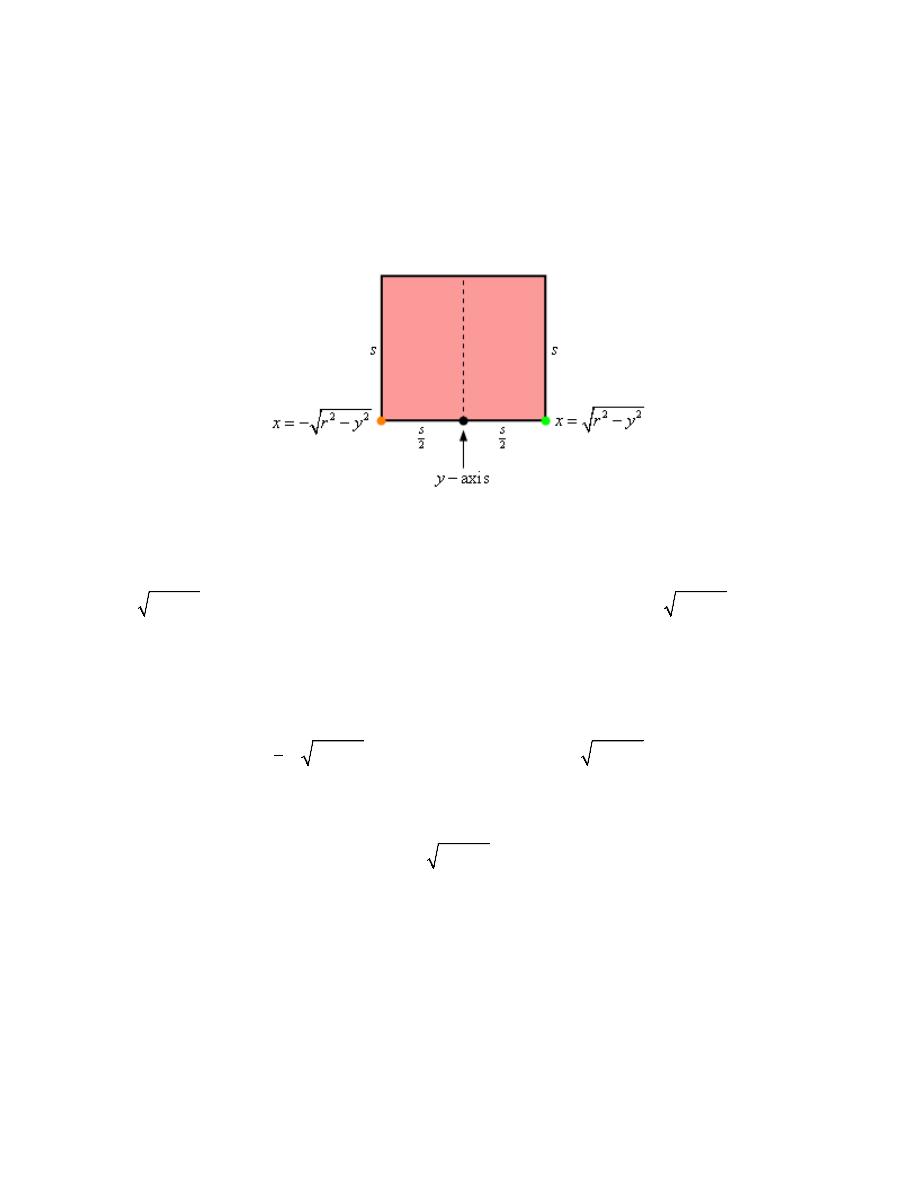
Calculus I
© 2007 Paul Dawkins
79
http://tutorial.math.lamar.edu/terms.aspx
The sketch on the left is really just the graph given in the problem statement with the only
difference that we colored the right/left sides so it will match with the sketch on the right. The
sketch on the right looks at the cross-section from directly above and is shown by the red line.
Let’s get a quick sketch of just the cross-section and let’s call the length of the side of each square
s.
Now, along the bottom we’ve denoted the y-axis location in the cross-section with a black dot and
the orange and green dots represent where the left and right portions of the circle are at. We can
also see that, assuming the cross-section is placed at some y, the green dot must be a distance of
2
2
r
y
−
from the y-axis. Likewise, the orange dot must also be a distance of
2
2
r
y
−
from
the y-axis (recall we want the distance to be positive here and so we drop the minus sign from the
function to get a positive distance).
Now, we know that the area of the square is simply
2
s
and from the discussion above we see
that,
2
2
2
2
2
2
s
r
y
s
r
y
=
−
⇒
=
−
So, a formula for the area of the cross-section in terms of y is,
( )
(
)
(
)
2
2
2
2
2
2
2
4
A y
s
r
y
r
y
=
=
−
=
−
Hint : All we need to do now is determine the volume itself.
Step 3
Finally we need the volume itself. We know that the volume is found by evaluating the following
integral.
( )
d
c
V
A y dy
=
∫
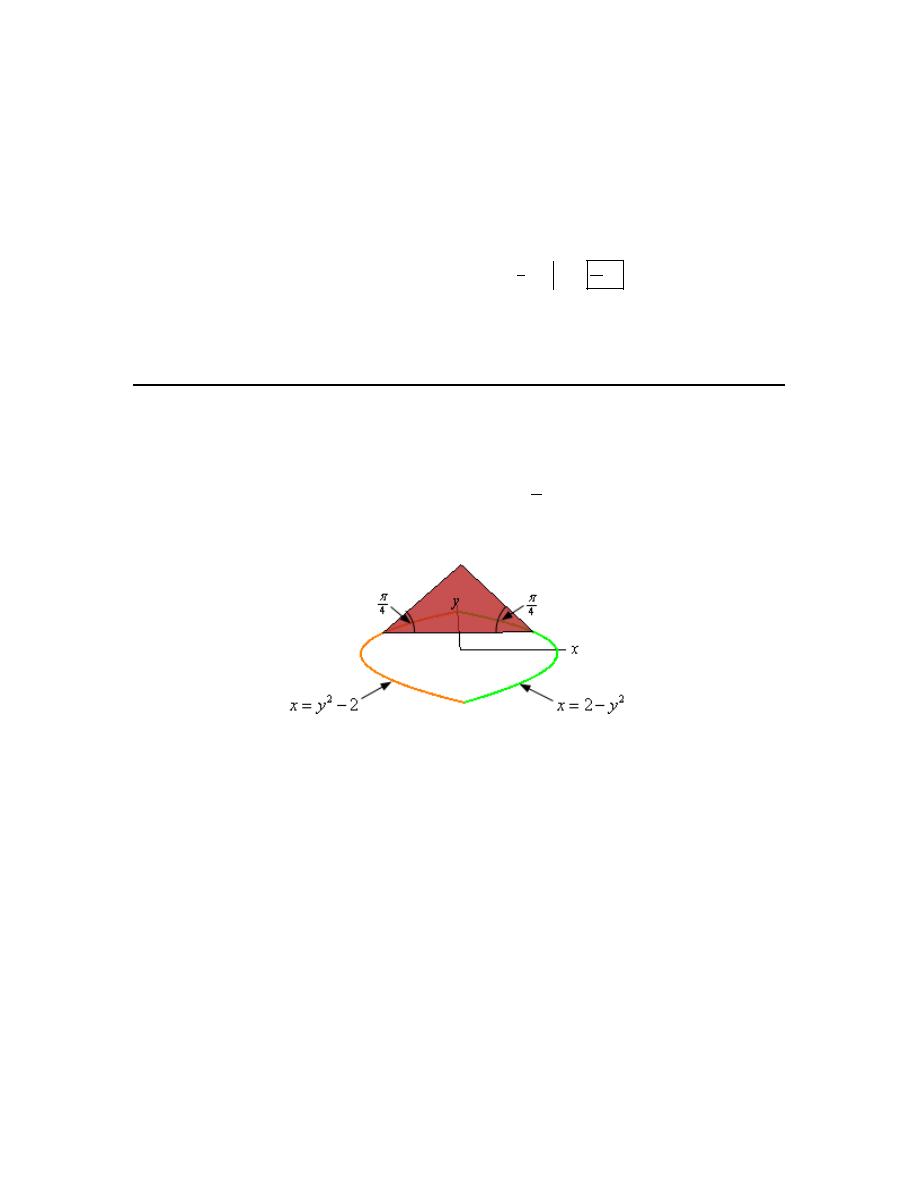
Calculus I
© 2007 Paul Dawkins
80
http://tutorial.math.lamar.edu/terms.aspx
We already have a formula for
( )
A y
from Step 2 and from the sketches in Step 1 we can see that
the “first” cross-section will occur at
y
r
= −
and that the “last” cross-section will occur at
y
r
=
and so these are the limits for the integral.
The volume is then,
(
)
(
)
2
2
2
3
3
16
1
3
3
4
4
r
r
r
r
V
r
y
dy
yr
y
r
−
−
=
−
=
−
=
∫
Do not get excited about the r integral and area formula. It is just a constant. The only letter that
is actually changing is y.
3. Find the volume of the solid whose base is the region bounded by
2
2
x
y
= −
and
2
2
x
y
=
−
and whose cross-sections are isosceles triangles with the base perpendicular to the y-axis and the
angle between the base and the two sides of equal length is
4
π
. See figure below to see a sketch
of the cross-sections.
Hint : While it’s not strictly needed for this problem a sketch of the solid might be interesting to
see just what the solid looks like.
Step 1
Here are a couple of sketches of the solid from three different angles. For reference the positive
x-axis and positive y-axis are shown.
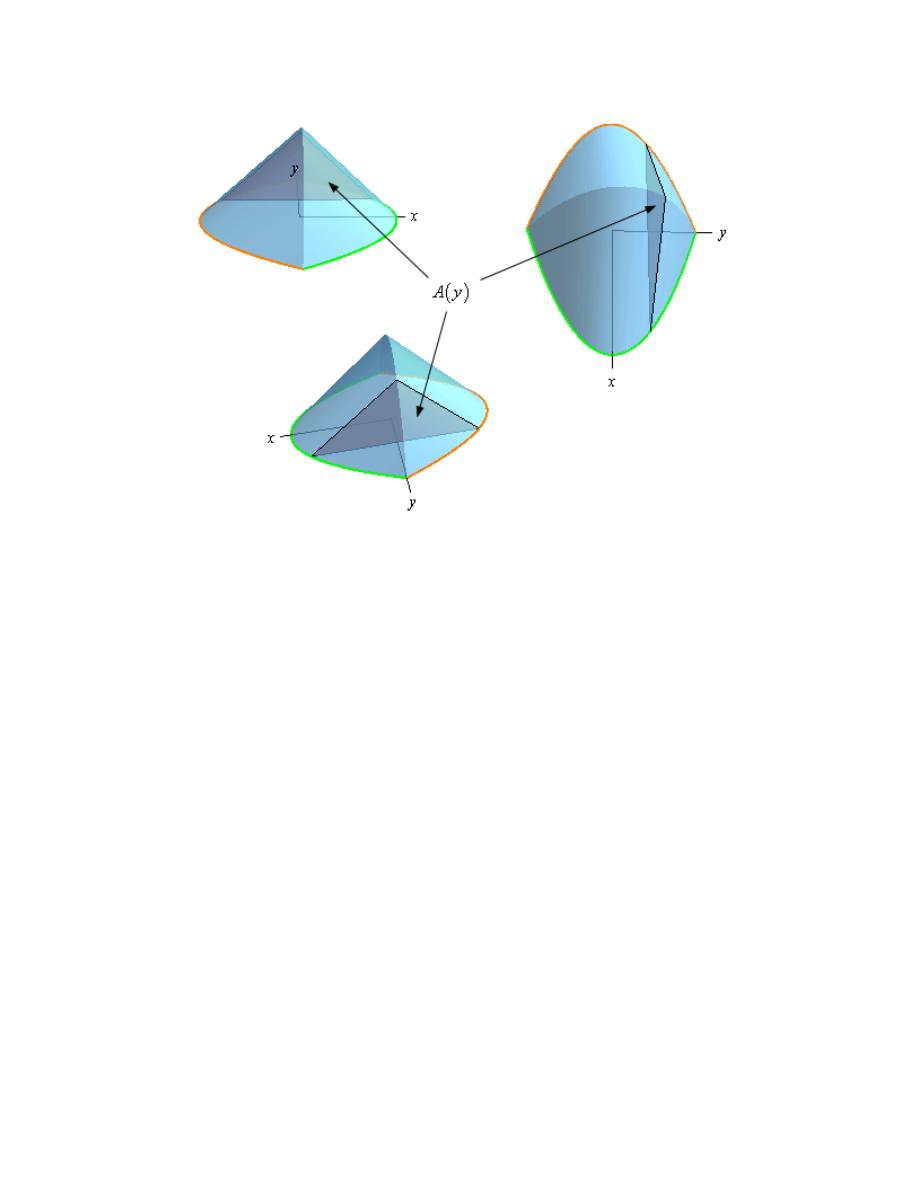
Calculus I
© 2007 Paul Dawkins
81
http://tutorial.math.lamar.edu/terms.aspx
Because the cross-section is perpendicular to the y-axis as we move the cross-section along the y-
axis we’ll change its area and so the cross-sectional area will be a function of y, i.e.
( )
A y
.
Hint : Determine a formula for the cross-sectional area in terms of y.
Step 2
While the sketches above are nice to get a feel for what the solid looks like, what we really need
is just a sketch of the cross-section. So, here’s a couple of sketches of the cross-sectional area.
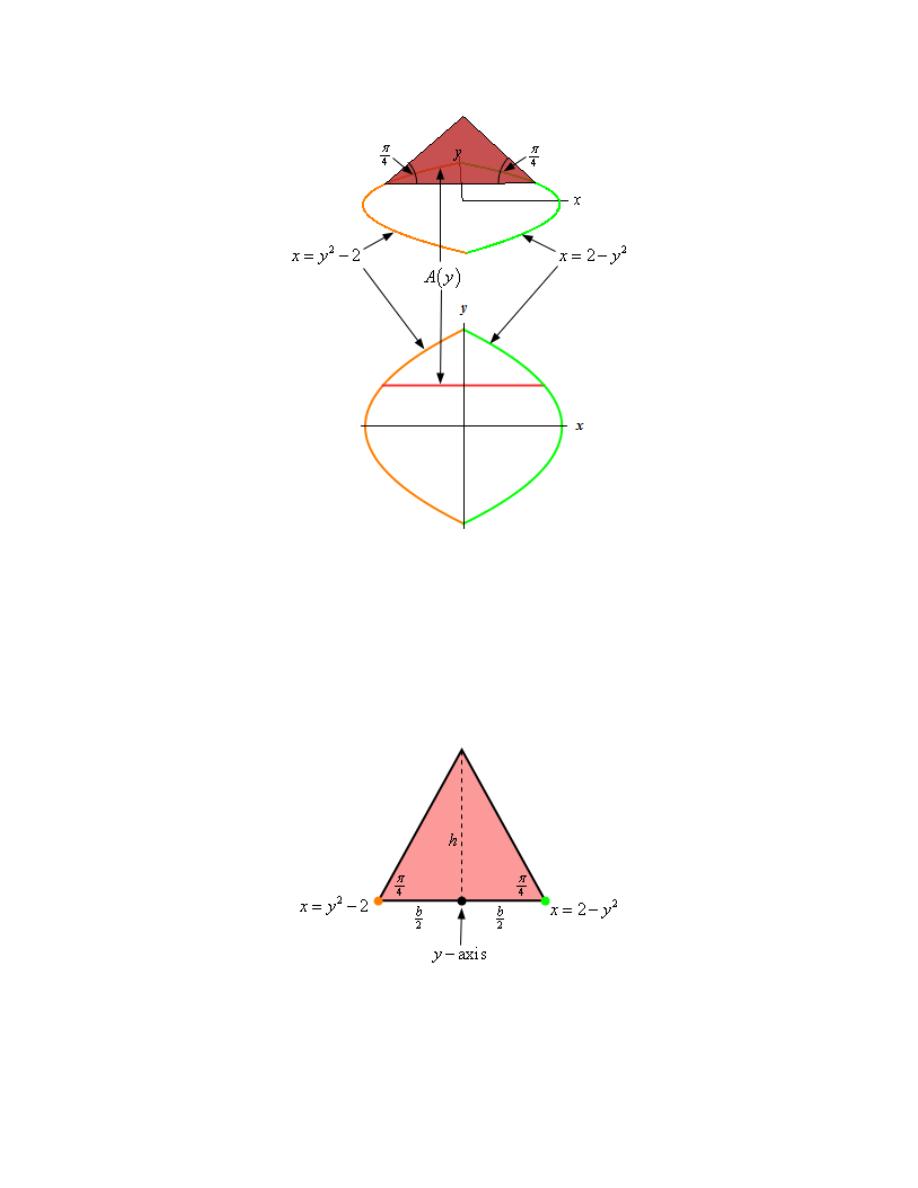
Calculus I
© 2007 Paul Dawkins
82
http://tutorial.math.lamar.edu/terms.aspx
The sketch on the top is really just the graph given in the problem statement that is included for a
reference with the sketch on the bottom. The sketch on the bottom looks at the cross-section from
directly above and is shown by the red line.
Let’s get a quick sketch of just the cross-section and let’s call the length of the base of triangle b
and the height of the triangle h.
Now, along the bottom we’ve denoted the y-axis location in the cross-section with a black dot and
the orange and green dots represent the left and right curves that define the left and right sides of
the bottom of the solid. We can also see that, assuming the cross-section is placed at some y, the
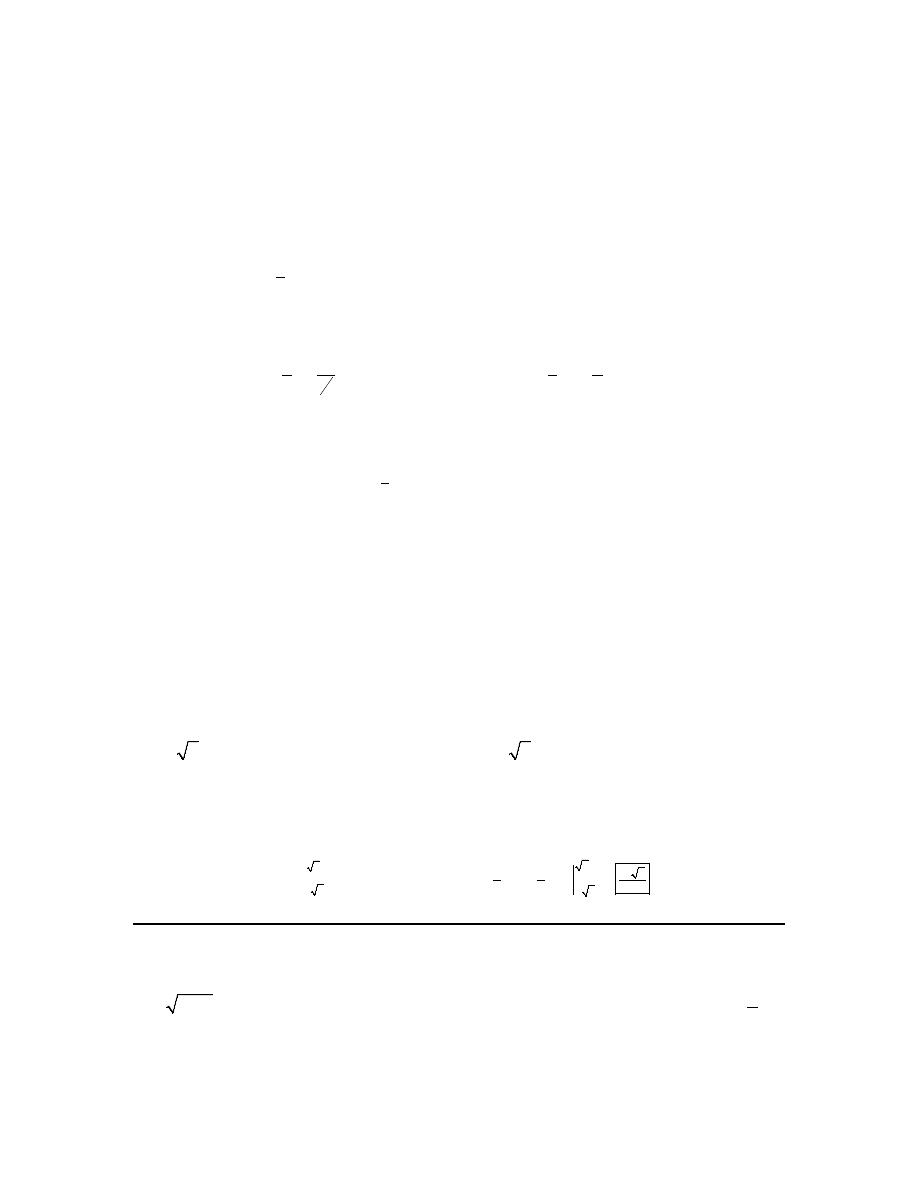
Calculus I
© 2007 Paul Dawkins
83
http://tutorial.math.lamar.edu/terms.aspx
green dot must be a distance of
2
2
y
−
from the y-axis. Likewise, the orange dot must also be a
distance of
(
)
2
2
2
2
y
y
−
−
= −
from the y-axis (recall we want the distance to be positive here
and so we add the minus sign to the function to get a positive distance).
Now, we can see that the base of the triangle is given by,
(
)
2
2
2
2
2 2
b
y
b
y
= −
⇒
=
−
Likewise, the height can be found from basic right triangle trig.
( )
( )
2
4
2
4
2
tan
tan
2
h
b
b
h
y
π
π
=
⇒
=
= −
So, a formula for the area of the cross-section in terms of y is then,
( )
(
)
2
2
2
4
1
2
2
4 4
A y
bh
y
y
y
=
=
−
= −
+
Hint : All we need to do now is determine the volume itself.
Step 3
Finally we need the volume itself. We know that the volume is found by evaluating the following
integral.
( )
d
c
V
A y dy
=
∫
By setting
0
x
=
into either of the equations defining the left and right sides of the base of the
solid (since they intersect at the y-axis) we can see that the “first” cross-section will occur at
2
y
= −
and the “last” cross-section will occur at
2
y
=
and so these are the limits for the
integral.
The volume is then,
(
)
2
2
2
4
3
5
64 2
4
1
3
5
15
2
2
4 4
4
V
y
y dy
y
y
y
−
−
=
−
+
=
−
+
=
∫
4. Find the volume of a wedge cut out of a “cylinder” whose base is the region bounded by
4
y
x
=
−
,
4
x
= −
and the x-axis. The angle between the top and bottom of the wedge is
3
π
.
See the figure below for a sketch of the “cylinder” and the wedge (the positive x-axis and positive
y-axis are shown in the sketch – they are just in a different orientation).
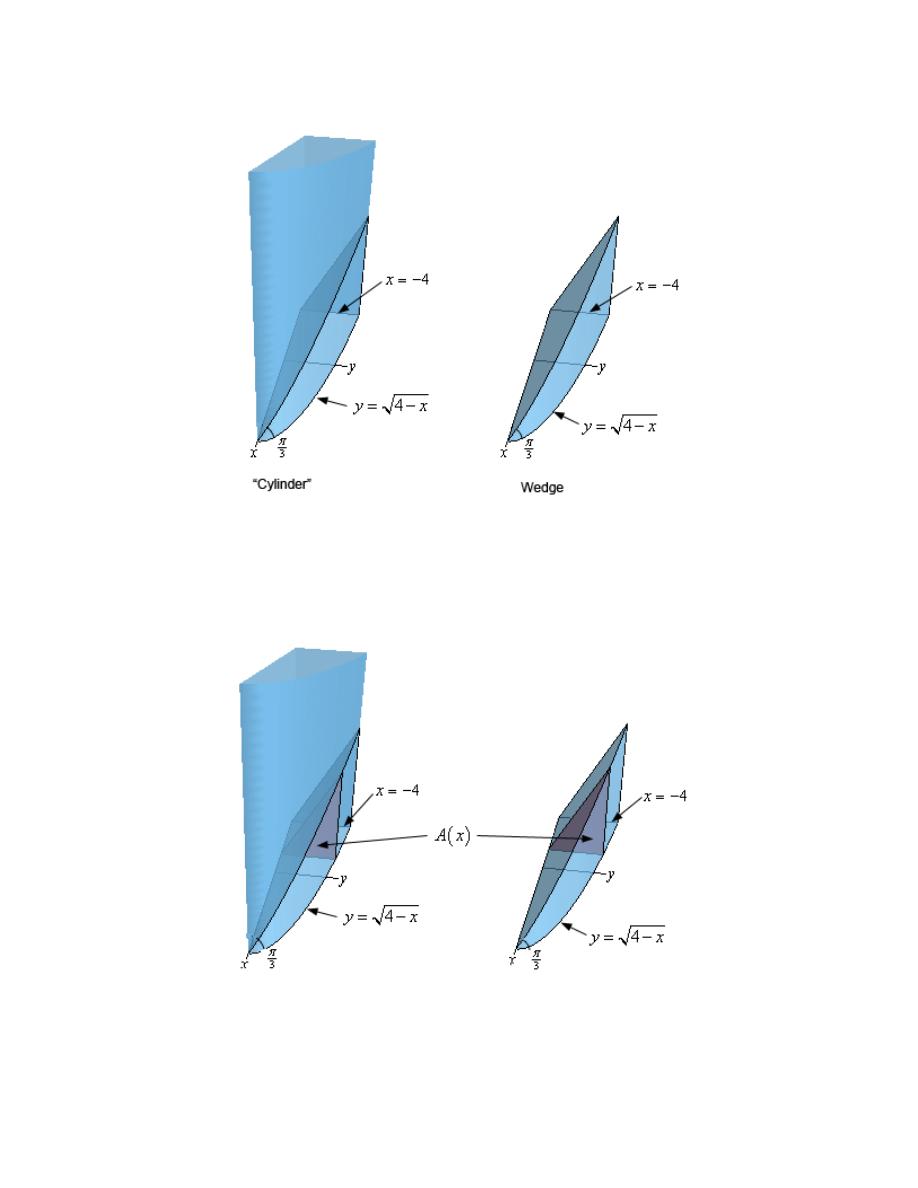
Calculus I
© 2007 Paul Dawkins
84
http://tutorial.math.lamar.edu/terms.aspx
Step 1
While not strictly needed let’s redo the sketch of the “cylinder” and wedge from the problem
statement only this time let’s also sketch in what the cross-section will look like.
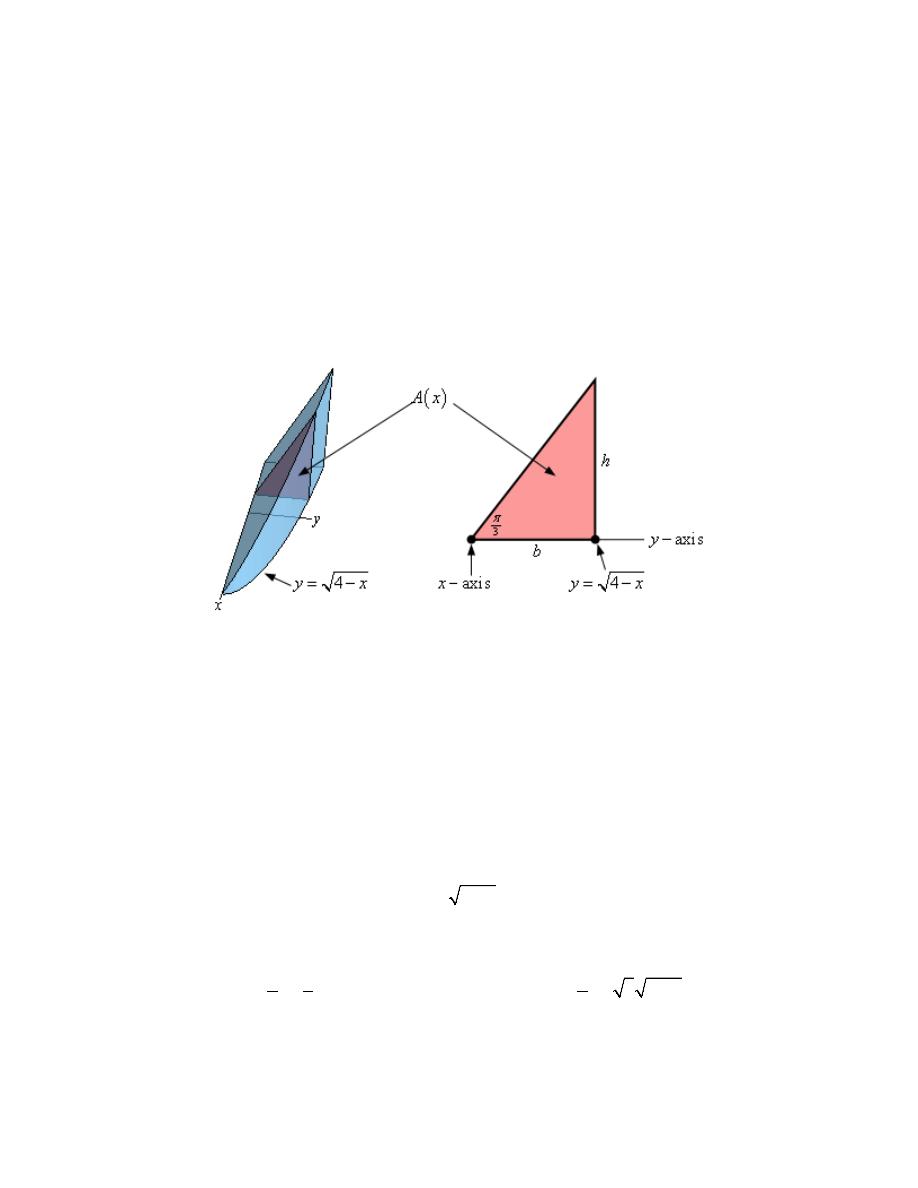
Calculus I
© 2007 Paul Dawkins
85
http://tutorial.math.lamar.edu/terms.aspx
Because the cross-section is perpendicular to the x-axis as we move the cross-section along the x-
axis we’ll change its area and so the cross-sectional area will be a function of x, i.e.
( )
A x
. Also
note that as shown in the sketches the cross-section will be a right triangle.
Hint : Determine a formula for the cross-sectional area in terms of x.
Step 2
While the sketches above are nice to get a feel for what the solid and cross-sections look like,
what we really need is just a sketch of just the cross-section. So, here are a couple of sketches of
the cross-sectional area.
The sketch on the left is just pretty much the sketch we’ve seen before and is included to give us a
reference point for the actual cross-section that is shown on the right.
As noted in the sketch on the right we’ll call the base of the triangle b and the height of the
triangle h. Also, the dot on the left side of the base represents where the x-axis is on the cross-
section and the dot on the right side of the base represents the curve that defines the edge of the
solid (and hence the wedge).
From this sketch it should then be pretty clear that the length of the base is simply the distance
from the x-axis to the curve or,
4
b
x
=
−
Likewise, the height can be found from basic right triangle trig.
( )
( )
3
3
tan
tan
3 4
h
b
h
b
x
π
π
=
⇒
=
=
−
So, a formula for the area of the cross-section in terms of x is then,
Calculus I
© 2007 Paul Dawkins
86
http://tutorial.math.lamar.edu/terms.aspx
( )
(
)
(
)
2
3
3
1
2
2
2
4
4
A y
bh
x
x
=
=
−
=
−
Hint : All we need to do now is determine the volume itself.
Step 3
Finally we need the volume itself. We know that the volume is found by evaluating the following
integral.
( )
b
a
V
A x dx
=
∫
From the sketches in the problem statement or from Step 1 we can see that the “first” cross-
section will occur at
4
x
= −
(the back end of the “cylinder”) and the “last” cross-section will
occur at
4
x
=
(the front end of the “cylinder” where the curve intersects with the x-axis. These
are then the limits for the integral.
The volume is then,
(
)
(
)
4
4
2
3
3
1
2
2
2
4
4
4
4
16 3
V
x dx
x
x
−
−
=
−
=
−
=
∫
Work
1. A force of
( )
( )
2
cos 3
2
F x
x
x
=
−
+
, x is in meters, acts on an object. What is the work
required to move the object from
3
x
=
to
7
x
=
?
Solution
There really isn’t all that much to this problem. We are given the force function and limits for the
integral (
3
x
=
and
7
x
=
) and so all we need to do is write down the integral for the work and
evaluate it.
( )
( )
(
)
( )
( )
(
)
7
2
3
7
3
1
1
1
3
3
3
3
cos 3
2
sin 3
2
340 sin 9
sin 21
113.1918
W
x
x
dx
x
x
x
=
−
+
=
−
+
=
+
−
=
∫
Calculus I
© 2007 Paul Dawkins
87
http://tutorial.math.lamar.edu/terms.aspx
2. A spring has a natural length of 18 inches and a force of 20 lbs is required to stretch and hold
the spring to a length of 24 inches. What is the work required to stretch the spring from a length
of 21 inches to a length of 26 inches?
Hint : What is the spring constant, k and the force function?
Step 1
Let’s start off by finding the spring constant. We are told that a force of 20 lbs is needed to
stretch the spring 24 in – 18 in = 6 in = 0.5 ft from its natural length. Then using Hooke’s Law
we have,
( )
20
0.5
40
k
k
=
⇒
=
Don’t forget that we want the displacement in feet. Also don’t forget that the displacement needs
to be the displacement from the natural length of the spring.
Again, using Hooke’s Law we can see that the force function is,
( )
40
F x
x
=
Step 2
For the limits of the integral we can see that we start with the spring at a length of 21 in – 18 in =
3 in or
1
4
feet and we end with a length of 26 in – 18 in = 8 in or
2
3
feet. These are then the limits
of the integral (recall that we need the relative distance from the natural length for the limits).
The work is then,
2
2
3
3
1
1
4
4
2
275
36
40
20
7.6389 ft-lbs
W
x dx
x
=
=
=
=
∫
3. A cable that weighs ½ kg/meter is lifting a load of 150 kg that is initially at the bottom of a 50
meter shaft. How much work is required to lift the load ¼ of the way up the shaft?
Hint : What is the total mass of the chain and load at any point in the shaft? How does that relate
to the force required to hold the chain and load at any point in the shaft?
Step 1
Let’s start off with the convention that
0
x
=
defines the bottom of the shaft and
50
x
=
defines
the top of the shaft. Therefore, x represents the distance that the load has been lifted. After lifting
the load by x meters there will be
50
x
−
meters of the chain left in the shaft that needs to be
lifted along with the load.
Calculus I
© 2007 Paul Dawkins
88
http://tutorial.math.lamar.edu/terms.aspx
Therefore, after lifting the load x meters, the total mass of the chain left in the shaft as well as the
load is,
(
)
1
1
2
2
50
150 kg
175
kg
x
x
− +
=
−
We know that the force required to hold the chain and load at any point is just the total weight of
the chain and load at that point. We also know that (because we are in the metric system) the
weight of a given mass (in kg) is just then,
Weight
mass 9.8
=
×
where 9.8 is the gravitational acceleration.
The force required to hold the chain and load a distance of x meters above the bottom is then,
( ) ( )
(
)
1
2
9.8 175
1715 4.9
F x
x
x
=
−
=
−
Step 2
For the limits of the integral we can see that we start with the chain and load at the bottom of the
shaft (i.e. at
0
x
=
) and stop ¼ of the way up the shaft (i.e. at
12.5
x
=
). These values are then
the limits for the integral.
The work is then,
(
)
12.5
12.5
2
0
0
1715 4.9
1715
2.45
21, 054.6875
W
x dx
x
x
J
=
−
=
−
=
∫
4. A tank of water is 15 feet long and has a cross section in the shape of an equilateral triangle
with sides 2 feet long (point of the triangle points directly down). The tank is filled with water to
a depth of 9 inches. Determine the amount of work needed to pump all of the water to the top of
the tank. Assume that the density of water is 62 lb/ft
3
.
Hint : Get the basic problem set up. Determine all the known information and what you will need
in order to work the problem. A sketch of at least the cross-section of the tank would probably be
useful as well.
Use the last example from this section as a general guide for this problem if you are having
trouble. This problem will work in pretty much the same manner, although there will be some
differences due to the obvious change in tank shape as well as the fact that we are using not using
the Metric system for this problem.
Step 1
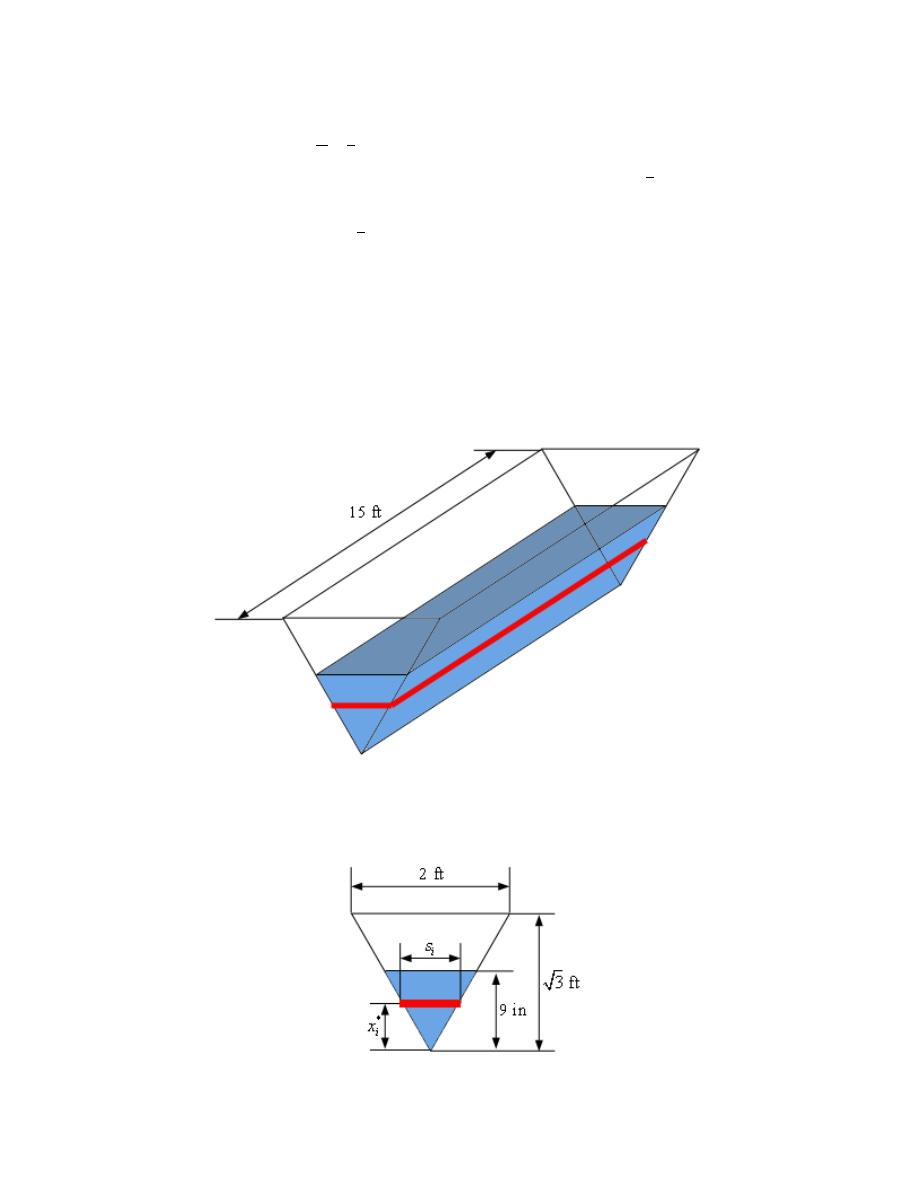
Calculus I
© 2007 Paul Dawkins
89
http://tutorial.math.lamar.edu/terms.aspx
Okay, let’s start off and define
0
x
=
to be the bottom point of the tank and the height of the
water in the tank to be
9
3
12
4
x
= =
feet (because all the other quantities are in feet we converted
this into feet as well). This means that we will be working in the interval
3
4
0,
for this problem.
We’ll next divide the interval
3
4
0,
into n subintervals each of width
x
∆
and we’ll let
*
i
x
be any
point in the i
th
subinterval where
1, 2,
,
n
n
=
. For each subinterval we can approximate the
water in the tank corresponding to that subinterval as a box with length 15 ft, width
*
i
s
and height
x
∆
.
Here is a quick sketch of the tank. The red strip represents the box we are using to approximate
the water in the tank in the i
th
subinterval.
The sketch of the tank is nice and while it does help us to visualize the tank what we really need
is a sketch of the tank from directly in front (i.e. a typical vertical equilateral triangular
cross-section for the tank). Here is that sketch.
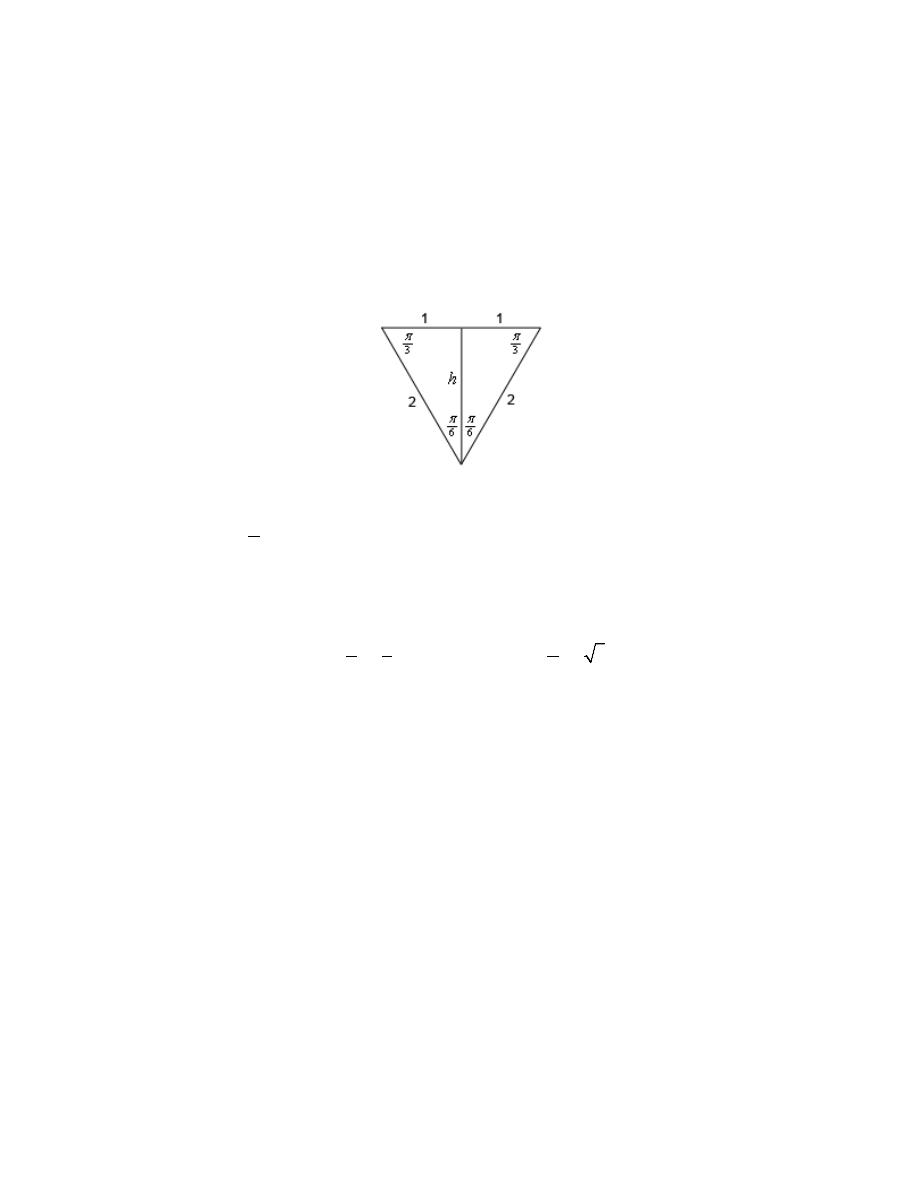
Calculus I
© 2007 Paul Dawkins
90
http://tutorial.math.lamar.edu/terms.aspx
The red strip again represents the box we are using to approximate the water in the i
th
subinterval.
As noted in the problem statement the cross-section is an equilateral triangle and with sides of
length 2 feet.
We included the height in the above sketch and this is easy to get using some basic right triangle
trig. Here is yet another sketch of the cross-section.
Because the triangle is an equilateral triangle we know that each of the interior angles of the
triangle must be
3
π
and we’re told the length of each side is 2. The height of the triangle is the
line that bisects the triangle as shown. Each half of the triangle is then an identical right triangle
and using any of the trig functions we can quickly determine the height of the triangle. We’ll use
cosine here.
( )
( )
6
2
6
cos
2 cos
3
h
h
π
π
=
⇒
=
=
Hint : What is the volume of the box of water we are using to approximate the volume of water in
the i
th
subinterval? Give the volume in terms of
*
i
x
.
Step 2
We’ll next need the volume of the box of water we using to approximate the volume of water in
the i
th
subinterval (as represented by the red strip in the first two pictures from Step 1).
Our approximate volume is the volume of a box and so we know that the volume for the i
th
subinterval would be,
(
)(
)(
) ( )( )( )
15
15
i
i
i
V
length
width height
s
x
s
x
=
=
∆ =
∆
We will eventually need the volume to be in terms of
*
i
x
and luckily enough this is easy enough
to do.
Calculus I
© 2007 Paul Dawkins
91
http://tutorial.math.lamar.edu/terms.aspx
From the cross-section sketch with the red strip in Step 1 we see that we have two similar
triangles (well actually we have three but we only need two of them). The two that we need are
the triangle with width 2 and height
3
and the triangle whose width is
i
s
(i.e. the triangle
whose top is the red strip) and whose height is
*
i
x
. Since these two triangles are similar we now
the following two ratios must be equal.
*
*
2
2
3
3
i
i
i
i
s
s
x
x
=
⇒
=
Plugging this into the volume formula above and we get,
*
30
3
i
i
V
x
x
=
∆
Hint : What is the approximate weight of the water in the i
th
subinterval? Or in other words what
is the approximate force needed to overcome the force of gravity acting on this volume of water?
Note that because we are working with the British system here the force in this case is just
density
i
i
F
V
=
×
.
Step 3
We next need to know how much force will be required to overcome the force of gravity that is
acting on the water in the i
th
subinterval. This will be approximately the forced needed to
overcome the force of gravity acting on the volume of water we found in Step 2. Because we are
working with the British system here the force is,
( )
(
)
*
*
30
1860
3
3
density
62
i
i
i
i
F
V
x
x
x
x
=
× ≈
∆ =
∆
Hint : Approximately how much work is needed to raise the water in the i
th
subinterval to the top
of the tank?
Step 4
We will need the amount of work required to raise the volume of water in the i
th
subinterval to the
top of the tank, i.e. raise it a distance of
*
3
i
x
−
. This is approximately,
(
)
(
)
*
*
*
1860
3
3
3
i
i
i
i
i
W
F
x
x
x
x
≈
−
=
−
∆
Hint : Finally compute the total amount of work needed to pump all the to the top of the tank.
Step 5
Calculus I
© 2007 Paul Dawkins
92
http://tutorial.math.lamar.edu/terms.aspx
The total amount of work to raise all the water to the top of the tank is the approximately the sum
of all the
i
W
for
1, 2,
i
n
=
or,
(
)
*
*
1860
3
1
3
n
i
i
i
W
x
x
x
=
≈
−
∆
∑
The exact work required is then found by letting
n
→ ∞
or,
(
)
*
*
1860
3
1
lim
3
n
i
i
n
i
W
x
x
x
→∞
=
=
−
∆
∑
This however is just the definition of the following definite integral,
(
)
3
4
1860
3
0
3
W
x
x dx
=
−
∫
The work required to pump all the water to the top of the tank is then,
(
)
(
)
3
3
4
4
2
3
3
1860
1860
1
2
3
3
3
0
0
3
372.112 ft-lbs
W
x
x dx
x
x
=
−
=
−
=
∫