ELECTROCARDIOGRAM (ECG or EKG)
Dr. Ahmed Moyed HusseinM.B.Ch.B- FIBMS(med)
CABMS(med)- FIBMS(cardiol)
What is an ECG?
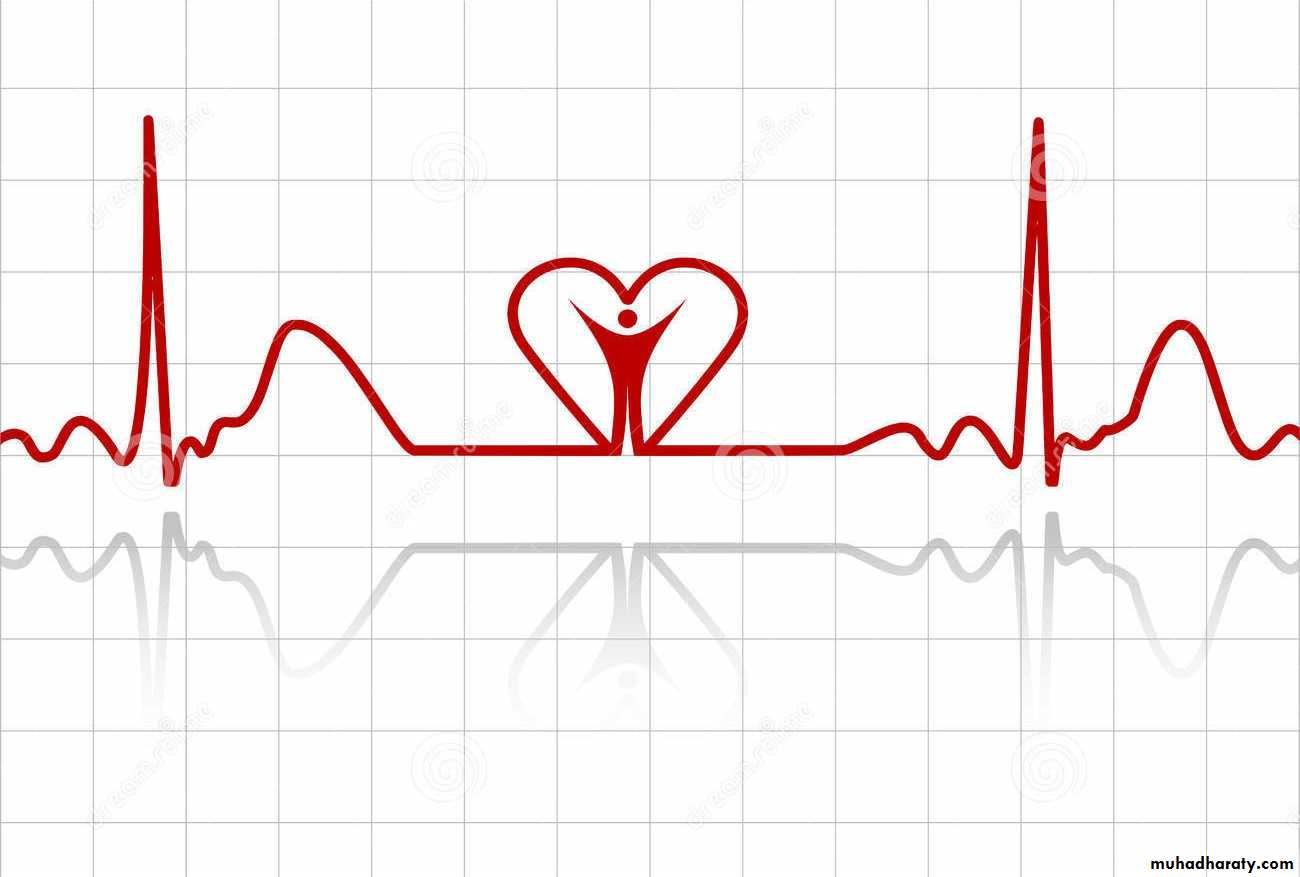
The electrocardiogram (EKG) is a representation of the electrical events of the cardiac cycle.Each event has a distinctive waveform
the study of waveform can lead to greater insight into a patient’s cardiac pathophysiology.
With EKGs we can identify
• Arrhythmias• Myocardial ischemia and infarction
• Pericarditis
• Chamber hypertrophy
• Electrolyte disturbances (i.e. hyperkalemia, hypokalemia)
• Drug toxicity (i.e. digoxin and drugs which prolong the QT interval)
Depolarization
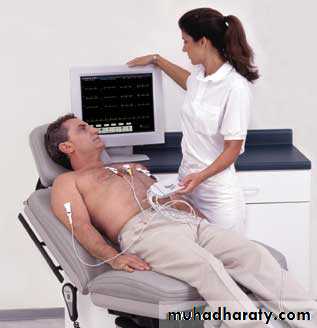
Contraction of any muscle is associated with electrical changes called depolarizationThese changes can be detected by electrodes attached to the surface of the body
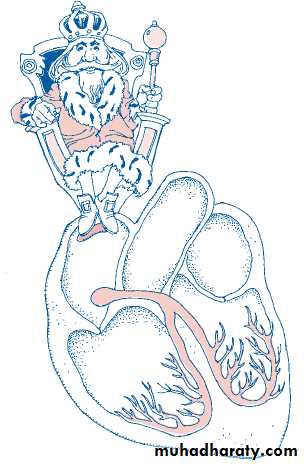
Conductive system of the heartSA Node - Dominant pacemaker with an intrinsic rate of 60 - 100 beats/minute.
AV Node - Back-up pacemaker with an intrinsic rate of 40 - 60 beats/minute.
Ventricular cells - Back-up pacemaker with an intrinsic rate of 20 - 45 bpm.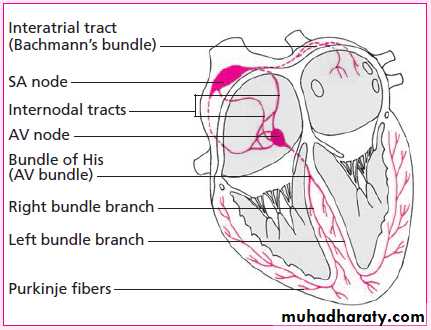
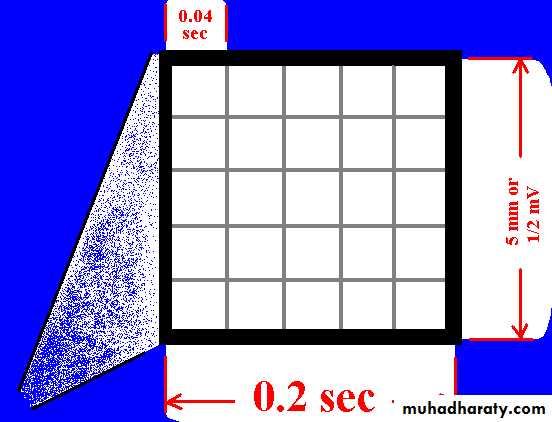
The ECG Paper
Horizontally
One small box - 0.04 s
One large box - 0.20 s
Vertically
One large box - 0.5 mV
EKG Leads
which measure the difference in electrical potential between two points1. Bipolar Leads: Two different points on the body
2. Unipolar Leads: One point on the body and a virtual reference point with zero electrical potential, located in the center of the heart
EKG Leads
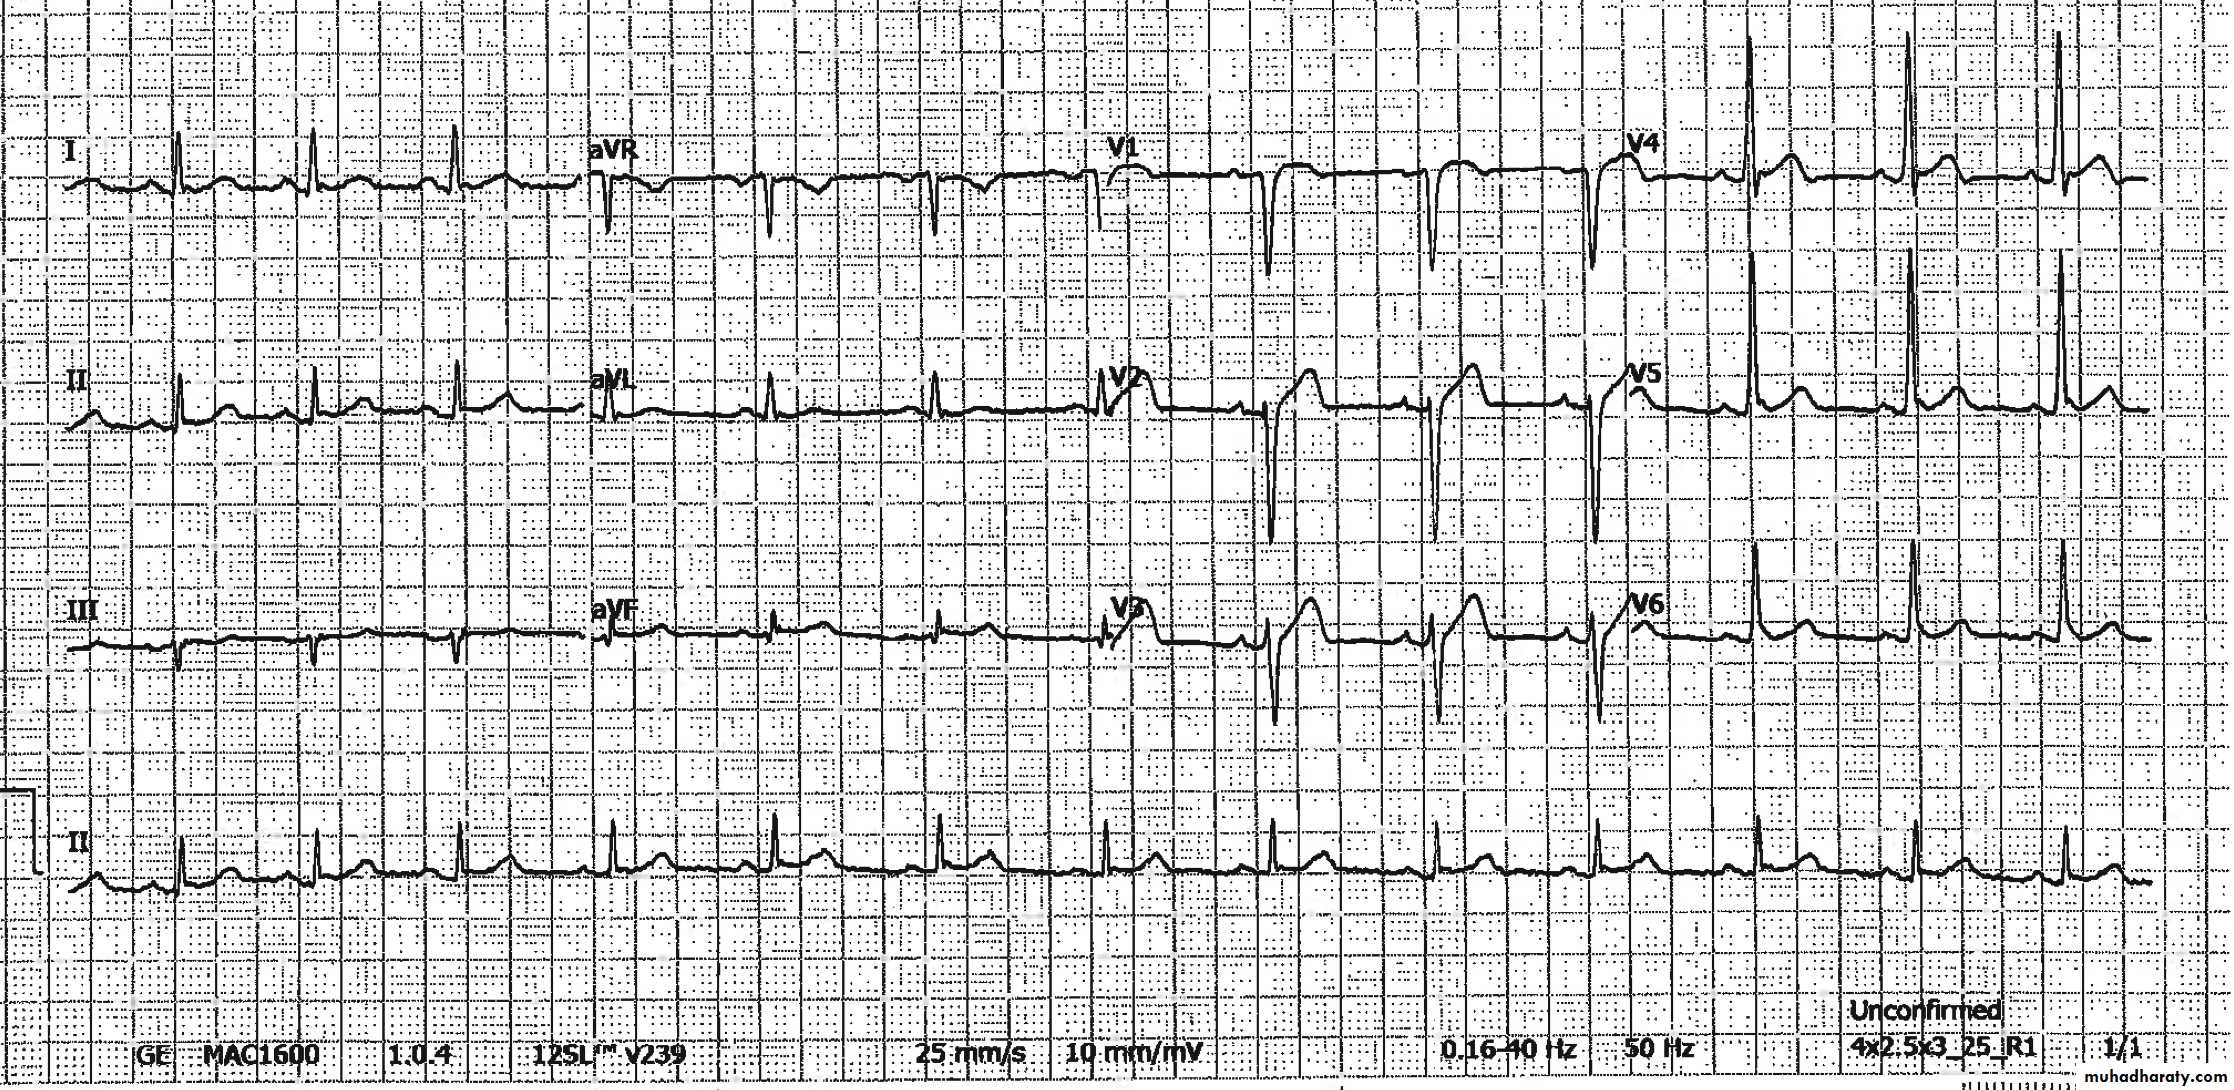
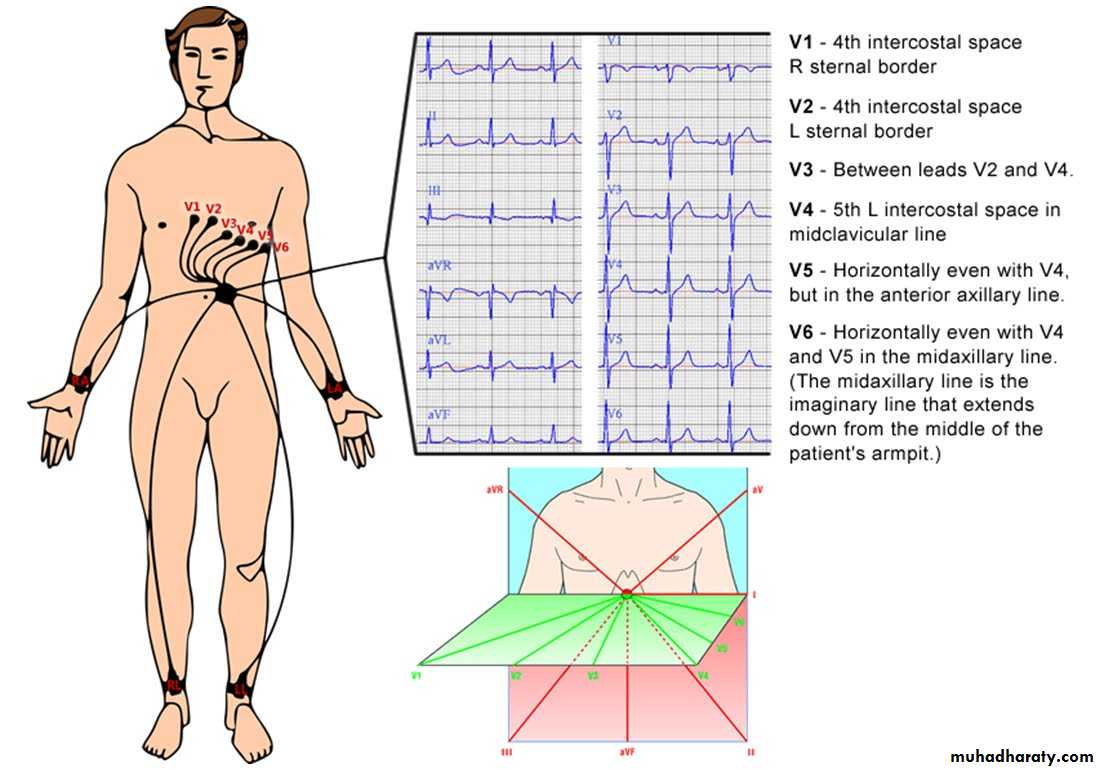
The standard EKG has 12 leads:3 Standard Limb Leads(I,II,III)
3 Augmented Limb Leads (aVR, aVL, aVF)
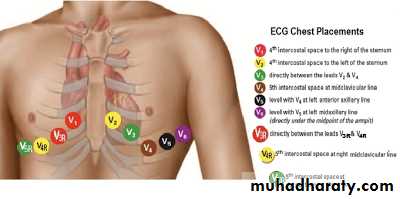
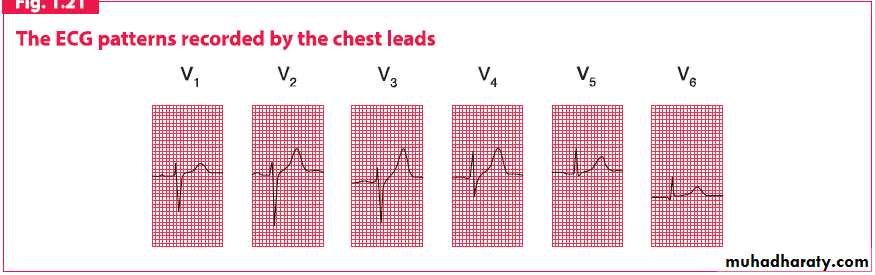
6 Precordial Leads (V1-6)
Extra leads:
Right sided ECG leads
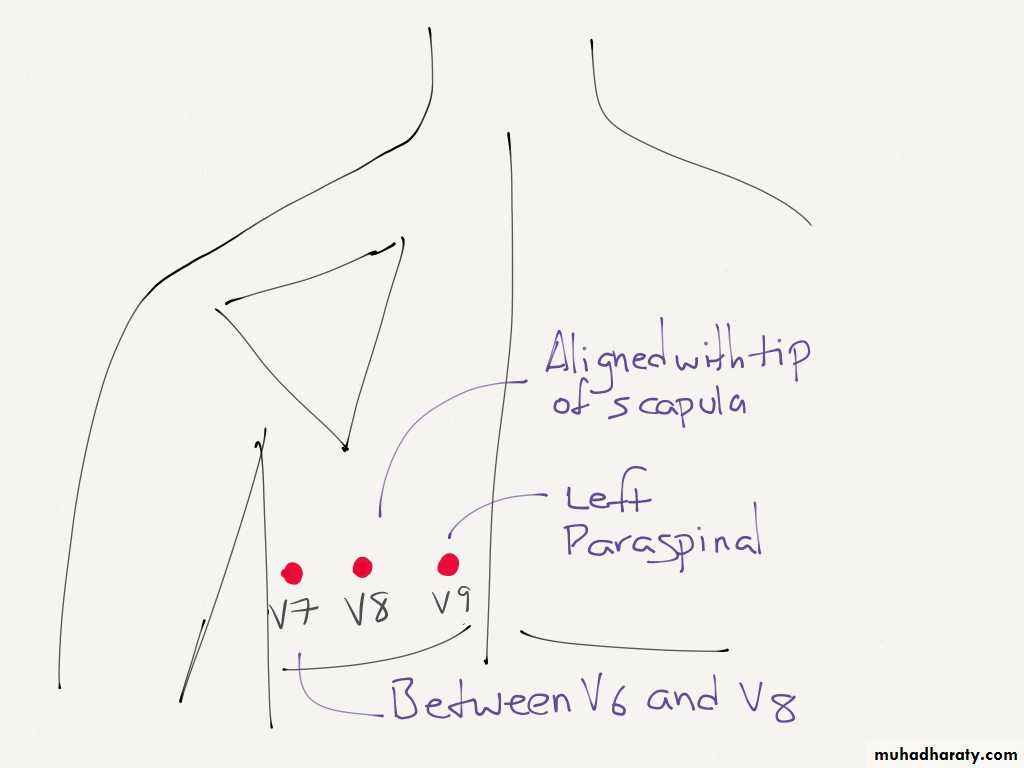
Posterior leads
Extra leads
Lead I
extends from the right to the left armLead II
extends from the right arm to the left foot
Lead III
extends from the left arm to the left foot
Einthoven’s Triangle
+
-
+
-
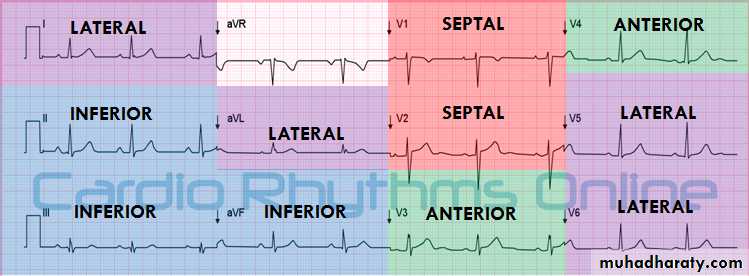
Leads II, III, aVF
Looks at inferior heart wallAnatomy of a 12-Lead EKG
View of Inferior Heart Wall
Looks from the left leg up
Leads I and aVLLooks at lateral heart wall
Looks from the left arm toward heart
Anatomy of a 12-Lead EKG (cont.)
View of Lateral Heart Wall
*Sometimes known as High Lateral*
Leads V5 & V6
Looks at lateral heart wallLooks from the left lateral chest toward heart
Anatomy of a 12-Lead EKG (cont.)
View of Lateral Heart Wall
*Sometimes referred to as Low Lateral or Apical view*
Leads V3, V4
Looks at anterior heart wall
Looks from the left anterior chest
Anatomy of a 12-Lead EKG (cont.)
View of Anterior Heart Wall
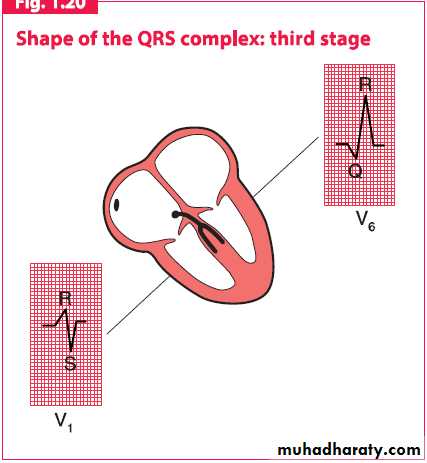
Leads V1, V2
Looks at septal heart wallLooks along sternal borders
Anatomy of a 12-Lead EKG (cont.)
View of Septal Heart Wall
Arrangement of Leads on the EKG
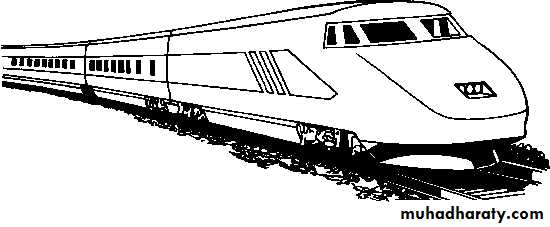
for any givenviewing (positive)electrode:
An approaching train of muscle fiber depolarizations (or repolarizations moving away) is seen as an upward trace on the recording (opposite movement = downward trace)
Interpreting the view from an electrode
Note: the normal average direction for the heart’s electrical activity is from the upper right, in the right atrium, to the lower left.
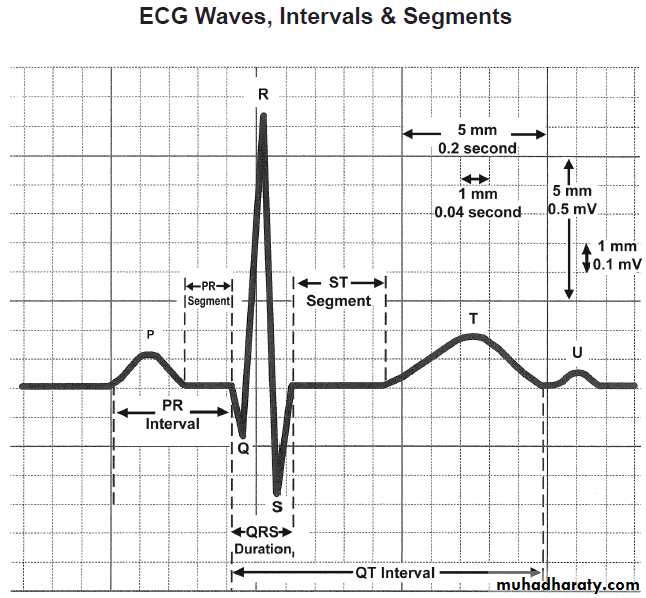
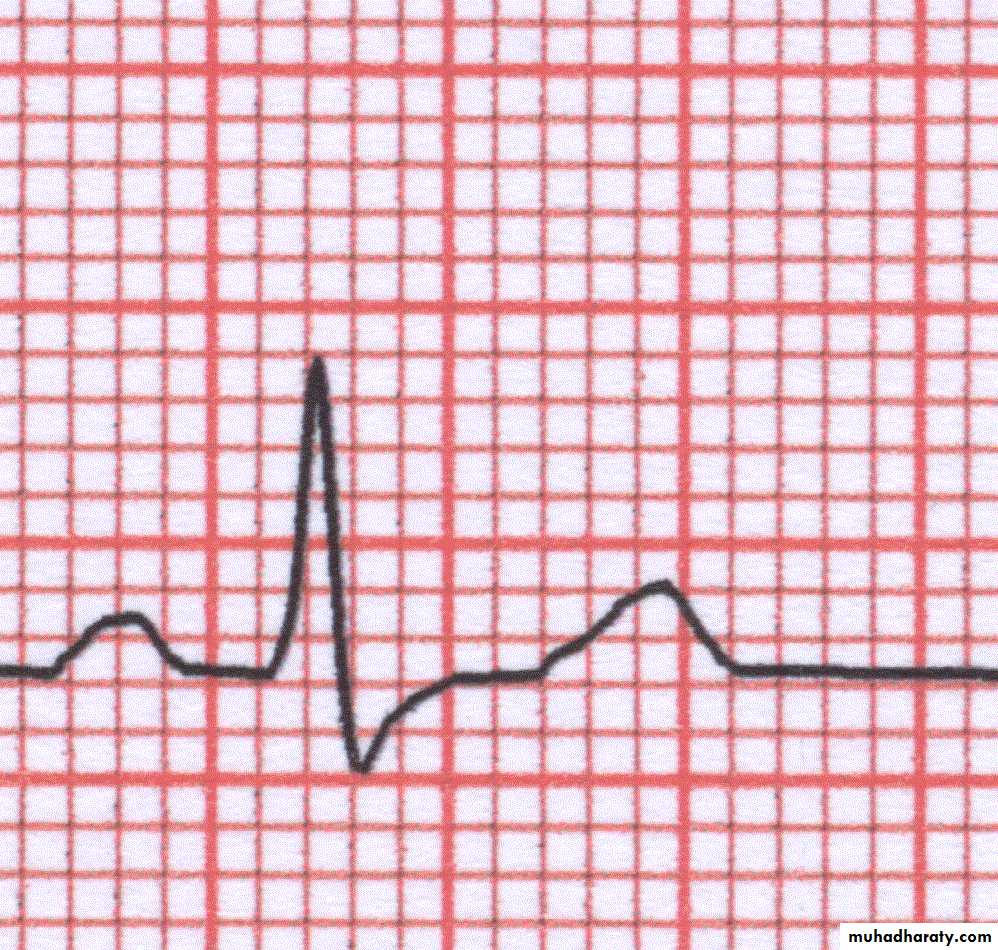
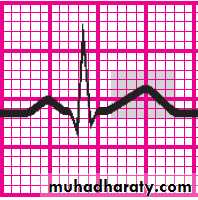
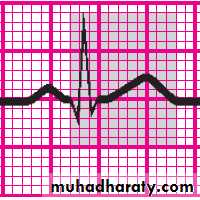
ECG wave
ECG wave(cont.)
The 8-step method
Step 1: Determine rhythmStep 2: Calculate rate
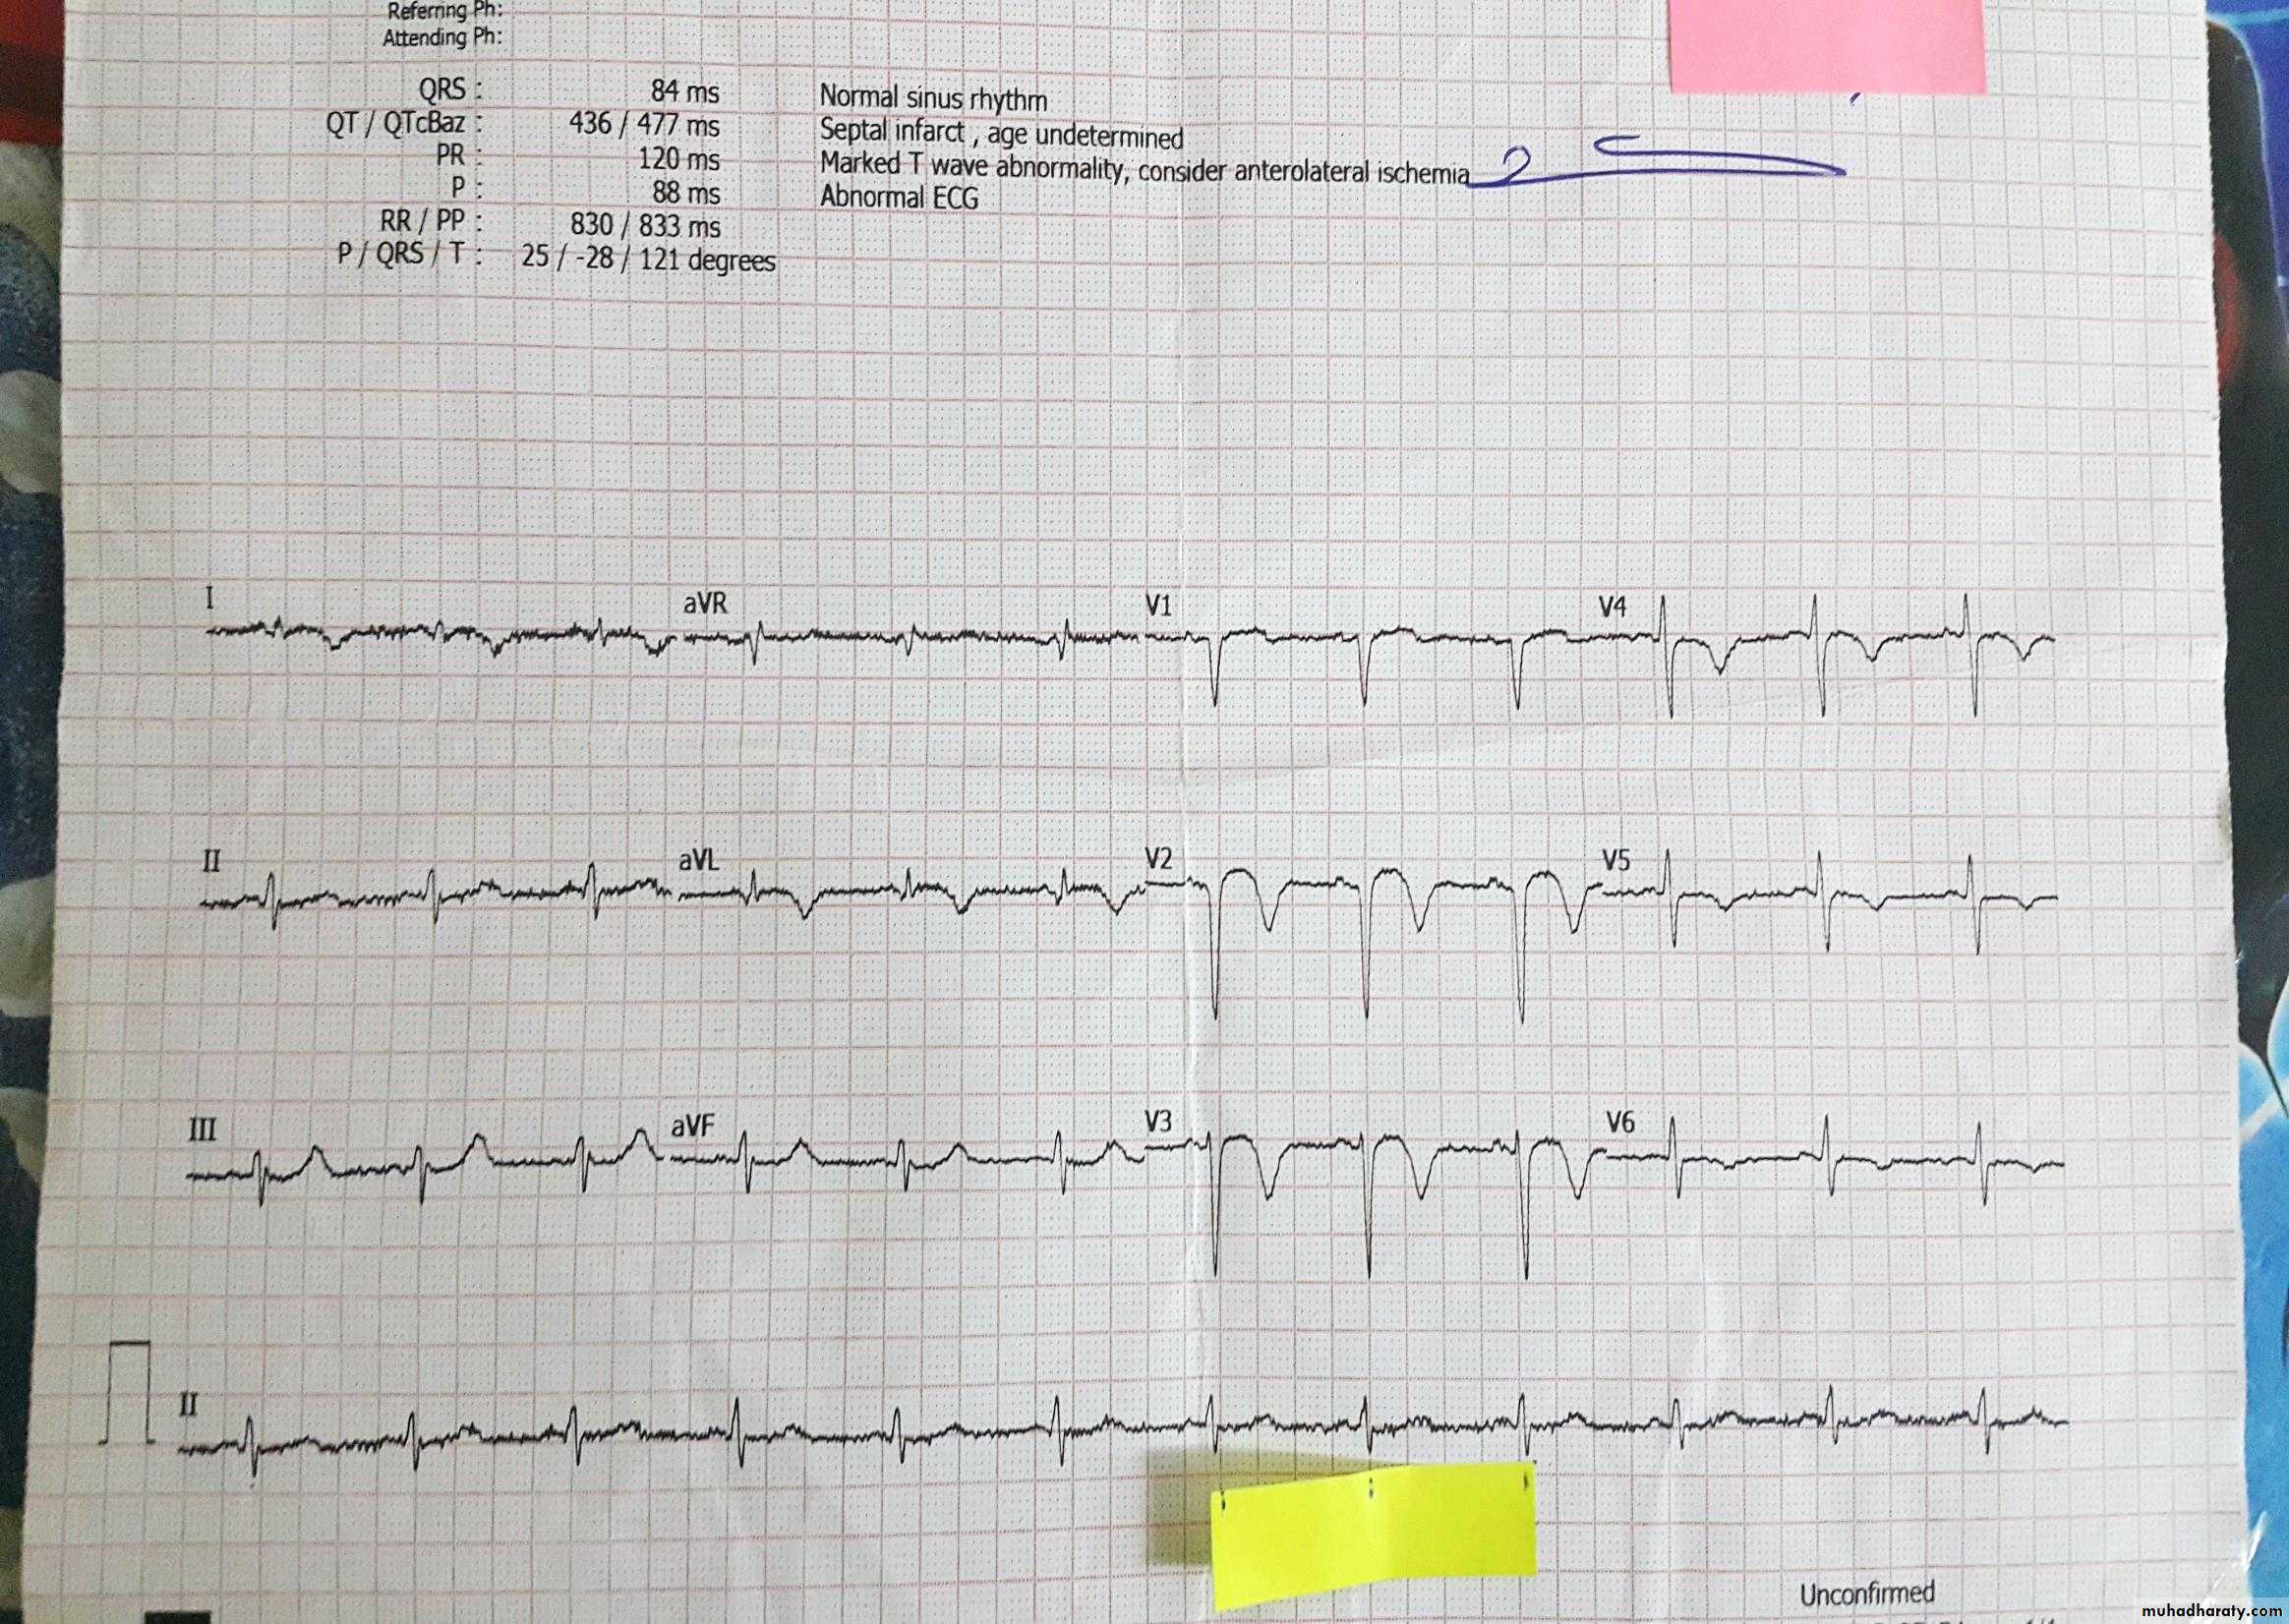
Step 3: Evaluate the P wave
Step 4: Calculate the PR interval
Step 5: Evaluate the QRS complex
Step 6: Evaluate the T wave
Step 7: Calculate the duration of the QT interval
Step 8: Evaluate other components
Speed= 25mm/sec
Height 10mm = 1 mVNote
Reversal limb connection
Dextrocardia
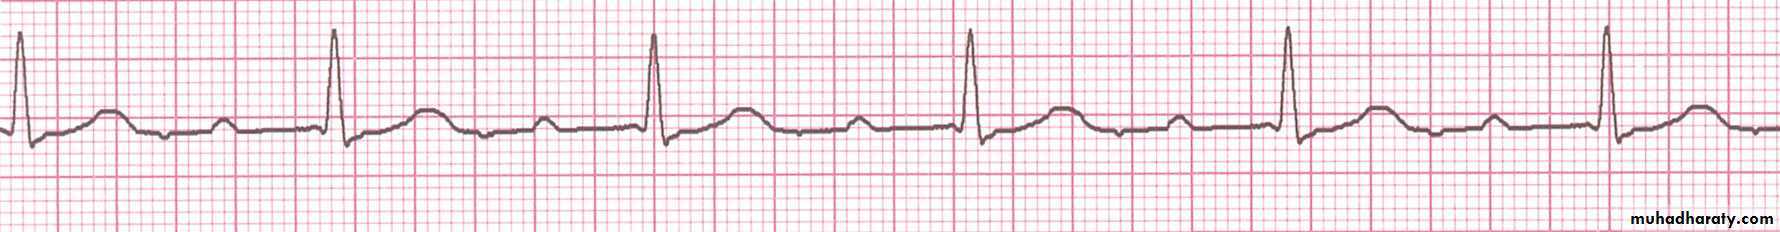
Step 1: Determine rhythm
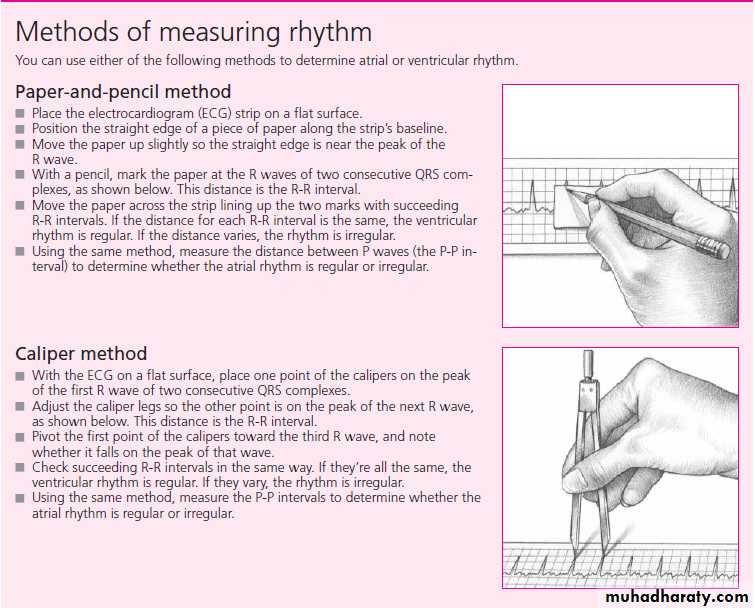
Step 2: Calculate rate
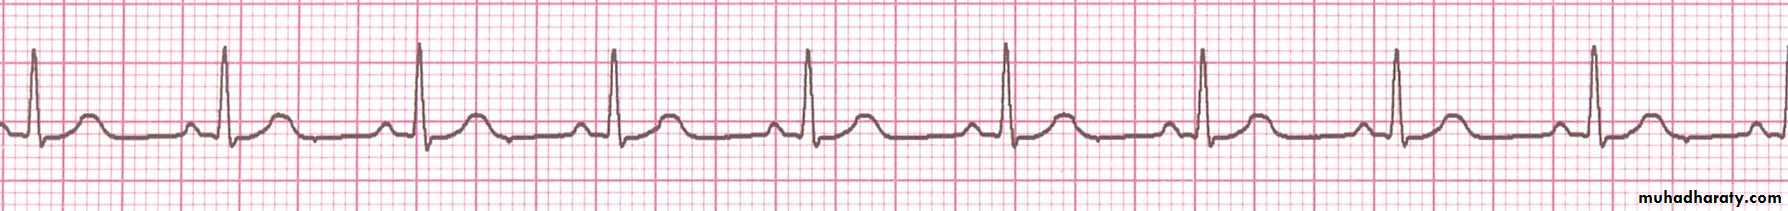
If the heart rate is regular: Count the number of large squares between R waves i.e. the RR interval in large squares Rate = 300 RR e.g. RR = 4 large squares 300/= 75 beats per minute
If the rhythm is irregular it may be better to estimate the rate using the rhythm strip at the bottom of the ECG (usually lead II) The rhythm strip is usually 25cm long (250mm i.e. 10 seconds) If you count the number of R waves on that strip and multiple by 6 you will get the rate
Step 3: Evaluate the P wave
When examining a rhythm strip for P waves, ask yourself:Are P waves present?
Do the P waves have a normal configuration?
Do all the P waves have a similar size and shape?
Is there one P wave for every QRS complex?
Atrial Waves
34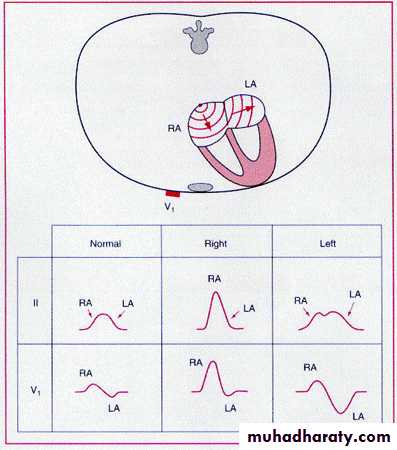
Right Atrial Enlargement
35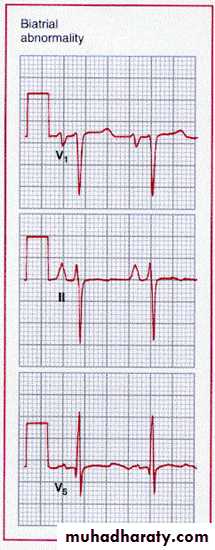
P wave voltage is 4 boxes or 4 mm
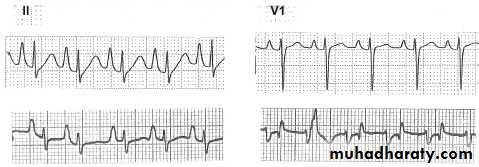
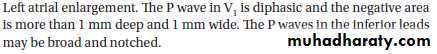
Left Atrial Enlargement36
P wave duration is 4 boxes-0.04 x 4 = 0.16
P wave abnormalities

Step 4: Calculate the PR interval
To measure the PR interval, count the small squares between the start of the P wave and the start of the QRS complex; then multiply the number of squares by 0.04 second.After performing this calculation, ask yourself:
Does the duration of the PR interval fall within normal limits, 0.12 to 0.20 second (or 3 to 5 small squares)?
Is the PR interval constant?
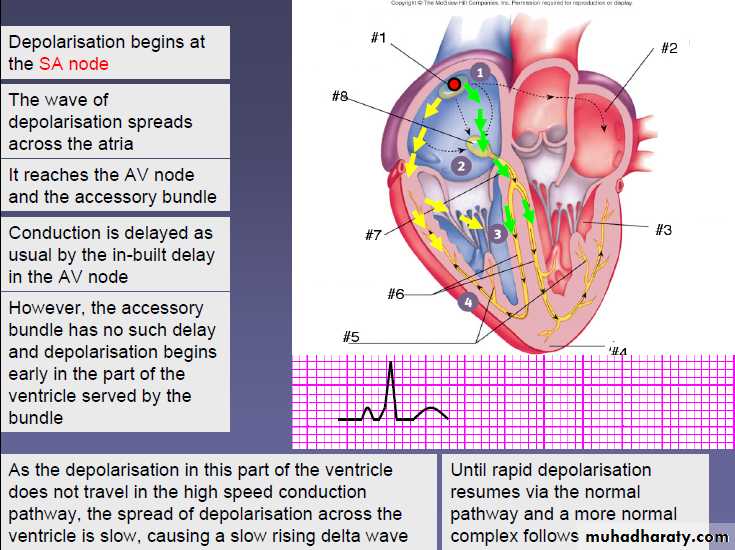
WPW
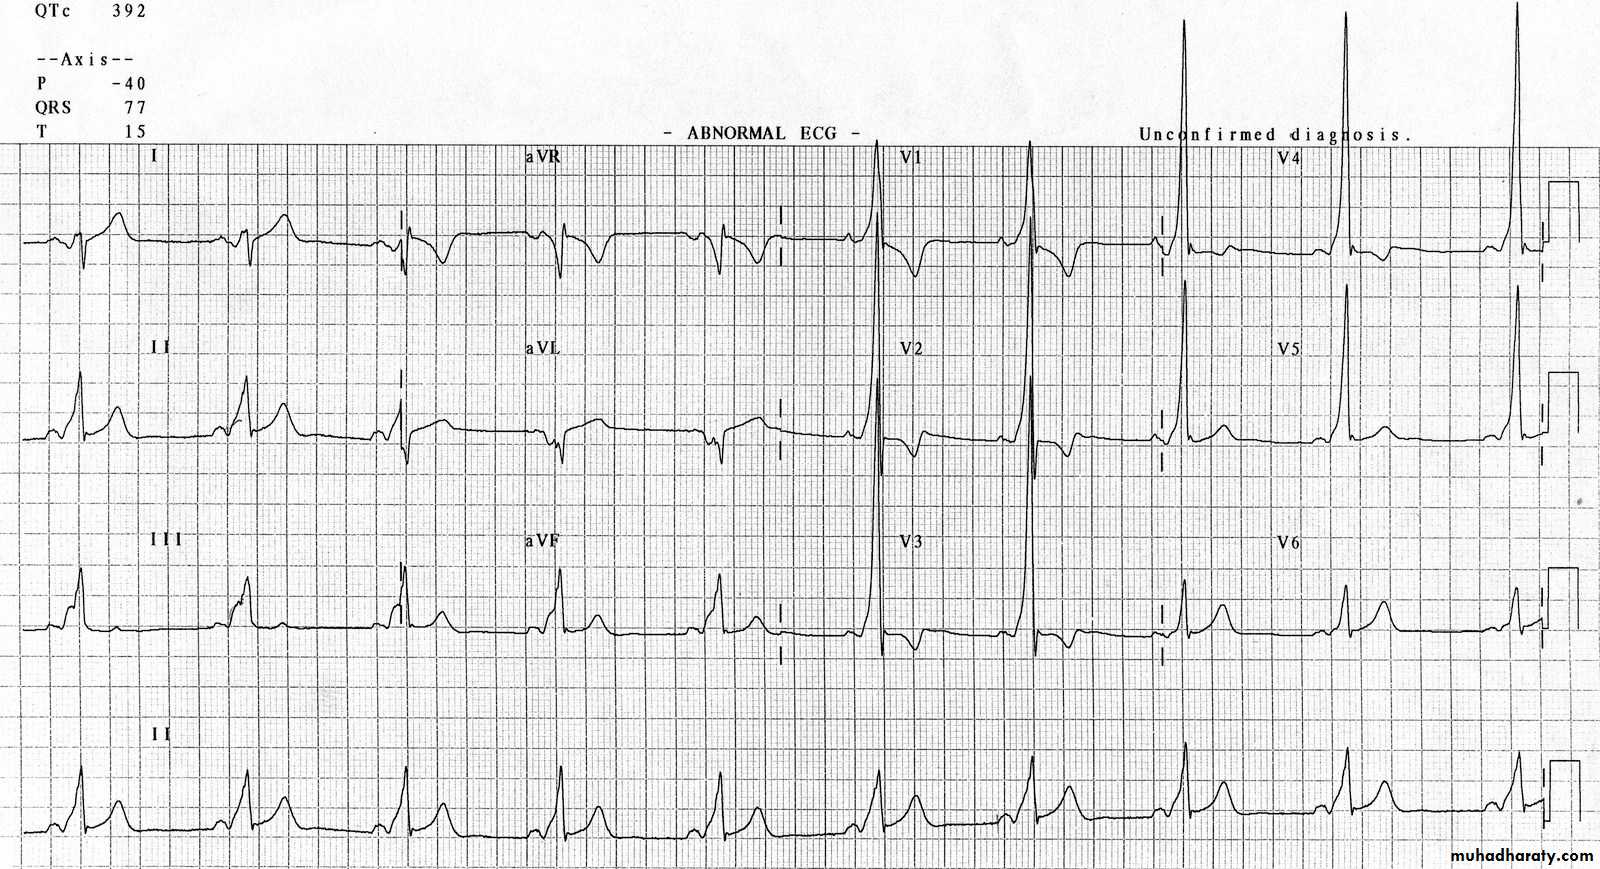
WPW Orthodromic tachycardia
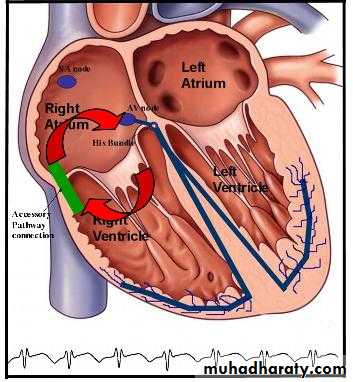
WPW Orthodromic tachycardia
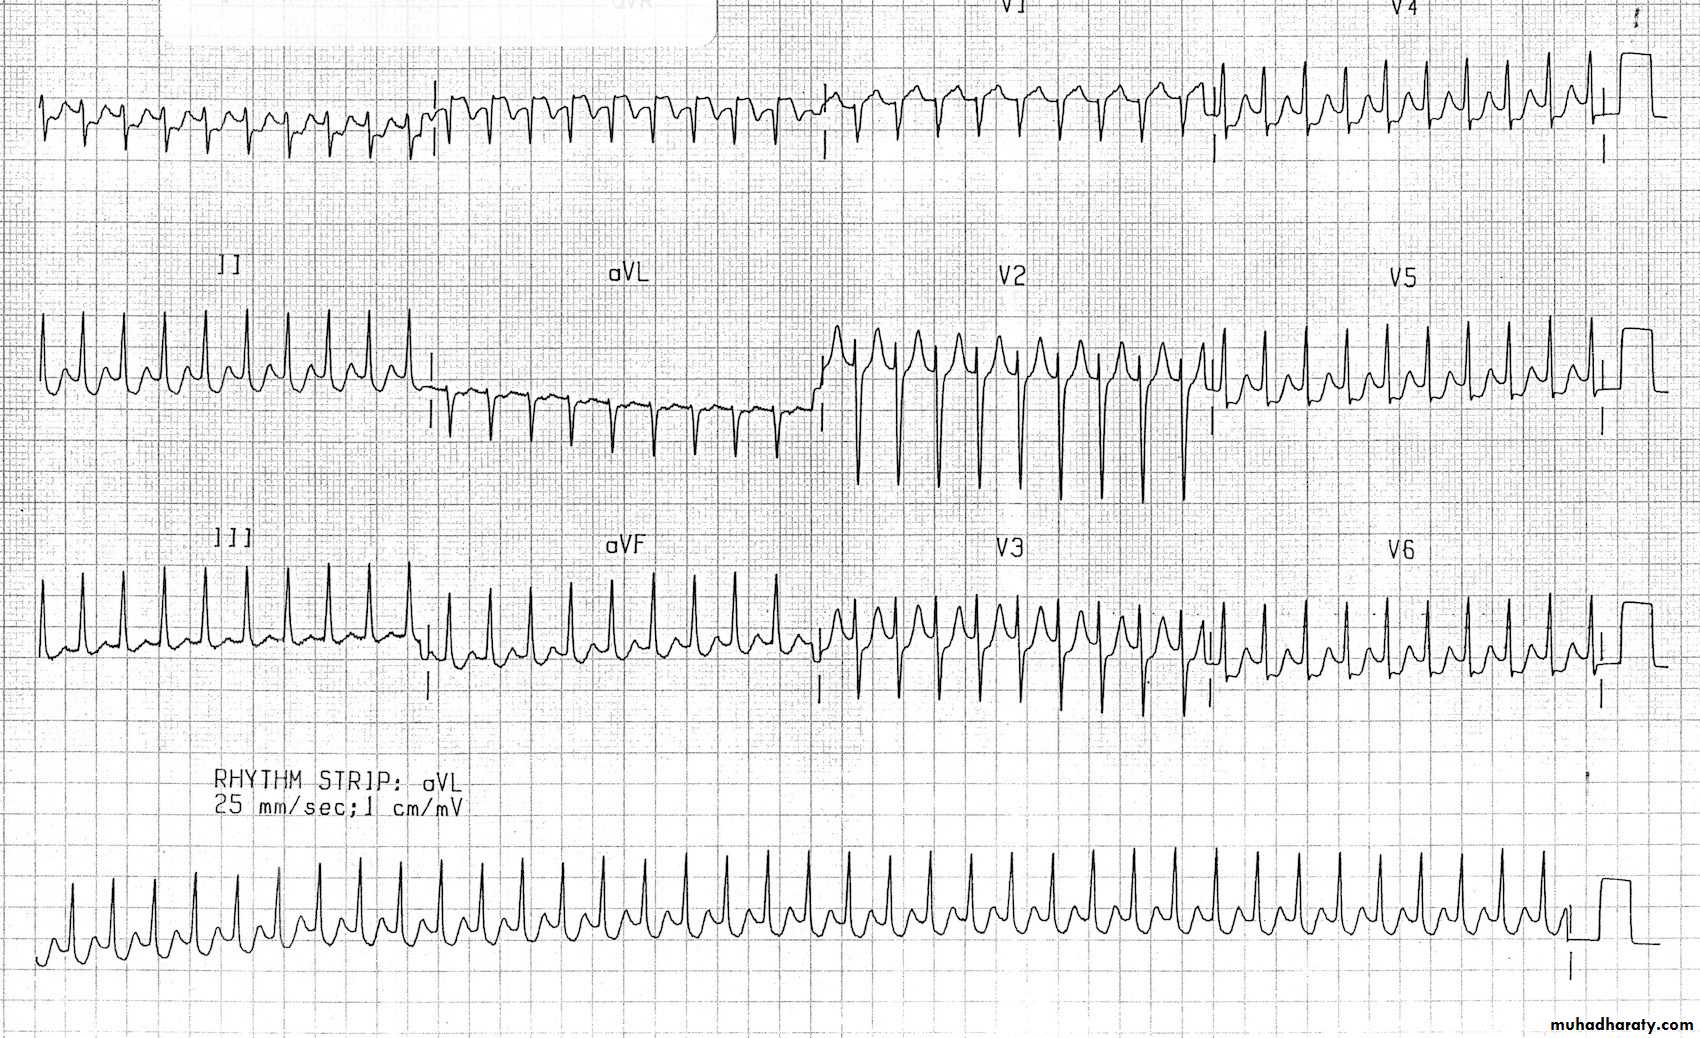
WPW Antidromic tachycardia
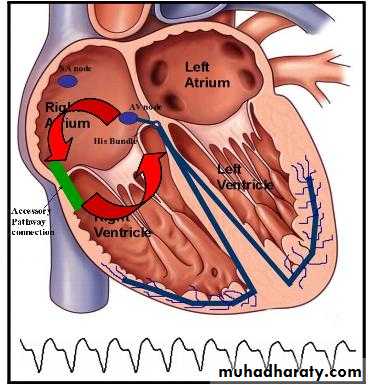
WPW Antidromic tachycardia
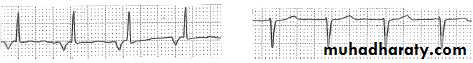
Long PR Interval
First degree Heart Block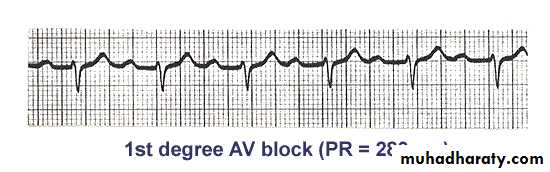
Step 5: Evaluate the QRS complex
When determining QRS-complex duration, make sure you measure straight across from the end of the PR interval to the end of the S wave, not just to the peak.To calculate duration, count the number of small squares between the beginning and end of the QRS complex and multiply this number by 0.04 second. Then ask yourself:
Does the duration of the QRS complex fall within normal limits, 0.06 to 0.10 second?
Are all QRS complexes the same size and shape? (If not, measure each one and describe them individually.)
Does a QRS complex appear after every P wave?
Q wave
A small Q wave may be normal in lead III, and is often associated with an inverted T wave. Q waves are also normal in lead aVR.Q waves in other leads are likely to be abnormal or ‘pathological’, particularly if they are:
2 small squares deep, or
25 per cent of the height of the following R wave in depth, and/or
1 small square wide.
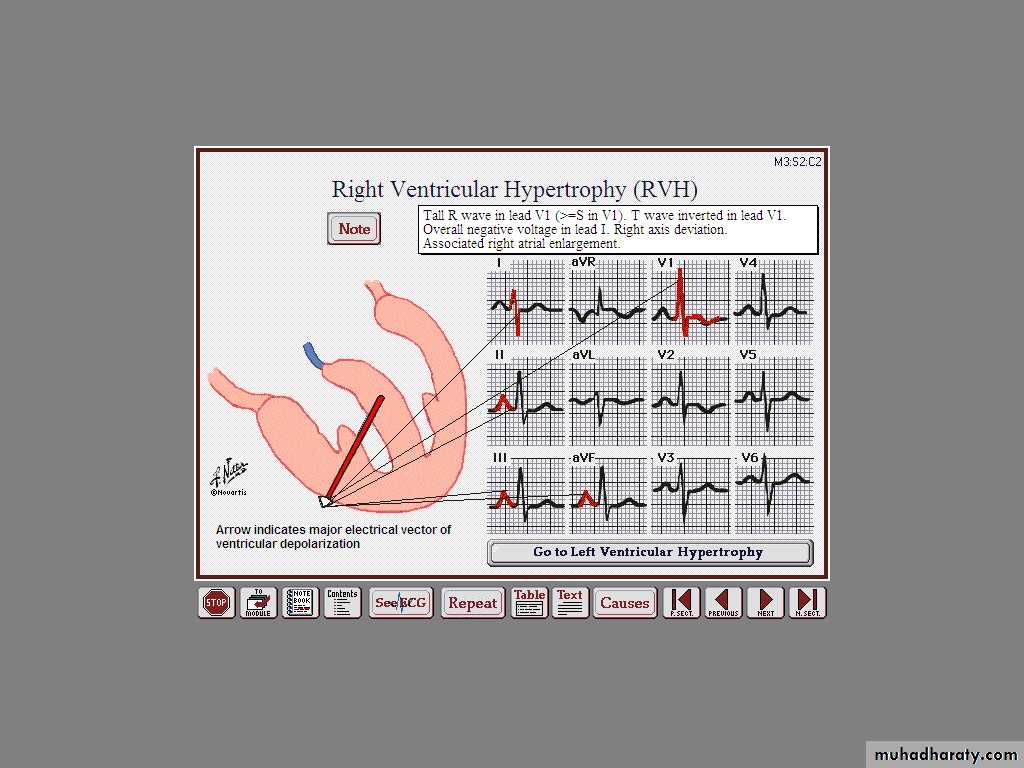
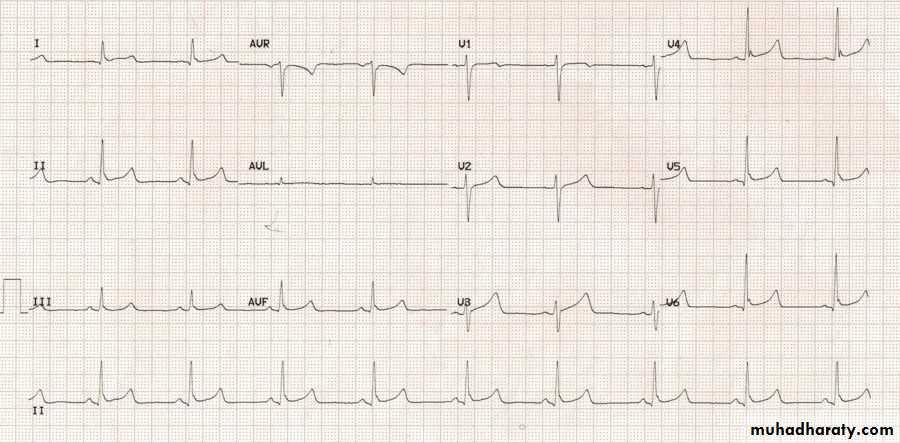
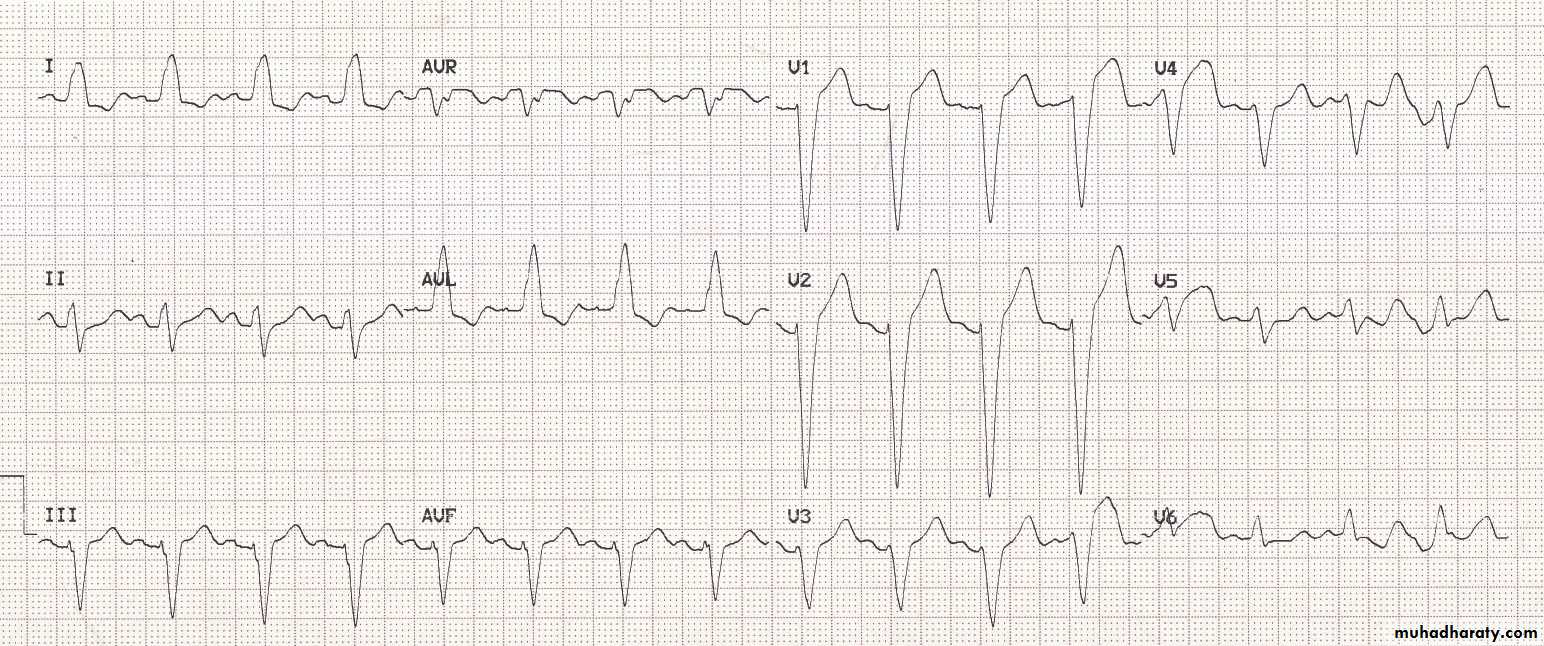
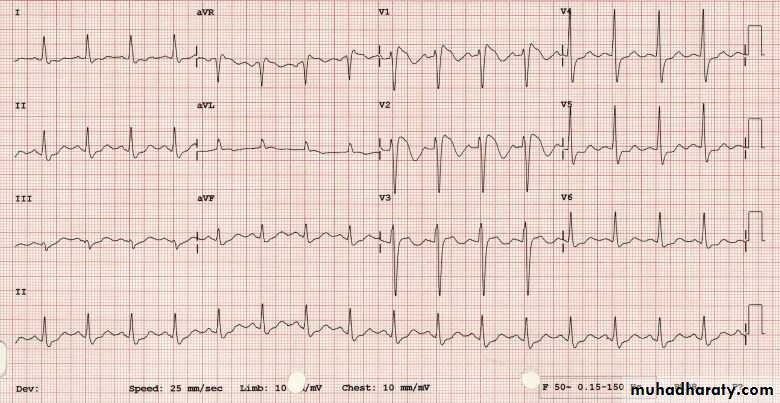
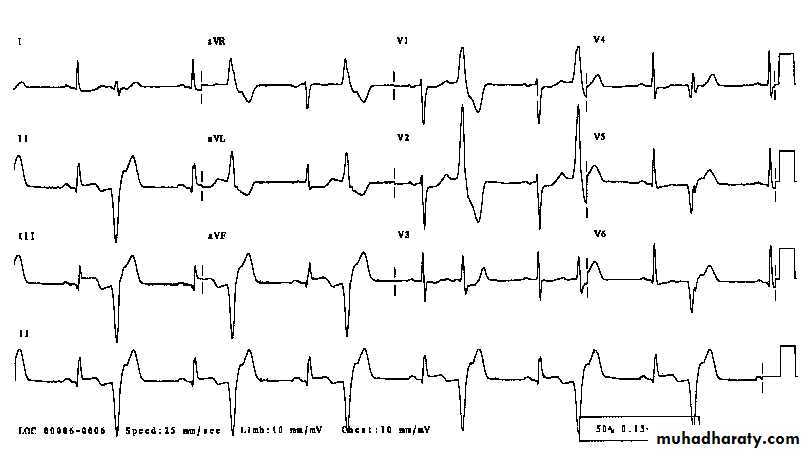
Right Ventricular Hypertrophy
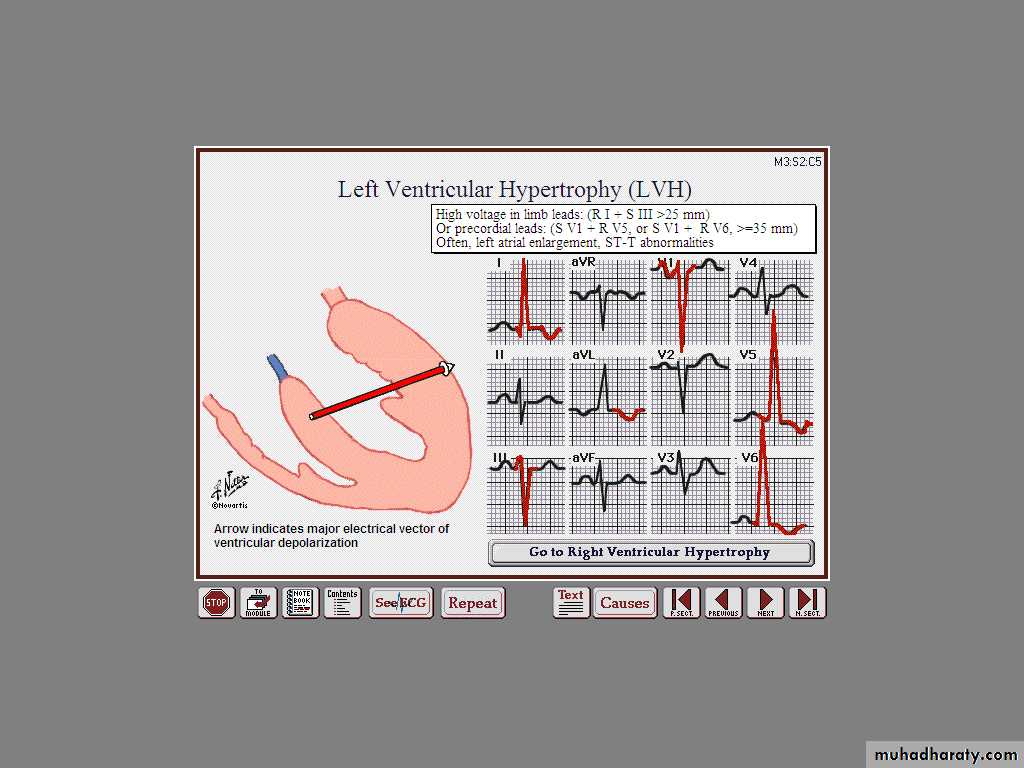
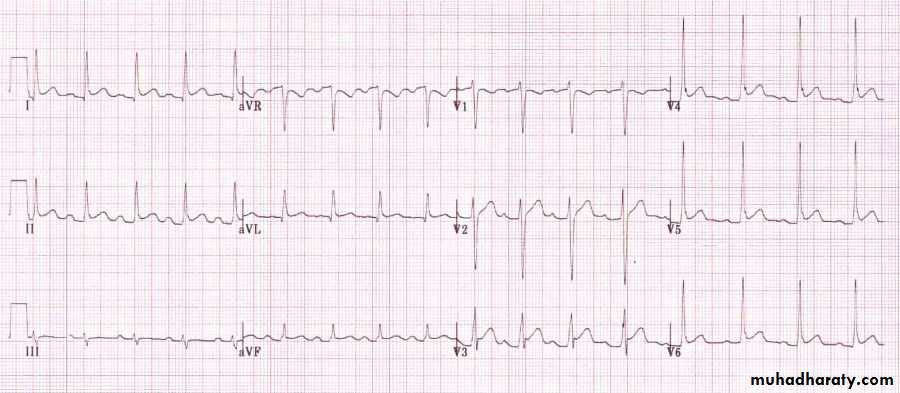
Left Ventricular Hypertrophy
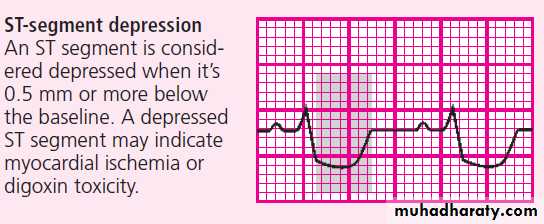
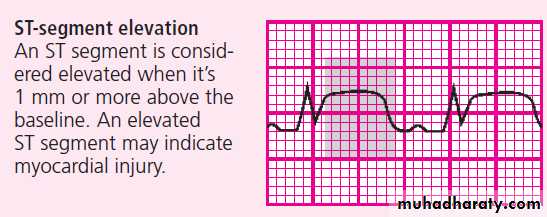
ST SegmentST segments can be abnormal in one of three ways, so the questions you need to ask about the ST segments when you review them are:
Are the ST segments elevated?
Are the ST segments depressed?
Are J waves present?
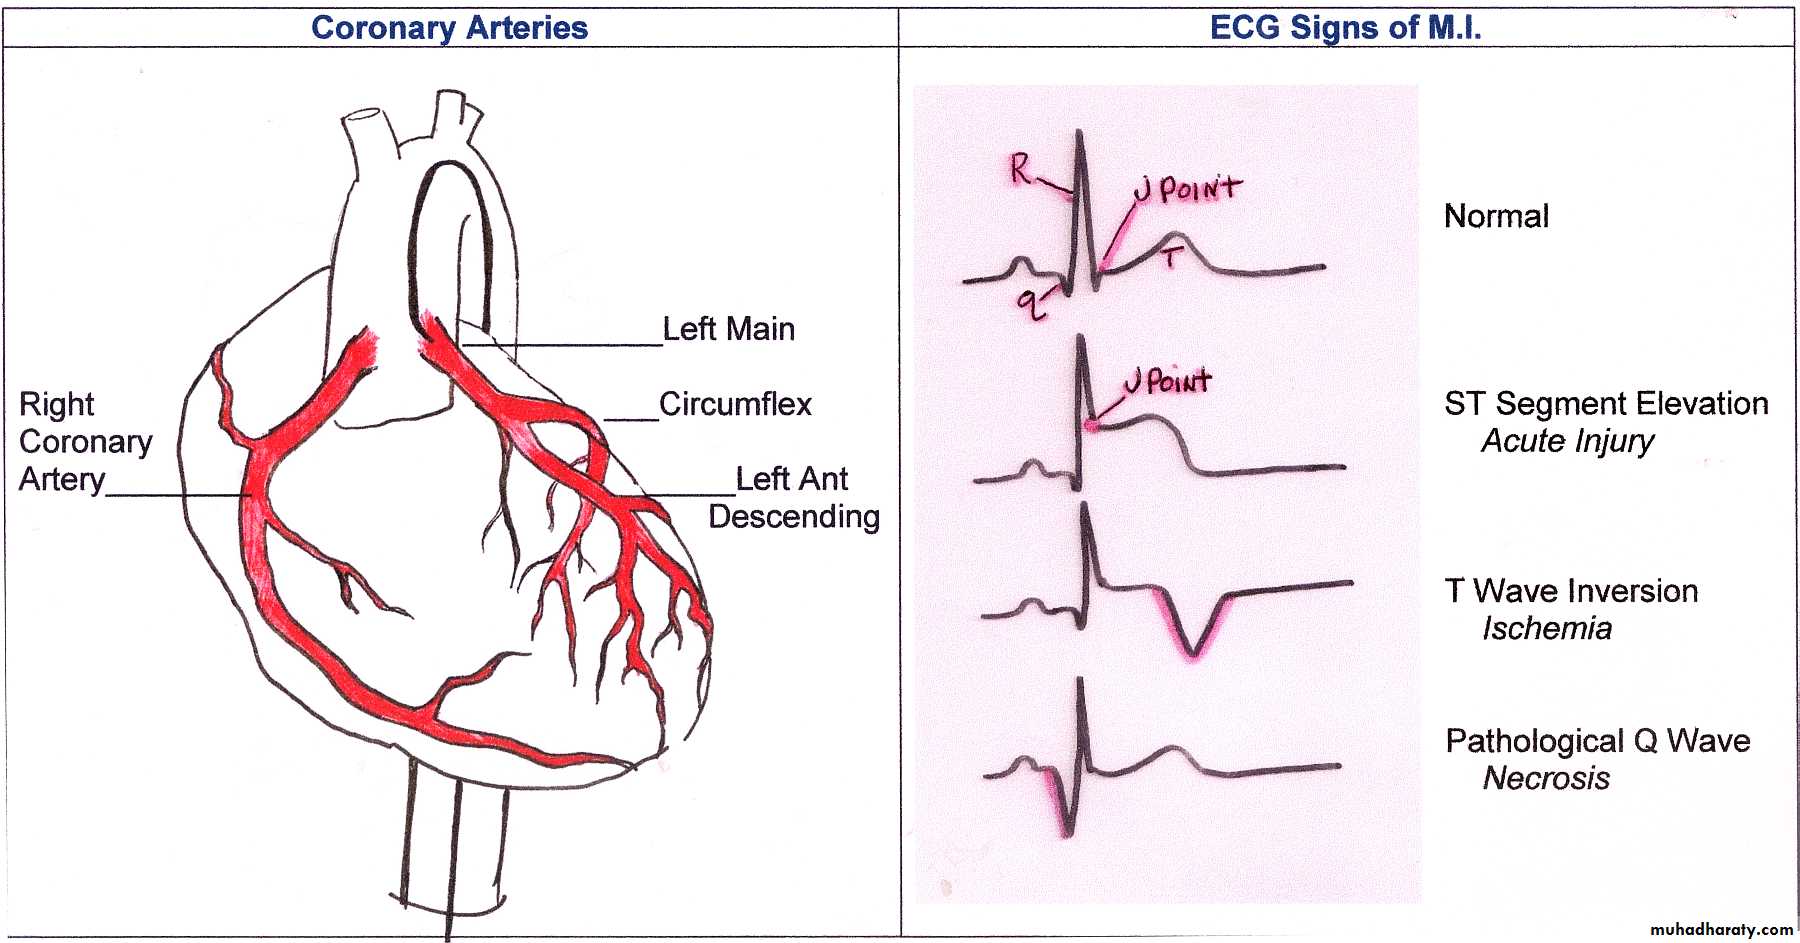
Causes of ST segment elevation:
acute coronary syndrome(STEMI)
left ventricular aneurysm
Prinzmetal’s (vasospastic) angina
Pericarditis
high take-off (early repolarization)
left bundle branch block
Brugada syndrome.
Acute pericarditis
• Wide spread ST segment elevation (concave )
• PR depression
Early Repolarization
• Young pt with non specific chest
• Wide spread ST elevation with notched J point• No reciprocal changes
LBBB
• ST elevation with negative QRS
• ST depression with positive QRSBrugada syndrome
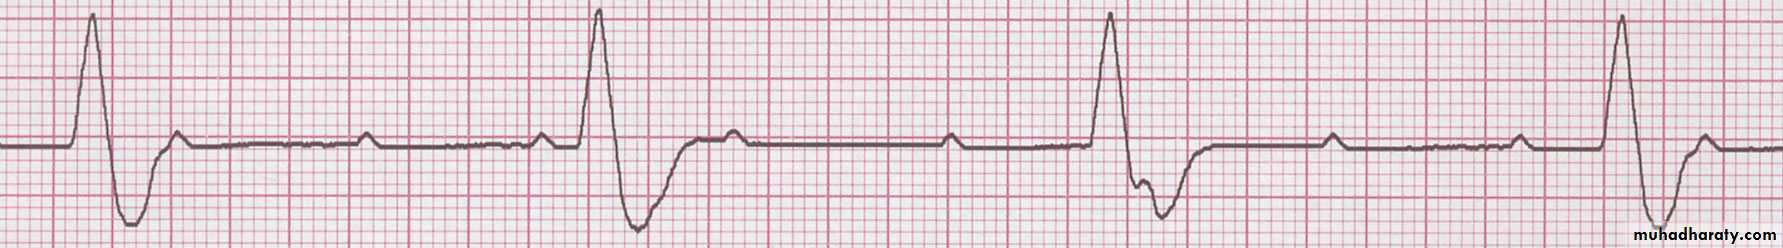
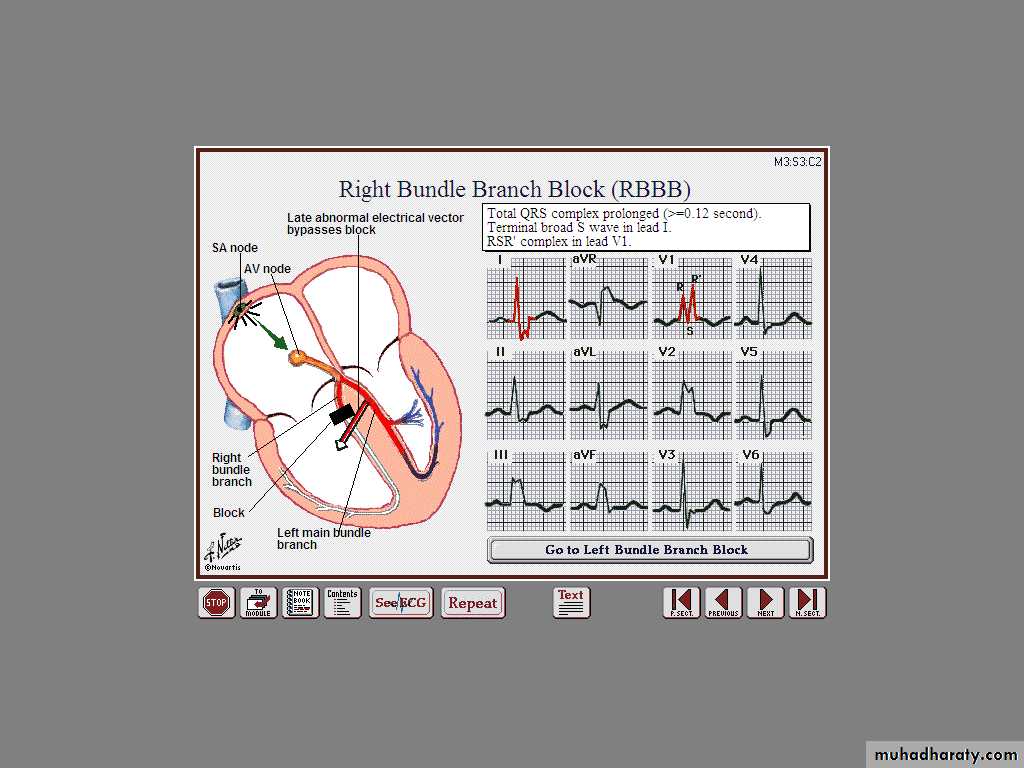
* Partial RBBB, ST elevation in V1-3, with T inversion
Step 6: Evaluate the T wave
Examine the T waves on the ECG strip. Then ask yourself:
Are T waves present?
Do all of the T waves have a normal shape?
Could a P wave be hidden in a T wave?
Do all T waves have a normal amplitude?
Do the T waves have the same deflection as the QRS complexes?
T wave
Normal T wave is asymmetrical, first half having a gradual slope than the secondShould be at least 1/8 but less than 2/3 of the amplitude of the R
T wave amplitude rarely exceeds 10 mmAbnormal T waves are symmetrical, tall, peaked, biphasic or inverted.
T wave follows the direction of the QRS deflection.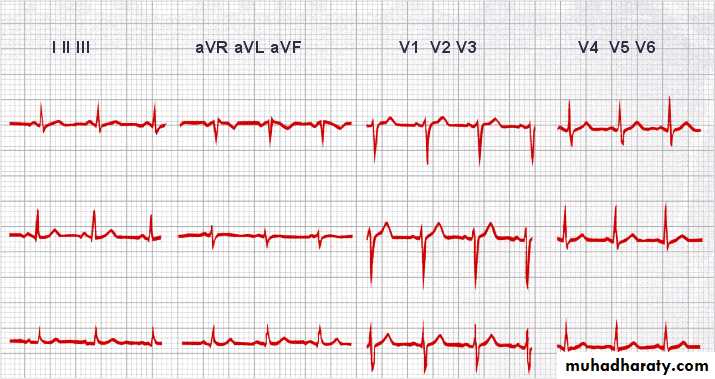
T wave
Hyperkalemia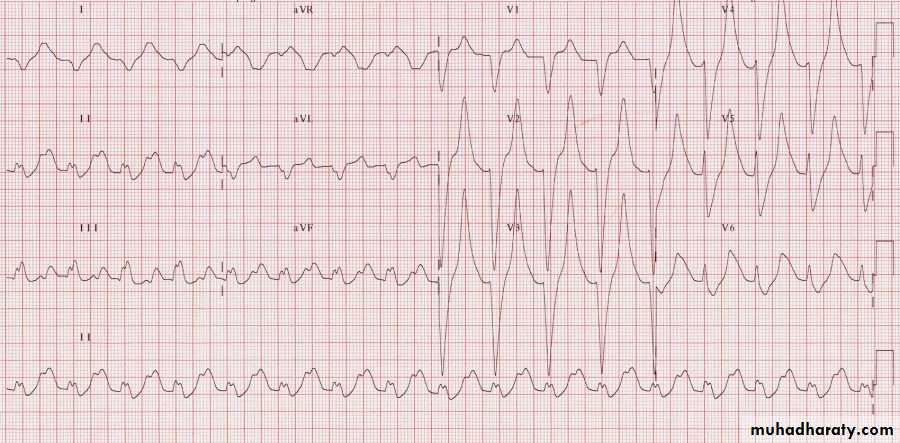
Hypokalaemia
Step 7: Calculate the duration of the QT interval
To determine the duration of the QT interval, count the number of small squares between the beginning of the QRS complex and the end of the T wave, where the T wave returns to the baseline. Multiply this number by 0.04 second. Ask yourself:Does the duration of the QT interval fall within normal limits, 0.36 to 0.44 second?
Long QT
Short QT
Step 8: Evaluate other components
Note the presence of ectopic beats or other abnormalities such as aberrant conduction.look for the presence of a U wave.
Now, interpret your findings by classifying the rhythm strip according to one or all of the following:
Origin of the rhythm: for example, sinus node, atria, AV node, or ventricles
Rate: normal (60 to 100 beats/minute), bradycardia (fewer than 60 beats/minute), or tachycardia (greater than 100 beats/minute)
Rhythm interpretation: normal or abnormal—for example, flutter, fibrillation, heart block, escape rhythm, or other arrhythmias
ST- segment changes
Cardiac Arrhythmia
Conductive system of the heart
SA Node - Dominant pacemaker with an intrinsic rate of 60 - 100 beats/minute.AV Node - Back-up pacemaker with an intrinsic rate of 40 - 60 beats/minute.
Ventricular cells - Back-up pacemaker with an intrinsic rate of 20 - 45 bpm.Sinus Node
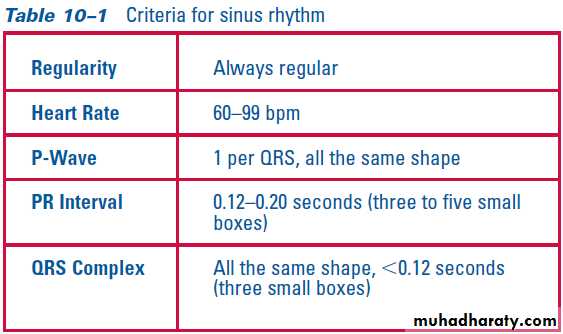
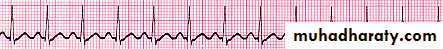
Rhythm
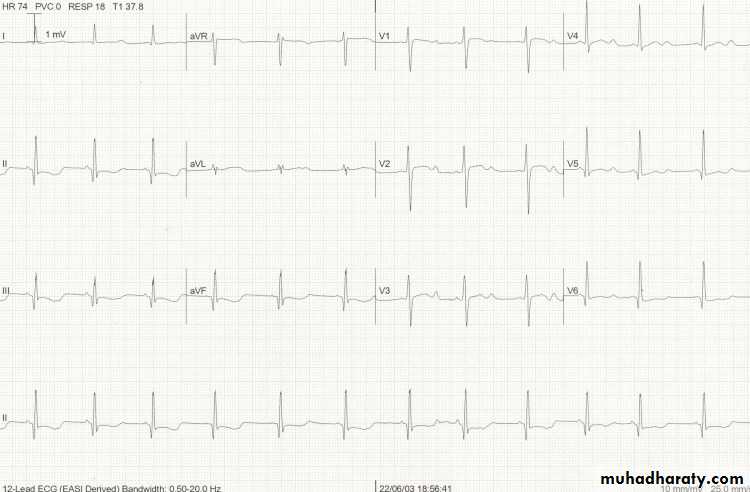
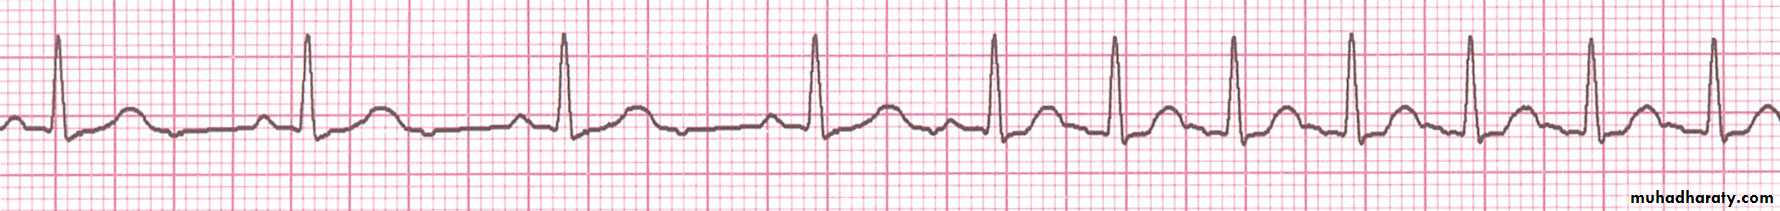
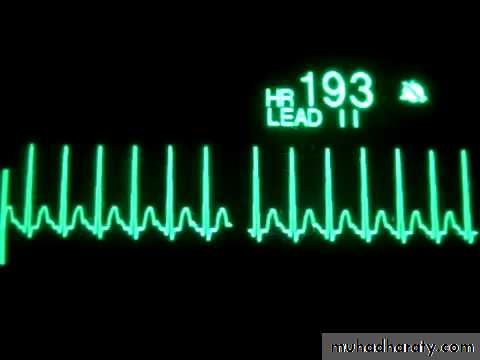
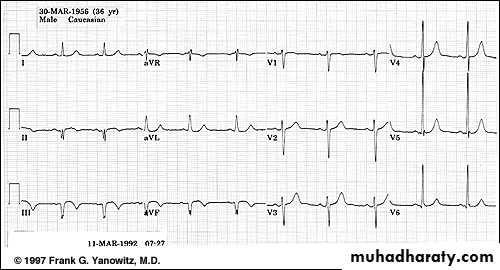
130 bpmRate?
Regularity?
regular
normal
0.08 s
P waves?
PR interval?
0.16 s
QRS duration?
Interpretation?
Sinus Tachycardia
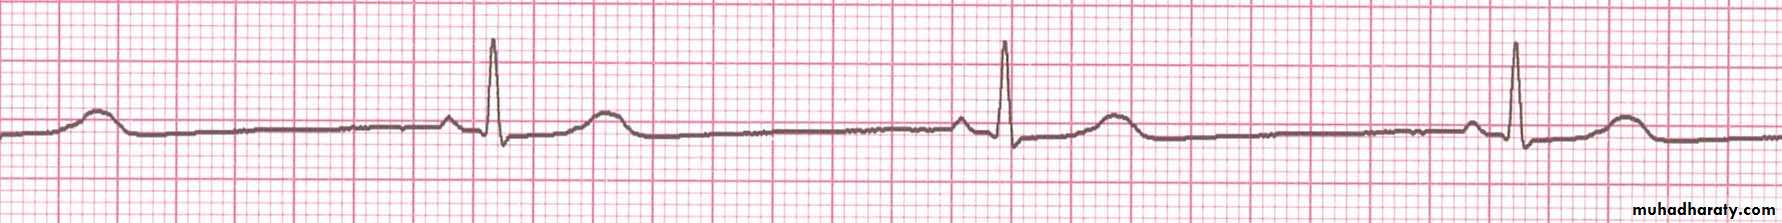
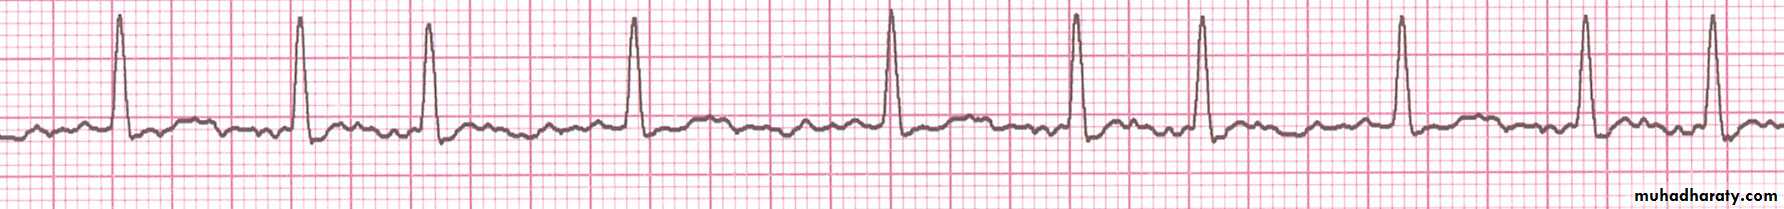
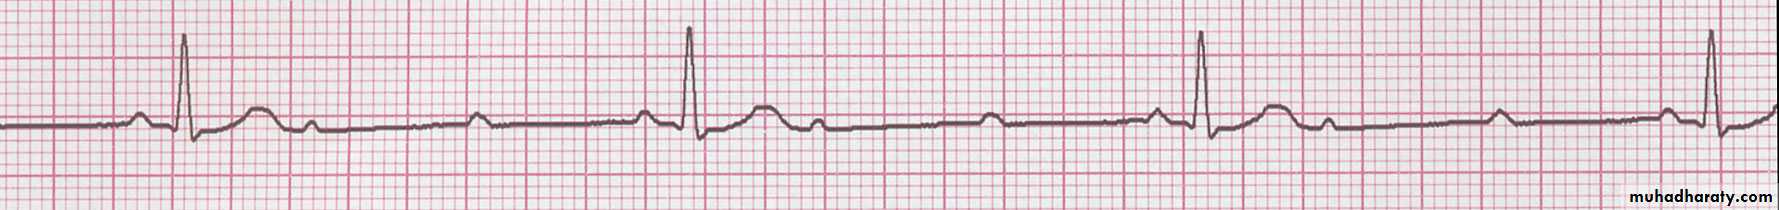
Rhythm
30 bpmRate?
Regularity?
regular
normal
0.10 s
P waves?
PR interval?
0.12 s
QRS duration?
Interpretation?
Sinus Bradycardia
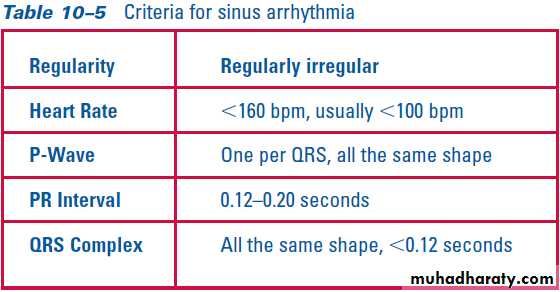
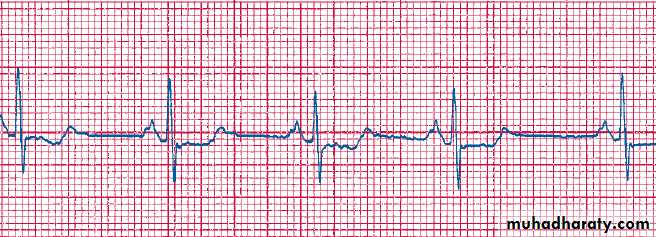
Sinus Arrhythmia
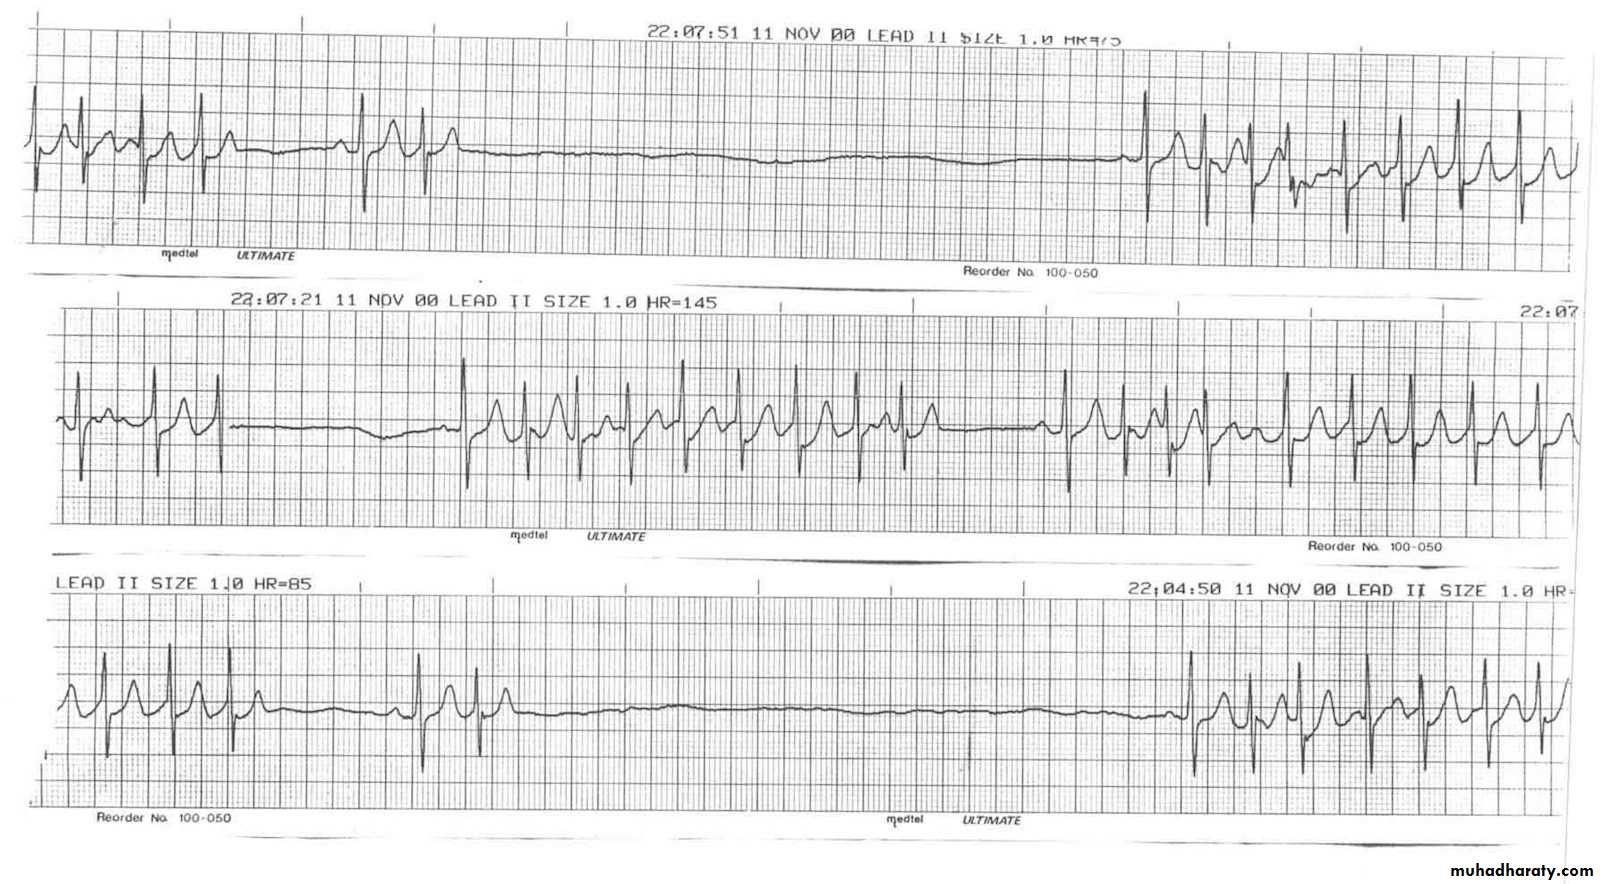
Sick Sinus Syndrome(SSS)
Supraventricular Arrhythmias
Atrial TachycardiaAtrial Fibrillation
Atrial Flutter
Paroxysmal Supraventricular Tachycardia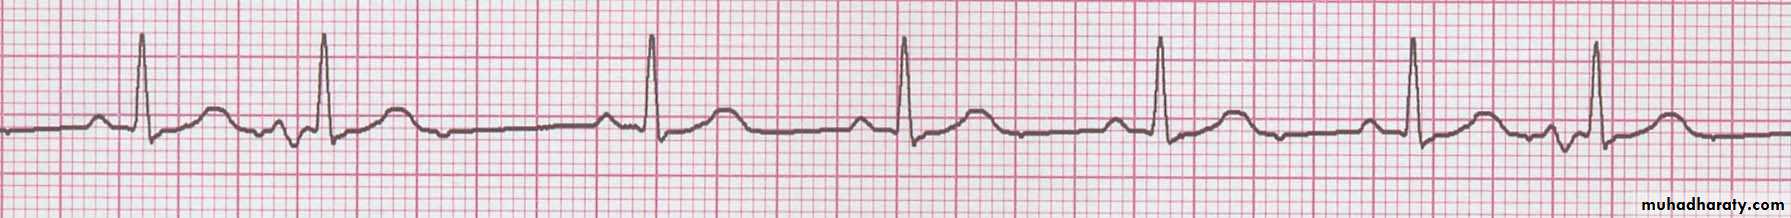
Rhythm
70 bpm
Rate?
Regularity?
occasionally irreg.
2/7 different contour
0.08 s
P waves?
PR interval?
0.14 s (except 2/7)
QRS duration?
Interpretation?
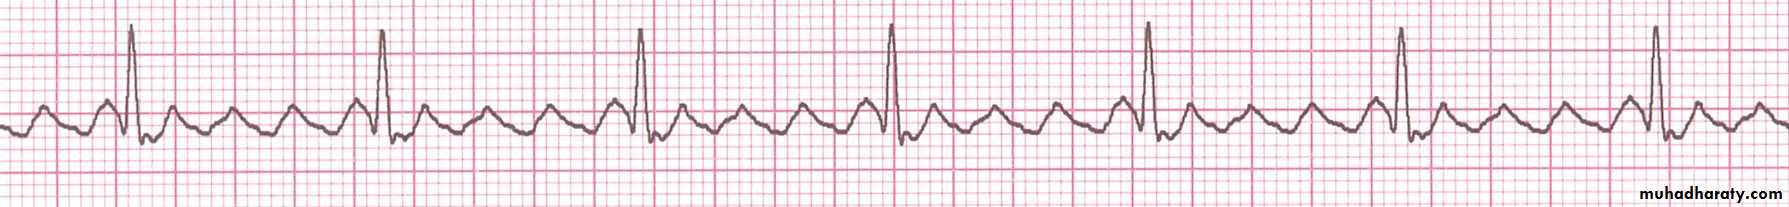
NSR with Premature Atrial Contractions
Premature Atrial Contractions
Deviation from NSRThese ectopic beats originate in the atria (but not in the SA node), therefore the contour of the P wave, the PR interval, and the timing are different than a normally generated pulse from the SA node.
Premature Atrial Contraction
Atrial Tachycardia
Rhythm
100 bpmRate?
Regularity?
irregularly irregular
none
0.06 s
P waves?
PR interval?
none
QRS duration?
Interpretation?
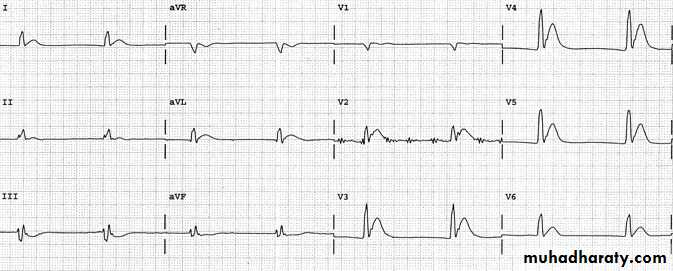
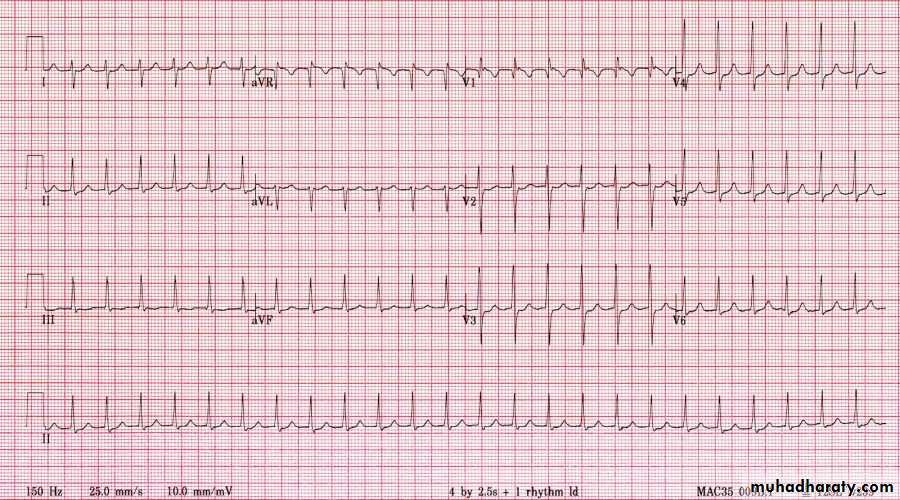
Atrial Fibrillation
Atrial Fibrillation
Deviation from NSRNo organized atrial depolarization, so no normal P waves (impulses are not originating from the sinus node).
Atrial activity is chaotic (resulting in an irregularly irregular rate).
Common, affects 2-4%, up to 5-10% if > 80 years old
Atrial Fibrillation
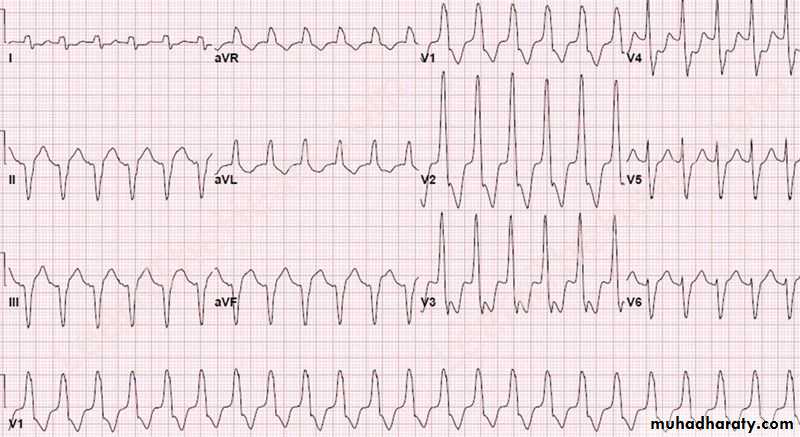
Rhythm
70 bpmRate?
Regularity?
regular
flutter waves
0.06 s
P waves?
PR interval?
none
QRS duration?
Interpretation?
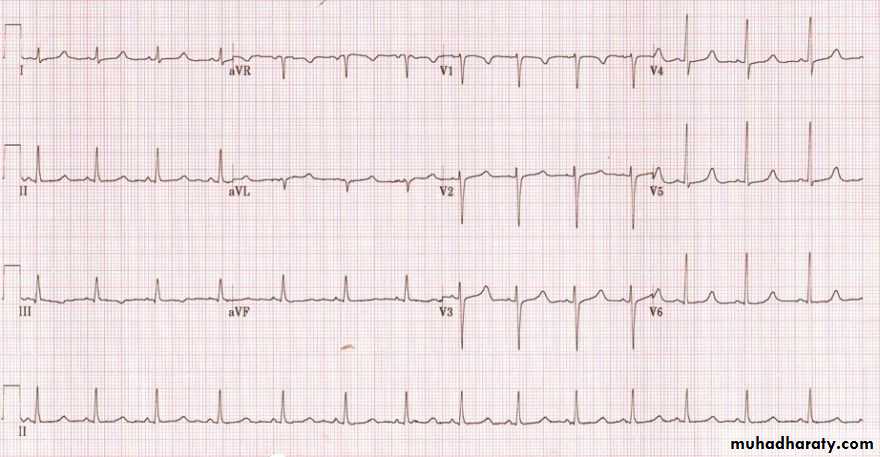
Atrial Flutter
Atrial Flutter 4:1 block
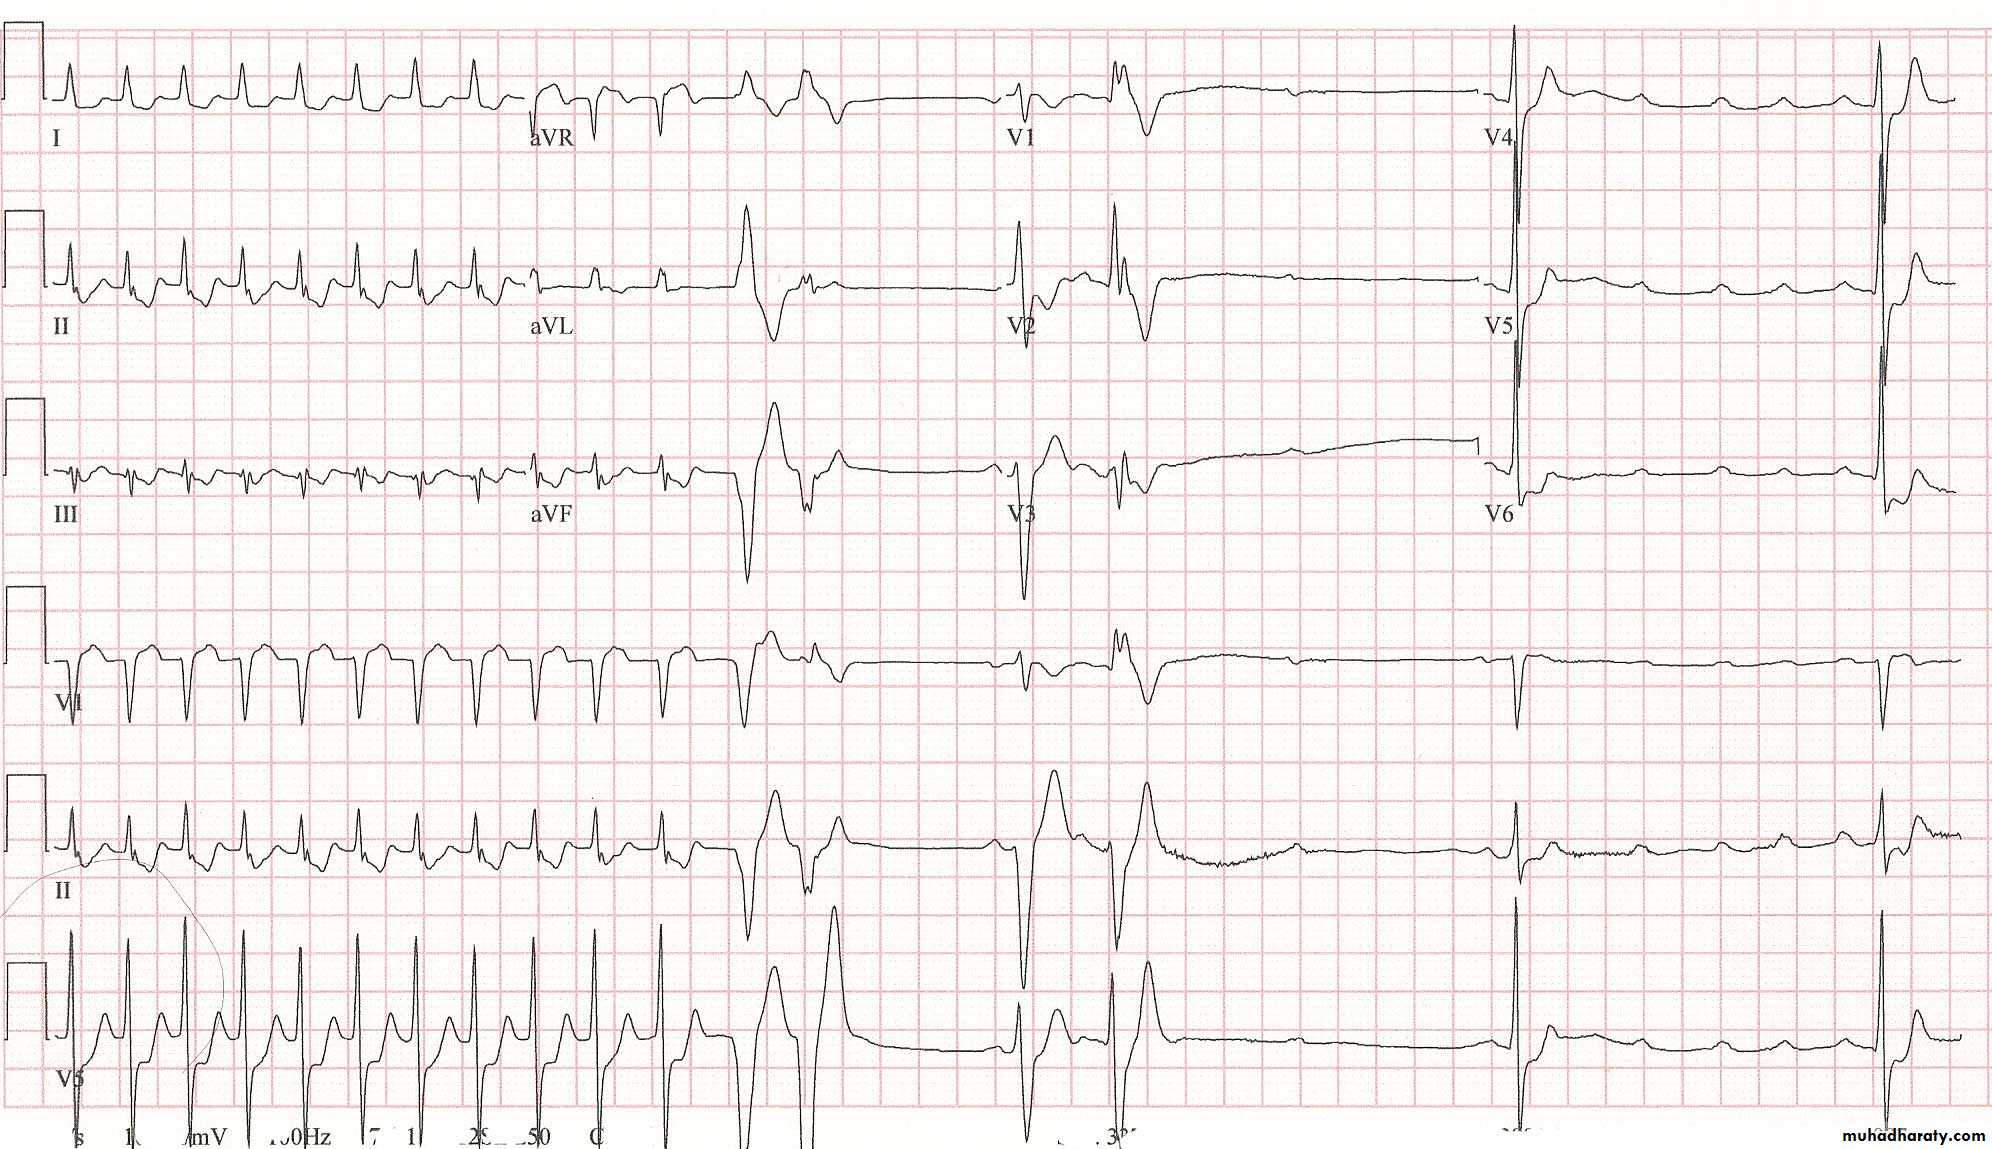
Rhythm
74 148 bpmRate?
Regularity?
Regular regular
Normal none
0.08 s
P waves?
PR interval?
0.16 s none
QRS duration?
Interpretation?
Paroxysmal Supraventricular Tachycardia (PSVT)
PSVT
Deviation from NSR
The heart rate suddenly speeds up, often triggered by a PAC (not seen here) and the P waves are lost.PSVT
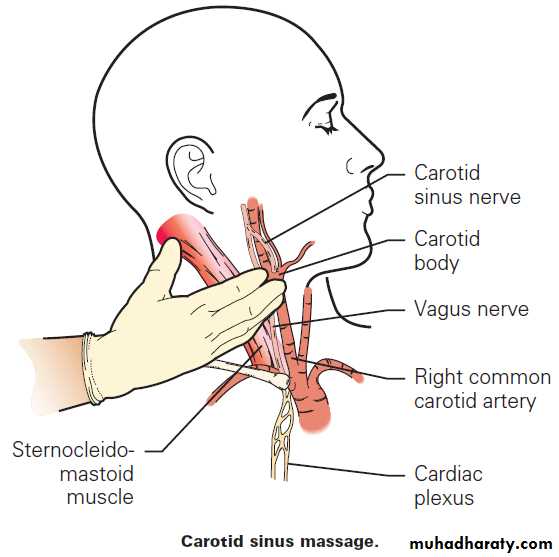
Effect of Adenosine
Effect of Adenosine
Ventricular Arrhythmias
Premature Ventricular ContractionsVentricular Tachycardia
Ventricular Fibrillation
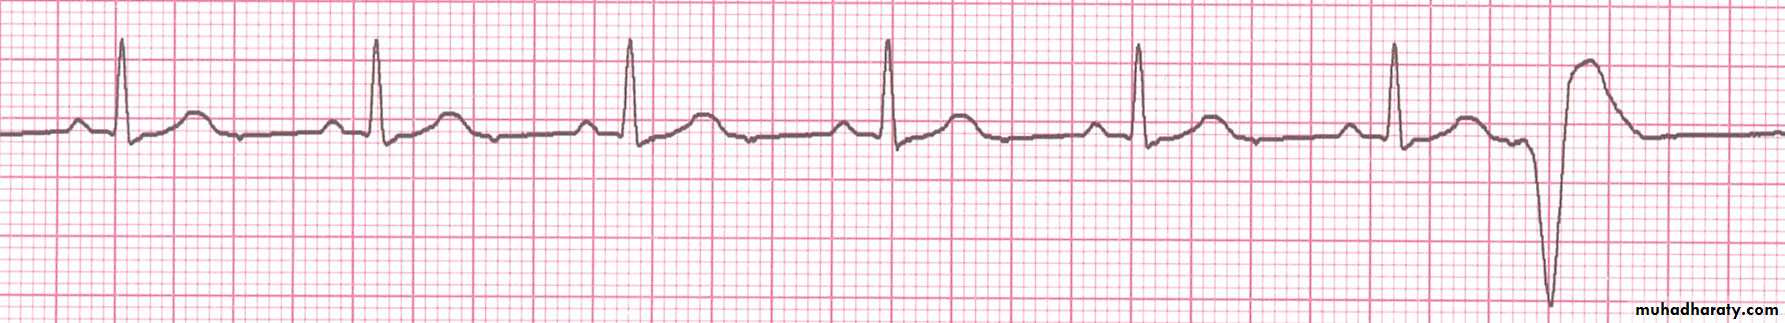
Rhythm
60 bpmRate?
Regularity?
occasionally irreg.
none for 7th QRS
0.08 s (7th wide)
P waves?
PR interval?
0.14 s
QRS duration?
Interpretation?
Sinus Rhythm with 1 PVC
92
Ventricular Bigeminy
Normal
VPCVPC
Normal
Rhythm
160 bpmRate?
Regularity?
regular
none
wide (> 0.12 sec)
P waves?
PR interval?
none
QRS duration?
Interpretation?
Ventricular Tachycardia
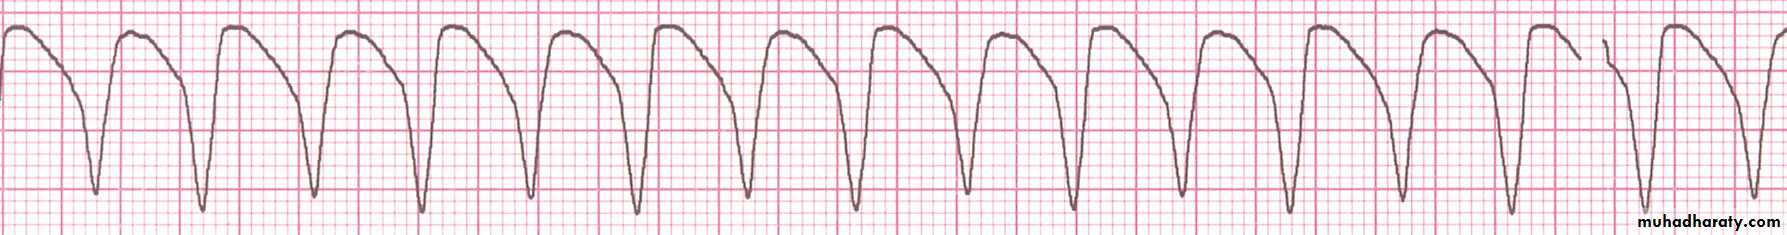
Ventricular Tachycardia
Deviation from NSRImpulse is originating in the ventricles (no P waves, wide QRS).
VT
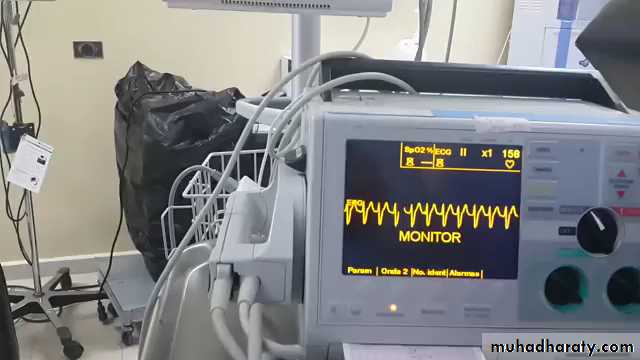
Rhythm
noneRate?
Regularity?
irregularly irreg.
none
wide, if recognizable
P waves?
PR interval?
none
QRS duration?
Interpretation?
Ventricular Fibrillation
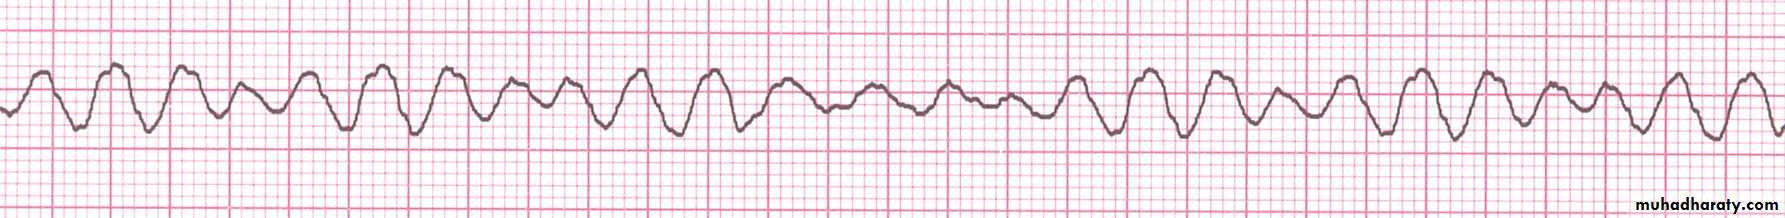
Ventricular Fibrillation
Deviation from NSRCompletely abnormal.
Asystole
AV Nodal Blocks
1st Degree AV Block2nd Degree AV Block, Type I
2nd Degree AV Block, Type II3rd Degree AV Block
Rhythm
60 bpm
Rate?
Regularity?
regular
normal
0.08 s
P waves?
PR interval?
0.36 s
QRS duration?
Interpretation?
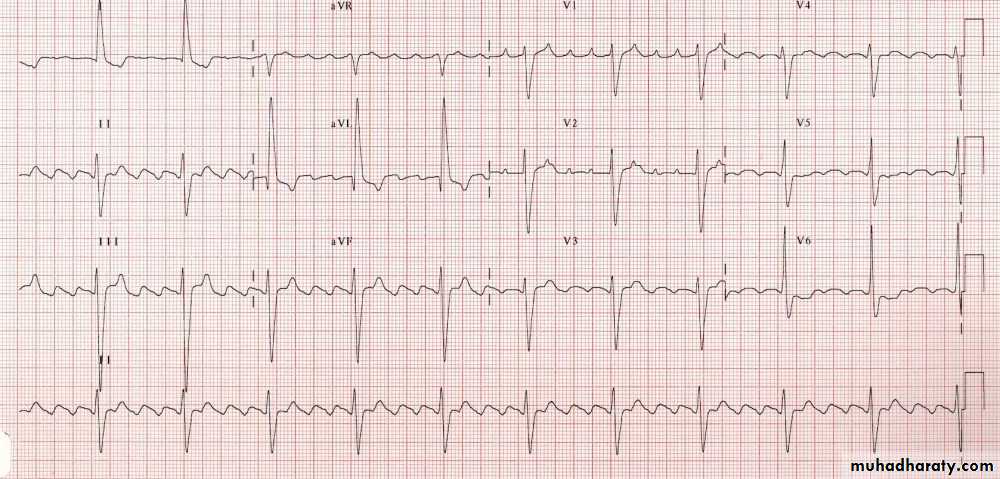
1st Degree AV Block
1st Degree AV Block
Etiology: Prolonged conduction delay in the AV node or Bundle of His.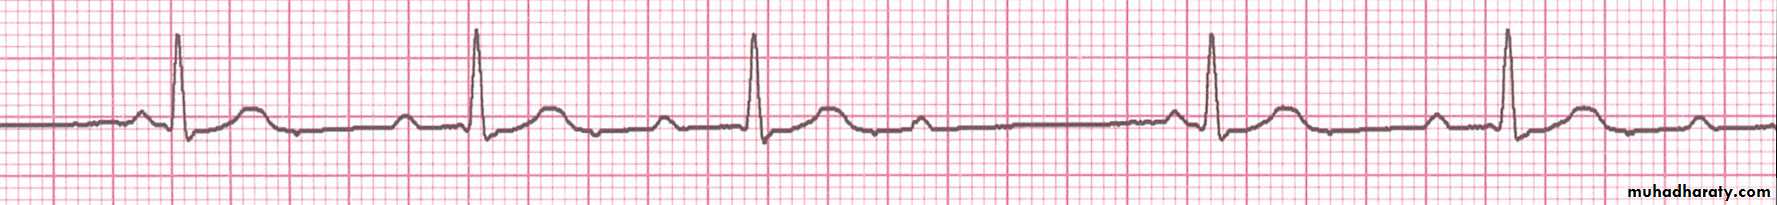
Rhythm
50 bpmRate?
Regularity?
regularly irregular
nl, but 4th no QRS
0.08 s
P waves?
PR interval?
lengthens
QRS duration?
Interpretation?
2nd Degree AV Block, Type I
2nd Degree AV Block, Type II
Deviation from NSR
Occasional P waves are completely blocked (P wave not followed by QRS).
Rhythm
40 bpmRate?
Regularity?
regular
nl, 2 of 3 no QRS
0.08 s
P waves?
PR interval?
0.14 s
QRS duration?
Interpretation?
2nd Degree AV Block, Type II
3rd Degree AV Block
Deviation from NSRThe P waves are completely blocked in the AV junction; QRS complexes originate independently from below the junction.
Rhythm
40 bpmRate?
Regularity?
regular
no relation to QRS
wide (> 0.12 s)
P waves?
PR interval?
none
QRS duration?
Interpretation?
3rd Degree AV Block
Complete RBBB
Complete LBBB
108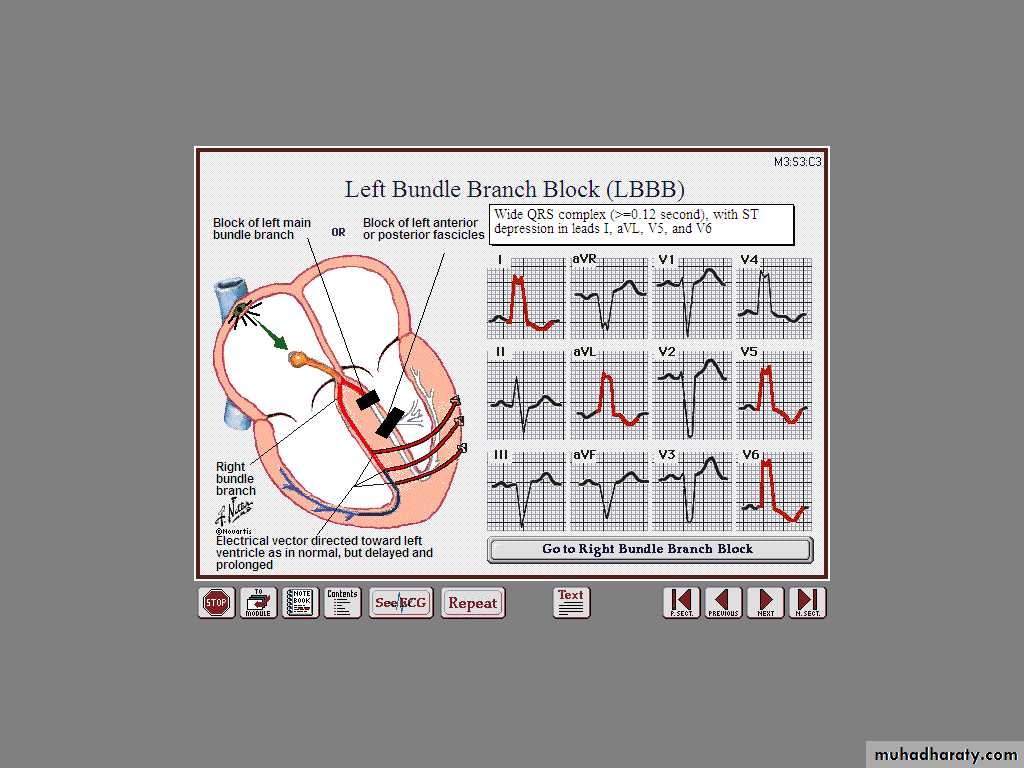
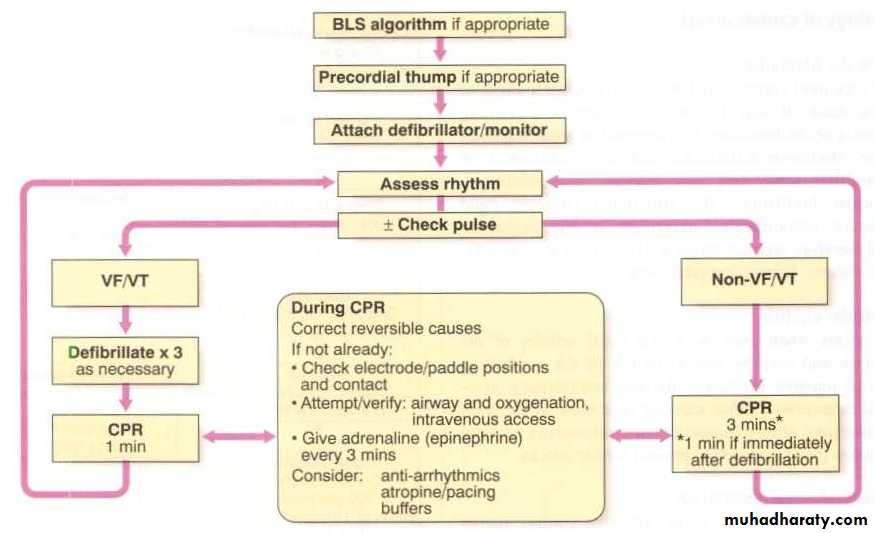
CPR
DC Cardioversion


Acute coronary syndrome
ACUTE CORONARY SYNDROMESNo ST Elevation
ST Elevation
Unstable Angina
NSTEMI STEMI
Myocardial Infarction
NSTEMI
Pathogenesis of ACS
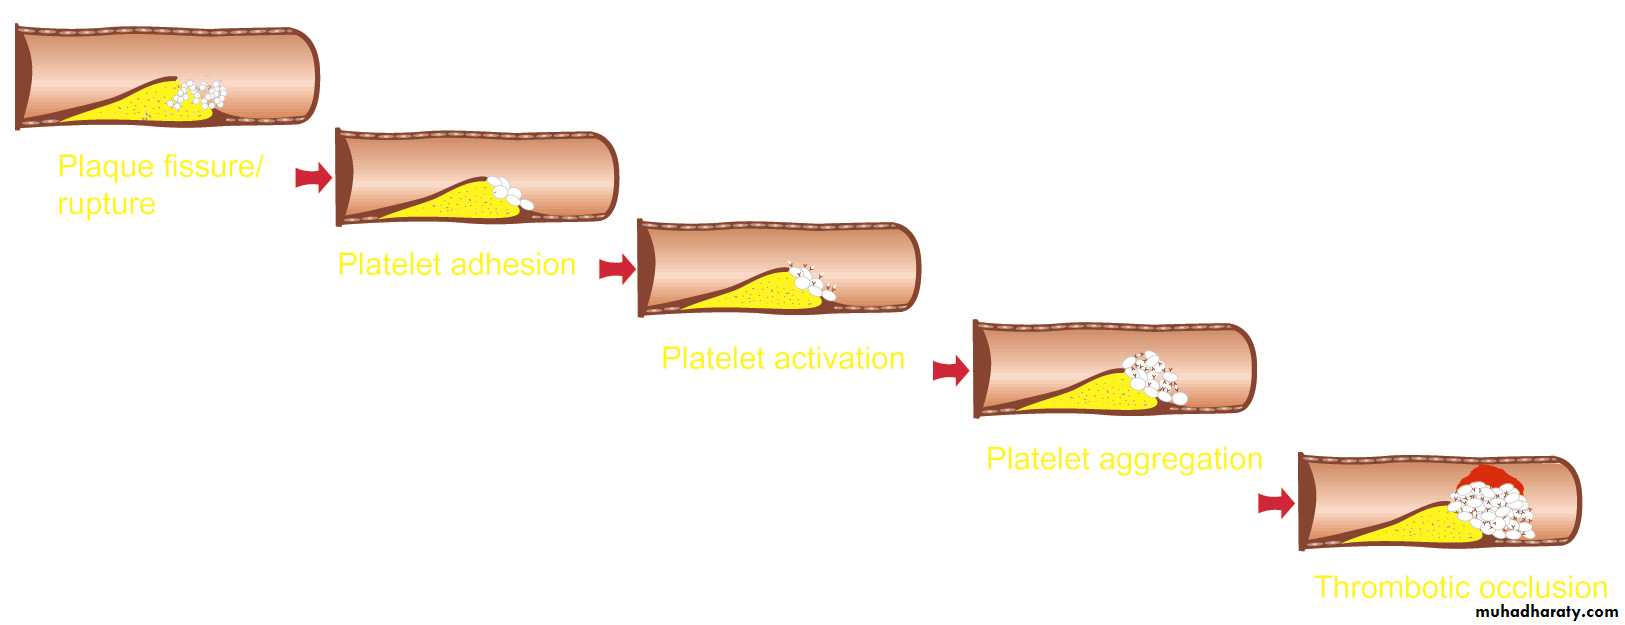
Sequence of events
Plaque Rupture
Platelet Adhesion
Platelet Activation
Platelet Aggregation
Thrombotic Occlusion
Anti-platelet drugs
Platelet rupture
Platelet Adhesion
Platelet Activation
Platelet Aggregation
Thrombotic Occlusion
MI
Thrombus Formation and ACS
UANSTEMI
Plaque Disruption/Fissure/Erosion
Thrombus Formation
Non-ST-Segment Elevation Acute Coronary Syndrome (ACS)ST-Segment Elevation Acute Coronary Syndrome (ACS)
Terminology:
High Serum Troponin
Ischemia and Infarction
118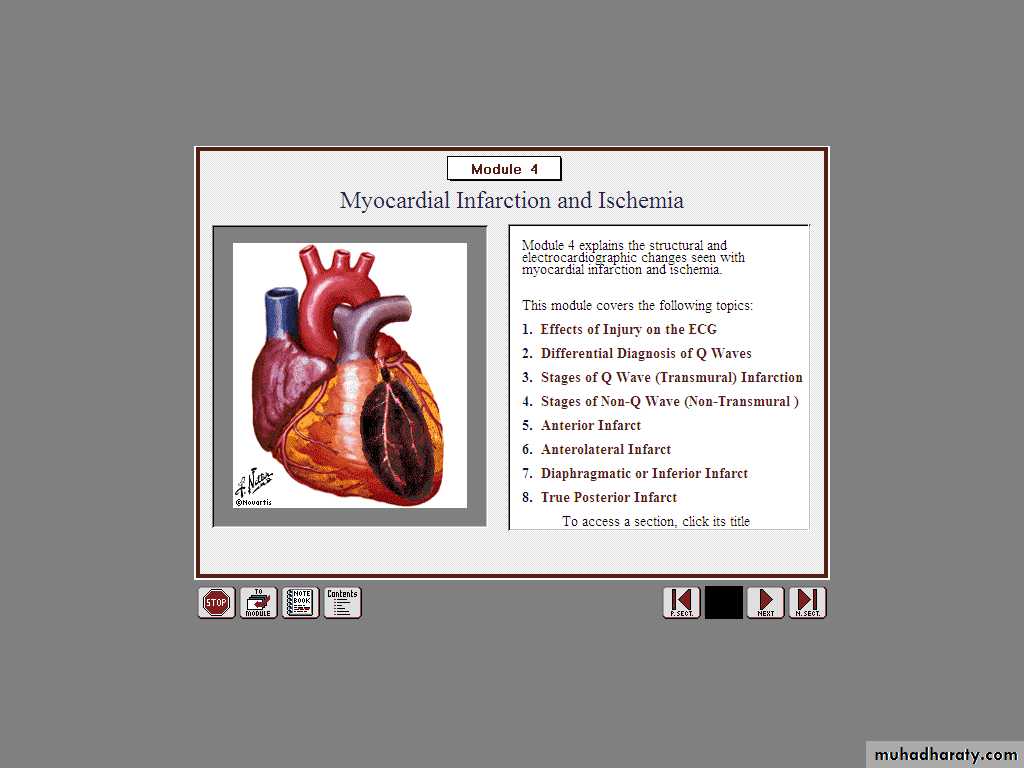
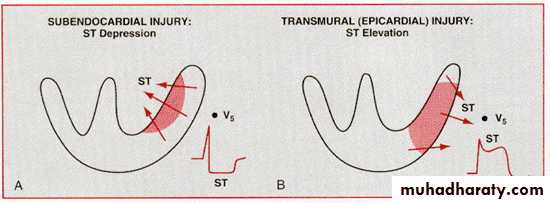
TRANSMURAL Injury ST Elevation
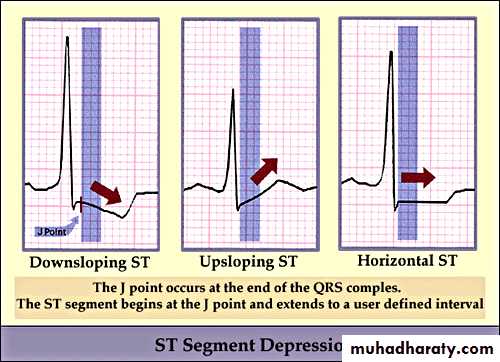
ST Segment Depression
• Upward sloping depression of ST segment is not indicative of IHD• It is called J point depression or sagging ST seg
• Downward slopping or Horizontal depression of ST segment leading to T↓is significant of IHD
119
ST depression
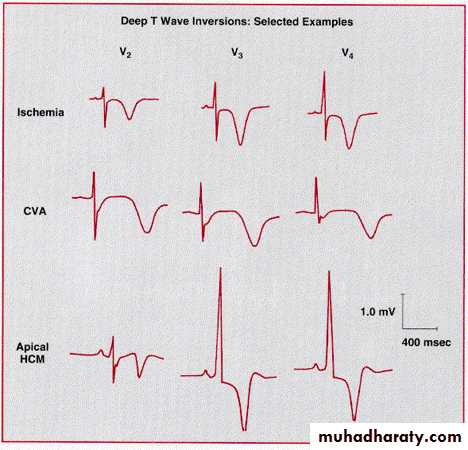
Deep symmetric inverted T waves
In more than 2 precardial leads85% of the patients with such T wave↓had > 75% stenosis of the coronary artery
T wave ↓are significantly associated with MI or death during follow up
T Wave Inversion
Stages of STEMI
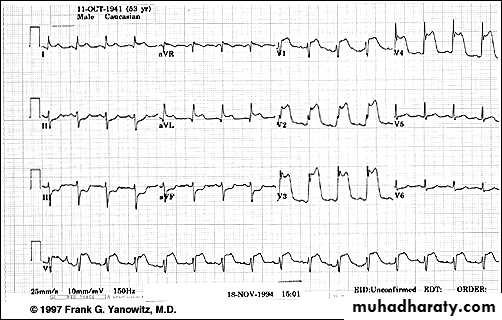
ST elevation
Arrangement of Leads on the EKG
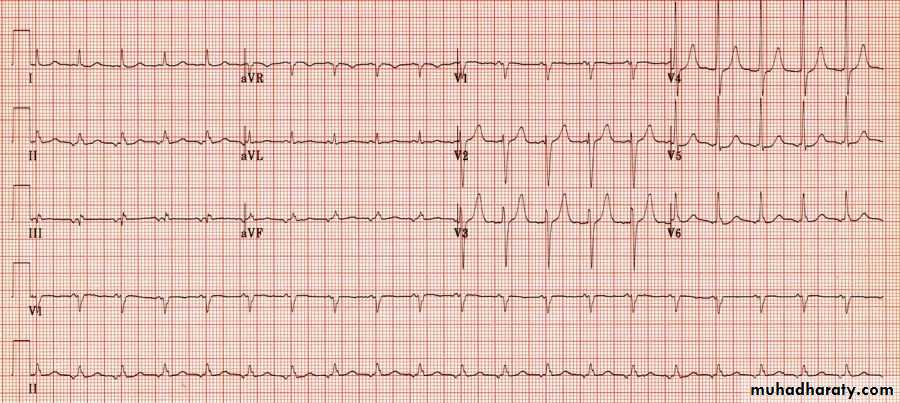
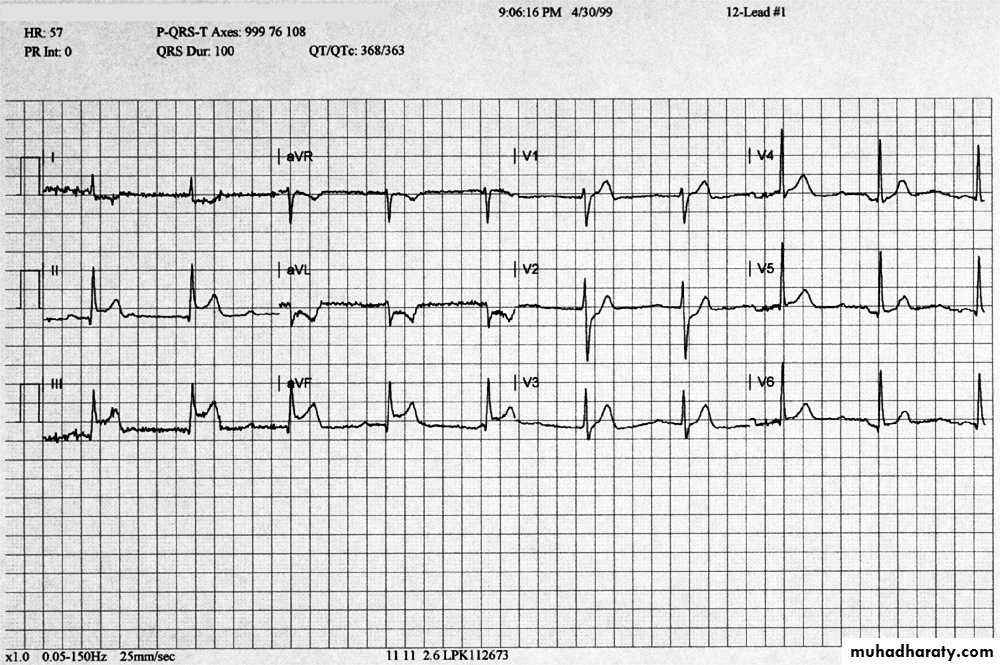
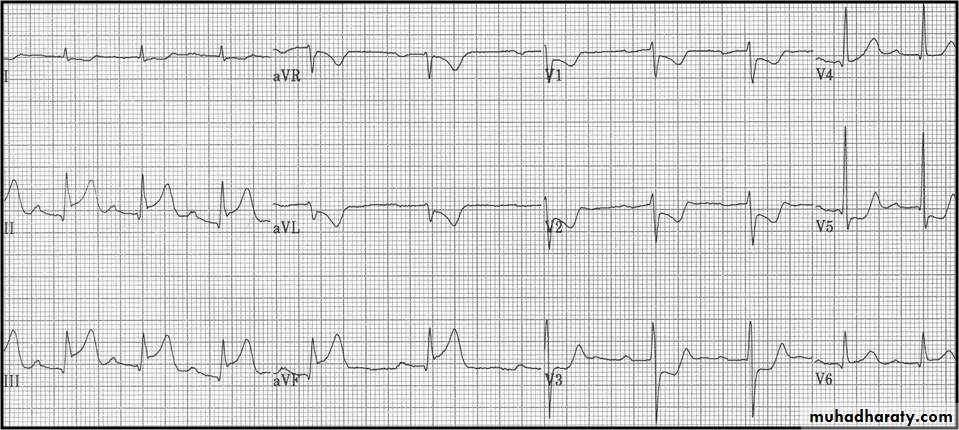
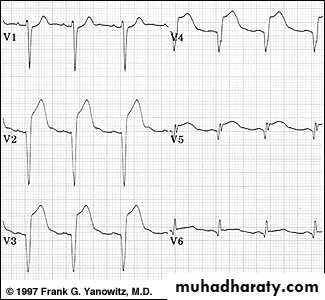
Acute Anterior MI
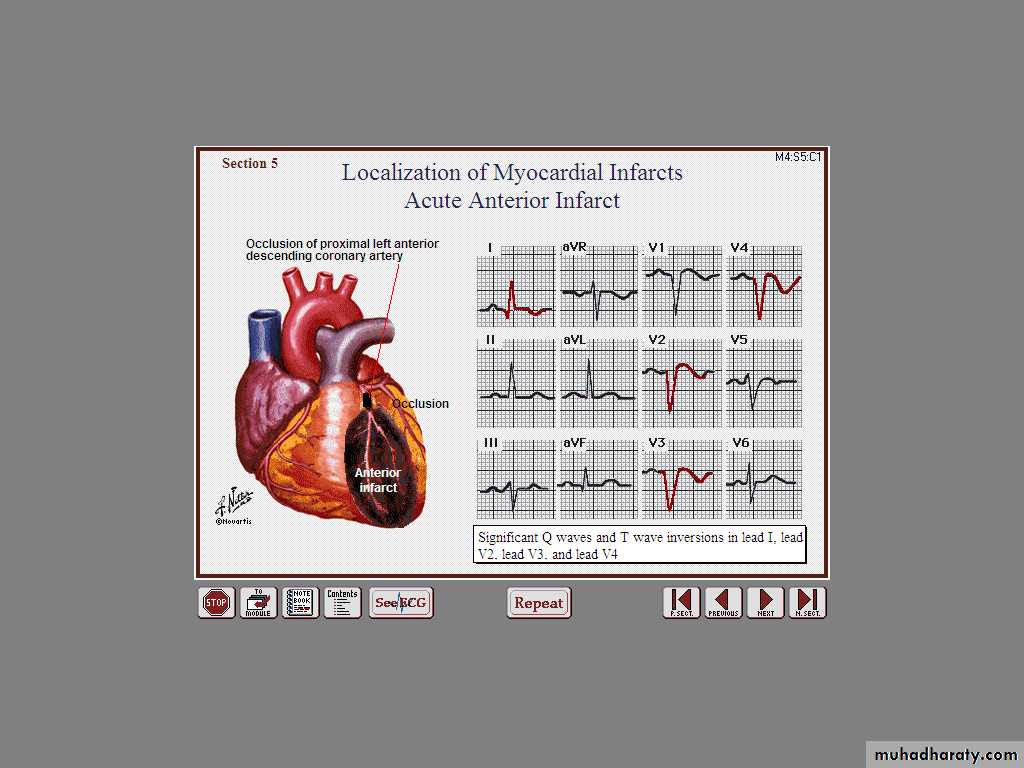
Very Striking
127
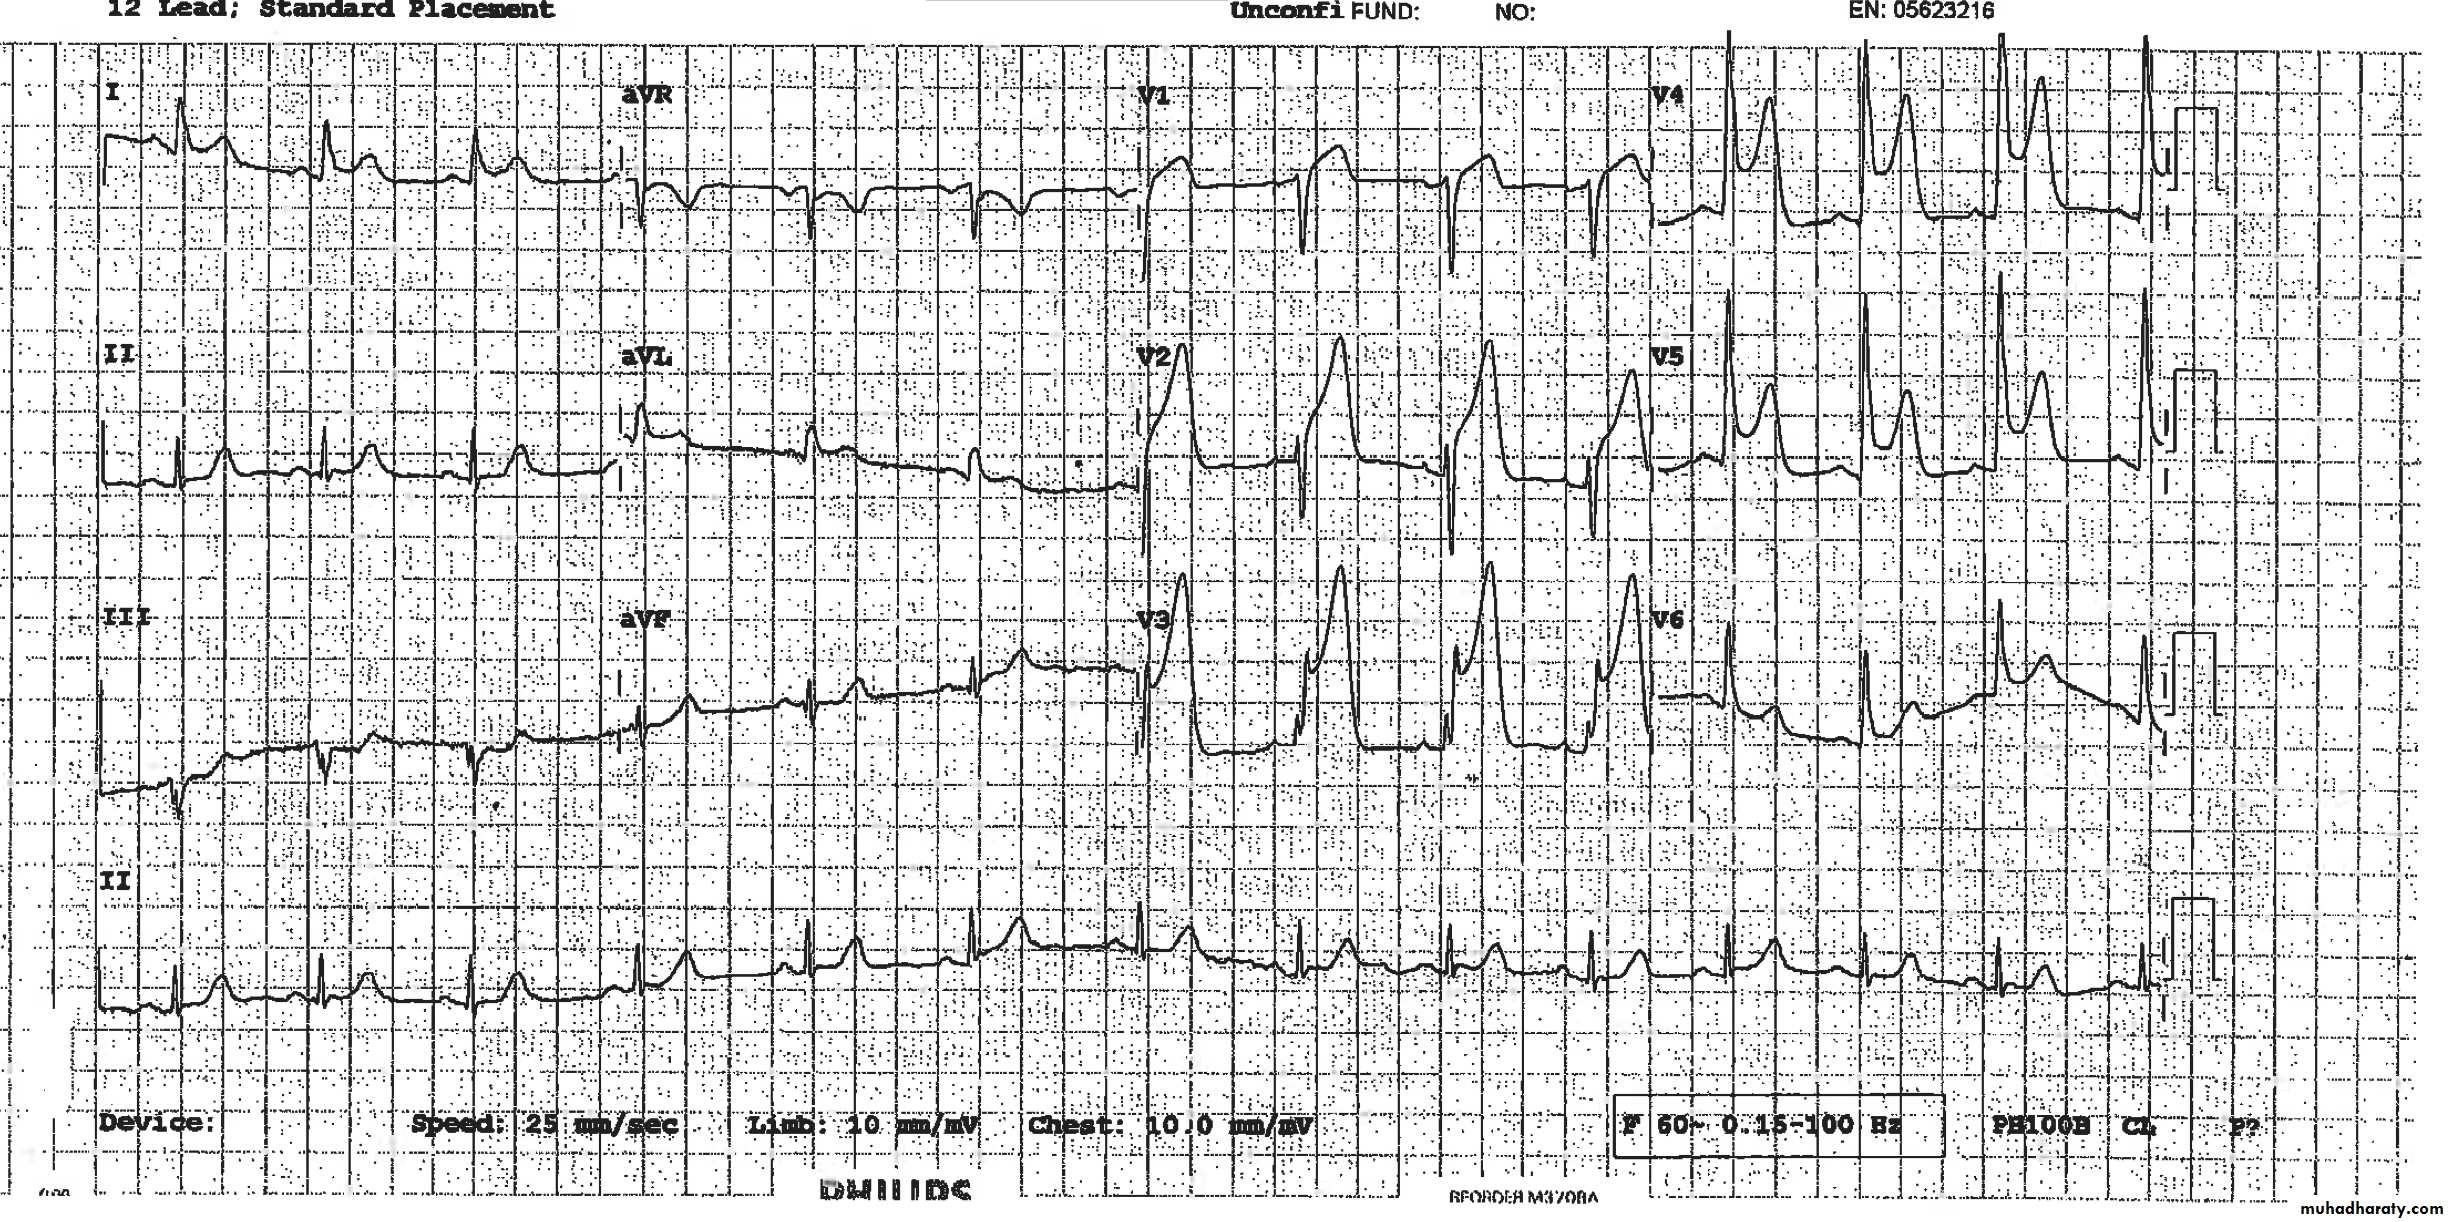
Acute Antero-Lateral MI

128
Severe Chest Pain – Why ?
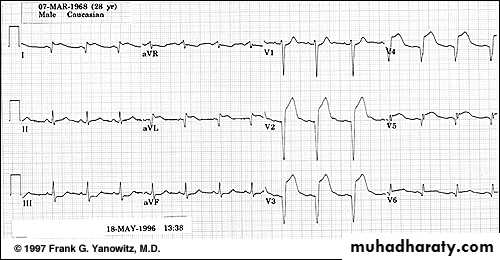
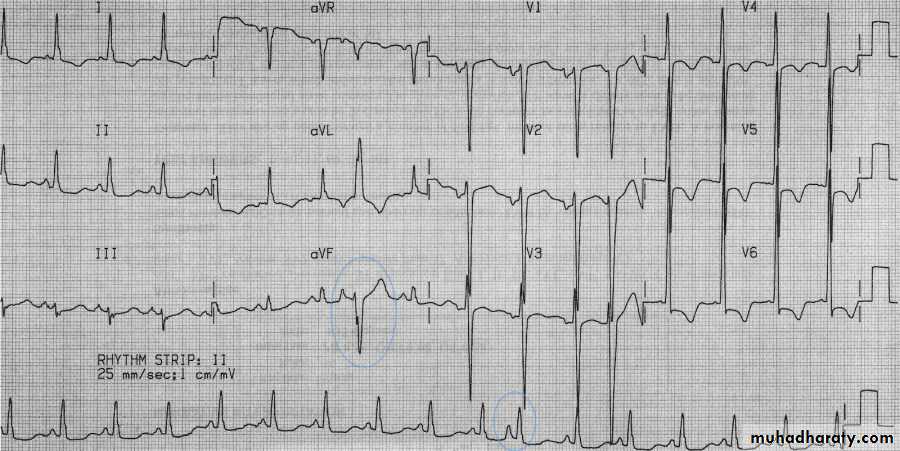
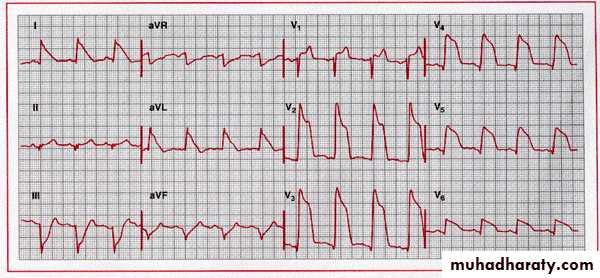
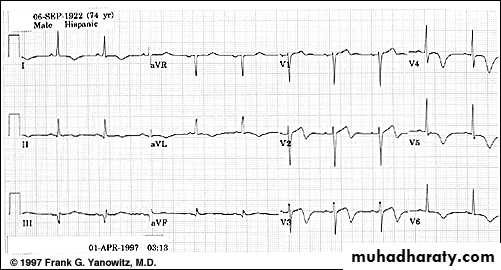
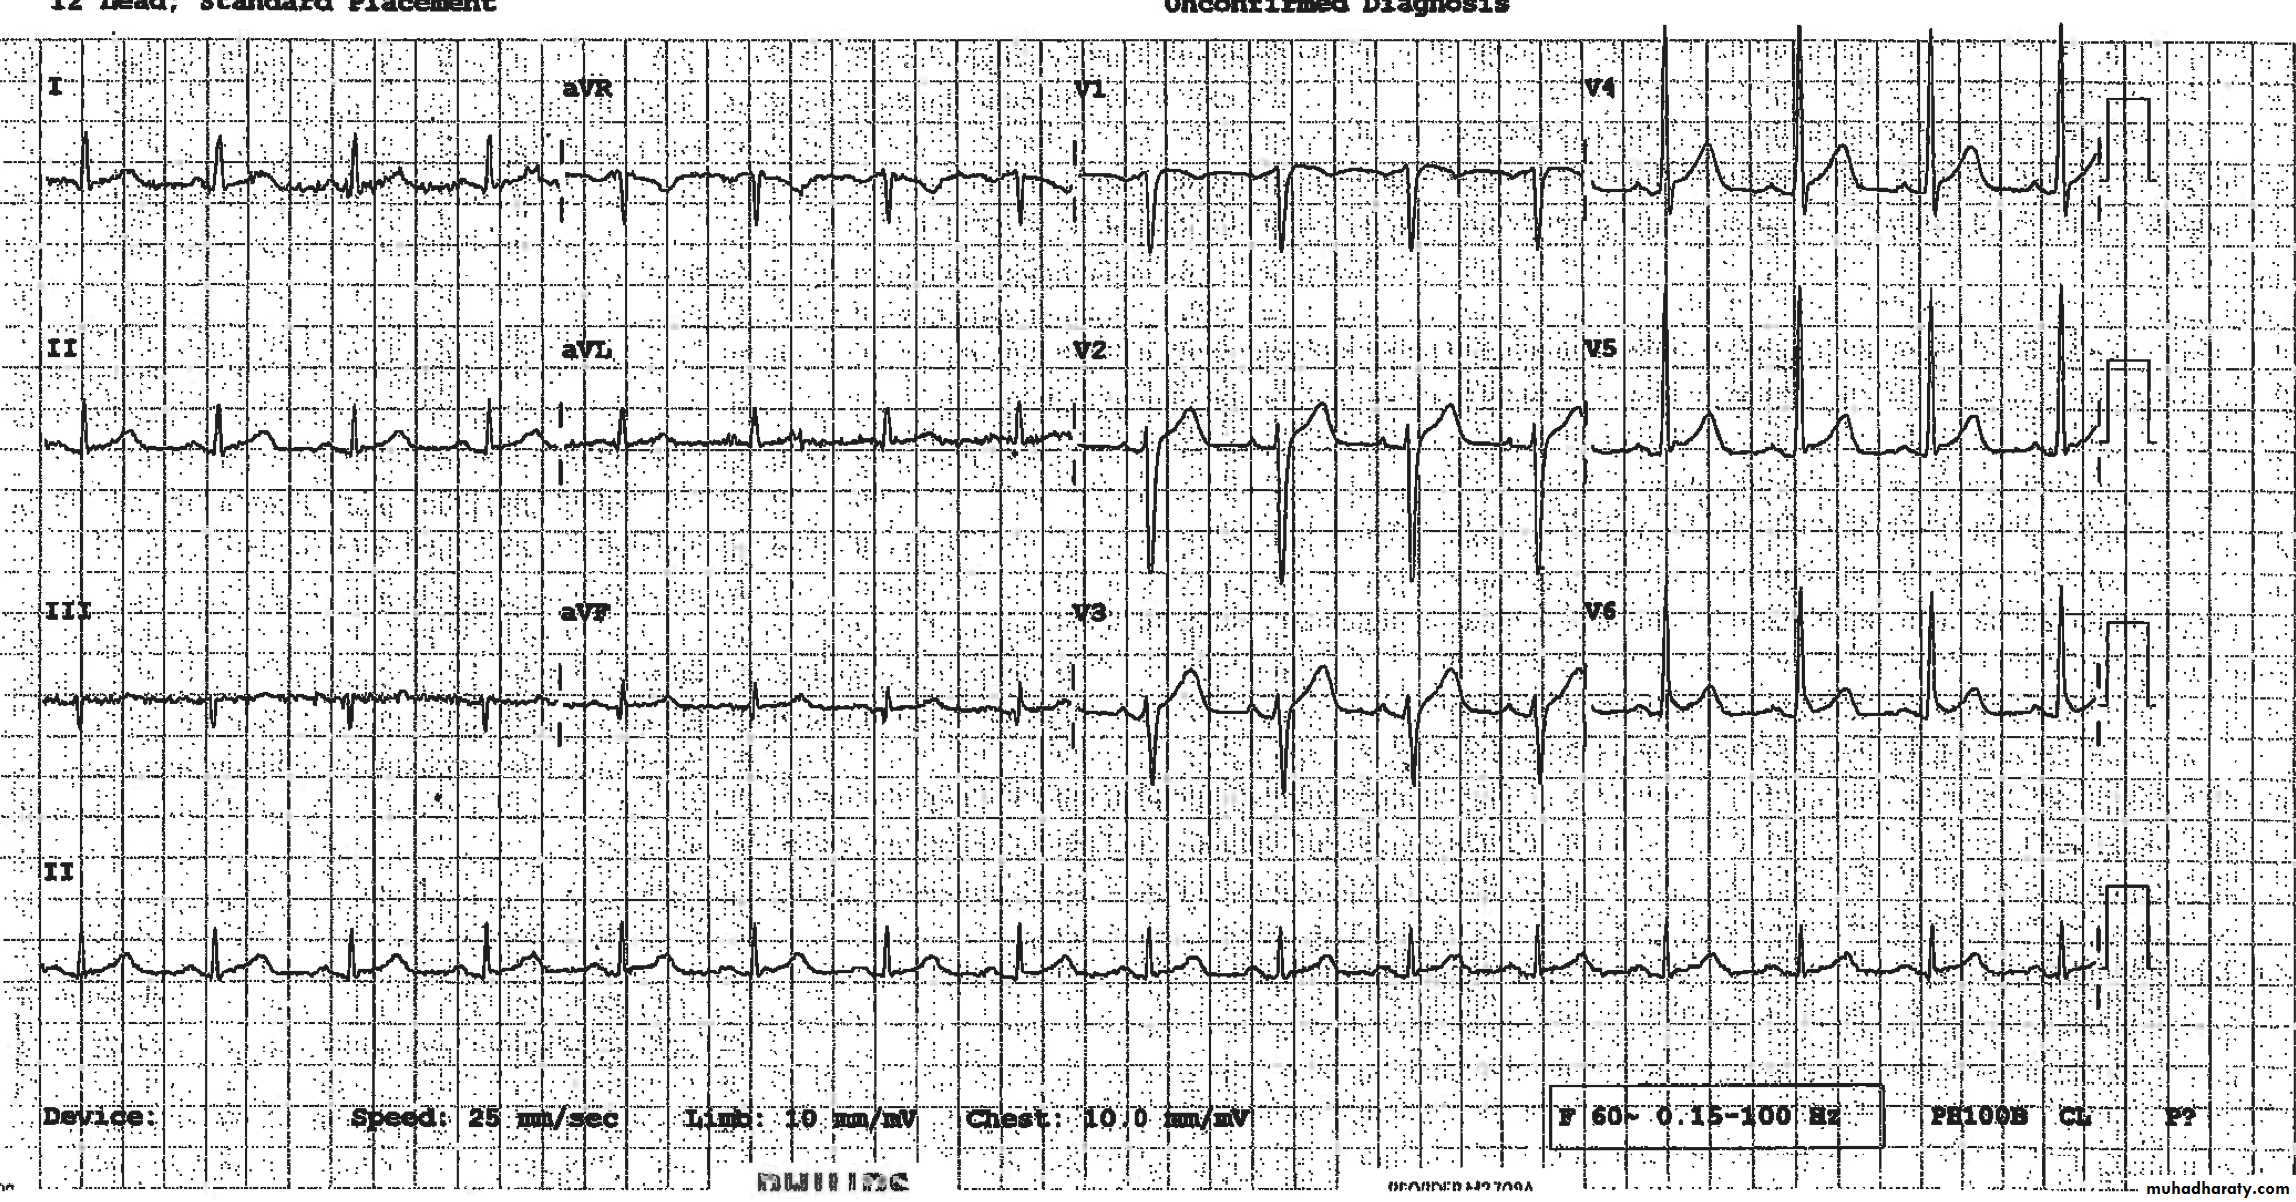
Acute Inferior wall MI
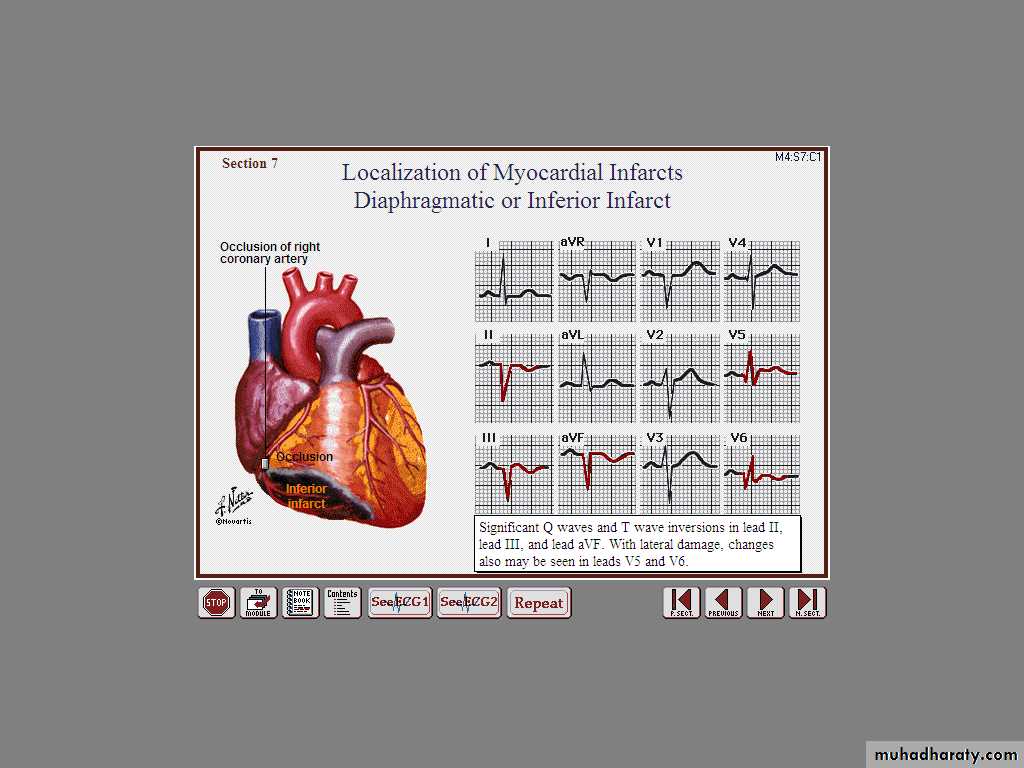
130
What is striking ?
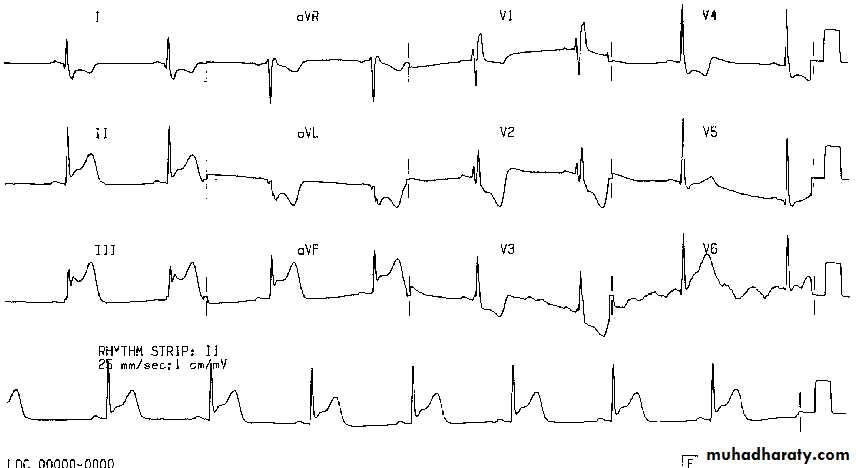
Acute Inf Post
131
Where are the ST ↑ ?
Inf Lysed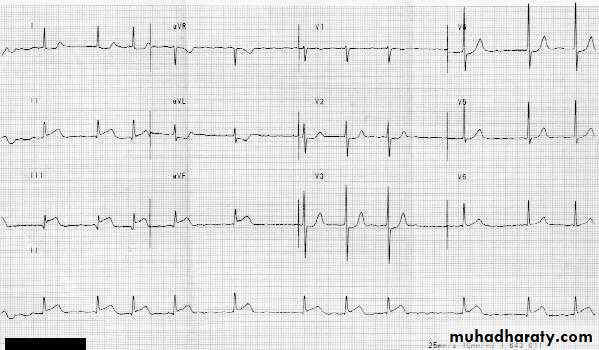
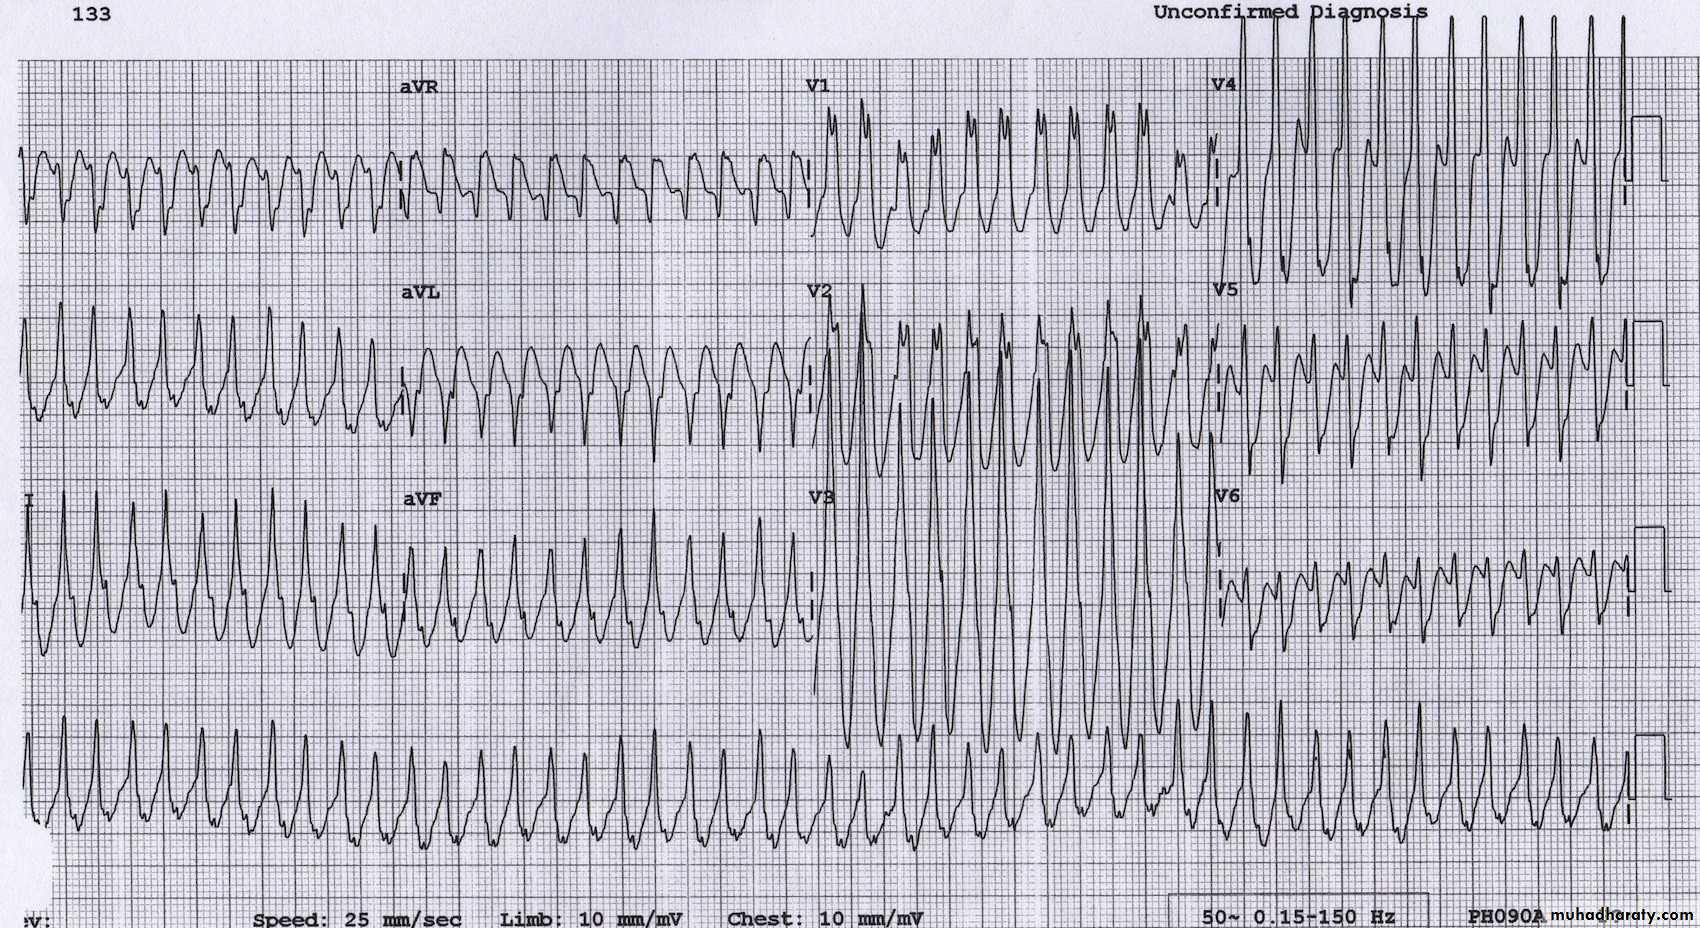
Acute ST segment elevation
Reciprocal ST segment depression133
What changes we see ?
134
Why Acute changes disappeared ?
r TPA
135
Guess How Old is this MI !
136
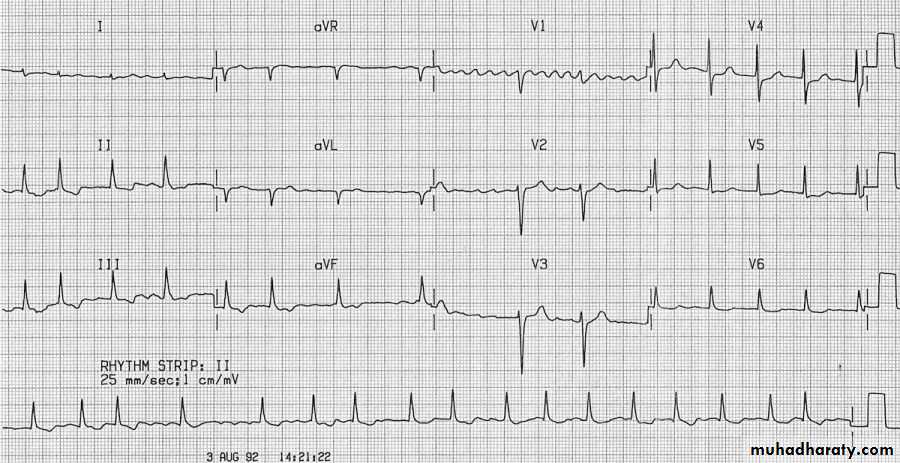
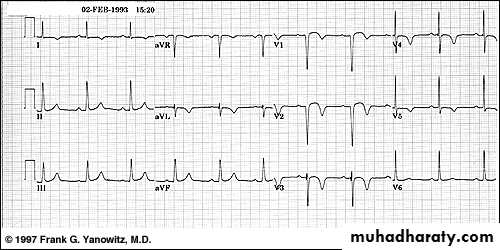
Acute True Posterior MI
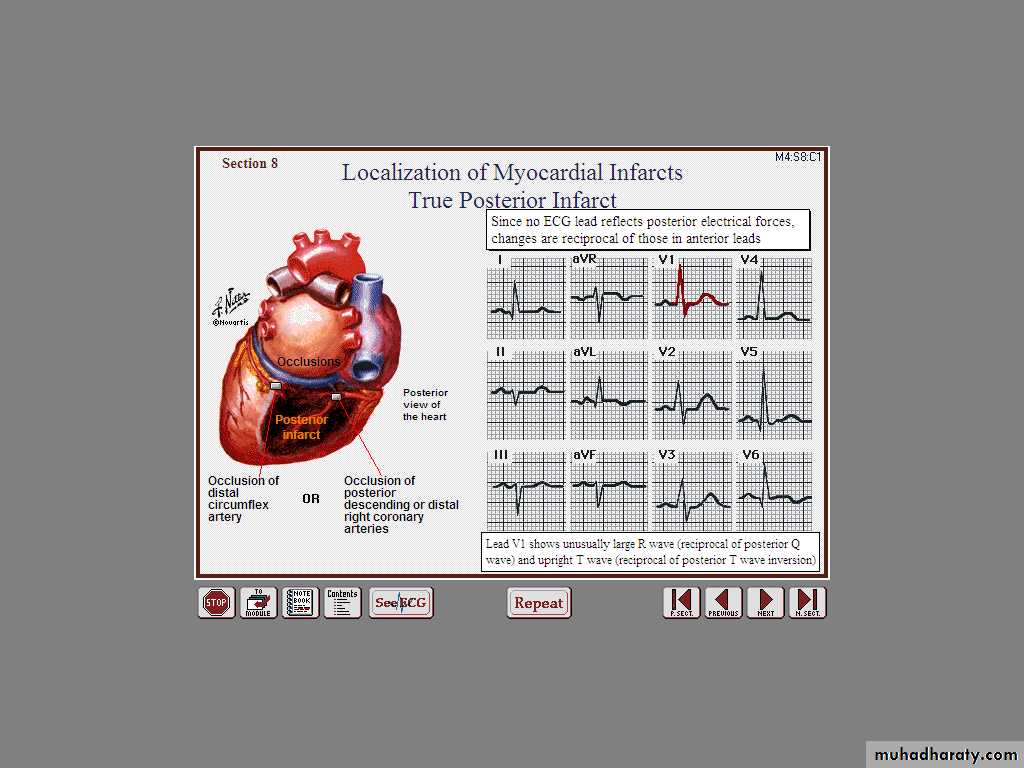
137
Decipher V1, V2, V3
Identify the Double wall MI
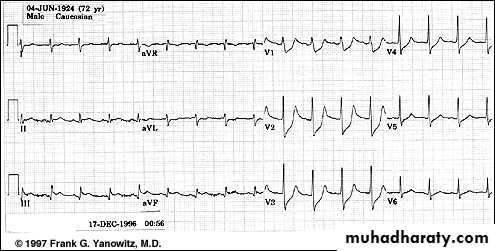
Inferior STEMI + Hypotension = ??
Next ??
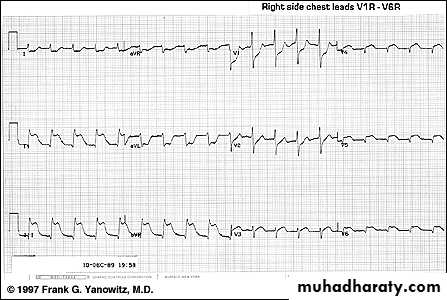
Look at the Right Chest Leads
R
R
R
R
R
R
Normal initial ECG exclude STEMI??
23 min. later
1 hr post revascularization