Community
Odds ratio examples
Dr.Mohammed 2015-12-05
Page | 1
Example
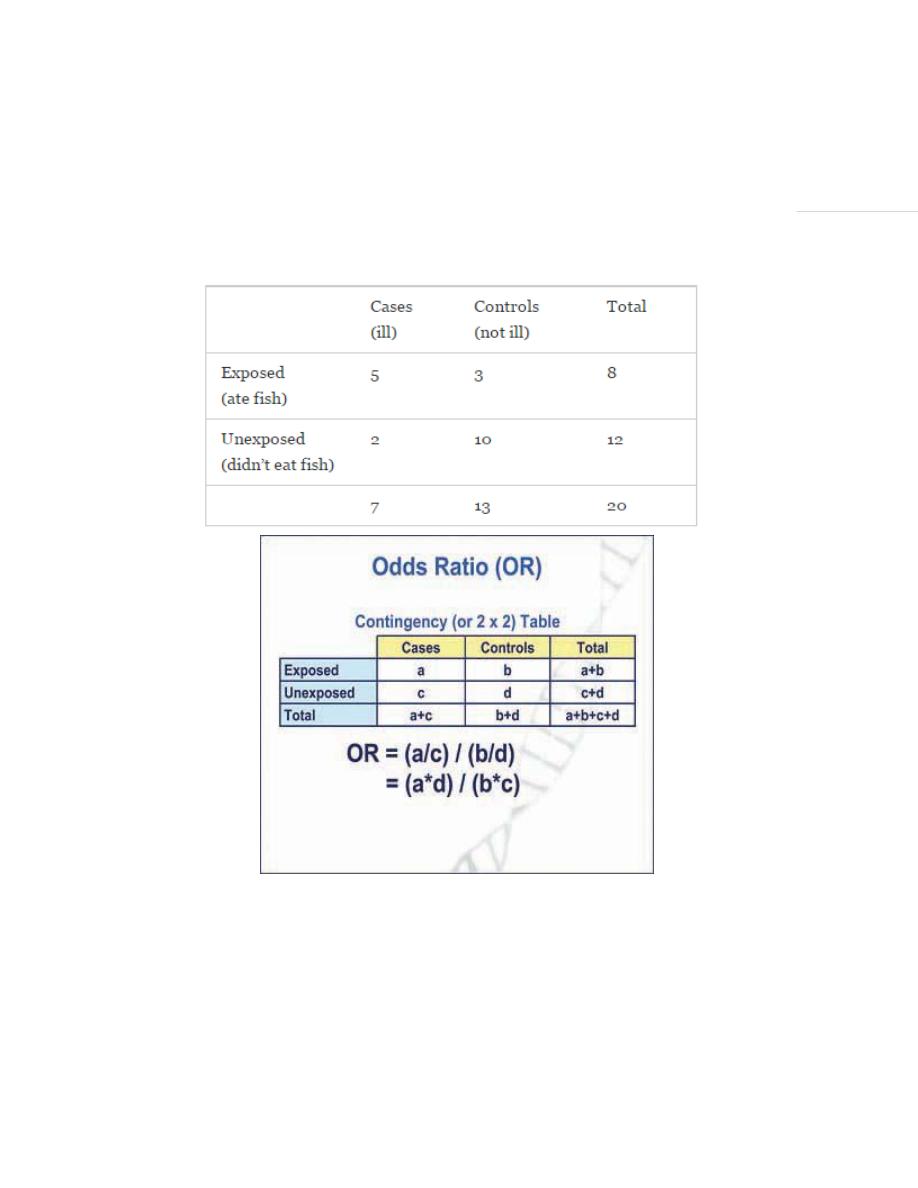
A group of 20 friends went out to the pub – the next day a 7 were ill. They suspect that
it may have been something they ate, maybe the fish casserole… here are the numbers:
Answer:
Odds Ratio = a*d/ b*c = 50/6 = 8.33
RR(Ie/In)= (5/8)/(2/12) = 5 we can’t apply this cause it’s cross sectional study.
Interpretation: What does this mean?(most important )

Community
Odds ratio examples
Dr.Mohammed 2015-12-05
Page | 2
OR of 1 would suggests that there is no difference between the groups;
i.e. there would be no association between the suggested exposure (fish) and the
outcome (being ill)
OR of > 1 suggests that the odds of exposure are positively associated with the adverse
outcome compared to the odds of not being exposed
OR of < 1 suggests that the odds of exposure are negatively associated with the adverse
outcomes compared to the odds of not being exposed. Potentially, there could be a
protective effect
In the example above, we can conclude that those who ate the fish casserole (exposure)
were 8.3 times more likely (OR = 8.3) to be ill (outcome), compared to those who did
not eat the fish casserole.
Advantages
Appropriate to analyze associations between groups from case-control and prevalent
(or cross-sectional) data.
For rare diseases (or diseases with long latency periods) the OR can be an approximate
measure to the RR (relative risk)
Doesn’t require denominator (i.e. total number in population) unlike measuring risk
Good method to estimate the strength of an association between exposures and
outcomes
Disadvantages
Association does not infer causation! *epidemiology golden rule*
Community
Odds ratio examples
Dr.Mohammed 2015-12-05
Page | 3
Example 2
Odds Ratio as an Estimate of Risk Ratio
Provided that the disease is uncommon (say <10%), this sampling approach gives an
odds ratio that is a reasonably good estimate of the risk ratio. Very rare outcomes will
give odds ratios that are extremely close to what the risk ratio would be. However, as
the outcomes of interest become more common, the odds ratio gives estimates that are
increasing more extreme than the risk ratio would have been. By more extreme, I mean
that odds ratios that are greater than 1 will be larger than the corresponding risk ratio,
and odds ratios that are less than 1 will be smaller than the corresponding risk ratio.
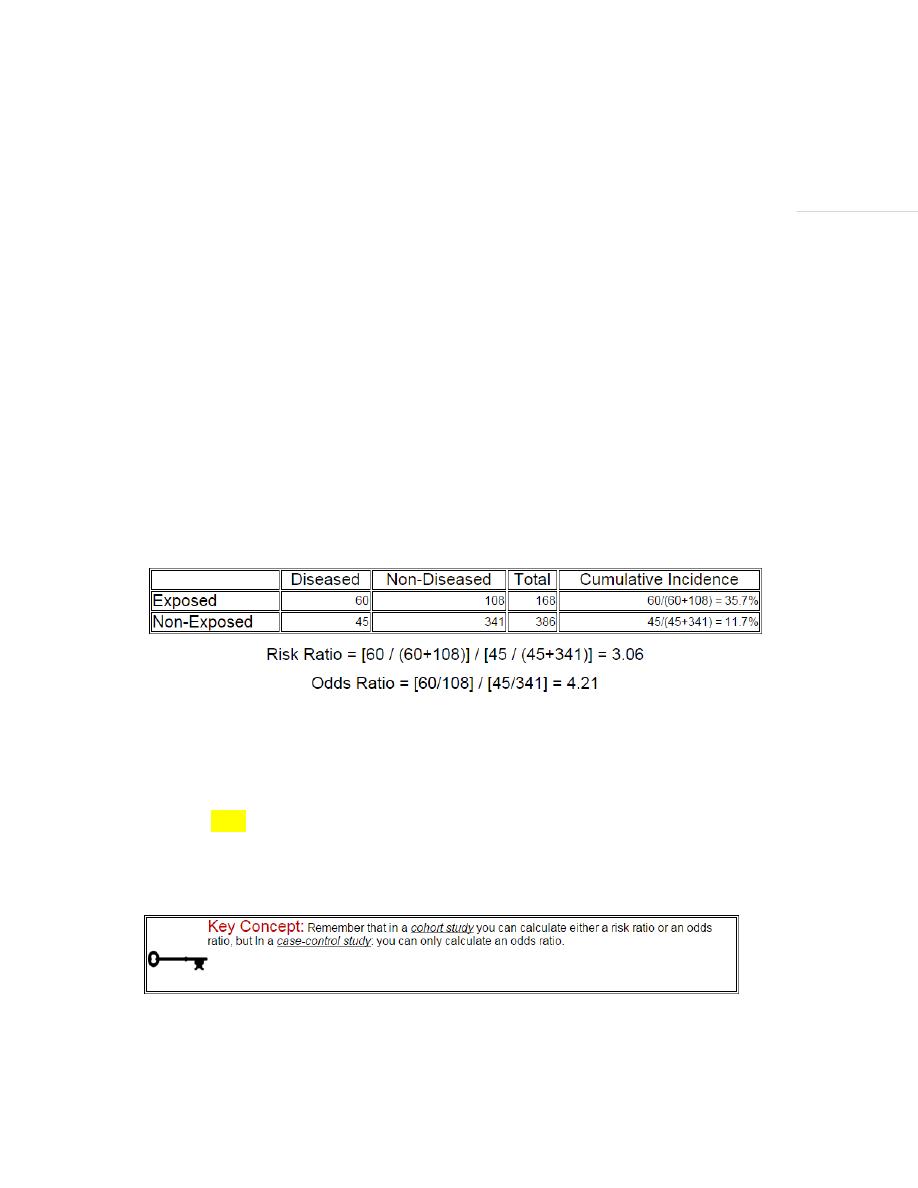
The figure below depict shows that when the outcome is more common (e.g., >10%),
the odds ratio exaggerates the estimated strength of association.
Computing both the risk ratio and the odds ratio in a hypothetical cohort study.
In general, the odds ratio will be close in value to the risk ratio when the outcome of
interest is rare, but the odds ratio will tend to become more extreme than the risk ratio
as the outcome becomes increasingly common.

Community
Odds ratio examples
Dr.Mohammed 2015-12-05
Page | 4
Incidence is Unknown in a Case-Control Study
In a cohort type study, one can calculate the incidence in each group, the risk
ratio, the risk difference, and the attributable fraction. In addition, one can also
calculate an odds ratio in a cohort study, as we did in the two examples
immediately above. In contrast, in a case-control study one can only calculate
the odds ratio, i.e. an estimate of relative effect size, because one cannot
calculate incidence. Consider once again the table that we used above to
illustrate calculation of the odds ratio.
Diseased
Non-diseased
Total
Exposed
7
10
unknown
Non-exposed
6
56
unknown
In this table the total number of exposed and non-exposed subjects is not known,
because sampling was done using a case-control design. One might find many
or all of the cases in a source population, particularly if it is a reportable disease.
In this example, the investigators found all thirteen cases, but then they just
sampled 66 non-diseased people in order to estimate the exposure distribution in
the source population.
When a case-control approach is used for sampling, we don't know how many
exposed people it took to generate the 7 cases in the first row, and we don't
know how many non-exposed persons were needed to generate the 6 cases in
the second row. The information from non-diseased controls allow us to estimate
the exposure distribution in the source population, .we don't know the
denominators ("Totals") for either exposure group.

Community
Odds ratio examples
Dr.Mohammed 2015-12-05
Page | 5
Example 3
Risk Ratio
For the study examining wound infections after incidental appendectomy, the risk of
wound infection in each exposure group is estimated from the cumulative incidence. The
relative risk (or risk ratio) is an intuitive way to compare the risks for the two groups.
Simply divide the cumulative incidence in exposed group by the cumulative incidence in
the unexposed group:
Risk Ratio = (CI
e
) / (CI
u
)
where CI
e
is the cumulative incidence in the 'exposed' group and CI
u
is the cumulative
incidence in the 'unexposed' group.
The table below shows how the risk ratio was calculated in the study examining the risk
of wound infections when an incidental appendectomy was done during a staging
laparotomy for Hodgkins disease.
Had Incidental
Appendectomy?
Wound Infection
No
Wound Infection
Total
Yes
7
124
131
No
1
78
79
Risk Ratio = 0.0534/0.0127 = 4.2
Odd=7*78/124*1 =4.4

could be compared with those of some well people who also ate at
the restaurant the same day. This could be done even if we didn’t
know exactly how many people ate at the restaurant that day.
• A two-by-two table is constructed, just like the one used to calculate RR,
with the same letters (a-d) used to label the cells. The OR is calculated by
multiplying across the cells.
Example:
Table 7
Number of Cases of Disease X by Exposure History, Smallville, 2004
Disease X
Yes No Total
Ate Tuna
Casserole
a 46
b 25
71
Didn’t Eat Tuna
Casserole
c 18
d 40
58
The formula for OR is:
Odds Ratio
=
ad
bc
Where
a
=
number of persons with disease and with exposure of interest
b
=
number of persons without disease, but with exposure of interest
c
=
number of persons with disease, but without exposure of interest
d
=
number of persons without disease and without exposure of interest
a+c =
total number of persons with disease (“cases”)
b+d =
total number of persons without disease (“controls”)
The OR in this example is:
Odds Ratio
=
46 x 40 = 1840 = 4.1
25 x 18 450
So those who became ill were 4.1 times as likely to have eaten the tuna
casserole. We should probably look a little more deeply into the tuna casserole!
We would still need to subject this result to a test of statistical significance (just
like we do with the RR) to judge the probability that the result could have
occurred by chance alone.
17
Community
Odds ratio examples
Dr.Mohammed 2015-12-05
Page | 6
Summery Plan: