Chapter 5 – Cardiovascular disease
87
“” Investigation of cardiovascular disease “”
(Printed by Mostafa Hatim
)
Electrocardiogram (ECG)
The ECG is used to:
- Assess cardiac rhythm (e.g. arrhythmia) and conduction.
- It provides information about chamber size (e.g. left ventricular hypertrophy) and is the
- Main test used to assess myocardial ischaemia & infarction.
- Also give information about pulmonary circulation
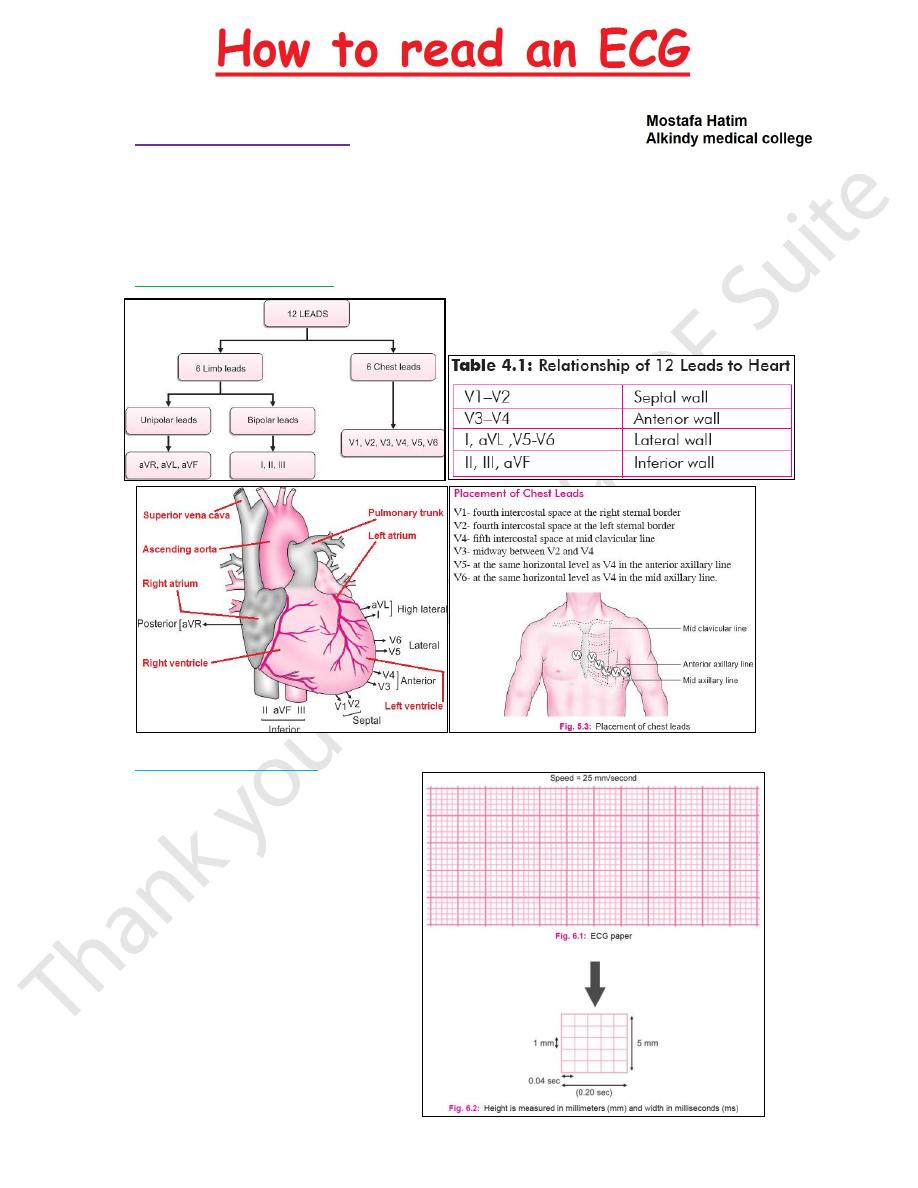
The standard 12-lead ECG
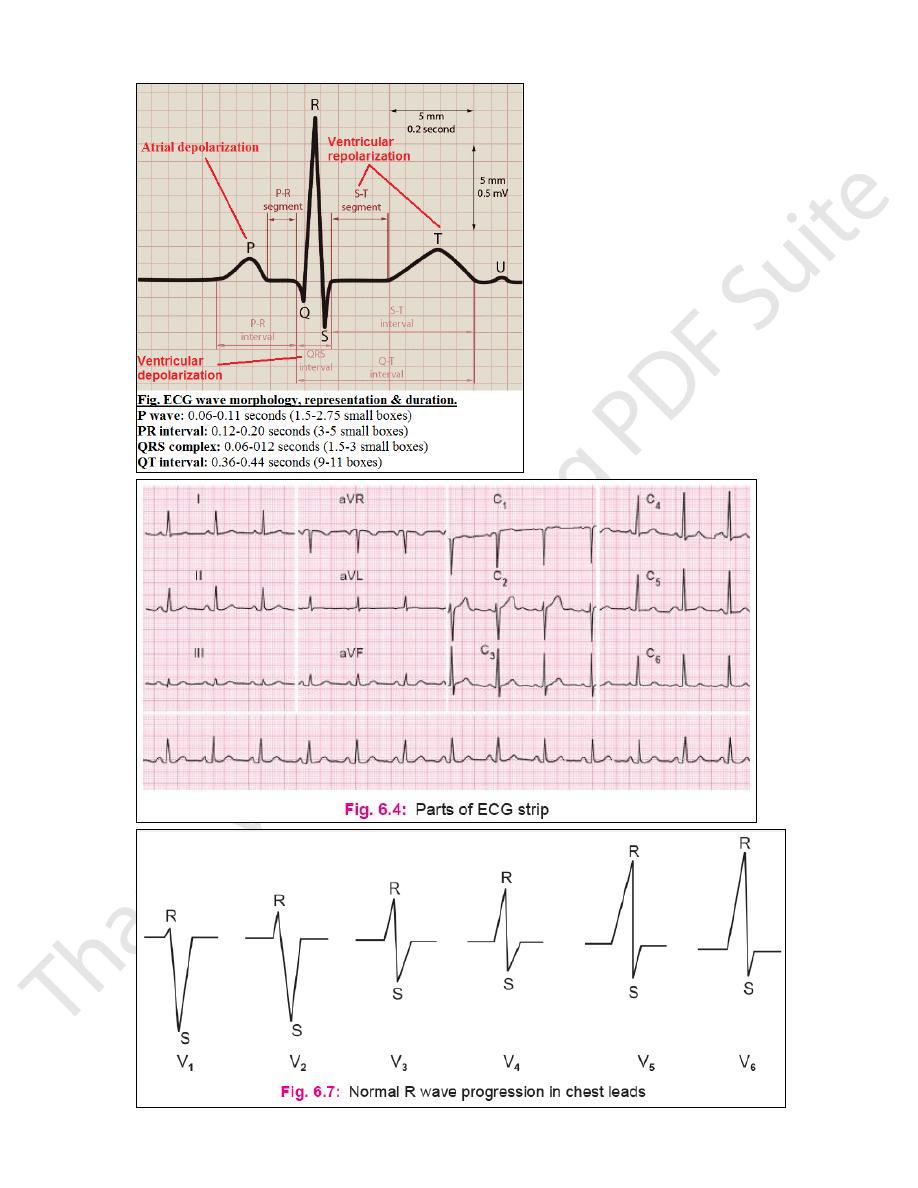
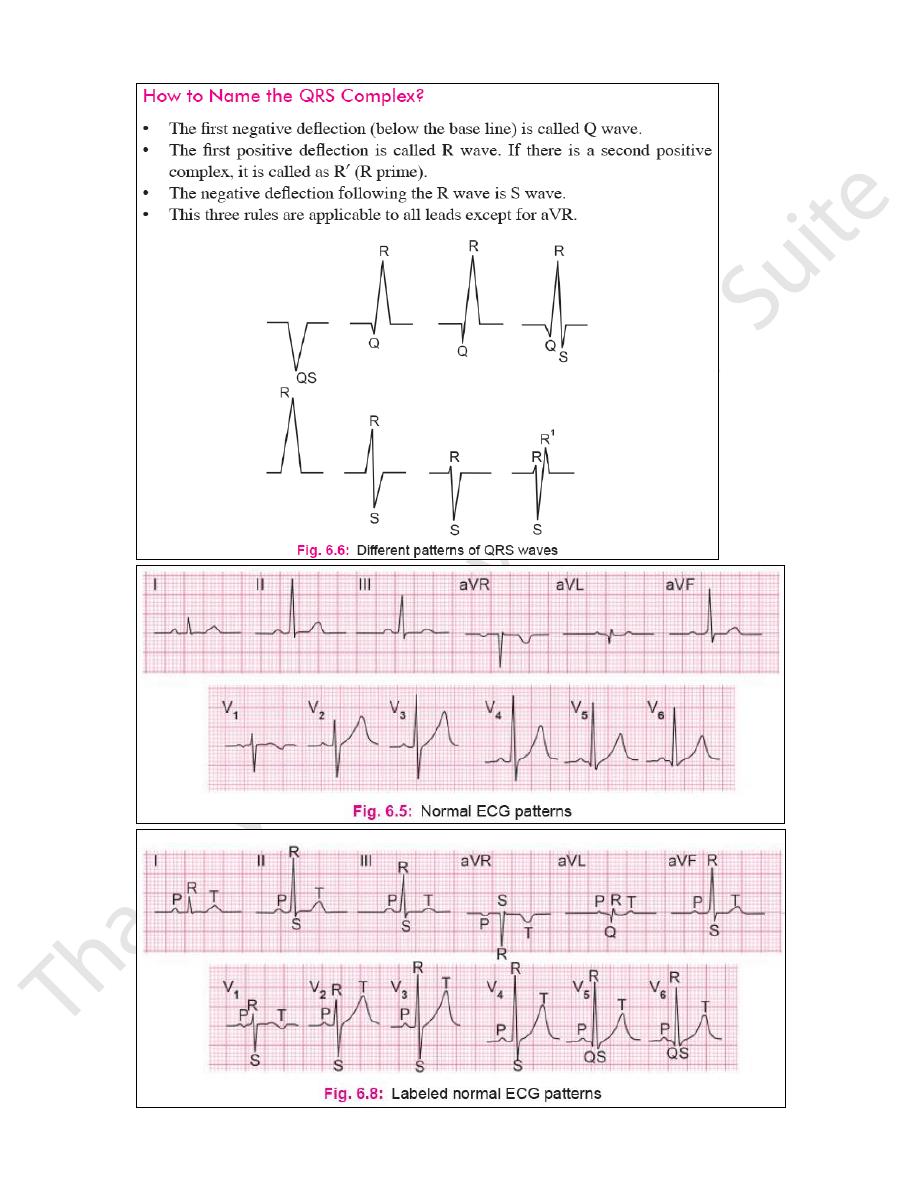
Normal ECG morphology
ECG paper = 6 seconds = 30 large boxes
= 150 small boxes
Chapter 5 – Cardiovascular disease
88
Chapter 5 – Cardiovascular disease
89
Chapter 5 – Cardiovascular disease
90
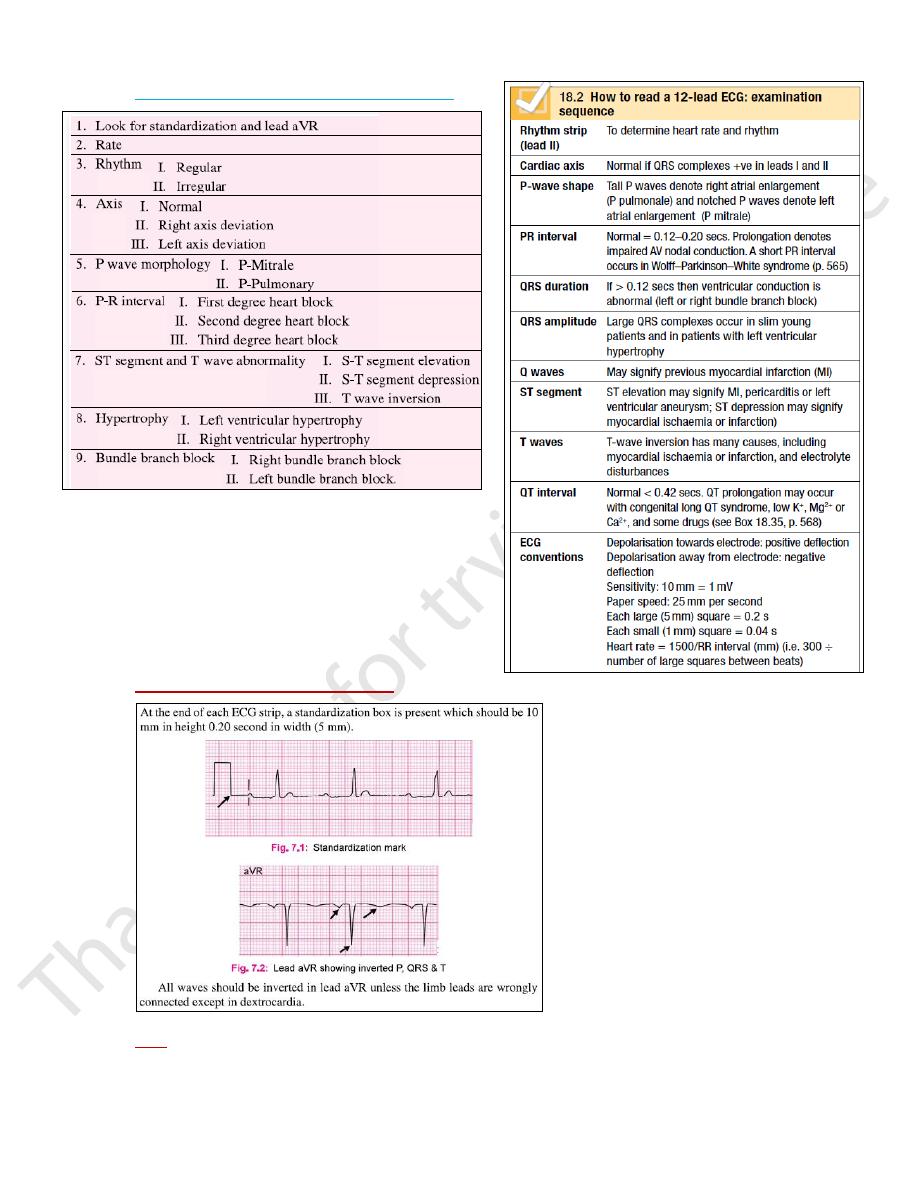
Systematic interpretation guidelines for ECG
Normally
S wave disappear in aVL, Lead I
Q wave appear only in aVL, V5 & V6
1) Look for standardization & Lead aVR
2) Rate
Our first method is simple. Count the number of QRS complexes over a 6 second
interval. Multiple by 10 to determine heart rate. This method works well for both regular
and irregular rhythms..
Chapter 5 – Cardiovascular disease
91
The second method uses small boxes. Count the number of small boxes for a typical R-
R interval. Divide this number into 1500 to determine heart rate..
HR= 60-90 beat/min
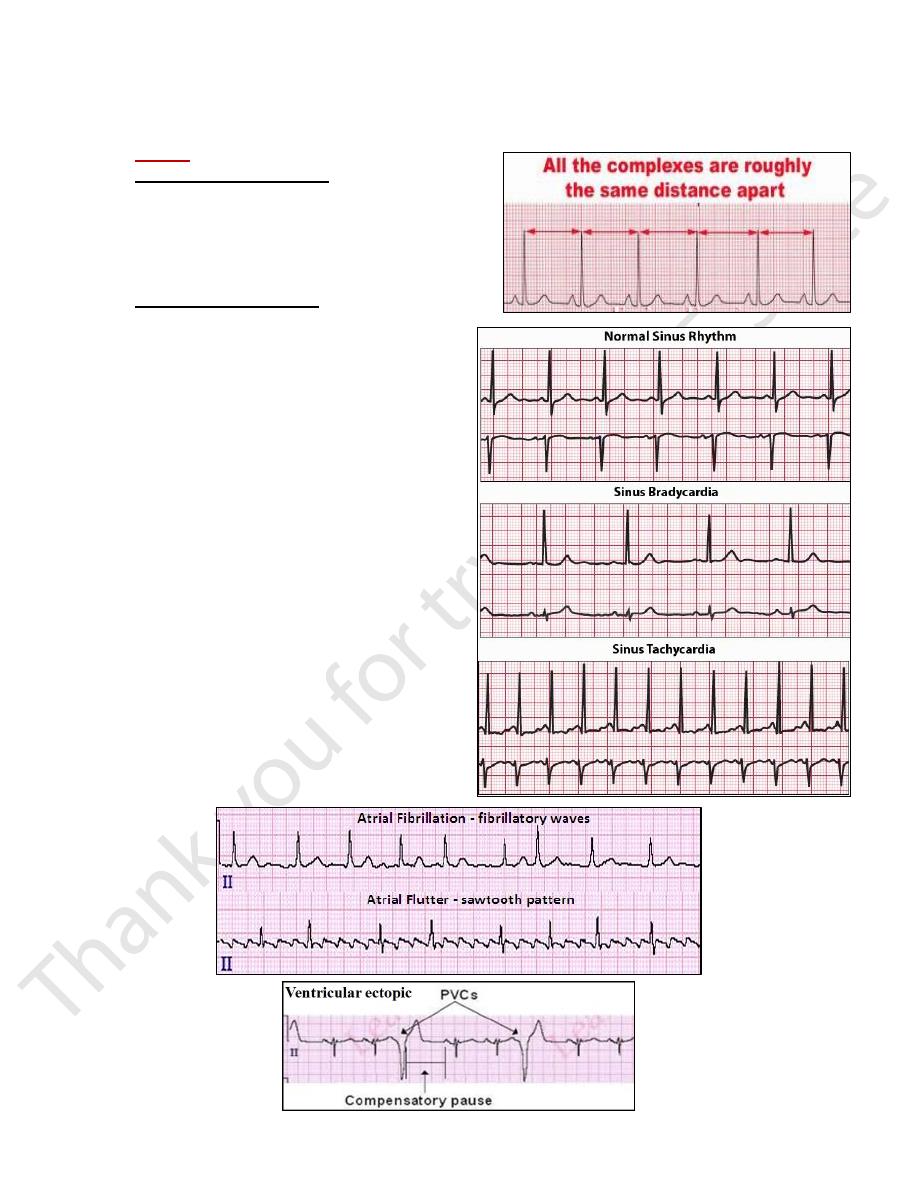
3) Rhythm
o Features of sinus rhythm are:
- Each P wave should be followed by QRS complex.
- P-R interval should be normal & constant.
- P wave morphology should be normal. - R-R interval
should be equal, if it is irregular, then it is called
irregular rhythm
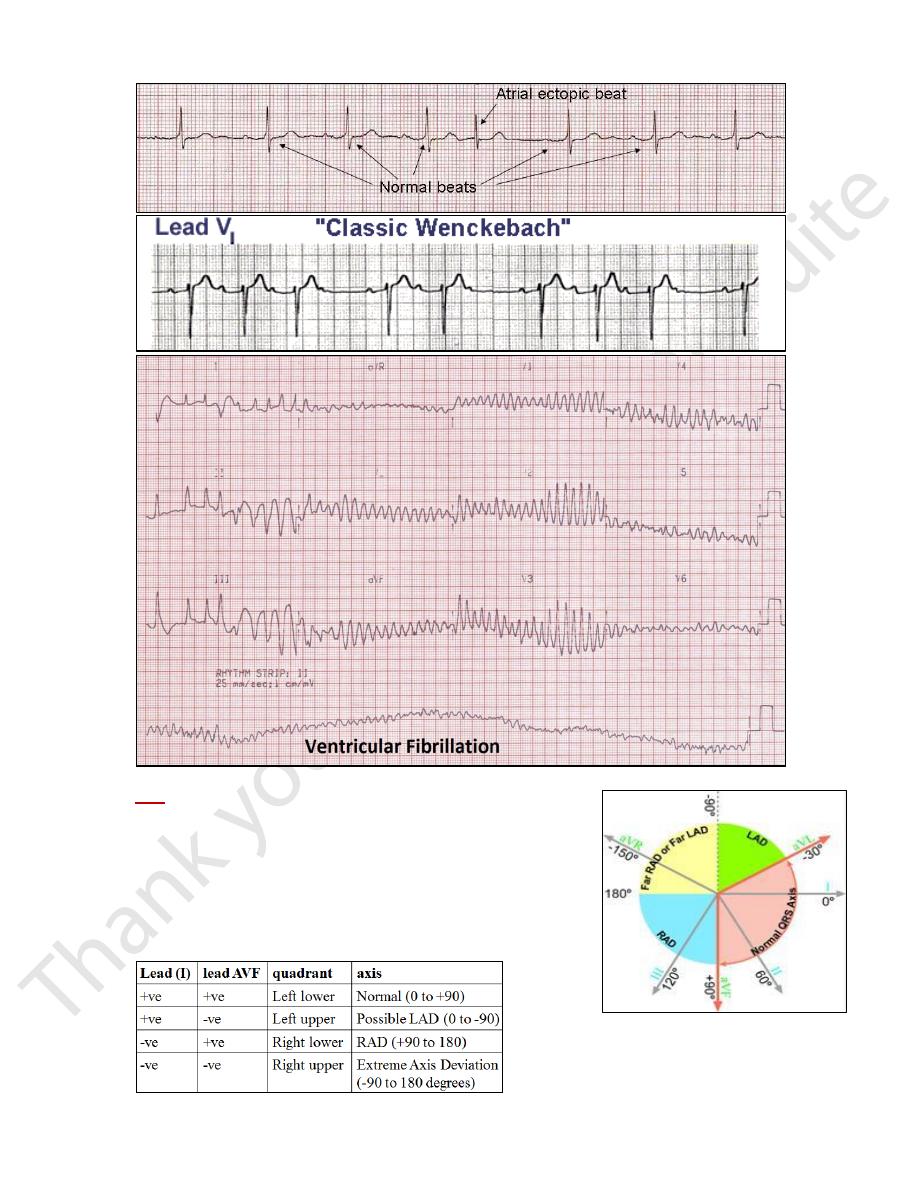
o Causes of irregular rhythm
1) Regularly irregular
A. Sinus arrhythmia (Physiological). Sinus
tachycardia (>150). Sinus bradycardia (<60)
B. 2
nd
degree (Wenkenbach) heart block
(Pathological): suggested by: regular rate with
regular dropped beat. Confirmed by: ECG showing
progressive prolongation of PR interval with
normal QRS complex followed by an absent QRS
complex
2) Irregularly irregular (Pathological)
A. Atrial fibrillation → absent P wave in lead II
B. Ventricular fibrillation
C. Atrial or ventricular (bizarre shape) ectopic beat:
suggested by: regular rate with irregular dropped
beat. Confirmed by: ECG showing normal sinus
rhythm with irregular QRS complexes not
proceeded by P wave, and then compensatory
absence of subsequent QRS.
D. Atrial flutter with variable heart block might
also present with an irregularly irregular pulse.
Suggested by: irregularly irregular pulse.
Confirmed by: ECG showing 'saw tooth' pattern,
and irregularly irregular normal QRS complexes
Chapter 5 – Cardiovascular disease
92
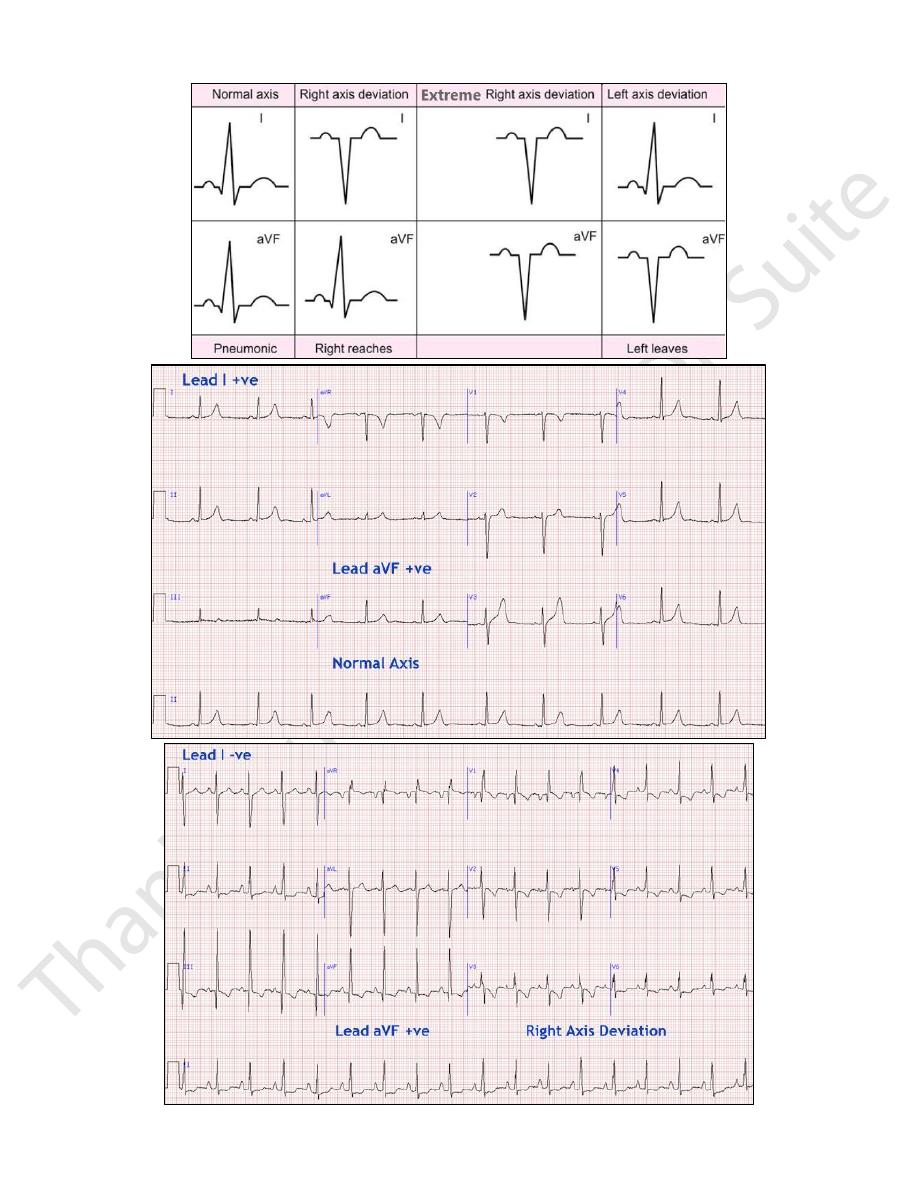
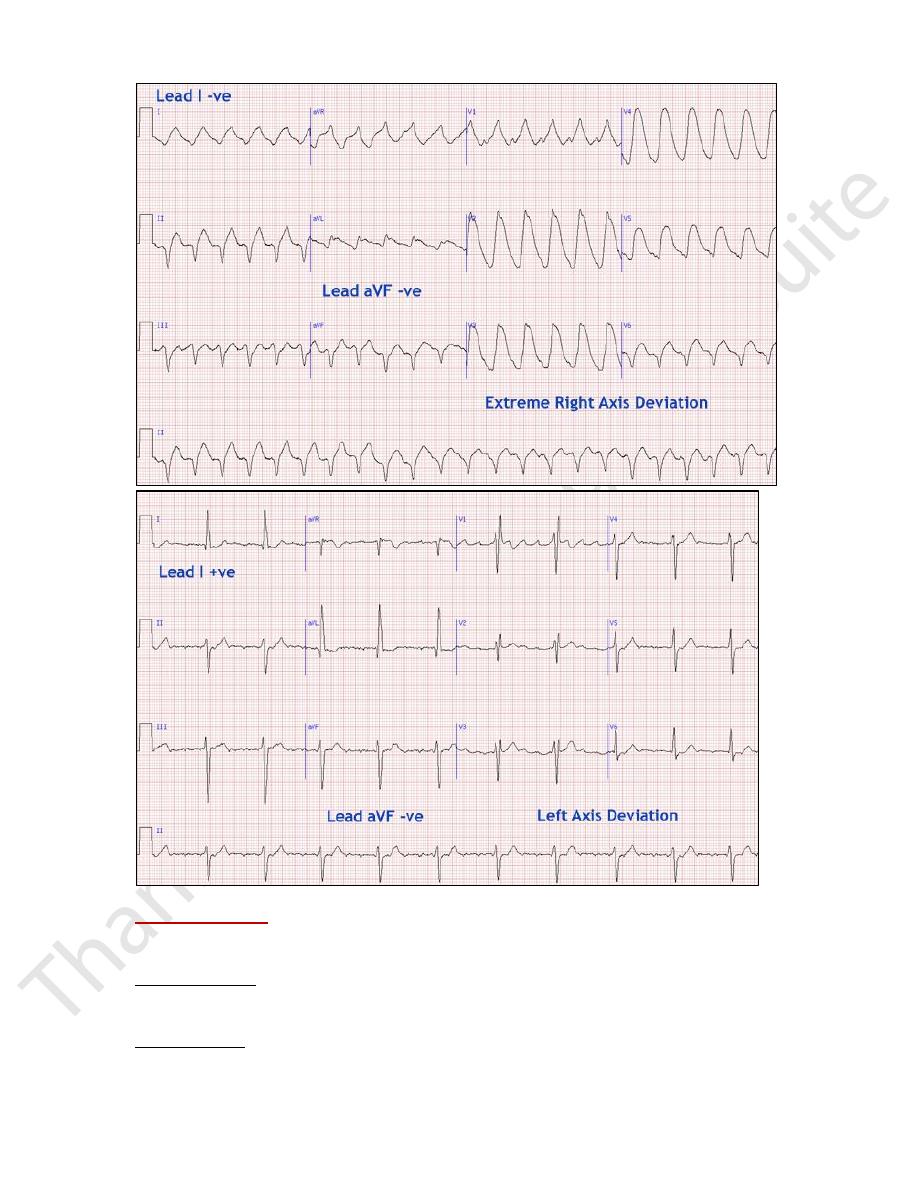
4) Axis
Look at lead I & Lead aVF for electrical axis of the heart. In both these
leads, normally, QRS complex is upwards.
Normal Axis = QRS axis between -30 and +90 degrees.
Left Axis Deviation = QRS axis less than -30 degrees.
Right Axis Deviation = QRS axis greater than +90 degrees.
Extreme Axis Deviation = QRS axis between -90 and 180 degrees
(AKA “Northwest Axis”).
Chapter 5 – Cardiovascular disease
93
Chapter 5 – Cardiovascular disease
94
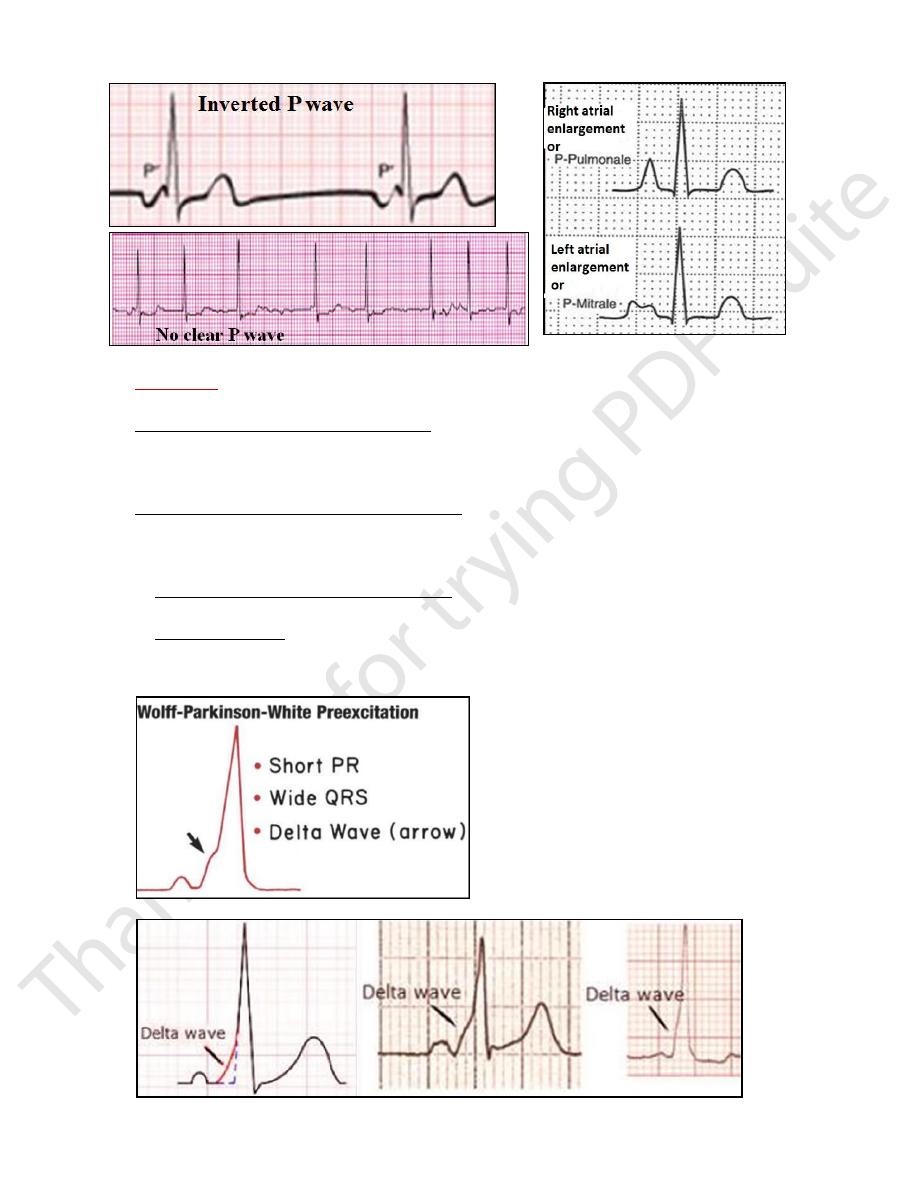
5) P wave morphology
o Is best appreciated in Lead II & contrast in Lead V1.
o Amplitude is normally 0.05-0.25mV (0.5 to 2.5 small boxes).
P-wave questions:
Are they present? Do they occur regularly? Is there one P-wave for each QRS complex?
Are the P-Waves smooth, rounded, and upright? Do all P-Waves have similar shapes?
o Inverted P wave: are found when the pacing or the initial impulse originates at or below
the AV node. Therefore, depolarization wave of the atrium will spread in a retrograde
manner causing inverted P wave. Inverted P wave indicates nodal rhythm or junctional
rhythm & idioventricular rhythm.
Chapter 5 – Cardiovascular disease
95
6) P-R interval
o It indicates AV conduction time. It is best appreciated in rhythm strip.
o Short P-R interval (˂ 0.11 seconds or 3 mm)
1) Retrograde junctional P wave
2) Lown Ganong-Levine syndrome (L-G-L)
3) Wolff-Parkinson-White pattern & syndrome (WPW)
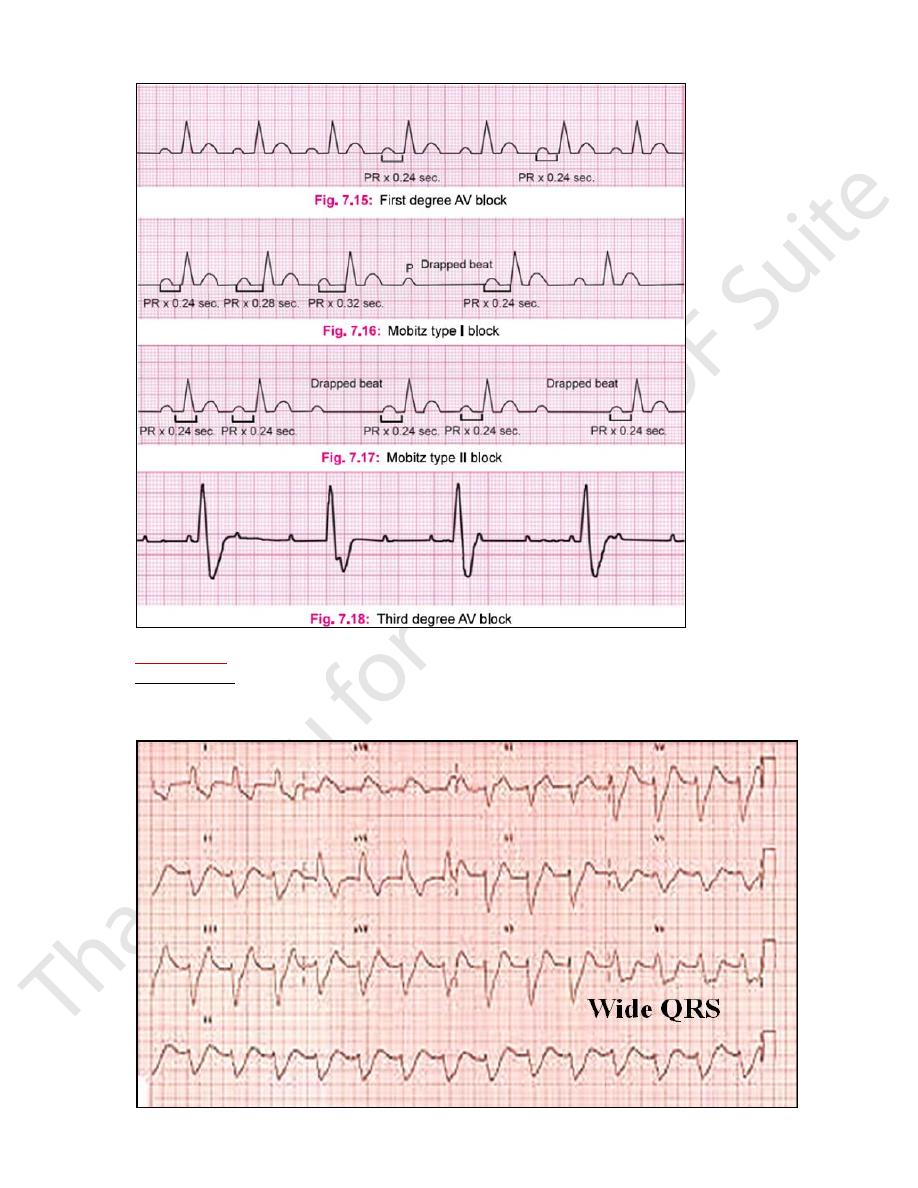
o Prolonged P-R interval (˃ 0.20 seconds or 5 mm)
AV block
1) 1
st
degree AV block: PR ˃ 0.20 seconds & remains constant from beat to beat.
2) 2
nd
degree AV block
a. Mobitz type I block (Wenckebach phenomena): There is progressive lengthening of
PR followed by a drop beat.
b. Mobitz type II block: There is no progressive lengthening of PR followed by a drop beat.
3) 3
rd
degree AV block: Here P wave has no relation to QRS complex. It always has more
P waves than QRS complex.
Chapter 5 – Cardiovascular disease
96
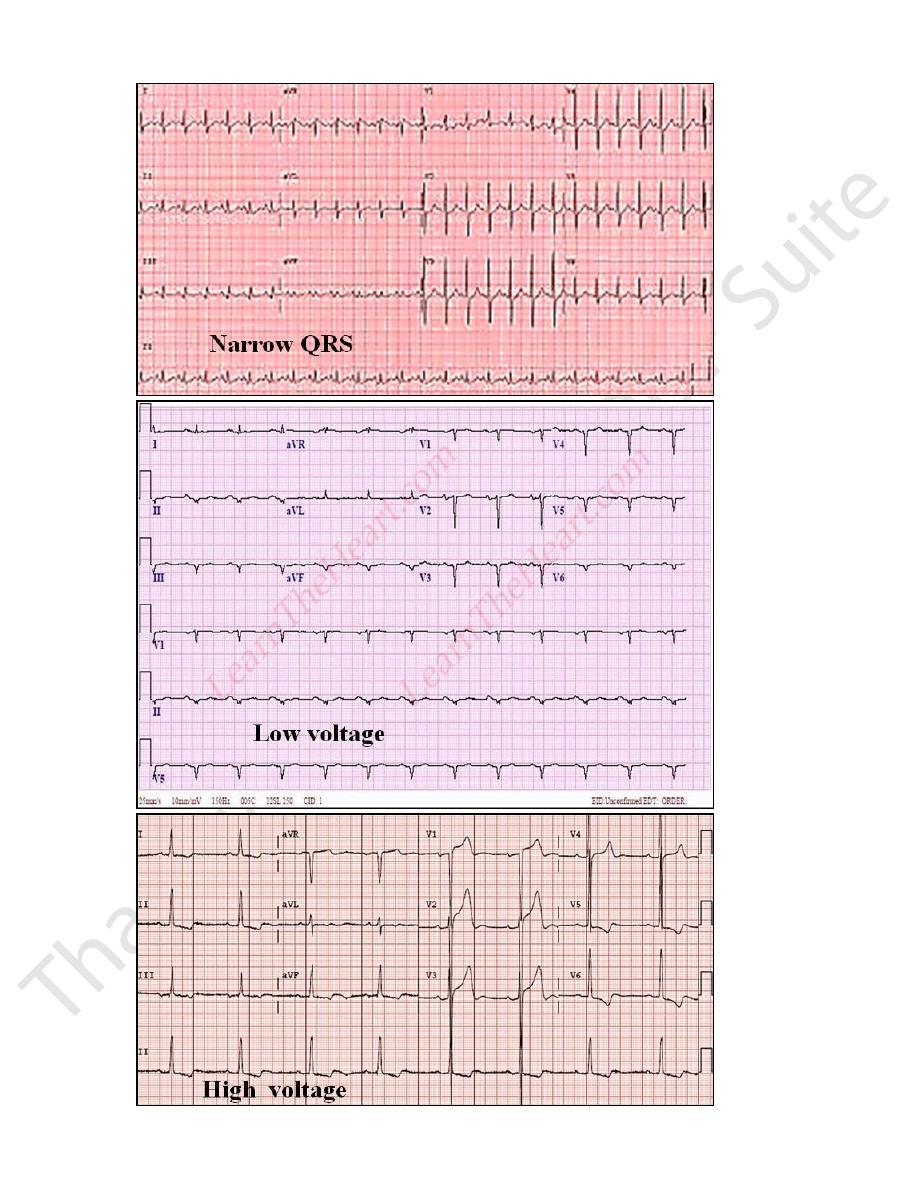
7) QRS complex
QRS questions: - Does the QRS interval -Wide or narrow?
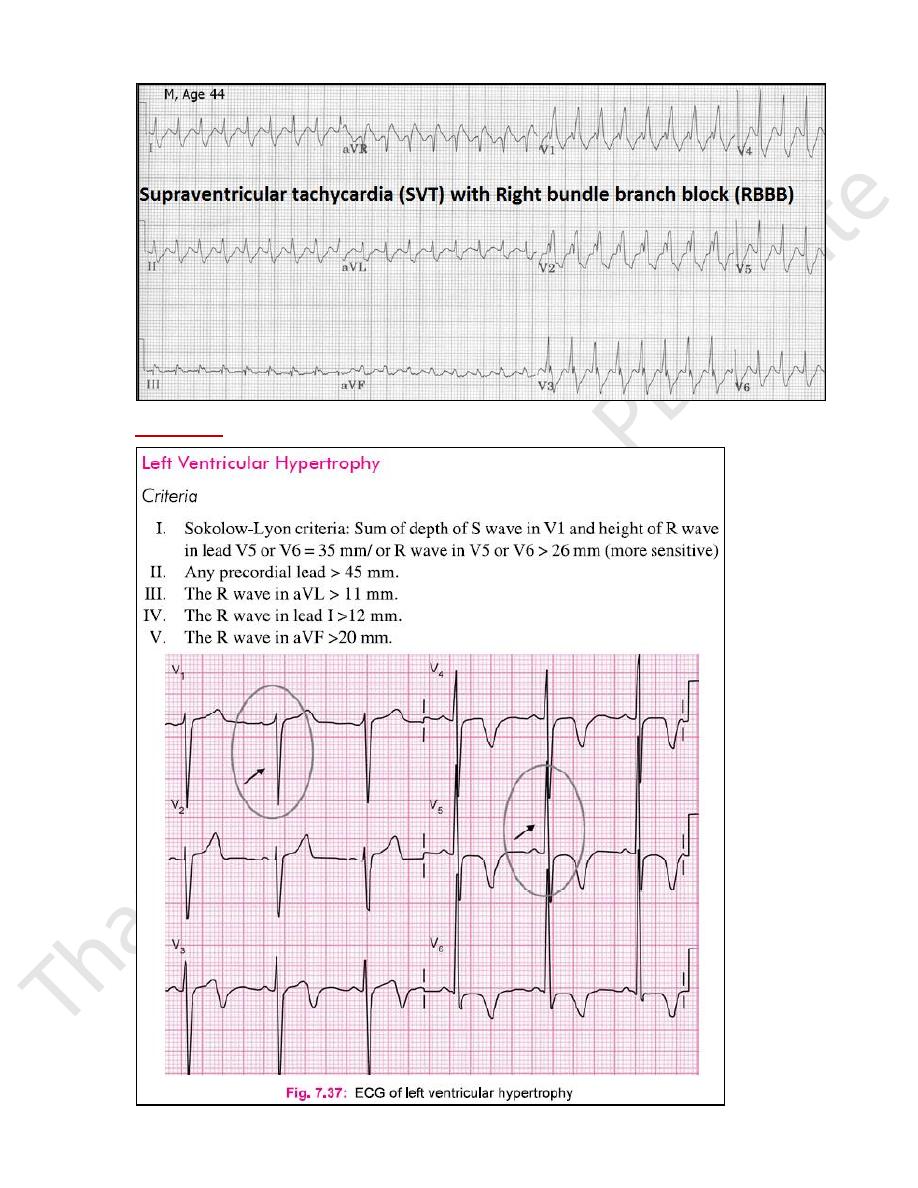
- Does QRS High or low voltage? (right ventricular hypertrophy, left ventricular hypertrophy)
- Are the QRS complexes similar in appearance across the ECG tracing? Ectopics
Chapter 5 – Cardiovascular disease
97
Chapter 5 – Cardiovascular disease
98
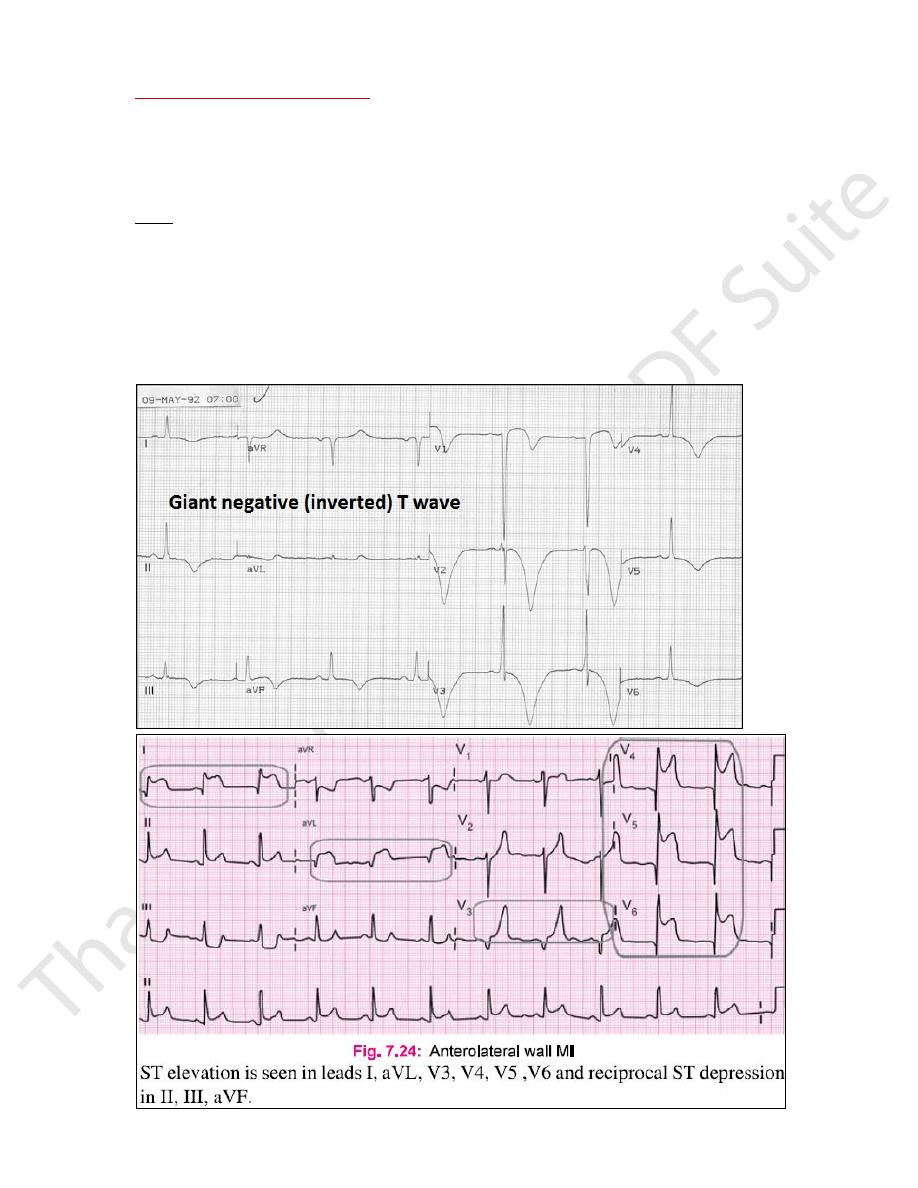
8) ST segment & T wave abnormality
o The ST segment represents the early part of ventricular repolarization. The ST segment
is the line that from the end of the QRS complex to beginning of the T wave. Normally,
ST segment is flat, being neither +ve or -ve relative to baseline.
o The T wave indicates the repolarization of the ventricles. It is a slightly asymmetrical
waveform which follows , the QRS complex. Either positive (up) or negative (down)?
o Notes
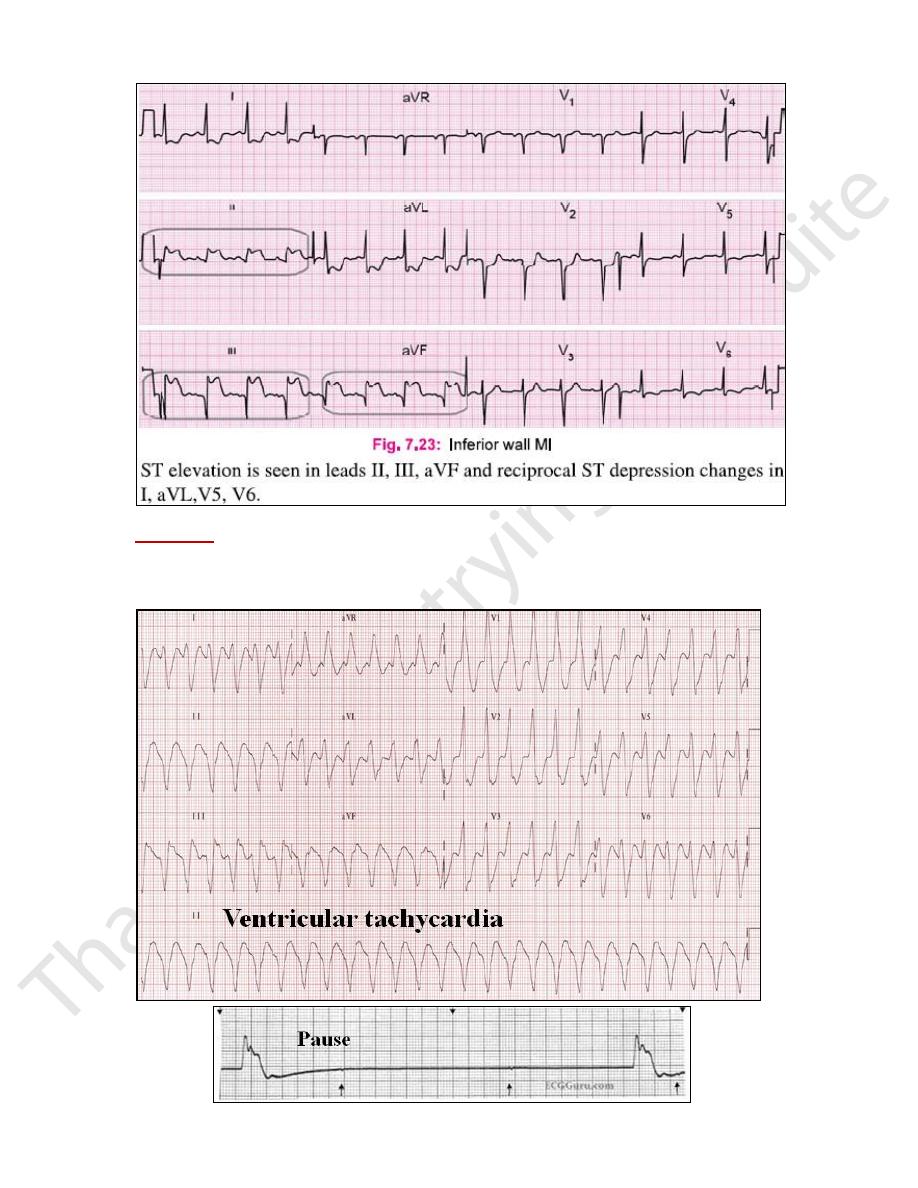
1) Elevation of ST segment indicates zone of injury, diagnosis is supported by reciprocal
changes, ST depression in the leads facing the opposite wall.
2) ST elevation > 1mm from baseline in limb leads & > 2mm in chest leads in 2 or more
leads facing same area is pathological
3) Inverted T wave indicates effect of ischemia surroundings.
4) Pathological Q wave > 1/3 the total height of the QRS & width > 0.03 seconds,
indicates zone of infarction or dead ms.
Chapter 5 – Cardiovascular disease
99
9) OT interval
It represents the time of ventricular activity including both depolarization and
repolarization. It is measured from the beginning of the QRS complex to the end of the T
wave. The QT interval will vary with patient gender, age and heart rate.
Chapter 5 – Cardiovascular disease
100
10) Hypertrophy
Chapter 5 – Cardiovascular disease
101
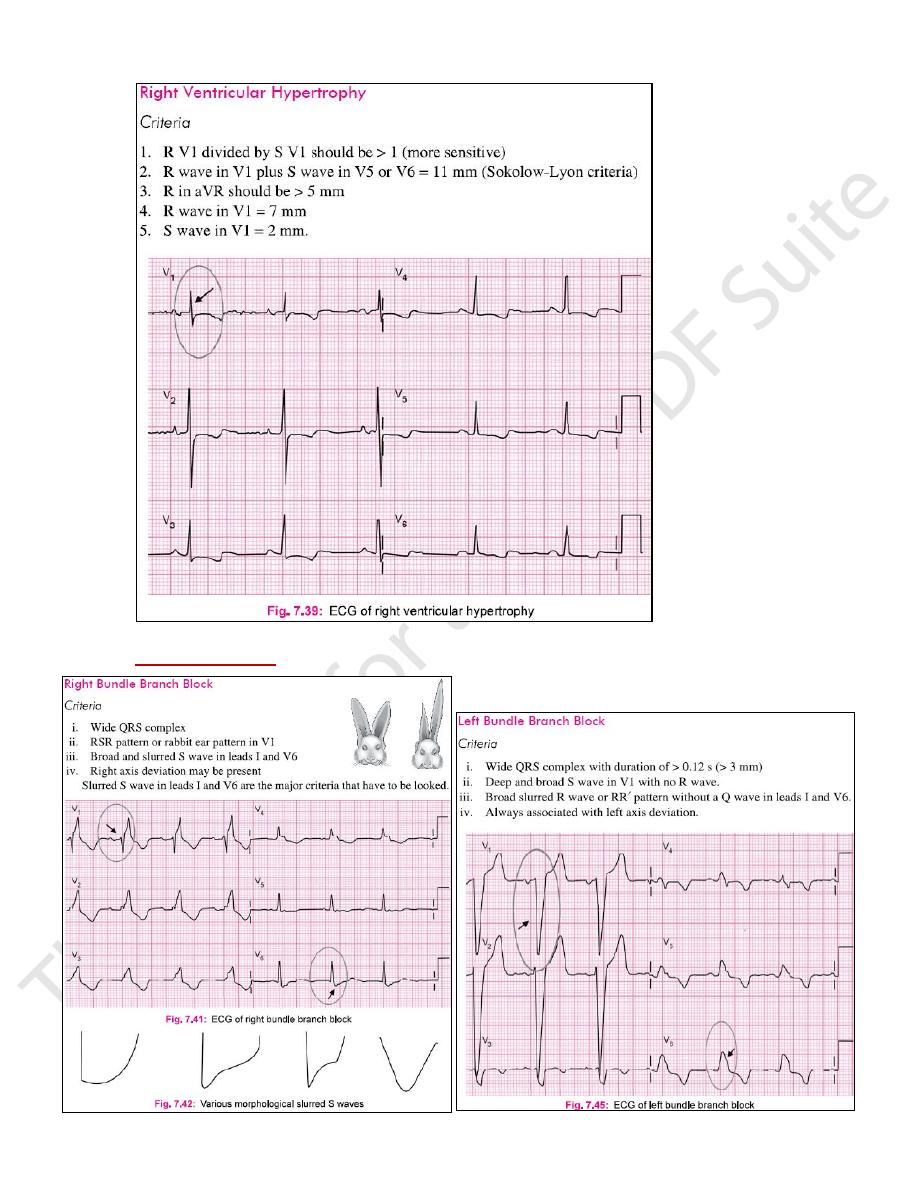
11) Bundle branch block

Chapter 5 – Cardiovascular disease
102
Exercise (stress) ECG
Is used to detect myocardial ischaemia during
physical stress and is helpful in the diagnosis of
coronary artery disease. A 12-lead ECG is
recorded during exercise on a treadmill or
bicycle ergometer. The limb electrodes are
placed on the shoulders & hips rather than the
wrists and ankles. The Bruce Protocol is the
most commonly used protocol for treadmill
testing. BP is recorded & symptoms assessed
throughout test.
A test is ‘positive’ if anginal pain occurs, BP falls or fails to increase, or if there are ST
segment shifts of > 1 mm. Exercise testing is useful in confirming the diagnosis in
patients with suspected angina, and in such patients has good sensitivity and specificity.
False negative results can occur in patients with coronary artery disease, and some
patients with a positive test will not have coronary disease (false positive). Exercise
testing is an unreliable population screening tool because in low-risk
individuals (e.g. asymptomatic young or middle-aged women) an abnormal response is
more likely to represent a false positive than a true positive test.
Stress testing is contraindicated in presence of acute coronary syndrome, decompensated
heart failure & severe hypertension.
Ambulatory ECG
Continuous (ambulatory) ECG recordings can be obtained using a portable digital
recorder. These devices usually provide limb lead ECG recordings only, and can record
for between 1&7 days. Ambulatory ECG recording is principally used in the investigation
of patients with suspected arrhythmia, such as those with intermittent palpitation, dizziness
or syncope. For these patients, a 12-lead ECG provides only a snapshot of the cardiac
rhythm and is unlikely to detect an intermittent arrhythmia, so a longer period of recording
is useful. These devices can also be used to assess rate control in patients with atrial
fibrillation, and are sometimes used to detect transient myocardial ischaemia using ST
segment analysis. For patients with more infrequent symptoms, small patient-activated
ECG recorders can be issued for several weeks until a symptom episode occurs. The
patient places the device on the chest to record the rhythm during the episode. With some
devices the recording can be transmitted to the hospital via telephone. Implantable ‘loop
recorders’ are small devices that resemble a leadless pacemaker and are implanted
subcutaneously. They have a lifespan of 1–3 years and are used to investigate patients with
infrequent but potentially serious symptoms, such as syncope.
Cardiac biomarkers
Plasma or serum biomarkers can be measured to assess myocardial dysfunction & ischaemia.
Brain natriuretic peptide:
This is a 32 amino acid peptide & is secreted by the LV
along with an inactive 76 amino acid N-terminal fragment (NT-proBNP). The latter is
diagnostically more useful, as it has a longer half-life. It is elevated principally in
conditions associated with left ventricular systolic dysfunction and may aid the diagnosis
and assess prognosis and response to therapy in patients with heart failure.
Cardiac troponins
Troponin I & troponin T are structural cardiac muscleproteins that are released during
myocyte damage and necrosis, and represent the cornerstone of the diagnosis of acute