
Dr. Ahmed Sameer Alnuaimi
Page 1 of 27
Slide 1
Test Performance Characteristics
Dr. Ahmed Samir Al-Naaimi
MBChB, MSc, PhD-Epidemiology
Department of Community Medicine
Baghdad College of medicine
Test Performance Characteristics
This lecture was prepared by Dr. Ahmed Samir Al-Naaimi
An epidemiologist and teaching staff member in Department of Community
Medicine
Baghdad College of medicine
The same tutor will do the talk for the slides

Dr. Ahmed Sameer Alnuaimi
Page 2 of 27
Slide 2
Objectives
Define validity of a test or criteria.
List 7 validity parameters of a test or criteria.
Compare stable validity parameters to those with
clinical applications.
Understand the effect of changing the cut-off value for
quantitative test on stable validity parameters.
Evaluate the role of physician in assessing the
meaning of test results.
Master the calculation of validity parameters.
Assess the effect of sensitivity, specificity and pretest
probability on predictive value of test result.
The prospective physician is expected to order and interpret laboratory tests.
The aim of this presentation is to help physicians in understanding the role that
lab tests play in their profession.
Learning Objectives
By the end of this lecture the participants should be able to achieve the
following objectives
•Define validity of a test or criteria.
•List 7 validity parameters of a test or criteria.
•Compare stable validity parameters to those with clinical applications.
•Understand the effect of changing the cut-off value for quantitative test on
stable validity parameters.
•Evaluate the role of physician in assessing the meaning of test results.
•Master the calculation of validity parameters.
•Assess the effect of sensitivity, specificity and pretest probability on predictive
value of test result.

Dr. Ahmed Sameer Alnuaimi
Page 3 of 27
Slide 3
Validity
Validity
of a test or criteria in predicting a health
outcome (disease) measures the extent to which the
test really measures what is supposed to measure.
The validity indices of a test include:
Sensitivity and its complement (rate of false negative)
Specificity and its complement (rate of false positive).
Accuracy (agreement).
PPV (positive predictive value).
NPV (negative predictive value). Define validity of a
test or criteria.
Validity
is a characteristic of a test or criteria in predicting a health outcome
(disease). It measures the extent to which the test really measures what is
supposed to measure. Validity is also called
test performance
characteristics.
The validity indices of a test include:
Sensitivity and its complement (rate of false negative).
Specificity and its complement (rate of false positive).
Accuracy (agreement)
PPV (positive predictive value).
NPV (negative predictive value).
Dr. Ahmed Sameer Alnuaimi
Page 4 of 27
Slide 4
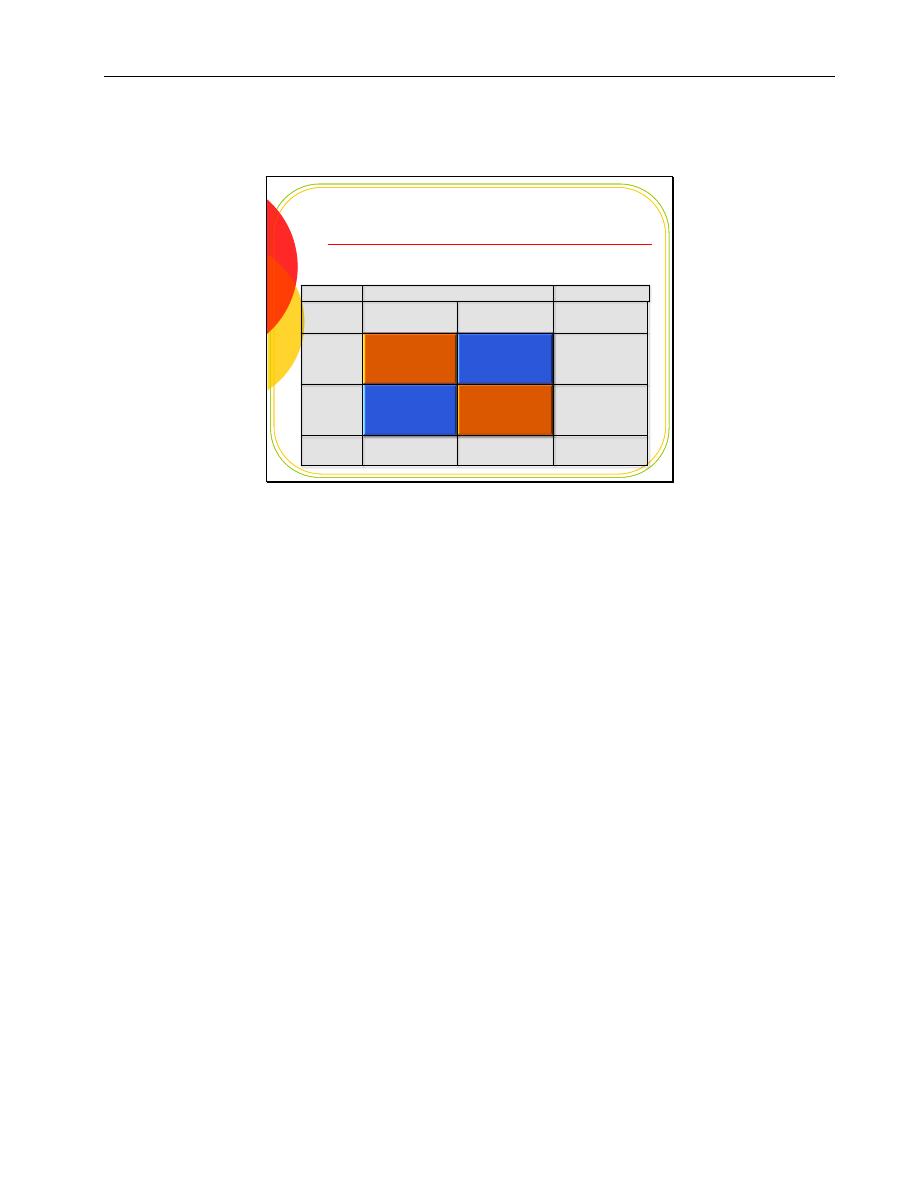
Calculating validity parameters
Typical arrangement for 2 by 2 table used for calculating
validity parameters.
Disease status
Test results
Disease
positive
Disease
free
Total
+ve
(A)
True
+ve test
(B)
False
+ve test
Total positive test
results
-ve
(C)
False
–ve test
(D)
True
-ve test
Total negative test
results
Total
Total cases
(disease)
Total non-cases
(disease free)
Total sample
Calculating validity parameters
The table shown in the slide displays the typical arrangement for 2 by 2 table
used in calculating validity parameters. The cross-tabulation between test
results and disease status will result in placement of the tested subjects in one
of the 4 cells:
Cell A “True positive test results”: frequency (count) of subjects who test
positive and have the disease.
Cell B “False positive test results”: frequency (count) of subjects who test
positive and are disease free.
Cell C “False negative test results”: frequency (count) of subjects who test
negative and have the disease.
Cell D “True negative test results”: frequency (count) of subjects who test
negative and are disease free.
Any of the 4 cells is labeled by the test result and its evaluation as true or false
according to the disease status.

Dr. Ahmed Sameer Alnuaimi
Page 5 of 27
Slide 5
Sensitivity
Definition 1:
Is the conditional probability that a
diseased person has a positive result. It
measures the ability of test to identify all
those who have the disease in the screened
population.
Definition 2:
The proportion of people who have the
disease in whom a screening test gives
positive result
Applications (making use of sensitivity)
1.
Sensitivity is of direct use in
screening
.
2.
Its value is used indirectly when ruling-out
(excluding)
Sensitivity
:
Is the conditional probability that a diseased person has a
positive result. It measures the ability of test to identify all those who have the
disease in the screened population.
Sensitivity: is also defined as the proportion of people who have the disease in
whom a screening test gives positive result.
Applications (Making use of sensitivity)
1. Sensitivity is of direct use in
screening
(looking for / searching) for a
certain condition or disease among subjects who are asymptomatic or those in
whom the penalty for missing the disease is high. A test with high sensitivity is
used for screening purposes. Example of tests used in screening:
Mammography in mass screening for breast cancer in menopausal women.
Pap smear for screening of cervical cancer in women.
The second application for sensitivity is an indirect one. The value of sensitivity
is used indirectly when ruling-out (excluding) a possible diagnosis (through its
impact on negative predictive value). We will come across this later on.

Dr. Ahmed Sameer Alnuaimi
Page 6 of 27
Slide 6
Sensitivity-2
The complement of sensitivity is the
proportion of
false negative
, is the conditional probability that a
diseased person has a negative test result (it equals 1-
sensitivity or 100-sensitivity%).
Sensitivity =
Number of true positives
=
A
Number of diseased people
A+C
Proportion
of False -ve
=
Number of false negative
=
C
Number of diseased people
A+C
Sensitivity =Number of true positives/Number of diseased people = A/A+C
(referring to the typical 2x2 table on slide 4)
The complement of sensitivity is the proportion of false negative, is the
conditional probability that a diseased person has a negative test result (it
equals 1-sensitivity or 100-sensitivity%).
Consequences for people who test false negative are being not identified,
falsely reassured. We usually choose tests of high sensitivity to reduce the
possibility of missing diseased people to the minimum.
The formula used for calculating the proportion of false negative
=Number of False negative / Number of diseased people = C/A+C

Dr. Ahmed Sameer Alnuaimi
Page 7 of 27
Slide 7
Specificity
Definition 1:
Is the conditional probability that a
disease-free person has a negative test
result.
Definition 2:
The proportion of people free of the
disease in whom a test gives a negative
result.
Applications (making use of specificity)
1.
Specificity is of no direct use or clinical application.
2.
Its value indirectly affect the positive predictive
value of a test. Therefore a test with high specificity
is used to establish a possible
diagnosis.
or
Specificity:
Is the conditional probability that a disease-free person has a
negative test result.
Specificity
can also be defined as the proportion of people free of the disease
in whom a test gives a negative result.
Applications (making use of specificity)
•
Specificity is of no direct use or clinical application.
•
Its value indirectly affect the positive predictive value of a test.
Therefore a test with high specificity is used to establish a possible
diagnosis. This finding deserves further discussion which is found later
on in this lecture.

Dr. Ahmed Sameer Alnuaimi
Page 8 of 27
Slide 8
Specificity-2
The complement of specificity is the
proportion of
false positive
, is the conditional probability that a
disease free person has a positive test result (it equals
1-specificity or 100-specificity%).
Specificity =
Number of true negative
=
D
Number of disease free people
B+D
Proportion
of False +ve
=
Number of false positive
=
B
Number of disease free people
B+D
Specificity =Number of true negative/Number of disease free people = D/B+D
(referring to the typical 2x2 table on slide 4)
The complement of specificity is the proportion of false positive, which is the
conditional probability that a disease free person has a positive test result (it
equals 1-specificity or 100-specificity%).
Consequences for people who test false positive: anxiety, unnecessary
diagnostic tests which may be invasive, costly and painful. A highly specific test
therefore can keep false positive test results to the minimum.
The formula used for calculating the Proportion of false positive
=Number of False positive/ Number of disease free people = B/B+D

Dr. Ahmed Sameer Alnuaimi
Page 9 of 27
Slide 9
Stable validity parameters
The sensitivity and specificity of a test are sometimes
called stable validity parameters, i.e. once
established will not change under different
circumstances.
An exception is made by changing the
cut-off value
for defining a positive test result in quantitative
assessments. The changes in stable validity
parameters depend on direction of the test.
A) Positive direction =
raising the cut-off value will
increase the specificity and decrease the sensitivity.
B) Negative direction =
reducing the cut-off value will
increase the specificity and decrease the sensitivity
Stable validity parameters
The sensitivity and specificity of a test are sometimes called stable validity
parameters, i.e. once established will not change under different
circumstances.
An exception is with quantitative tests, changing the cut-off value for a
positive test result will change the stable validity parameters (sensitivity and
specificity) depending on the direction of test.
A) Positive direction: Higher values for test results indicate disease (or
positive outcome): For example fasting serum glucose concentration, in
which higher values indicate hyperglycemia, one of the biochemical
abnormalities of diabetes mellitus. The WHO suggests that a fasting serum
glucose concentration of 126 mg/dl or higher is positive for DM. Increasing the
cut-off value for positive test much above 126 will increase the specificity and
decrease the sensitivity of test and Vice versa.
• Negative direction: Lower values for test results indicate disease (or
positive outcome): For example blood Hb concentration, in which lower
values indicate anemia. The WHO suggests that blood Hb concentration of <
12g/dl in an adult non-pregnant female is positive for anemia. Decreasing
the cut-off value for positive test much below 12 g/dl will increase the
specificity and decrease the sensitivity and Vice versa.

Dr. Ahmed Sameer Alnuaimi
Page 10 of 27
Slide 10
Accuracy
Accuracy (percent agreement)
is the proportion of
true results among all test results (positive and
negative). It is a summary measure for the performance
(validity) of test.
Accuracy=
Number of true +ve and -ve
=
A+D
Total sample size
A+B+C+D
Accuracy (percent agreement)
is the proportion of true results among all
test results (positive and negative). It is a summary measure for the
performance (validity) of the test that allow easy comparison between two
tests. But it does not help in choosing an application for a specific test.
Accuracy=Number of true +ve and –ve/Total sample size=A+D/A+B+C+D
(you can always refer to the typical 2x2 table on slide 4)

Dr. Ahmed Sameer Alnuaimi
Page 11 of 27
Slide 11
Clinically applied parameters
In clinical settings
the test result is used
to
predict
the disease status of the tested
individual. The
confidence
level in
predicting disease status can be measured
in terms of probability theory using PPV
and NPV.
To measure PPV and NPV one should use
the stable validity parameters (sensitivity
and specificity) in addition to
pretest
probability
or
prevalence .
Clinically applied parameters sometimes called yield or predictive value of a
test result
In clinical settings the test result is used to predict the disease status of the
tested individual. So if a subject tests positive one would like to believe that he
is really diseased. On the other hand when he tests negative one would like to
believe that the subject is really disease free. The confidence level in the
previous 2 types of predictions can be measured in terms of probability theory
using PPV (predictive value of a positive test result) and NPV (predictive value
of a negative test result).
To measure PPV and NPV one should use the stable validity parameters
(sensitivity and specificity) in addition to pretest probability or prevalence
(which is the probability that an individual with certain characteristics have the
disease based on history and clinical judgment alone.

Dr. Ahmed Sameer Alnuaimi
Page 12 of 27
Slide 12
PPV
Positive Predictive Value (PPV) is the conditional
probability that a person with a positive test result is
truly diseased.
The PPV is directly proportional to specificity and
pretest probability (prevalence or the clinical
judgment for the probability of having the disease).
A high PPV is needed to establish the diagnosis with
confidence.
PPV =
Number of true positive
=
A
Number of all positive test results
A+B
Positive Predictive Value (PPV) is the conditional probability that a person with
a positive test result is truly diseased.
The PPV is directly proportional to specificity and pretest probability
(prevalence or the clinical judgment for the probability of having the disease).
It reflects the degree of confidence in being diseased after applying the test
(post-test probability).
A high PPV is needed to establish the diagnosis with confidence.
PPV=Number of true positive/Number of all positive test results= A/A+B
(referring to the typical 2x2 table on slide 4)

Dr. Ahmed Sameer Alnuaimi
Page 13 of 27
Slide 13
NPV
Negative predictive value (NPV) is the conditional
probability that a person with a negative test result is
truly free of the disease.
The NPV is directly proportional to sensitivity and
inversely proportional to pretest probability.
A high NPV is needed to exclude a possible diagnosis
with confidence.
NPV =
Number of true negative
=
D
Number of all negative test results
C+D
Negative predictive value (NPV) is the conditional probability that a person
with a negative test result is truly free of the disease.
The NPV is directly proportional to sensitivity and inversely proportional to
pretest probability.
A high NPV is needed to exclude a possible diagnosis with confidence.
PPV=Number of true negative/Number of all negative test results= D/C+D
(referring to the typical 2x2 table on slide 4)

Dr. Ahmed Sameer Alnuaimi
Page 14 of 27
Slide 14
Notes about PPV and NPV
The value of both PPV and NPV in quantitative test
depends in addition to the prevalence of the disease
(pretest probability) on the cutoff point for positive
test result (through its effect on sensitivity and
specificity).
The NPV and PPV reported in literatures for a certain
test is not comparable to values of the same test
when applied in other samples or studies.
The use of NPV and PPV is in the domain of physicians
only, since they need the pretest probability for its
calculation, which can only be specified by them
(through history taking and clinical examination).
PPV cannot be used in the same context of NPV.
or
Notes about PPV and NPV
The value of both PPV and NPV in quantitative test depends in addition to the
prevalence of the disease (pretest probability) on the cutoff point for positive
test result (through its effect on sensitivity and specificity).
The NPV and PPV reported in literatures for a certain test is not comparable to
values of the same test when applied in other samples or studies, since the
pretest probability for having the condition is usually different between studies.
It is therefore better not to compare them. They are reported in literatures to
show how good (or bad) was the test when applied in clinical settings.
The use of NPV and PPV is in the domain of physicians only, since they need the
pretest probability for its calculation, which can only be specified by them
(through history taking and clinical examination), a process which we call
differential diagnosis. All what we need to do is to assign probability figures to
phrases, such as: rare, highly probable, very common, common, unlikely
……etc.
Keep in mind that PPV cannot be used in the same context of NPV. One should
decide in advance what he really needs from the test. Is it to establish the
diagnosis? or exclude it?. If on clinical bases the disease is highly likely (high
pretest probability) then the PPV is needed, while if the disease is considered a
rare possibility clinically (low pretest probability) then we will wait for the NPV
of the test.
Dr. Ahmed Sameer Alnuaimi
Page 15 of 27
Slide 15
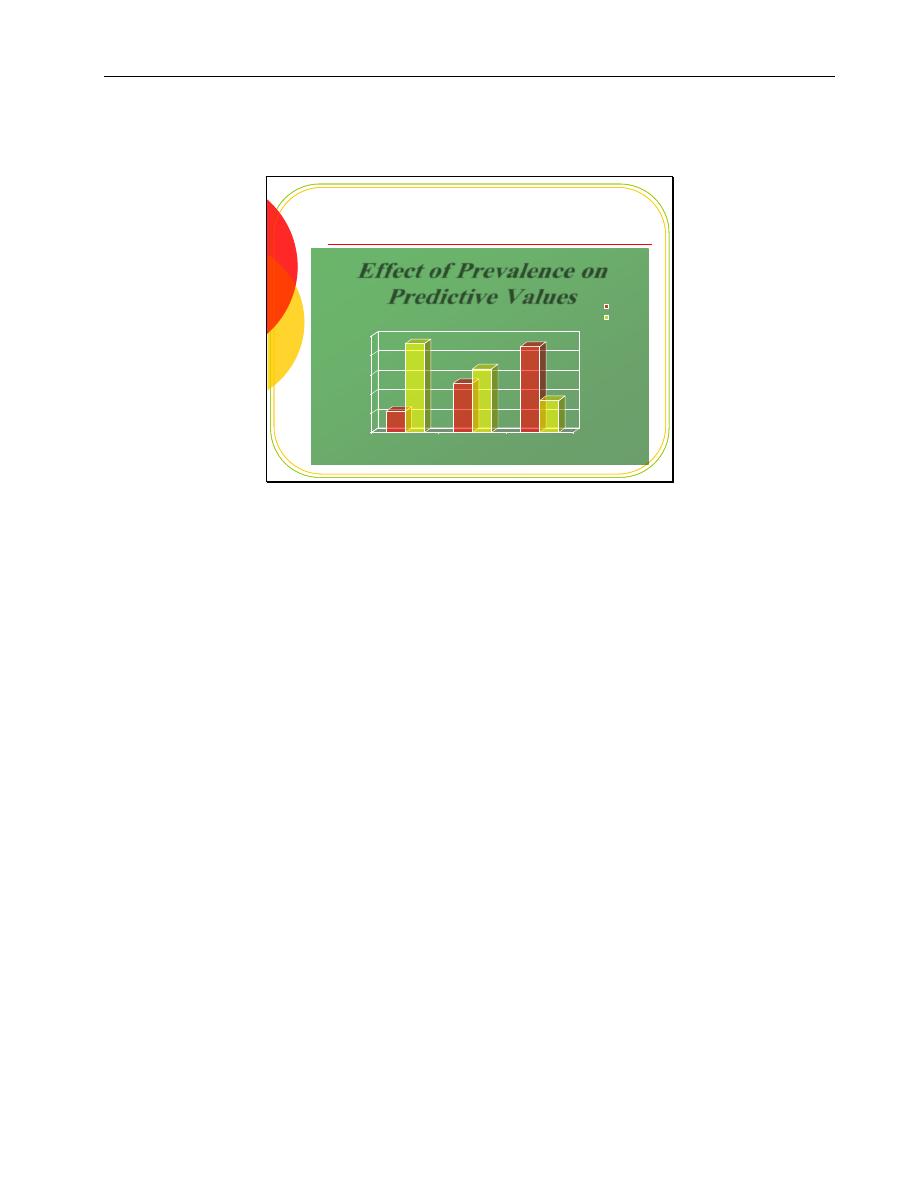
Prevalence and Predictive Values
0
20
40
60
80
100
5
20
50
PV +
PV -
Effect of Prevalence on
Predictive Values
Prevalence (%)
Rules of Prevalence and Predictive Values:
As prevalence rate increases (moving from left to right on X axis in the figure);
so does the positive predictive value (red bars in the figure) while negative
predictive value decreases (yellow bars in the same figure).
On the other hand as the prevalence rate decreases (moving from right to left
on X axis in the figure); so does positive predictive value, while negative
predictive value increases.
PPV is directly proportional to prevalence or pretest probability, while NPV is
inversely proportional.

Dr. Ahmed Sameer Alnuaimi
Page 16 of 27
Slide 16
Example-calculations
The following 2 by 2 table show the association
between a test and disease status
Disease status
Test
Disease
positive
Disease
free
Total
+ve
450
100
550
-ve
50
400
450
Total
500
500
1000
The following 2 by 2 table show the association between a test and disease
status
All the 7 validity parameters are calculated as follows:
Sensitivity = 450/500 x 100 = 90%
Specificity = 400/500 x 100 = 80%
Accuracy = [(450+400)/1000] x 100 = 85%
Proportion of false positive = 100 – 80 = 20%
Proportion of false negative = 100 – 90 = 10%
PPV = 450 / 550 x 100 = 81.8% for prevalence of disease = 500/1000 x 100 =
50%
NPV = 400 / 450 x 100 = 88.9% for the same 50% prevalence rate

Dr. Ahmed Sameer Alnuaimi
Page 17 of 27
Slide 17
Example-1-Increase Prevalence
Now let's
increase
the disease prevalence to 90%
Disease status
Test
Disease
positive
Disease
free
Total
+ve
810
20
830
8
1
0
-ve
90
80
170
9
0
Total
900
100
1000
9
0
0
PPV increase
from 81.8% to 90% and
NPV
decrease
from 88.9 to 47.1% , while sensitivity and
specificity are stable.
Now let's increase the disease prevalence to 90%, without affecting the stable
validity parameters (sensitivity and specificity).
Sensitivity = 810/900 x 100 = 90%
Specificity = 80/100 x 100 = 80%
Accuracy = (810+80)/200 = 890/1000 x 100 = 89%
Proportion of false positive = 100 – 80 = 20%
Proportion of false negative = 100 – 90 = 10%
You can see that
PPV increased
from 81.8% to 90% and
NPV decreased
from 88.9 to 47.1% , while
sensitivity
and
specificity
are stable. As shown in
the calculations below
PPV = 810 / 830 x 100 = 97.6% for prevalence of disease = 900/1000 x 100 =
90%
NPV = 80 / 170 x 100 = 47.1% for the same 90% prevalence rate

Dr. Ahmed Sameer Alnuaimi
Page 18 of 27
Slide 18
Example-1-Decrease Prevalence
Now let's
decrease
the disease prevalence to 10%
Disease status
Test
Disease
positive
Disease
free
Total
+ve
90
180
270
8
1
0
-ve
10
720
730
9
0
Total
100
900
1000
9
0
0
PPV decrease
from 81.8% to 33.3% and
NPV
increase
from 88.9 to 98.6% , while sensitivity and
specificity are stable.
Now let's decrease the disease prevalence to 10%,
without affecting the stable
validity parameters (sensitivity and specificity).
Sensitivity = 90/100 x 100 = 90%
Specificity = 720/900 x 100 = 80%
Accuracy = (90+720)/1000 = 810/1000 x 100 = 81%
Proportion of false positive = 100 – 80 = 20%
Proportion of false negative = 100 – 90 = 10%
You can notice that
PPV decreased
from 81.8% to 33.3% and
NPV
increased
from 88.9% to 98.6% , while
sensitivity
and
specificity
are
stable. As shown in the calculations below .
PPV = 90 / 270 x 100 = 33.3% for prevalence of disease = 100/1000 x 100 =
10%
NPV = 720 / 730 x 100 = 98.6% for the same prevalence rate of 10%

Dr. Ahmed Sameer Alnuaimi
Page 19 of 27
Slide 19
Example-2-effect of sensitivity
The following 2 by 2 table show the association between a
test and disease status
Disease status
Test
Disease
positive
Disease
free
Total
+ve
450
100
550
8
1
0
-ve
50
400
450
9
0
Total
500
500
1000
9
0
0
Example-2-stuying the effect of changes in sensitivity
The following 2 by 2 table show the association between a test and disease status
Sensitivity = 450/500 x 100 = 90%
Proportion of false negative = 100 – 90 = 10%
NPV = 400 / 450 x 100 = 88.9%
Prevalence of disease=500/1000 x 100 = 50%
Specificity= 400/500 x 100 = 80%

Dr. Ahmed Sameer Alnuaimi
Page 20 of 27
Slide 20
Example-2-decrease sensitivity
Now let's
decrease
the test sensitivity from 90% to 10%-
keeping the prevalence and specificity constant
The
NPV decreased
from 88.9% to 47.1%
Disease status
Test
Disease
positive
Disease
free
Total
+ve
50
100
150
8
1
0
-ve
450
400
850
9
0
Total
500
500
1000
9
0
0
Now let's decrease the test sensitivity from 90% to 10%-keeping the prevalence rate and specificity constant
Sensitivity = 50/500 x 100 = 10%
Proportion of false negative = 100 – 10 = 90%
Specificity= 400/500 x 100 = 80%
The NPV decreased from 88.9% to 47.1% , as shown in the calculations below
NPV = 400 / 850 x 100 = 47.1%
Prevalence of disease=500/1000 x 100 = 50%

Dr. Ahmed Sameer Alnuaimi
Page 21 of 27
Slide 21
Example-2-increase sensitivity
Now let's
increase
the test sensitivity from 90% to 99%-
keeping the prevalence and specificity constant
The NPV
increased
from 88.9% to 98.8%
Disease status
Test
Disease
positive
Disease
free
Total
+ve
495
100
595
8
1
0
-ve
5
400
405
9
0
Total
500
500
1000
9
0
0
Example-2-increase sensitivity
Now let's increase the test sensitivity from 90% to 99%-keeping the prevalence rate and specificity constant.
Sensitivity = 495/500 x 100 = 99%
Proportion of false negative = 100 – 99 = 1%
You can see that the NPV increased from 88.9% to 98.8%, as shown in the calculations below.
NPV = 400 / 405 x 100 = 98.8%
Prevalence of disease=500/1000 x 100 = 50%

Dr. Ahmed Sameer Alnuaimi
Page 22 of 27
Slide 22
Example-3-effect of specificity
The following 2 by 2 table show the association between a
test and disease status
Disease status
Test
Disease
positive
Disease
free
Total
+ve
450
100
550
8
1
0
-ve
50
400
450
9
0
Total
500
500
1000
9
0
0
Example-3-studying the effect of changing specificity
The following 2 by 2 table show the association between a test and disease status
Specificity = 400/500 x 100 = 80%
Proportion of false positive = 100 – 80 = 20%
PPV = 450 / 550 x 100 =81.8% for prevalence of disease = 500/1000 x 100 =
50%
Sensitivity = 450 / 500 x 100 = 90%

Dr. Ahmed Sameer Alnuaimi
Page 23 of 27
Slide 23
Example-3-decrease specificity
Now let's
decrease
the test specificity from 80% to 10%-
keeping the prevalence and sensitivity constant.
Disease status
Test
Disease
positive
Disease
free
Total
+ve
450
450
900
8
1
0
-ve
50
50
100
9
0
Total
500
500
1000
9
0
0
The
PPV decreased
from 81.8% to 50%
Example-3-decrease specificity
Now let's decrease the test specificity from 80% to 10%-keeping the prevalence and sensitivity constant.
Specificity = 50/500 x 100 = 10%
Proportion of false positive = 100 – 10 = 90%
Sensitivity = 450 / 500 x 100 = 90%
The PPV decreased from 81.8% to 50%, as shown in the calculations below
PPV = 450 / 900 x 100 =50% for prevalence of disease = 500/1000 x 100 =
50%

Dr. Ahmed Sameer Alnuaimi
Page 24 of 27
Slide 24
Example-3-increase specificity
Now let's
increase
the test specificity from 80% to 99%-
keeping the prevalence and sensitivity constant
The
PPV increased
from 81.8% to 98.9%
Disease status
Test
Disease
positive
Disease
free
Total
+ve
450
5
455
8
1
0
-ve
50
495
545
9
0
Total
500
500
1000
9
0
0
Example-3-increase specificity
Now let's increase the test specificity from 80% to 99%-keeping the prevalence and sensitivity constant
Specificity = 495/500 x 100 = 99%
Proportion of false positive = 100 – 99 = 1%
The PPV increased from 81.8% to 98.9% , as shown in the calculations below
PPV = 450 / 455 x 100 = 98.9% for prevalence of disease = 500/1000 x 100
=
50%
Sensitivity = 450 / 500 x 100 = 90%

Dr. Ahmed Sameer Alnuaimi
Page 25 of 27
Slide 25
Recap
A valid test is one that measures what it is supposed
to measure accurately.
Sensitivity and specificity are stable parameters for a
test and therefore useful for comparison across
studies.
A highly sensitive test is useful for screening
purposes.
Sensitivity and specificity has no direct clinical
application on their own.
Accuracy is useful in comparison between tests, but it
gives no idea about its specific performance.
Recap
Let us recall some core concepts presented in this lecture
A valid test is one that measures what it is supposed to measure
accurately.
Sensitivity and specificity are stable parameters for a test and therefore
useful for comparison across studies.
A highly sensitive test is useful for screening purposes.
Sensitivity and specificity has no direct clinical application on their own.
Accuracy is useful in comparison between tests, but it gives no idea
about its specific performance.

Dr. Ahmed Sameer Alnuaimi
Page 26 of 27
Slide 26
Recap-2
Only a well trained physician is able to assess the
predictive value of a test result in assessing disease
membership, since he can give an assumption of
pretest probability or prevalence of the outcome for a
subject.
The predictive value of a positive test result can be
maximized by increasing specificity and prevalence.
The predictive value of a negative test result can be
maximized by increasing sensitivity and decreasing
the prevalence or pretest probability.
Recap
Only a well trained physician is able to assess the predictive value of a
test result in assessing disease membership, since he can give an
assumption of pretest probability or prevalence of the outcome for a
subject.
The predictive value of a positive test result can be maximized by
increasing specificity and prevalence.
The predictive value of a negative test result can be maximized by
increasing sensitivity and decreasing the prevalence or pretest
probability.

Dr. Ahmed Sameer Alnuaimi
Page 27 of 27
Slide 27
The
Thank you for listening