Pediatric E.C.G
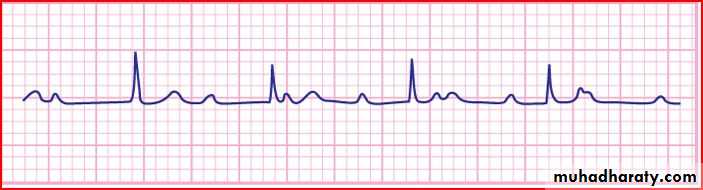
The electrocardiogram should be read systematicallyHeart rate (300/no.of large squares between R-R)OR(1500/NO.of small squares between R-R)
P wave axis (the P wave should be upright in leads I and aVF and inverted in lead Avr)-Normally less than 2-3 small squares (0.08-0.12 sec) wide and tall
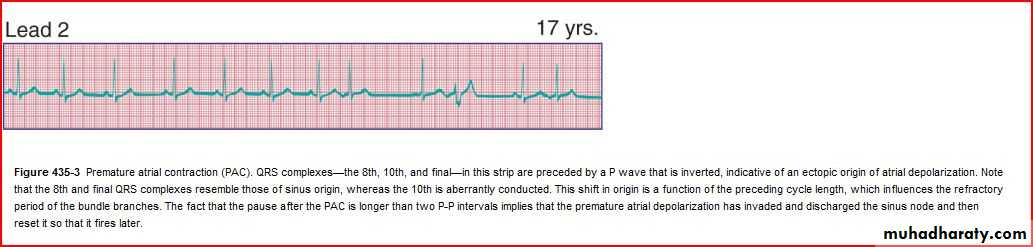
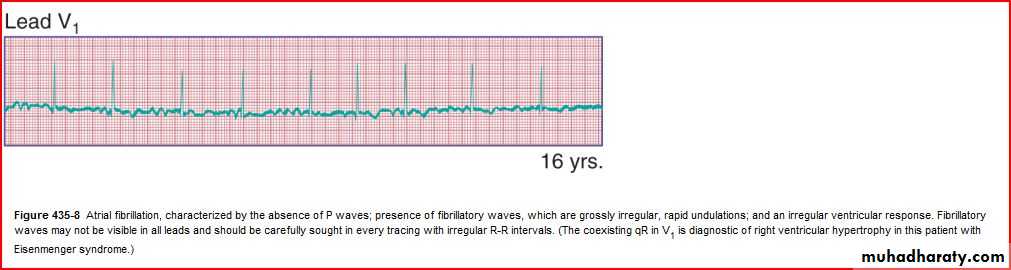
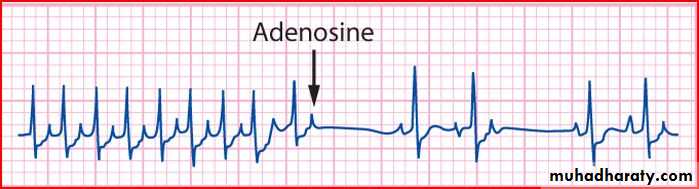
Rhythm
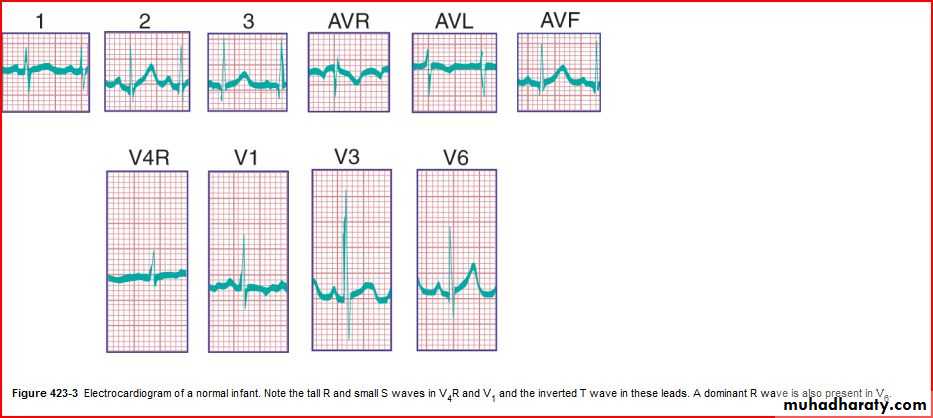
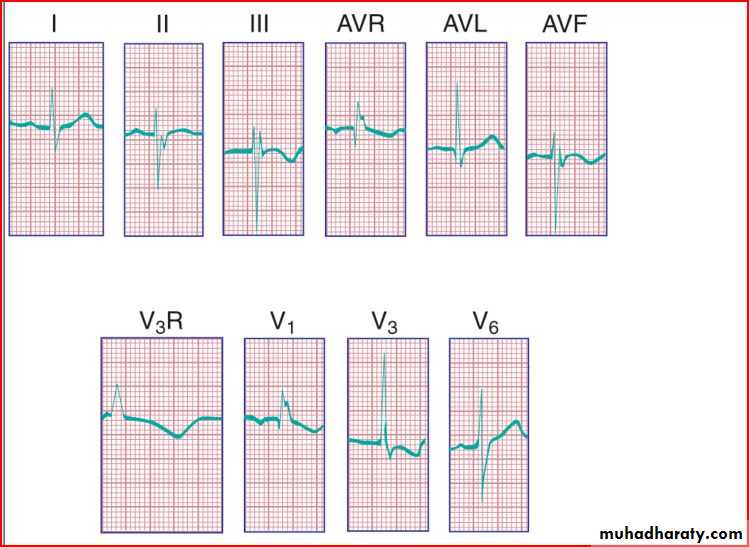
QRS axis (In a newborn, the mean QRS frontal-plane axis normally lies in the range of +110 to +180 degrees. The right-sided chest leads reveal a larger positive (R) than negative (S) wave and may do so for months or years because the right ventricle remains relatively thick throughout infancy-Over the years, the QRS axis gradually shifts leftward, and the right ventricular forces slowly regress. Leads V1, V3R, and V4R display a prominent R wave until 6 mo to 8 yr of age)
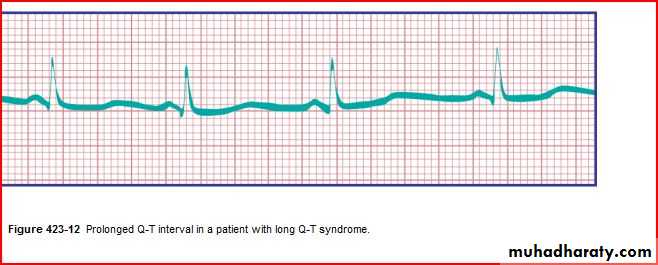
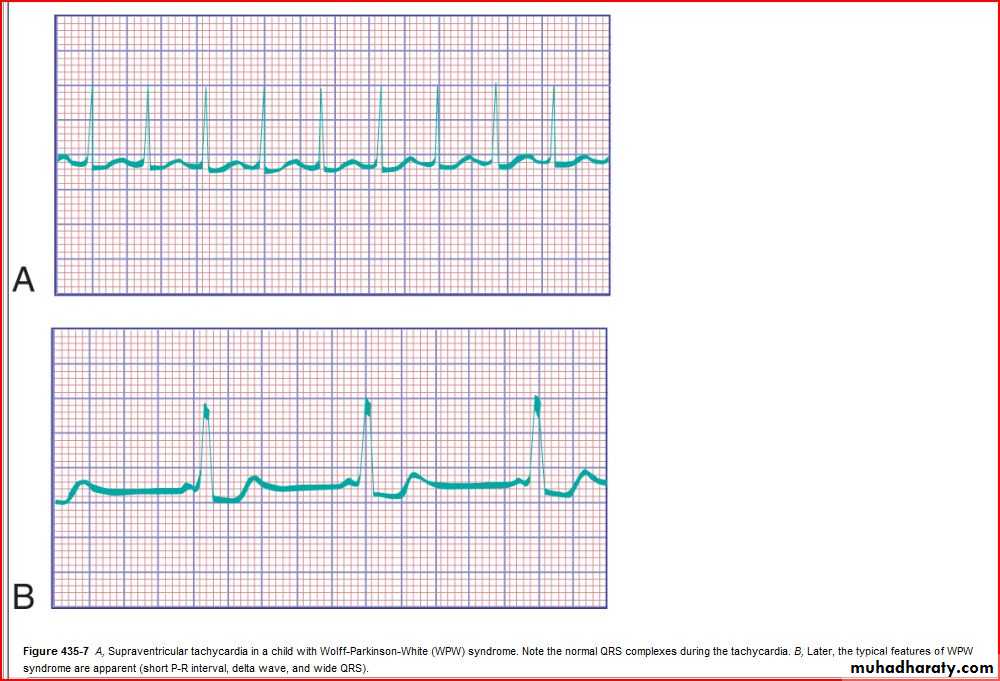
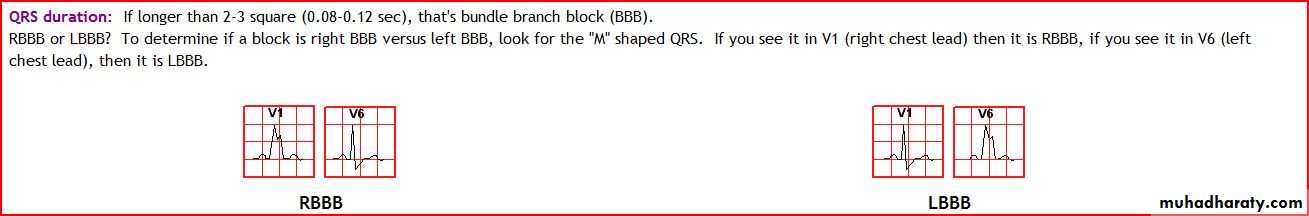
Intervals PR, QRS, QT/QTc (PR 3-5 SMALL SEQUARES)(QRS If longer than 2-3 square (0.08-0.12 sec), that's bundle branch block (BBB).
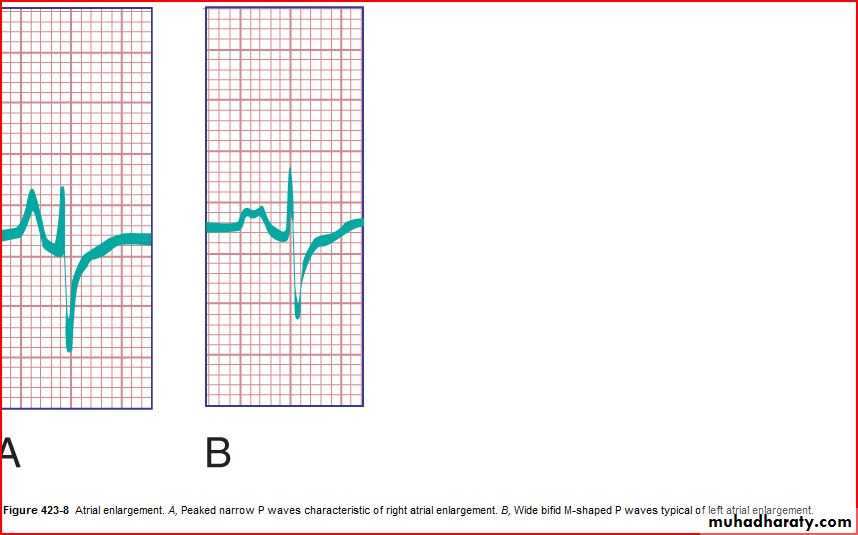
P wave amplitude and duration (RA and LA enlargement)
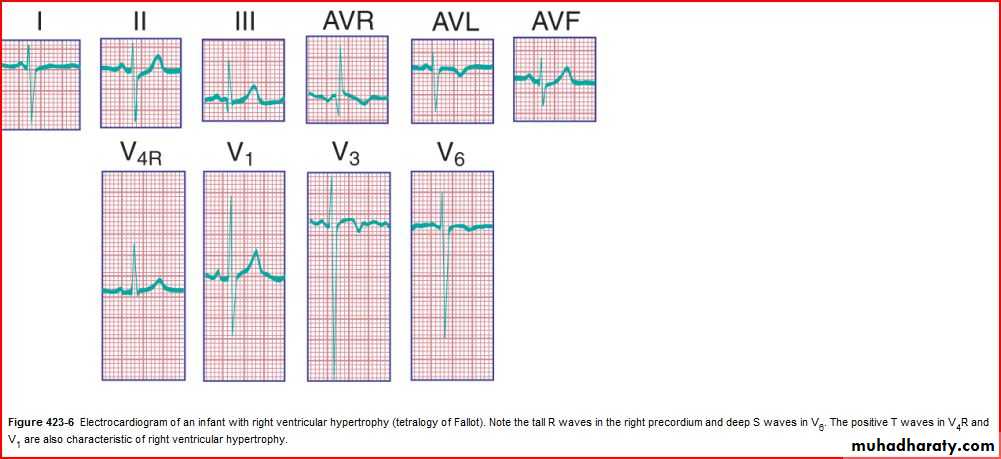
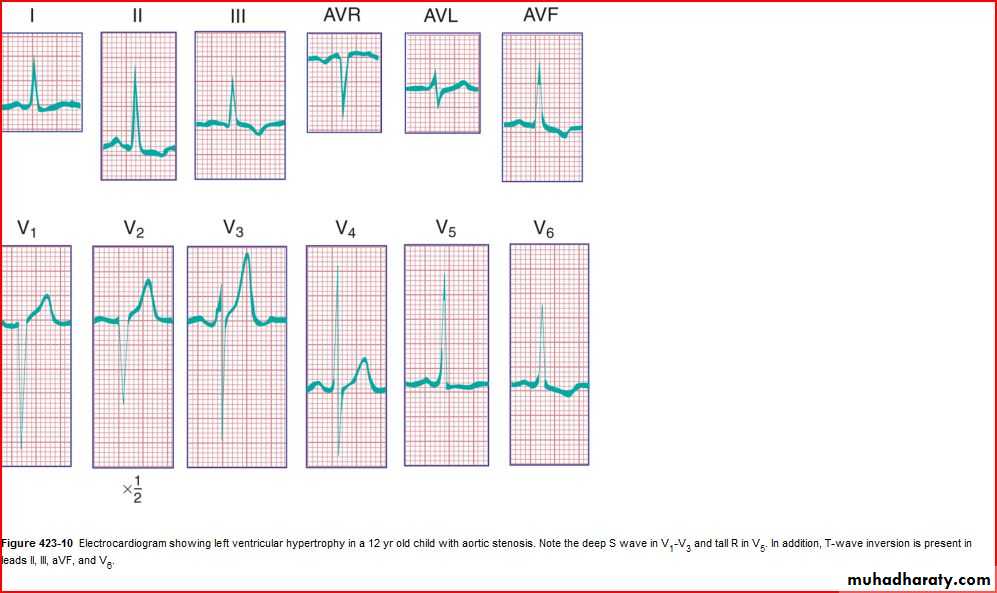
QRS amplitude, R/S ratio, Q waves (RVH – LVH)
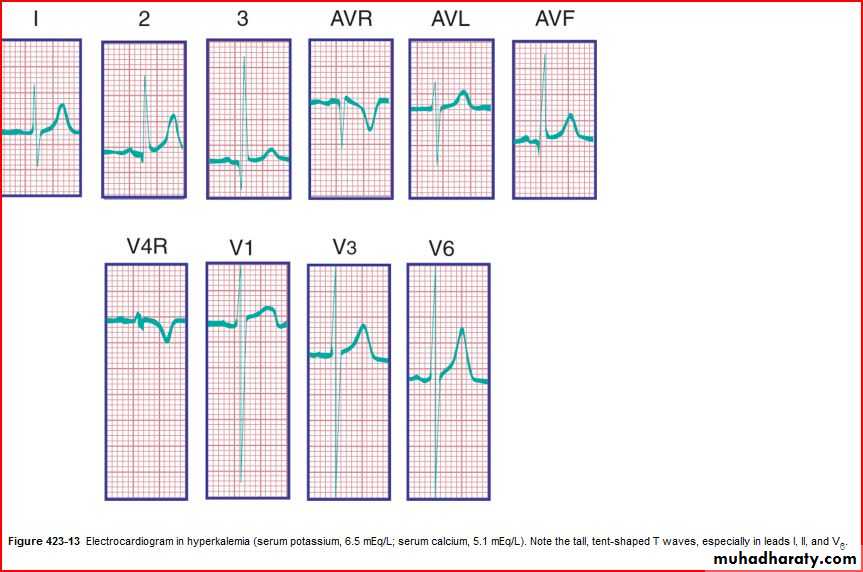
ST segments and T wave
T wave inversion: Infants older than 48 hours of age should have inverted T waves in the right praecordial leads. These findings persist throughout childhood with inversion to V4 being accepted as normal. There is a progressive change to an upright T wave across the praecordial leads from left to right as the child grows older. Until 8 years of age an upright T wave in V1 is considered a sign of right ventricular hypertrophy. Many children will show persistence of an inverted T wave in V1 until their late teens
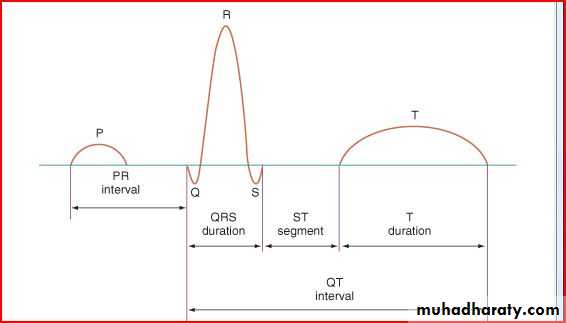
PR interval if > 5 small sequares is prolonged
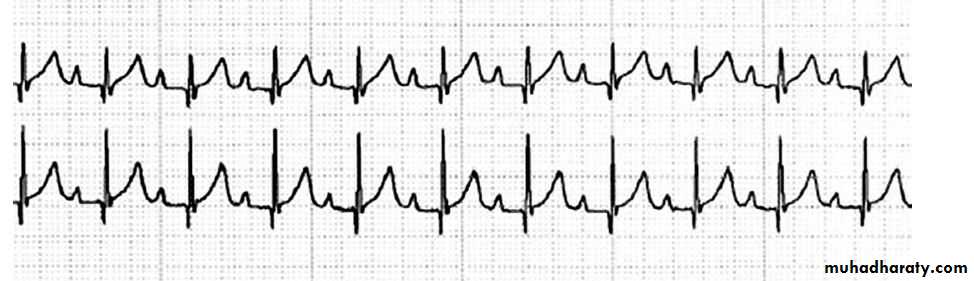
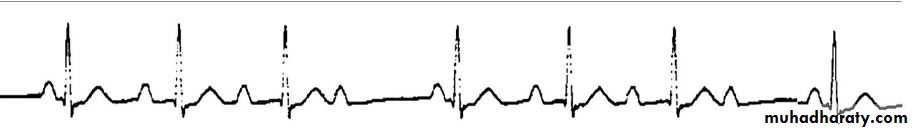
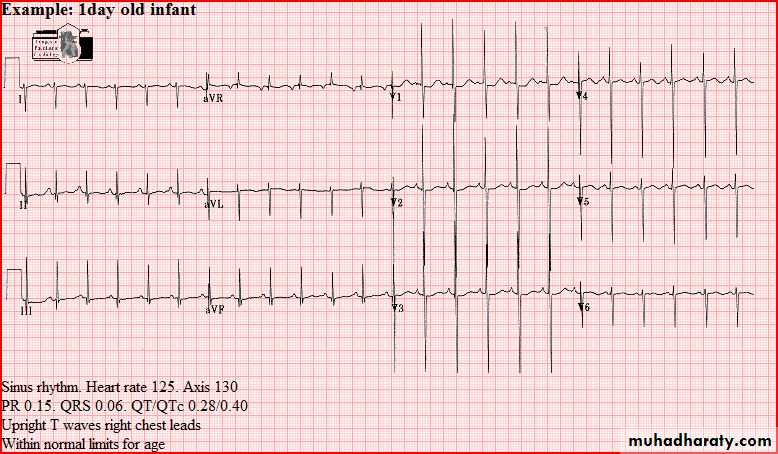
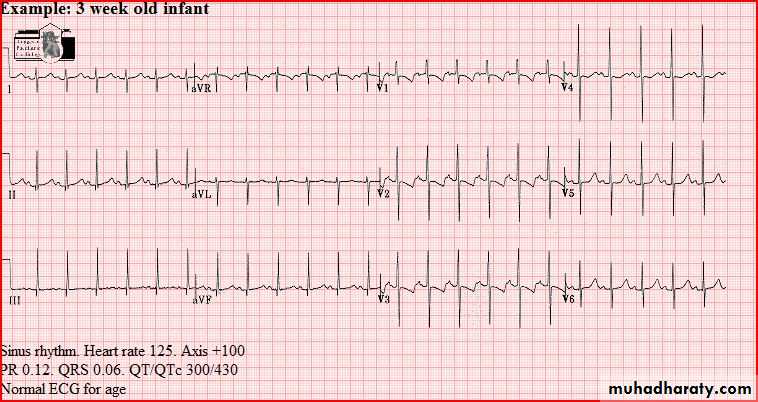
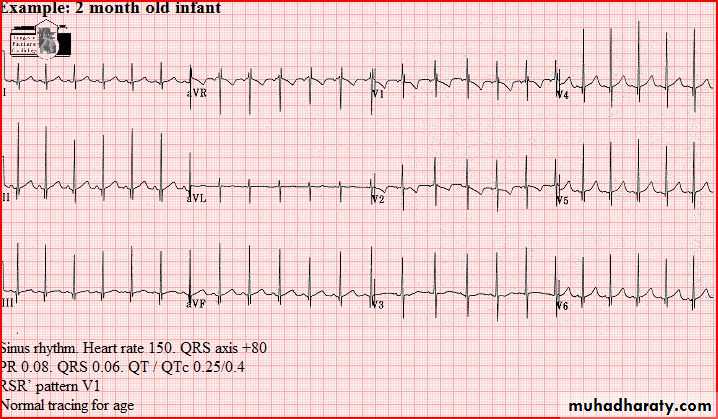
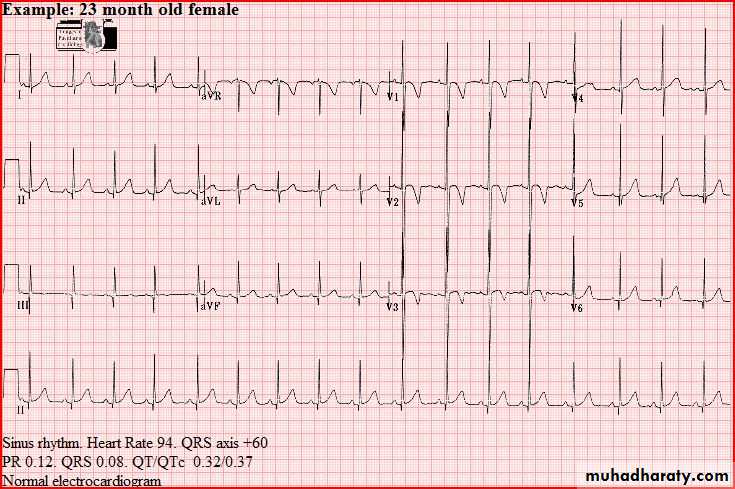
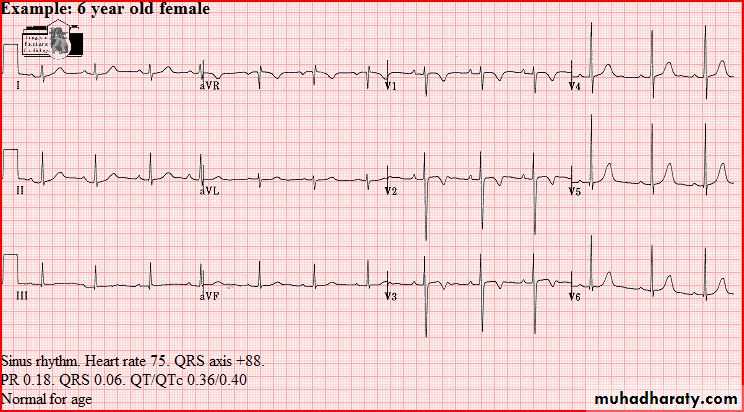
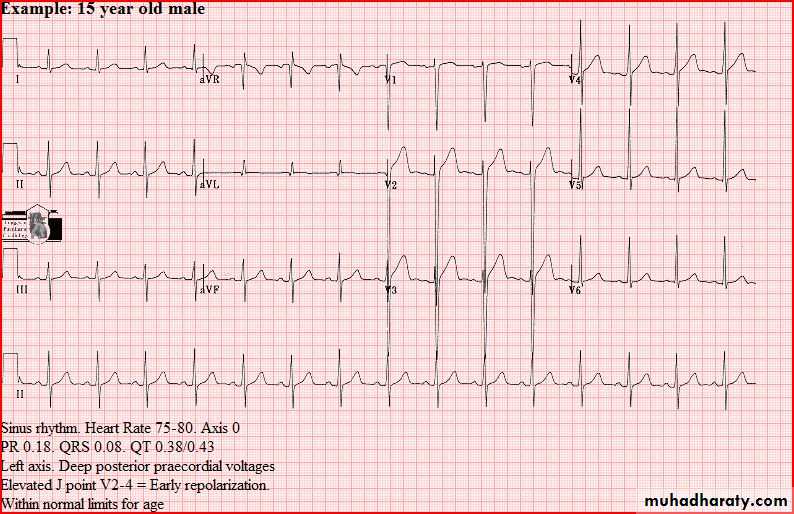
Normal tracings Examples of normal tracings for the different age groups follow, preceded by a general description of the characteristics of that age group.

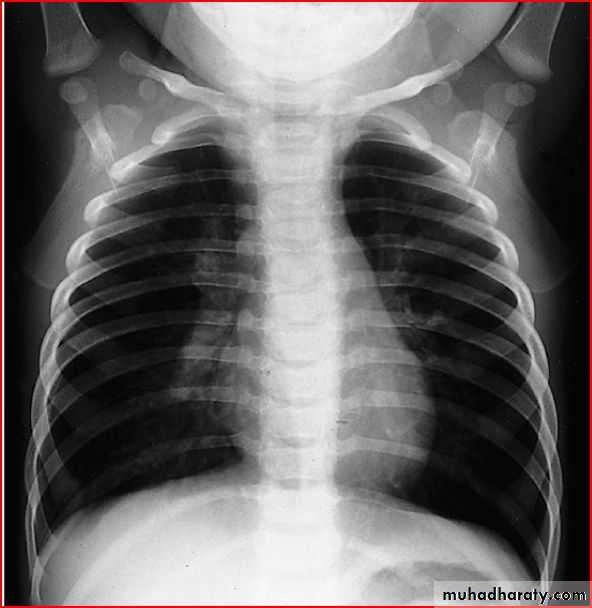
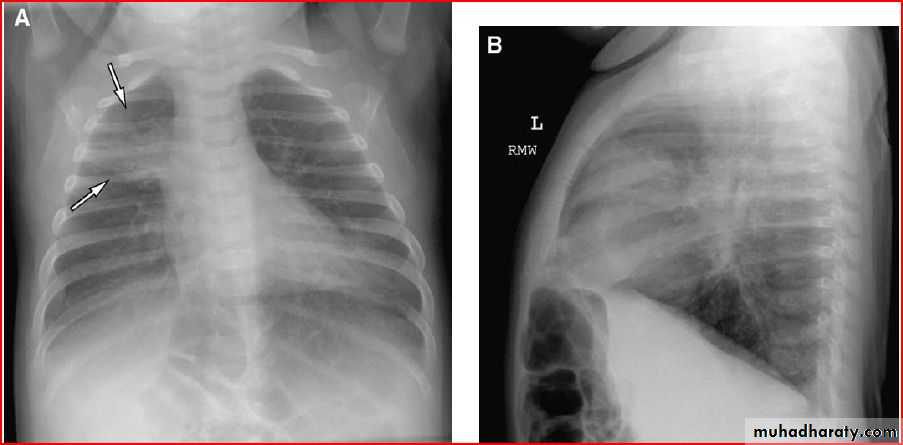
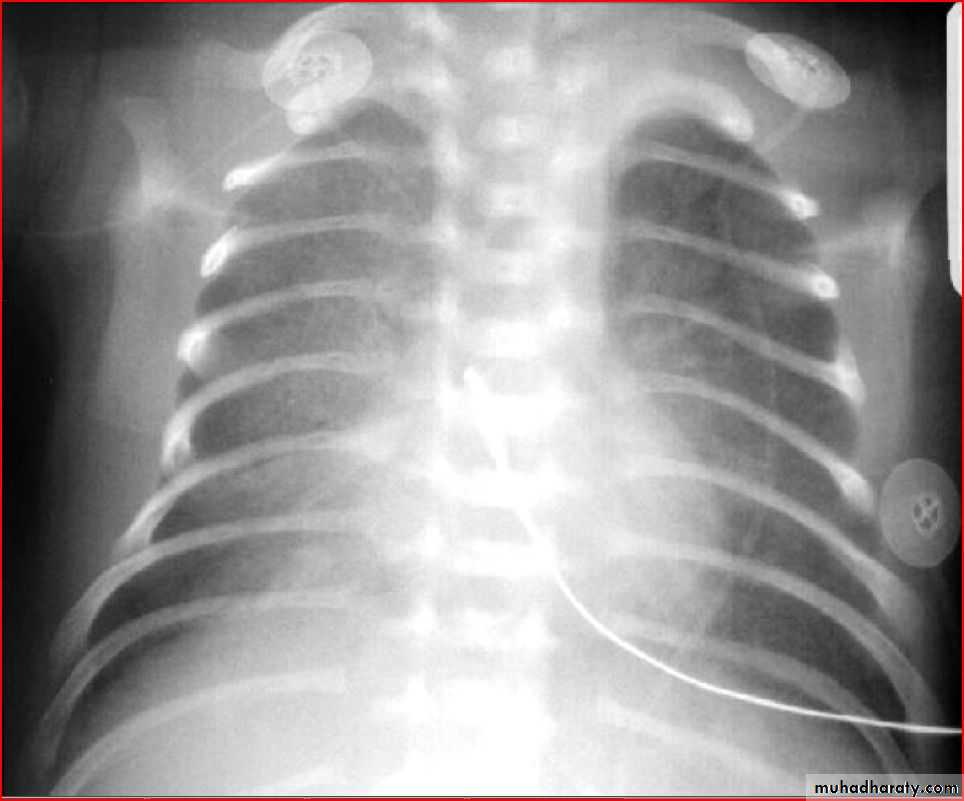
Bronchoilitis
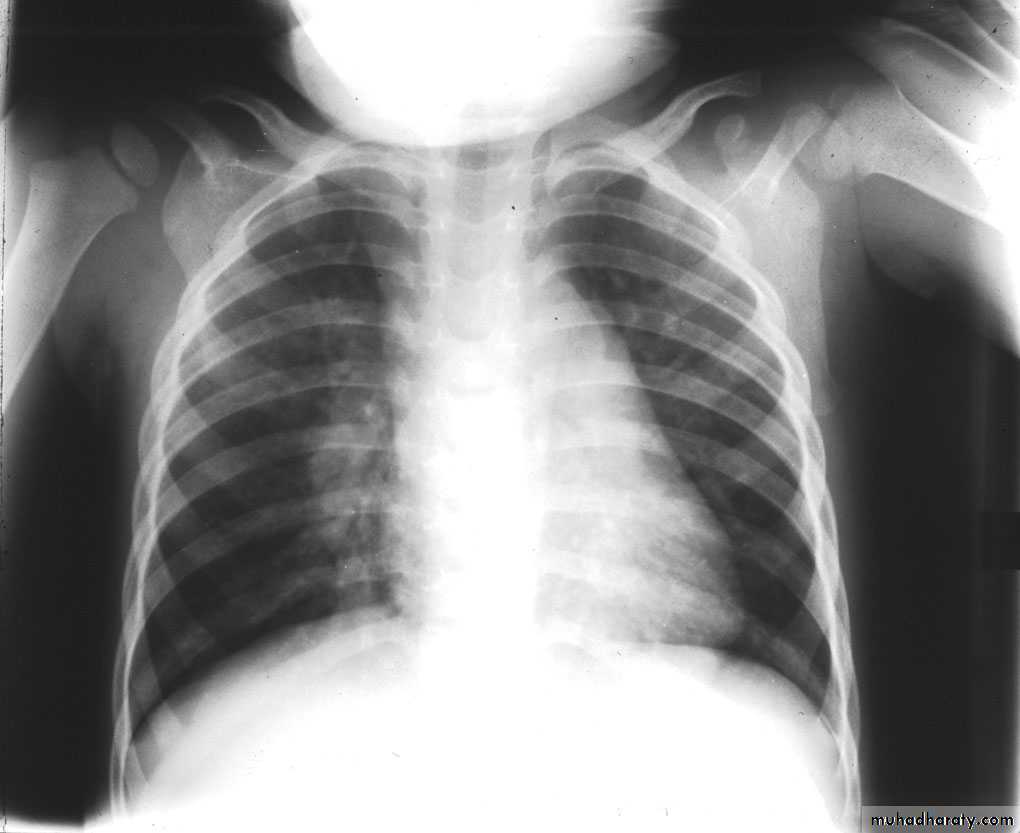
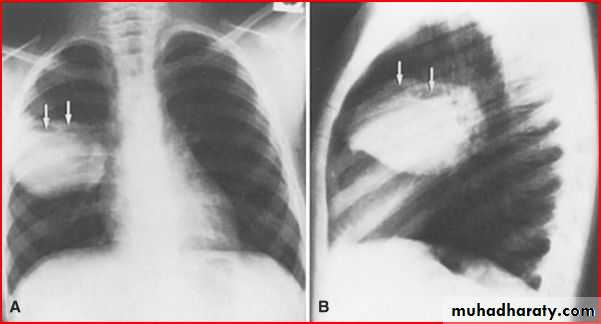
Middle lobe pneumonia
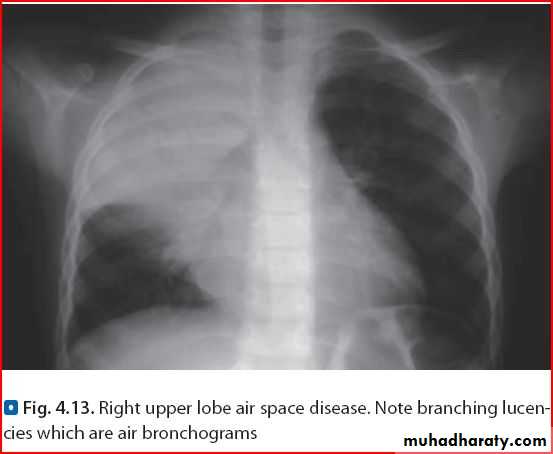
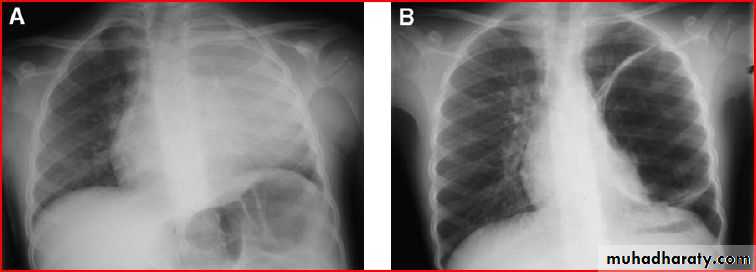
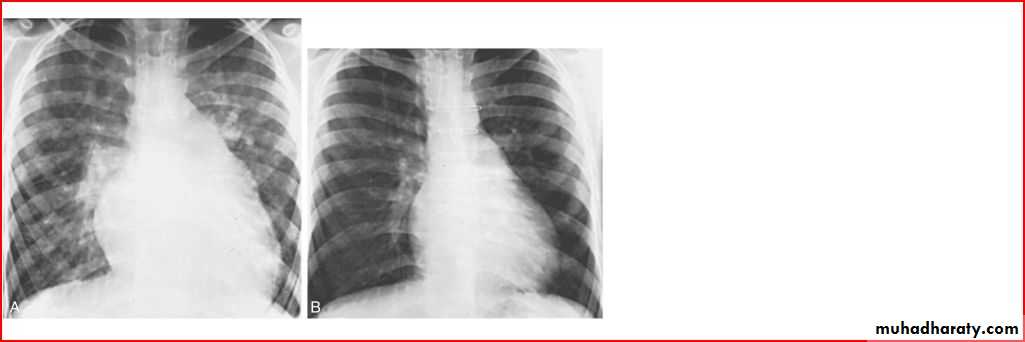
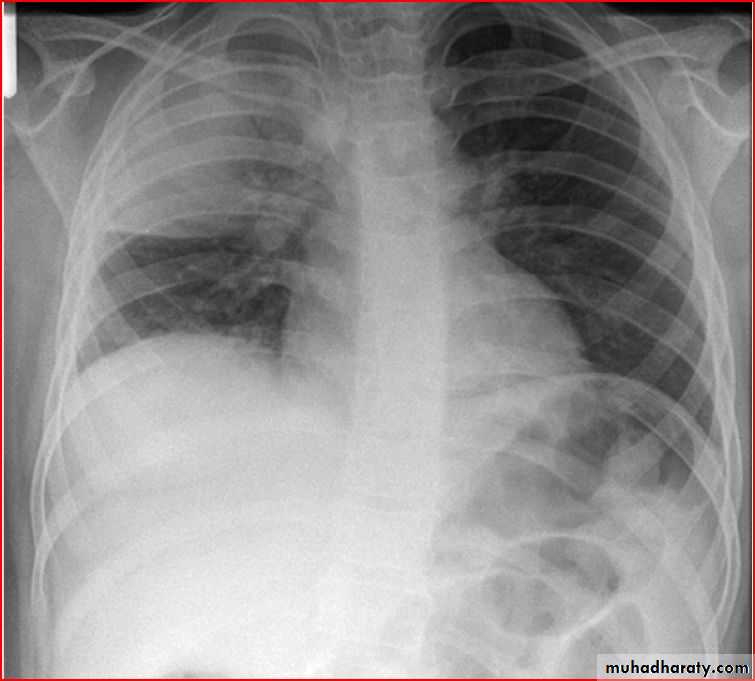
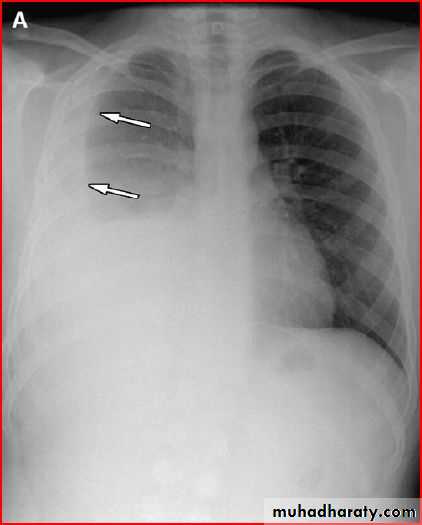
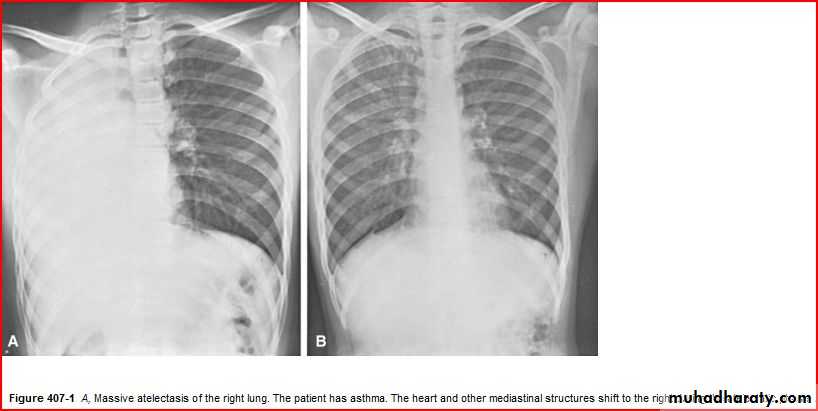
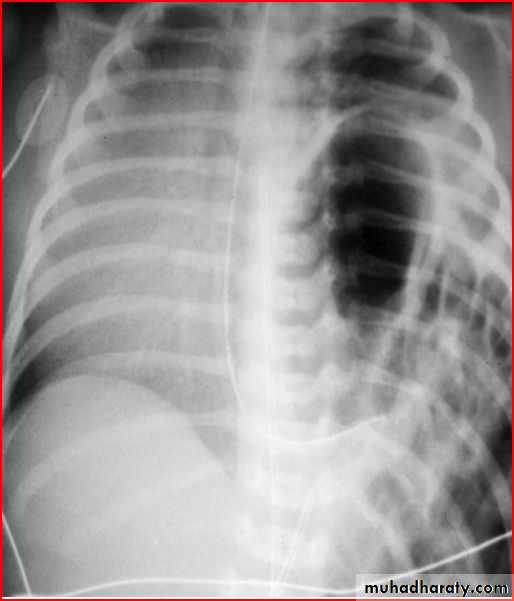
Whole right lung pneumonia
Normal after the tratment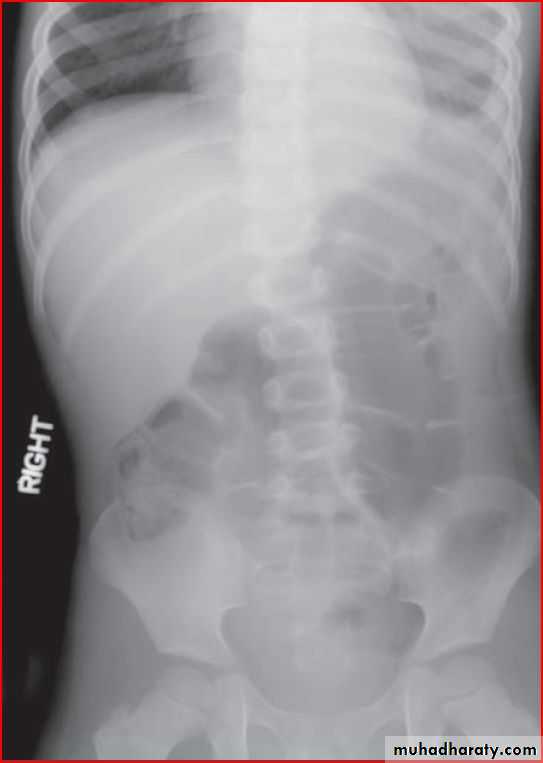
Basal left lobe pneumonia
May be presented as abdomial pain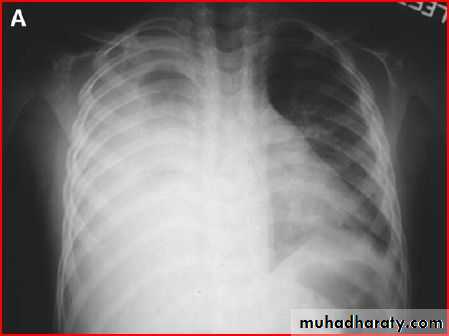
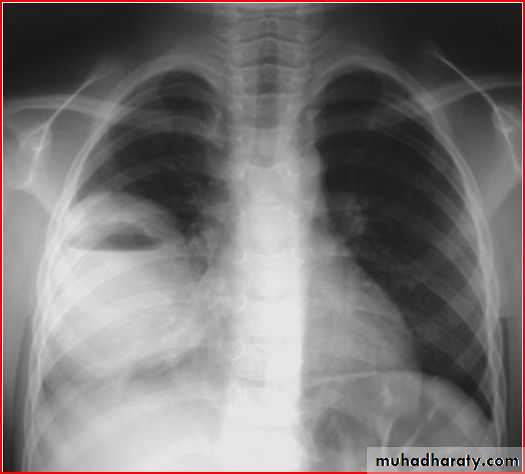
Pneumatocele ( air lined wall
Cause : staph aureus infection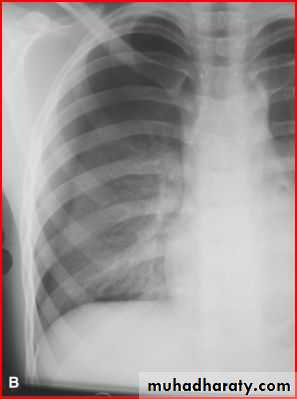
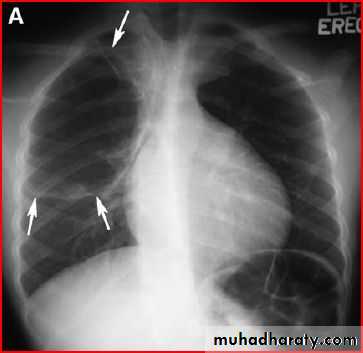
pneumothorax
Tension pneumothorax
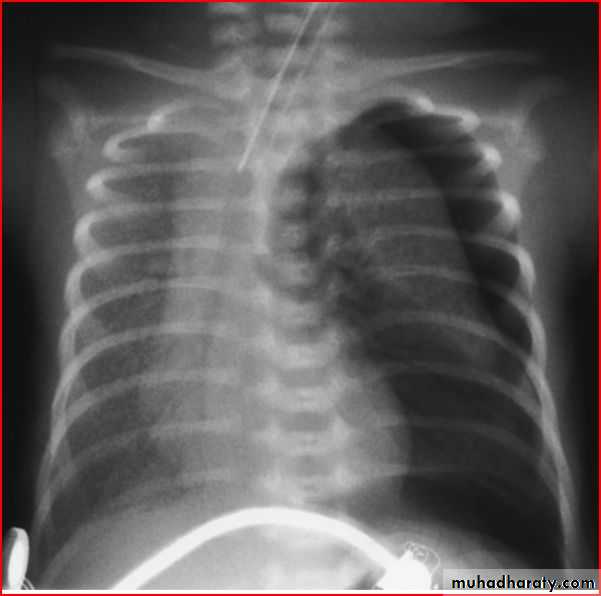
Respiratory distress syndrome ( hyaline membrane disease )
Radiological features : glasss ground appearance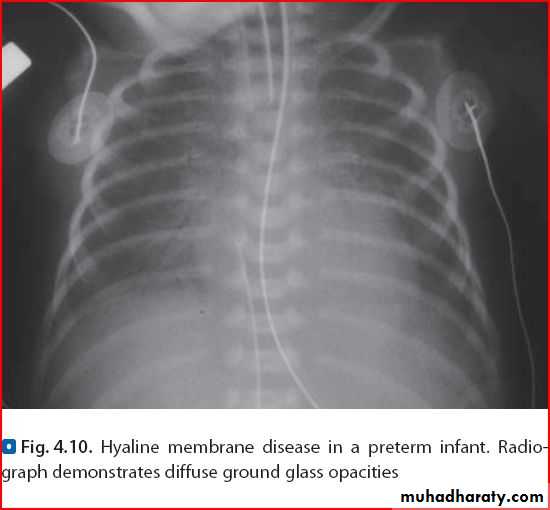
Lung abcess
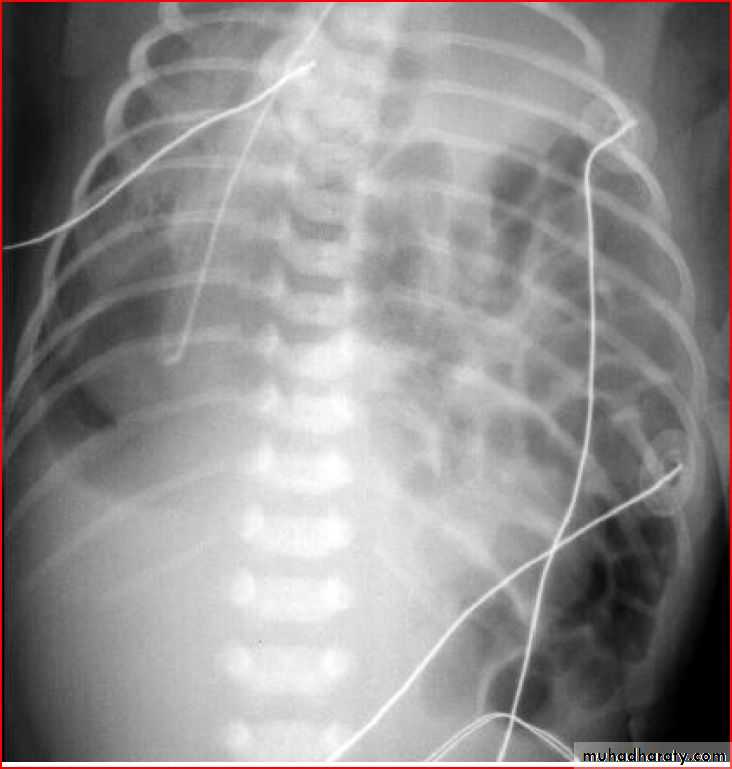
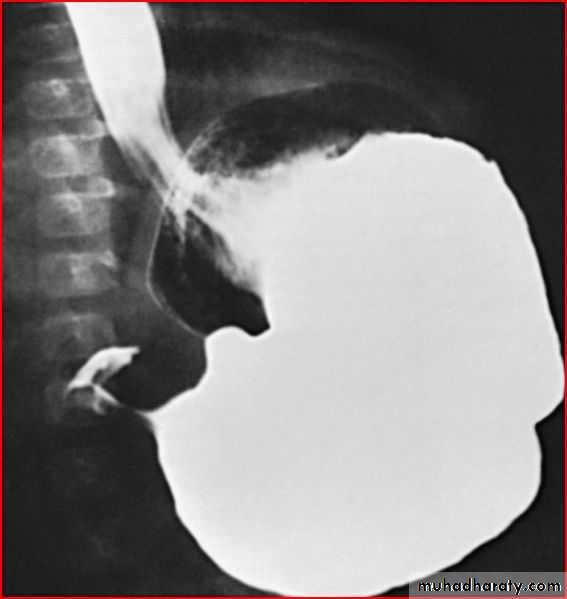
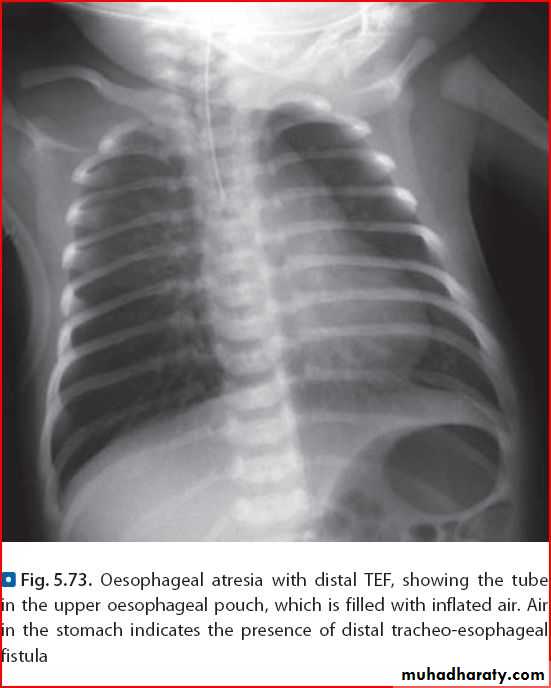
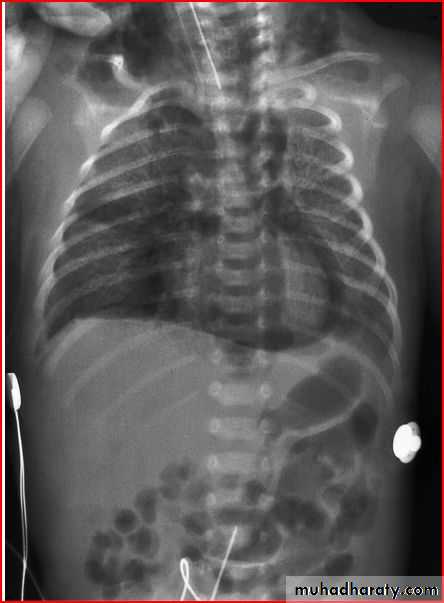
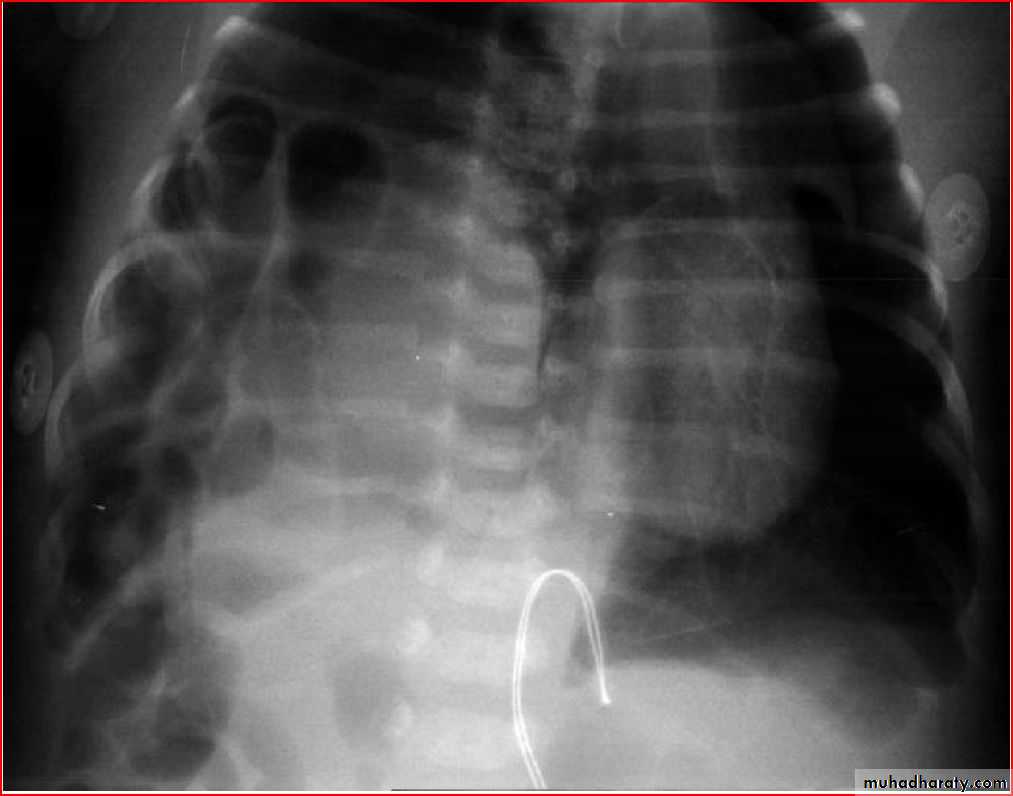
Diaphgramtic hernia
Lung abcess
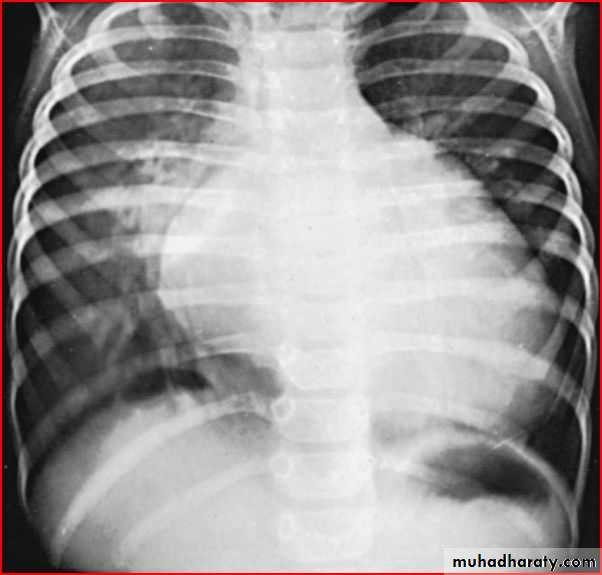
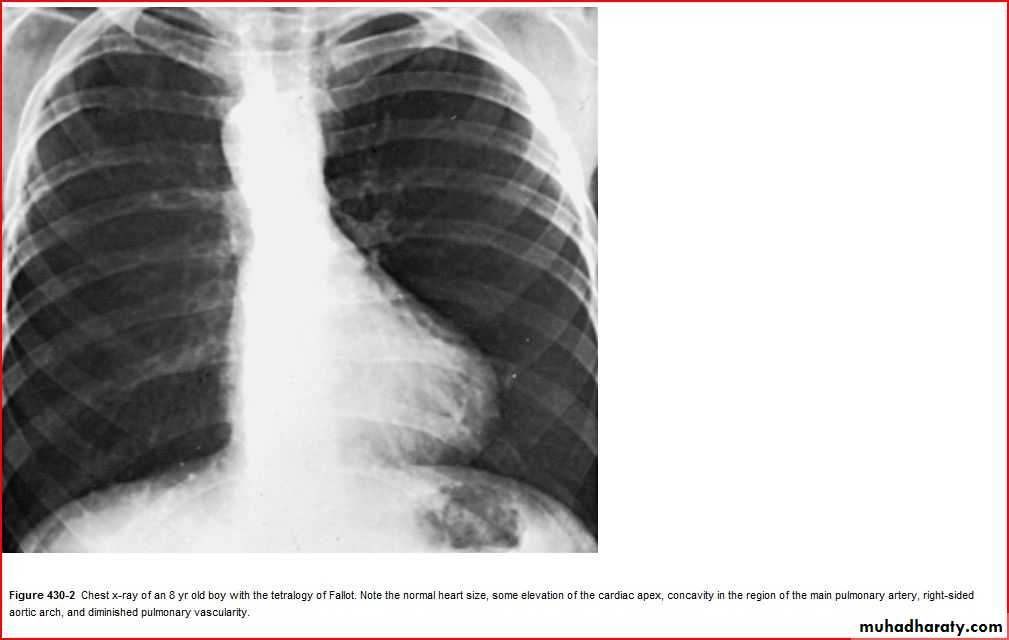
cardiomegaly