Introduction
-
Lecture 1+2
54
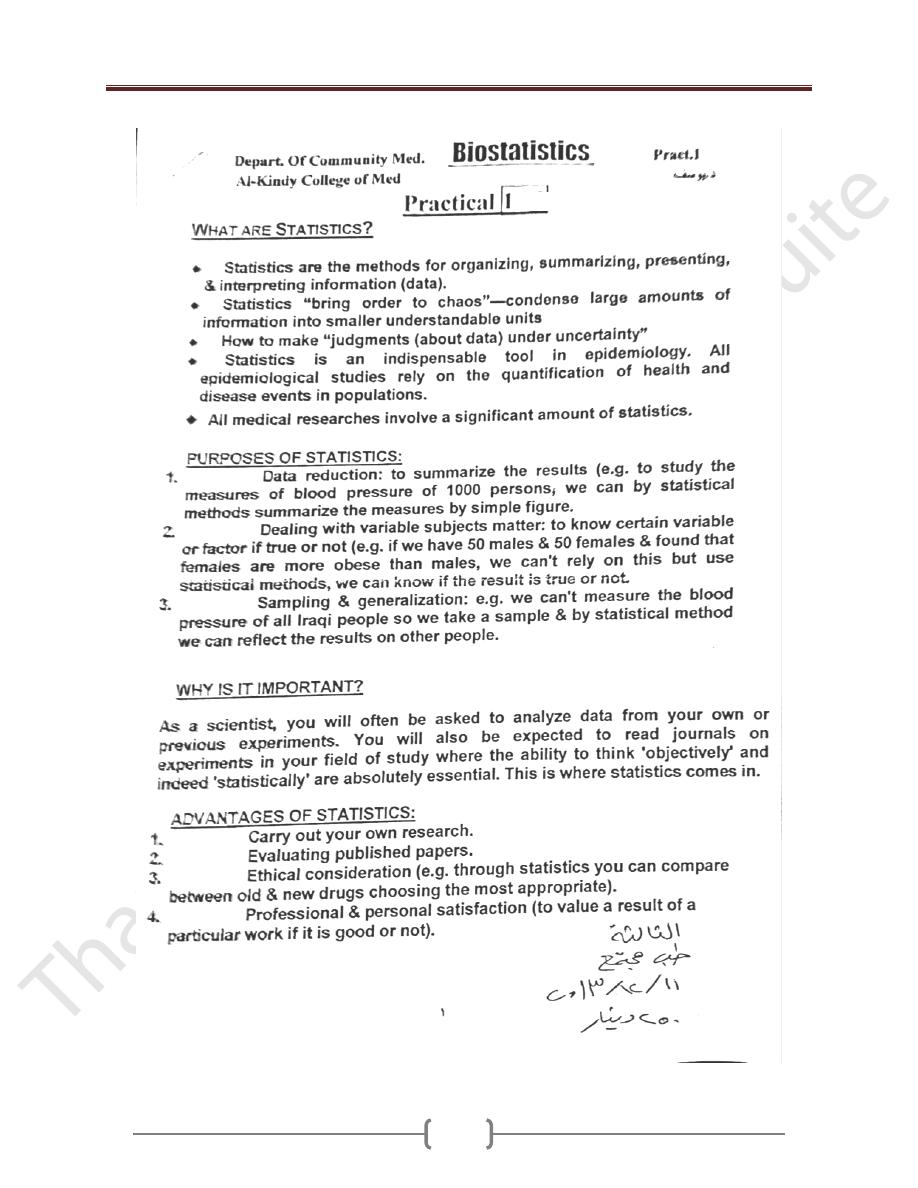
Introduction.
"The importance of medical statistics"
*"Smoking cigarettes causes lung cancer". This is now a
somewhat uninteresting fact because it is such common
knowledge, yet 60 years ago relatively few people were
aware of this. It has only been with the aid of research
methods and statistical techniques that such a
consequence of smoking was introduced to society and is
now well accepted. Research has since shown us
numerous other diseases that are caused by smoking. As a
result of people giving up smoking, there has been a
dramatic reduction in deaths in many countries.
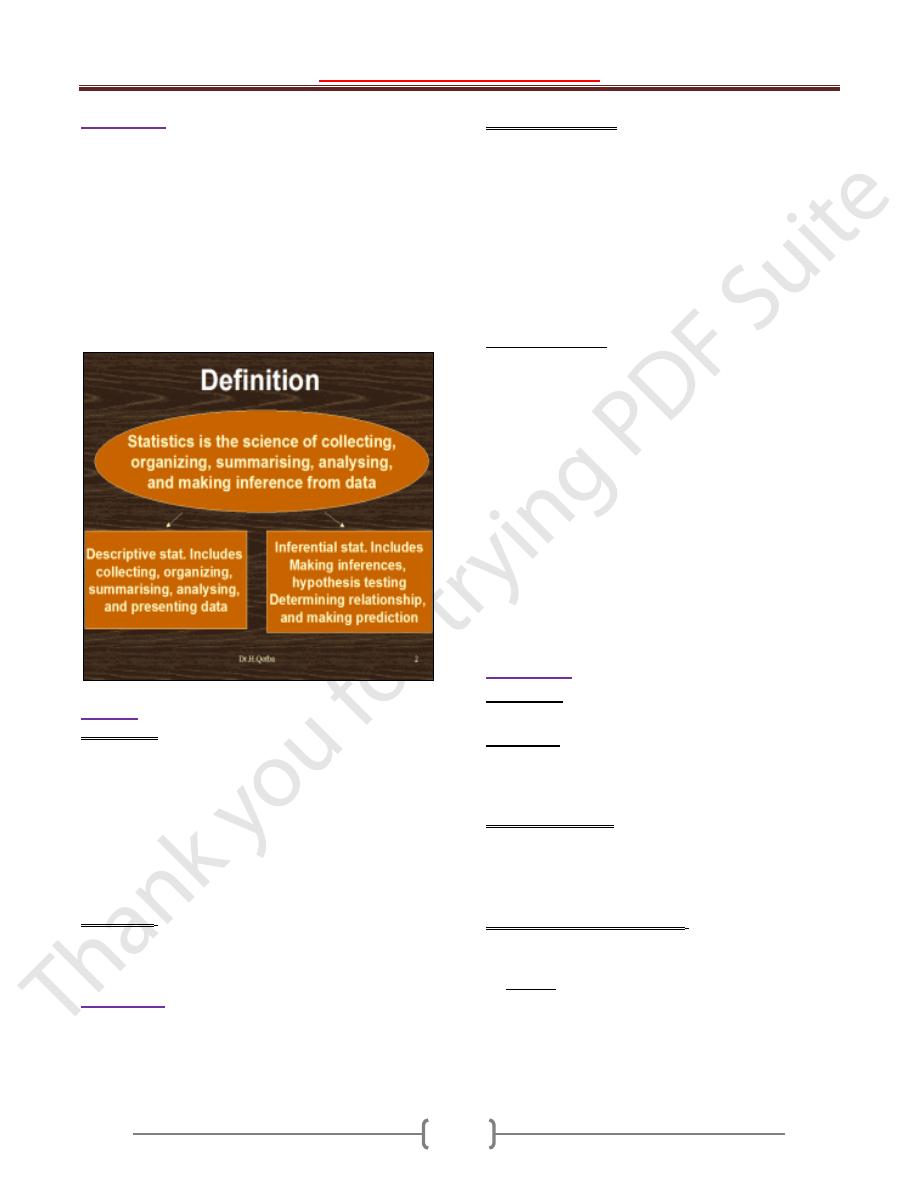
Statistic
is the field of study which can be classified into;
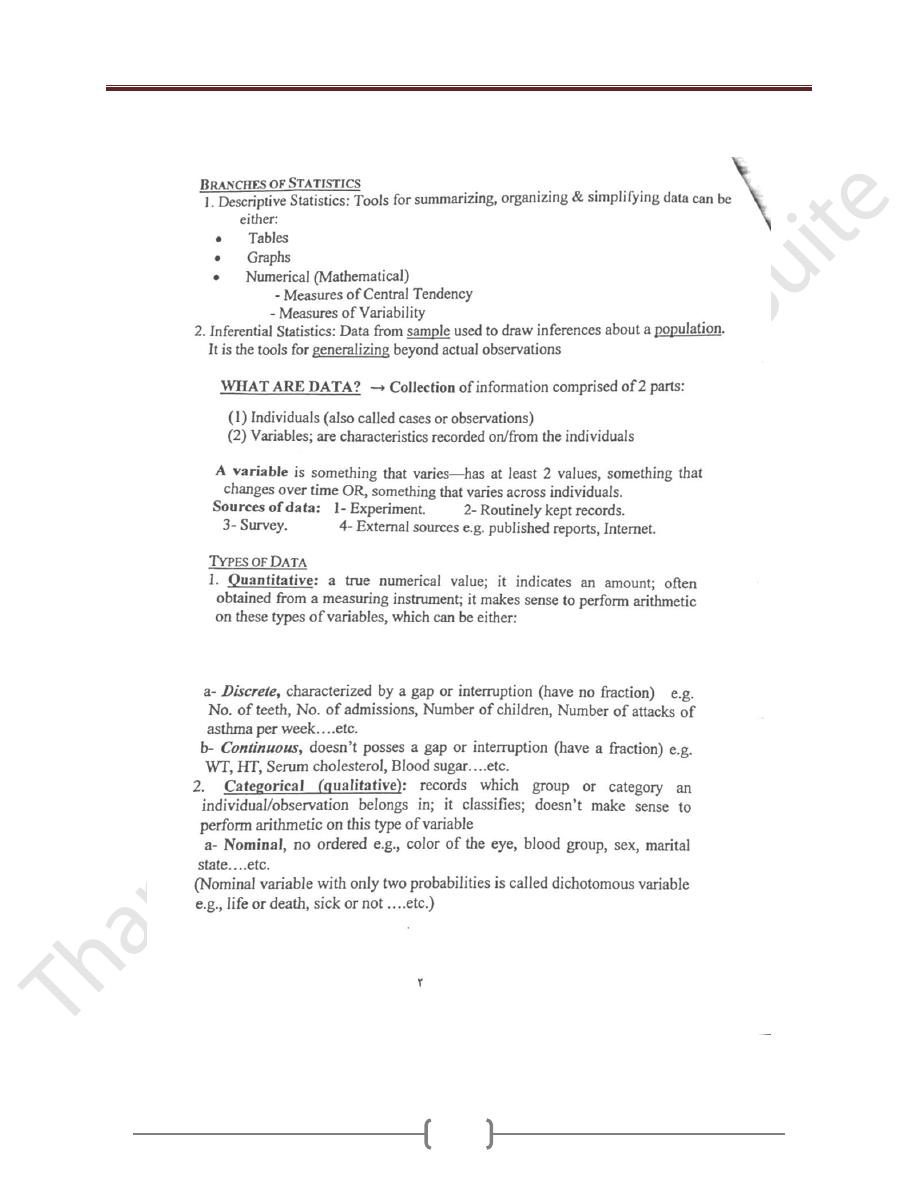
1) Descriptive: Concern with collection, classification,
organization and summarization (reduction) of the data.
((They are merely descriptive & used to describe the basic
features of the data in a study. They provide simple
summaries about the measures make no attempt to draw
conclusion)). They can be:
a- Tabular ((tables)).
b- Diagrammatic ((Figures)).
c- Numerical ((Numbers)).
2) Inferential: Concern with drawing conclusions from the
data that extend beyond the immediate data alone. The
conclusion drawn will influence sub- sequent decision.
Biostatistics
:
The statistics that concern with biological
& medical aspects.
Uses of Biostatistics:
1) Measure & analyze the health status and health problems
in the community.
2) Compare the health status of the community with others.
3) Planning for the health services.
4) Evaluation of the health services & estimation the future
needs.
5) For research purposes. "Statistics is vital & central to
most medical research".
6) Evaluation of published paper.
Learning objective: To understand the basic statistical
principles commonly used in Public Health.
We are living in the information age, the information
about which we are concerned are called data (raw
material of statistics) and these data are a available to us
in form of numbers (values). Two kinds of number are
used in statistics;
1) Numbers (values) that result from the process of
counting "Frequencies" e.g. No. of patient admitted
to the hospital per day, No. of teeth……etc.
2) Number (values) that result from measurement e.g.
B.P, WT, and HT……etc.
3) Sources of data: 1- Experiment. 2- Survey.
3- Routinely kept records.
4) External sources e.g. published reports, Internet.
Quantities;
can be classified into:
1)
Constants,
quantities which are not vary e.g. ח
= 3.14,
this type not need statistical analysis.
2)
Variables
, quantities which vary (take different values
in different person, place, &/or time e.g. WT, HT,
BP..etc; this type need statistical analysis.( Statistics
deals with variables )
Random variable;
Is the variable that arises as a result of chance factors, so
can't be exactly predicted in advance. e.g. HT, WT,
when a child born, we can't predict exactly his/her HT or
WT at maturity.
Variables are subdivided into;
1) Quantitative (Numerical); can be measured by the usual
sense e.g. age, WT, HT….etc. This can be either:
a) Discrete, taking some value in discontinues set of
value (charect by a gap or interruption, have no
fraction) e.g. No. of teeth, No. of admissions, Number
of children, Number of attacks of asthma per
week….etc..

Introduction
-
Lecture 1+2
55
b) Continuous, taking some value in an infinity divisible
range of value (doesn’t possess a gap or interruption,
have a fraction, we can find another value somewhere
in between) e.g. WT, HT, Serum cholesterol, Blood
sugar….etc.
2) Qualitative (Categorical); can't be measured by the
usual sense but must describe in category. This can be
either:
a) Nominal, defined by un ordered categories. E.g., color
of the eye, blood group, sex, marital state….etc.
(Nominal variable with only two probabilities is called
"dichotomous variable" e.g., life or death, sick or
not ….etc.
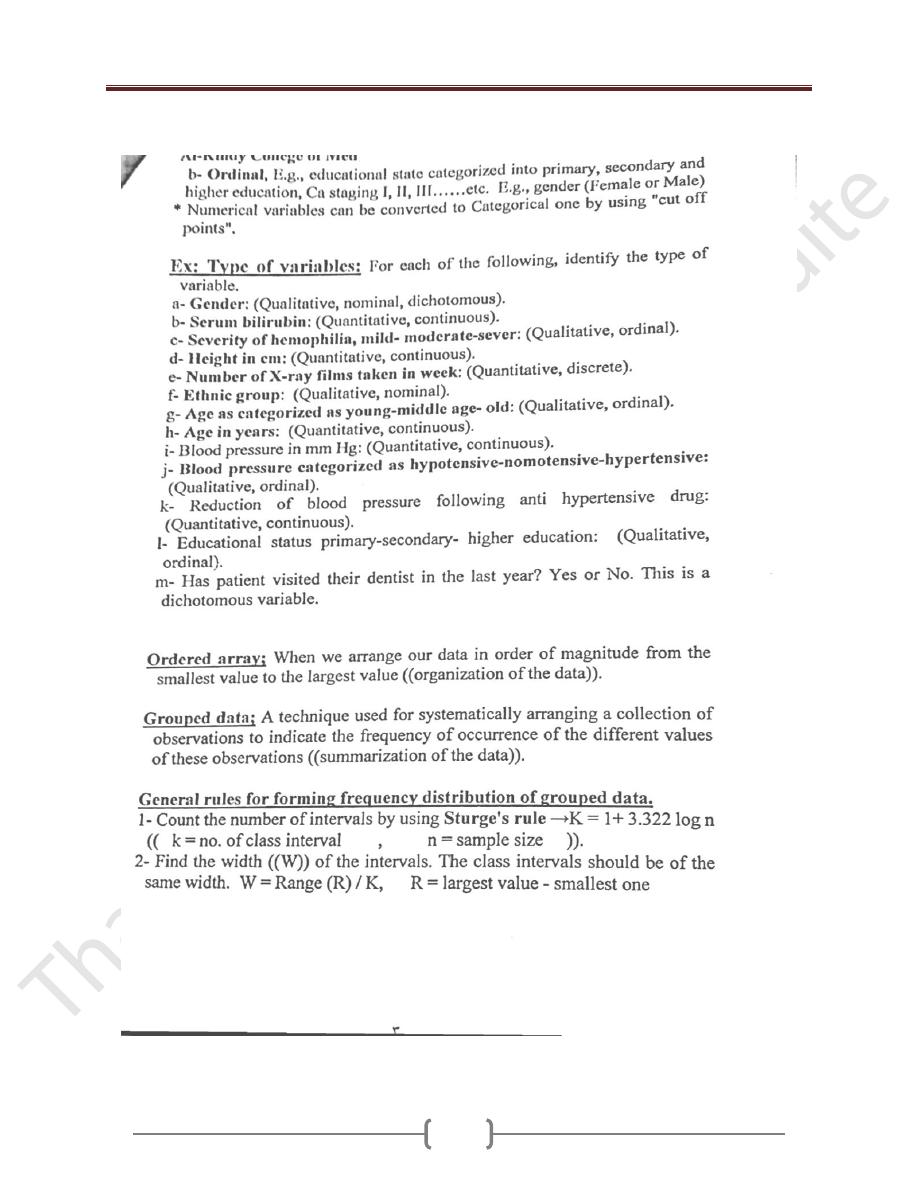
b) Ordinal, defined by ordered categories. E.g.,
educational state categorized into primary, secondary
and higher education, Cancer staging I, II, III……etc.
Notes;
I. It is important to be able to distinguish different types of
data from one another as we use different techniques to
describe and analyses the different types.
II. Numerical variables can be converted to Categorical one
by using "cut off points". For example, blood pressure can
be turned into a nominal variable by defining
"hypertension" as a diastolic blood pressure greater than
90 mmHg, and "normotension" as blood pressure less
than or equal to 90 mmHg. Height (continuous) can be
converted into "short", average" or "tall" (ordinal). In
general it is easier to summarize categorical variables, and
so quantitative variables are often converted to categorical
ones for descriptive purposes as in make a clinical
decision on serum potassium level, one does not need to
know the exact serum potassium level (continuous) but
whether it is within the normal range (nominal) also It
may be easier to think of the proportion of the population
who are hypertensive than the distribution of blood
pressure.
Ordered array
: When we arrange our data in order of
magnitude from the smallest value to the largest value
((organization of the data)).
Ex; (9, 2, 5, 7, 3, 1) → In ordered array→ (1, 2, 3, 5, 7,
9).
Grouped data:
A technique used for systematically
arranging a collection of observations to indicate the
frequency of occurrence of the different values of these
observations ((summarization of the data)).
To group a set of observations, we select a set of
contiguous, non overlapping intervals in such away that
each value in the set of observation can be placed in one
interval only, these intervals usually called "class-
intervals". The no. of values falling in each class interval
is called "Frequency distribution". Ex. Frequency
distribution of Ht in cm of 61 subjects.
Class interval Ht(cm)
Frequency
100-119
120-129
130-139
140-149
≥150
5
19
10
13
4
Total
61
General rules for forming frequency distribution of
grouped data.
1) Count the number of intervals by using "Sturge's rule":
K = 1+ 3.322 log n (k = no. of class interval, n =
sample size).
2) Find the width ((W)) of the intervals. The class intervals
should be of the same width. W = Range (R) / K ,
R = largest value - smallest one
Ex; The Wt of malignant tumor (in gm) removed from the
abdomen of 57 subjects are 68, 63, 42, 27, 30, 36, 28, 32,
79, 27, 22, 23, 24, 25, 44, 65, 43, 25, 74, 51, 36, 42, 28,
31, 28, 25, 45, 12, 57, 51, 12, 32, 49, 38, 42, 27, 31, 50,
38, 21, 16, 24, 69, 47, 23, 22, 43, 27, 49, 28, 23, 19, 46,
30, 43, 49, 12.
Construct the frequency distribution by calculating the
suitable no. of class intervals.
K = 1+ 3.322 log n = 1+ 3.322log
57
= 1 +
3.322(1.755) = 7
W = R/K = (79-12) / 7 = 9.6 ~ 10
Class interval Wt(kg)
Frequency
10 – 19
20 - 29
30 - 39
40 - 49
50 - 59
60 - 69
70 - 79
5
19
10
13
4
4
2
Total
57
Introduction
-
Lecture 1+2
56
Note. Too few intervals are undesirable because of the
resulting loss of information, and too many intervals will
not meet the objective of summarization.
The Mid-Point of the class interval is obtaining by
computing the mean of the upper & lower limits of the
interval.
The Cumulative Frequency; is the frequency regarding
two or more intervals.
The Relative Frequency; is the proportion of value with
in each class interval. This is obtained by dividing the
class frequency by the total frequency for all classes x
100((usually express as percentage)).
The Cumulative Relative Frequency; is the relative
frequency for two or more class intervals ((also usually
express as percentage)).
Ex1: Frequency, cumulative frequency, relative
frequency, & cumulative relative frequency for the
previous example.
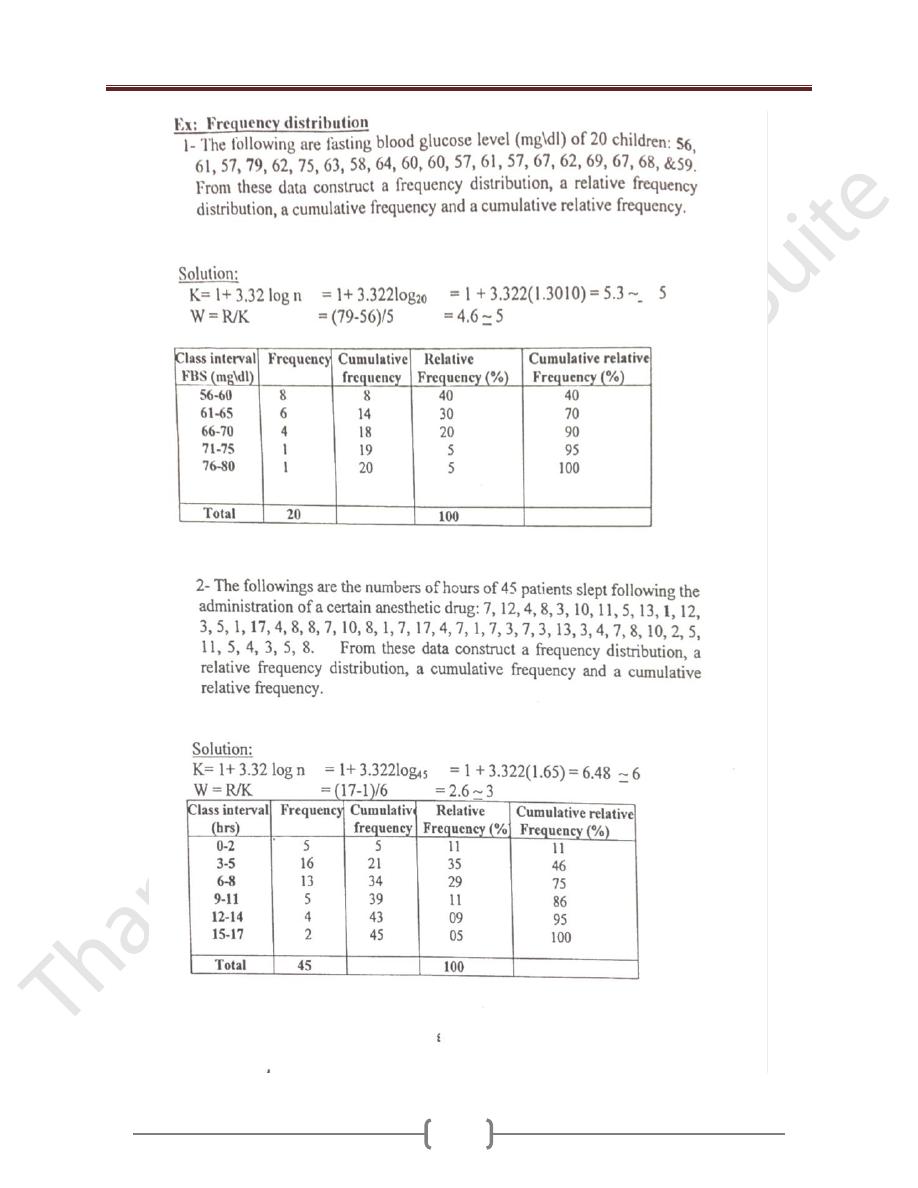
EX2: The following are fasting blood glucose level
(mg\dl) of 20 children: 56, 61, 57, 79, 62, 75, 63, 58, 64,
60, 60, 57, 61, 57, 67, 62, 69, 67, 68, &59. From these
data construct a frequency distribution, a relative
frequency distribution, a cumulative frequency and a
cumulative relative frequency.
Solution:
K= 1+ 3.32 log n = 1+ 3.322log
20
= 1 +
3.322(1.3010) = 5.3 ~ 5
W = R/K = (79-56)/5 = 4.6 ~ 5
Class
interval
Wt(kg)
Mid-
Point
Freq
uenc
y
Cumu
lative
freque
ncy
Relativ
e
Freque
ncy
(%)
Cumulat
ive
relative
Frequen
cy (%)
10 - 19
20 - 29
30 - 39
40 - 49
50 - 59
60 - 69
70 - 79
14.5
24.5
34.5
44.5
54.5
64.5
74.5
5
19
10
13
4
4
2
5
24
34
47
51
55
57
8.77
33.33
17.54
22.81
7.02
7.02
3.51
8.77
42.10
59.64
82.45
89.47
96.49
100.00
Total
57
100
Class
interval
FBS
(mg\dl)
Frequ
ency
Cumulative
frequency
Relative
Frequency
(%)
Cumulative
relative
Frequency
(%)
56-60
61-65
66-70
71-75
76-80
8
6
4
1
1
8
14
18
19
20
40
30
20
5
5
40
70
90
95
100
Total
20
100
Lecture 1+2 - Introduction
57
h
h
Lecture 1+2 - Introduction
58
Lecture 1+2 - Introduction
59
Lecture 1+2 - Introduction
60

Lecture 1+2 - Introduction
61
Population, Sample & Sampling Methods
Population:
largest collection from which we have an
interest at particular time. (Collection of entire people
you want to understand), Could be:
1) Entities; peoples, animals, plants…. etc. ((people of
unit)).
2) Variables; Wt, Ht, serum cholesterol…etc. ((people of
observation)).
If a population of value consists of fixed number of these
value→ ''Finite population", but it consists of an endless
values → "Infinite population"
Sample;
A limit number of values drawn from the
population ((part of population intended to represent the
population)), could be either entities or variables.
Parameters: A descriptive measure computed from the
data of population.
Statistics: A descriptive measure computed from the
data of a sample.
Statistical inference: Is the condition concerning a
people on the basis of the information obtained from a
sample drawn from that population.
Generalizations: will depend on how well the sample
represents the population.
Representative sample = Sample whose characteristics
are similar to population.
EX1: Since blood tests are costly to administer, a sample
of n=20 children were selected from the N=293 of a
particular school. These 20 were given the test and, based
on their results; a statement is made concerning the blood
levels of all 293 children in the school.
Note: If a sample is NOT drawn in an appropriate manner
from a population, it may not be representative of that
population. In that case, results from the sample may not
be generalizable to the population.
EX2: Thirty-six percent of the adult Iraqi population has
an allergy. A sample of 1200 randomly selected adults
resulted in 33% having an allergy. Describe each of the
six terms.
POPULATION: all Iraqi adults.
SAMPLE: the 1200 adults.
VARIABLE: allergy status.
DATA: yes/no responses to questions concerning
existence of allergies
PARAMETER: percentage of all (US---Iraqi) adults with
an allergy.
STATISTIC: 33% from the sample
Why we not collect data from the whole population?
Sometimes impractical, often impossible! But if we
cannot measure everyone in the population, that does not
mean we cannot study populations or make any
conclusions about them. →Data from a sample can tell
us something about a population. For example, to find
out the immunization coverage of a district, not all the
children in the district have to be surveyed - one could
take a random sample and still estimate the coverage with
good accuracy.
Sampling error: The difference between sample measure
and its correspondent population measure.
Parameter = Values describing POPULATIONS
Greek letters
(Mean),
2
(Variance),
(Standard deviation)
Statistics = Values describing SAMPLES
English letters
X
(Mean), s
2
(Variance),
s (standard deviation)
Sampling methods
In order to make a valid inference about population, we
need a scientific sample from that population. We have 2
methods of sampling:
1)
Probability sample
; It’s the sample that drawn from a
population in such a way that every member of population
has the same chance of being included in the sample. The
results of this sample are amenable for generalization
(valid inference).
We have:
a- Simple random sample. b- Systematic sample.
c- Stratified sample. d- Cluster sample.
e- Multistage sample.
2)
Non- Probability sample
; the results of this sample
are not amenable for generalization. We have:
a- Convenience sample. b- Quota sample.

Lecture 1+2 - Introduction
62
Simple random sample
If a sample of size "n" is drawn from a population of size
"N" in such a way that every possible sample of size "n"
has the same chance of being selected. The mechanism of
drawing is called "Random sampling", can be done by:
1- Lottery method. 2- Computer program.
3- Random number table.
Use of random number table:
a) Assign a unique identification number to each member
of the population (sample frame).
b) Decide the direction of movement on the table
(vertical or horizontal).
c) Locate at random a starting digit.
d) Move on table by equal digit number to the population
digit number.
Simple random sample requires:
1- Sample frame. & 2- Sample fraction.
Systematic sample:
Done by:
1) Assign a unique identification number to each member
of the population.
2) Locate at random starting point.
3) Selection of the sample at regular interval (every 3,
every 4 ...etc.).
Stratified sample
Simple random sample & systematic sample can't ensure
that the structure of the sample will be similar to the
structure of the population regarding certain
characteristic. To overcome such problem, we use
stratified sample by dividing the population into strata
regarding certain character (age, sex….etc.), then a
random or systematic sampling will be applied to each
stratum by either:
1) Equal allocation (equal No. in each stratum).
2) Proportion allocation, the number is proportion to the
size of the stratum.
Cluster sample.
The selection of group (cluster) of study instead of
individuals. This is usually done in big studies, and the
clusters are often geographical unit like villages, districts,
schools…..etc. But these clusters contain similar person
((high interclass correlation)), then the generalization of
the result may be affected.
Multistage sample
Sampling procedures that carry out in phases (stages) and
usually involve more than one sampling method. This is
usually done in two or more stages in very large diverse
population.
Convenience sample
This sample is representative to the site and time of data
collection ((e.g., in surgical ward in certain time)), but the
drawback that the sample is not representative to the total
population.
Quota sample
The composition of the sample as in term of age, sex,
social class…etc., is decided and all that require is to find
the right number of population to full these quota.
Sample size
It’s important to put in mind that:
1) The more the sample size, the less is the variability in the
results, and more chance that the random sample
represents the studied population.
2) The larger two samples are drawn from the same
population randomly, the more they resemble each other.
3) In small sample size, it's difficult & even impossible to
make a precise and confidently generalization, on the
other hand, its wasteful to study objects require. It's
said that "Samples which are too small can prove no
thing, and samples which are too large can prove
everything".
4) Standard error (SE): is the measurement of variation
between sample and population. SE = Standard
deviation (SD)/ ⌡sample size (n).
So, if we increase the n, SE will decrease.
If we use the all the population, there is no SE.

Lecture 1+2 - Introduction
63
Small group work
1) Specify the sampling method used in each of the
following studies. Write A, B, C, or D.
A = simple random sampling B = stratified random
sampling
C = cluster sampling D = systematic sampling
a) A die is rolled to decide which one of the six volunteers
will get a new, experimental vaccine: _____
b) A sample of students in a school is chosen as follows: two
students are selected from each batch by picking roll
numbers at random from the attendance registers: _____
c) A target population for a telephonic survey is picked by
selecting 10 pages from a total of 100 pages from a
telephone directory by using a table of random numbers.
In each of the selected pages, all listed persons are called
for the interview: _____
d) The number 35 is a two-digit random number generated
by a calculator. A sample of two wheelers in a state is
selected-by picking all those vehicles which have
registration numbers ending with 35: _____
2) Consider the following statement concerned with the
collection of data, and determine the best selection of
terms to complete the statement: "The entire group of
objects or people about which information is wanted is
called the ____________. Individual members are called
_______. The ________ is the part that is actually
examined in order to gather information."
a) population, explanatory variables, subgroup
b) whole, items of interest, stratum
c) response group, respondents, nonresponse group
d) sample, units, target population
e) population, units, sample (The right answer)
3) In a study looking at the effect of fluoridation on caries
prevalence in children, the researchers studied two towns;
the local water was fluoridated in the first one and no
fluoride was added to the second one. In both cases they
examined all 5-6 year old children in the two towns. They
found a 40% difference in the number of caries-free
children. From the point of view of sample selection,
would we be correct in assuming that this study proves
that defluoridation of the water supply causes an increase
in caries in children? Why?
Answer: Strictly speaking the children were not a random
sample of 'children' or even '5-6 year old children'. All the
5-6 year old children in the two towns were selected, had
a 100% chance of being picked and all other children had
a 0% chance of being picked. The population that was
sampled was 5-6 year olds and so, strictly speaking, the
results can only be generalized to that population.
4) A researcher wishes to investigate the average duration of
hospital staying for patients suffering from CVA in Al
Kindy Teaching hospital. From patient records, design a
suitable sampling method in order to get a valid and a
generlizable results.
5) In the campaign against polio, a doctor inquired into the
number of times children <5 years in village had been
vaccinated. Design a suitable sampling method in order to
get a valid and a generlizable results.