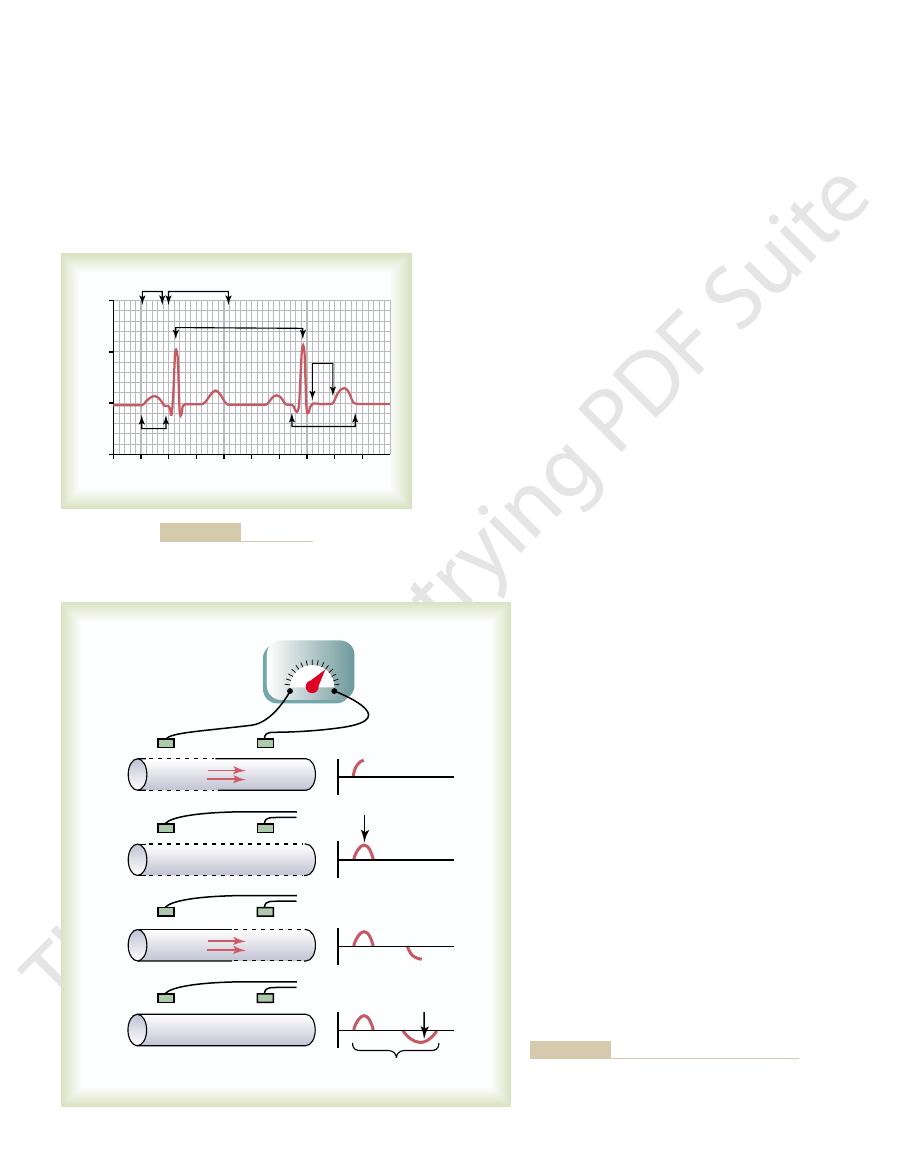
the record has risen to a maximum positive value.
meter. Note that when depolarization has reached the halfway mark in Figure
in potential between the two electrodes, as recorded by a high-speed recording
record positively. To the right of the muscle fiber is shown a record of changes
tivity, and the right electrode is in an area of positivity; this causes the meter to
Therefore, the left electrode on the outside of the fiber is in an area of nega-
the fiber has already depolarized, while the remaining half is still polarized.
and red negative charges outside, is traveling from left to right. The first half of
depolarization, demonstrated by red positive charges inside
In Figure 11–2
slightly positive inside and negative outside.
ization, the normal negative potential inside the fiber reverses and becomes
and repolarization, the color red designating depolarization. During depolar-
Figure 11–2 shows a single cardiac muscle fiber in four stages of depolarization
Depolarization Waves Versus Repolarization Waves
is needed.
discussed in Chapter 5. The distinction between depolarization waves and repo-
larization waves. The principles of depolarization and repolarization are
Thus, the electrocardiogram is composed of both depolarization and repo-
ization wave.
0.25 to 0.35 second after depolarization, and the T wave is known as a
the state of depolarization. This process normally occurs in ventricular muscle
The T wave is caused by potentials generated as the ventricles recover from
depolarization waves.
depolarization wave spreads through the ventricles. Therefore, both the P wave
tials generated when the ventricles depolarize before contraction, that is, as the
larize before atrial contraction begins. The QRS complex is caused by poten-
The P wave is caused by electrical potentials generated when the atria depo-
separate waves: the Q wave, the R wave, and the S wave.
QRS complex, and a T wave. The QRS complex is often, but not always, three
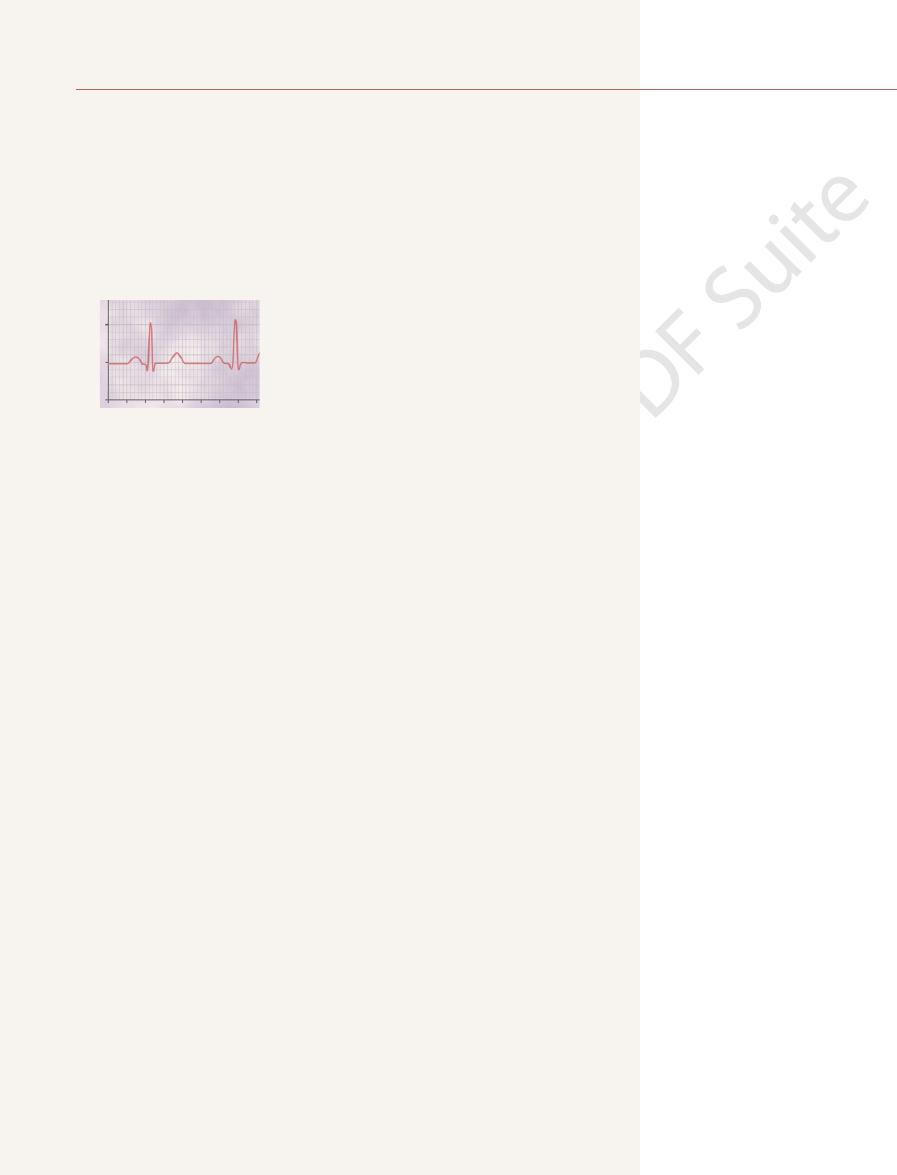
The normal electrocardiogram (see Figure 11–1) is composed of a P wave, a
Electrocardiogram
Characteristics of the Normal
A normal electrocardiogram for two beats of the heart is shown in Figure 11–1.
electrocardiogram.
skin on opposite sides of the heart, electrical
surface of the body. If electrodes are placed on the
the adjacent tissues surrounding the heart. A small
When the cardiac impulse passes through the heart,
The Normal Electrocardiogram
C
H
A
P
T
E
R
1
1
123
electrical current also spreads from the heart into
portion of the current spreads all the way to the
potentials generated by the current can be recorded;
the recording is known as an
and the components of the QRS complex are
repolar-
larization waves is so important in electrocardiography that further clarification
A,
11–2A,
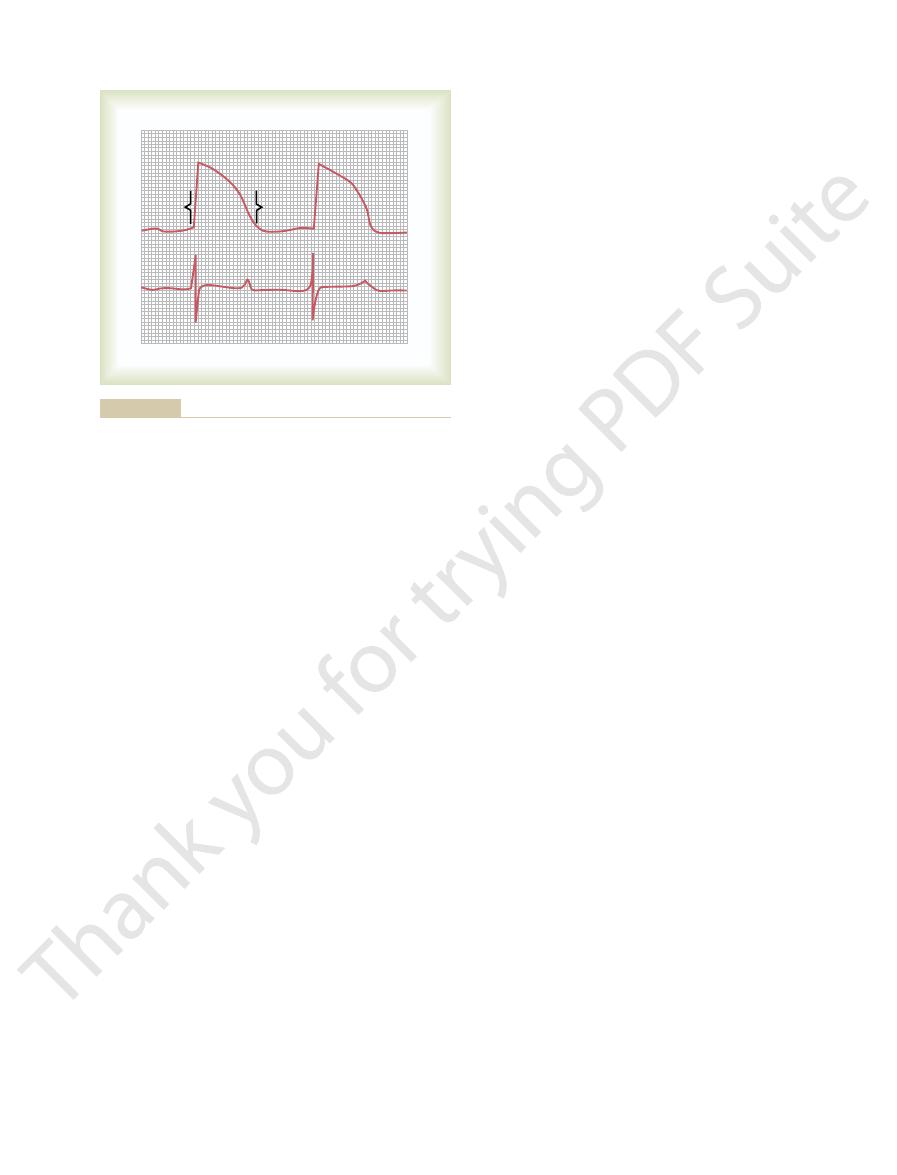
ventricle, which shows the QRS waves appearing at
muscle fiber. The upsweep of this action potential is
0.25 and 0.35 second. The top part of Figure 11–3 shows
muscle, discussed in Chapter 10, normally lasts between
The monophasic action potential of ventricular
Muscle to the QRS and T Waves in the Standard Electrocardio-
Relation of the Monophasic Action Potential of Ventricular
fiber membrane.
potential returns once more to zero. This completed
between them. Thus, in the recording to the right, the
positivity, so that no potential difference is recorded
repolarized, and both electrodes are now in areas of
In Figure 11–2
to the right, becomes negative.
Consequently, the recording, as shown
Figure 11–2
area of negativity. This is opposite to the polarity in
in an area of positivity, and the right electrode is in an
outside of the fiber. At this point, the left electrode is
same muscle fiber, with positivity returning to the
Figure 11–2
membrane.
trodes are now in areas of equal negativity. The com-
the entire muscle fiber, and the recording to the right
In Figure 11–2
124
Unit III
The Heart
B, depolarization has extended over
has returned to the zero baseline because both elec-
pleted wave is a depolarization wave because it results
from spread of depolarization along the muscle fiber
C shows halfway repolarization of the
A.
D, the muscle fiber has completely
negative wave is a repolarization wave because it
results from spread of repolarization along the muscle
gram.
a monophasic action potential recorded from a micro-
electrode inserted to the inside of a single ventricular
caused by depolarization, and the return of the poten-
tial to the baseline is caused by repolarization.
Note in the lower half of the figure a simultaneous
recording of the electrocardiogram from this same
4 0.6
0.8 1.0
1.2
1.6
0
0.2 0.
Atria Ventricles
+2
RR interval
P
R
T
S
Q
P-R interval
= 0.16 sec
Q-T interval
S-T
segment
+1
0
–1
1.4
Millivolts
Time (sec)
Normal electrocardiogram.
Figure 11–1
+
– – – – – – – – –
– – – – – – – – –
+ + + + + + +
+ + + + + + + + +
+ + + + + + + + + + + + + + + +
+ + + + + + + + + + + + + + + +
+ + + + + + + + +
+ + + + + + + + + + + + + + + +
+ + + + + + + + + + + + + + + +
+ + + + + + +
+
–
–
+
–
+
–
Depolarization
wave
Repolarization
wave
+ + + + + + + + +
+ + + + + + + + +
– – – – – – – – –
+ + + + + + +
– – – – – – – – –
+ + + + + + +
– – – – – – – – – – – – – – – –
– – – – – – – – – – – – – – – –
– – – – – – –
– – – – – – –
– – – – – – –
– – – – – – –
– – – – – – –
– – – – – – –
– – – – – – – – –
– – – – – – – – –
A
B
C
D
0.30 second
–
–
+
+
0
muscle fiber.
) from a cardiac
repolarization wave
Recording the
Figure 11–2
depolarization wave (A and B) and
the
(C and D
the Q wave is absent) to the end of the T wave. This
from the beginning of the Q wave (or R wave, if
Q-T Interval.
The normal P-Q interval is about 0.16 second. (Often
the ventricles. This period is called the P-Q interval.
The time between the beginning of
P-Q or P-R Interval.
and 0.3 millivolt; and that of the T wave is between 0.2
the S wave; the voltage of the P wave is between 0.1
electrodes on the two arms or on one arm and one leg,
brane. When electrocardiograms are recorded from
as 3 to 4 millivolts. Even this voltage is small in com-
heart, the voltage of the QRS complex may be as great
electrodes are to the heart. When one electrode is
The recorded
Normal Voltages in the Electrocardiogram.
thin lines, each of which represents 0.04 second.
these dark lines represent 0.20 second. The 0.20 second
segments by dark vertical lines; the intervals between
is 1 second, and each inch is usually broken into five
calibration lines. Each inch in the horizontal direction
The vertical lines on the electrocardiogram are time
gram represent 1 millivolt, with positivity in the upward
As shown in Figure 11–1, the horizontal calibration
with the photographic types of electrocardiographs.
the electrocardiogram is recorded, which is the case
paper, as is the case when a pen recorder is used, or
appropriate calibration lines on the recording paper.
Voltage and Time Calibration of the
QRS complex, partly because of its prolonged length.
the T wave is considerably less than the voltage of the
trocardiogram is a prolonged wave, but the voltage of
second. For this reason, the T wave in the normal elec-
repolarization extends over a long period, about 0.15
as long as 0.35 second. Thus, the process of ventricular
(the QRS complex), but in many other fibers, it takes
muscle begins to repolarize in some fibers about 0.20
the normal electrocardiogram. Ordinarily, ventricular
The ventricular repolarization wave is the T wave of
this reason, an atrial T wave seldom is observed in the
obscured by the much larger QRS complex. For
atrial T wave,
larization wave, known as the
the electrocardiogram. Therefore, the atrial repo-
termination of the P wave. This is also approxima-
The atria repolarize about 0.15 to 0.20 second after
has occurred, that is, until after the end of the T wave.
The
beginning of contraction of the ventricles.
11–1; the P wave occurs at the
cal processes of contraction. Refer again to Figure
Before contraction of muscle can occur, depolarization
Contraction to the Waves of the
Relationship of Atrial and Ventricular
or completely depolarized.
the ventricular muscle is either completely polarized
no potential is recorded in the electrocardiogram when
the T wave appearing at the end. Note especially that
The Normal Electrocardiogram
Chapter 11
125
the beginning of the monophasic action potential and
Only when the muscle is
partly polarized and partly depolarized does current
flow from one part of the ventricles to another part,
and therefore current also flows to the surface of the
body to produce the electrocardiogram.
Electrocardiogram
must spread through the muscle to initiate the chemi-
beginning of contrac-
tion of the atria, and the QRS complex of waves occurs
at the
ventricles remain contracted until after repolarization
tely when the QRS complex is being recorded in
is usually
electrocardiogram.
second after the beginning of the depolarization wave
Electrocardiogram
All recordings of electrocardiograms are made with
Either these calibration lines are already ruled on the
they are recorded on the paper at the same time that
lines are arranged so that 10 of the small line divisions
upward or downward in the standard electrocardio-
direction and negativity in the downward direction.
intervals are then broken into five smaller intervals by
voltages of the waves in the normal electrocardiogram
depend on the manner in which the electrodes are
applied to the surface of the body and how close the
placed directly over the ventricles and a second elec-
trode is placed elsewhere on the body remote from the
parison with the monophasic action potential of 110
millivolts recorded directly at the heart muscle mem-
the voltage of the QRS complex usually is 1.0 to 1.5
millivolt from the top of the R wave to the bottom of
and 0.3 millivolt.
the P wave and the beginning of the QRS complex is
the interval between the beginning of electrical exci-
tation of the atria and the beginning of excitation of
this interval is called the P-R interval because the Q
wave is likely to be absent.)
Contraction of the ventricle lasts almost
Depolarization
Repolarization
T
R
S
Q
simultaneously.
Electrocardiogram recorded
Below,
but rapidly toward the end.
and then repolarization occurring slowly during the plateau stage
fiber during normal cardiac function, showing rapid depolarization
Monophasic action potential from a ventricular muscle
Figure 11–3
Above,
When one portion of the ventricles depolarizes and
electricity even more easily. Therefore, the heart
with air, conduct electricity to a surprising extent, and
the chest. Even the lungs, although mostly filled
Figure 11–5 shows the ventricular muscle lying within
Chest Around the Heart
Flow of Electrical Currents in the
apparatus.
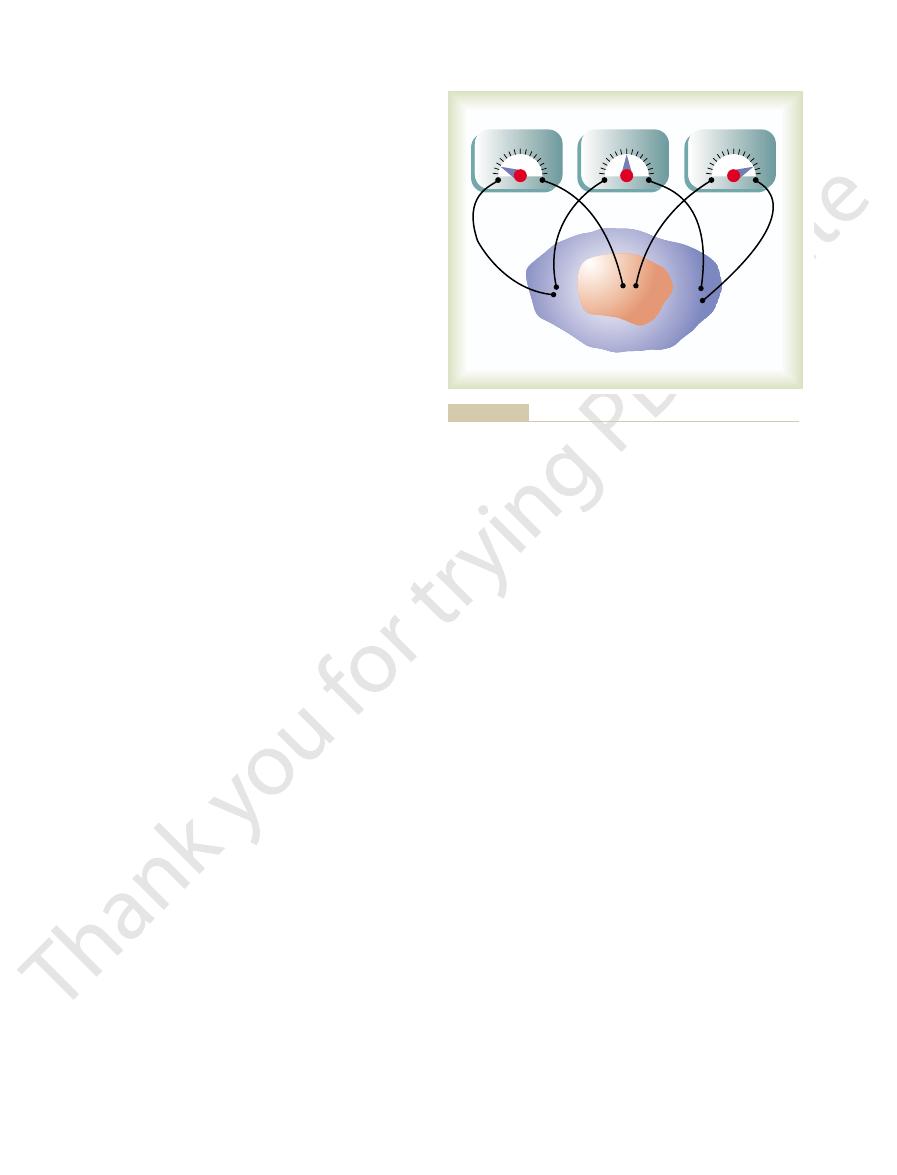
a second, and the actual voltage measurements can
in the figure persist for only a few thousandths of
through the heart, the potential differences shown
explain the causes of the respective meter readings.
studied carefully, and the reader should be able to
are also demonstrated in Figure 11–4.
Two other electrode placements and meter readings
records positively.
in the figure,
still-polarized areas, as shown
is represented by the positive signs. Therefore, a meter
remaining surface of the heart, which is still polarized,
resented by the negative signs in Figure 11–4. The
making this part of the surface electronegative, as rep-
to the outsides of the depolarized muscle fibers,
syncytium becomes depolarized, negative charges leak
membrane potentials, as soon as an area of cardiac
had been positive and the interiors negative. For
Before stimulation, all the exteriors of the muscle cells
Figure 11–4 shows a syncytial mass of cardiac muscle
Recording Electrical Potentials from a
Cardiac Cycle
the Heart During the
Flow of Current Around
line on the paper where the stylus touches.
paper to an electrode at its back. This leaves a black
through its tip. Another type turns black when electri-
paper turns black when it is exposed to heat; the stylus
does not require ink in the recording stylus. One such
the electrocardiogram.The movement of the pen is con-
speed. As the paper moves forward, the pen records
at one end to an inkwell, and its recording end is con-
of paper. Sometimes the pen is a thin tube connected
puter-based systems and electronic display, while
changes in potentials.
sides of the heart in less than 0.01 second. Therefore,
Electrocardiograms
Methods for Recording
60/0.83 times per minute, or 72 beats per minute.
person is about 0.83 second. This is a heart rate of
heart rate is 60 beats per minute. The normal interval
mined from the time calibration lines is 1 second, the
heartbeats. If the interval between two beats as deter-
The rate of heartbeat can be determined easily from
126
Unit III
The Heart
interval is called the Q-T interval and ordinarily is
about 0.35 second.
Rate of Heartbeat as Determined from the Electrocardiogram.
an electrocardiogram because the heart rate is the
reciprocal of the time interval between two successive
between two successive QRS complexes in the adult
Sometimes the electrical currents generated by the
cardiac muscle during each beat of the heart change
electrical potentials and polarities on the respective
it is essential that any apparatus for recording electro-
cardiograms be capable of responding rapidly to these
Pen Recorder
Many modern clinical electrocardiographs use com-
others use a direct pen recorder that writes the elec-
trocardiogram with a pen directly on a moving sheet
nected to a powerful electromagnet system that is
capable of moving the pen back and forth at high
trolled by appropriate electronic amplifiers connected
to electrocardiographic electrodes on the patient.
Other pen recording systems use special paper that
itself is made very hot by electrical current flowing
cal current flows from the tip of the stylus through the
Partially Depolarized Mass of
Syncytial Cardiac Muscle
that has been stimulated at its centralmost point.
reasons presented in Chapter 5 in the discussion of
connected with its negative terminal on the area of
depolarization and its positive terminal on one of the
to the right
These should be
Because the depolarization spreads in all directions
be accomplished only with a high-speed recording
fluids in other tissues surrounding the heart conduct
is actually suspended in a conductive medium.
therefore becomes electronegative with respect to the
+++++
+++++
++++++
– – – – – – – – –
– – – – – – – – –
– – – – – – – –
– – – – –
–
–
+
+
–
+
–
+
0
–
+
0
–
+
0
+++++
+++++
+++++
+++++
++++++++
+++++
+
+
+
+
+
+
+
+
+
+
+
+
+++++++++++
++++++++++
++++++
++++++
+++++
+++++
++++++
+++++
++++++
+
– – – – – – –
+
+
+
+
– – – – – – – – –
+++++
+++++
+++
+
+ +
+
– – – – – – – – –
– – – – – – – – –
– – – – – – – – –
– – – – – – – – –
– – – – – – –
– – – –
– –
+
+
muscle mass that has been depolarized in its center.
Instantaneous potentials develop on the surface of a cardiac
Figure 11–4
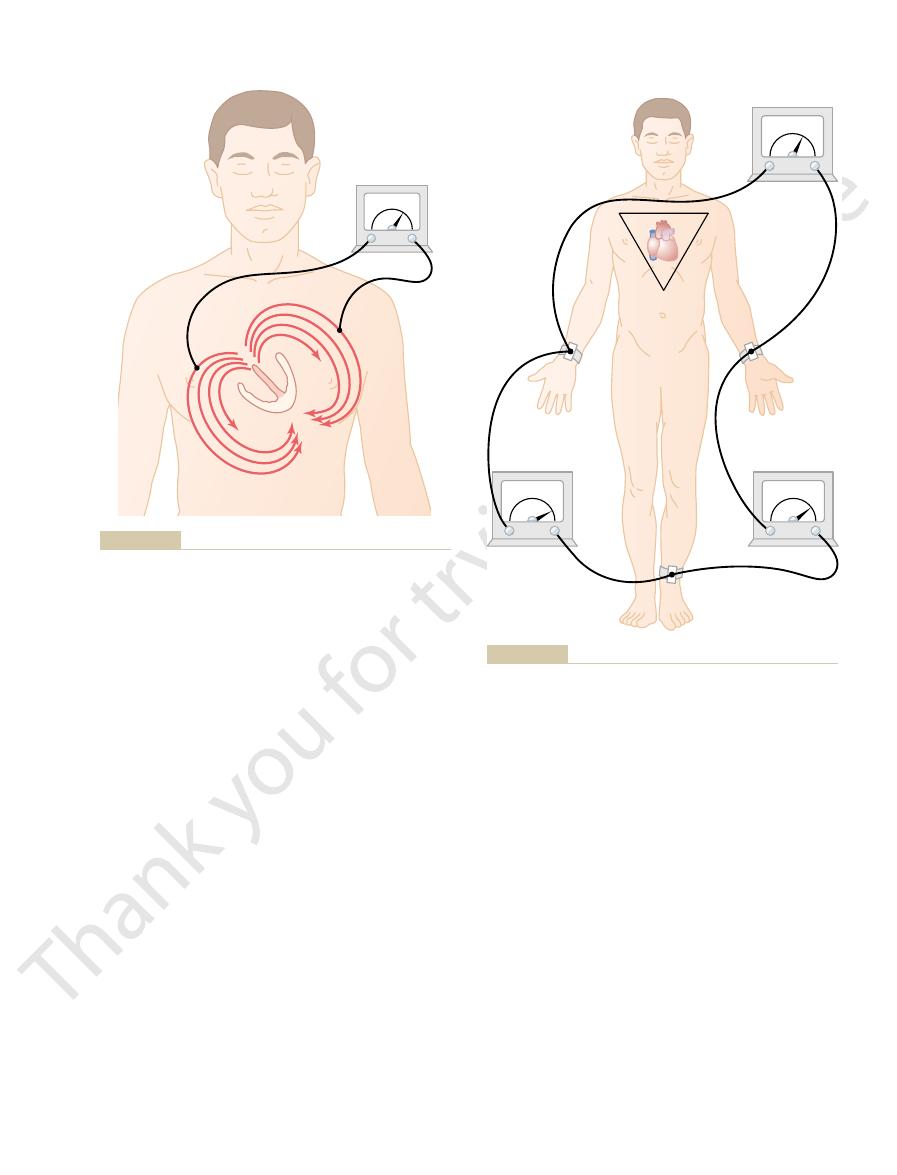
The term “bipolar” means that the
bipolar limb leads.
standard
patient’s limbs and the electrocardiograph for record-
Figure 11–6 shows electrical connections between the
Electrocardiographic Leads
the electrode nearer the apex will be positive, and
electrode nearer the base will be negative, whereas
the surface of the body as shown in Figure 11–5, the
end. And if a meter is connected to electrodes on
the entire cycle of depolarization, except at the very
Thus, in normal heart ventricles, current flows from
the base, because the last part of the heart to become
0.01 second, flowing from the ventricular apex toward
has completed its course through the ventricles, the
muscle mass. Then, immediately before depolarization
direction, while depolarization spreads from the endo-
process, current also continues to flow in this same
with positivity toward the apex.
with negativity toward the base of the heart
elliptical lines), one finds that the average current flow
strated by the curving arrows in the figure. If one
ing the ventricles along elliptical paths, as demon-
tropositivity on the outer walls of the ventricles, with
negative signs in Figure 11–5. This provides elec-
der of the ventricles, as shown by the red areas and the
routes, as noted in the figure.
remainder, electrical current flows from the depolar-
The Normal Electrocardiogram
Chapter 11
127
ized area to the polarized area in large circuitous
It should be recalled from the discussion of the
Purkinje system in Chapter 10 that the cardiac impulse
first arrives in the ventricles in the septum and shortly
thereafter spreads to the inside surfaces of the remain-
tronegativity on the insides of the ventricles and elec-
electrical current flowing through the fluids surround-
algebraically averages all the lines of current flow (the
occurs
and
During most of the remainder of the depolarization
cardial surface outward through the ventricular
average direction of current flow reverses for about
depolarized is the outer walls of the ventricles near the
base of the heart.
negative to positive primarily in the direction from
the base of the heart toward the apex during almost
the recording meter will show positive recording in the
electrocardiogram.
Three Bipolar Limb Leads
ing electrocardiograms from the so-called
electrocardiogram is recorded from two electrodes
+
-
-
-
-
-
----
--
-
++
++
+
+
+
+
++++
+
+
+
+
+
+
+
+
+
+
+
+
+
+
+
+
++
0
A
B
-
-
+
+
Flow of current in the chest around partially depolarized
Figure 11–5
ventricles.
-
+
-
+
-
+
0 .2 mV
1 .2 mV
1 .0 mV
0 .5 mV
0 .7 mV
0 .3 mV
+
+
+
+
Lead III
+
Lead II
Lead I
-
0
-
+
-
+
-
-
+
+
0
-
+
0
-
+
dard electrocardiographic leads. Einthoven’s triangle is superim-
Conventional arrangement of electrodes for recording the stan-
Figure 11–6
posed on the chest.
cardiac impulse conduction
abnormalities of cardiac
are recorded, because
conducting system, it does matter greatly which leads
cycle. But when one wants to diagnose damage in
diagnose different cardiac arrhythmias, because diag-
leads are similar to one another, it does not matter
Einthoven’s law.
potential in lead II, thus illustrating the validity of
observance of polarities, that at any given instant the
be shown, with careful measurements and proper
On analysis of the three electrocardiograms, it can
P waves and positive T waves, and the major portion
electrocardiograms in leads I, II, and III. It is obvious
Figure 11–7 shows recordings of the
the three “standard” bipolar electrocardiograms are
Einthoven’s law, holds true at any given instant while
0.7 equals 1.2. Mathematically, this principle, called
that is, 0.5 plus
Now, note that
ences between the respective pairs of limbs.
0.7 millivolt, and
0.3 millivolt on the left arm. Similarly, lead
0.5 millivolt, because this is the
meters in the figure, it can be seen that lead I records
the body, the left arm is
noted in Figure 11–6, the right arm is
For instance, let us assume that momentarily, as
given instant, the third one can be determined
Einthoven’s law states that if the
s Law.
the point at which the left leg connects with the fluids.
with the fluids around the heart, and the lower apex is
form apices of a triangle surrounding the heart. The
heart. This illustrates that the two arms and the left leg
Einthoven’s triangle,
In Figure 11–6, the triangle, called
Einthoven’s Triangle.
arm is negative with respect to the left leg.
This means that
positive terminal to the left leg.
of the electrocardiograph is connected to the left arm
To record limb lead III, the
electrocardiograph records positively.
right arm is negative with respect to the left leg, the
Therefore, when the
positive terminal to the left leg.
the electrocardiograph is connected to the right arm
To record limb lead II, the
trocardiograph records below the line.
electrocardiogram. When the opposite is true, the elec-
positively, that is, above the zero voltage line in the
the left arm connects, the electrocardiograph records
Therefore,
of the electrocardiograph is connected to the right arm
In recording limb lead I, the
with a moving paper.
trical meter in the diagram, although the actual
the body and the electrocardiograph. The electrocar-
the limbs. Thus, a “lead” is not a single wire connect-
located on different sides of the heart, in this case, on
128
Unit III
The Heart
ing from the body but a combination of two wires and
their electrodes to make a complete circuit between
diograph in each instance is represented by an elec-
electrocardiograph is a high-speed recording meter
Lead I.
negative terminal
and the positive terminal to the left arm.
when the point where the right arm connects to the
chest is electronegative with respect to the point where
Lead II.
negative terminal of
and
the
Lead III.
negative terminal
and the
the electrocardiograph records positively when the left
is drawn around the area of the
two apices at the upper part of the triangle represent
the points at which the two arms connect electrically
Einthoven’
electrical potentials of any two of the three bipolar
limb electrocardiographic leads are known at any
mathematically by simply summing the first two (but
note that the positive and negative signs of the
different leads must be observed when making this
summation).
-0.2 millivolt
(negative) with respect to the average potential in
+ 0.3 millivolt (positive), and
the left leg is
+1.0 millivolt (positive). Observing the
a positive potential of
+
difference between the
-0.2 millivolt on the right arm
and the
+
III records a positive potential of
+
lead II records a positive potential of
+1.2 millivolts
because these are the instantaneous potential differ-
the sum of the voltages in leads I and
III equals the voltage in lead II;
being recorded.
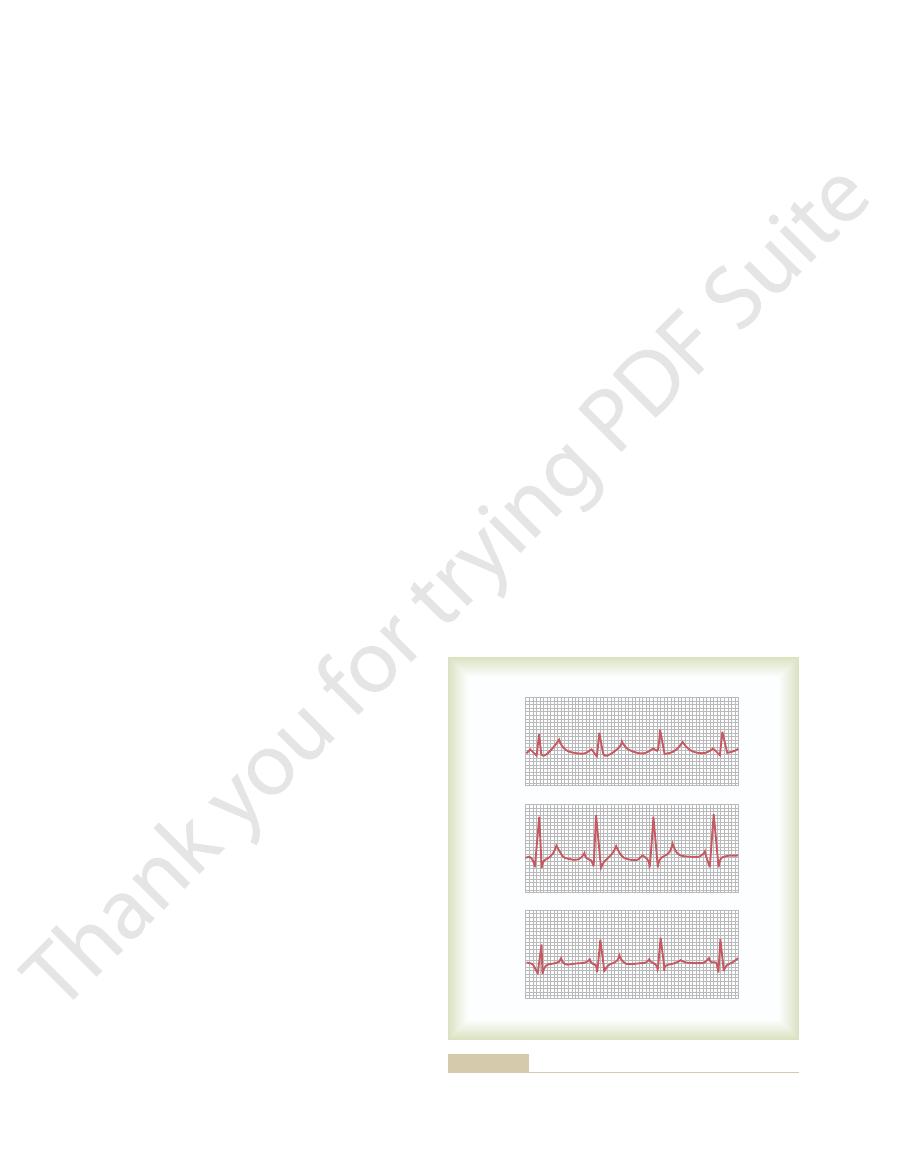
Normal Electrocardiograms Recorded from the Three Standard
Bipolar Limb Leads.
that the electrocardiograms in these three leads are
similar to one another because they all record positive
of the QRS complex is also positive in each
electrocardiogram.
sum of the potentials in leads I and III equals the
Because the recordings from all the bipolar limb
greatly which lead is recorded when one wants to
nosis of arrhythmias depends mainly on the time
relations between the different waves of the cardiac
the ventricular or atrial muscle or in the Purkinje
muscle contraction or
do
I
II
III
electrocardiographic leads.
standard
Normal electrocardiograms recorded from the three
Figure 11–7
In this type of recording, two of
leads is nearer the heart apex, which is the direction
, and V
versely, the QRS complexes in leads V
most of the ventricular depolarization process. Con-
to the base of the heart than to the apex, and the base
Figure 11–8, the chest electrode in these leads is nearer
normal heart are mainly negative because, as shown in
, the QRS recordings of the
In leads V
vidual chest leads.
the anterior ventricular wall, can cause marked
minute abnormalities in the ventricles, particularly in
diately beneath the electrode. Therefore, relatively
to the chest wall, each chest lead records mainly the
chest leads. Because the heart surfaces are close
Figure 11–9 illustrates the electrocardiograms of the
, and V
are known as leads V
points shown in the diagram. The different recordings
recorded, one at a time, from the anterior chest wall,
in the figure. Usually six standard chest leads are
left arm, and left leg all at the same time, as also shown
indifferent electrode,
electrode, called the
terminal of the electrocardiograph, and the negative
Figure 11–8. This electrode is connected to the positive
markedly in some leads yet may not affect other leads.
The Normal Electrocardiogram
Chapter 11
129
change the patterns of the electrocardiograms
Electrocardiographic interpretation of these two
types of conditions—cardiac myopathies and cardiac
arrhythmias—is discussed separately in Chapters 12
and 13.
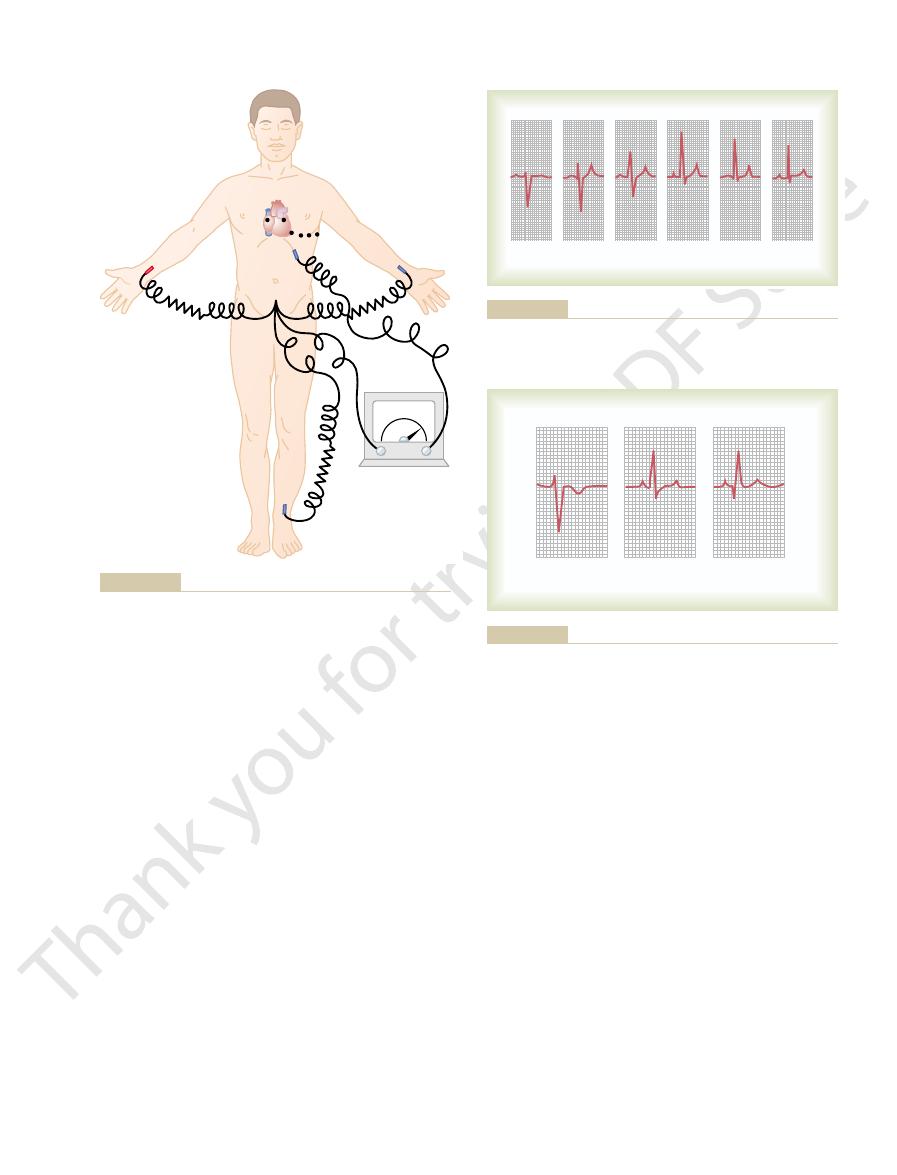
Chest Leads (Precordial Leads)
Often electrocardiograms are recorded with one elec-
trode placed on the anterior surface of the chest
directly over the heart at one of the points shown in
is connected
through equal electrical resistances to the right arm,
the chest electrode being placed sequentially at the six
1
, V
2
, V
3
, V
4
, V
5
6
.
healthy heart as recorded from these six standard
electrical potential of the cardiac musculature imme-
changes in the electrocardiograms recorded from indi-
1
and V
2
of the heart is the direction of electronegativity during
4
, V
5
6
are
mainly positive because the chest electrode in these
of electropositivity during most of depolarization.
Augmented Unipolar Limb Leads
Another system of leads in wide use is the augmented
unipolar limb lead.
the limbs are connected through electrical resistances
to the negative terminal of the electrocardiograph,
-
+
0
-
+
1 2
3 456
LA
RA
5000
ohms
5000
ohms
5000
ohms
. LA, left arm; RA, right arm.
Connections of the body with the electrocardiograph for record-
Figure 11–8
ing chest leads
V
1
V
2
V
3
V
4
V
5
V
6
Normal electrocardiograms recorded from the six standard chest
Figure 11–9
leads.
aVR
aVL
aVF
Normal electrocardiograms recorded from the three
Figure 11–10
augmented
unipolar limb leads.

the electrocardiograph to determine this.)
recording from the aVR lead is inverted. (Why does
to the standard limb lead recordings, except that the
leads are shown in Figure 11–10. They are all similar
arm, the aVL lead; and when on the left leg, the aVF
the lead is known as the aVR lead; when on the left
nal. When the positive terminal is on the right arm,
130
Unit III
The Heart
and the third limb is connected to the positive termi-
lead.
Normal recordings of the augmented unipolar limb
this inversion occur? Study the polarity connections to
References
See references for Chapter 13.