When one states that cardiac output is controlled by venous return, this means
Mechanism of the Heart
Return—Role of the Frank-Starling
Control of Cardiac Output by Venous
activity with age.
bolic activity. Therefore, the declining cardiac index is indicative of declining
age 80 years. We will see later in the chapter that the cardiac output is regu-
at age 10 years, the cardiac index declines to about 2.4 L/min/m
as cardiac index, at different ages. Rising rapidly to a level greater than
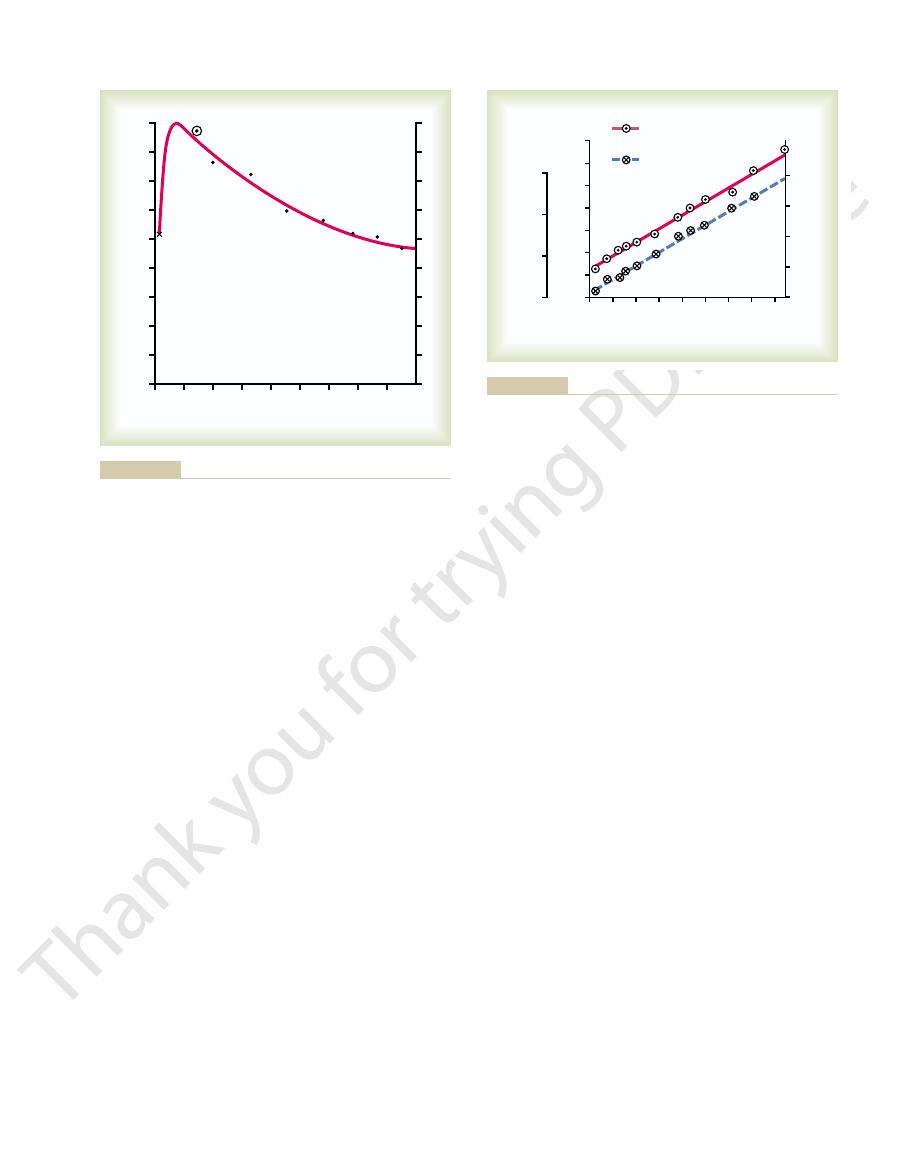
Figure 20–1 shows the cardiac output, expressed
area of about 1.7 square meters, which means that the normal average cardiac index
The normal human being weighing 70 kilograms has a body surface
cardiac output per square meter of body
, which is the
cardiac index
portion to the surface area of the body. Therefore, cardiac output is frequently stated
cardiac output for the resting adult, in round numbers, is often stated to be
as well—because with increasing age, body activity diminishes—the average
, this value is about 4.9 L/min. When one considers the factor of age
For
, resting cardiac output averages about 5.6 L/min.
For
(4) size of the body.
body metabolism, (2) whether the person is exercising, (3) the person’s age, and
ing factors, among others, directly affect cardiac output: (1) the basic level of
Cardiac output varies widely with the level of activity of the body. The follow-
Normal Values for Cardiac Output at Rest and
the heart and lungs.
The venous return and the cardiac output must equal each other except for a
from the veins into the right atrium each minute.
Venous return
circulation. Cardiac output is perhaps the most
the aorta each minute by the heart. This is
Cardiac output
and Their Regulation
Cardiac Output, Venous Return,
C
H
A
P
T
E
R
2
0
232
is the quantity of blood pumped into
also the quantity of blood that flows through the
important factor that we have to consider in rela-
tion to the circulation.
is the quantity of blood flowing
few heartbeats at a time when blood is temporarily stored in or removed from
During Activity
young, healthy men
women
almost exactly 5 L/min.
Cardiac Index
Experiments have shown that the cardiac output increases approximately in pro-
in terms of the
surface area.
for adults is about 3 L/min/m
2
of body surface area.
Effect of Age on Cardiac Output.
4 L/min/m
2
2
at
lated throughout life almost directly in proportion to the overall bodily meta-
that it is not the heart itself that is the primary controller of cardiac output.
summate to form the venous return, and the heart
control local blood flow. All the local blood flows
To summarize, cardiac output is determined by the
other.
work output during exercise, the oxygen consumption
levels of exercise. Note that at each increasing level of
this effect is demonstrated in Figure 20–2 for different
olism. For instance, local blood flow almost always
increases mainly in proportion to each tissue’s metab-
discussed in Chapter 17. In most tissues, blood flow
The mechanisms of local blood flow regulation were
the local blood flow regulations.
segments of the peripheral circulation. Therefore, it
The venous return to the heart is the sum of all the
Metabolism Regulates Most Local
Local Tissues of the Body—Tissue
of Blood Flow Regulation in All the
Cardiac Output Regulation Is the Sum
blood does become more than the heart can pump,
eral factors that determine venous return. However,
Under most normal unstressful conditions,
increase the heart rate.
by way of the sympathetic nerves and vagi, also to
, passing first to the vaso-
heart rate as much as 10 to 15 per cent. In addition,
faster—at an increased heart rate.That is, stretch of the
Another important factor, discussed in Chapter 10,
systemic circulation. Therefore, the blood that flows
the cardiac muscle contracts with increased force, and
walls of the heart chambers. As a result of the stretch,
flow into the heart, the increased blood stretches the
, was discussed in Chapter 9. Basically,
Frank-Starling
the veins. This mechanism, called the
The main reason peripheral factors are usually more
controllers.
, that are the primary
the veins, called
Instead, it is the various factors of the peripheral cir-
Cardiac Output, Venous Return, and Their Regulation
Chapter 20
233
culation that affect flow of blood into the heart from
venous return
important than the heart itself in controlling cardiac
output is that the heart has a built-in mechanism that
normally allows it to pump automatically whatever
amount of blood that flows into the right atrium from
law of the heart
this law states that when increased quantities of blood
this empties the extra blood that has entered from the
into the heart is automatically pumped without delay
into the aorta and flows again through the circulation.
is that stretching the heart causes the heart to pump
sinus node in the wall of the right atrium has a direct
effect on the rhythmicity of the node itself to increase
the stretched right atrium initiates a nervous reflex
called the Bainbridge reflex
motor center of the brain and then back to the heart
the
cardiac output is controlled almost entirely by periph-
we shall see later in the chapter that if the returning
then the heart becomes the limiting factor that deter-
mines cardiac output.
Blood Flow
local blood flows through all the individual tissue
follows that cardiac output regulation is the sum of all
increases when tissue oxygen consumption increases;
and the cardiac output increase in parallel to each
sum of all the various factors throughout the body that
automatically pumps this returning blood back into
the arteries to flow around the system again.
0
10
20
30
40
50
60
70
80
Cardiac index (L
/min
/m
2
)
Age in years
0
1
2
3
4
1
2
3
4
0
AC, Jones CE, Coleman TB: Circulatory Physiology: Cardiac
meter of surface area) at different ages. (Redrawn from Guyton
for the human being (cardiac output per square
Cardiac index
Figure 20–1
Output and Its Regulation. 2nd ed. Philadelphia: WB Saunders Co,
1973.)
Work output during exercise (kg-m/min)
0
200 400 600 800 1000 1200 14001600
Oxygen consumption (L
/min)
Cardiac output (L
/min
/m
Cardiac index (L
/min
/m
2
)
2
)
0
5
10
15
20
25
15
10
5
0
30
35
0
1
2
3
4
Cardiac output
and cardiac index
Oxygen
consumption
Dexter
Douglas
Christensen
Donald
1951
1922
1931
1055
Physiology: Cardiac Output and Its Regulation. 2nd ed. Philadel-
(Redrawn from Guyton AC, Jones CE, Coleman TB: Circulatory
(red solid line)
Effect of increasing levels of exercise to increase cardiac output
Figure 20–2
and oxygen consumption (blue dashed line).
phia: WB Saunders Co, 1973.)
cardiac output curves
the heart can pump, which can be expressed quantita-
There are definite limits to the amount of blood that
Output That It Can Achieve
tions of the circulation change), the cardiac output
simply the following: Any time the long-term level of
The meaning of this formula, and of Figure 20–3, is
law, as expressed in Chapter 14:
stand this by reconsidering one of the forms of Ohm’s
the cardiac output increases. One can easily under-
versely, when the total peripheral resistance decreases,
increases above normal, the cardiac output falls; con-
normal. Then, when the total peripheral resistance
cent mark in the figure), the cardiac output is also
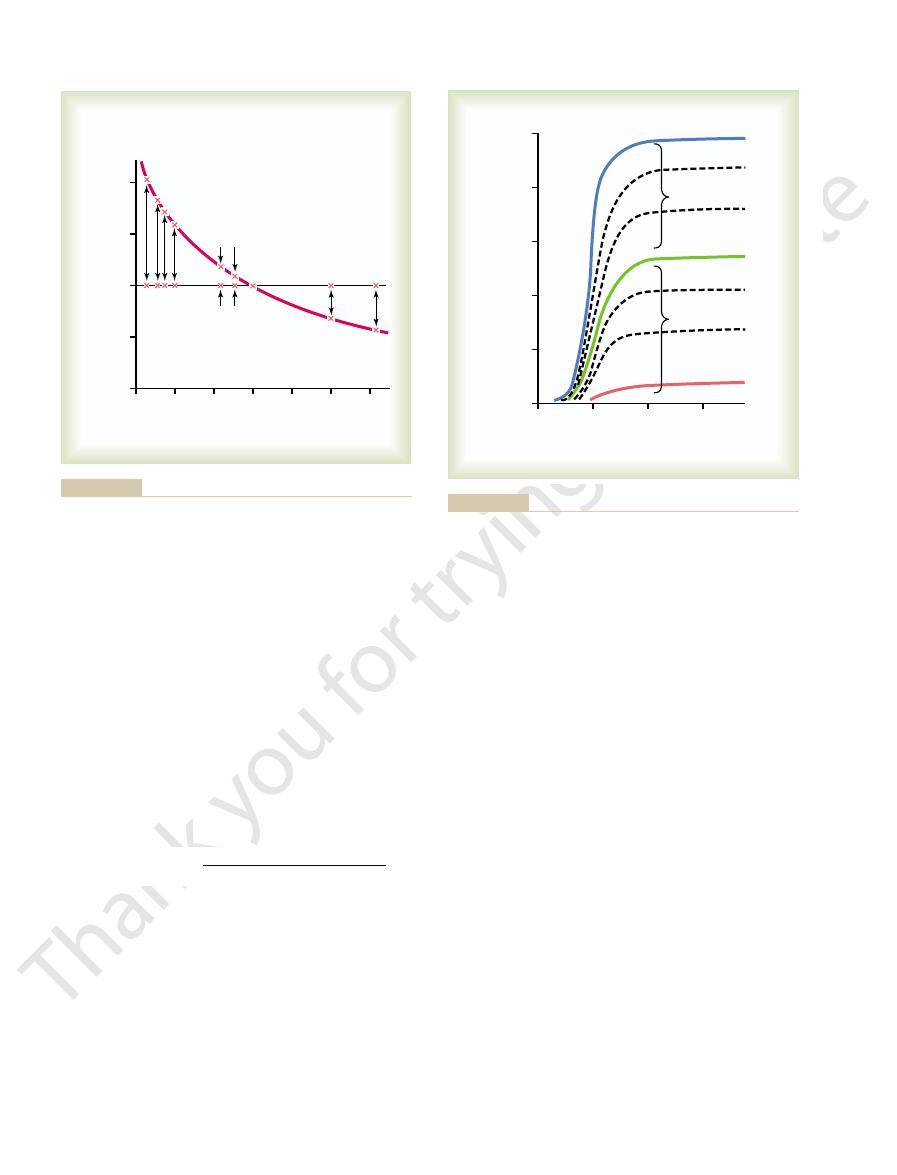
resistance. Note in Figure 20–3 that when the total
normal conditions, the long-term cardiac output level
principle in cardiac output control: Under most
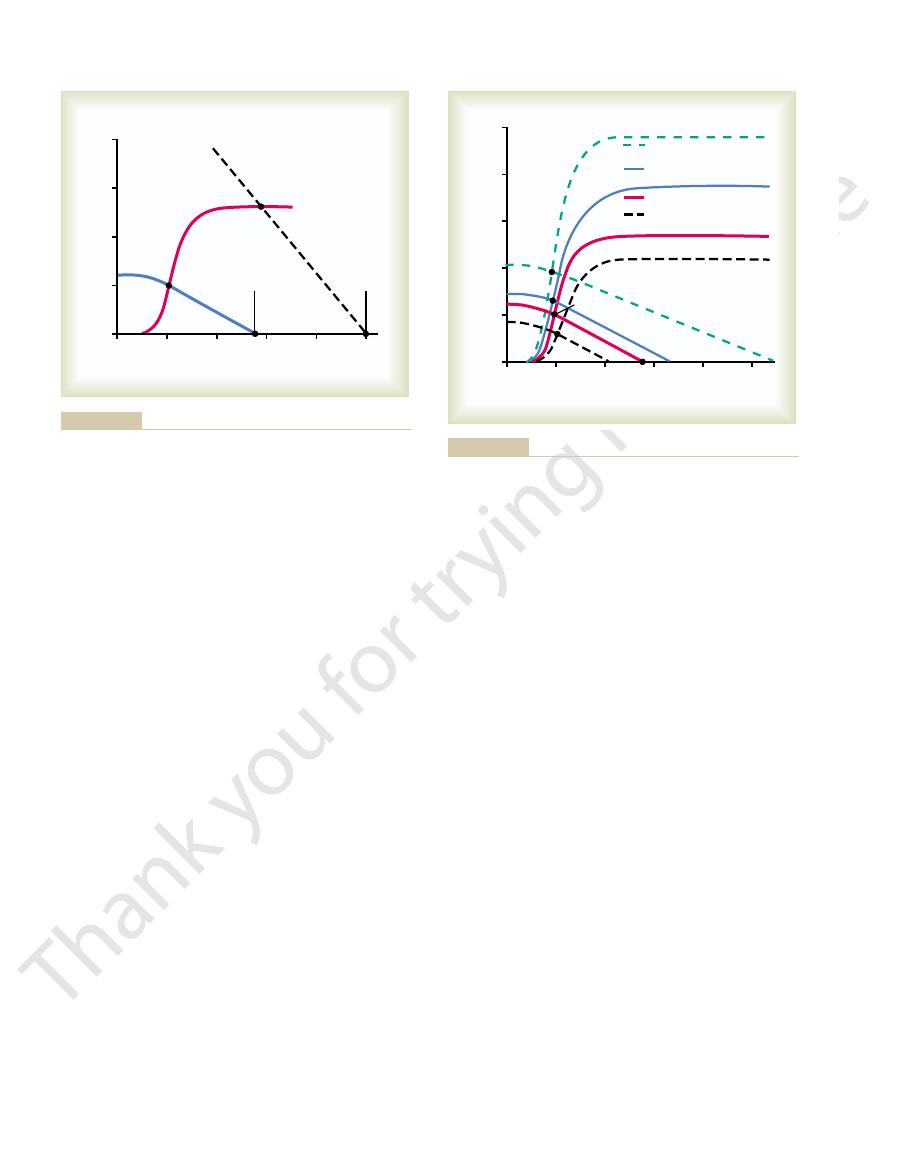
Figure 20–3 is the same as Figure 19–5.
Effect of Total Peripheral Resistance on the Long-Term Cardiac
234
Unit IV
The Circulation
Output Level.
It is repeated here to illustrate an extremely important
varies reciprocally with changes in total peripheral
peripheral resistance is exactly normal (at the 100 per
total peripheral resistance changes (but no other func-
changes quantitatively in exactly the opposite direction.
The Heart Has Limits for the Cardiac
tively in the form of
.
Cardiac Output
Arterial Pressure
Total Peripheral Resistance
=
sometimes, in young people, from the normal level of
of the heart: (1) it greatly increases the heart rate
Chapter 9, we saw that a combination of (1) sympa-
Effect of Nervous Excitation to Increase Heart Pumping.
ulation and (2) hypertrophy of the heart muscle.
a better pump than normal. They are (1) nervous stim-
Factors That Can Cause Hypereffective Heart
that are pumping better than normal. The low-
mally. The uppermost curves are for
4 are several other cardiac
Shown in Figure 20
tion, can pump an amount of venous return up to
human heart, functioning without any special stimula-
output of about 5 L/min. This means that the normal
curve is about 13 L/min, 2.5 times the normal cardiac
which was discussed in Chapter 9. Note
function curve,
cardiac
level of right atrial pressure. This is one type of
, showing the cardiac output per minute at each
normal cardiac output
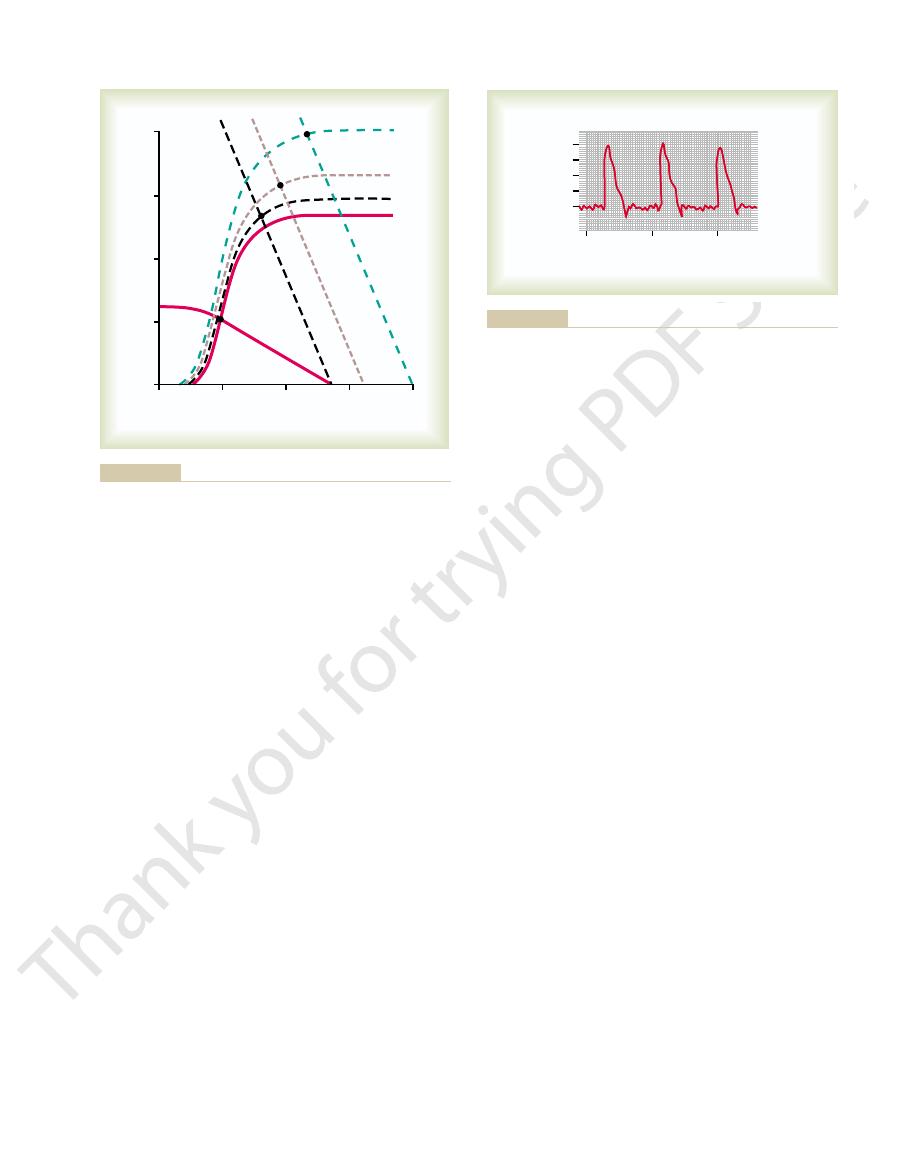
Figure 20–4 demonstrates the
curve
that the plateau level of this normal cardiac output
about 2.5 times the normal venous return before the
heart becomes a limiting factor in the control of
cardiac output.
–
output curves for hearts that are not pumping nor-
hypereffective
hearts
ermost curves are for hypoeffective hearts that are
pumping at levels below normal.
Only two types of factors usually can make the heart
In
thetic stimulation and (2) parasympathetic inhibition
does two things to increase the pumping effectiveness
—
40
60
80
100
120
140
160
Arterial pressure or cardiac output
(percentage of normal)
0
50
100
150
200
Total peripheral resistance
(percentage of normal)
output
Beriberi
AV shunts
Hyperthyroidism
Anemia
Normal
Pulmonary disease
Paget’s disease
Removal of both arms and legs
Hypothyroidism
C
ar
dia
c
AC: Arterial Pressure and Hypertension. Philadelphia: WB
peripheral resistance and cardiac output. (Redrawn from Guyton
cardiac output, showing a reciprocal relationship between total
Chronic effect of different levels of total peripheral resistance on
Figure 20–3
Saunders Co, 1980.)
4
0
+4
+8
Cardiac output (L
/min)
–
0
5
10
15
20
25
Right atrial pressure (mm Hg)
Normal
Hypereffective
Hypoeffective
Coleman TB: Circulatory Physiology: Cardiac Output and Its
and hypereffective hearts. (Redrawn from Guyton AC, Jones CE,
Cardiac output curves for the normal heart and for hypoeffective
Figure 20–4
Regulation. 2nd ed. Philadelphia: WB Saunders Co, 1973.)
In summary, when local tissue vessels dilate and
ow through the active muscles.
above normal, which in turn forces still more blood
and increased contractility of the heart. All these
causing large vein constriction, increased heart rate,
centers of the brain to excite circulatory activity,
nervous system immediately compensates. The same
decrease the arterial pressure also. However, the
the total peripheral resistance, which normally would
muscle contraction. Obviously, this greatly decreases
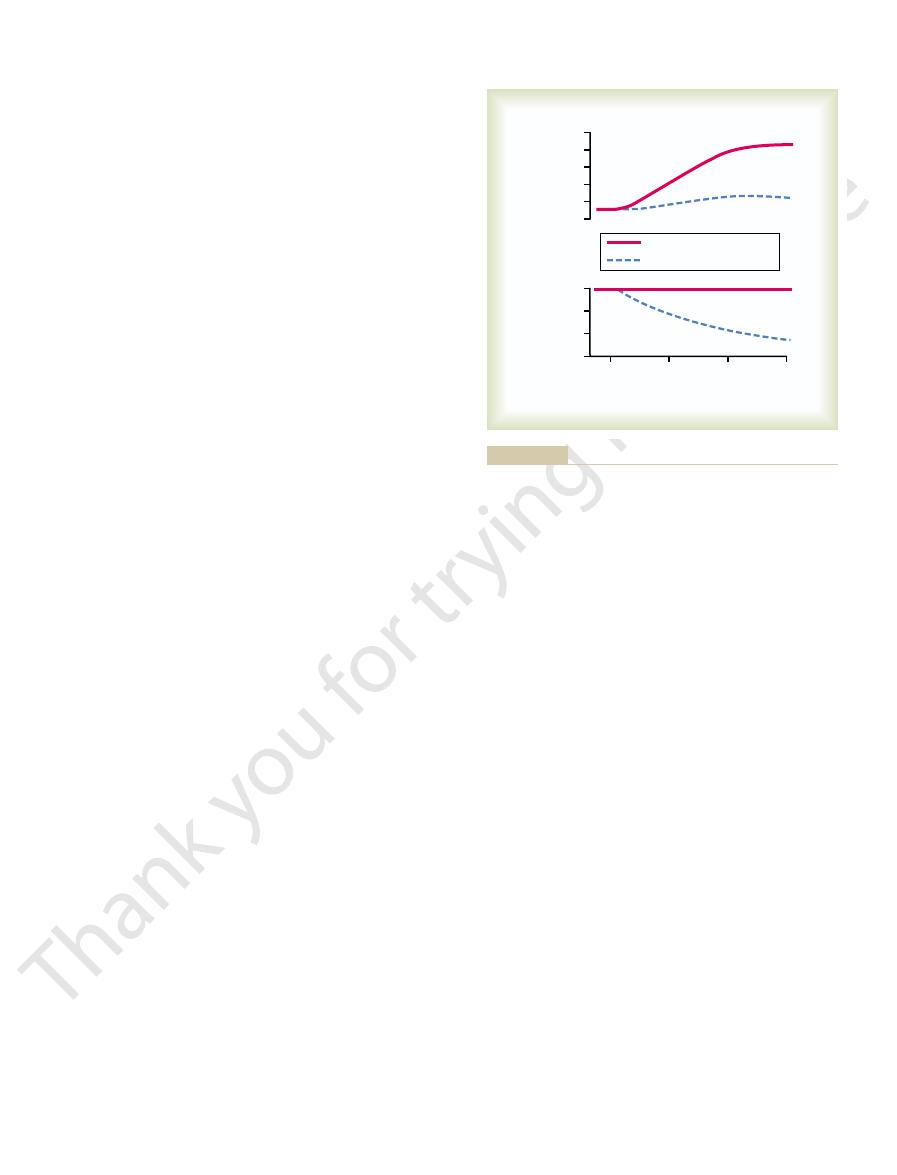
During exercise, intense increase in
Effect of the Nervous System to
Chapter 18, is essential to achieve high cardiac outputs
exes, by mechanisms explained in
Thus, maintenance of a normal arterial pressure by
fall in arterial pressure to about one half normal, and
could function, and vasodilation of the vessels with
system had been blocked, none of the normal circula-
However, after autonomic control of the nervous
pressure from falling, dilating all the peripheral blood
the drug dinitrophenol, which increased the metabo-
nomic nervous system. The solid curves demonstrate
Figure 20
Venous Return and Cardiac Output Increase
Maintaining the Arterial Pressure When the
Importance of the Nervous System in
Nervous System in Controlling
What Is the Role of the
heart must pump, such as in hypertension
Valvular heart disease
Coronary artery blockage, causing a
blood causes hypoeffectivity. Some of the factors that
Factors That Cause a Hypoeffective Heart
s running time.
times normal; this increased level
40 L/min, about 2
and hypertrophy, as occurs in marathon runners, the
When one combines nervous excitation of the heart
the cardiac output curve, sometimes 60 to 100 per cent,
by 50 to 75 per cent. This increases the plateau level of
muscles to hypertrophy. For instance, it is common for
excess load that it damages the heart, causes the heart
A long-term increased workload, but not so much
Increased Pumping Effectiveness Caused by Heart Hypertrophy.
level of the uppermost curve in Figure 20
plateau of the normal curve, as shown by the 25-liter
strength. Combining these two effects, maximal
Cardiac Output, Venous Return, and Their Regulation
Chapter 20
235
72 beats/min up to 180 to 200 beats/min—and (2) it
increases the strength of heart contraction (which is
called increased “contractility”) to twice its normal
nervous excitation of the heart can raise the plateau
level of the cardiac output curve to almost twice the
–4.
muscle to increase in mass and contractile strength in
the same way that heavy exercise causes skeletal
the hearts of marathon runners to be increased in mass
and therefore allows the heart to pump much greater
than usual amounts of cardiac output.
total effect can allow the heart to pump as much 30 to
1
/
2
of pumping is one of the most important factors in
determining the runner’
Any factor that decreases the heart’s ability to pump
can do this are the following:
“heart
attack”
Inhibition of nervous excitation of the heart
Pathological factors that cause abnormal heart
rhythm or rate of heartbeat
Increased arterial pressure against which the
Congenital heart disease
Myocarditis
Cardiac hypoxia
Cardiac Output?
–5 shows an important difference in cardiac
output control with and without a functioning auto-
the effect in the normal dog of intense dilation of
the peripheral blood vessels caused by administering
lism of virtually all tissues of the body about fourfold.
Note that with nervous control to keep the arterial
vessels caused almost no change in arterial pressure
but increased the cardiac output almost fourfold.
tory reflexes for maintaining the arterial pressure
dinitrophenol (dashed curves) then caused a profound
the cardiac output rose only 1.6-fold instead of 4-fold.
the nervous refl
when the peripheral tissues dilate their vessels to
increase the venous return.
Increase the Arterial Pressure
During Exercise.
metabolism in active skeletal muscles acts directly on
the muscle arterioles to relax them and to allow ade-
quate oxygen and other nutrients needed to sustain
brain activity that sends motor signals to the muscles
sends simultaneous signals into the autonomic nervous
changes acting together increase the arterial pressure
fl
thereby increase venous return and cardiac output
0
10
20
(L
/min)
Cardiac output
0
2
3
4
5
6
Arterial pressure
(mm Hg)
0
50
75
100
With pressure control
Dinitrophenol
Without pressure control
30
Minutes
very little. (Drawn from experiments by Dr. M. Banet.)
sure control, the arterial pressure falls and the cardiac output rises
increases cardiac output greatly; without pres-
dinitrophenol
output control. Note that with pressure control, the metabolic stim-
maintenance of the arterial pressure as a prerequisite for cardiac
Experiment in a dog to demonstrate the importance of nervous
Figure 20–5
ulant
these is reduced viscosity of the blood, resulting
decrease the total peripheral resistance. One of
In anemia, two peripheral effects greatly
consequently, the venous return and cardiac output
Therefore, the total peripheral resistance decreases
vasodilator products are released from the tissues.
greatly increased. Oxygen usage increases, and
In hyperthyroidism, the
likewise, increases the venous return and cardiac
from the artery into the vein. This, too, greatly
vein, tremendous amounts of blood
stula (also called an AV
Earlier, we pointed
Arteriovenous fistula (shunt).
to as little as one-half normal. Consequently, the
of the tissues to use some cellular nutrients, and the
diet. Lack of this vitamin causes diminished ability
This disease is caused by insuf
sequently. For the present, let us look at some of the
excitation of the heart itself, which we will explain sub-
eral resistance.
they all result from chronically reduced total periph-
The left side of Figure 20
by Reduced Total Peripheral
important of these are shown in Figure 20
either high or low cardiac outputs. Some of the more
However, multiple clinical abnormalities can cause
surprisingly constant from one person to another.
In healthy human beings, the cardiac outputs are
Cardiac Outputs
even above normal, which serves to increase the
exercise, the nervous system goes even further, pro-
from falling to disastrously low levels. In fact, during
above normal, the nervous system plays an exceed-
236
Unit IV
The Circulation
ingly important role in preventing the arterial pressure
viding additional signals to raise the arterial pressure
cardiac output an extra 30 to 100 per cent.
Pathologically High and
Pathologically Low
–6.
High Cardiac Output Caused
Resistance
–6 identifies conditions that
commonly cause cardiac outputs higher than normal.
One of the distinguishing features of these conditions is
that
None of them result from excessive
conditions that can decrease the peripheral resistance
and at the same time increase the cardiac output to
above normal.
1. Beriberi.
ficient
quantity of the vitamin thiamine (vitamin B
1
) in the
local tissue blood flow mechanisms in turn cause
marked compensatory peripheral vasodilation.
Sometimes the total peripheral resistance decreases
long-term levels of venous return and cardiac
output also often increase to twice normal.
2.
out that whenever a fi
shunt) occurs between a major artery and a major
flow directly
decreases the total peripheral resistance and,
output.
3. Hyperthyroidism.
metabolism of most tissues of the body becomes
markedly because of the local tissue blood
flow control reactions throughout the body;
often increase to 40 to 80 per cent above normal.
4. Anemia.
from the decreased concentration of red blood
(L
/min/
m
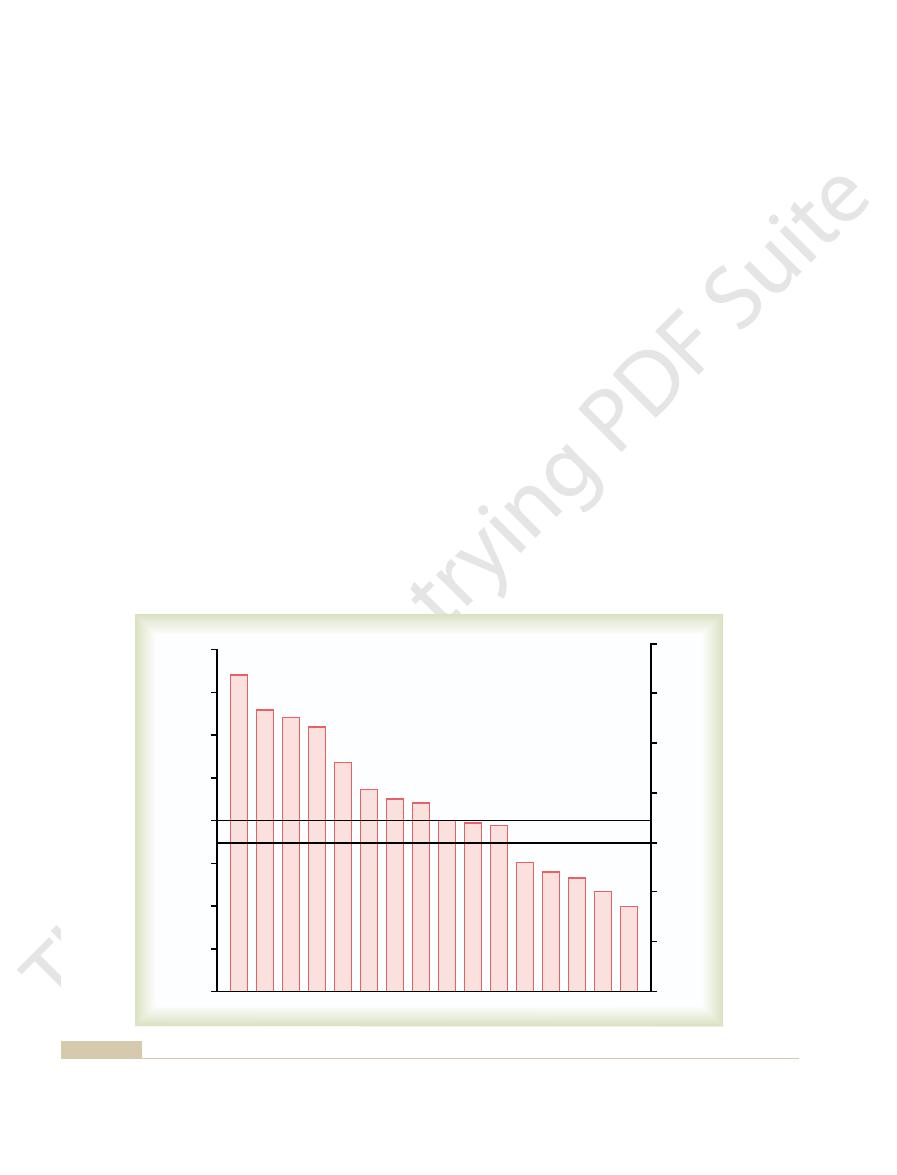
Average 45-year-old adult
T
raumatic shock (4)
A
V
shunts (33)
Beriberi (5)
Hyperthyroidism (29)
Anemia (75)
Anxiety (21)
Pulmonary disease (29)
Pregnancy (46)
Paget
’s disease (9)
Control (young adults) (308)
Hypertension (47)
Mild valve disease (31)
Myocardial infarction (22)
Mild shock (4)
Severe valve disease (29)
Cardiac shock (7)
Control (young adults)
200
175
150
125
100
75
50
25
0
Cardiac output
(per cent of control)
7
6
5
4
3
2
1
0
Cardiac index
2
)
(Redrawn from Guyton AC, Jones CE, Coleman TB: Circulatory Physiology: Cardiac Output and Its Regulation. 2nd ed. Philadelphia:
Cardiac output in different pathological conditions. The numbers in parentheses indicate number of patients studied in each con
Figure 20–6
dition.
WB Saunders Co, 1973.)

50 mm Hg during strenuous breathing.
2 mm Hg during
, which are about
Cyclical changes of intrapleural pressure during
4 mm Hg, which shifts
2 mm Hg requires a 6 mm Hg increase in right
of the heart. Likewise, an increase in intrapleural pres-
with blood requires an extra 2 mm Hg right atrial pres-
This shift occurs because to
2 mm Hg, shifts the entire
intrapleural pressure, to
4 mm Hg. Note in the
nal cardiac pressure on the cardiac output curve. The
Figure 20
Curves.
the heart, as explained in the next section.
4. However, an additional set of
shown in Figure 20
venous return, and right atrial pressure at the same time.
Then one can put these
venous return curves.
ow of blood from the veins into the heart, as repre-
, and (2) the peripheral factors that affect
cardiac
pumping ability of the heart, as represented by
concerned with cardiac output regulation: (1) the
To perform the more quantitative analysis, it is nec-
sections.
cardiac failure, and circulatory shock, a more complex
stressful situations, such as the extremes of exercise,
cardiac output in most simple conditions. However, to
of Cardiac Output Regulation
A More Quantitative Analysis
within a few minutes to a few hours. Circulatory shock
This condition can be lethal
circulatory shock.
for adequate nutrition of the tissues, the person is said
whether it be a peripheral factor or a cardiac factor, if
ow needs of the muscles, resulting in
turn, decreases the total oxygen consumption and
reduction in the size of the skeletal muscles. This, in
periods of physical inactivity, there is usually a
With normal aging or with prolonged
muscle mass.
Consequently, the cardiac output falls markedly.
obstructed, so that the blood in the peripheral
On rare occasions,
Obstruction of the large veins.
result, the blood
accid peripheral blood vessels. As a
veins, to dilate markedly. This decreases the
the peripheral capacitative vessels, especially the
sympathetic nervous system activity, which causes
system suddenly becomes inactive. For instance,
peripheral veins become acutely vasodilated. This
On some occasions, the
output: Loss of blood decreases the
volume, resulting most often from hemorrhage.
By far, the most
Decreased blood volume.
cardiac output. Some of these factors are the following:
Factors—Decreased Venous Return.
cussed fully in Chapter 22 in relation to cardiac failure.
This is dis-
cardiac shock.
ciency, the condition is called
When the cardiac output falls so low that the tissues
6, demonstrating the low cardiac outputs that
Figure 20
The effects of several of these are shown on the right in
cardiac metabolic derangements.
, and (5)
cardiac
, (4)
myocarditis
, (3)
, (2)
blockage and consequent myocardial infarction
ow to the tissues. Some
of the cause, its limited level of pumping may fall below
ever the heart becomes severely damaged, regardless
When-
low.
fall into two categories: (1) those abnormalities that
cause abnormally low cardiac output. These conditions
Figure 20
consequence, the cardiac output increases greatly.
the tissues, which causes local vasodilation. As a
cells. The other is diminished delivery of oxygen to
Cardiac Output, Venous Return, and Their Regulation
Chapter 20
237
Any other factor that decreases the total peripheral
resistance chronically also increases the cardiac output.
Low Cardiac Output
–6 shows at the far right several conditions that
cause the pumping effectiveness of the heart to fall too
low and (2) those that cause venous return to fall too
Decreased Cardiac Output Caused by Cardiac Factors.
that needed for adequate blood fl
examples of this include (1) severe coronary blood vessel
severe valvular heart disease
tamponade
–
result.
throughout the body begin to suffer nutritional defi-
Decrease in Cardiac Output Caused by Non-cardiac Peripheral
Anything that inter-
feres with venous return also can lead to decreased
1.
common non-cardiac peripheral factor that leads
to decreased cardiac output is decreased blood
It is clear why this condition decreases the cardiac
filling of the
vascular system to such a low level that there is not
enough blood in the peripheral vessels to create
peripheral vascular pressures high enough to push
the blood back to the heart.
2. Acute venous dilation.
results most often when the sympathetic nervous
fainting often results from sudden loss of
filling
pressure of the vascular system because the blood
volume can no longer create adequate pressure
in the now fl
“pools” in the vessels and does not
return to the heart.
3.
the large veins leading into the heart become
vessels cannot flow back into the heart.
4. Decreased tissue mass, especially decreased skeletal
blood fl
decreases in skeletal muscle blood flow and cardiac
output.
Regardless of the cause of low cardiac output,
ever the cardiac output falls below that level required
to suffer
is such an important clinical problem that it is discussed
in detail in Chapter 24.
Our discussion of cardiac output regulation thus far is
adequate for understanding the factors that control
understand cardiac output regulation in especially
quantitative analysis is presented in the following
essary to distinguish separately the two primary factors
output curves
fl
sented by
curves together in a quantitative way to show how they
interact with each other to determine cardiac output,
Cardiac Output Curves Used in the
Quantitative Analysis
Some of the cardiac output curves used to depict quan-
titative heart pumping effectiveness have already been
–
curves is required to show the effect on cardiac output
caused by changing external pressures on the outside of
Effect of External Pressure Outside the Heart on Cardiac Output
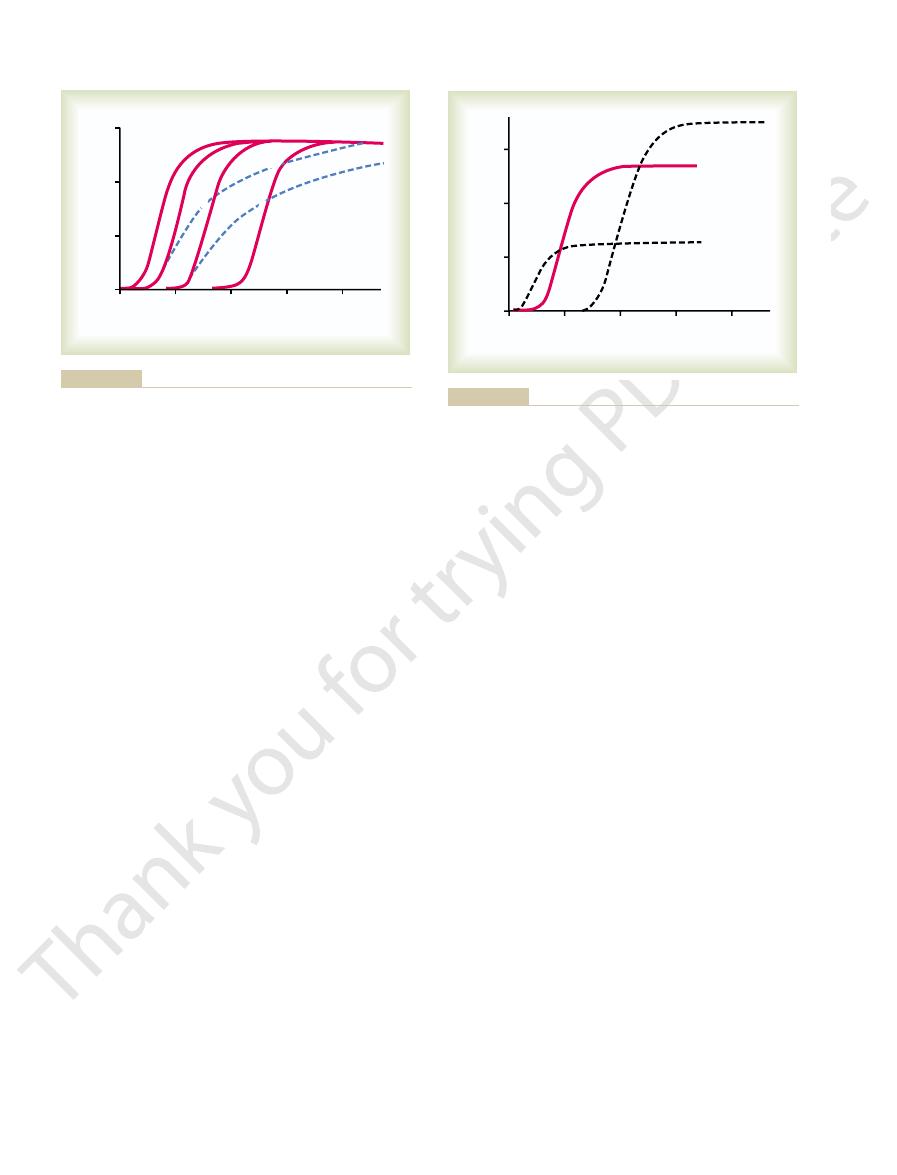
–7 shows the effect of changes in exter-
normal external pressure is equal to the normal
intrapleural pressure (the pressure in the chest cavity),
which is
-
figure that a rise in
-
cardiac output curve to the right by the same amount.
fill the cardiac chambers
sure to overcome the increased pressure on the outside
sure to
+
atrial pressure from the normal
-
the entire cardiac output curve 6 mm Hg to the right.
Some of the factors that can alter the intrapleural
pressure and thereby shift the cardiac output curve are
the following:
1.
respiration
±
normal breathing but can be as much as
±
and causing venous stasis, pumping by the heart also
bag, so that any increase in back pressure causes blood
7 mm Hg. Such a slight rise in
nervous circulatory reflexes are prevented from acting
pressure to rise, the backward force of the rising atrial
curve. This curve shows that when heart pumping capa-
9 is the
The curve in Figure 20
levels of right atrial pressure.
that is, the venous
pumping of blood by the heart to right atrial pressure,
Normal Venous Return Curve
sections.
venous return curve,
These factors can all be expressed quantitatively
Resistance to blood flow
2. Degree of
, which exerts a backward force
heart from the systemic circulation. They are as follows:
different circulatory states. In these studies, one
venous pressure in the right atrium, are altered to
such blood volume, vascular resistances, and central
cial oxygenator system. Then, different factors,
circulation, we
can be achieved. To analyze the function of the systemic
There remains the entire systemic circulation that must
Venous Return Curves
heart to pump blood by a single cardiac output curve.
as a pump, one can express the momentary ability of the
a pump. Thus, by knowing what is happening to the
Figure 20
Combinations of Different Patterns of Cardiac Output Curves.
right. Note in Figure 20
, which means accumulation of
Cardiac tamponade
cardiac output curve to the right 4 mm Hg.
intrapleural pressure to 0 mm Hg and shifts the
, which increases the
, which shifts the curve to
Positive pressure breathing
, which shifts
238
Unit IV
The Circulation
2. Breathing against a negative pressure
the curve to a more negative right atrial pressure
(to the left).
3.
the right.
4. Opening the thoracic cage
5.
a large quantity of fluid in the pericardial cavity
around the heart with resultant increase in external
cardiac pressure and shifting of the curve to the
–7 that cardiac tamponade
shifts the upper parts of the curves farther to the
right than the lower parts because the external
“tamponade” pressure rises to higher values as the
chambers of the heart fill to increased volumes
during high cardiac output.
–8 shows that the final cardiac output curve can
change as a result of simultaneous changes in (a) exter-
nal cardiac pressure and (b) effectiveness of the heart as
external pressure as well as to the capability of the heart
be considered before total analysis of cardiac regulation
first remove the heart and lungs from the
circulation of an animal and replace them with a pump
and artifi
determine how the systemic circulation operates in
finds
three principal factors that affect venous return to the
1. Right atrial pressure
on the veins to impede flow of blood from the
veins into the right atrium.
filling of the systemic circulation
(measured by the mean systemic filling pressure),
which forces the systemic blood toward the heart
(this is the pressure measured everywhere in the
systemic circulation when all flow of blood is
stopped—we discuss this in detail later).
3.
between the peripheral
vessels and the right atrium.
by the
as we explain in the next
In the same way that the cardiac output curve relates
the venous return curve relates venous return also to
right atrial pressure—
flow of blood
into the heart from the systemic circulation at different
–
normal venous return
bility becomes diminished and causes the right atrial
pressure on the veins of the systemic circulation
decreases venous return of blood to the heart. If all
,
venous return decreases to zero when the right atrial
pressure rises to about
+
right atrial pressure causes a drastic decrease in venous
return because the systemic circulation is a distensible
to dam up in this bag instead of returning to the heart.
At the same time that the right atrial pressure is rising
0
+4
+8
+12
Cardiac output (L
/min)
0
–4
Right atrial pressure (mm Hg)
5
10
15
Car
diac
tam
pona
d
e
N
or
m
a
l
(i
n
tr
a
p
le
u
ra
l
p
re
s
s
u
re
=
–
4
m
m
Hg
)
In
tr
a
p
le
u
ra
l
p
re
s
s
u
re
=
–5
.5
m
m
In
tr
a
p
le
u
ra
l
p
re
s
s
u
re
=
–
2
m
m
Hg
In
tr
a
p
le
u
r
a
l
p
re
s
s
u
re
=
+
2
m
m
H
g
Cardiac Output and Its Regulation. 2nd ed. Philadelphia: WB
Guyton AC, Jones CE, Coleman TB: Circulatory Physiology:
and at different degrees of cardiac tamponade. (Redrawn from
Cardiac output curves at different levels of intrapleural pressure
Figure 20–7
Saunders Co, 1973.)
Hypoeffective
Hypereffective
0
+4
+8
+12
Cardiac output (L
/min)
0
–4
Right atrial pressure (mm Hg)
5
10
15
Normal
–increased
intrapleural pressure
–reduced
intrapleural pressure
Jones CE, Coleman TB: Circulatory Physiology: Cardiac Output
effectiveness of the heart as a pump. (Redrawn from Guyton AC,
showing the effect of alterations in both extracardiac pressure and
Combinations of two major patterns of cardiac output curves
Figure 20–8
and Its Regulation. 2nd ed. Philadelphia: WB Saunders Co, 1973.)
about 17 mm Hg.
pressure from 7 mm Hg to about 2.5 times that value, or
increased. At normal blood volume, maximal sympa-
blood volume, the mean circulatory
capacity of the system decreases, so that at each level of
and even the chambers of the heart. Therefore, the
lling pressure. Strong sympa-
10 show the effects, respectively,
in Figure 20
The
Mean Circulatory Filling Pressure.
Effect of Sympathetic Nervous Stimulation of the Circulation on
lling pressure increases almost linearly.
of 7 mm Hg. Similarly, at still higher volumes, the mean
of 5000 milliliters, the
of the circulation, but at a volume
blood volume of about 4000 milliliters, the mean circu-
lling pressure. Note that at a
in Figure 20
ture. The
The greater the volume of blood in the circulation, the
Effect of Blood Volume on Mean Circulatory Filling Pressure.
mean circulatory filling pressure.
become equal. This equilibrated pressure level is called
ow, the pressures everywhere in the circulation
the circulation ceases a few seconds later.Without blood
stopped in any other way,
When heart pumping is stopped by shocking the heart
Pressure, and Their Effect on Venous Return
Mean Circulatory Filling Pressure and Mean Systemic Filling
0 mm Hg.
veins. Consequently, even very negative pressures in the
veins together where they enter the chest, which pre-
entering the chest. Neg-
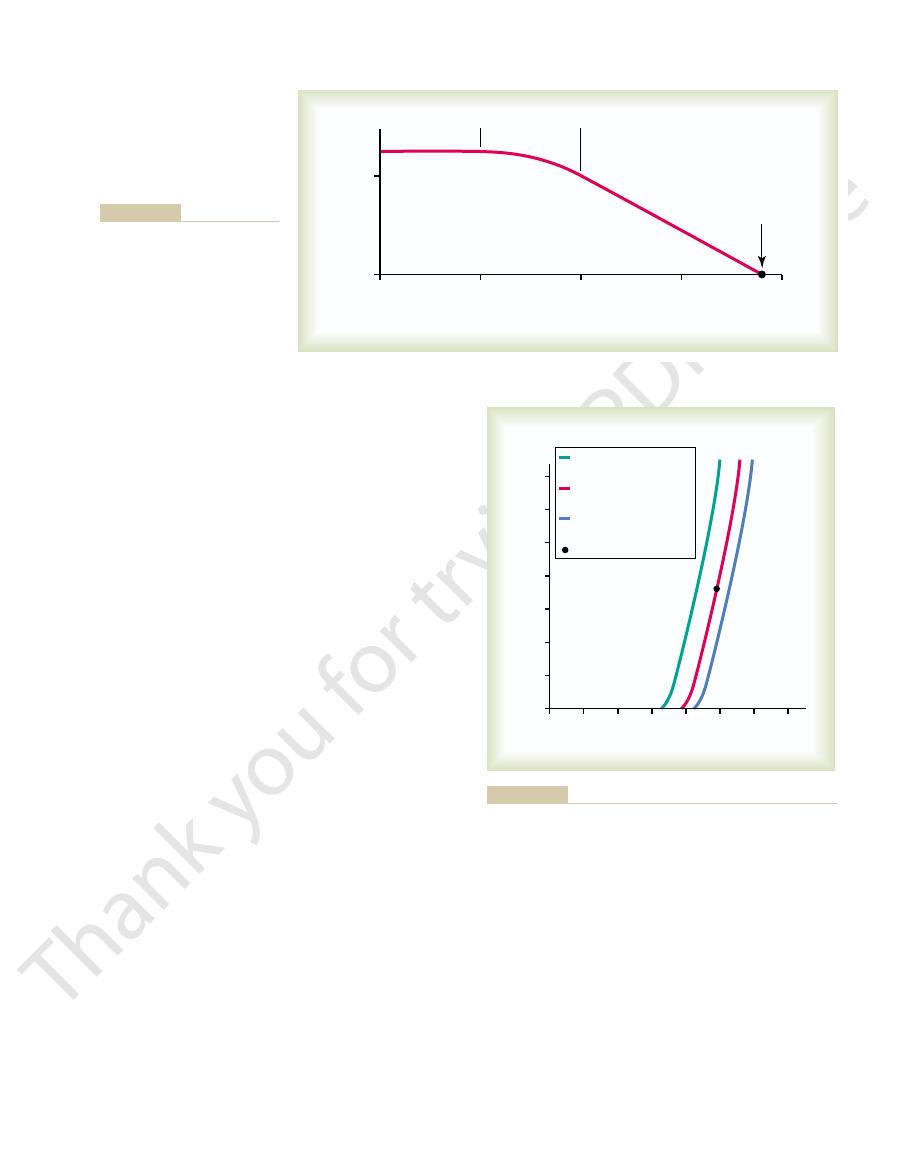
50 mm Hg, or even further.This plateau
20 mm Hg,
return will have reached a plateau. It remains at this
2 mm Hg, the venous
return almost ceases. And by the time the right atrial
that is, below
below
When the
Pressures—Caused by Collapse of the Large Veins.
Plateau in the Venous Return Curve at Negative Atrial
nition, is
ceases at a pressure of 7 mm Hg, which, by de
Cardiac Output, Venous Return, and Their Regulation
Chapter 20
239
approaches zero because of decreasing venous return.
Both the arterial and the venous pressures come to
equilibrium when all flow in the systemic circulation
fi
the mean systemic filling pressure (Psf).
right atrial pressure falls
zero—
atmospheric pressure—further increase in venous
pressure has fallen to about
-
plateau level even though the right atrial pressure falls
to
-
-
is caused by collapse of the veins
ative pressure in the right atrium sucks the walls of the
vents any additional flow of blood from the peripheral
right atrium cannot increase venous return significantly
above that which exists at a normal atrial pressure of
with electricity to cause ventricular fibrillation or is
flow of blood everywhere in
fl
the
greater is the mean circulatory filling pressure because
extra blood volume stretches the walls of the vascula-
red curve
–10 shows the approxi-
mate normal effect of different levels of blood volume
on the mean circulatory fi
latory filling pressure is close to zero because this is the
“unstressed volume”
filling pressure is the normal value
circulatory fi
green curve and blue
curve
–
of high and low levels of sympathetic nervous activity
on the mean circulatory fi
thetic stimulation constricts all the systemic blood
vessels as well as the larger pulmonary blood vessels
filling pressure is
thetic stimulation increases the mean circulatory filling
4
0
+4
+8
Venous return (L
/min)
0
5
–8
–
Transitional zone
Plateau
Down slo
pe
Mean
systemic
filling
pressure
Right atrial pressure (mm Hg)
mean systemic filling pressure.
atrial pressure rises to equal the
becomes zero when the right
Note also that venous return
below atmospheric pressure.
when the right atrial pressure falls
venous return curve
Normal
Figure 20–9
. The
plateau is caused by collapse of
the large veins entering the chest
0
1000 2000 3000 4000 5000 6000 7000
0
2
4
6
8
10
12
14
–
Volume (ml)
Mean circulatory filling pressure (mm Hg)
Strong sympathetic
stimulation
Normal circulatory
system
Complete sympathetic
inhibition
Normal volume
culatory system). These curves also show the effects of strong
(i.e., “volume-pressure curves” for the entire cir-
filling pressure
mean circulatory
Effect of changes in total blood volume on the
Figure 20–10
sympathetic stimulation and complete sympathetic inhibition.

ow.
7 mm Hg, right atrial pressure equals 0 mm Hg, and
equals 5 L/min, mean systemic
adult, the values for these are as follows: venous return
is resistance to venous return. In the healthy human
lling pressure, PRA is right atrial pressure, and RVR
in which VR is venous return, Psf is mean systemic
Venous return can be calculated by the following
artery resistance.
ance, and about one third by the arteriolar and small
come much of the increased resistance. Mathematically,
the veins. Therefore, even slight accumulation of blood
resistances increase, blood accumulates in the arteries,
drastically. Conversely, when arteriolar and small artery
ance, and blood
are highly distensible. Therefore, this rise in venous
to be dammed up, mainly in the veins themselves. But
when the resistance in the veins increases, blood begins
ing the resistance to venous return? The answer is that
Why is venous resistance so important in determin-
occurs in the veins, although some occurs in the arteri-
ow of blood. It is called the
periphery toward the heart, there is also resistance to
Resistance to Venous Return
. Therefore, the difference between these
11. That is,
venous return curves in Figure 20
proportionately, as one can see by studying any of the
lling pressure, the
back to the right atrium. However, when the right atrial
vessels and the right atrium. Consequently, there can no
lling pressure, there is no
When the right atrial pressure rises
Is No Venous Return.
“Pressure Gradient for Venous Return”—When This Is Zero, There
lling, the more dif
The less the
lled, the easier it is for blood to
To express this another way, the greater the system is
downward
lling pressure,
Conversely, the lower the mean systemic
upward
decreased to 3.5 mm Hg. These curves demonstrate that
14 mm Hg, and for the lowermost curve, has been
gure,
7 mm Hg. Then, for the uppermost curve in the
lling pressure (Psf). Note in Figure
Figure 20
Effect on the Venous Return Curve of Changes in Mean Systemic
one tenth as much blood volume.
is almost always nearly
however
impossible to measure in the living animal, is the impor-
lation. The mean systemic pressure, although almost
by clamping the large blood vessels at the heart, so that
pressure. It is the pressure measured everywhere
Psf, is slightly different from the mean circulatory
The
tory Filling Pressure.
pressure.
steep the curves are. This means that even slight changes
10, note speci
Hg. Before leaving Figure 20
heart, decreasing the mean circulatory
Conversely, complete inhibition of the sympathetic
240
Unit IV
The Circulation
nervous system relaxes both the blood vessels and the
filling pressure
from the normal value of 7 mm Hg down to about 4 mm
–
fically how
in blood volume or slight changes in the capacity of the
system caused by various levels of sympathetic activity
can have large effects on the mean circulatory filling
Mean Systemic Filling Pressure and Its Relation to Mean Circula-
mean systemic filling pressure,
filling
in the
systemic circulation after blood flow has been stopped
the pressures in the systemic circulation can be meas-
ured independently from those in the pulmonary circu-
tant pressure for determining venous return. The mean
systemic filling pressure,
,
equal to the mean circulatory filling pressure because the
pulmonary circulation has less than one eighth as much
capacitance as the systemic circulation and only about
Filling Pressure.
–11 shows the effects on the
venous return curve caused by increasing or decreasing
the mean systemic fi
20–11 that the normal mean systemic filling pressure is
fi
the mean systemic filling pressure has been increased to
the greater the mean systemic filling pressure (which
also means the greater the “tightness” with which the
circulatory system is filled with blood) the more the
venous return curve shifts
and to the right.
fi
the more the curve shifts
and to the left.
fi
flow into the heart.
fi
ficult it is for blood to
flow into the heart.
to equal the mean systemic fi
longer any pressure difference between the peripheral
longer be any blood flow from any peripheral vessels
pressure falls progressively lower than the mean sys-
temic fi
flow to the heart increases
–
the greater
the difference between the mean systemic filling pressure
and the right atrial pressure, the greater becomes the
venous return
two pressures is called the pressure gradient for venous
return.
In the same way that mean systemic filling pressure rep-
resents a pressure pushing venous blood from the
this venous fl
resistance to
venous return. Most of the resistance to venous return
oles and small arteries as well.
the venous pressure rises very little because the veins
pressure is not very effective in overcoming the resist-
flow into the right atrium decreases
which have a capacitance only 1/30 as great as that of
in the arteries raises the pressure greatly—30 times as
much as in the veins—and this high pressure does over-
it turns out that about two thirds of the so-called “resist-
ance to venous return” is determined by venous resist-
formula:
fi
filling pressure equals
resistance to venous return equals 1.4 mm Hg per liter
of blood fl
Psf
PRA
VR
RVR
=
-
4
0
+4
+8
+12
Venous return (L
/min)
–
0
5
10
Right atrial pressure (mm Hg)
Normal
Psf = 3.5
Psf = 7
Psf = 14
Cardiac Output and Its Regulation. 2nd ed. Philadelphia: WB
Guyton AC, Jones CE, Coleman TB: Circulatory Physiology:
of altering the Psf to either 3.5 or 14 mm Hg. (Redrawn from
systemic filling pressure (Psf) is 7 mm Hg, and showing the effect
Venous return curves showing the normal curve when the mean
Figure 20–11
Saunders Co, 1973.)
venous return curve of Figure 20
the curve upward. As a result of these two effects, the
reducing the resistance to venous return, which rotates
vessels, thus reducing their resistance and thereby
time, the increased blood volume distends the blood
shifts the venous return curve to the right. At the same
lling pressure (Psf) to increase to 16 mm Hg, which
diately on infusing the large quantity of extra blood, the
14. Imme-
analysis of this effect is shown in Figure 20
the cardiac output to about 2.5 to 3 times normal. An
Effect of Increased Blood Volume on Cardiac Output.
, giving a normal
point A, called the
cardiac output, and venous return are all depicted by
fore, in the normal circulation, the right atrial pressure,
for both the heart and the systemic circulation. There-
point A, at which the venous return equals the cardiac
There is only one point on the graph,
normal cardiac
Two curves in the
against each other, as shown in Figure 20
venous return curve; and (3)
this in the form of a cardiac output curve; (2) determine
right atrial pressure in the following way: (1) Determine
Therefore, one can predict the cardiac output and
circulation must operate together. This means that (1)
In the complete circulation, the heart and the systemic
Venous Return Curves
Simultaneous Cardiac Output and
Right Atrial Pressure, Using
Analysis of Cardiac Output and
both these factors can operate simultaneously.
and resistance to venous return, demonstrating that
Figure 20
Combinations of Venous Return Curve Patterns.
lling pressure.
regardless of how much the heart might fail, is equal to
highest level to which the right atrial pressure can rise
ow is still zero. Therefore,
is in the circulation; the
ow of blood, it makes no difference what the resistance
lling pressure, venous return
a slope.
rotates the curve downward
a slope. Conversely, an
rotates the curve upward
and, therefore,
return curve, showing that a
Figure 20
Curve.
Effect of Resistance to Venous Return on the Venous Return
Cardiac Output, Venous Return, and Their Regulation
Chapter 20
241
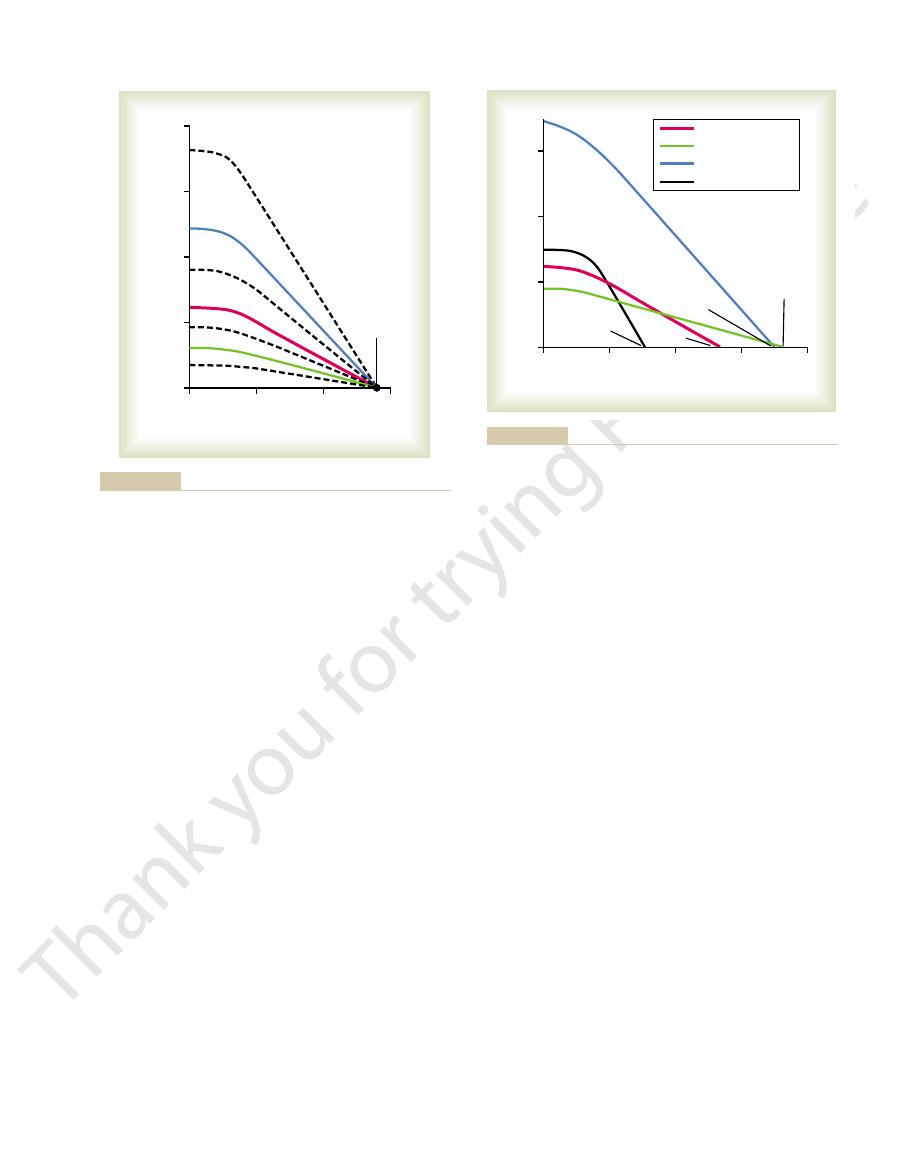
–12 demonstrates the effect of different
levels of resistance to venous return on the venous
decrease in this resistance
to one-half normal allows twice as much flow of blood
to twice as great
increase in resistance to twice
normal
to one-half as great
Note also that when the right atrial pressure rises to
equal the mean systemic fi
becomes zero at all levels of resistance to venous return
because when there is no pressure gradient to cause
fl
fl
the
,
the mean systemic fi
–13
shows effects on the venous return curve caused by
simultaneous changes in mean systemic pressure (Psf)
the venous return from the systemic circulation must
equal the cardiac output from the heart and (2) the right
atrial pressure is the same for both the heart and the
systemic circulation.
the momentary pumping ability of the heart and depict
the momentary state of flow from the systemic circula-
tion into the heart and depict this in the form of a
“equate” these curves
–14.
figure depict the
output curve (red line) and the normal venous return
curve (blue line).
output and at which the right atrial pressure is the same
equilibrium point
value for cardiac output of 5 liters per minute and a
right atrial pressure of 0 mm Hg .
A sudden
increase in blood volume of about 20 per cent increases
–
increased filling of the system causes the mean systemic
fi
–14 is shifted to the
1/
2 resistance
4
0
+4
+8
Venous return (L
/min)
–
0
5
10
15
20
Right atrial pressure (mm Hg)
Norm
al r
e
sista
nce
2
¥
resistanc
e
Psf = 7
Physiology: Cardiac Output and Its Regulation. 2nd ed. Philadel-
(Redrawn from Guyton AC, Jones CE, Coleman TB: Circulatory
ance to venous return.” Psf, mean systemic filling pressure.
Venous return curves depicting the effect of altering the “resist-
Figure 20–12
phia: WB Saunders Co, 1973.)
Venous return (L
/min)
–4
0
+4
+8
+12
0
5
10
15
Right atrial pressure (mm Hg)
Normal resistance
2
¥
resistance
1/2 resistance
1/3 resistance
Psf = 10
Psf = 7
Psf = 2.3
Psf = 10.5
Physiology: Cardiac Output and Its Regulation. 2nd ed. Philadel-
(Redrawn from Guyton AC, Jones CE, Coleman TB: Circulatory
filling pressure (Psf) and in “resistance to venous return.”
showing the effects of simultaneous changes in mean systemic
Combinations of the major patterns of venous return curves,
Figure 20–13
phia: WB Saunders Co, 1973.)
1. The two red curves crossing at point A show the
stula, that is, after
Figure 20
cardiac output falls from point A to point B, which is a
. The
inhibition caused by total spinal anesthesia, demon-
curves in Figure 20
signals through the autonomic ganglia. The lowermost
, that blocks transmission of nerve
or by using some drug, such as
The sym-
occur within seconds or minutes.
, until other compensatory effects
Thus, differ-
the right atrial pressure hardly changes.
heart by nearly 100 per cent. As a result, the cardiac
the zero venous return level).And the sympathetic stim-
pressure of 0 min Hg. Note in the
each other at point A, which represents a normal venous
venous return curves are depicted; these equate with
15, the
In Figure 20
(2) In the systemic circulation, it
temic circulation: (1) It
ally, over a period of 10 to 40 minutes, the cardiac output
the systemic circulation to constrict. Therefore, gradu-
. These
autoregulatory increase in the peripheral resistance,
. (3) The excess
reservoirs, such as the liver and spleen, to distend, thus
, especially causing the venous blood
returning the blood volume toward normal. (2) The
transude out of the capillaries into the tissues, thereby
ately begin to occur: (1) The increased cardiac output
The greatly increased cardiac output
Blood Volume.
Further Compensatory Effects Initiated in Response to Increased
8 mm Hg.
venous return increase 2.5 to 3 times, and that the right
curve at point B, showing that the cardiac output and
right. This new curve equates with the cardiac output
242
Unit IV
The Circulation
atrial pressure rises to about
+
caused by increased blood volume lasts for only a few
minutes because several compensatory effects immedi-
increases the capillary pressure so that fluid begins to
increased pressure in the veins causes the veins to
continue distending gradually by the mechanism called
stress-relaxation
reducing the mean systemic pressure
blood flow through the peripheral tissues causes
thus increasing the resistance to venous return
factors cause the mean systemic filling pressure to
return back toward normal and the resistance vessels of
returns almost to normal.
Effect of Sympathetic Stimulation on Cardiac Output.
Sympa-
thetic stimulation affects both the heart and the sys-
makes the heart a stronger pump.
increases the mean
systemic filling pressure because of contraction of
the peripheral vessels—especially the veins—and it
increases the resistance to venous return.
–
normal cardiac output and
return and cardiac output of 5 L/min and a right atrial
figure that maximal
sympathetic stimulation (green curves) increases the
mean systemic filling pressure to 17 mm Hg (depicted
by the point at which the venous return curve reaches
ulation also increases pumping effectiveness of the
output rises from the normal value at equilibrium point
A to about double normal at equilibrium point D—and
yet
ent degrees of sympathetic stimulation can increase the
cardiac output progressively to about twice normal for
short periods of time
Effect of Sympathetic Inhibition on Cardiac Output.
pathetic nervous system can be blocked by inducing
total spinal anesthesia
hexamethonium
–15 show the effect of sympathetic
strating that (1) the mean systemic filling pressure falls
to about 4 mm Hg and (2) the effectiveness of the heart
as a pump decreases to about 80 per cent of normal
decrease to about 60 per cent of normal.
Effect of Opening a Large Arteriovenous Fistula.
–16
shows various stages of circulatory changes that occur
after opening a large arteriovenous fi
making an opening directly between a large artery and
a large vein.
normal condition.
Psf = 7
Psf = 16
4
0
+4
+8
+12
+16
Cardiac output and venous return (L
/min)
–
0
5
10
15
20
Right atrial pressure (mm Hg)
B
A
systemic filling pressure.
and right atrial pressure shift from point A to point B. Psf, mean
curve to become the dashed curve; as a result, the cardiac output
equal to 20 per cent of the blood volume causes the venous return
curves are normal. Transfusion of blood
venous return
(red line)
and right atrial pressure when the cardiac output
The two solid curves demonstrate an analysis of cardiac output
Figure 20–14
and
(blue line)
4
0
+4
+8
+12
+16
Cardiac output and venous return (L
/min)
–
0
5
10
15
20
25
Right atrial pressure (mm Hg)
B
A
D
C
Maximal sympathetic
stimulation
Moderate sympathetic
stimulation
Spinal anesthesia
Normal
Jones CE, Coleman TB: Circulatory Physiology: Cardiac Output
by total spinal anesthesia (point B). (Redrawn from Guyton AC,
thetic stimulation (from point A to point C), (2) maximal sympa-
Analysis of the effect on cardiac output of (1) moderate sympa-
Figure 20–15
thetic stimulation (point D), and (3) sympathetic inhibition caused
and Its Regulation. 2nd ed. Philadelphia: WB Saunders Co, 1973.)
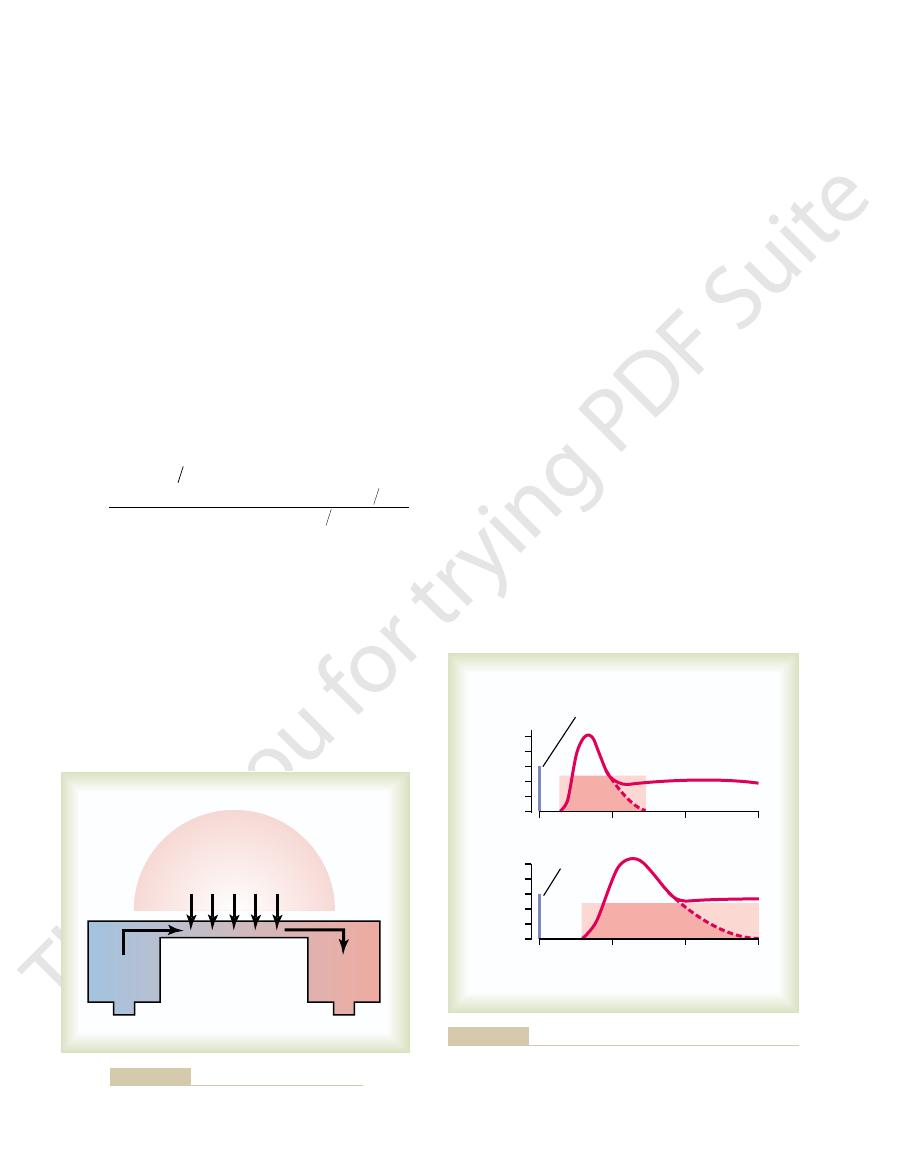
return to zero.
systole reverses for a fraction of a second. This reverse
rapidly to a peak during systole, and then at the end of
owmeter. It demonstrates that the blood
17 shows a recording in a dog of blood
Figure 20
Pulsatile Output of the Heart as
oxygen Fick method
surgery. Two of the methods commonly used are the
In the human, except in rare instances, cardiac output
ter. An electromagnetic or ultrasonic
monary artery, or great veins entering the heart and
In animal experiments, one can cannulate the aorta, pul-
Cardiac Output
presented, and in Chapter 22, analyses of cardiac output
In Chapter 21,
pressure of about 6 mm Hg.
still further. Therefore, point D shows a cardiac
slightly, raising the level of the cardiac output curve
Also, the prolonged increased workload on the
12 mm Hg, shifting the
kidney output of urine. The mean systemic
By this time, the blood volume has increased
4. Point D shows the effect after several more weeks.
pressure to about 4 mm Hg.
rises to almost 16 L/min, and the right atrial
excitation of the heart. The cardiac output now
right, and (2) further elevation of the cardiac
all veins and arteries) from 7 to 9 mm Hg, thus
two other effects: (1) an increase in the mean
exes have restored
3. Point C represents the effects about 1 minute later,
3 mm Hg
from 5 L/min up to 13 L/min
increase in cardiac output
depicted by point B, is an
the heart can pump more easily. The net result,
the cardiac output curve
circulation, and (2) a
arteries into the venous system, bypassing most
. The principal effects are (1) a sudden and
2. The curves crossing at point B show the circulatory
Cardiac Output, Venous Return, and Their Regulation
Chapter 20
243
condition immediately after opening the large
fistula
precipitous rotation of the venous return curve
upward caused by the large decrease in resistance to
venous return when blood is allowed to flow with
almost no impediment directly from the large
of the resistance elements of the peripheral
slight increase in the level of
because opening the fistula
decreases the peripheral resistance and allows
an acute fall in arterial pressure against which
and an increase in
right atrial pressure to about
+
.
after the sympathetic nerve refl
the arterial pressure almost to normal and caused
systemic filling pressure (because of constriction of
shifting the venous return curve 2 mm Hg to the
output curve because of sympathetic nervous
because the slight reduction in arterial pressure and
the sympathetic stimulation have both reduced
filling
pressure has now risen to
+
venous return curve another 3 mm Hg to the right.
heart has caused the heart muscle to hypertrophy
output now of almost 20 L/min and a right atrial
Other Analyses of Cardiac Output Regulation.
analysis of cardiac output regulation during exercise is
regulation at various stages of congestive heart failure
are shown.
Methods for Measuring
measure the cardiac output using any type of flowme-
flowmeter can also
be placed on the aorta or pulmonary artery to measure
cardiac output.
is measured by indirect methods that do not require
and the indicator dilution method.
Measured by an Electromagnetic or
Ultrasonic Flowmeter
–
flow
in the root of the aorta made using an electromagnetic
fl
flow rises
flow causes the aortic valve to close and the flow to
4
0
+4
+8
+12
Cardiac output and venous return (L
/min)
–
0
5
10
15
20
Right atrial pressure (mm Hg)
A
B
C
D
Physiology: Cardiac Output and Its Regulation. 2nd ed. Philadel-
(Redrawn from Guyton AC, Jones CE, Coleman TB: Circulatory
volume has increased and the heart has begun to hypertrophy.
reflexes have become active; and D, several weeks after the blood
opening the AV fistula; C, 1 minute or so after the sympathetic
equilibrium points, are A, normal conditions; B, immediately after
pressure in a human being after a large arteriovenous (AV) fistula
Analysis of successive changes in cardiac output and right atrial
Figure 20–16
is suddenly opened. The stages of the analysis, as shown by the
phia: WB Saunders Co, 1973.)
0
1
2
Seconds
Flow (L/min)
20
15
10
5
0
tromagnetic flowmeter.
Pulsatile blood flow in the root of the aorta recorded using an elec-
Figure 20–17
meter.
oxygen from the respired air, using any type of oxygen
rate of oxygen absorption
artery in the body. The
the right ventricle or pulmonary artery. And
nally, into
clavian vein, down to the right atrium, and,
up the brachial vein of the forearm, through the sub-
mixed venous
cardiac output in the human being,
In applying this Fick procedure for measuring
a measure of the cardiac output. Thus, the cardiac
through the lungs each minute is 5 liters, which is also
oxygen. Therefore, the quantity of blood
the blood from the lungs each minute is 200 milliliters,
per liter of blood. From these data, one can calculate
liters per liter of blood, whereas that leaving the left
each minute. It also shows that the blood entering the
18. This
The Fick principle is explained by Figure 20
Measurement of Cardiac Output Using
244
Unit IV
The Circulation
the Oxygen Fick Principle
–
figure shows that 200 milliliters of oxygen are being
absorbed from the lungs into the pulmonary blood
right heart has an oxygen concentration of 160 milli-
heart has an oxygen concentration of 200 milliliters
that each liter of blood passing through the lungs
absorbs 40 milliliters of oxygen.
Because the total quantity of oxygen absorbed into
dividing 200 by 40 calculates a total of five 1-liter por-
tions of blood that must pass through the pulmonary
circulation each minute to absorb this amount of
flowing
output can be calculated by the following formula:
blood is usually obtained through a catheter inserted
fi
systemic
arterial blood can then be obtained from any systemic
by
the lungs is measured by the rate of disappearance of
Arteriovenous O difference ml L of blood
O absorbed per minute by the lungs ml min
Cardiac output L min
2
2
(
)
=
(
)
(
)
19, this was done by measuring the area under the
of the curve. For instance, in the top example of Figure
been determined, one then calculates the mean con-
curve. In this way, the
zero point, as shown by the dashed portion of each
rise again. For the purpose of calculation, it is necessary
sequently, the dye concentration in the artery began to
and returned through the heart for a second time. Con-
reached zero, some of the dye had already circulated all
concentration fell rapidly, but before the concentration
to a maximum in about 6 to 7 seconds. After that, the
arterial tree until about 3 seconds after the injection, but
In the top recording, none of the dye passed into the
ligrams of Cardio-Green dye was injected at zero time.
19. In each of these instances, 5 mil-
shown in Figure 20
through one of the peripheral arteries, giving a curve as
nally, into the systemic arterial system. The con-
vessels of the lungs, through the left side of the heart
the right side of the heart, then through the blood
ably, into the right atrium. This passes rapidly through
a dye, is injected into a large systemic vein or, prefer-
, such as
To measure cardiac output by the so-called
Indicator Dilution Method for
Measuring Cardiac Output
“indicator
dilution method,” a small amount of indicator
and, fi
centration of the dye is recorded as the dye passes
–
then the arterial concentration of the dye rose rapidly
the way through some of the peripheral systemic vessels
to extrapolate the early down-slope of the curve to the
extrapolated time-concentration
curve of the dye in the systemic artery without recircu-
lation can be measured in its first portion and estimated
reasonably accurately in its latter portion.
Once the extrapolated time-concentration curve has
centration of dye in the arterial blood for the duration
20–
O
2
=
160 ml/L
right heart
O
2
=
200 ml/L
left heart
Oxygen used = 200 ml/min
LUNGS
Cardiac output =
5000 ml/min
Fick principle for determining cardiac output.
Figure 20–18
0
10
20
30
10
20
30
Dye concentration in artery (mg/dl)
0
0.1
0.2
0.3
0.4
0.5
Seconds
0
0.1
0.2
0.3
0.4
0.5
5 mg
injected
5 mg
injected
0
rial blood for the durations of the respective extrapolated curves.)
areas are the calculated average concentrations of dye in the arte-
arate cardiac outputs by the dilution method. (The rectangular
Figure 20–19
Extrapolated dye concentration curves used to calculate two sep-

and diastolic heart failure. Annu Rev Med. 55:373, 2004.
Gaasch WH, Zile MR: Left ventricular diastolic dysfunction
94:849, 2003.
atrial pressure determines venous return. J Appl Physiol
Brengelmann GL: A critical analysis of the view that right
19. To summarize, the cardiac output can be
Figure 20
10 L/min. We leave it to the reader to calculate the
be the same as a cardiac output of 2 L/12 sec, or
through the heart during the 12 seconds, which would
dye through the heart and lungs in 12 seconds, a total
experiment. For blood carrying only 0.25 milligram of
of this average value was 12 seconds. A total of 5 mil-
Cardiac Output, Venous Return, and Their Regulation
Chapter 20
245
entire initial and extrapolated curve and then averaging
the concentration of dye for the duration of the curve;
one can see from the shaded rectangle straddling the
curve in the upper figure that the average concentration
of dye was 0.25 mg/dl of blood and that the duration
ligrams of dye had been injected at the beginning of the
dye in each deciliter to carry the entire 5 milligrams of
of 20 1-deciliter portions of blood would have passed
cardiac output from the bottom extrapolated curve of
–
determined using the following formula:
References
Milligrams of dye injected 60
Cardiac output ml min
Average concentration of dye
in each milliliter of blood
for the duration of the curve
Duration of
the curve
in seconds
(
)
=
¥
Ê
Ë
Á
ˆ
¯
˜ ¥
Ê
Ë
Á
ˆ
¯
˜
nisms in the conscious state. N Engl J Med 293:970, 1975.
Vatner SF, Braunwald E: Cardiovascular control mecha-
Physiol 286:H2376, 2004.
work of circulatory equilibrium. Am J Physiol Heart Circ
Uemura K, Sugimachi M, Kawada T, et al: A novel frame-
9:706-718, 1953.
left ventricular function curves in the dog. Circulation
of the heart, studied by means of simultaneous right and
Sarnoff SJ, Berglund E: Ventricular function. 1. Starling
Physiol Rev 63:1281, 1983.
ex control of veins and vascular capacitance.
Rothe CF: Re
measurement. J Appl Physiol 74:499, 1993.
lling pressure: its meaning and
Rothe CF: Mean circulatory
415:206, 2002.
brane-spanning receptors and heart function. Nature
Rockman HA, Koch WJ, Lefkowitz RJ: Seven-transmem-
naling. Annu Rev Physiol 62:237, 2000.
Koch WJ, Lefkowitz RJ, Rockman HA: Functional conse-
factors on cardiac output. Am J Physiol 180:463-468, 1955.
Guyton AC, Lindsey AW, Kaufmann BN: Effect of mean cir-
Saunders Co, 1973.
Cardiac Output and Its Regulation. Philadelphia: WB
Guyton AC, Jones CE, Coleman TG: Circulatory Physiology:
regulation. Annu Rev Physiol 34:13, 1972.
Guyton AC, Coleman TG, Granger HJ: Circulation: overall
Rev 35:123, 1955.
venous return curves with cardiac response curves. Physiol
Guyton AC: Determination of cardiac output by equating
Wilkins, 1963, p 1099.
book of Physiology. Sec 2, Vol. 2. Baltimore, Williams &
Guyton AC: Venous return. In: Hamilton WF (ed): Hand-
culatory filling pressure and other peripheral circulatory
quences of altering myocardial adrenergic receptor sig-
fi
fl
’s law