
2
Lecture 1 - Introduction
SPSS stands for Statistical Package for the Social Sciences. It was developed in
1968, by three young men from disparate professional backgrounds. Norman H. Nie,
C. Hadlai (Tex) Hull and Dale H. Bent developed SPSS out of the need to quickly
analyze volumes of social science data gathered through various methods of
research.
The initial work was done at Stanford University with the intent to make it only
available locally, and not for international distribution. Nie, a social scientist and
Stanford doctoral candidate, represented the target audience and set the
requirements; Bent, a Stanford University doctoral candidate in operations research,
had the analysis expertise and designed the SPSS system file structure; and Hull,
who had recently graduated from Stanford with a master of business administration
degree, programmed SPSS.
SPSS is a Windows based program that can be used to perform data entry and
analysis and to create tables and graphs. SPSS is capable of handling large
amounts of data and can perform all of the analyses covered in the text and much
more
.
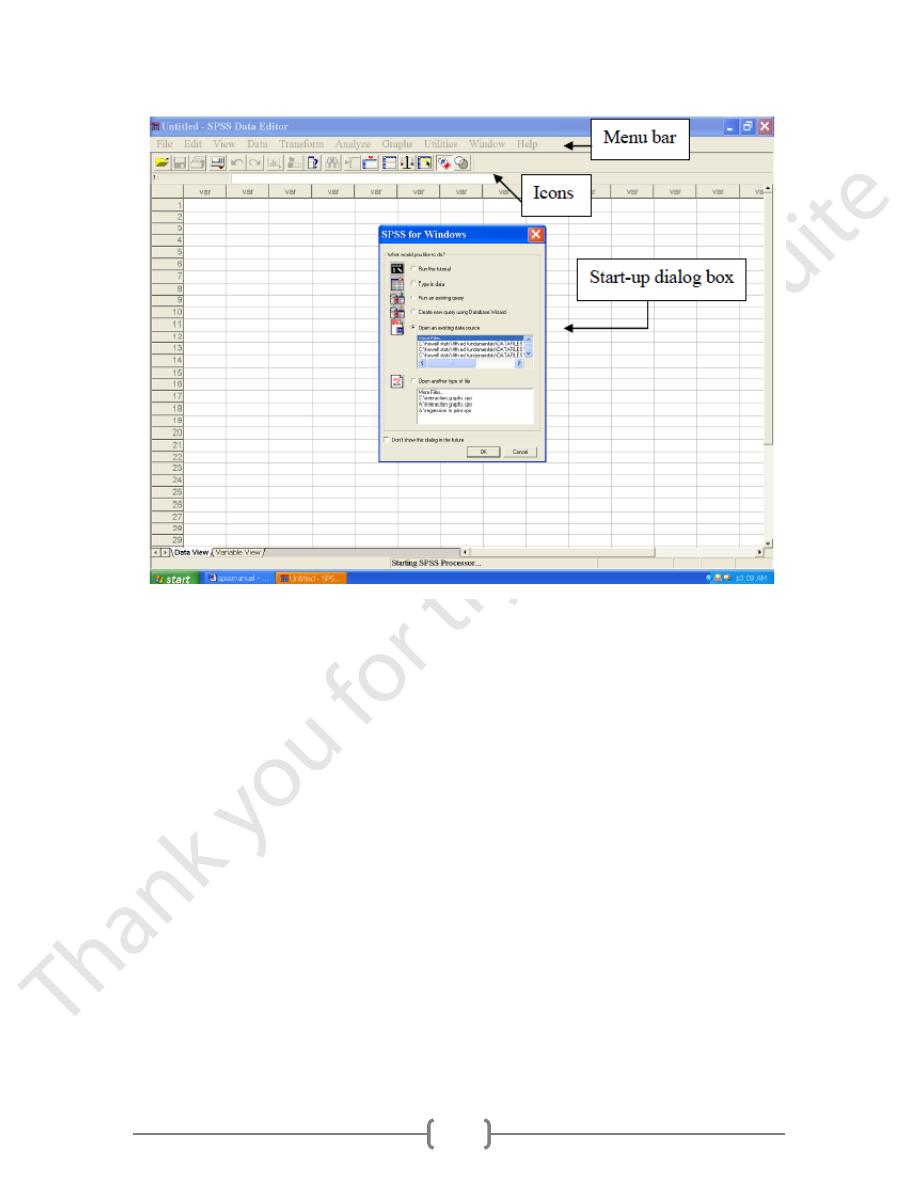
Layout of SPSS
The Data Editor window has two views that can be selected from the lower left hand
side of the screen. Data View is where you see the data you are using. Variable
View is where you can specify the format of your data when you are creating a file or
where you can check the format of a pre-existing file. The data in the Data Editor is
saved in a file with the extension .sav.
3
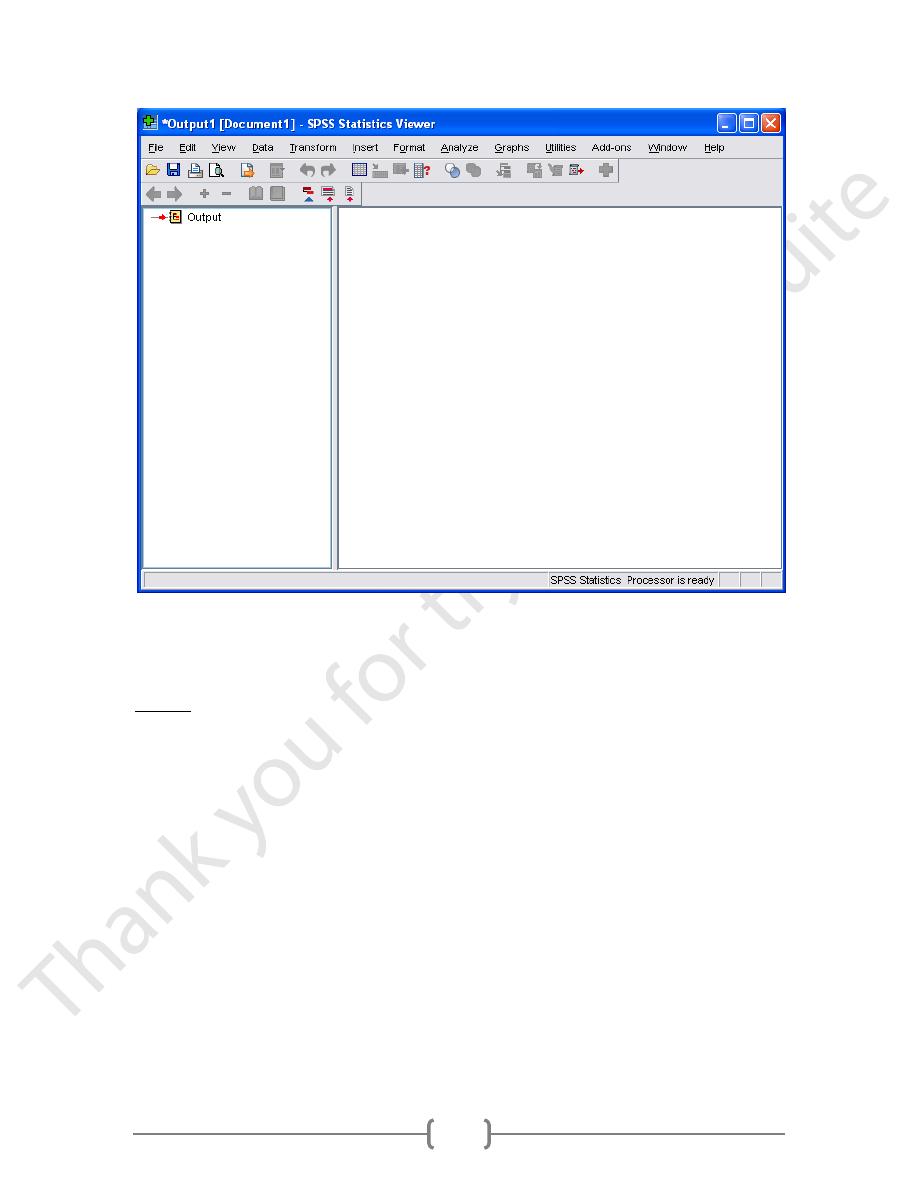
The other most commonly used SPSS window is the SPSS Viewer window which
displays the output from any analyses that have been run and any error messages.
Information from the Output Viewer is saved in a file with the extension .spv.
On the File menu, click New and select Output. The following will appear. The left
hand side is an outline of all of the output in the file. The right side is the actual
output. To shrink or enlarge either side put your cursor on the line that divides them.
4
SPSS Menus and Icons
.
Review the options listed under each menu on the Menu Bar by clicking them one at
a time. Follow along with the below descriptions.
File includes all of the options you typically use in other programs, such as open,
save, exit. Notice, that you can open or create new files of multiple types as
illustrated to the right.
Edit includes the typical cut, copy, and paste commands, and allows you to specify
various options for displaying data and output.
Click on Options, and you will see the dialog box to the left. You can use this to
format the data, output, charts, etc. These choices are rather overwhelming, and you
can simply take the default options for now. The author of your text (me) was too
dumb to even know these options could easily be set.
View allows you to select which toolbars you want to show, select font size, add or
remove the gridlines that separate each piece of data, and to select whether or not
to display your raw data or the data labels.

5
Data allows you to select several options ranging from displaying data that is sorted
by a specific variable to selecting certain cases for subsequent analyses.
Transform includes several options to change current variables. For example, you
can change continuous variables to categorical variables, change scores into rank
scores, add a constant to variables, etc.
Analyze includes all of the commands to carry out statistical analyses and to
calculate descriptive statistics.
Graphs includes the commands to create various types of graphs including box
plots, histograms, line graphs, and bar charts.
Utilities allows you to list file information which is a list of all variables, there labels,
values, locations in the data file, and type.
Add-ons are programs that can be added to the base SPSS package. You probably
do not have access to any of those.
Window can be used to select which window you want to view (i.e., Data Editor,
Output Viewer, or Syntax). Since we have a data file and an outp
ut file open, let’s try
this.
Select Window/Data Editor. Then select Window/SPSS Viewer.
Help has many useful options including a link to the SPSS homepage, a statistics
coach, and a syntax guide. Using topics, you can use the index option to type in any
key word and get a list of options, or you can view the categories and subcategories
available under contents. This is an excellent tool and can be used to troubleshoot
most problems.
The Icons directly under the Menu bar provide shortcuts to many common
commands that are available in specific menus. Take a moment to review these as
well.
Place your cursor over the Icons for a few seconds, and a description of the
underlying command will appear. For example, this icon is the shortcut for Save.
Review the others yourself.
The Logic of Data Files
Each row typically represents the data from 1 case, whether that be a person,
animal, or object. Each column represents a different variable. A cell refers to the
juncture of a specific row and column. For example, the first empty cell in the right
hand corner would include the data for case 1, variable 1.
Entering Data
.
To enter data, you could simply begin typing information into each cell. If you did so,
SPSS would give each column a generic label such as var00001. Clearly this is not
desirable, unless you have a superior memory, because you would have no way of
6
identifying what var00001 meant later on. Instead, we want to specify names for our
variables. To do this, you can double left click on any column head, this will
automatically take you to the Variable View. Alternatively, you can simply click on
Variable View on the bottom left hand corner of your screen.
The first column of variable view is Name. In earlier versions names could only be 8
characters long. Although that restriction no longer applies, you should keep names
short for ease of reading. For example, if I had depression data that was collected at
intake, and 1 month, 6 months, and 1 year post intervention, I would name those
variables depress0 or depresin (i.e., in for intake), depress1, depress6, and
depres12. SPSS also has preferences for variable names. For example, a number
cannot begin a variable name (e.g., 12depres would not be a valid name). Error
messages will appear if you have selected a name that is not allowed in SPSS.
Next, you can select the Type of variable. Left click on the empty cell, then left click
on the gray box with dots that appears. The dialog box to the right appears. The
most commonly used types of data include numeric, date, and string. For numeric
data, width and decimal places refer to the number of characters and decimal places
that will be displayed in the Data Editor window. If you entered a value with 3
decimal places, SPSS would save that value, but would only display the value to 2
decimal places.
String variables are those that consist of text. For example, you could type Male and
Female if gender were a variable of interest. It is important to note that SPSS is case
sensitive meaning that “female” and “Female” would not be viewed as the same
category. Misspellings are also problematic with string data (e.g., “femal” would not
be recognized as the intended “female”). For these reasons, it is advantageous to
use numbers to represent common categories, and then supply names for those
levels as discussed below.
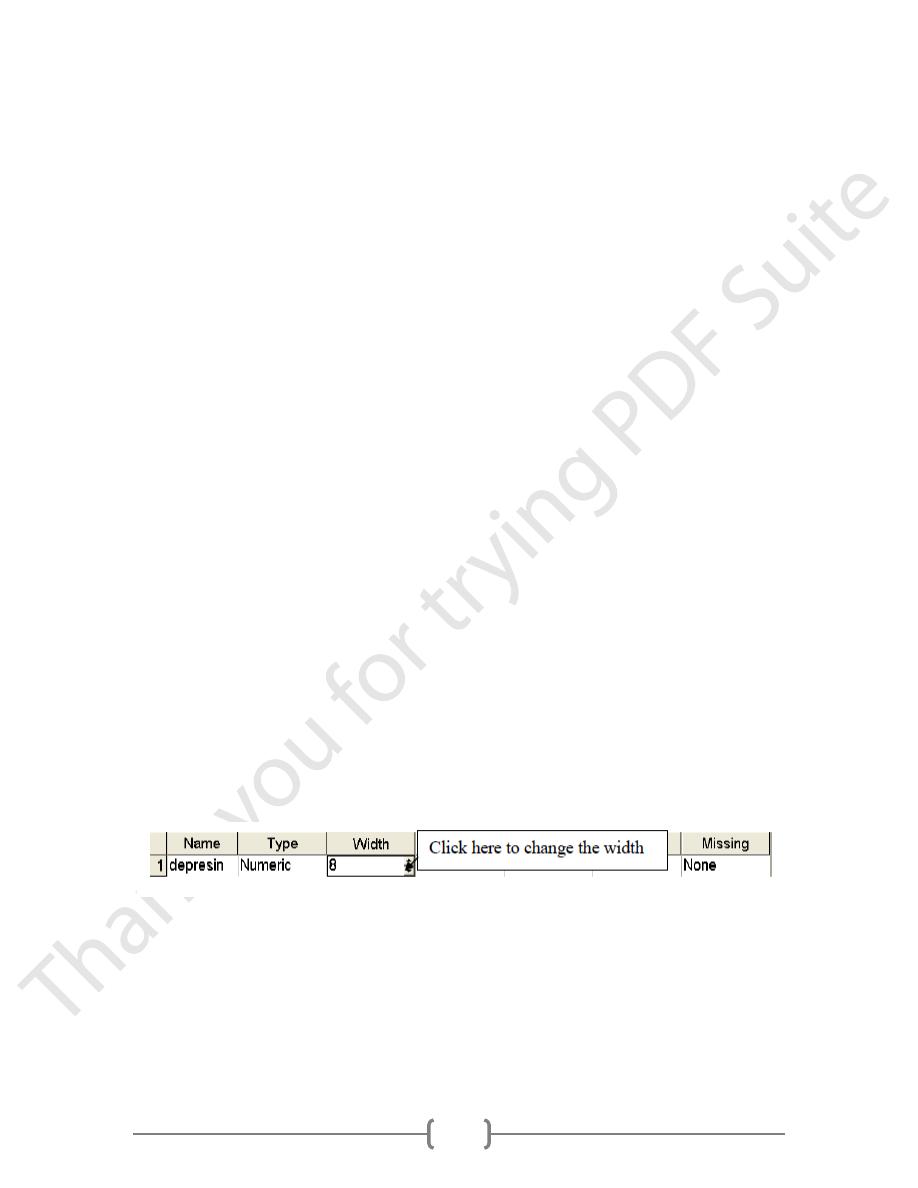
The next columns are for Width and Decimals. You could have set this while
specifying your variable type, or you can specify them in these columns. The default
for width is 8 characters and the default for decimals is 2. To change this, left click
the cell, and up and down arrows will appear, as illustrated below. Left click the up
arrow if you want to increase the number, click the down arrow to decrease the
value. Alternatively, you can simply type the desired value in the cell.
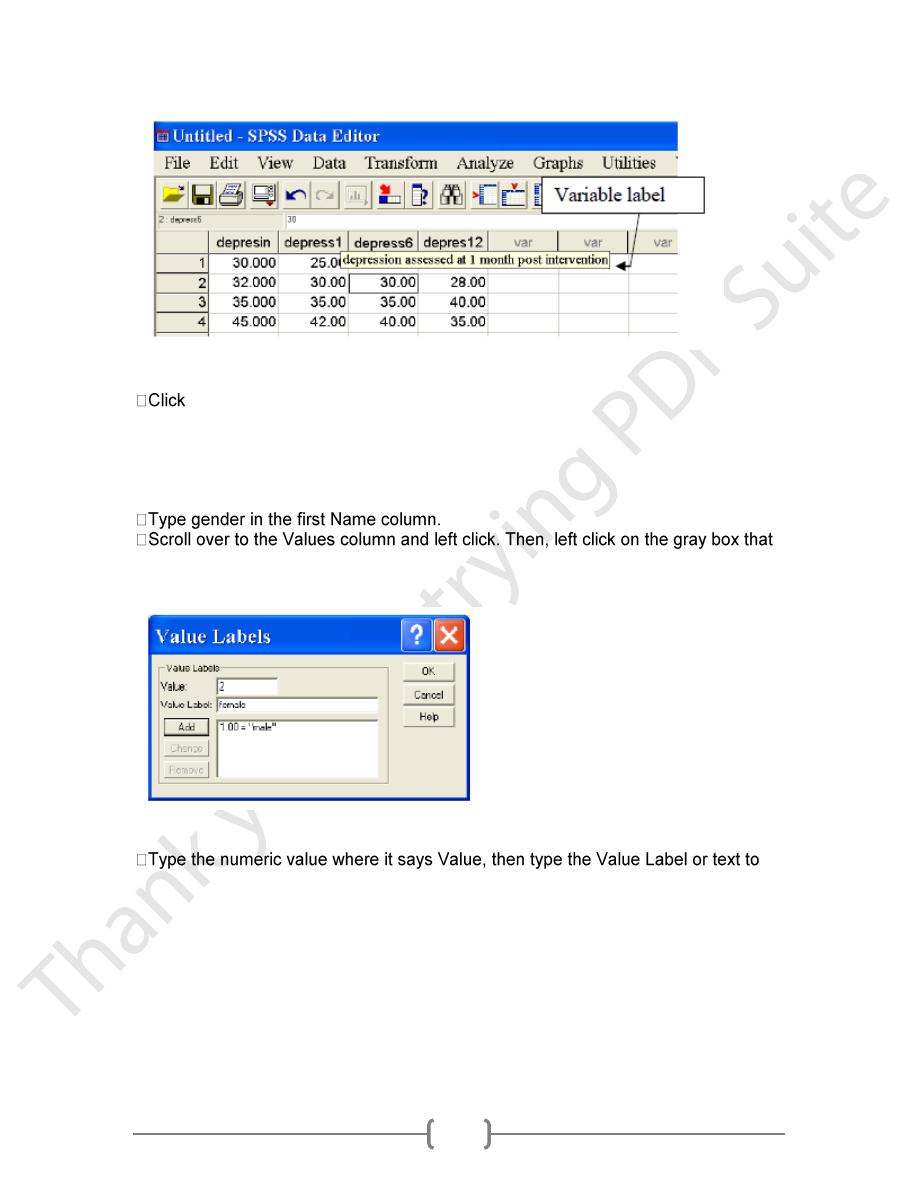
The next column is Label. This is a very nice feature that allows you to provide more
information about the variable than you could fit in the 8 character variable name.
For example, I could type “Depression assessed at intake” for the example used
above. When you hold your cursor over a variable name in the Data View, the full
label will appear. This is very useful when you need a quick reminder. An example of
this feature is below.
7
Since labels are so much more detailed than variable names, we can specify that
SPSS label variables this way in dialog boxes and output. Let’s do this.
Edit/Options/Output Labels and select “labels” for each of the options. Then
click Ok.
The next column is Values. This allows you to assign variable labels. You will
typically use this option for categorical variables. For example, we may want the
number 1 to represent males and the number 2 to represent females when we enter
data on gender. Let’s try this.
appears on the right hand side of the cell. The Value Labels dialog box will appear.
Variable label
explain what it means. Click Add. Do this for males and females. When you are
done, click Ok.

8
Of the remaining columns, you are most likely to use Align, which allows you to
specify how the data will appear in the cells. Your choices are left justified, right
justified, or centered. This is simply a matter of personal preference.
After you have completed specifying your variables, you can click on Data View and
begin entering your data. Put your cursor on the cell in which you want to enter data.
Type the value. If you hit Enter the cursor will move to the cell under the one you just
filled. You can also use the arrow keys to move to the next cell in any given
direction. Typically, you will either enter all of the values in one column by going
down or you will enter all of the variables in a row going from left to right.
Inserting a Variable
After specifying the types of variables for the depression data, I realized I forgot to
include a column for ID number. Typically, I like ID to be the first variable in my data
file. I can add this in one of two ways.
1. In Variable View, highlight the first row and then click Insert Variable on the Data
menu. This will place a new variable before the selected variable.
2. In Data View, highlight the first variable column and then click the Insert Variable
icon . This will also place a new variable column at the beginning of the file.
Inserting a Case
As you can see, the data for ID 10 is missing. I found the missing data and want to
enter it in the file. I’d like my data to be in order by ID number, so I want to insert a
case between the person with ID 9 and ID 11. To do so, I can highlight the row for
the case with ID 11, and either:
1. click on Insert Case on the Data menu or
2. click on the Insert Case icon . In either case, a blank row will appear before the
highlighted case. Try it yourself.