
1
Babylon University
College of Medicine
Department of physiology
Dr. Ghafil Saihood Hassan 2016 – 2017.
5- Normal electrocardiogram
Objective:
1-Draw an ECG classical waveform and label each component (P wave, QRS
complex wave, and T wave).
2-Draw normal ECG of 12 leads standard unipolar (aVR, aVL, aVF) and
bipolar limb leads (L
1,
L
2,
L
3
) and unipolar chest leads(C
1, …….
C
6
).
3-State the direction of cardiac vector.
4- Normal cardiac vector.
5- How draw cardiac vector from bipolar limb leads.
6-How find HR from regular ECG and irregular ECG.
The electrocardiogram:
Because the body fluid is good conductors, algebraic sum of the action
potentials of myocardial fibers can be recorded externally. The record of this
potential fluctuation during cardiac cycle is called electrocardiogram (ECG).
Most electrocardiograph machines record these fluctuations on moving strip of
paper. The names of these waves and segments are:
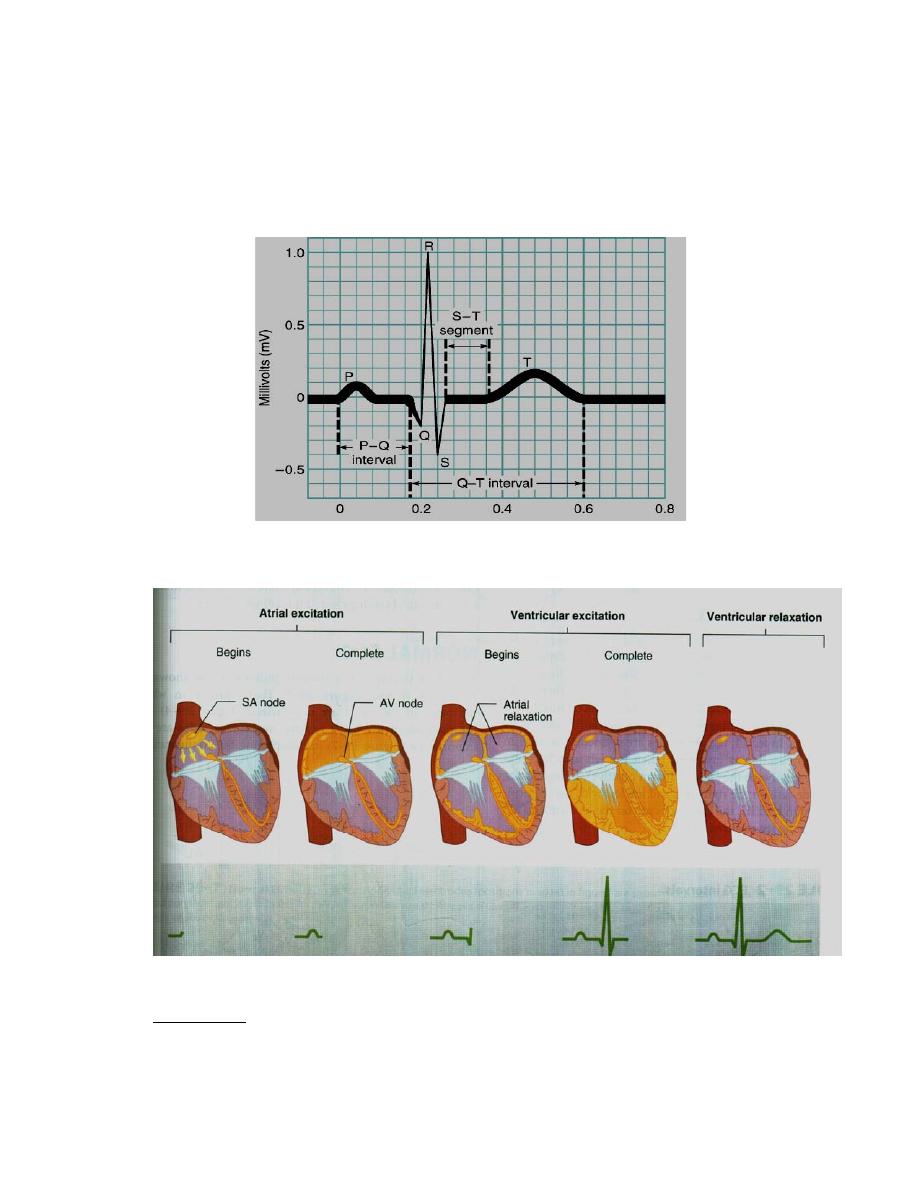
1- P wave represents atrial depolarization. Atrial repolarization is buried in
QRS complex, because it is too slow and diffuse to register. It is about 0.07 –
0.14 seconds and not more than 3 mm.
2- PR segment is due to the delay in conduction through AV node. It is
isoelectric because insulating fibrosis prevents the electrical circuit and no
current flow.
3-PR interval is measured from the beginning of the P wave to the beginning
of the QRS complex. This interval corresponds to the time taken for the impulse
to travel from the sinus node to the ventricular muscle. It ranges normally
between 0.12- 0.21 seconds.
4- QRS complex represents depolarization of the ventricles. The duration is
about 0.06 – 0.10 seconds. Abnormal wide QRS indicate bundle branch block.
5- ST segment is the segment from end of the S wave to the beginning of the T
wave. It is isoelectric, which coincides with the plateau of ventricular action
potential.
6- T wave represents ventricular repolarization. It is positive because
repolarization occurs in reverse sequence to depolarization, producing the
upright T wave. The duration is about 0.25 -0.35 seconds and not taller than 10
mm in chest leads.
7- QT interval represents the total time from the onset of ventricular
depolarization to the completion of repolarization. It indicates the duration of
2
ventricular systole i.e. contraction of the ventricle lasts from the beginning of
the Q wave to the end of the T wave. Normally it is about 0.35 seconds; range
0.28 – 0.44 seconds.
8- U wave is not constant finding, due to slow repolarization of papillary
muscle. Figure (18).
Figure (18): Normal waves of ECG (Ganong's review of medical physiology
2016).
Figure (19): Atrial and ventricular excitation and relaxation.
ECG leads: The electrocardiograph is a modified galvanometer that measures
the difference in action potential between two points.
1- Bipolar limb leads:
3
They record the difference between two limbs.
Lead I; between right arm and left arm.
Lead II; between right arm and left leg.
Lead III; between left arm and left leg.
Einthoven stated that Lead II = Lead I + Lead III. This is called Einthoven's
law. Lead II has upright positive deflection.
2- Unipolar limb leads:
They measure the action potential difference between that point and zero.
They are VR (right arm), VL (left arm) and VF (left foot). Augmented limb
leads designated by the letter (a) (aVR, aVL, aVF) are generally used. In the
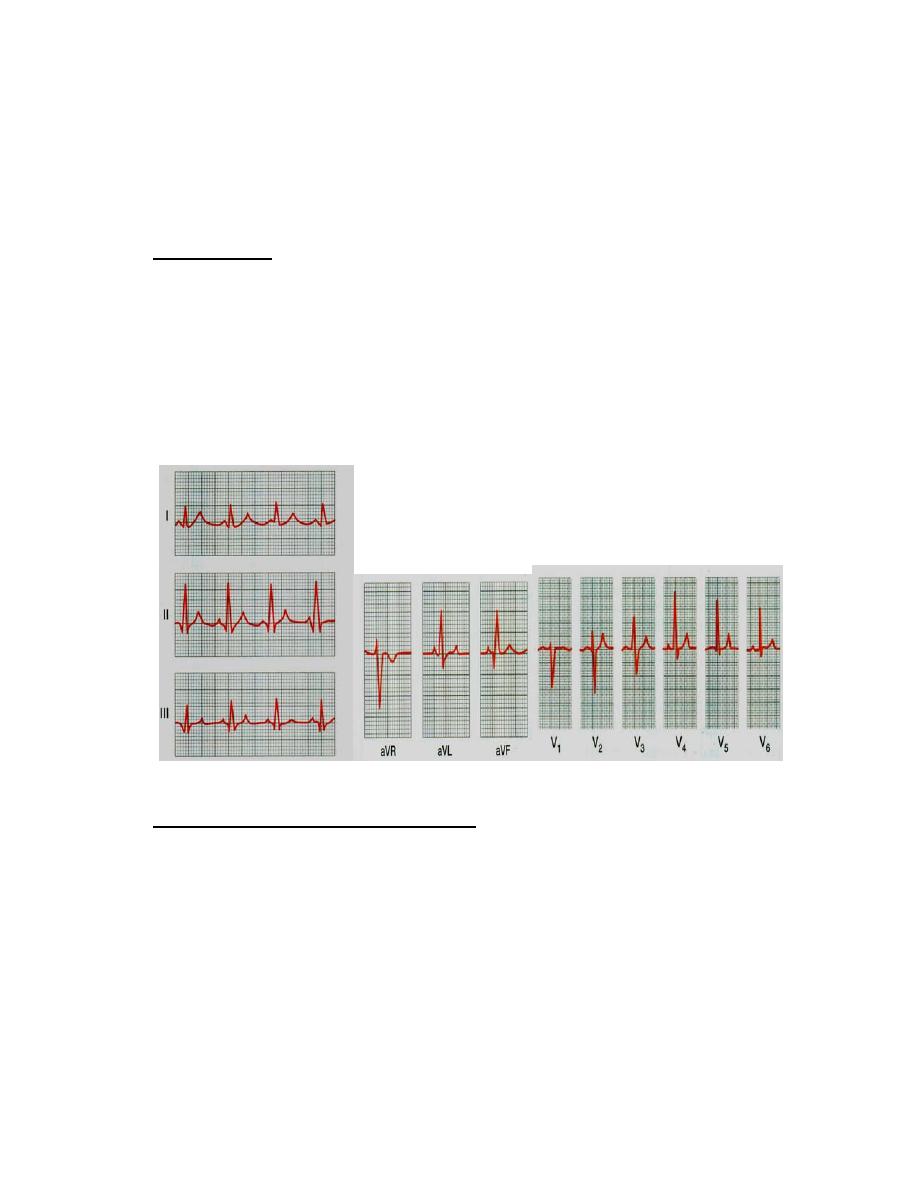
aVR The P wave, QRS complex wave and T wave are all negative (downward)
deflection. In the aVL and AVF deflections are positive.
3- Unipolar chest leads:
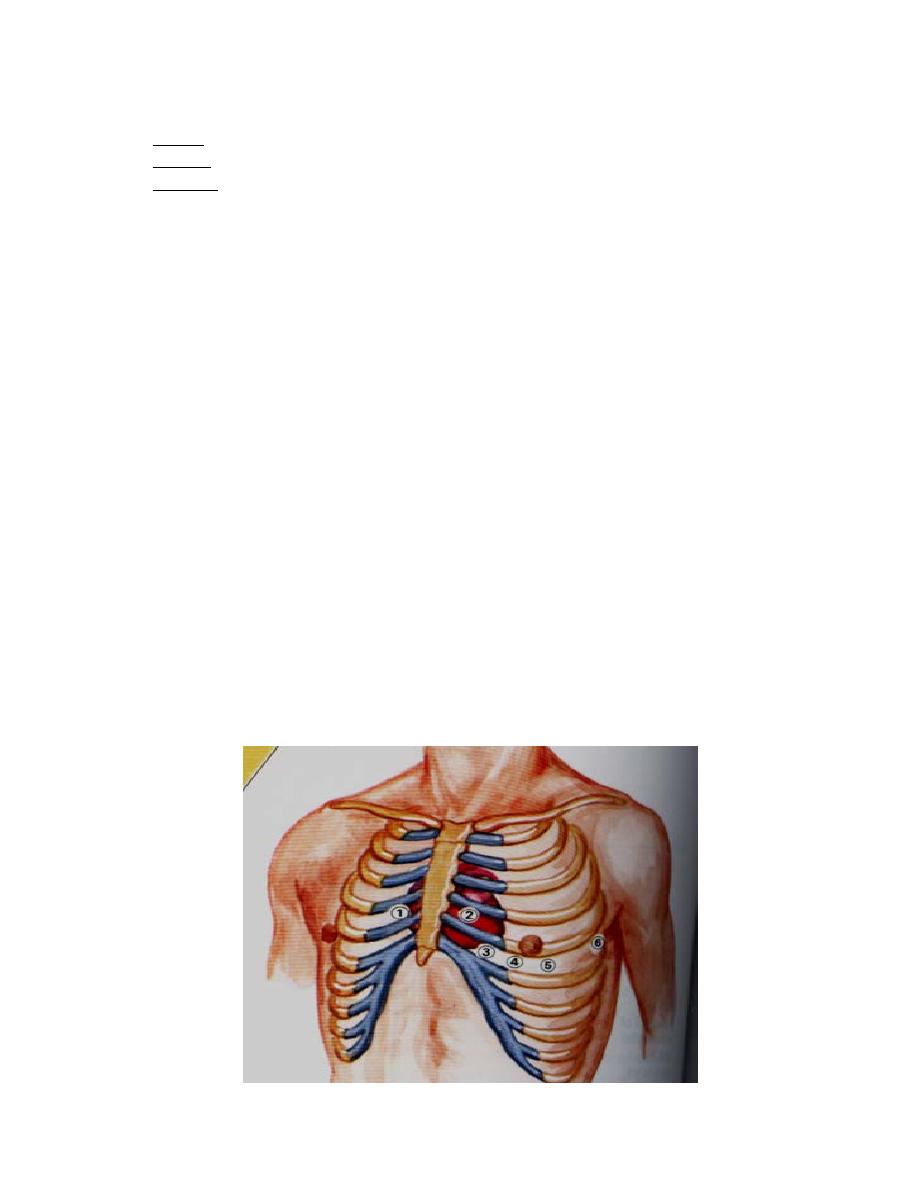
There are 6 uipolar chest leads, designated V1 to V6. The positions of these
leads are illustrated in figure 20. Unipolar precordial or chest leads record the
absolute potential at 6 standard points on the anterior chest wall designated as
V1 to V6, the locations of which are as follows:
V1: At the right margin of the sternum in the 4th right intercostal space.
V2: At the left margin of the sternum in the 4th left intercostal space.
V3: Midway between V2 and V4.
V4: At the left midclavicular line in the 5th intercostal space.
V5: At the left anterior axillary line in the 5th intercostal space.
V6: At the left midaxillary line in the 5th intercostal space.
The precordial leads look at the heart in a horizontal plane from the front & left
sides. Leads V1 & V2 look at the right ventricle and reflect its activity, V3 &
V4 look at the interventricular septum and reflect its activity, while leads V5 &
V6 look at the left ventricle and reflect its activity.
4
Figure (20): Position of unipolar chest leads (Fox, 2006).
Connections of the electrocardiograph:
By specific electrodes, the electrocardiograph is connected to the 4 limbs and
the chest at the same time. The right leg connection is used to "earth" the
subject (to minimize interference currents).
Normal ECG:
There are no Q waves in V1 and V2 and the initial potential of QRS complex is
small upward deflection because ventricular depolarization first move across
the midportion of septum from left to right toward the exploring electrode. The
wave of excitation then moves down the septum and into the left ventricle away
from electrode, producing a large S wave, finally it moves back along the
ventricular wall toward the electrode, producing the isoelectric line. In the left
ventricular leads V4-V6, there are an initial small Q wave, large R wave (septal
in V4 and V5. to left ventricle depolarization), and moderate S wave.
Figure (21): Normal ECG.
Calibration of the electrocardiograph:
The electrocardiograph is calibrated so that a change of 1 mV upward or
downward produces a deflection of 10 mm amplitude (10 small squares; 2 large
squares). The horizontal lines are time calibration in which duration of each mm
(Small Square) equals 0.04 second. Each large square (5 small squares)
represents 0.2 second.
Speed:
The standard speed is 25 mm/sec. The importance of another speed (50
mm/sec) is in case of tachycardia (e.g. HR of 180 beat/min), to obtain a proper
ECG.
Sensitivity:
5
The higher the sensitivity of the instrument, the more the deflection and vise
versa. The standard sensitivity is 10 mm/mV (2 large squares), in cardiomegaly
you must reduce the sensitivity.
Cardiac vector:
The cardiac vector is the net result of the directions of the spread of
depolarization waves from the SA node to the base of the heart
Bipolar limb leads and cardiac vector:
Because the standard limb leads are records the potential difference between
two points, the deflection in each lead indicates magnitude of direction in the
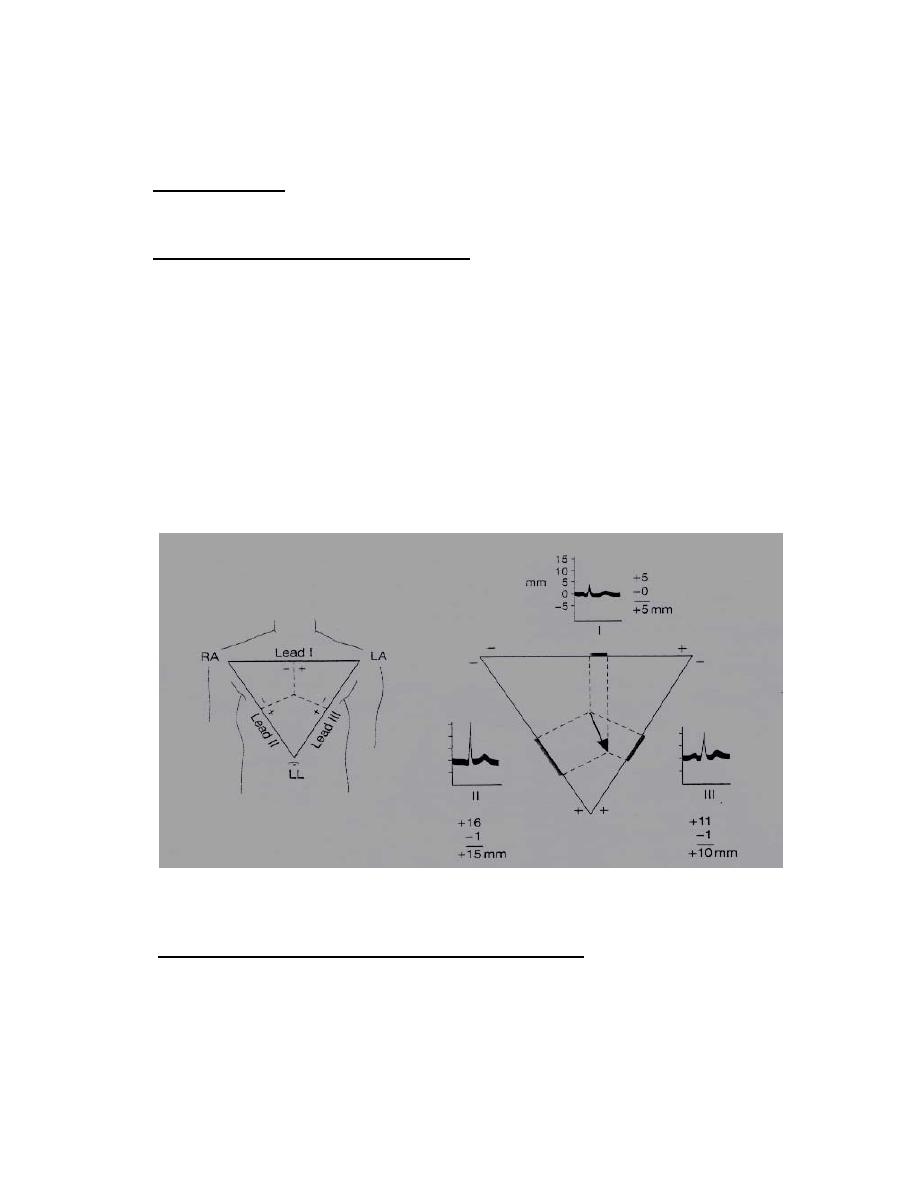
axis of the lead of electromotive force generated in the heart. Cardiac vector can
be calculated from standard limb leads. If it is assumed that the three electrodes
location from the points of an equilateral triangle (Einthoven's triangle), and
that the heart lies in the center of triangle. Mean QRS vector (electrical axis of
the heart) is plotted by using the average QRS deflection in each lead. The
average QRS deflection should be measured by integrating the QRS complex,
measuring the net differences between the positive and negative peak of QRS.
Calculate the mean QRS of lead I, II, and III. Draw perpendicular lines from the
potential L I, II, III. Figure (22).
Figure (22): Cardiac vector .and Enthoven's triangle (Ganong's review for
medical physiology, 2016).
Normal and cardiac vector ( or axis) and deviation :
The normal direction of mean QRS is generally (- 30° to +110°). Left to (– 30
degrees) is called left axis deviation, right to (+ 110 degrees) is called right axis
deviation.
Right axis deviation suggests right ventricular hypertrophy, and left axis
deviation may be due to left ventricular hypertrophy, see figure (23).
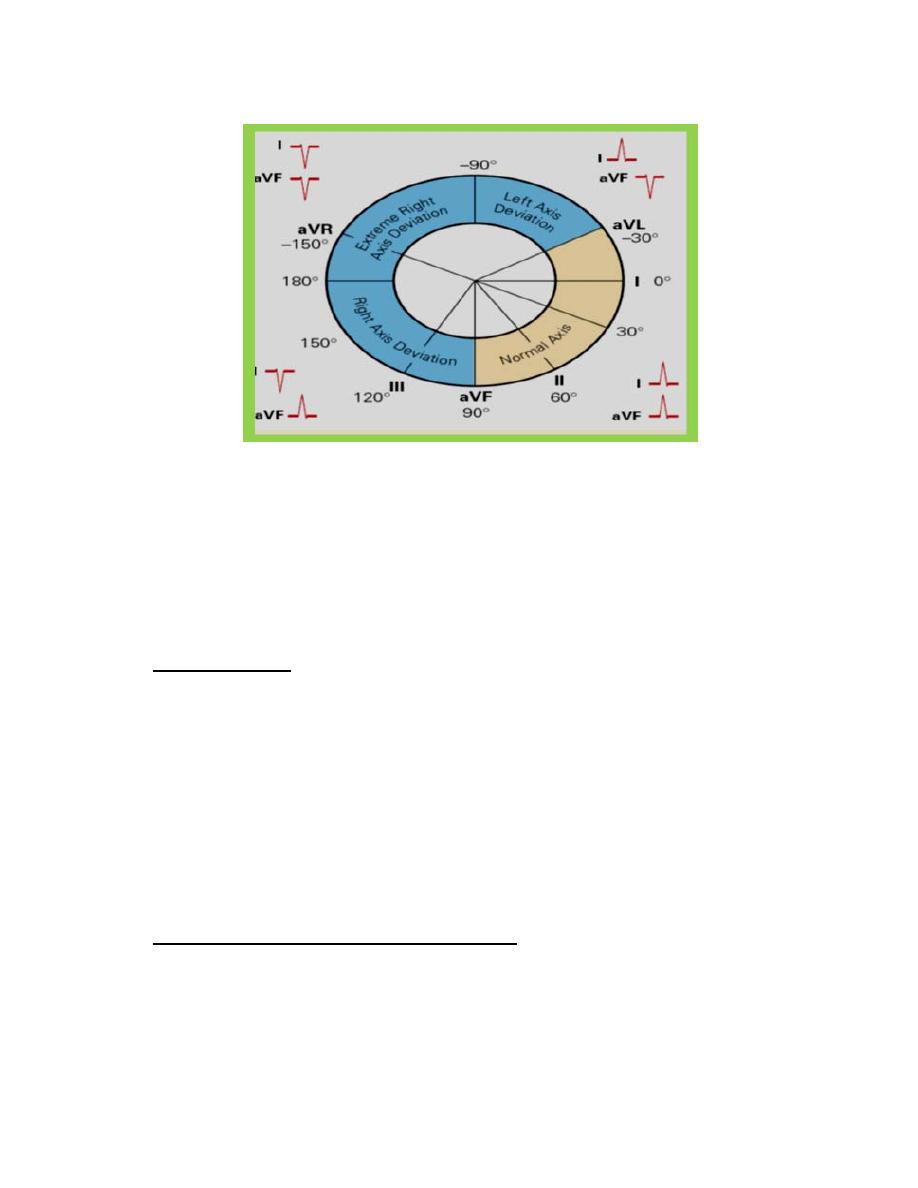
6
Figure (23): normal cardiac axis and left and right axis deviation.
The physiological conditions change vectors of heart are:
I- Expiration shift the vector to left, inspiration shift it to the right.
2-Supine position of body shifts it to left.
3- Fatty body shift to left, while non-fatty body shifts it to right.
Electrical axis of the ventricular QRS:
By the bipolar limb leads (I, II, III), the cardiac vector or axis can be calculated.
As shown in figure 22.
Axis deviation:
Axis deviation occurs if the electric axis of the heart is right or to the left the
normal range. QRS axis further right that of +110 constitutes Right axis
deviation (RAD), QRS axis left that of –30 constitutes Left axis deviation
(LAD).
Right axis deviation
This normally occurs in vertical heart (tall slender subjects), but pathologically,
it is common in right ventricular hypertrophy and right bundle branch block.
Left axis deviation
This normally occurs in horizontal hearts (short obese subjects and pregnant
women) but pathologically, it is common in left ventricular hypertrophy and left
bundle branch block.
Calculation of heart rate from ECG paper:
If the heart rhythm is regular, the heart rate (HR) ran be counted by dividing the
number of large squares between two consecutive R waves into 300 or small
squares into 1500. If the rhythm is irregular, one can multiply the number of
complexes in 6 seconds by 10.

7
