1
Babylon University
College of Medicine
Department of physiology
Dr. Ghafil Saihood Hassan 2016 – 2017.
6- Cardiac Arrhythmia
Objectives:
1-List the types of arrhythmias.
2-Identify on ECG: ectopic beats, atrial & ventricular fibrillation, and heart
block
The causes of the cardiac arrhythmias are usually one or a combination of
the following abnormalities in the rhythmicity-conduction system of the heart:
1- Abnormal rhythmicity of the pacemaker.
2- Shift of the pacemaker from the sinus node to other parts of the heart.
3- Blocks at different points in the transmission of the impulse through the
heart.
4- Abnormal pathways of impulse transmission through the heart.
5- Spontaneous generation of abnormal impulses in almost any part of the heart.
Types of arrhythmias
1- Abnormal sinus rhythms.
2- Conduction heart block.
3- Premature Contractions.
4- Paroxysmal tachycardia.
1-Abnormal sinus rhythms:
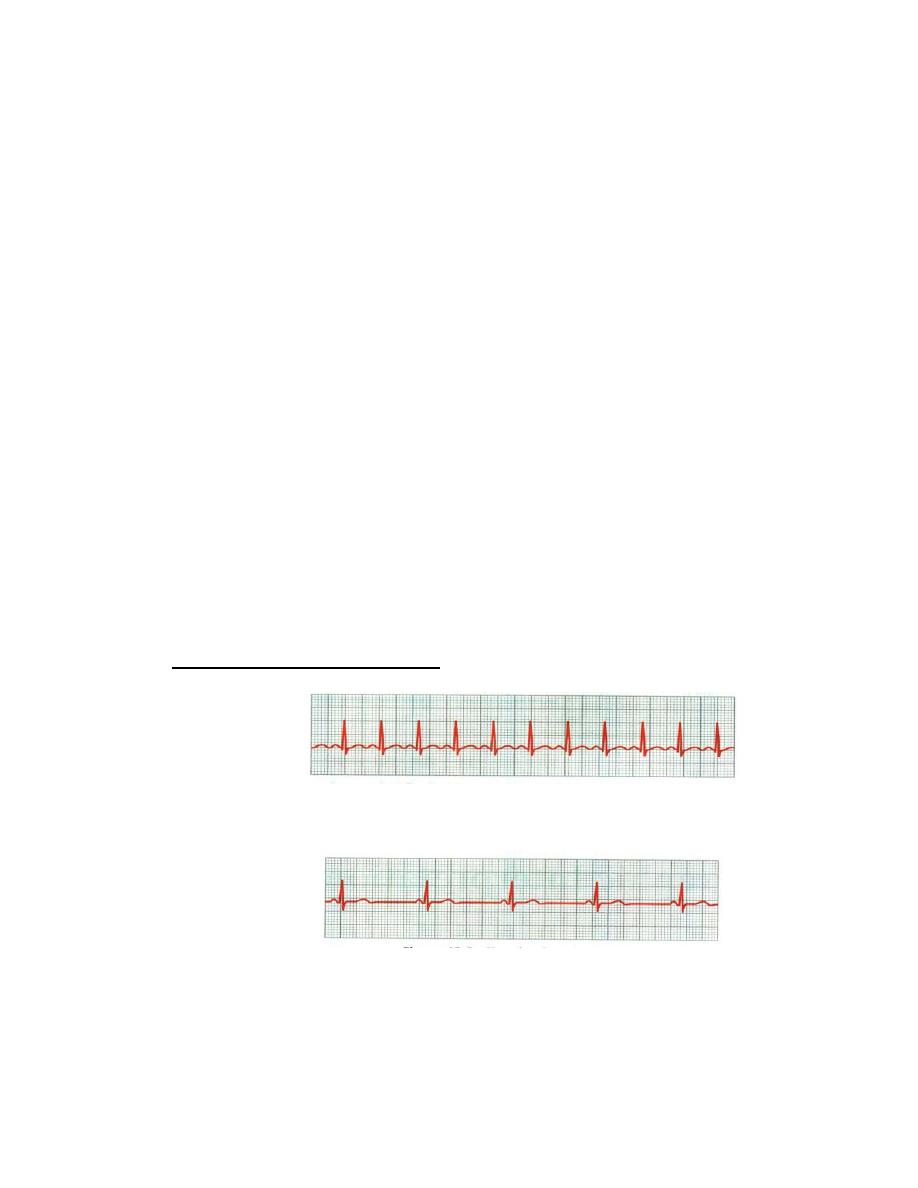
A- Sinus tachycardia. See figure 24.
Figure 24: Sinus tachycardia (Hall, 2016).
B- Sinus bradycardia. See figure 25.
Figure (25): Sinus bradycardia (Hall, 2016)
C- Variation in breathing cycle.
The heart rate is increased during inspiration and decreased during expiration.
The ECG is normal except that the number of the cycles varies with the two
phases of respiration. See figure (26).
2
Figure (26): Sinus arrhythmia.
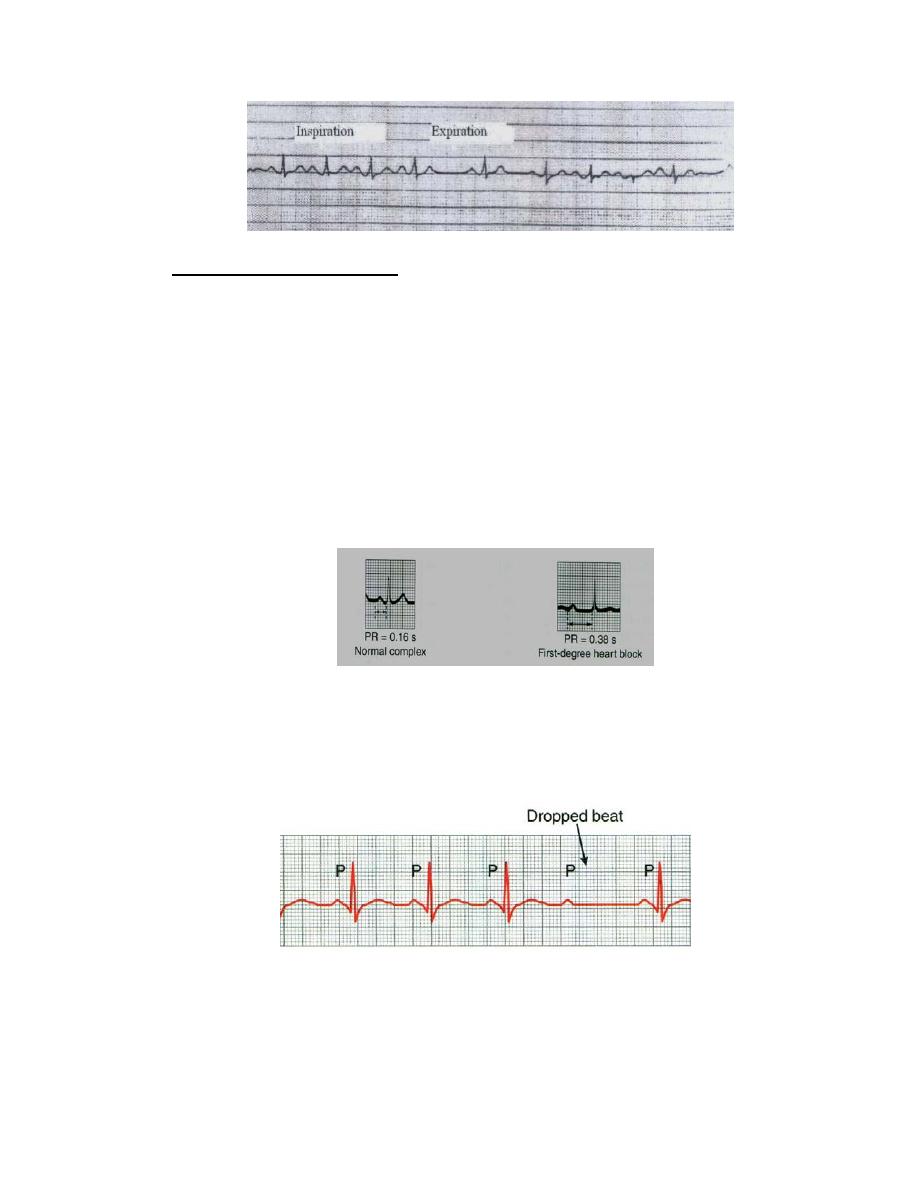
2- Conduction Heart block:
It is caused by abnormality of impulse conduction in the AV node. The causes
of block are:
1- Ischemia of the A-V node by coronary insufficiency.
2- Compression of the A-V node by scar tissue or by calcification.
3- Inflammation of the A-V node, such as occur in rheumatic fever.
4- Extreme stimulation of the heart by the vagus nerves.
There are three types:
A- First degree: Prolonged P-R interval, The normal time between the
beginning of the P wave and the beginning of the QRS complex is 0.12 –
0.21 second. When the P-R interval increases above 0.21 second, the P-R
interval is said to be prolonged and the patient is said to have first degree
incomplete heart block. See figure 27.
Figure 27: First degree of heart block.
B-Second degree: there are dropped beats of the ventricles. This
condition is called second degree incomplete heart block, one dropped
beat as a result of failure of conduction from the atria to the ventricles.
See figure 28.
Figure (28): Second degree of heart block.
C-Third degree (Complete heart block): Conduction from the atria to the
ventricle is completely interrupted. Ventricular beats are independently of
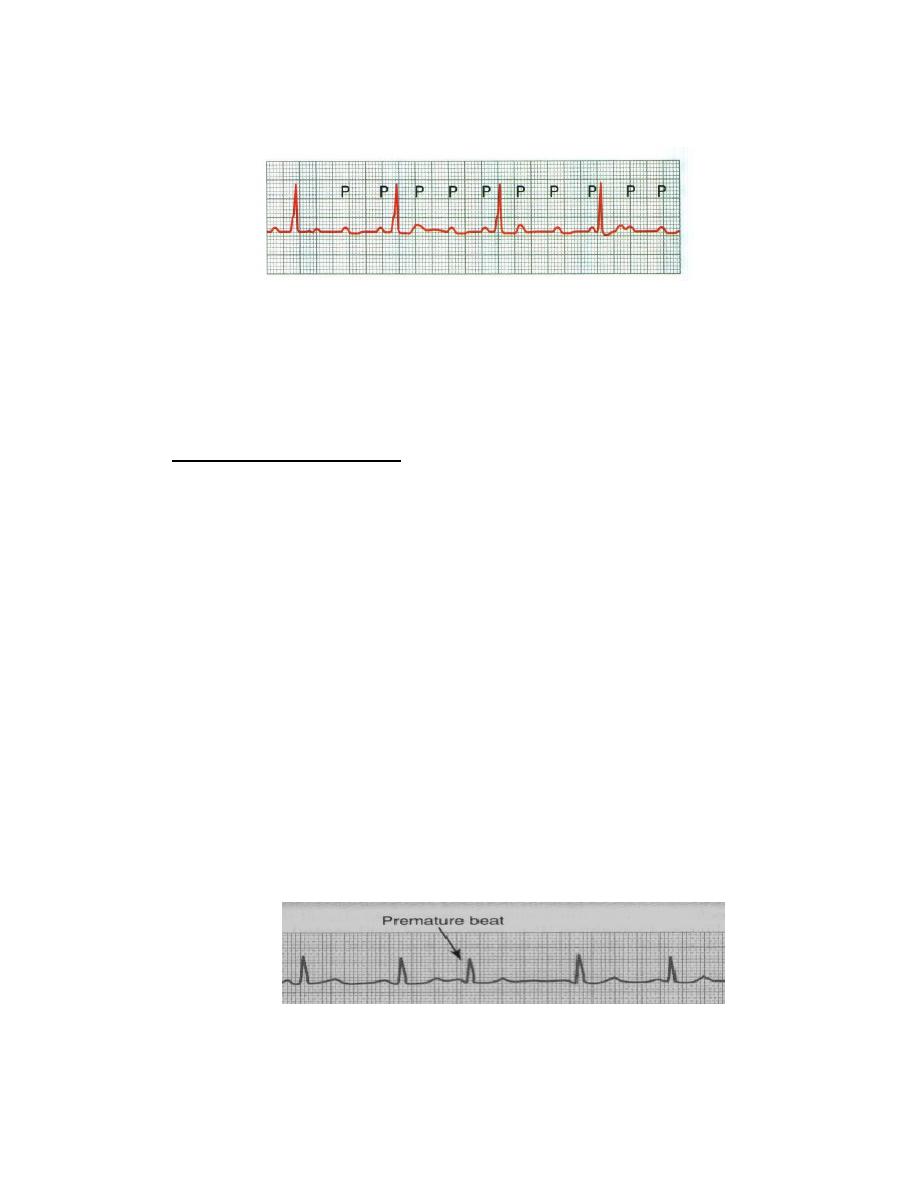
3
the atrial beats. Ventricular rhythm is approximately 40 – 60 beats/ minute.
It is associated with bradycardia. See figure (29).
Figure (29): Third degree of heart block (Hall, 2016).
In some patients with A-V block, suddenly no impulses are conducted from the
atria into ventricles for a period of time. The ventricles usually stop for 5 to 30
seconds. Because brain can not remain active for more than 4 to 5 seconds
without blood supply, most patients faint a few seconds after complete block
occurs. This period of fainting is known as the Stokes-Adams syndrome.
3-Premature Contractions:
A premature contraction is a contraction of the heart before the time that normal
contraction would have been expected. This condition is also called
extrasystole, premature beat, or ectopic beat. Most premature contractions result
from ectopic foci in the heart, The possible causes:
Local areas of ischemia.
Small calcified plaques at different points in the heart.
Toxic irritation of the A-V node, Purkinje system, or myocardium caused
by drugs, nicotine, or caffeine. Mechanical initiation during cardiac
catheterization.
Premature Atrial Contractions
The P-wave of this beat occurs too soon in the heart cycle, and the P-R interval
is shortened, Also, the interval between the premature contraction and the next
succeeding contraction is slightly prolonged, which is called a compensatory
pause. Premature atrial contractions occur:
In healthy people.
In athletes.
Mild toxic conditions resulting from; excess smoking, lack of sleep,
ingestion of too much coffee, alcoholism, and the use of various drugs.
Figure 30.
Figure (30): Atrial premature beat.
Premature Ventricular Contractions
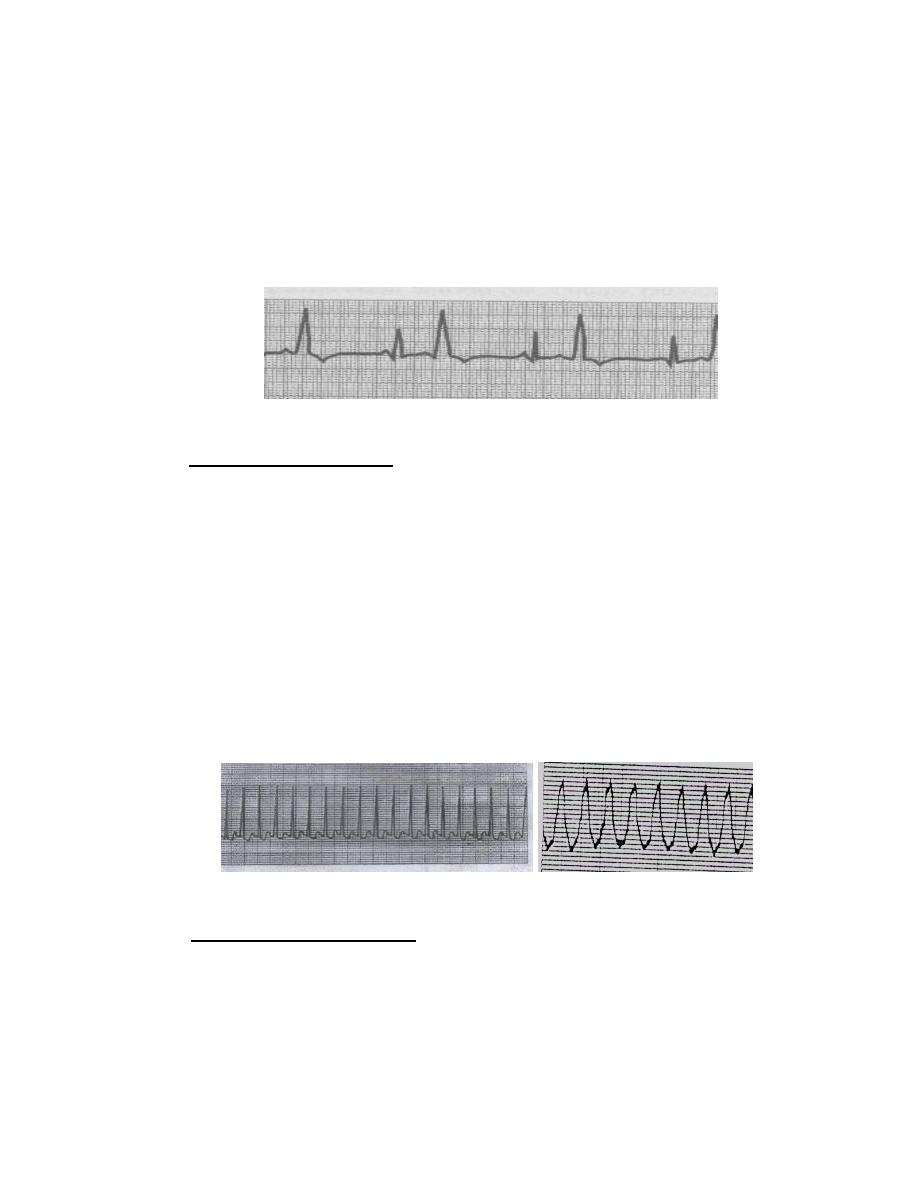
4
Premature ventricular contractions (PVCs) cause specific effects in the elec-
trocardiogram,
The QRS complex is usually prolonged.
The QRS complex has a high voltage.
The T wave has a potential polarity opposite to that of the QRS complex.
Some PVCs result from factors such as cigarettes, coffee, lack of sleep, and
emotional irritability. Other PVCs originate from infracted or ischemic areas of
the heart. Figure 31.
Figure (31): Ventricular ectopic beats,
4-Paroxysmal tachycardia:
The term "paroxysmal" means that the heart rate usually becomes rapid in
paroxysms, beginning suddenly and lasting for a few seconds, a few minutes, a
few hours, or much longer. Then the paroxysms usually end suddenly as they
begun. This phenomenon could be explained according to Reentry phenomenon
in that the impulse passes in one direction to excite the cardiac muscle fibers,
but if the impulse returns high up, it excites the cardiac muscle fibers again.
A-Supra ventricular paroxysmal tachycardia: There is normal QRS
complex, T wave but missing P wave. there is a sudden increase in the rate of
heartbeat from about 95 to about 150 beats per minute.
B- Ventricular paroxysmal tachycardia:
It is a series of ventricular premature beats one after another without any
normal beat. It is a serious condition because it may change to ventricular
fibrillation. See figure 32.
Figure (32): Two types of paroxysmal tachycardia (Ganong's review of medical
physiology 2010)
5- Flutter and fibrillation:
1-Atrial flutter: The rate of contraction of atria 200-350 beat /minute, so the
amount of blood pumped by atria is slight. ECG show high rate of P wave, QRS
is less than P wave number, not all impulse pass AV node, so P: QRS is 2:1 or
3:1.
2-Atrial fibrillation: There is loss of systolic activity of atria but as 70% of the
blood passes from atria to ventricle passively. The patient will not be affected
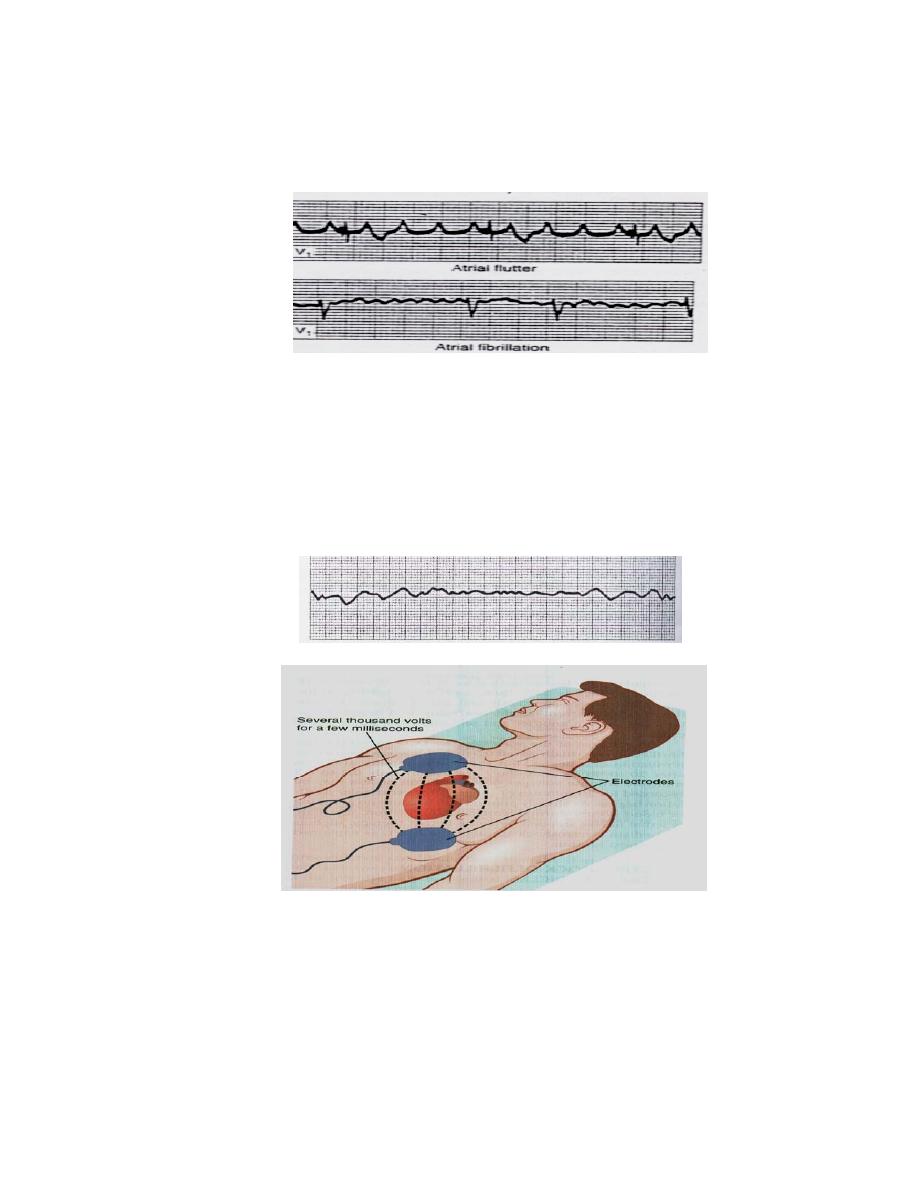
5
during rest and the effect will appear during exercise where 30% of active
systole will be used. ECG show very rapid low voltage P wave (350-600 P
wave/minute). QRS normal in component, irregular and rapid (125-150
QRS/minute). See figure 33.
Figure (33): Atrial flutter and fibrillation (Ganong's review of medical physiology
2010).
3-Ventricular fibrillation: It seems to be produced by discharge of one or more
ectopic foci. The ventricle losses its contractile ability. It is very dangerous,
death can occur few minute after its occurrence. A strong high voltage electric
current (110 – 1000) volts (DC shock) passed through the ventricles for short
interval can stop fibrillation in which all action potential stop, and the heart
remains quiescent for 3 to 5 second, after which it begin to beat again. See
figure 34.
Figure (34): Ventricular fibrillation and DC shock.
6-Hypekalemia and hypokalemia:
Hyperkalemia is very dangerous,
lethal because its effect on heart. Change in ECG is tall peaked T wave. As
plasma K level raises, paralysis of atria and prolongation of QRS complex
waves occur. A decrease in the plasma K level causes prolongation of PR
interval, prominent U wave, T wave inversion. Figure (35).
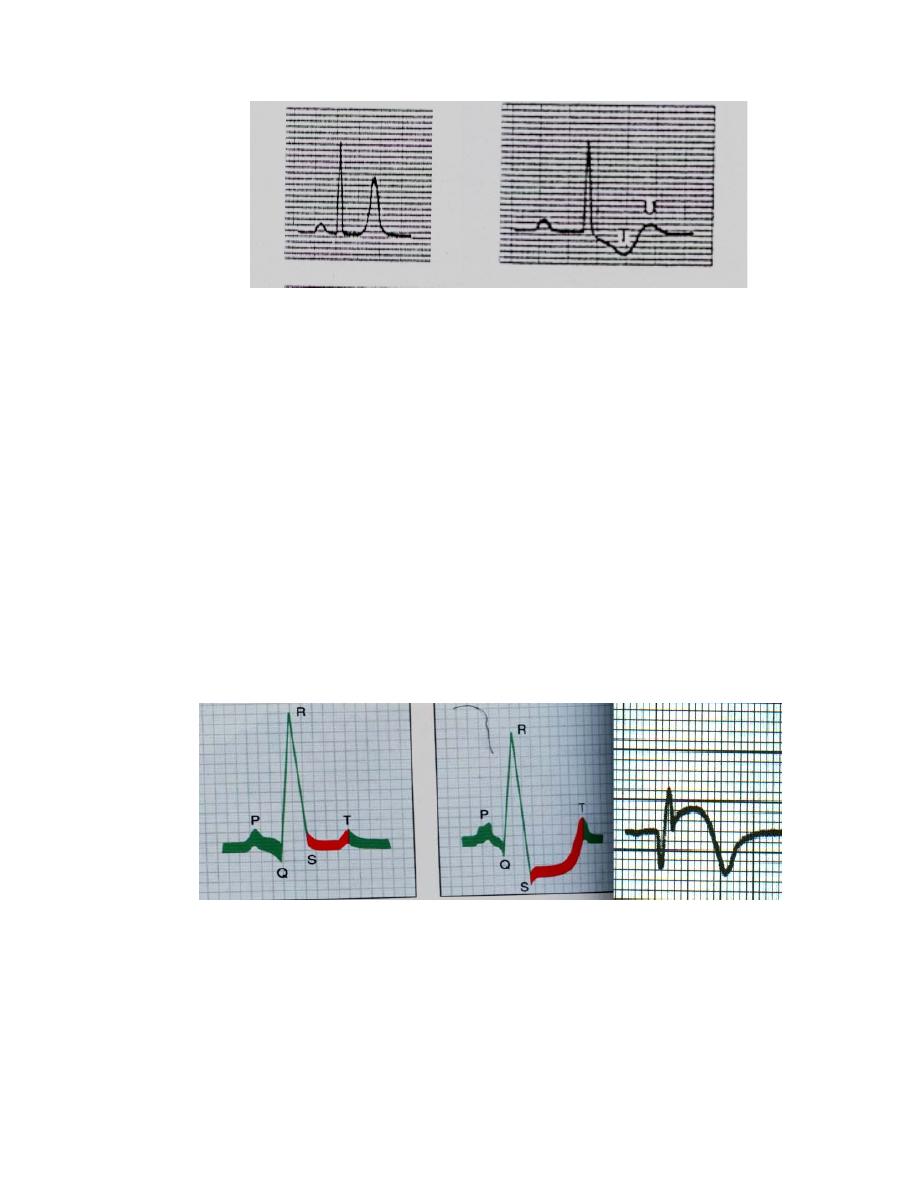
6
Figure (35): Effect of Hyperkalemia and hypokalemia on ECG (Ganong's
review of medical physiology 2010).
7- Myocardial infarction:
The infarcted muscle fibers cause acceleration opening of K channels which
develops seconds after occlusion of a coronary artery with loss of intracellular
k, so resting membrane potential of the infarcted fibers decline and depolarize
more slowly than surrounding normal fibers. After some days or weeks, the
dead muscle scar tissue become electricity silent.
Myocardial infarction may be detected by changes in:
1- S-T segment of the electrocardiogram either ST elevation or ST
depression few hours after infarction. After many days to many weeks ST
becomes isoelectric.
2- T wave inverted, deeply inversion after days or weeks then return to
normal after many months to years.
3- Abnormal Q wave appears few hours to few days and persist for years.
See figure 36.
Figure (36):
Normal, Ischemic heart disease, and acute MI ECG changes.