Phase diagram of two component system
Introduction:System : A system is that part of the universe which is under consideration. Thus, it may or may not have fixed boundaries, depending on the type of the system.
Systems physically of different types:
-Single phase system e.g. water-Two phase system e.g. water & vapor
-Three phase system e.g. water, vapor & ice
Phase: is a homogenous, physically distinct portion of a system, which is separated from other portions of the system by bounding surfaces.
Two phase system
During addition of a liquid into another liquid, one of the following results will occur:a-Two immiscible liquid result always two different phases at normal conditions such as carbon tetrachloride (CCL4) and water.
b-Partially miscible liquids and will result in one or two phase of the liquid and depend on the conditions such as phenol and water.
c-Totally miscible liquids at any percent and result in phase of a homogenous solution such as ethyl alcohol and water.
The Phase Rule
The phase rule is an expression of the number of variables and equations that can be used to describe a system in equilibrium. In simple terms, the number of variables are the number of chemical components in the system plus the extensive variables, temperature and pressure. The number of phases present will depend on the variance or degrees of freedom of the system. The general form of the phase rule is stated as follows:F = C- P+2
where F is the number of degrees of freedom or variance of the system. C is the number of components in the system. P is the number of phases in equilibrium, and the 2 comes from the two extensive variables, Pressure and Temperature.
Phenol-water binary system is a system that shows the nature of the mutual solubility between phenol and water at a certain temperature and fixed pressure. When phenol and water are mixed together, two layers form which are:
a) The upper layer is a solution of water in phenol
b) The lower layer is a solution of phenol in water.
At a fixed temperature, the composition of each solution is fixed, and both the solutions are in equilibrium. Two solutions of different compositions existing in equilibrium with one another are known as conjugate solutions. Above a particular temperature, such solutions are completely miscible in all proportions. Such a temperature is known as the Critical Solution Temperature (CST) or Consolute Temperature.
a) Above this temperature, the liquid mixture is homogeneous.
b) Below this temperature, the mixture separates into 2 layers.
The CST is affected by pressure and also by the presence of impurities. Hence, the CST may be taken as a criterion for the purity of a substance.
Aim of the experiment:
1) To correlate the relationship between temperature and solubility of phenol and water.
2) To determine the Critical Solution Temperature (CST) for phenol-water system.
3) To construct the mutual solubility curve for phenol and water.
Procedure:
1-Weight 3g of phenol in a dry and clean test-tube.
2-Add a calculated volume of water to get a mixture of 80% of phenol by weight (review the calculations).
3-Close the tube with a cover with a thermometer and glass bar inserted through it, then put it at a water bath.
4-Heat gradually with continuous shaking of the mixture until the two layers disappear and one homogenous layer formed. Record the temperature of disappearance of the two layers then notes the appearance of the turbidity again and records the temperature again and find the average temperature of two values.
5-For the same mixture add needed volume of water to get a mixture of 70% of phenol and find the average temperature by repeating the step 3 and 4.
6-Repeat the last processes by using a mixture contain 60%, 50%, 40%, 30% phenol.
Calculations
1-Calculate the used water weight in each mixture as follow:
The percentage(%) = Partial weight/Total weight X 100
80 = 33+x X 100
x = 0.75 the calculated water weight
The weight of the added water = weight of the calculated water (2) - weight of the calculated water (1)
Repeat this equation for each percentage.
Set a table for the results as follow:
Phenol%
Calculated water weight (gm)
Add water weight (gm)
Temperature Turbid-clean
Temperature Clean-turbid
Temperature average
80%
0.75
0.75
70%
1.29
0.54
60%
50%
40%
30%
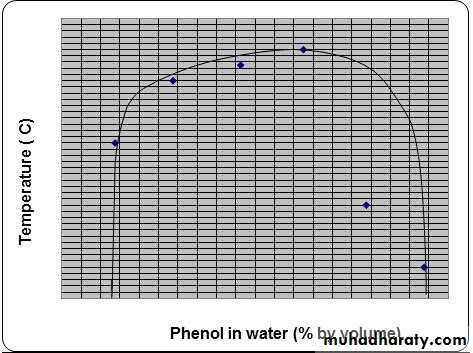
3-Plot the graph of phenol composition (horizontal axis) in the different mixture against temperature of complete miscibility. Determined the critical solution temperature.
Treatment of experimental data and discussion:
As the diagram (figure1) indicates, at low and high percentages of phenol, water and phenol mix completely, forming a single liquid phase. However, at intermediate compositions (and below the critical temperature) mixtures of phenol and water separate into two liquid phases. Point "h" in the figure is the critical point. Above the critical temperature, phenol and water are completely miscible.Figure 1: The liquid-liquid phase diagram of phenol and water. This diagram is from Martin's Physical Pharmacy and Pharmaceutical Sciences.
Phase diagram of three component system
Introduction:
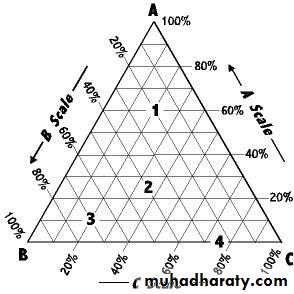
A phase diagram shows the phases existing in equilibrium at any given condition. According to the Phase Rule, a maximum of four intensive variables (intensive properties) must be specified to completely define the state of a three-component system. In this system, there are 3 components but only 1 phase exists. Thus, by using the phase rule, we can find out that the degree of freedom is 4 which are temperature, pressure, and concentrations of the two of the three components. At constant temperature and pressure, the composition of a ternary system can be presented in the form of triangular coordinates.
Each of three corners or apexes of the triangle represent 100% by weight of one component (A, B, or C). As a result, that same apex will represent 0% of the other two components. For example, the top corner point represents 100% B. Each side of the triangle represents a binary mixture where two components mixed together and any line drawn parallel to one of the sides shows the percentage of a particular component. By dividing each line into 100 equal units, the location of a point along the line can be directly related to the percent concentration of one component in a two-component system. In going along a line bounding the triangle so as to represent the concentration in a two-component system, it does not matter whether we proceed in a clockwise or counterclockwise direction around the triangle, provided we are consistent. If a line is drawn through any apex to a point on the opposite side then all systems represented by points on such a line have a constant ratio of two components, in this case A and B.
Solubility differs when there are different components mixing together. When the third component is added to a pair of miscible liquid, it may affect the mutual solubility. If the third component is more soluble in one of the liquids than in the other, then the miscibility between that pair of liquids decreases. But, if the third component is soluble in both components, then the mutual solubility will increase.
Aim of the experiments:
Determination of the phase diagram for three component liquid system of ethanol, benzene and water.
Procedure:
1- In a 100 ml conical flask add 5 ml of benzene and 15 ml of water.2- Shake the solution, a two layers appears represent the presence of two phases
3- Add from the burette drop by drop ethanol with shaking until the mixture become one layer.
4- Record the volume of alcohol.
5- Repeat the above procedure with different mixture:
a- 8 ml benzene and 12 ml water
b- 10 ml benzene and 10 ml water
c- 12 ml benzene and 8 ml water
d- 15 ml benzene and 5 ml water
6- Tabulate the results as follows:
Sample
No.Vol. of water
(ml)
Vol. of benzene
(ml)
Vol. of alcohol
(ml)
Wt. of water
(g)
Wt. of benzene
(g)
Wt. of alcohol
(g)
Wt.% of water
Wt.% of benzene
Wt.% of alcohol
1
15
5
2
12
8
3
10
10
4
8
12
5
5
15

Treatment of experimental data and discussion:
1. From the titer of water when the second phase starts to separate out, calculate the percentage by weight of each component. Plot these points on triangular co-ordinate graph paper.
2. Discuss the phase diagram in terms of the phase rule, and explain the variation of the solubility curve with temperature.