

SERIES AND PARALLEL RESONANCE
I) SERIES RESONANCE:
Aim: - To obtain the plot of of frequency vs. X
L
, frequency vs. X
C
, frequency vs. impedance and
frequency vs. current for the given series RLC circuit and determine the resonant frequency and check
by theoretical calculations.
R = 15
Ω
, C = 10
µ
F, L = 0.1 H, V = 50V vary frequency in steps of 1 Hz using Matlab.
%Program to find the Parallel Resonance
clc;
clear
all
;
close
all
;
r=input(
'enter the resistance value----->'
);
l=input(
'enter the inductance value------>'
);
c=input(
'enter the capacitance value----->'
);
v=input(
'enter the input voltage------->'
);
f=5:2:300;
xl=2*pi*f*l;
xc=(1./(2*pi*f*c));
x=xl-xc;
z=sqrt((r^2)+(x.^2));
i=v./z;
%plotting the graph
subplot(2,2,1);
plot(f,xl);
grid;
xlabel(
'frequency'
);
ylabel(
'X1'
);
subplot(2,2,2);
plot(f,xc);
grid;
xlabel(
'frequency'
);
ylabel(
'Xc'
);
subplot(2,2,3);
plot(f,z);
grid;
xlabel(
'frequency'
);
ylabel(
'Z'
);
subplot(2,2,4);
plot(f,i);
grid;
xlabel(
'frequency'
);
ylabel(
'I'
);
EXPERIMENT: 2nd class
electrical engineering dept.
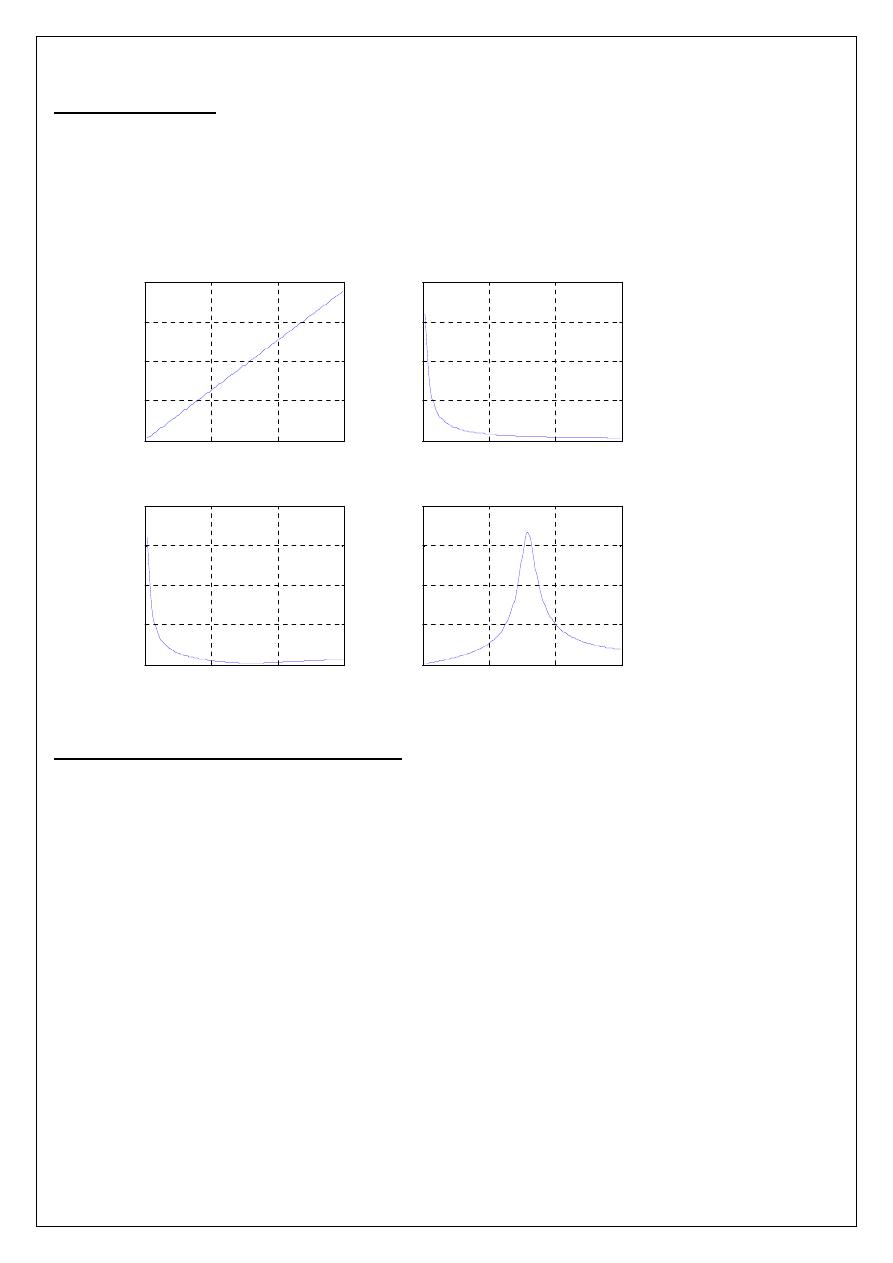
PROGRAM RESULT:
enter the resistance value----->15
enter the inductance value------>0.1
enter the capacitance value----->10*10^-6
enter the input voltage------->50
II)
PARALLEL RESONANCE(Ideal Circuit):- To obtain the graphs of frequency vs. B
L
, frequency
vs. B
C
, frequency vs. admittance and frequency vs. current vary frequency in steps for the given circuit
and find the resonant frequency and check by theoretical calculations.
R = 1000
Ω
, C = 400
µ
F, L = 1 H, V = 50V vary frequency in steps of 1 Hz using Matlab.
%Program to find the Parallel Resonance
clc;
clear all;
close all;
r=input('enter the resistance value----->');
l=input('enter the inductance value------>');
c=input('enter the capacitance value----->');
v=input('enter the input voltage------->');
f=0:2:50;
xl=2*pi*f*l;
xc=(1./(2*pi*f*c));
b1=1./xl;
bc=1./xc;
b=b1-bc;
0
100
200
300
0
50
100
150
200
frequency
X
1
0
100
200
300
0
1000
2000
3000
4000
frequency
X
c
0
100
200
300
0
1000
2000
3000
4000
frequency
Z
0
100
200
300
0
1
2
3
4
frequency
I

g=1/r;
y=sqrt((g^2)+(b.^2));
i=v*y;
%plotting the graph
subplot(2,2,1);
plot(f,b1);
grid;
xlabel('frequency');
ylabel('B1');
subplot(2,2,2);
plot(f,bc);
grid;
xlabel('frequency');
ylabel('Bc');
subplot(2,2,3);
plot(f,y);
grid;
xlabel('frequency');
ylabel('Y');
subplot(2,2,4);
plot(f,i);
grid;
xlabel('frequency');
ylabel('I');
PROGRAM RESULT:
enter the resistance value----->1000
enter the inductance value------>1
enter the capacitance value----->400*10^-6
enter the input voltage------->50
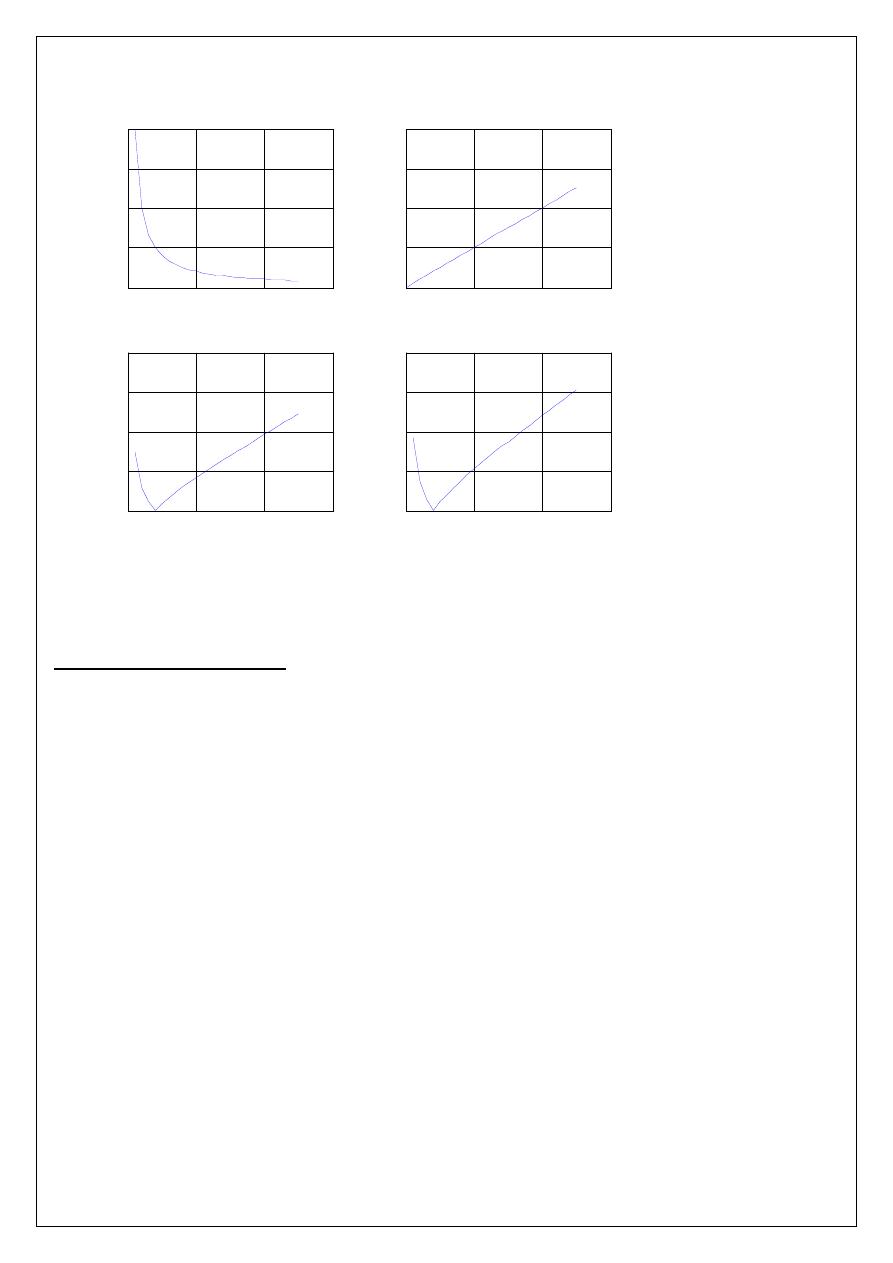
RESULTS & DISCUSSIONS: Resonance phenomena for series and parallel circuits were simulated
using MATLAB m-programming.
•
MATLAB m- programming allows customizing to our simulation requirement and required
results/graphs can be studied and analyzed.
•
Effect of resonance on current and other quantities can be seen
•
Effect of L,C parameters on resonant frequency can be seen from the simulation.
•
Current amplification for series circuit are observed
0
20
40
60
0
0.02
0.04
0.06
0.08
frequency
B
L
0
20
40
60
0
0.05
0.1
0.15
0.2
frequency
B
c
0
20
40
60
0
0.05
0.1
0.15
0.2
frequency
Y
0
20
40
60
0
2
4
6
8
frequency
I