Collected By
P
P
r
r
o
o
f
f
.
.
D
D
r
r
.
.
S
S
a
a
m
m
i
i
h
h
H
H
.
.
A
A
r
r
s
s
a
a
l
l
a
a
n
n
A
A
s
s
s
s
i
i
s
s
t
t
.
.
P
P
r
r
o
o
f
f
.
.
D
D
r
r
.
.
M
M
a
a
a
a
b
b
I
I
.
.
A
A
l
l
-
-
F
F
a
a
r
r
w
w
a
a
c
c
h
h
i
i
M
M
o
o
h
h
a
a
m
m
m
m
a
a
d
d
O
O
.
.
A
A
b
b
d
d
u
u
l
l
-
-
M
M
a
a
j
j
e
e
e
e
d
d
,
,
A
A
s
s
s
s
i
i
s
s
t
t
L
L
e
e
c
c
t
t
u
u
r
r
e
e
r
r
O
O
m
m
a
a
r
r
K
K
h
h
.
.
A
A
l
l
-
-
H
H
a
a
n
n
k
k
a
a
w
w
e
e
,
,
A
A
s
s
s
s
i
i
s
s
t
t
L
L
e
e
c
c
t
t
u
u
r
r
e
e
r
r
O
O
s
s
a
a
m
m
a
a
h
h
M
M
.
.
A
A
l
l
-
-
I
I
r
r
a
a
q
q
i
i
,
,
A
A
s
s
s
s
i
i
s
s
t
t
L
L
e
e
c
c
t
t
u
u
r
r
e
e
r
r
M
M
o
o
d
d
r
r
e
e
k
k
a
a
M
M
.
.
A
A
L
L
-
-
H
H
a
a
s
s
a
a
n
n
,
,
A
A
s
s
s
s
i
i
s
s
t
t
L
L
e
e
c
c
u
u
r
r
e
e
r
r
id23041031 pdfMachine by Broadgun Software - a great PDF writer! - a great PDF creator! - http://www.pdfmachine.com http://www.broadgun.com

V
V
e
e
t
t
e
e
r
r
i
i
n
n
a
a
r
r
y
y
C
C
l
l
i
i
n
n
i
i
c
c
a
a
l
l
D
D
i
i
a
a
g
g
n
n
o
o
s
s
t
t
i
i
c
c
P
P
r
r
o
o
c
c
e
e
d
d
u
u
r
r
e
e
s
s
2
2
0
0
0
0
8
8
Collected By
P
P
r
r
o
o
f
f
.
.
D
D
r
r
.
.
S
S
a
a
m
m
i
i
h
h
H
H
.
.
A
A
r
r
s
s
a
a
l
l
a
a
n
n
A
A
s
s
s
s
i
i
s
s
t
t
.
.
P
P
r
r
o
o
f
f
.
.
D
D
r
r
.
.
M
M
a
a
a
a
b
b
I
I
.
.
A
A
l
l
-
-
F
F
a
a
r
r
w
w
a
a
c
c
h
h
i
i
M
M
o
o
h
h
a
a
m
m
m
m
a
a
d
d
O
O
.
.
A
A
b
b
d
d
u
u
l
l
-
-
M
M
a
a
j
j
e
e
e
e
d
d
,
,
A
A
s
s
s
s
i
i
s
s
t
t
L
L
e
e
c
c
t
t
u
u
r
r
e
e
r
r
O
O
m
m
a
a
r
r
K
K
h
h
.
.
A
A
l
l
-
-
H
H
a
a
n
n
k
k
a
a
w
w
e
e
,
,
A
A
s
s
s
s
i
i
s
s
t
t
L
L
e
e
c
c
t
t
u
u
r
r
e
e
r
r
O
O
s
s
a
a
m
m
a
a
h
h
M
M
.
.
A
A
l
l
-
-
I
I
r
r
a
a
q
q
i
i
,
,
A
A
s
s
s
s
i
i
s
s
t
t
L
L
e
e
c
c
t
t
u
u
r
r
e
e
r
r
M
M
o
o
d
d
r
r
e
e
k
k
a
a
M
M
.
.
A
A
L
L
-
-
H
H
a
a
s
s
a
a
n
n
,
,
A
A
s
s
s
s
i
i
s
s
t
t
L
L
e
e
c
c
u
u
r
r
e
e
r
r
University of Mosul
College of Veterinary Medicine
Department of Internal and Preventive Medicine
id23070765 pdfMachine by Broadgun Software - a great PDF writer! - a great PDF creator! - http://www.pdfmachine.com http://www.broadgun.com

I
Preface
With knowledge growing in different scientific fields, a progress have also made in the
diagnosis of diseases. The major subjects being divided and subdivided into small fields. Such
specialization is admirable in many ways in its advantages but it does have many direct and indirect
disadvantages. Veterinary students having been taught a series of specialized subjects as separate
entities and may find it more difficult to inter-relate these subjects without being demonstrated in a
separate text.
In this text we tried to illustrate in the best way the modern techniques of diagnostic
procedures employed to differentiate diseases based on knowledge collected from most modern
sources of textbooks as well as information related to the subject from the websites. Throughout of
the text mention is made of recent commercially available products of kits used in the field of
veterinary medicine.
The text containing illustrations and many different recent techniques which can be value,
provided if they are employed in the right way at the right time and in the scientific manners. For
this purpose a basic knowledge of normal and abnormal structures, functions and why these modern
diagnostic techniques are employed, hence the students and practitioners should be aware of the
variations and errors anticipated which might occur when performing these laboratory techniques,
and logic interpretation of results is made.
It is now become believable how computer simulation has becoming sufficiently important
for having of this kinds of advances in laboratory diagnosis. However, the use of this book work
equally (might be) well in teaching laboratory procedures for academic and in fields by the
practitioners.
The primary target readership of this text is 4
th
year students in the college of veterinary
medicine, but we hope that it will be of similar benefit for the 5
th
year and post-graduate students as
well as for practitioners in the field, for its broad spectrum definitional and variety of numerous
information, examples and demonstrations contains, and hope that enough coverage of laboratory
diagnostic methods have been pursued.
Jan. 2008 Samih H. Arslan
id23091328 pdfMachine by Broadgun Software - a great PDF writer! - a great PDF creator! - http://www.pdfmachine.com http://www.broadgun.com

II
Acknowledgment
This piece of work was possible to be published by the collection of scientific
laboratory diagnostic procedures based on work of many scientists and workers in this field
universally as well as staff members of this college. We hereby express our admiration to
the progress, giving the opportunity to veterinarians to learn more on the basis of recent
advances in this important science, we grateful to all. Also our thanks are due to Dean of
the college participates in make this text available for the students and practitioners. Thanks
also to our many colleagues at the department of internal and preventive medicine.
id23122843 pdfMachine by Broadgun Software - a great PDF writer! - a great PDF creator! - http://www.pdfmachine.com http://www.broadgun.com

III
C
C
o
o
n
n
t
t
e
e
n
n
t
t
s
s
Chapter 1 … Collection of Samples ……………………………………. 1
Types of samples
………………………………………………………………………….. 1
I. Sample collected from live animals
………………………………………………… 1
1- Blood
…………………………………………………………………………… 1
2- Urine
…………………………………………………………………………….. 2
3- Feces
……………………………………………………………………………... 3
4- Milk
……………………………………………………………………………… 3
5- Genital tract and Semen
…………………………………………………………. 3
6- Abortion cases
………………………………………………………………….. 3
7- Nasal discharge, Saliva and Tears
……………………………………………….. 4
8- Eye
………………………………………………………………………………. 4
9- Skin
……………………………………………………………………………… 4
10- Body fluids
…………………………………………………………………….. 4
11- Gastric juice and Ruminal fluid
……………………………………………….. 5
12- Abscess
………………………………………………………………………. 5
II. Samples collected at post-mortem
………………………………………………… 5
III. Environmental and feed sampling
…………………………………………………. 5
Transportation of specimens
……………………………………………………………… 6
Transportation of specimens
……………………………………………………………… 6
Chapter 2 … Clinical Hematology ………………………………………. 7
Erythrocytes count
……………………………………………………………………….. 7
Leukocytes count
…………………………………………………………………………. 7
1. Total Leukocytes count (TLC)
……………………………………………………… 7
2. Differential Leukocytes count (DLC)
………………………………………………. 8
Reticulocytes count
……………………………………………………………………… 10
Thrombocytes count
……………………………………………………………………... 11
Packed Cell Volume "Hematocrit"
………………………………………………………. 12
Hemoglobin determination
……………………………………………………………….. 13
Erythrocytes indices
……………………………………………………………………… 13
Blood Counts by Electronic Analyzer
……………………………………………………. 13
Erythrocyte sedimentation rate (ESR)
……………………………………………………. 14
Hemostasis and coagulation of the blood
…………………………………………………. 14
Whole blood coagulating time
……………………………………………………………. 14
Bleeding time
…………………………………………………………………………….. 15
Chapter 3 … Bone Marrow Examination ………………………….... 17
Bone Marrow Aspiration
…………………………………………………………………. 17
Preparation of Bone Marrow Smears
….……………………………………………… 17
Preparation of Bone Marrow Sections
…………………………………………………. 18
Examination of Bone Marrow Film
……………………………………………………… 18
Cell Identification
………………………………………………………………………… 18
Chapter 4 … Clinical Biochemistry …………………………………… 21
Panel of Biochemical Analyses
…………………………………………………………. 21
Preparation of Solutions
………………………………………………………………... 21
id23145546 pdfMachine by Broadgun Software - a great PDF writer! - a great PDF creator! - http://www.pdfmachine.com http://www.broadgun.com

IV
Equipments of Biochemical Analyses
…………………………………………………... 22
pH meter
………………………………………………………………………………. 22
Refractometer
…………………………………………………………………………. 22
Spectrophotometer
…………………………………………………………………….. 23
Flame photometer
……………………………………………………………………... 23
Atomic absorption spectrophotometer
………………………………………………... 24
Electrophoresis
………………………………………………………………………... 24
Enzyme linked Immunosorbent Assay (ELISA)
……………………………………… 24
VET Scan Analyzer
……….…………………………………………………………... 25
Techniques of Biochemical Analyses
………………………………………….……. 25
Tests of functional status of several organs
…………………………………………… 27
Chapter 5 … Urinalysis …………………………………………………… 29
Macroscopic Examination of the Urine
…….…………………………………………… 29
I. Physical Examination
……………………………………………………………….. 29
II. Chemical Examination
……………………………………………………………... 30
Microscopic Examination of the Urine
…….……………………………………………. 30
Component of Urinary Sediment
….…………………………………………………. 31
I. Organized Sediment
….……………………………………………………………. 31
II. Unorganized Sediment
……………………………………………………………... 31
Urine Culture
….………………………………………………………………………… 33
Kidney Function Tests
…………………………………………………………………... 33
Chapter 6 … Clinical Parasitology ……………………………………. 35
Coprological Examination
….…………………………………………………………….. 35
Macroscopic Examination
….…………………………………………………………… 35
Microscopic Examination
………………………………………………………………… 35
I- Qualitative Methods
………………………………………………………………… 35
II- Quantitative Methods
……………………………………………………………… 37
III- Micrometry
………………………………………………………………………... 37
Examination of Feces for Protozoa
….………………………………………………….. 38
Blood Examination
……….……………………………………………………………….. 41
Blood Protozoa
…………………………………………………………………………… 41
Babesia
………………………………………………………………………………... 41
Theileria
……………………………………………………………………………….. 41
Anaplasma
…………………………………………………………………………….. 42
Trypanosoma
………………………………………………………………………….. 42
Toxoplasma
…………………………………………………………………………… 42
Blood Nematodes
…….…………………………………………………………………. 43
Miscellaneous Parasitic Examination
….………………………………………………… 44
Parasites of the Urinary Tract
…………………………………………………………….. 44
Parasites of the Reproductive Tract
………………………………………………………. 44
Parasites of the Eye
………………………………………………………………………. 44
Diagnosis of External Parasites
….……………………………………………………….. 44
Mites
……………………………………………………………………………………… 44
Ticks
……………………………………………………………………………………… 45
Insects
…………………………………………………………………………………….. 45
Chapter 7 … Rumen Fluid Examination …………………………….. 49
Examination of the Fluid
…….………………………………………………………….. 49
Physical Examination
……………………………………………………….……….. 49

V
Chemical Examination
………………………………………………………….…… 51
Examination of the Protozoa
……………………………………………………………... 51
Examination of the Bacteria
………………………………………………………….…. 51
Chapter 8 … Milk Examination ……………………………………….. 53
Physical Examination (Strip-cup test)
……………………………………………….….. 53
Chemical Examination
…………….……………………………………………………. 53
Indirect Leukocyte Count
……………………………………………………………….. 54
Direct Leukocyte Count
………………………………………………………………… 55
Hotis Test
……………………………………………………………………………….. 56
Chapter 9 … Clinical Microbiology …………………………………… 57
Clinical Bacteriology
….…………………………………………………………………... 57
Methods of Bacteriological Diagnosis
……….………………………………………….. 57
1- Smears
……………………………………………………………………………… 57
2- Bacteriological Media
……………………………………………………………… 57
Preparation of Culture Media
…….……………………………………………………... 57
Inoculation of Culture Media
….………………………………………………………… 58
Streaking of the Plate
…….…………………………………………………………….. 58
Incubation of the Plate
…….……………………………………………………………. 60
Identification of Bacteria
…….………………………………………………………….. 60
Bacterial Cell Counting Techniques
……………………………………………………... 62
Clinical Virology
……………………………………………………………………………. 63
Preparation of Clinical Specimens
……………………………………………………….. 63
Preparation of Washed Sand
……………………………………………………………. 63
Inoculation of Specimen into Susceptible Host Systems
….……………………………. 64
Preparation of Cell Culture
………………………………………………………………. 64
Virus Inoculation in Chick Embryo
…………………………………………………….. 65
Clinical Mycology
…………………………………………………………………………... 66
Direct Microscopic Examination
…………………………………………………………. 66
Isolation and Subculture of Fungi
….……………………………………………………. 67
Chapter 10 … Serology …………………………………………………… 69
Agglutination Tests
…….……………………………………………………………….. 69
Haemagglutination Test (HA)
……………………………………………………………. 70
Haemagglutination Inhibition test (HI)
…………………………………………………... 71
Agglutination-Lysis Test
……….………………………………………………………… 71
Precipitation Test
……….……………………………………………………………….. 71
Complement Fixation Test
………….…………………………………………………… 72
Enzyme Linked Immunosorbent Assay (ELISA) .
………………………………………. 72
Immunofluorescence
……………………………………………………………………... 73
Chapter 11 … Polymerase Chain Reaction (PCR) ……………….. 75
Materials used in PCR technique
………………………………………………………… 75
Procedure of PCR technique
……………………………………………………………... 75
Appendix ……………………………………………………………………….. 79

1
C
C
h
h
a
a
p
p
t
t
e
e
r
r
1
1
C
C
o
o
l
l
l
l
e
e
c
c
t
t
i
i
o
o
n
n
o
o
f
f
S
S
a
a
m
m
p
p
l
l
e
e
s
s
Before taking samples, careful consideration
should be given to the purpose for which they
are required. This will determine the type and
number of samples needed to provide valid
results. Considerable skill and care are required
to decide on the correct samples to be sent to the
laboratory.
The samples collected should be represent the
condition being investigated and the lesions
observed.
When samples are taken from live animals,
care should be taken to avoid injury or
distress to the animal or danger to the
operator and attendants. It may be necessary
to use mechanical restraint, tranquillization or
anesthesia.
A sufficient quantity of material must be
provided to permit a thorough examination.
Sample should be obtained from the edges of
lesion and include some macroscopically
normal tissue. Microbial replication will be
most active at the lesion's edge.
For bacteriological isolation, sample should
be collected before the administration of any
form of treatment.
The risk of zoonotic disease should be kept in
mind and precautions taken to avoid human
infection.
Care should be taken to avoid environmental
contamination, or risk of spread of disease
through insects or fomites.
For obtaining specimens, select an animal
that is in advanced stages of the disease.
If the disease is a flock or herd problem,
specimens should be obtained from more than
one diseased animal which are in various
stages of illness, and also from one or two
animals that have died recently.
Identification of samples should be submitted
with each sample including complete history
as follows:
Owner's name and address.
Description of the animal including:
species, age and sex.
Duration of the condition or outbreak.
Morbidity and mortality rates.
Nature of feed including any change of
feed that has occurred.
Possibility of contact with other animals.
Clinical signs observed.
Necropsy findings.
History of treatment or vaccination.
Tentative clinical diagnosis.
Veterinarian's name, address and phone
number.
The nature of submitted sample.
Type of preservation used on specimen.
Types of samples
I. Sample collected from live animals
1-
Blood:
Blood samples may be taken for hematology
(hemograms) or for culture and/or direct
examination for bacteria, viruses, or protozoa, in
which case it is usual to use anticoagulants
.
In nearly the site of choice for taken of blood
sample in all species is the jugular vein. Other
veins provide a useful alternative to the jugular,
such as mammary vein, caudal vein (tail vein) in
standing cattle, or cephalic vein in large dogs
with short thick neck.
The blood sample is taken, as cleanly as
possible. The skin at the site of vein puncture
should be shaved and swabbed with alcohol
Anticoagulants:
1- EDTA " Ethylene Diamine Tetra Acetic Acid ":
It acts by combining with calcium. It preserve the
stainability
and
morphologic
characteristics
of
leukocytes, but it decrease PCV if EDTA is present in
excess due to cell shrinkage. It is used as:
Liquid form: 1drop of 10% sol./5ml of blood.
dry powder: 1mg of powder/1ml of blood.
2- Oxalate:
It is act by combining with calcium. It is easy to prepare
and inexpensive, but has some disadvantages.
3- Heparin:
It is act by interfering with conversion of prothrombin to
thrombin, but it is expensive and effective for only 10-12
hours.
4- Sodium fluoride:
It is not used for hematological determination, but used
for glucose estimation.
id23206265 pdfMachine by Broadgun Software - a great PDF writer! - a great PDF creator! - http://www.pdfmachine.com http://www.broadgun.com
2
70%, and allowed to dry, then the blood taken
either by syringe and needle, or by needle and
vacutainer tube (Fig 1-1) and (Fig. 1-2).
Notes:
For samples that are collected with anti-
coagulant, thorough mixing is necessary as
soon as the sample has been taken, using
gentle agitation only.
It may also be necessary to make a smear of
fresh blood on a microscope slide; both thick
and thin smears may be prepared
1
.
Serum and Plasma:
Serum or plasma may be collected from
whole blood as follows:
Separation of serum:
Blood left to stand at ambient temperature
(but protected from excessive heat or cold)
for 1-2 hours until the clot begins to contract.
The clot can then be ringed round with a
sterile rod then place the tube in a refrigerator
at 4
°C for several hours or overnight.
1
Preparation of blood film will be discussed in "Chapter 2".
The sample can be centrifuged at about 1000
rpm for 10-15 minutes.
Aspire the serum with a pipette.
Avoid the tip of the pipette being pocked into
the clot, or too much suction applied near the
surface because fragments may be detached.
Separation of plasma:
Blood with anticoagulant centrifuged at about
1000 rpm for 10-15 minutes.
Aspire the plasma with a pipette.
Do not disturb the cell layer, otherwise blood
cells will be withdrawn.
Serum and plasma may be stored at 4
˚c in a
refrigerator for up to 4 days, or should be placed
into deep-freeze at (-15
˚c) to (-20˚c) until used.
2-
Urine:
Urine in the urinary bladder is normally
sterile, the urethra has microflora. Urine colleted
from animals via several methods.
(a) Manual compression of urinary bladder:
A continuous pressure should be done for
several minutes until the sphincters of the urethra
relax and urine is expelled. The bladder in small
animals
is
obtained by abdominal
palpation,
while
a gentle continuous pressure in large animals can
be applied through rectal palpation.
(b) Catheterization:
Catheterization used in female large animal.
Care must be taken to avoid contamination and
traumatic injury. The catheter should be passed
by handling it through the sterile packing mate-
rial in which it is contained, utilized sterilized
forceps, and wearing sterilized rubber gloves.
The first portion of aspired urine should be
discarded. Samples colleted by catheterization
often contain a few RBCs (Fig. 1-3).
(c) Cystocentesis:
Cystocentesis indicated for bacterial culture,
and used in small animals only when the bladder
contains a sufficient volume of urine so that it is
readily palpable (Fig 1-4).
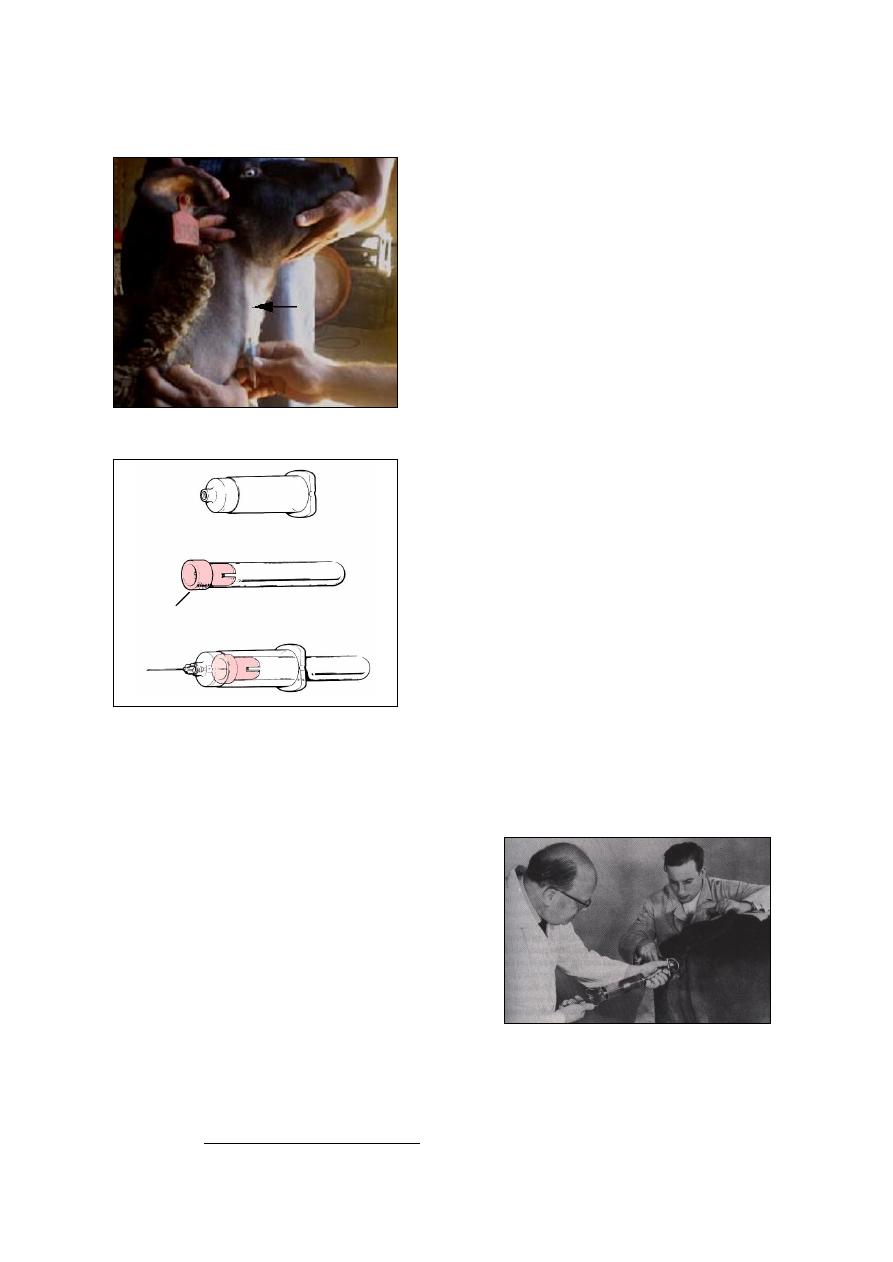
Fig. (1-1) blood sampling from the jugular vein
Fig. (1-2) vacutainer blood collection system
Holder
Evacuated tube
Rubber bung
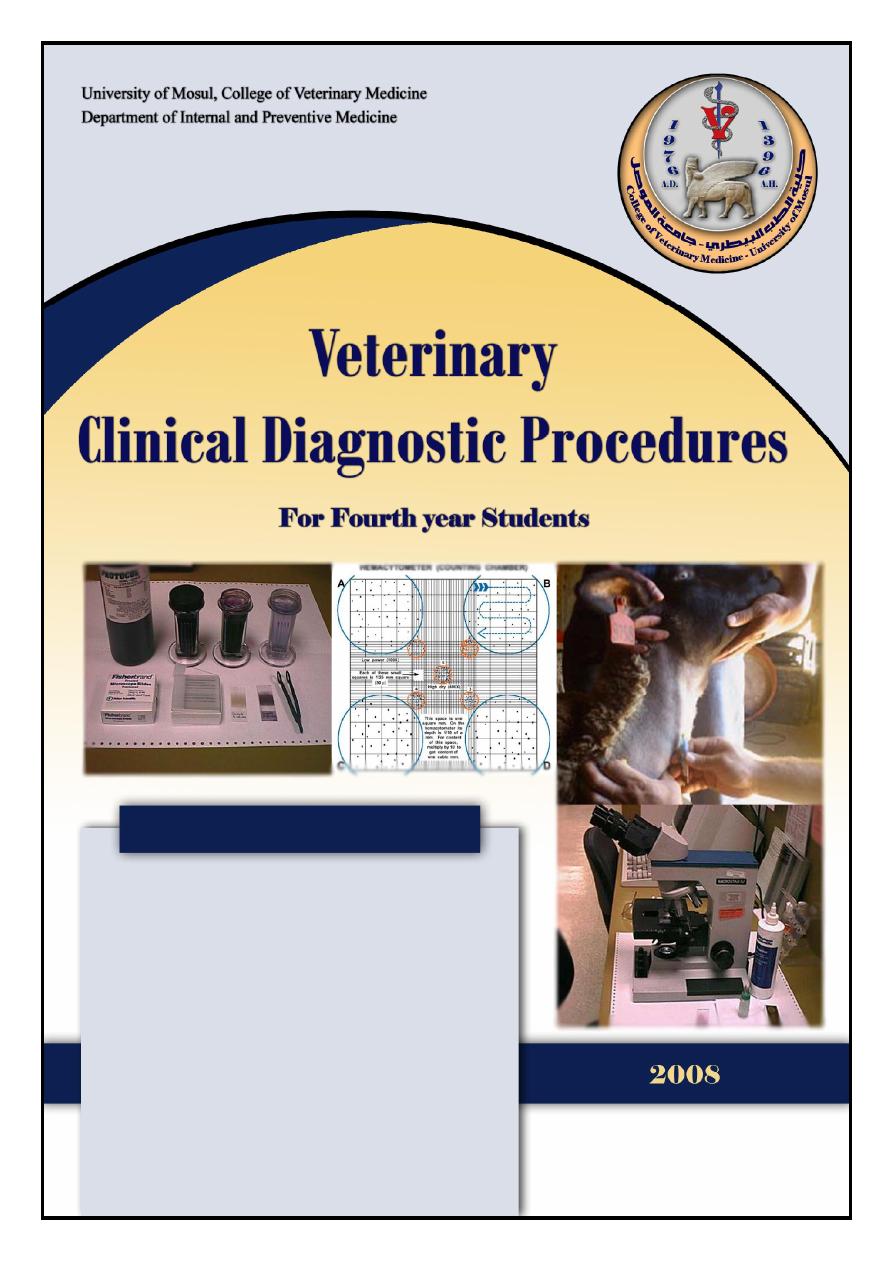
Fig. (1-3) collection of urine by catheterization
3
The skin should be cleansed and prepared
aseptically.
The bladder should be held firmly.
Use a syringe and needle (1.5 by 16 gauge).
3- Feces:
At least 10 g of freshly voided feces should be
collected (Fig 1-5). Feces for parasitology should
fill the container "Screw top containers or sterile
plastic bags" and be sent to arrive at the labora-
tory within 24 hours. If transport times are likely
to be longer than 24 hours, the sample should be
sent on ice or refrigerated to prevent the hatching
of parasite eggs. Feces are best stored and
transported at 4
°C. Sterile swabs can be taken
from the rectum for bacterial examination.
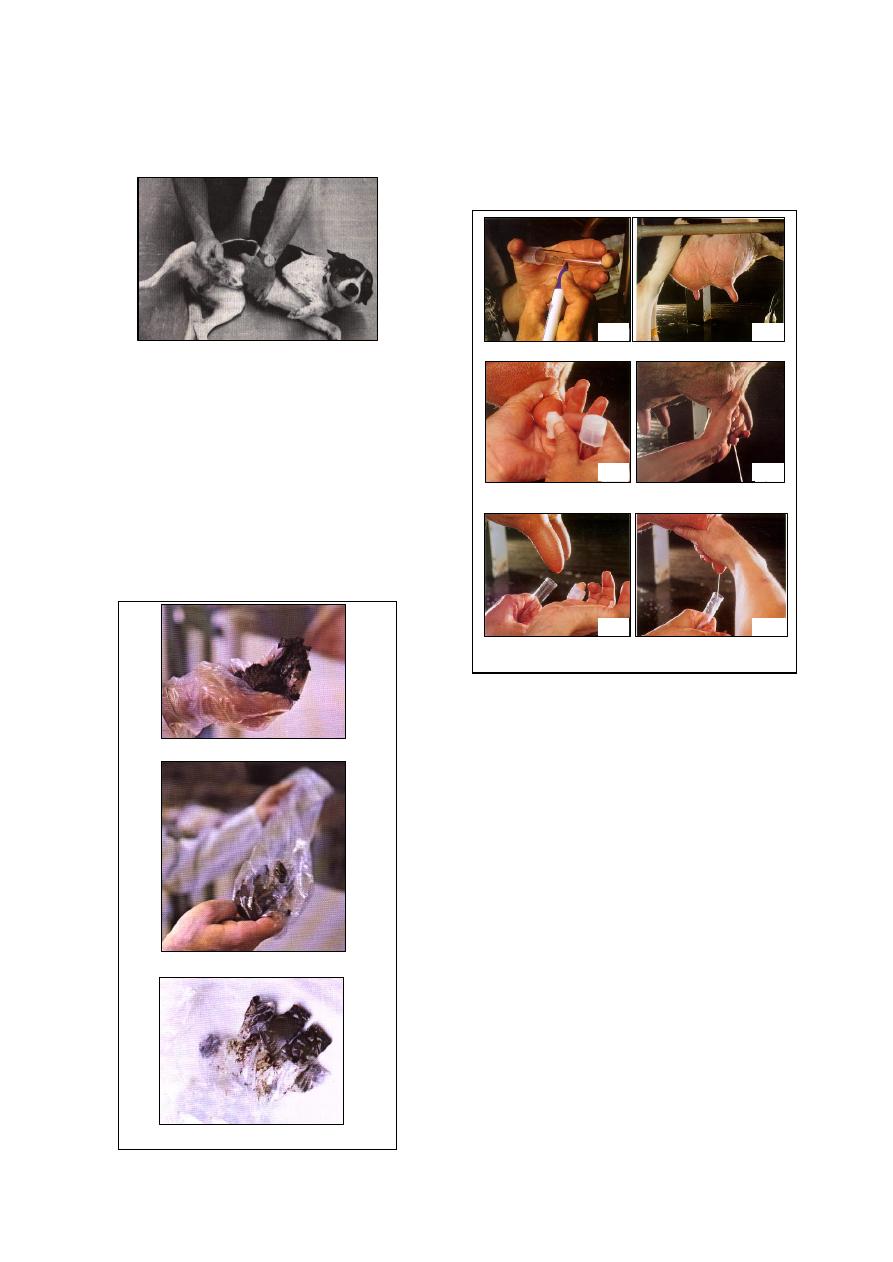
4-
Milk:
Milk samples should be taken after cleansing
with mild soap and water, and drying the tip of
the teat. The use of antiseptics should be avoi-
ded. Initial streams of milk should be discarded
and a tube filled with the next streams (Fig 1-6).
Milk for serological tests should not have
been frozen, heated or subjected to violent
shaking. If there is going to be a delay in
submitting them to the laboratory, preservatives
can be added to milk samples that are being
collected for serological testing. Milk for
bacterial examination can be frozen.
5-
Genital tract and Semen:
Samples may be taken by vaginal or preputial
washing, or by the use of suitable swabs. The
cervix or urethra may be sampled by swabbing.
Samples of semen are best obtained using an
artificial vagina.
6- Abortion cases:
If possible, whole fetus should be submitted,
else fetal abomasal contents (in ruminants),
lung, liver and a sample of any gross lesions
in or on the fetus should be sent.
A piece of obviously affected placenta and
two or more cotyledon from aborted animals.
(a) the feces are taken per rectum
(b) the plastic glove is turned inside out
(c) the plastic glove is tied and labeled
Fig. (1-5) steps of feces collection
labeling of sterile tube
a
b
udder should be clean
drying the tip of the teat
c
d
remove (1-2) streams of milk
from each teat
hold the sterile tube and remove
the cap without contaminating it
e
f
hold tube at an angle to prevent
debris from entering the tube
Fig. (1-6) steps of milk collection
Fig. (1-4) collection of urine by cystocentesis
4
Uterine discharge, especially if no placenta is
available.
If there is Leptospiral abortion, 20 ml of mid-
stream urine from the dam preserved with 1.5
ml of 10% formalin should be submitted if
possible.
7-
Nasal discharge, Saliva and Tears:
Samples may be taken with cotton or gauze
swabs, preferably on wire handles as wood is
inflexible and may snap (Fig 1-7). It may be
helpful if the swab is first moistened with
transport medium. The swab should be allowed
to remain in contact with the secretions for up to
1 minute, then placed in transport medium, such
as nutrient broth, and sent to the laboratory
without delay at 4
°C.
Long protected nasopharyngeal swabs should
be used to collect samples for some suspected
viral infections. Mucopurulent nasal discharges
are rarely useful.
8-
Eye:
A sample from the conjunctiva can be taken
by holding the palpebra apart and gently
swabbing the surface.
The swab is then put into transport medium.
Scrapings may also be taken on to a
microscope slide.
Mucopurulent lacrimal discharges are rarely
useful.
9-
Skin:
Skin specimens differ according to the type of
the lesions.
(a) In diseases producing vesicular lesions:
2 g of affected epithelial tissue as aseptically
as possible should be collected, and place it in
5 ml phosphate buffered glycerine or Tris-
buffered tryptose
broth virus transport media
at pH 7.6.
The vesicular fluid should be sampled where
unruptured vesicles are present; if possible,
vesicular fluid should be aspirated with a
syringe and placed in a separate sterile tube.
(b) Plucked hair or wool samples are useful for
surface-feeding mites, lice and fungal infec-
tions. Deep skin scrapings, using the edge of
a scalpel blade, are useful for burrowing
mites. Arthropod parasites can be most
effectively stored in 70% ethyl alcohol or
glycerin for shipment or long term preser-
vation. Formalin 10% will also preserve
arthropods.
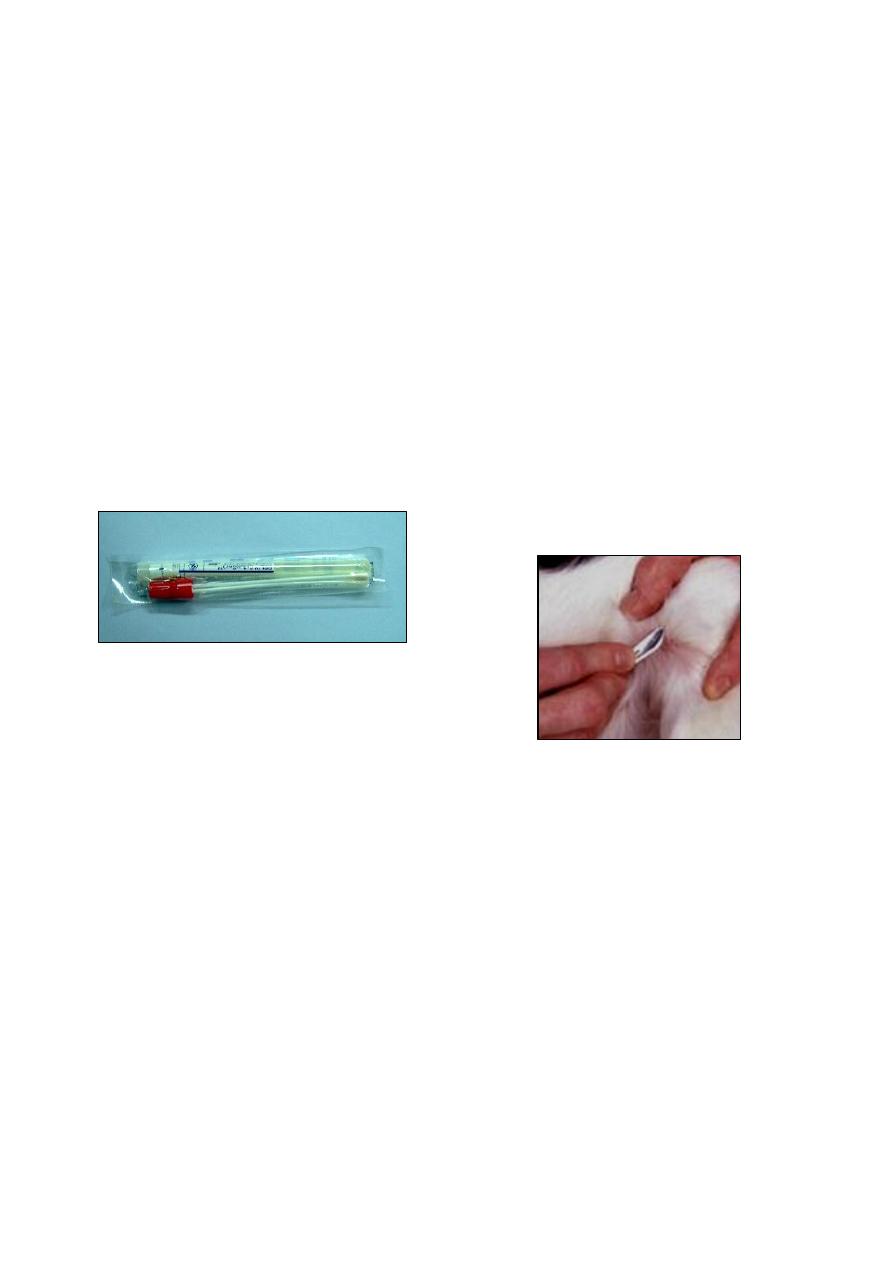
(c) When mites are suspected, skin scrapings can
be collected and forwarded to the laboratory
by placing them in glycerin in a lightly sealed
vial for shipment. Vials should be packed
carefully to prevent breakage or leakage. The
following technique is used for the diagnosis
of mites:
Add several drops of mineral oil or
glycerin to the area to be scraped. The area
should be at the periphery of the
continuous lesion, not in the center of the
lesion.
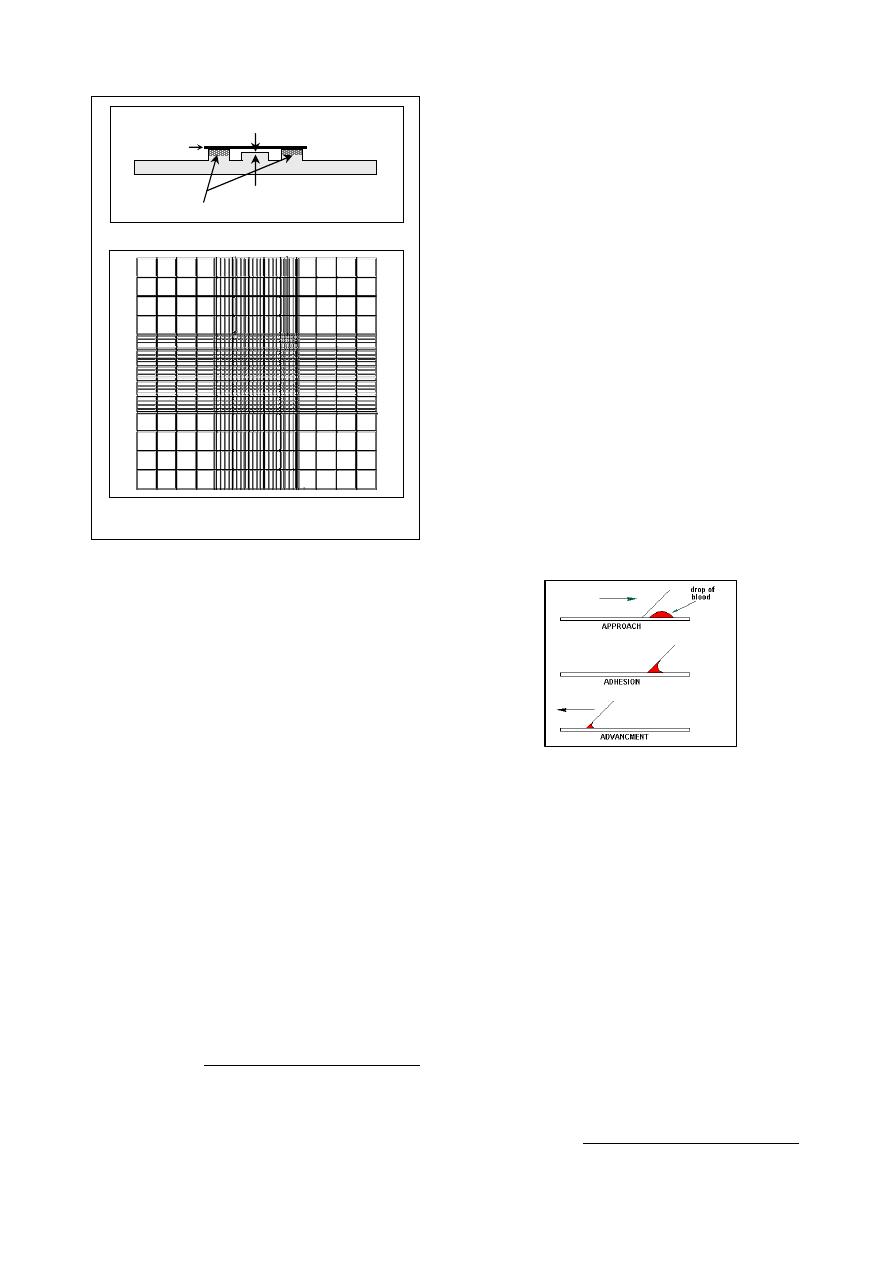
Scrape with a scalpel blade the area to a
depth that blood begins to ooze from the
wound (Fig 1-8).
Transfer the bloody material that was scraped
to a microscope slide.
Add additional mineral oil and cover with a
coverslip.
Examine under low power (40x) firstly, if
nothing seen, increase the magnification.
Note:
Large amounts of hair or skin can digested in
10% KOH for 12-24 hours, and the sediment
can be examined for mites either directly after
centrifugation or the sediment can be
examined with the sugar flotation solution.
10- Body fluids (Paracentesis):
Cerebrospinal fluids (CSF), synovial fluids,
fluids of thoracic, pleural, pericardial and
abdominal cavities are aspired aseptically
with a sterile needle of proper length and
Fig. (1-8) method of making skin scraping with a
scalpel blade.
Fig. (1-7) Culture swab, collection and transport system
5
gauge, and collected in sterile screw cap
bottle without preservatives.
Samples for cellular examination, not later
than 24 hrs., could be preserved with a tube
containing EDTA, or 10% formalin, or 10%
normal saline, at a rate of (1 drop / 2-5 ml).
11- Gastric juice and Ruminal fluid:
In monogastric animals, when gastritis or a
chemical poison is suspected, sample of vomitus
should be collected.
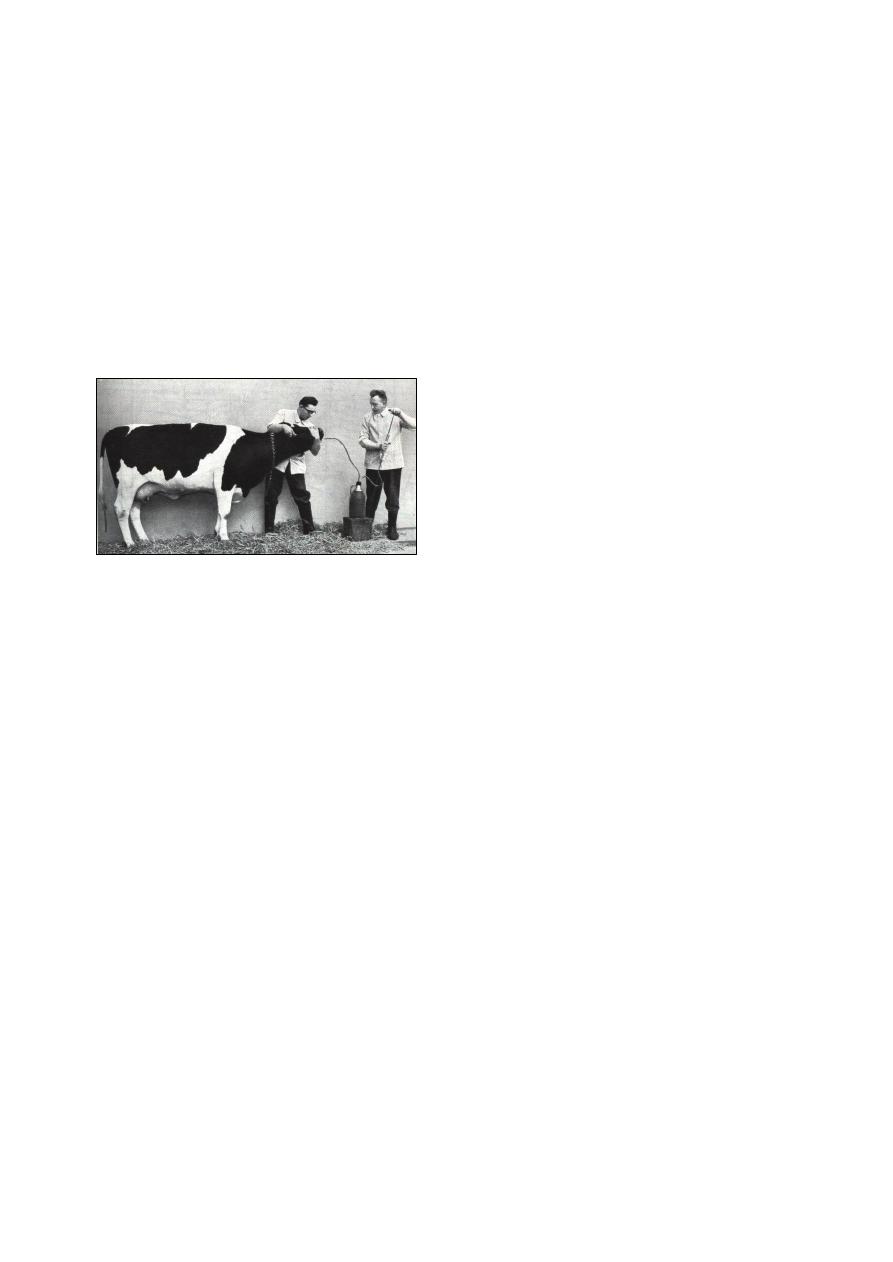
In ruminants, ruminal fluid is aspirated
through stomach tube and suction pump in a
glass container (Fig 1-9).
12- Abscess:
Abscess must be collected before the lesion is
opened for drainage. The surface is disinfected
with 70% alcohol, a sterile needle introduce in
the abscess and the contents are withdrawn by a
syringe. The contents are evacuated in a sterile
stopper tube that is placed in a refrigerated
package.
II. Samples collected at post-mortem
Tissues may be collected for microbiological
culture, parasitology, biochemistry, histopatho-
logy and/or immuno-histochemistry, and for
detection of proteins or genome nucleic acids.
The person conducting the post-mortem
examination should have sufficient knowledge of
anatomy and pathology to select the most
promising organs and lesions for sampling.
Samples of tissue from a variety of organs
can be taken. This procedure will requires:
Knife, saw, cleaver, scalpel, forceps and
scissors, including scissors with a rounded tip
on one blade, for opening intestines.
Plentiful supply of containers appropriate to
the nature of the sample, with labels and
report forms including the date, tissue and
animal identification.
Special media may be required for transport
of samples from the field.
The operator should wear protective clothing:
overalls, washable apron, rubber gloves and
rubber boots. If potential zoonotic diseases
are being investigated, the post-mortem
examination should be conducted in a
biological safety cabinet; if this is not
possible, an efficient face mask and eye
protection should be worn.
After collection, the samples for micro-
biological examination should be refrigerated
until shipped. If shipment cannot be made
within 48 hours, the samples should be
frozen; however, prolonged storage at -20
°C
may be detrimental to virus isolation.
For histopathology, blocks of tissue not more
than 0.5 cm thick and 1-2 cm long are cut and
placed in neutral buffered 4-10% formalin,
which should be at least ten times the volume
of the tissue sample.
Because of the rapid post-mortem invasion of
the animal body by anaerobes from the
intestinal tract, samples from animals died for
more than four hours are usually unsuitable.
The considerations of Samples for anaerobic
culture are:
Bone marrow appears to be one of the last
tissue to be invaded by contaminating
bacteria, so that it is a good sample for the
diagnosis of blackleg or malignant edema.
In suspected enterotoxemia cases, at least
20 ml of the ileal contents should be
submitted for demonstration of the
specific toxin. Or a loop of ileum with
contents tied of at each ends, or the ileal
contents may be drained into a screw-
capped bottle.
Any samples must be arrived at the
laboratory as soon as possible after
collection.
III. Environmental and feed sampling
Samples may be taken to monitor hygiene or
as part of a disease enquiry. Environmental
samples are commonly taken from litter or
bedding and voided feces or urine. Swabs may
be taken from the surface of ventilation ducts,
feed troughs and drains. Samples may also be
taken from animal feed, in troughs or bulk
containers. Water may be sampled in troughs,
drinkers, header tanks or from the natural or
artificial supply.
Fig. (1-9) method of ruminal fluid collection

6
Transportation of specimens
The specimens should be forwarded to the
laboratory by the fastest method available. If
they can reach the laboratory within 48 hours,
samples should be sent refrigerated. If dry ice is
used, the additional packaging requirements
must be met. Infectious substances, which can
include diagnostic specimens, are not permitted
to be shipped as checked luggage or as carry on
luggage and must be shipped as cargo.
Packaging
The shipper should ensure that the specimens
are packaged so they arrive at the laboratory in
good condition and there is no leakage during
shipment. There are three of the national
guidelines provide explicit directions for
packaging and shipping diagnostic specimens:
(a) The packaging should consist of three
components:
1- a leak-proof primary receptacle(s).
2- a leak-proof secondary packaging.
3- an outer packaging of adequate strength for
its capacity, mass and intended use, and
having minimum dimensions of:
(100 mm
× 100 mm).
(b) For liquids, absorbent material in sufficient
quantity to absorb the entire contents must be
placed between the primary receptacle(s) and
the secondary packaging so that, during
transport, any release or leak of a liquid
substance will not reach the outer packaging
and will not compromise the integrity of the
cushioning material.
(c) When multiple fragile primary receptacles are
placed in a single secondary packaging, they
should be either individually wrapped or
separated to prevent contact between them.
References
Coles, E. H. (1986). Veterinary clinical pathology. 4
th
ed., WB Saunders Co Philadelphia, London,
Toronto.
Cruickshank, R. Duguid, J. P., Marmion, B. P. and
Swain, R. H. A. (1975). Medical microbiology.
12th ed. Edinbarch, London and New York.
Kerr, M. G. (2002). Veterinary laboratory medicine:
clinical biochemistry & hematology. 2nd ed.,
Blackwell Science.
Mitchell, B., Neary, N. and Kelly, G. Blood Sampling
in Sheep. Purdue University, Department of
Animal Sciences:
http://www.ces.purdue.edu/extmedia
OIE. (2006). Manual of Diagnostic Tests and
Vaccines for Terrestrial Animals. :
http://www.oie.int.
Rosenberger, G. (1977). Clinical Examination of
Cattle. 2
nd
ed., Verlag Paul Parey, Berlin and
Hamburg, Germany.
Sloss, M. W., Kemp, R. L. & Zajac, A. M. (1994).
Veterinary clinical parasitology. 6th ed.,
Blackwell Co, Iowa State Press.
Thienpont, D., Rochette, F. & Vanparijs, O. F. J.
(1979). Diagnosing helminthiasis through
coprological examination. Janssen Founda-
tion, Beerse, Belgium.
7
C
C
h
h
a
a
p
p
t
t
e
e
r
r
2
2
C
C
l
l
i
i
n
n
i
i
c
c
a
a
l
l
H
H
e
e
m
m
a
a
t
t
o
o
l
l
o
o
g
g
y
y
The clinician should be able to perform a
number of hematological examinations. These
include: erythrocyte count, total and differential
leukocyte counts, platelet count, packed cell
volume, hemoglobin estimation, erythrocyte
sedimentation rate and clotting time.
Erythrocytes count
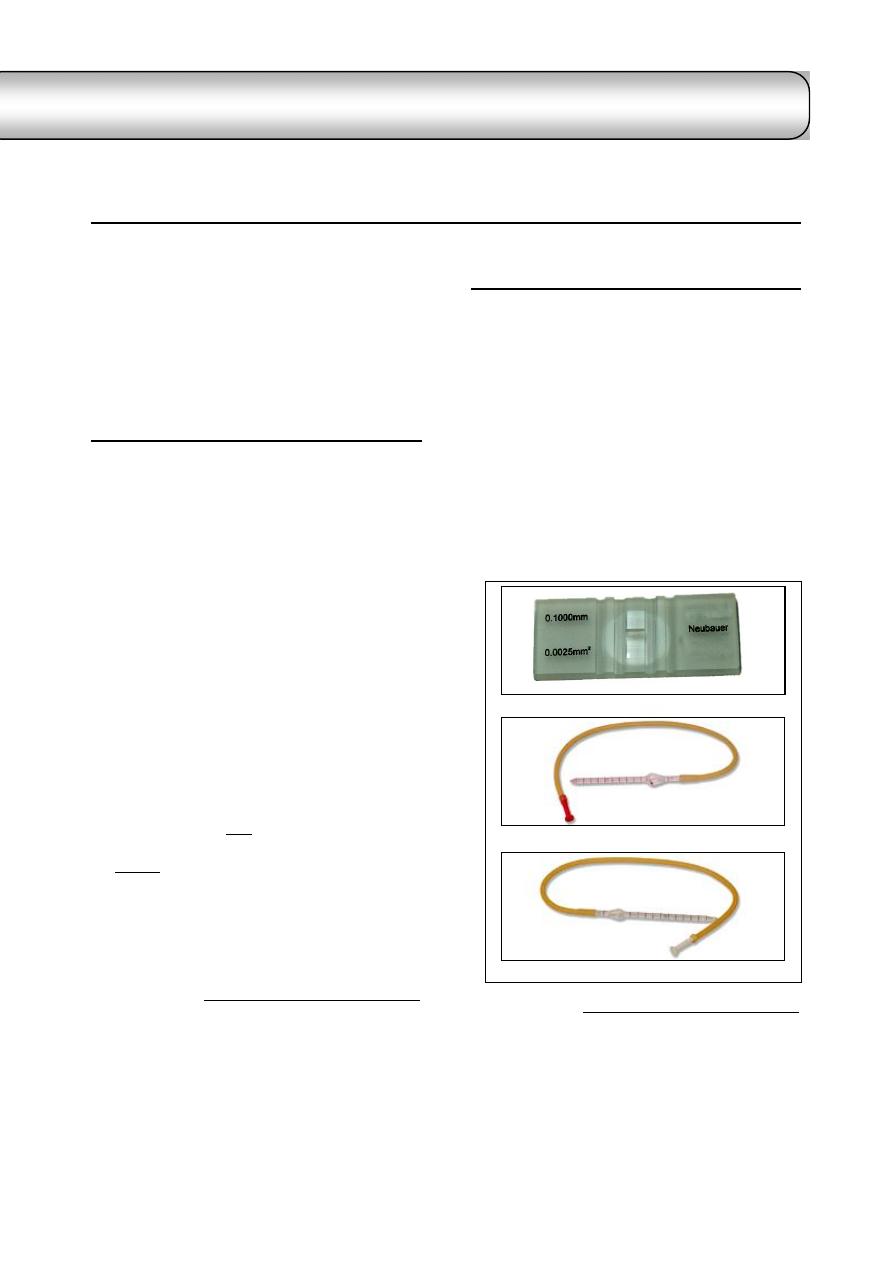
Erythrocytes are counted via hemocytometer
1
which is consist of:
Thoma blood cell diluting pipettes with
plastic mouthpiece
2
.
Double cell counting chamber with Neubauer
ruling central (Fig 2-1 a, b & c) and (Fig 2-2).
Procedure of erythrocytes count:
Blood should be carefully drawn to the 0.5
mark of the pipette.
An isotonic solution such as normal saline or
Hayem's solution
3
drawn to the mark 101 and
well mixed.
Discharged onto the hemocytometer counting
chamber and allowed to settle for several
minutes. Before the areas in the chamber are
counted, the slide should be examined under
low power to check distribution of cell in the
ruled area.
Count RBCs in five squares in the center of
the counting chamber, then multiplied by
10,000. This value represents the total
number of erythrocytes per microliter.
Note: Some difficulty may be encountered in
counting the same cell twice. One method of
avoiding duplication is to count only those cells
that touch the lower and right boundaries.
1
Further to hemocytometer method, there is photoelectric
counting method, and electronic counting methods such as
coulter analyzer.
2
Note that the red corpuscles pipette is marked 0.5 and 101
in order to give blood dilution of 1 in 200, and has red
bead. The white cell pipette is marked 0.5 and 11 for
blood dilutions of 1 in 20, and has white bead.
3
Hayem's solution consist from: sodium chloride 1.0 g,
sodium sulphate 5.0 g, mercuric 0.5 g, and distilled water
200 ml.
Leukocytes count
1.
Total Leukocytes count (TLC):
Hemocytometer
4
is used for enumeration of
total leukocytes.
Carefully blood drawn to the 0.5 mark of the
pipette.
The diluting fluid (Turck's solution)
5
is then
drawn to the mark 11 and well mixed.
Discharged onto the hemocytometer counting
chamber as done in erythrocytes count.
The total number of WBCs in four squares of
larger ruled area in the corner of the counting
chamber is determined and multiplied by 50.
This value represents the total number of
leukocytes per microliter.
4
Further to hemocytometer method, there is
electronic
method, DNA viscosity technique, examination of
wet blood film stained with new methylene blue,
and from stained blood film.
5
Turck's solution consist from: glacial acetic acid 2 ml, in
100 ml of distilled water, to which has been added 1 ml of
1% aqueous solution of gentian violet. This diluting fluid
should carefully filtered prior to use to remove particles
that might be confused with leukocytes.
Fig. (2-1) Parts of Hemocytometer
(a) Neubauer hemocytometer slide
(b) Pipette used for erythrocyte count -has red bead-
(c) Pipette used for leukocytes count -has white bead-
id23273265 pdfMachine by Broadgun Software - a great PDF writer! - a great PDF creator! - http://www.pdfmachine.com http://www.broadgun.com
8
2.
Differential Leukocytes count (DLC):
Differential leukocytes are counted by blood
film
1
. The blood film should be made from fresh
blood containing no anticoagulants (as soon as
possible after collection of the blood); otherwise,
best results are obtained if EDTA is used as the
anticoagulants
2
.
Films of blood may be prepared either on a
microscope slide or coverslip. The microscope
slide is preferable to the coverslip for routine
laboratory work, because the slides are easy to
clean and store, identify and file, while the
coverslip method is better than the microscope
slide because there are usually more suitable
fields for examination, and leukocytes are well
distributed (there are more leukocytes per field
than with slide method), and there is generally
better cell definition.
Microscope slide method:
Select good quality, clean, grease-fresh slides
.
Place a slide on a flat surface, or held by
edges between the forefinger and thumb.
1
There are other parameters can be estimated by blood film
such as erythrocytes abnormalities, platelet count, blood
protozoa. These are will discussed in the followings.
2
Bovine lymphocytes may be adversely affected within a
few hours by EDTA causing the appearance of abnormal
lymphocytes in blood films.
Place small drop of well-mixed blood near
one end of the slide by using of applicator
stick or capillary tube.
Immediately after placing blood on the slide,
place second slide "spreader" in front of the
drop of blood at an angle of approximately
30
and pull it back until it comes to contact
with the drop of blood, and the pause until the
blood spreads along the edge of the spreader
(Fig 2-3).
After the blood spreads along the edge of the
spreader, push the spreader forward smoothly
and quickly at an angle about 30
. The greater
the angle the thicker and shorter blood smear,
and the smaller the angle the thinner and
longer smear.
Dry blood film quickly by waving it in the air
.
Identify the blood film by writing in the date
and client's name, or a reference number,
along the end of smear with a pencil or the
edge of the spreader slide.
Whenever possible fix and stain blood films
immediately
3
they are prepared, otherwise fix
them in absolute methanol and then store
them in a clean box until they can be stained.
Coverslip method:
Square coverslip 22 by 22 mm of No. 1
thinness are used.
Hold a clean, dry coverslip by its edges in
one hand.
Place a small drop of blood on the center of
the coverslip.
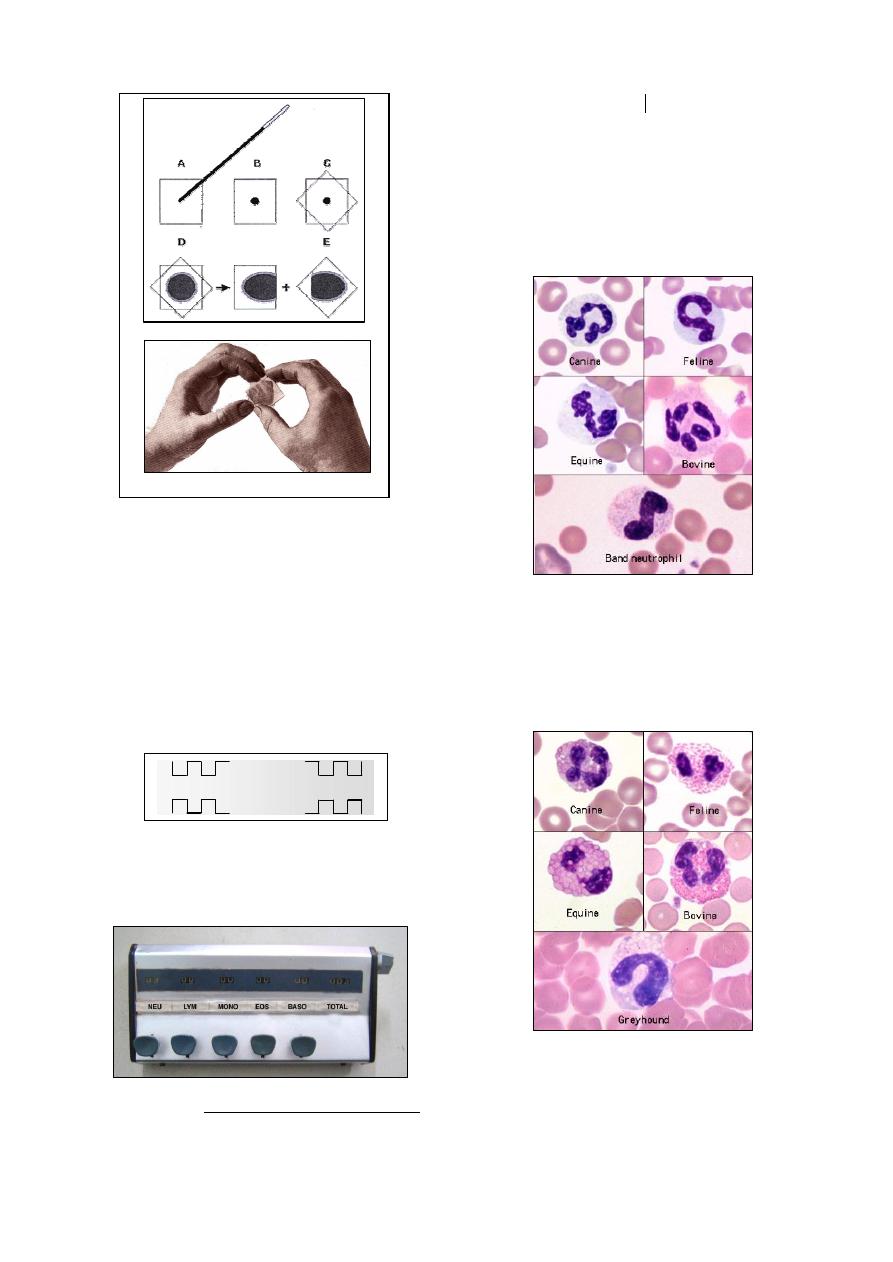
Place a second clean, dry coverslip diagonally
on the first, forming an eight-pointed star; the
blood will immediately spread.
Grasp the top coverslip by its corners and
using a smooth motion slide the two apart
(Fig 2-4), then wave the coverslip in the air to
enhance drying.
The coverslips should be identified by
placing it in a small box with the name of the
owner or number of the case on it.
3
See the appendix for the stains and their preparation.
Fig. (2-3) Procedure of microscope slide method
of preparation of blood film
W
W
W
W
R
R
R
R
R
cover slip
depth of chamber = 0.1 mm
ruled platform
raised platform
(a) Cross section of hemocytometer slide and cover slip
(b) Improved Neubauer ruling. R= squares used for
RBC count, W= squares used for WBC count
Fig. (2-2) Double hemocytometer slide and Neudauer
ruling central
9
Method of differential Leukocytes count:
The examination is made with oil-immersion
objective.
A standard procedure, such as battlement
(meander) method, should be employed in
examining blood smear for cytological
differentiation.
Count and differentiate 50 leukocytes at each
of the corner of the film
1
(Fig 2-5).
The individual cells can be tabulated in
columns on a prepared sheet of paper, or a
blood cell counter (fig 2-6).
1
The minimum number of leukocytes counted in arriving at
the differential count is 100, but if abnormal cells are
present, 200 or more cells should be enumerated.
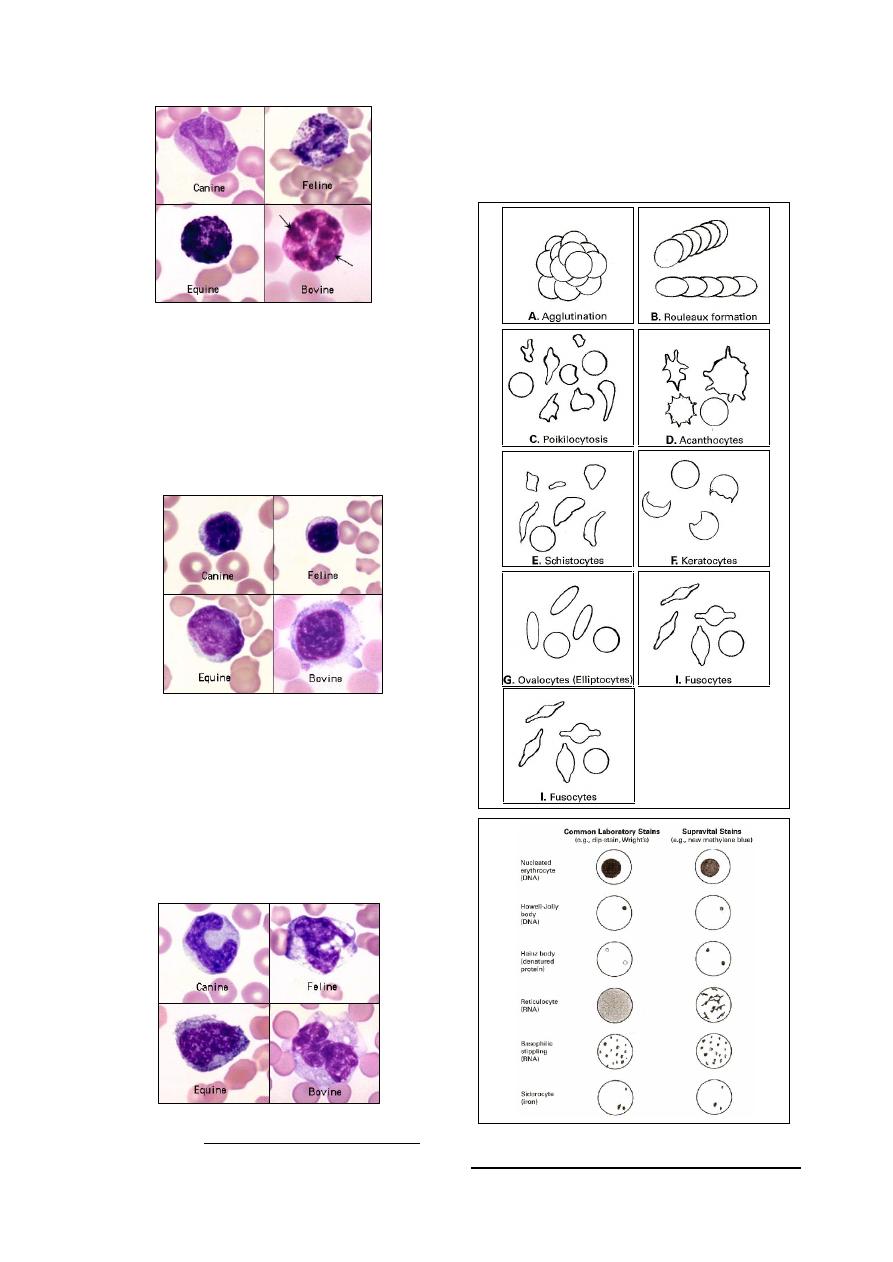
The characteristics of l
eukocytes as follows:
1.
Neutrophils:
Mature cell has either mono-lobular nucleus,
or its nucleus may have up to five lobes
which are joints by thin strands. In correctly
stained blood films, they have faintly
acidophilic cytoplasm with a deeply staining
nucleus (Fig 2-7).
2.
Esinophisls:
The cell has numerous small, regularly
cellular, oranged-red granules. Nuclei of
mature cell are shorter and less segmented
than neutrophil nuclei and the cytoplasm, if
visible, is pale blue
(Fig 2-8)
.
3.
Basophisls:
Purple staining granules scattered throughout
the cytoplasm. They occur rarely in the blood
of the dog and cat (Fig 2-9).
Fig. (2-4) Procedure of coverslip method of
preparation of blood film
Fig. (2-5) Meander method of blood film examination
Fig. (2-6) blood cell counter
Fig. (2-7) Neutrophils of different animals
Fig. (2-8) Esinophils of different animals
(a) Steps of the method
(b) Technique of the method
10
4.
Lymphocytes:
They are occur in two varieties: large size,
and small size
1
(less than 10
µm in diameter).
The cell almost
circular
or slightly intended
nucleus, and a narrow peripheral zone of
blue-stained cytoplasm which may contain a
group of comparatively large, dark blue or
red (azurophilic) granules (Fig 2-10).
5.
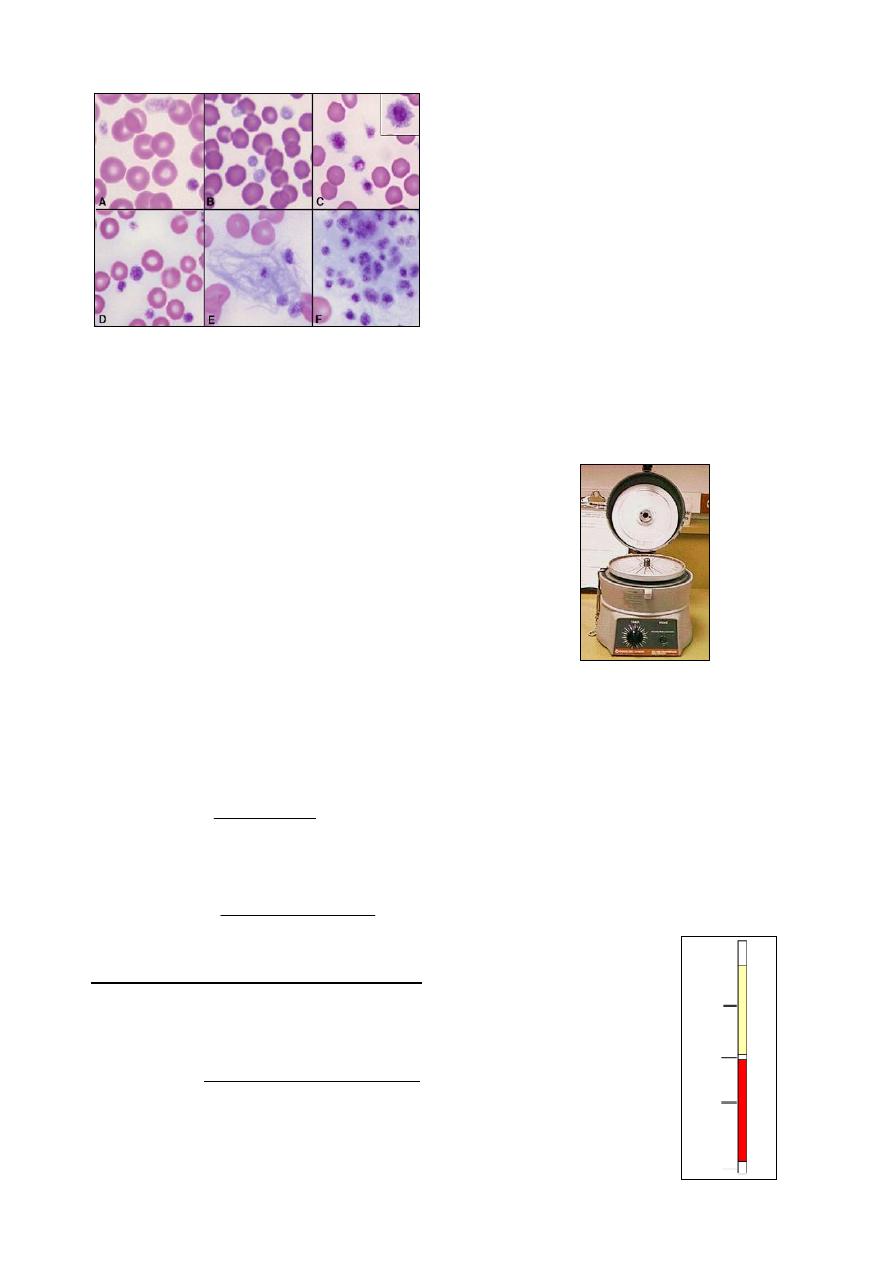
Monocytes:
They are the largest cells in the leukocyte
series,
their
nuclei
are
more
varied
morphologically, being oval, elliptical or
horse-shoe shaped and even segmented or
presenting a folded appearance. The cyto-
plasm is faintly granular, stains distinctly
basophilic and may have a vacuolated or
foamy appearance (as in cattle) (Fig 2-11).
1
The commonest type of lymphocytes are small size.
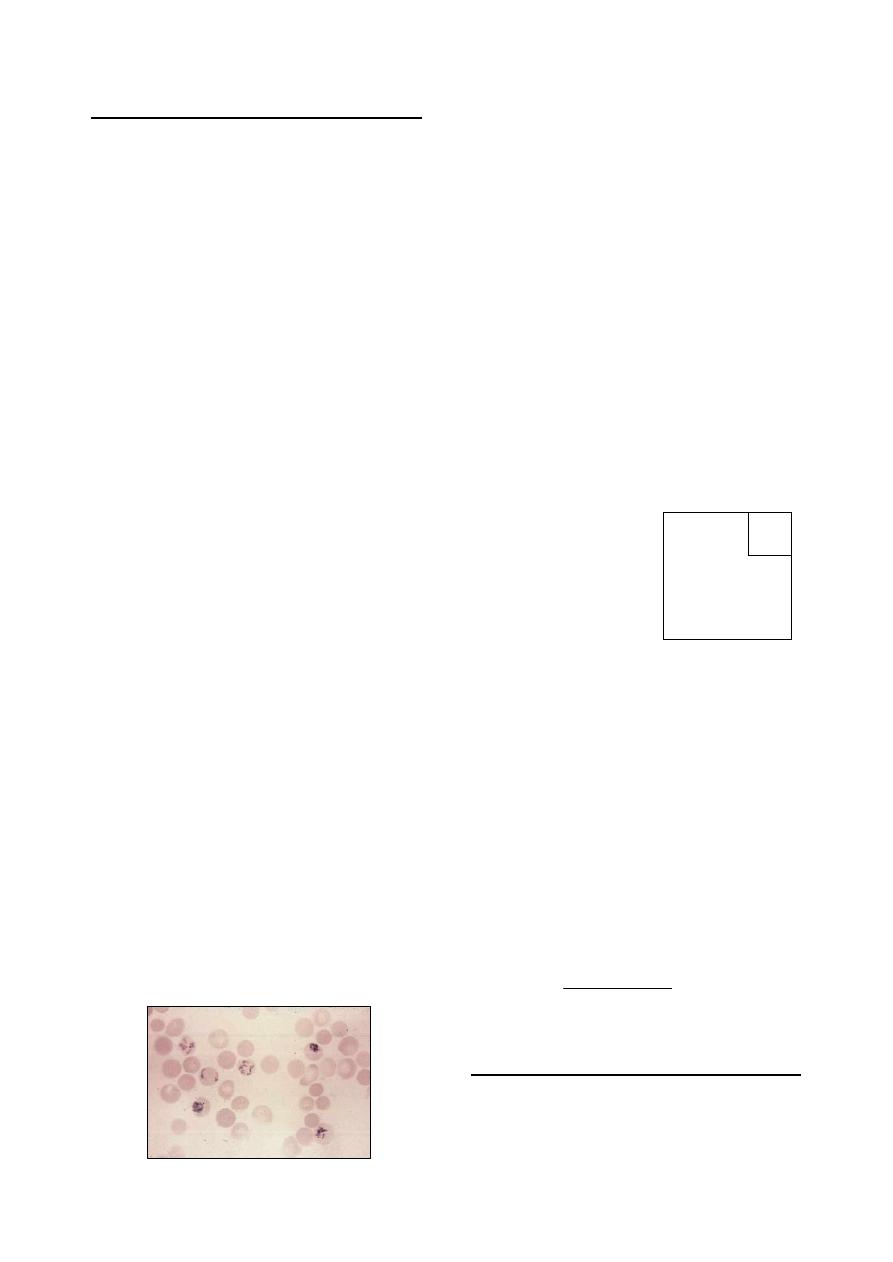
Note:
During examination of blood films for diffe-
rential leukocytes count, abnormallities in the
appearance of erythrocytes can be indicated (Fig
2-12, 2-13).
Fig. (2-9) Basophils of different animals
Fig. (2-10) Lymphocytes of different animals
Fig. (2-11) Monocytes of different animals
Fig. (2-12) Examples
of variations of the
appearance of eryth-
rocytes.
Fig. (2-13) Appearance of cellular invclusions inside
the erythrocytes, stained with different stains.
11
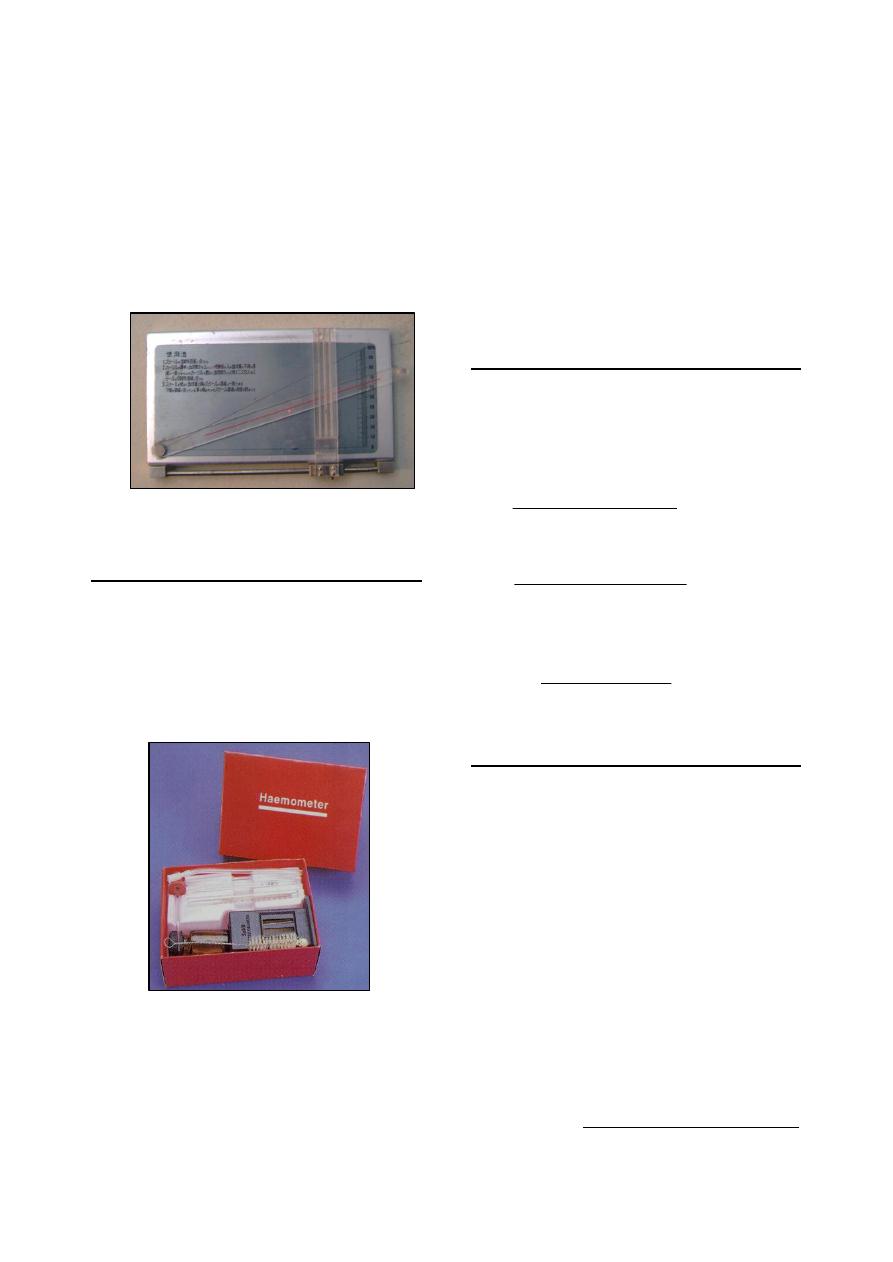
Reticulocytes count
Reticulocytes are juvenile red cells. They
contain remnants of ribosomes and ribonucleic
acids which were present in larger amounts in
their nucleated precursors.
Because the number of reticulocytes in the
peripheral blood is a fairly accurate reflection of
erythropoietic activity, a reticulocyte count is
one of the essential procedures in diagnostic
haematology.
The most immature reticulocytes are those
with the largest amount of precipitable ribosomal
material, whilst in the least immature only a few
dots or strands are seen.
Method for the Reticulocyte Count:
Staining solution
Reticulocytes are best demonstrated by use of
supra-vital stains. The most commonly used are
new methylene blue and brilliant cresyl blue.
1.0 gm of New methylene blue or Azure B is
dissolved in 100 ml of citrate-saline solution
(1 part 3% tri-sodium citrate to 4 parts 0.85%
saline).
1.0 gm of brilliant cresyl blue is dissolved in
100 ml of physiological saline.
After dissolving the dyes, the solution is
filtered and is then ready for use. Store at 40 C.
Staining method
Add two or three drops of stain into a tube.
Add approximately equal volume of patient's
blood. If anaemic use a larger proportion of
blood; and use a smaller proportion of blood
if polycythaemic.
Mix and leave in water bath or incubator at
37
˚C for 15-20 minutes. At the end of this
time, resuspend the red cells by gentle mixing
and make a thin film in the usual way.
When dry, the films are examined without
counter-staining.
Reticulocytes stained in this manner have a
bluish stippling in the center of the cell. The
quantity of bluish staining material in any
reticulocytes may vary depending upon the
stage of maturation (Fig 2-14).
Counting
Choose an area of the field where the cells are
undistorted and the staining is good.
Using the x100 oil-immersion lens, count the
number of reticulocytes seen per 1000 red
cells.
Counting the red cells can be helped by
inserting into the eyepiece a paper or
cardboard diaphragm in the centre of which
has been cut a small square to reduce the
optical field.
An easier labour-saving method is to use a
Miller squares, which inserted in the eyepiece
of the microscope. Miller square consists of a
large square inside which in one corner is a
smaller square of one-ninth the area of the
large square (Fig 2-15). Provided that the red
cells are evenly distributed, the red cells need
to be counted only in the small square as
there will be approximately nine times that
number in the complete large square.
Calculation
No. of reticulocytes in (n) fields = x
when: (n)= number of counted fields
Average number of cells in small squares = y
Total number of cells in (n) fields = 9
×y×n
Reticulocyte percentage = x / (9
×y×n)
Absolute reticulocyte count =
% Reticulocytes x RBC (x10
12
/L)
Usually more convenient to report as x10
9
/L.
As an example:
reticulocytes per 1000 red cells = 18.
the percentage of reticulocytes =
18/1000
× 100% = 1.8%
RBC = 4.5 x 10
12
/L
Absolute reticulocyte count:
Thrombocytes count
The total number of thrombocytes "platelets"
in the blood can be determined directly by
hemocytometer method, or indirectly by exami-
nation of stained blood film (Fig 2-16).
9
12
10
81
100
10
5
.
4
8
.
1
Fig. (2-14) reticulocytes stained with new methylene blue
Fig. (2-15) Miller squares.
Reticulocytes only are counted
within the boundary of the
larger square, but all RBCs are
counted within the boundary
of the smaller square.
12
1.
Hemocytometer method:
Direct counting of platelets is performed in
the same manner as for erythrocytes counting.
Blood should be carefully drawn to the 0.5 mark
of the pipette, and diluting fluid (Rees-Ecker)
1
drawn to the mark 101, well mixed and then
discharged onto the hemocytometer counting
chamber which should be placed ia a petri dish
containing a piece of moistened filter paper ad
allowed to stand for up to 20 min. Platelets
2
are
counted in the entire ruled area on each side of
the counting chamber. Multiply the number of
platelats in the ruled area by 1000 to give total
thrombocytes/
µl.
2.
Indirect method:
This method performed from a stained blood
film as that prepared for routine hematological
examination.
A count is made of platelets accompanying
RBC in the same way as for DLC.
If the TLC is known, the number of platelets
may compared with the number of WBC:
If the total RBC is known, the number of
platelets may compared with RBC number:
Packed Cell Volume "Hematocrit"
The packed cell volume (PCV), or hematocrit
(HCT) represents the proportion of blood
composed of red blood cells, expressed as %
(vol/vol).
1
Rees-Ecker fluid consist from: sodium citrate 3.8 g, 40%
formaldehyde 0.2 ml, brilliant cresyl blue 0.05 g, distilled
water 100 ml.
2
Platelets will appear as rod- or oval-shaped bodies,
approximately one-half the diameter of erythrocytes.
It is the quickest and most accurate measure
of the red cell component of blood. Micro-
hematocrit is the suitable method for routine use.
The procedure as follows:
Thoroughly mix the blood samples and fill
capillary
tubes
to approximately 3 quarters of
their length with the samples.
Wipe excess blood from the outside of each
tube, then seal the unfilled end of the tube
using heat or by pushing gently into the
plastic material such as Cristaseal or wax.
Make sure that the top of the clay can be
easily seen, and check that the seal has a flat
surface. Discard any tube where the upper
surface of the clay is noticeably uneven.
Place the capillary tubes in the grooves of the
base plate of the microhematocrit centrifuge
with the sealed end pointing outwards. Note
the position and identity of each tube (Fig 2-
17).
Firmly secure the inner lid of the centrifuge,
then close the outer lid. Centrifuge for five
minutes at 12000 g (but see below).
As soon as the centrifuge has stopped,
remove the tubes and stand them upright until
they are read. It is important that the cells are
not allowed to settle and that reading takes
place with the minimum of delay. If delay by
more than a few minutes is unavoidable, seal
the top of the tubes as well to avoid
evaporation of the plasma. The capillary tube
after centrifugation will be as (Fig 2-18).
count
WBC
Total
WBC
platelets
of
number
platelets
of
number
100
1000
/ l
RBC
platelets
of
number
platelets
of
number
Fig. (2-17) Microhematocrit centrifuge
Fig. (2-18) Capillary tube after
centrifugation:
(1)
Wax plug.
(2)
Packed red cells (mass
of erythrocytes).
(3)
Buffy coat (leukocytes
and thrombocytes).
(4)
Plasma.
(1)
(2)
(3)
(4)
- canine
- equine
- feline
- bovine
- fibrin clump
- platelet clump
Fig. (2-16) Thrombocytes of different animals
13
Read the PCV by a special reader (Fig 2-19)
as follows:
Place the bottom of RBC column (which
is just above the sealed end) on the box
line of the reader.
Move the reader until the top of the
plasma layer exactly meets upper line.
Observe a line on the reader which passes
across the top of the RBC layer.
Read the PCV from the scale at the point
where this line meets it.
Hemoglobin determination
Methods for hemoglobin determination
are many and varied
such as oxyhemoglobin
method, cyanmethaemoglobin method and direct
matching methods.
The manual methods for
determining blood hemoglobin is the acid
hematin method that use Sahli hemoglobino-
meter (Fig 2-20).
The blood is mixed with dilute hydro-chloric
acid which hemolyzes the red cells, disrupting
the integrity of the red cells' membrane and
causing the release of hemoglobin, which is
converted to a brownish-colored solution of acid
hematin. The acid hematin solution is then
compared with a color standard.
Add N/10 hydrochloric acid to the 20 mark
on the graduated tube.
Fill the pipette with the blood to the mark 20
µl, and expelling it into the acid solution,
followed by rinsing out the pipette to ensure
thorough mixing.
The tube and contents should be removed
from bright light and left until acid hematin
has developed.
Dilute the contents with distilled water until
the color matches that of the glass standard.
Erythrocytes Indices
These values are of particular importance in
determining the morphological type of anemia,
and normal erythrocyte mass or existence of
hemoconcentration.
1- Mean Corpuscular volume (MCV):
2- Mean Corpuscular Hemoglobin (MCH):
3-
Mean Corpuscular Hemoglobin Concentration
(MCHC):
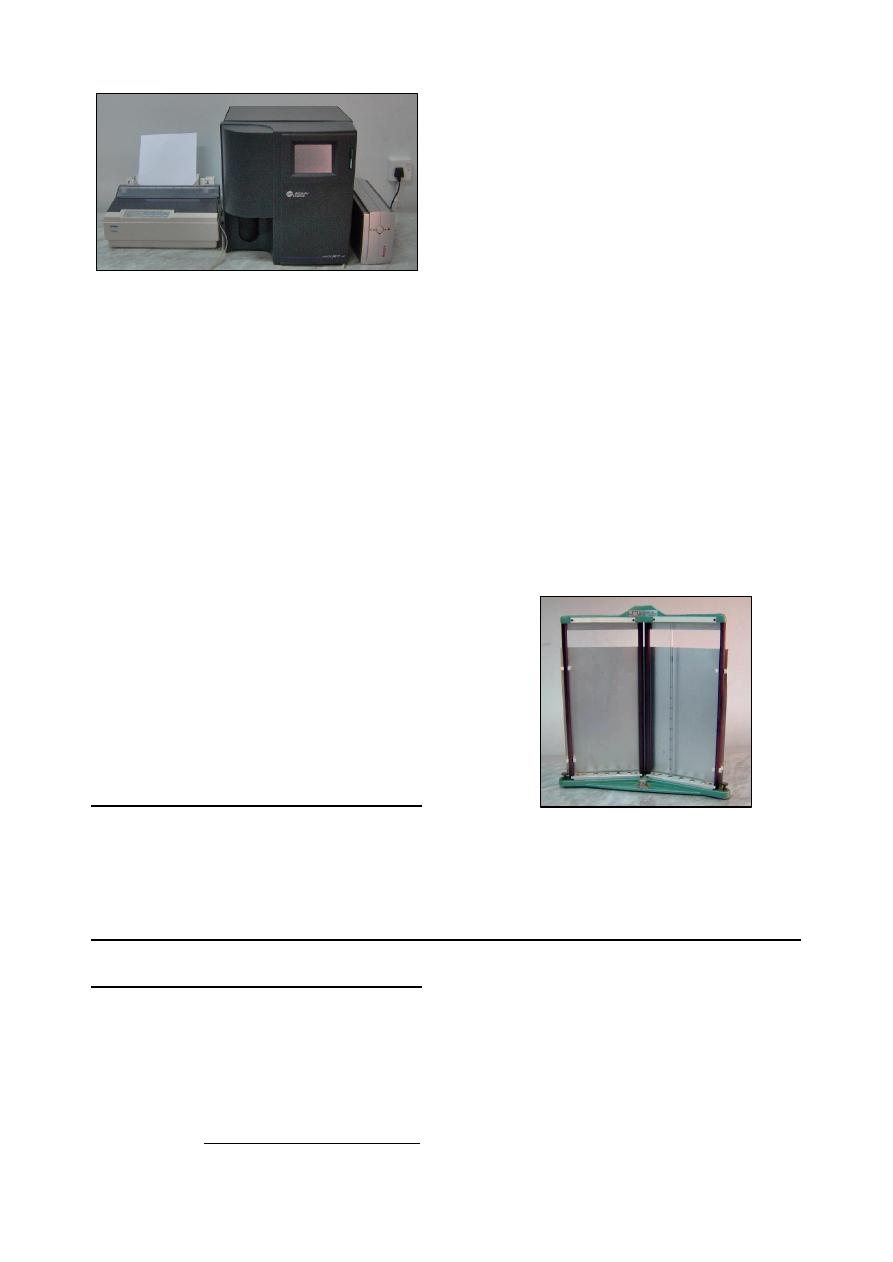
Blood Counts by Electronic Analyzer
Many electronic counters are available.
Earlier models required the users to calibrate the
counters individually and to identify the
appropriate settings for distinguishing red cells
from leucocytes and platelets. Most modern
analyzers include measurement of RBC , WBC,
platelets, haemoglobin, packed cell volume and
absolute values (MCV, MCH and MCHC).
Coulter A
C.
T diff Analyzer
1
:
It used to analyze blood contents for
hematology during 16 seconds. It is consist from
four parts (Fig 2-21):
Probe, draw about 12
µl of blood.
Internal analyzing system with calculator and
special diluting fluid.
Digital screen.
Printer.
1
This analyzer produced by Beckman Co., USA, model
2004.
)
(
.
)
(
)
/
(
10
)
(
2
s
femtoliter
fl
mm
millions
count
RBC
Total
numbers
whole
PCV
MCV
)
(
.
)
(
)
/
(
10
)
/
(
2
picogram
pg
mm
millions
count
RBC
Total
dl
gm
Hb
MCH
dl
gm
numbers
whole
PCV
dl
gm
Hb
MCHC
/
)
(
)
(
100
)
/
(
Fig. (2-19) Microhematocrit reader
Fig. (2-20) Sahli hemoglobinometer
14
General principles:
It is act by detecting and measuring changes
in electrical resistance as follows:
when a particle, such as a cell, in a
conductive liquid passes through a small
aperture, impedes the current and causes a
measurable pulse.
The number of pulses signals the number of
particles.
The height of each pulse is proportional to the
volume of that particle.
The analyzer has a spectrophotometer to
measure Hb at wave length 525 nm.
The computer:
o
Computes Hct "PCV", MCH, MCHC,
LY#, MO#, and GR#.
o
Derives MCV and RDW from the RBC
histogram.
o
Drives MPV and Plt count from the
platelet histogram.
o
Drives LY%, MO%, and GR% from the
WBC histogram.
Erythrocyte Sedimentation Rate (ESR)
When blood containing anticoagulant is
allowed to stand in a perpendicular tube, the
erythrocytes sink because they are heavier than
the plasma in which they are suspended. The
speed with which erythrocytes fall in the blood
of normal animals is relatively slow, but in
animals with inflammatory diseases in which
there is tissue necrosis and degeneration, speed is
increased. This alteration in suspension stability
probably results from changes that occur in the
physiochemical properties of the erythrocyte
surfaces and the plasma.
Mix the blood well and draw the sample into
clean dry Westergren tube that has a length of
about 30 cm and a bore of 2.5 mm
Place the tube into the stand, taking care that
the base is firmly positioned on the base pad
to prevent leakage.
Adjust the rack so that the tube rests in an
exactly vertical position.
Leave undisturbed for 20 minutes in horses, 1
hours in dog and cats, 24 hours in ruminants.
It is conventional to set up sedimentation
rates at room temperature (18 - 25
o
C).
At the end of the time, read the height of clear
plasma above the upper margin of the column
of sedimenting cells to the nearest millimeter
(Fig 2-22).
H
H
e
e
m
m
o
o
s
s
t
t
a
a
s
s
i
i
s
s
a
a
n
n
d
d
C
C
o
o
a
a
g
g
u
u
l
l
a
a
t
t
i
i
o
o
n
n
o
o
f
f
B
B
l
l
o
o
o
o
d
d
:
:
Whole blood coagulating time
The whole blood coagulating time (Clotting
time) can be determined by several techniques. A
simple method is the capillary tube method:
The skin is punctured, the first drop of blood
is wiped away, and the capillary tube
1
is filled
with blood noting the time when blood first
appears in the capillary tube.
1
approximately 15 cm long and 1-1.5 mm diameter is used.
Holding the tube between the thumb and
index finger of both hands.
Gently break off small pieces every 30
seconds until a strand of fibrin is seen
extending across the gap between the two
broken ends of the tube.
The interval between the appearance of blood
and the appearance of a fibrin strand is the
clotting time.
Fig. (2-21) Coulter A
C.
1 diff analyzer
Fig. (2-22) Westergren tube placed in ESR stand

15
Bleeding time
Determination of bleeding time is a simple
and sometimes useful tool for evaluation the
efficiency of the capillary-platelet aspect of
hemostasis. The technique as follows:
With the animal suitably restrained, or even
anesthetized, carefully clip an area of skin
where there are comparatively few hairs.
Wash the area thoroughly with soap and
water, and dry it.
Using a sterile disposable lancet, swiftly
make 2 small puncture wounds in the skin a
short distance apart avoiding any major blood
vessels.
Start the stop-watch. At 30 seconds intervals,
gently touch the drop of blood on each wound
with a piece of filter paper. Take care not to
touch the edge of the wound because this may
dislodge the platelet plug.
When no spot of blood appears on the filter
paper, read the time. Accept the longer of 2
times as the bleeding time.
Laboratory tests for coagulation defect
(specific techniques):
1.
coagulation time.
2.
bleeding time.
3.
platelet counting and evaluation.
4.
fibrinogen
1
.
5.
one-stage prothrombin test.
Tests for measuring intrinsic system factors:
1.
partial thromboplastin time.
2.
prothrombin consumption.
3.
thromboplastin generation test (TGT).
These tests can be determined by using
specific kits that should be added to the samples
according to the manufacturer's directions.
References
Bush, B. M. (1975). Veterinary laboratory manual.
1st ed., The Gresham Press, London.
Coles, E. H. (1986). Veterinary clinical pathology. 4
th
ed., WB Saunders Co Philadelphia, London.
Jain, N. (1986). Schalm's Veterinary Hematology. 4
rd
ed., Lea and Febiger, Philadelphia, U.S.A.
Kelly, W. R. (1984). Veterinary Clinical Diagnosis.
3rd ed. Bailliere Tindall. London.
1
Fibrinogen is a plasma protein produced by the liver. It
functions in the clotting mechanism and plays a
significant role in the body's defense by moving into
extravascular spaces to assist in localization of disease
processes. Estimation of fibrinogen level have been found
useful in evaluation of the inflammatory response. In
some species, such as ruminants, fibrinogen determination
is preferred to an ESR estimation.
Meyer, D. J. & Harvey, J. W. (2004). Veterinary
laboratory medicine: interpretation & dia-
gnosis. 3rd ed., Saunders, Elsevier Inc, USA.
WHO (2006). Blood Safety and Clinical Technology:
Guidelines on Standard Operating Proce-
dures for haematology.

16
17
C
C
h
h
a
a
p
p
t
t
e
e
r
r
3
3
B
B
o
o
n
n
e
e
M
M
a
a
r
r
r
r
o
o
w
w
E
E
x
x
a
a
m
m
i
i
n
n
a
a
t
t
i
i
o
o
n
n
Examination of the bone marrow may be of
valuable diagnostic tool in the differential diag-
nosis of diseases characterized by alterations in
the peripheral blood. Such an examination is
especially indicated in diseases associated either
with a decrease or increase in cellular elements
or with appearance of abnormal cellular forms.
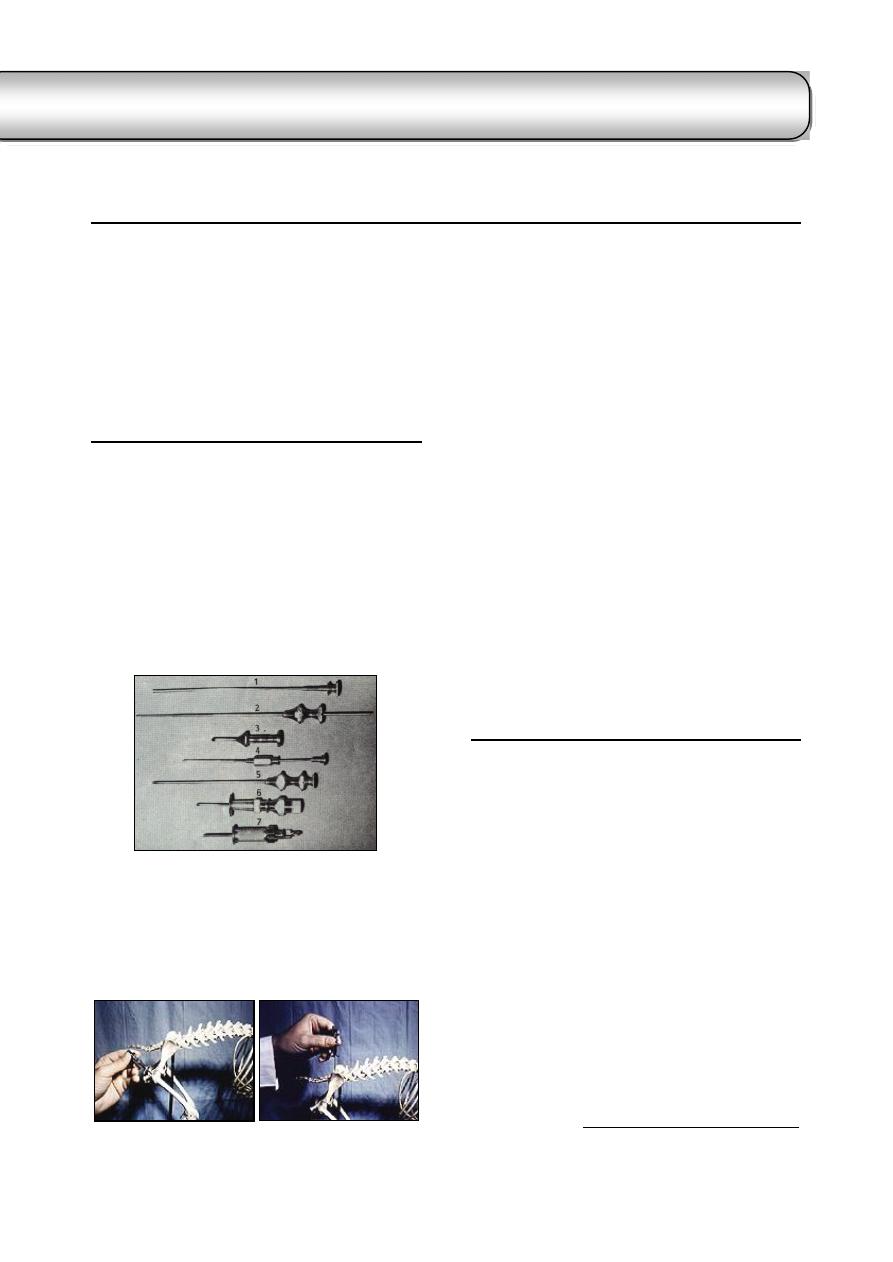
Bone Marrow Aspiration
Equipments needed for sterile aspiration:
Syringe (20 ml) with metal tip.
2 syringe (10 ml) with metal tip.
2-3 hemostats.
Knife handle and blades.
2 bone marrow needles, there size and length
will depend upon the species of animal, see
(Fig 3-1).
Numerous clean slides (about 20).
Different surgical equipments, and local or
general anesthesia.
Sites used for bone marrow aspiration:
Bone marrow sample is readily obtained either
from trochanteric fossa or iliac crest. It can be
also obtained from sternum or humerus.
Steps of bone marrow aspiration:
Under general or local anesthesia and after
aseptic surgical preparation of the surface, a
short skin incision is made to facilitate penet-
ration.
A sterile aspiration needle with a stylet is
passed through the skin and muscle. When the
needle is forced into the bone by steady
pressure accompanied by rotation. When the
needle become firmly embedded,
it has usually
penetrated the medullary cavity.
A stylet is utilized to free the lumen of the
needle of tissue and bone particles, and a dry
20 ml glass syringe is fitted to the needle.
The plunger of the syringe should be pulled
out a considerable distance to establish a
vacuum and withdraw marrow fluid. Only a
small amount of fluid (0.5-1.0 ml) should be
aspirated.
As soon as fluid appears, vacuum should be
discontinued, as further negative pressure may
result in rupture of a sinusoid and contamina-
tion with peripheral blood.
Preparation of Bone Marrow Smears
As soon as possible after aspiration, prepare a
bone marrow smear similar to that used in
preparation of blood film
1
.
A few drops of marrow are placed on the end
of a slide and excess blood is aspirated back
into the syringe. If tissue fragments are aspi-
rated, a "squash" preparation is made by
placing a second slide firmly down on top of
the marrow particles and very carefully
drawing the two slides apart.
Slides should be waved in the air for rapid
drying.
Bone marrow smear stains with any good
polychrome stain, such as Wright's, Wright-
Giemsa,
or May-Gr
ünwald-Giemsa.
The smear
should be exposed to stain for a longer period
of time than is necessary for peripheral blood
smear.
1
If desired, some aspirated marrow may be placed into a
tube containing anticoagulant for later examination.
Fig. (3-1) Needles used for bone marrow collection
Fig. (3-2) Anatomical sites for bone marrow aspiration
(a) trochanteric fossa, (b) iliac crest.
(a)
(b)
id23357078 pdfMachine by Broadgun Software - a great PDF writer! - a great PDF creator! - http://www.pdfmachine.com http://www.broadgun.com
18
Preparation of Bone Marrow Sections
Bone marrow sections may be also prepared
by one of the following methods:
Remove the amount of marrow required for
preparation of smears and permit the
remainder of the aspirate to clot in the syringe.
This clot is placed in a fixative for sectioning.
Collect the bone marrow in an anti-coagulant,
place it on a slide, and the excess blood is
removed from the edge of the slide with
gauze. Place the specimen in a fixative for
centrifugation and later sectioning.
Examination of Bone Marrow Film
In general, there are two ways in which a
marrow film is examined:
Entails scanning the slide under the low power
of the microscope, then under the high dry
objective, and finally under oil immersion
magnification. This method give the operator
possibility to formulate impressions concern-
ing the number and distribution of cells.
Entails making a differential count and calcu-
lating the percentage of each cell type. A
minimum of 500 cells should be examined,
and it is preferable to count 1000 cells.
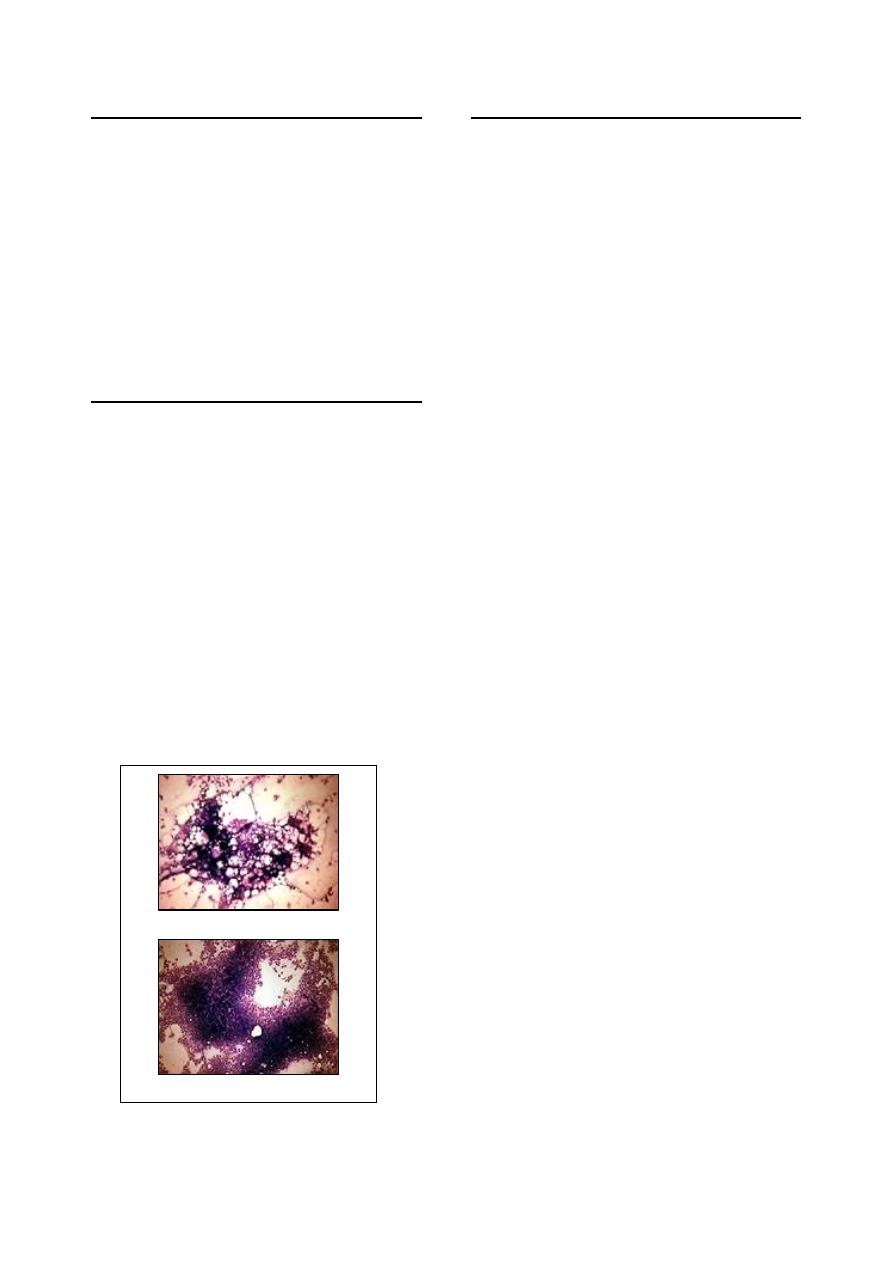
The cellularity of the smear can be evaluated
using low power magnification. Older animals
have more fat, while younger animals have less
fat (Fig 3-3).
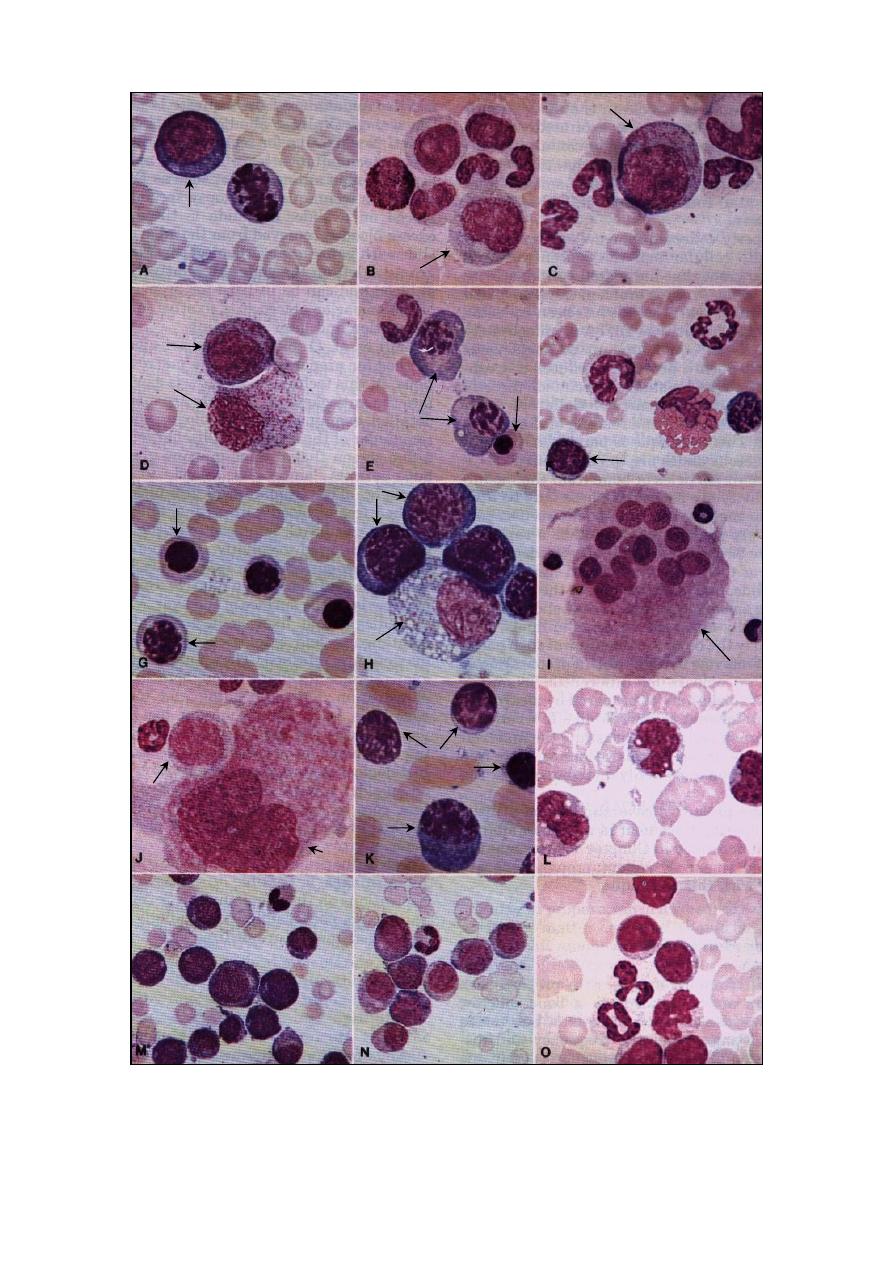
Cell Identification:
All cells that develop in bone marrow alter
morphologically as they progress from primitive
to mature types. Primitive cells are usually larger
than mature cells, and the nuclei of these young
cells are relatively large in relation to the amount
of cytoplasm.
Erythrocytes series:
The developmental stages (from immature to
mature) of the erythrocytes are:
rubriblast
→ prorubricyte → rubricyte (from
basophilic
→ polychromatophilic → normo-
chromic)
→ metarubricyte → reticulocyte →
erythrocyte.
Leukocytes series:
(1) Granulocytic series:
The developmental stages (from immature to
mature) of the granulocytes are:
myeloblast
→ progranulocyte → myelocyte →
metamyelocyte
→ band cell → segmented
granulocyte.
(2) Lymphocytic series:
Lymphocytes are formed in lymphoid tissues
in many parts of the body, and a few them are
formed in the marrow. The developmental stages
(from immature to mature) of the lymphocytes
are:
lymphoblast
→ prolymphocyte → lymphocyte.
(3) Monocytic series:
Young forms of monocytes, particularly
monoblasts, may be difficult to differentiate
from other immature cells in marrow.
Other cells:
There are other cells may be found in marrow
smear, these are: reticulum cells, plasma cells,
tissue esinophils, tissue basophils, osteoblasts,
osteoclasts.
Myeloid to Erythroid Ratio (M:E):
The most significant information available
following bone marrow examination is the ratio
of myeloid to erythroid cells (M:E). This ratio is
calculated by dividing the number of all granulo-
cytic cells (myeloid) of bone marrow by the total
number of nucleated erythroid cells.
Interpretation of the M:E ratio can be made
only in relationship to the total leukocyte count
of peripheral blood.
The M:E ratio increases when there is:
o
Increase in granulocyte production.
o
Erythroid hypoplasia.
The M:E ratio decreases when there is:
o
decrease in granulocyte production.
o
Erythroid hyperplasia.
Fig. (3-3) Cellularity of the bone marrow smear
(a) hypocellular
(b) hypercellular.
19
Fig. (3-4) Different cells of the bone marrow smear. A- blast cell (500x), B- neutrophilic myelocyte (500x), C- progranulocytes (500x),
D- 1: early progranulocytes, 2: granular histiocytes (500x), E- 1: plasma cell, 2: metarubricyte (500x), F- rubricyte (500x), G- 1:meta-
rubricyte, 2: polychromic rubricytes (500x), H- 1: neutrophilic myelocyte, 2: basophilic rubricyte (670x), I- multinucleated osteoclast
(200x), J- 1: megakaryocyte, 2: neutrophilic myelocyte (500x), K- 1: equine lymphocytes, 2: late rubricyte, 3: plasma cell (670x), L- 3
monocytes, note their vacuolated cytoplasm (500x), M- immature mononuclear cell with a basophilic cytoplasm (peripheral blood film
330x), N- immature mononuclear cell (330x), O- peripheral blood film with lyphosarcoma characterized by presence of large
lymphocytes.
1
2
1
2
F
1
2
1
2
1
2
1
2
3

20
References
Coles, E. H. (1986). Veterinary clinical pathology.
4th ed., WB Saunders Co Philadelphia,
London, Toronto.
Elaine Anthony CVT. Online class Animal Lab.
Procedures II. webpage/m.kennedy/5/99

21
C
C
h
h
a
a
p
p
t
t
e
e
r
r
4
4
C
C
l
l
i
i
n
n
i
i
c
c
a
a
l
l
B
B
i
i
o
o
c
c
h
h
e
e
m
m
i
i
s
s
t
t
r
r
y
y
Evaluation of chemical components of blood
has become an important aid in formulation of an
accurate diagnosis,
prescription of proper therapy
and documentation of the response to treatment.
Most chemical assays measure the level of a
dissolved
substance normally carried in the blood
(plasma) or the amount of a substance not nor-
mally found in blood, which has been released
into the blood from damaged or destroyed cells.
Accurate results from chemical analyses are
dependent upon the care with the sample is
collected and procedures are conducted.
Serum or plasma is preferred to whole blood
for most determinations of chemical constituents.
Anti-coagulants present in plasma may interfere
with tests, also serum less likely to show
hemolysis than plasma; therefore, serum should
always be submitted unless plasma is requested.
Panel of Biochemical Analyses
Biochemical analyses accomplish to evaluate
one or more of the followings:
1- Plasma proteins:
Total protein.
Albumin, and Albumin to globulin ratio.
Fibrinogen.
2- Electrolytes:
Sodium.
Potassium.
Chloride.
3- Minerals:
Calcium.
Phosphorus.
Magnesium.
Copper.
Cobalt.
Selenium.
Iron.
Zinc.
4- Acid-base balance:
Bicarbonate (HCO
3
–
).
Carbonic acid (H
2
CO
3
).
5- Nitrogenous substances:
Blood urea nitrogen (BUN).
Creatinine.
Ammonia.
6- Carbohydrate metabolism:
Glucose.
Glycated proteins.
Ketone bodies:
o
Acetone.
o
Acetoacetic acid.
o
Betahydroxybutyric acid.
7- Bilirubin and fat metabolism:
Bilirubin (total, direct and indirect).
Bile acids: principally
o
Cholic acid.
o
Deoxycholic acid.
o
Chenodeoxycholic acid.
o
Lithocholic acid.
Cholesterol.
Triglycerides and fatty acids.
8- Plasma enzymes:
Creatine phosphokinase (CPK).
Alkaline phosphatase (ALP).
Aspartate aminotransferase (AST; GOT).
Alanine aminotransferase (ALT; GPT).
Gamma-glutamyl transferase (GGT).
Sorbitol dehydrogenase (SDH).
Lactate dehydrogenase (LDH).
Glutathione peroxidase (GSH-Px).
9- Others:
Vitamins, such as: vit. A, vit. E and vit D
3
.
Hormones, such as: thyroid hormone,
parathormone and calcitonin.
Preparation of Solutions
Most reagents are available from a variety of
commercial sources. However, one must take
care to insure that these solutions retain their
activity and chemical composition, as solutions
deteriorate with age and are no longer usable in
chemical analyses. Commercially manufactured
reagents should be stored according to the manu-
facturer's directions and should be discarded
when outdated.
Nowadays, kits have been developed to
include all chemical reagents needed for a
specific determination. Kits should be added to
the samples according to the manufacturer's
directions.
id23414203 pdfMachine by Broadgun Software - a great PDF writer! - a great PDF creator! - http://www.pdfmachine.com http://www.broadgun.com
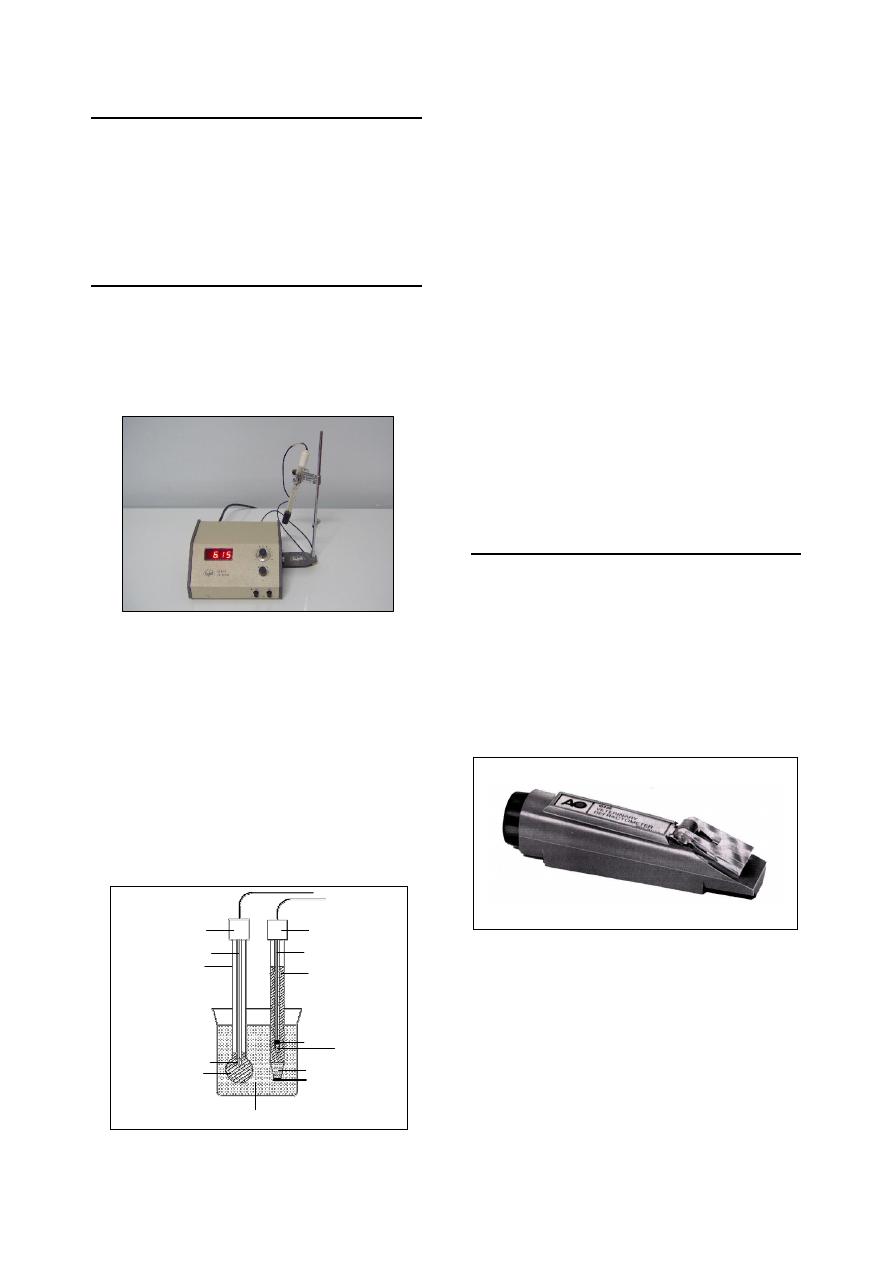
22
Equipments of Biochemical Analyses
There are many of equipments use for bio-
chemical analysis, some them are pipettes (both
graduated pipettes and automatic pipettes),
volumetric flasks, graduated cylinders, devices
use for colorimetry and other measurements.
pH meter
The most convenient and reliable method for
measuring pH is by the use of a pH meter (Fig.
4-1), which measures the electromotive force
(e.m.f.) of an electrochemical cell formed from a
reference electrode, the test solution, and a glass
electrode sensitive to hydrogen ions (Fig. 4-2).
Glass electrode:
Consists of a very thin bulb blown onto a hard
glass tube. Inside the bulb is a solution of HCl
connected to platinum wire (Pt wire) via a
sliver-sliver chloride electrode (Ag.AgCl)
which is reversible to H
+
.
Calomel reference electrode:
Consists of porous plug, KCl, calomel paste,
mercury, saturated KCl and Pt wire.
Some pH meters have the glass and reference
electrodes combined in one unit (not separated).
Notes:
New electrodes must be soaked in 0.1 mol/
1 HCl or distilled water for several hours
before use.
The solution must be thoroughly stirred before
measuring the pH.
The electrodes should be washed in distilled
water before and after use, and must not be
touched. They should be thoroughly washed
after measuring the pH of a solution with a
high concentration of biological macro-
molecules as they may adhere to the glass.
The pH meter is calibrated before use by
means of a standard solution.
The pH meter should be switched to zero but
the mains switch left on. After use, the
electrodes are soaked in distilled water and
must never be allowed to dry out. If this does
occur, then the electrodes need to be soaked in
water and calibrated frequently before their
measurements can be relied on.
Refractometer
A refractometer, or total solids meter, is used
to measure fluid-specific gravity, or protein
concentration. It is a cylindric instrument with a
built-in prism and calibration scale (Fig 4-3).
Refraction is bending of light rays as they pass
from one medium (e.g., air) into another medium
(e.g., urine) with a different optical density. The
refractometer is calibrated to a zero reading (zero
refractive index) with distilled water at a tempe-
rature between 60
˚-100˚ F.
The plasma protein concentration can be
determined from the small amount of plasma in a
microhematocrit tube as the following:
The tube is broken above the cell-fluid
interface after reading the hematocrit.
A drop of the plasma is placed on the clean
prism cover class of the refractometer.
Point the refractometer toward bright artificial
light or sunlight.
Fig. (4-3) Refractometer
Fig. (4-1) pH meter
Fig. (4-2) Electrodes of the pH
Glass electrode
Calomel reference
electrode
Pt wire
Pt wire
Hard glass tube
Saturated KCl
Mercury
Calomel paste
KCl crystals
Porous plug
Ag.AgCl
Thin bulb of soda glass
Sensitive to H
+
Test solution of unknown
H
+
concentration
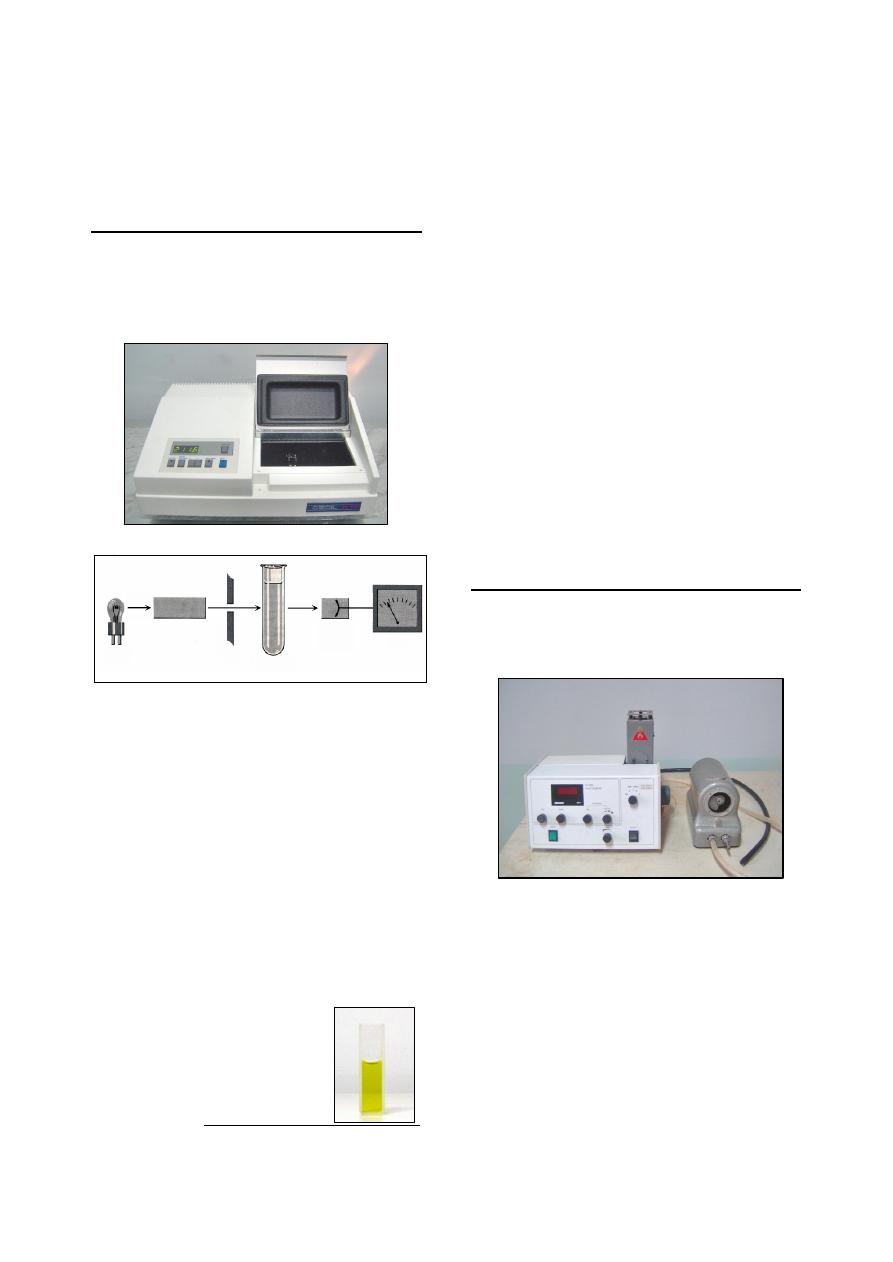
23
Bring the light-dark boundary line into focus
by turning the eyepiece.
Read and record the result using the protein
scale.
Spectrophotometer
The spectrophotometer (Fig 4-4) is used to
measure absorbance experimentally, by produ-
cing light of a preselected wavelength directs it
through the sample
1
, and measures the intensity
of light transmitted by the sample (Fig 4-5).
Basic components of Spectrophotometer:
Light source: tungsten-halogen lamp with a
wavelength range of 340-800 nm.
Wavelength selector: generate the desired
wavelength of light.
Slits: adjust the intensity of the incident light.
Sample chamber. The sample is placed in a
tube or cuvette made of glass, quartz, or other
transparent material (Fig 4-6).
Detector. The light's intensity is measured by
a light-sensitive detector and converts it into
an electrical signal.
Printer & Recorder: give a direct readout of
absorbance in analog or digital form.
1
The sample usually dissolved in a solvent and placed in a
cuvette.
Applications of Spectrophotometer:
All applications of spectrophotometer are fall
in one of two categories:
Measurement of absorbance at a fixed wave-
length, to obtain quantitative information such
as the concentration of a solute in solution.
Measurement of absorbance as a function of
wavelength, which provide qualitative infor-
mation that assists in solving the identity and
structure of a pure substance.
General rules of measurement:
The blank should be used for each determi-
nation.
Cuvette should be dry and clean, by washing
it with alcohol or acetone.
The solution in each cuvette should be free
from bubbles.
Care should be taken to place the cuvette with
the same side facing the light source.
Dust and light from windows cause errors in
readings, therefore, spectrophotometer should
be covered after the work.
Flame photometer
The flame photometer (Fig. 4-7) is used to
measure absorbance light emitted by excited
atoms. Widely used to determine concentration
of Na
+
, K
+
and Li
+
.
Basic components of flame photometer:
Nebulizer: convert sample solution into a
fine spray and feed this spray into burner. A
fine spray produced by the combination of
sample steam with a steam of air.
Fuel: produce the flame, used CH
4
(common
gas), acetylene or propane.
Oxidant gas: regulate and continuous the
flame. It is the atmospheric air enter by the
compressor.
Filter: each atom has special filter due to the
differences in the wavelengths of the atoms.
Fig. (4-4) Spectrophotometer
Fig. (4-6) Cuvette of spectrophotometer
wavelength
selector
light source
Slit
sample tube
(cuvette)
light detecting
photocell
(phototube)
Recorder
Fig. (4-5) Principal of spectrophotometer work
Fig. (4-7) Flam photometer
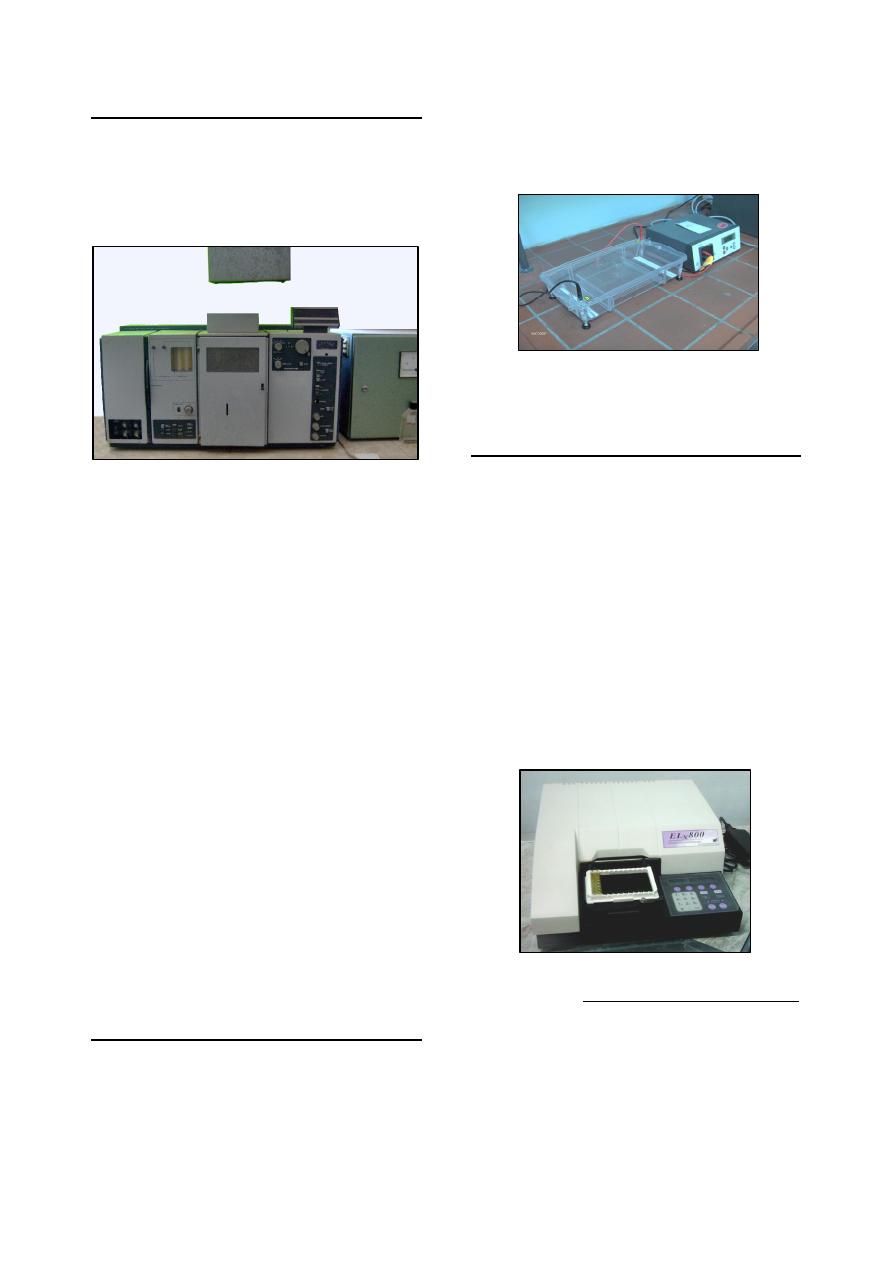
24
Atomic Absorption Spectrophotometer
The atomic absorption spectrophotometer
(Fig. 4-8) is used to measure the concentration
by detecting absorption of radiation by atoms
rather than by molecules. It permits accurate
measurement of elements such as calcium, zinc,
lead, copper, iron and magnesium.
Parts of atomic absorption spectrophotometer
The basic components of atomic absorption
spectrophotometer are:
Light source known as hollow-cathode lamp.
Atomizer: consists of
o
Burner: to convert the sample to vapor.
o
Air.
o
Fuel (commonly acetylene).
o
Sample chamber.
The sample must contain the metal in the
atomic vaporized state. This is done by using
the heat of flame to break the chemical bonds
and from free and unexcited atoms.
Action of atomic absorption:
Light from the hallow-cathode lamp passes
through the sample of ground-state atoms in
the flame.
The atoms absorb light energy and become
excited atoms.
The excited atoms then return to the ground
state and emitting light of the same energy as
it absorbed.
The emitted energy from the flame will go in
all directions, it will be a steady emission.
Electrophoresis
Electrophoresis is based on the examination
of the movement of charged molecules in an
electric field. These charged molecules migrate
in solution to opposite polarity when an electric
field is applied.
There are many types of electrophoresis, but
all based on the same principles. The major
difference between methods is the type of
support medium, which can be either cellulose or
thin gel (Fig. 4-9).
Enzyme Linked Immunosorbent Assay
(
ELISA
)
The enzyme linked immunosorbent assay is
one of the most sensitive diagnostic techno-
logies. It is rapid and simple to perform, depends
on the specificity of antigen-antibody reaction,
and is, therefore, very accurate. It is also used for
the detection and measurement of vitamins and
hormones, which they serve as the antigenic part
of the test.
A variety of ELISA-based applications per-
formed by automated microplate reader, such as
ELx800 automated microplate reader (Fig 4-10),
which is a single-channel reader-assay system
can perform the endpoint analysis
1
via measure
the optical density of solutions in 6, 12, 24, 48
and 96 well microplate at wavelength range from
400 nm to 750 nm.
1
Assay methods are classified as endpoint or kinetic assay.
With endpoint methods, the product formed from
enzymatic action interacts with a reagent to produce a
color complex. The amount of light by this color complex
is proportional to the amount of color complex present,
which indirectly reflect the concentration of the enzyme
present in the sample. Kinetic methods measure the rate of
the enzymatic reaction while it is in progress, and usually
involve serial measurements of the product concentration
per unit of time.
Fig. (4-8) Atomic absorption spectrophotometer
Fig. (4-9) Electrophoresis
Fig. (4-10) ELx800 Automated Microplate Reader
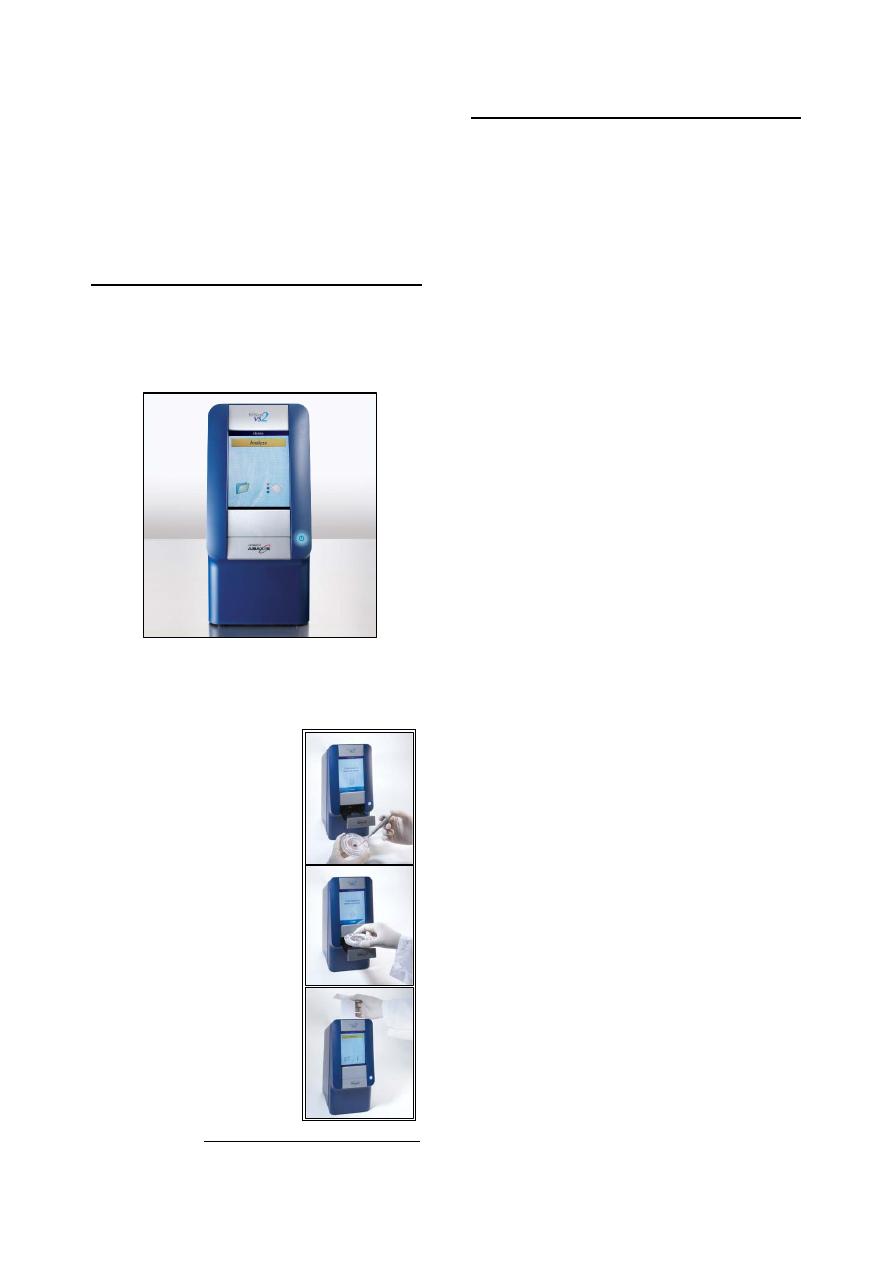
25
ELx800 reader consist of:
Single optical channel.
Wavelength range of 400-750 nm.
5-position filter wheel.
2
×24 LCD display.
Keypad with alphanumeric keys.
X-Y carrier movement.
VetScan Analyzer
VetScan VS2 is an innovative state of the art
chemistry, electrolytes, immunoassay and blood
gas analyzer, provides laboratory results from
100
ìl of whole blood, plasma, or serum in less
than 15 minutes (Fig. 4-10).
VetScan VS2 analyzer operating:
VetScan VS2 operation is an easy three-step
process (Fig. 4-11):
Transfer 100
µL of whole
blood, plasma, or serum into
the rotor
1
(Fig 4-11, a).
Insert the reagent rotor into
the VetScan
VS2 chemistry,
electrolytes, immunoassay
and blood gas analyzer (Fig
4-11, b).
Results are ready for view-
ing, printing, and down-
loading on the full color
display monitor and will
include Analyzer status, test
result, sample integrity alert,
error notification and help
instructions. Results can
also be transmitted to your
computer for record keeping
and billing (Fig 4-11, c).
1
There is no sample processing.
Techniques of Biochemical Analyses
1- Plasma protein:
Total protein is usually measured as serum
protein by:
Biuret method, which is a highly specific
spectrophotometric technique for protein
measurement, but it is inaccurate in deter-
mining protein concentration <1 g/dl.
Refractometry is useful if an emergency
result is required.
Albumin measuring is done by:
Bromocresol green dye binding method,
which is a spectrophotometric technique.
Serum protein electrophoresis.
Globulin can be measured by:
Mathematically by the formula:
globulin = total protein - albumin
Serum protein electrophoresis.
Immunochemical and radioimmunologic
methods, which allow specific identifecat-
ion and quantitation of individual globulin
.
Albumin-to-globulin ratio (A:G) is determined
mathematically by dividing the albumin con-
centration by the globulin concentration.
Fibrinogen evaluation is done by:
Heat precipitation test, the most common
method, using a refractometer as follows:
1.
Fill two pairs of microhematocrit tubes
with anticoagulated whole blood.
2.
Spin one pair of tubes in a microhema-
tocrit centrifuge.
3.
Using a refractometer, read the total
plasma protein concentration of each
tube and average the values.
4.
Heat the second pair of tubes in a 56
˚c
incubator or water bath for 3 minutes.
This process precipitate the fibrinogen.
5.
After incubation, spin the second pair of
tubes in a microhematocrit centrifuge.
6.
Using a refractometer, read the total
plasma protein
concentration
for
each
tube and average the values.
7.
Calculate the fibrinogen value by sub-
tracting the average total plasma protein
value of the heated tubes from the
average total plasma protein of the first
(unheated) pair of tubes.
Automated methods are available for
analysis.
2- Electrolytes:
Serum is the best sample for electrolyte
analysis. Heparinized plasma also can be used.
Serum should be separated from the clot as
quickly as possible and kept in an airtight
container to prevent in vitro alteration.
Fig. (4-10) VetScan VS2 analyzer
Fig. (4-11) Step of VetScan analyzer operating
a
b
c

26
Measurement techniques can use undiluted
sample giving results as mmol/L of serum water,
and diluted sample giving results as mmol/L of
serum. Many instruments that measure electro-
lytes use diluted sample. These are:
Ion-specific electrodes (ISE).
Flame photometer.
Chloride ion can be measured by ISE, and
colorimetric methods.
Nowadays, electrolyte assays can be routinely
performed by automatic chemistry analyzers.
3- Minerals:
Serum minerals have been measured by a
variety of techniques including colorimetric ana-
lysis using spectrophotometer, atomic absorption
spectrometry
1
, and automated analyzers.
4- Acid-base balance:
Blood pH is maintained within narrow limits
in health by proteinic, phosphate and bicarbonate
buffer systems. The bicarbonate system is the
only one of these systems that is measured for
clinical evaluation.
Actual bicarbonate ion (HCO
3
–
) concentration
is calculated from the Henderson-Hasselbalch
equation:
pH = 6.1 + log [HOC
3
–
÷ (0.03 × PCO
2
)]
Blood pH is measured by pH meter.
PCO
2
, which is a partial pressure of carbon
dioxide, determined by a special electrode.
6.1 = pK of carbonic acid.
Carbonic acid (H
2
CO
3
) is determined through
the formula:
H
2
CO
3
= 0.03
× PCO
2
5- Nitrogenous substances:
Urea, a nitrogenous compound, is synthesized
in the liver from carbon dioxid (CO
2
) and the
ammonia generated from deamination of amino
acids. Urea results are usually expressed as blood
urea nitrogen (BUN), which their levels are used
to evaluate kidney function based on the ability
of the kidney to remove nitrogenous waste (urea)
from the blood.
Creatinine is formed from creatine, which is
found in skeletal muscle, as part of muscle
metabolism. Creatinine diffuse out of the muscle
cell and
into most of body fluids
including blood.
Blood creatinine levels are used to evaluate renal
function, based on the ability of glomeruli to
filter creatinine from blood and eliminate it in
urine.
1
Atomic absorption spectrometry is the method of choice
for the determination of zinc in biological fluids.
A number of commercially available kits for
determination of BUN and creatinine in serum or
plasma using spectrophotometric method. BUN
and creatinine also can be measured by automa-
ted chemistry analyzers.
6- Carbohydrate metabolism:
Blood glucose concentration assay technique
is primarily spectrophotometric. Colorimetric
reagent strips are available for estimation of
glucose concentration in fresh whole blood.
Proper sample management is necessary to
correctly interpret blood glucose value:
Sampling of frightened animals should be
avoided; excessive release may cause
hyperglycemia.
If the medical history precludes the
likelihood of hypoglycemia, nonruminants
and very young ruminants should be fast-
ed at least 12 hours to avoid postprandial
hyperglycemia.
In vitro glycolysis is the most common
cause of pseudohypoglycemia in labora-
tory specimens. Using of anticoagulant
solution containing sodium fluoride inhibit
glycolysis.
Glycated protein assays include fructosamine
(FrAm), hemoglobin Alc (HbAlc) and glycol-
albumin (Galb).
Fructosamine is the most common glycat-
ed protein assay in veterinary medicine
using colorimetric test. It is useful in
diagnosis of diabetes mellitus.
Hemoglobin
Alc concentration is measured
less frequently.
Ketone bodies measured by the nitroprusside
reaction, which is the most qualitative test
detect ketones, and specific for acetoacetate
and to a lesser extent acetone;
â-hydroxy-
butyrate is not detected. An enzymatic and
colorimetric method has been developed for
quantification of
â-hydroxybutyrate.
Specimens (serum, urine, or milk) should
be fresh to avoid false-negative reactions
following the degradation of acetoacetate:
Serum should be diluted 1:1 with water.
Urine should be diluted 1:10 with water
.
Milk may be tested directly.
Tablets containing sodium nitroprusside
are available commercially. These tablets
are placed on a clean surface, and a drop
of sample
is
placed on the tablet. If ketones
present, tablet color will vary after 30
second from lavender to deep purple, rep-
resenting a trace, moderate, or strongly
positive reaction.

27
7- Bilirubin and fat metabolism:
Bilirubin is measured by spectrophotometric
method that based on the diazo reaction,
which is based on the ability of bilirubin to
couple with diazo reagent to form red-violet
pigment. Conjugated bilirubin reacts directly
with the reagent, while unconjugated bilirubin
reacts only after alcohol addition.
Cholesterol is measured by spectrophoto-
meter using ferro-ham method.
Bile acids concentration are estimated by
spectrophotometric assay.
Samples should be drawn from a fasting
animal, because the postprandial serum
samples are often lipemic, which may
falsely elevate bile acid concentration.
The measurement of a 2-hour postprandial
bile acid concentration increase the sensi-
tivity of the test, providing a more severe
test of the liver's capacity for bile acid
resorption.
Triglycerides are measured by spectrophoto-
meter. Fasting sample should be analyzed be-
cause
postprandial
hypertriglyceridemia occurs
4-6 hours after eating regardless of diet eating.
Fatty acids are quantify by colorimetric
spectrophotometer, and also may be measured
by enzymatic assays.
8- Plasma enzymes:
The blood level of most enzymes is low in a
healthy animal. It may be elevated if the enzyme
has leaked out of damaged cells, or if the cells
have increased production of the enzyme and the
excess amount has leaked out of the cells into the
blood.
Directly measuring enzyme concentration is
difficult because of its low level. The tests per-
formed to determine enzyme concentration in
blood indirectly by enzymatic reaction, which is
forms a product but no change in the enzyme as
follows:
The substance on which an enzyme (E) work
is called a substrate (S). Each of many enzymes
has a specific substrate. Each enzymatic reaction
produces a specific product (P) from the inter-
action of substrate and enzyme: (S + E
→ P + E)
Most enzymes assays use spectrophotometer
to measure
the
amount
of product produced.
Enzyme concentrations are measured as units
of activity known as the International Unit (IU),
which defined as that amount of enzyme which
will catalyze the conversion of one micromole of
substrate per minute.
9- Others:
Vitamins and Hormones:
Vitamins and hormonal assays are usually
complicated procedures requiring specialized
equipment. They can be estimated by
Radioimmunoassay, which is the more
sensitive method.
ELISA, which is intended for the quanti-
tative determination.
Tests of functional status of several organs
The functional status of several organs
–
notably the liver, kidneys, pancreas, adrenal
gland, pituitary gland, thyroid and parathyroid
gland functions
– can be evaluated by laboratory
tests.
Since the clinical manifestations of diseases
of these organs are often not characteristics, it
behooves the veterinarian to apply certain labo-
ratory tests to detect the presence of disease. In
other instances, clinical signs produced as a
result of a diseased organ are characteristic, and
laboratory techniques may then become a way of
estimating the degree of organ damage and the
response of the disease to therapy.
I. Liver function tests:
1- Tests dependent primarily on hepatic
secretion and excretion:
Bile pigments.
Clearance of foreign substances.
2- Tests dependent upon specific biochemical
function:
Protein metabolism tests.
Carbohydrate metabolism tests.
Lipid metabolism tests.
3- Tests dependent upon the measurement of
serum enzyme activity:
Transaminases.
Alkaline phosphatase.
III. Pancreatic function tests:
1- Blood glucose.
2- Serum lipase.
3- Serum amylase.
IV. Endocrine function tests:
Hormonal assays such as:
1- Pituitrin concentration test.
2- Thyroxin (T
4
) level.
3- Tri-iodothyronine (T
3
) level.
4- parathormone level.
5- ACTH level.
6- Aldosterone level.

28
References
Abaxis (2006). VetScan VS2: the next generation
point-of-care analyzer. Abaxis, Inc. 888-
9001 Rev. B
Boyer, R. (2000). Modern Experimental Biochemistry.
3rd ed. Addison Wesly Longman Inc. San
Francisco.
Coles, E. H. (1986). Veterinary clinical pathology. 4
th
ed., WB Saunders Co Philadelphia, London.
Hendrix, C. M. (2002). Laboratory Procedures for
Veterinary Technicians. 4th ed., Mosby, Inc..
Henry, J. B. (2001). Clinical Diagnosis and
Management by Laboratory Methods. 12th
ed. W.B. Saunders Co
Kerr, M. G. (2002). Veterinary laboratory medicine:
clinical biochemistry & hematology. 2nd ed.,
Blackwell Science.
Latimer, K. S., Mahaffey, E. A. and Prasse, K. W.
(2003). Duncan and Prasse's Veterinary
Laboratory Medicine: Clinical Pathology.
4th ed., Blackwell Publishing Co., U.S.A
Kaneko, J. J., Harvey, J. W. & Bruss, M. L. (1997).
Clinical biochemistry of domestic animals.
5th ed., Academic Press, California, USA.
Meyer, D. J. & Harvey, J. W. (2004). Veterinary
laboratory
medicine:
interpretation
&
diagnosis. 3rd ed., Saunders, Elsevier Inc,
USA.

29
C
C
h
h
a
a
p
p
t
t
e
e
r
r
5
5
U
U
r
r
i
i
n
n
a
a
l
l
y
y
s
s
i
i
s
s
Since urine is the end product of a complicated
and delicately balanced physiological process,
many normal and pathological mechanisms may
influence the constituents.
Urinalysis is performed for:
Acquiring a
large amount of information about
several body systems (as a screening method).
Evaluation of the kidneys, through detection
of abnormal components in the urine that may
be of renal origin such as cast and protein.
Macroscopic Examination of the Urine
I. Physical examination:
(1) Urine volume (quantity):
The amount of urine produced daily depends
upon several physiological factors including:
water and other fluid intake, environmental
condition, diet, size the activity of the animal, as
well as the species of the animal.
Increased daily urine volume called polyuria.
Decreased daily urine output called oliguria.
(2) Color:
The normal color is pale yellow to yellow
brown dpend on the concentration of urochrome.
Pale urine is seen in diabetes mellitus,
diabetes insipidus, increased water intake.
Dark urine due to the concentration of uro-
chromes occurs in association with dehyd-
ration, fever, decreased blood pressure, and
presence of bilirubin.
Red to red-brown due to presence of hemo-
globin and myoglobin.
(3) Transparency:
The transparency (clarity, turbidity) of urine
as observed in a test tube or urinometer cylinate
should recorded as clear, flocculent or cloudy.
Normal urine is clear when freshly voided in
all animals except in the horses which is
normally thick and cloudy due to the presence
of calcium carbonate crystals and mucus.
Pathologically cloudy urine observed when
leukocytes, erythrocytes, epithelial cells, bac-
teria, mucus, fat and crystal are present.
(4) Odor:
The odor of the urine is not diagnostic,
although the urine of males of certain species
(porcine, feline and caprine) has an especially
strong odor.
The normal odor of urine is derived from the
volatile organic acids present.
Fruity odor may be detected in urine in
associated with pregnancy disease, acetone-
mia and diabetes mellitus.
(5) Foam:
When shaken after collection, normal urine
produces a white foam that is limited in quantity.
If there is proteinuria the amount of foam pro-
duced is in excess and slow to disappear.
(6) Specific gravity:
Specific gravity of urine is a measurement of
the relative amount of solids in solution and is an
indication of the degree of tubular reabsorption
or concentration by the kidney.
Method of determination:
Fill a cylinder to its three fourth its hight with
urine.
Place the urinometer in the urine and rotate it
to prevent its touching the sides of the bottom
of the cylinder (Fig 5-1).
Read the specific gravity at the highest point
at the bottom of the meniscus and record.
Increased
specific
gravity
physiologically
occur as a consequence to decrease in water
intake or in animal held in a high environ-
mental temperature.
Several diseases caused
increasing in specific
gravity such as dehydra-
tion result from diarrhea,
high fever, cystitis and
diabetes mellitus, while
lower specific gravity
occurs in advanced urea-
mia, diabetes insipidus
and excessive fluid in-
take.
Fig. (5-1) Urinometer
id23468031 pdfMachine by Broadgun Software - a great PDF writer! - a great PDF creator! - http://www.pdfmachine.com http://www.broadgun.com

30
II. Chemical Examination:
(1) Acid-alkaline reaction (pH):
Normal values of the pH reaction of urine
from any species of animal must be carefully
considered as the diet and state of metabolism. In
general bovine, ovine and caprine have alkaline
urine, while canine and feline have acid urine.
The hydrogen ion concentration can be deter-
mined by the use of litmus paper or hydrogen pH
paper strips.
Increased acidity of the urine may result from
starvation, fever and acidosis.
Alkaline urine occur in cystitis, ingestion of
salts such as sodium lactate, sodium bicar-
bonate, sodium citrate and nitrate.
(2) Protein:
Protein in urine can be estimated through
Roberts' test as follows:
Pour 2
ml of 20%
sulphosalicylic acid solution
into a test tube.
Carefully pour 6 drops of urine down the side
of the tube from a dropping pipette to form a
layer of urine above the acid.
Development of white ring at the junction
indicate the presence of protein.
(3) Glucose:
A number of methods are available for both
qualitative and quantitative estimation of glucose
in the urine. The simplest method is the use of
Benedict reagent.
Put 5 ml of Benedict reagent in a test tube.
Add 5 ml of urine.
Heat the mixture for 5 minutes in a boiling
water bath.
Cool in air and read the result as follows:
o
Clear blue
-
o
Greenish precipitate
+
o
Green-yellow precipitate
++
o
Yellow-orange precipitate
+++
o
Red precipitate
++++
Glucose is increase in the case of diabetes
mellitus.
(4) Ketone bodies:
The Ross test has been widely utilized for the
detection of ketone bodies in the urine.
Put 5 gm of provided reagent in a dry test
tube.
Add 5 ml of urine to the test tube.
Add 1-2 ml conc. ammonium hydroxide to
form a layer above the mixture.
The reaction is reported as:
o
Very slight purple color
Trace
o
Slight purple color
+
o
Moderate purple color
++
o
Dark purple color
+++
o
Black color
++++
(5) Blood:
Blood may be present in the urine (hematuria)
or the pigment hemoglobin (hemoglobinuria).
Benizidine test:
Dissolve a small amount of benzidine base in
2 ml of glacial acetic acid.
Add 2 ml of urine and mix.
Add 1 ml of fresh hydrogen peroxide and
mix.
Appearance of a green or blue color within 5
minutes indicate the presence of blood.
(6) Bile salt:
Hay's test:
Place 10 ml of urine in a test tube.
Put a small amount of sulphur on the surface
of the urine.
If the bile salt are present, the sulphur will
immediately start to sink through the urine.
(7) Urobilinogen:
Ehrlicks' benzaldehyde test:
Put 5 ml of urine in a test tube.
Add 0.5 ml of Ehrlicks' reagent.
Leave at 5 minutes and read as follows:
o
Pink color normal.
o
Red color access of urobilinogen.
Microscopic Examination of the Urine
The portion of urine that have been used in a
microscopic examination is the sediment.
Gently mix the urine then fill about 10 ml of
urine on a conical centrifuge tube.
Centrifuge for 15 minutes at 1000 rpm.
Carefully pour away the supernatant liquid
and leave about 0.5 ml of material at the
bottom of the tube.
Pull 1-2 drops from the deposit by pasture
pipette on a clean microscopic slide and apply
cover slip.
Examine the slide under the power 10x. The
differentiation could be made through high
power (40x).
Addition of stain to urine sediment will
facilitate identification of cells and structure.
One drop of 0.5% New methylene blue stain
preserved by addition of a drop, or two of
formalin provides a most satisfasctory stain
and permits easy identification of cells and
other organized elements.

31
Note:
The sediment should be made using fresh
specimen. If there is delay
(within
2
hours before
examination) the sample should be preserved by
refrigeration or adding formalin.
Component of Urinary Sediment:
Urinary sediment can generally be divided into
organized and unorganized elements (Fig 5-2).
I. Organized Sediment:
(1) Epithelial cells:
a- squamous epithelial cells:
They are the largest of cells that appear in the
urine sediment, derived from superficial layer
of the urethra and vagina.
They have an irregular outline, and contain a
small round nucleus.
They found as a single cells, or as sheets.
b- transitional epithelial cells:
They have various forms including round,
oval and spindle shape.
They have intermediate size between the
squamous cells and renal cells.
(2) Leukocytes or pus cells:
They are granulated cells, smaller than
epithelial cells, contain nucleus
1
.
Normal urine contains 1-2 white cells/HPF,
but 5-9/HPF indicates urethritis, cystitis,
nephritis, vaginitis and metritis.
(3) Erythrocytes:
They are yellow to orange cells, smaller than
leukocytes, contain no nuclei.
In normal urine 1-2 RBC in each high power
field, but presence of larger numbers of red
cells more than 5-9/HPF denotes hemorrhage
in genito-urinary tract.
(3) Casts:
Casts are principally formed in the lumen of
the distal tubules ascending loop of Henle and
collecting tubules of the kidneys.
There are several types of casts:
o
Hyaline cast. It is composed of protein
and mucoprotein. It is hemogenous, semi-
transparent colorless, cylindrical structure
and having rounded end. It can be seen
only in a dark field.
o
Granular cast. It is hyaline cast contain
granules either fine or coarse. It is derived
from
the
disintegration
of
tubular
epithelium.
o
Waxy cast. It is similar in appearance to
hyaline cast, being typically hemogenous
1
Usually segmented but often degenerated.
and appears more opaque than the hyaline
cast, grayish or colorless. It is indicates a
chronic lesion of the tubules.
o
Epithelial cast. It is formed from the
desquamated cells derived from the renal
tubules. Cells within these cast vary in
size and often oval, elongated or flat.
o
Erythrocytic cast. It is a hemogenous,
cylindrical mass, having a deep yellow to
orange color.
o
Leukocytic cast. It is characterized by the
presence of mucous pus cells adherent to
or within a hyaline matrix.
o
Fatty cast. Contain small droplets that
appear as refractile bodies, usually color-
less but can be stained with suddan III.
(4) Mucous strands:
They are derived from the mucous glands of
the urinary tract.
They are appear as long, translucent shreds.
They are normal in horses.
(5) Bacteria:
They are seen as small objects displaying true
motility under high power.
Normally there will be no bacteria seen in
urine collected under sterile condition.
(6) Yeast:
Unnucleated round and oval bodies, larger
than bacteria but smaller than leukocytes.
They exist in urine as contamination.
(7) Protozoa:
Trichomonads and Giardia are usually the
result of fecal contamination.
(8) Spermatozoa:
It appears as a contamination of urine with
varying amount of semen.
(9) Parasites ova:
Urine sample contaminated by fecal matter
may contain a variety of parasites ova.
II. Unorganized Sediment:
(1) Fat droplets:
They are appear as round, highly retractile
bodies of various size.
Positive identification of fat droplets can be
made by the addition of suddan III to the
urinary sediment.
(2) Crystal:
The type of crystal observed in urine depends
upon the pH, solubility and concentration of
the crystalloid and colloids.
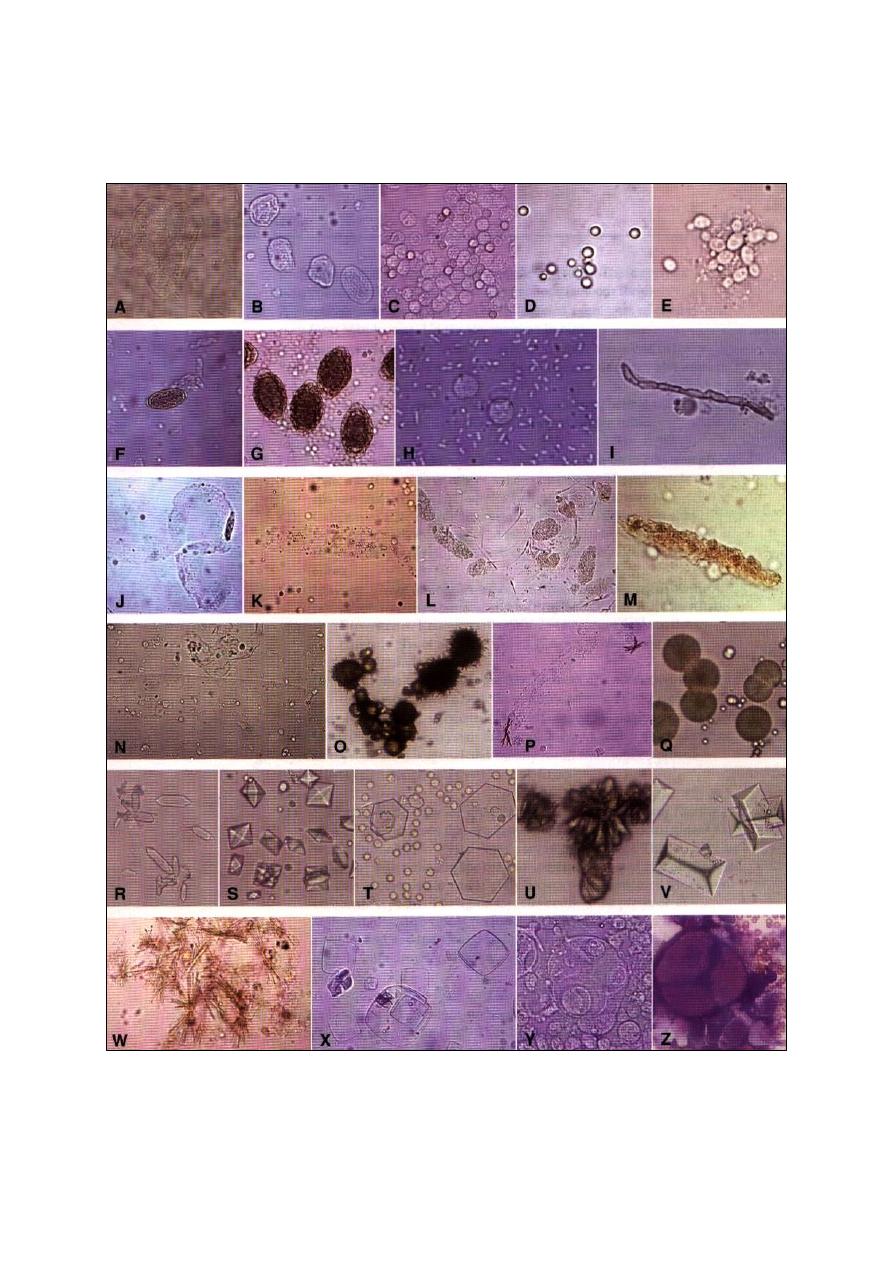
32
Alkaline urine will contain triple and
amorphous phosphate, calcium carbonate,
especially in the horse, and on rare occasions,
ammonium urate crystals.
Acidic urine contains amorphous urate and
uric acid, calcium oxalate and hippuric acid
may be present, but are less common.
Fig. (5-2) urinary sediment. (A) squamous epithelial cell, (B) transitional epithelial cells, (C) erythrocytes and leukocytes, (D) fat
droplets, (E) Candida spp. Yeast, (F) Capillaria plica ovum, (G) Dioctophyma renale ova, (H) bacteria and leukocytes, (I) fungal
hypha, (J) mucus thread, (K) hyaline cast, (L) granular cast fragments and spermatozoa, (M) cellular cast with hemoglobin staining, (N)
waxy cast, (O) ammonium biurate crystals, (P) bilirubin crystals with hyaline cast, spermatozoa, and leukocytes, (Q) calcium carbonate
crystals, (R) calcium oxalate monohydrate crystals (ethylene glycol toxicosis), (S) calcium oxalate monohydrate crystals, (T) cystine
crystals, (U) sulfonamide crystals, (V) triple phosphate crystals, (W) tyrosine crystals, (X) uric acid crystals, (Y) transitional cell
carcinoma (wet mount), (Z) transitional cell carcinoma (Wright's stain).

33
Urine Culture
Normal urine is sterile, but it may become
contaminated with members of the skin
microbiots near the end of it's passage through
the urethra.
Urine itself is a good culture medium. The
followings should be considered during urine
collection for culture:
Urine specimen should be collected in the
morning.
Urine specimen should be collected by the
cytocentesis or catheterization.
All specimens should be processed by the
laboratory within 2 hours of collection, or be
kept refrigerated at 4
˚c.
The examination procedure include the follo-
wing steps:
Examine gram-stained smear.
Culture the urine on suitable media such as
MacConky agar, blood agar, incubate at 37
˚c
for 24 hours under aerobic condition.
Susceptibility tests on clinically significant
bacterial isolates.
Note:
One or more bacteria cells per oil-immersion
field usually implies that there are 105 or more
bacteria per milliliter in the specimen. The
presence of one or more leukocytes per oil-
immersion field is a further indication of urinary
tract infection.
Kidney Function Tests
1- Urine specific gravity and the effect of
water deprivation.
2- Estimation of non-protein nitrogen
2
level
in the blood.
3- Studies of the ability of the kidney to
excrete certain dyes.
4- Tests based on the clearance concept.
5- Other blood chemistry determinations,
such as electrolytes, blood pH, cholesterol
and serum proteins.
2
Non-protein nitrogen include urea, creatinine, creatine,
uric acid,
ammonia, amino acids and a fraction designated
undetermined nitrogen.
References
Coles, E. H. (1986). Veterinary clinical pathology. 4
th
ed., WB Saunders Co Philadelphia, London,
Toronto.
Henry, J. B. (2001). Clinical Diagnosis and
Management by Laboratory Methods. 12th
ed. W.B. Saunders Co.

34
id23576578 pdfMachine by Broadgun Software - a great PDF writer! - a great PDF creator! - http://www.pdfmachine.com http://www.broadgun.com

35
C
C
h
h
a
a
p
p
t
t
e
e
r
r
6
6
C
C
l
l
i
i
n
n
i
i
c
c
a
a
l
l
P
P
a
a
r
r
a
a
s
s
i
i
t
t
o
o
l
l
o
o
g
g
y
y
Under all conditions of animal husbandry, all
species of domestic animals harbor intestinal
parasites, and evidence of infestation with many
of these is to be found in form of ova, larvae or
segments. There are number of potential patho-
genic protozoa may also be found in the feces,
some of which are of public health significance.
Moreover, there are protozoan parasites and
rickettsia-like organisms that are found in the
blood stream can be identified by examination of
the properly prepared blood films.
This chapters deals with the methods used to
detect the parasitic infestation in the animals
C
C
o
o
p
p
r
r
o
o
l
l
o
o
g
g
i
i
c
c
a
a
l
l
E
E
x
x
a
a
m
m
i
i
n
n
a
a
t
t
i
i
o
o
n
n
Macroscopic and microscopic examination of
the feces used to identify internal parasites.
Macroscopic Examination
Some of intestinal parasites such as ascarid
species, segments of several tapeworms, and
Gastrophilus larvae can be recognized with the
unaided eye.
Microscopic Examination
Microscopic examination can be divided into
two types of methods: qualitative methods that
used for identification of types, and quantitative
methods that used for counting of the number of
eggs in feces.
I- Qualitative Methods:
1-
Direct smear:
The direct smear method is a rapid and easily
completed procedure, but eggs and oocysts are
not concentrated. It should be used only when:
Very small samples are available.
Lack of equipments.
Time prevents the use of a more accurate
techniques.
Procedure of direct smear:
Put a small quantity of feces on a slide.
Dilute this quantity with water.
Thoroughly mix, using an applicator stick,
until obtaining homogeneous and sufficiently
transparent preparation. The largest particles
can be moved aside.
A coverglass is applied and the smear is
examined under the microscope.
Note:
A negative result with this method is not
always reliable, therefore; this method is of little
diagnostic value because it is unlikely that ova
will be observed unless the infestation is severe.
2-
Flotation:
This method based on the principle that the
eggs of parasites are less dense than the fluid
flotation medium, thus they will float to the top
of the container when they can be collected for
microscopic evaluation.
Flotation is used to diagnose the nematode
eggs, whereas it is not suitable for eggs of trema-
todes and some cestodes.
Concentrated solutions for nematodes used in
this technique may be:
Sugar solution, density 1.12 at 15
˚c:
1.
sugar 1300 g.
2.
distilled water 1000 ml.
3.
formalin 40% 20 ml.
Salt solution, density 1.19 at 20
˚c:
1.
sodium chloride
± 400 g.
2.
distilled water 1000 ml.
Magnesium solution, density 1.28 at 15
˚c:
1.
magnesium sulfate
± 400 g.
2.
distilled water 1000 ml.
Procedure of flotation:
In a 100 ml glass beaker,
± 2 g fresh feces
and some of concentrated solution are mixed
intensity by means of a spatula to obtain a
relatively homogenous mixture.
Dilute to
90
ml with the concentrated solution.
id23680328 pdfMachine by Broadgun Software - a great PDF writer! - a great PDF creator! - http://www.pdfmachine.com http://www.broadgun.com
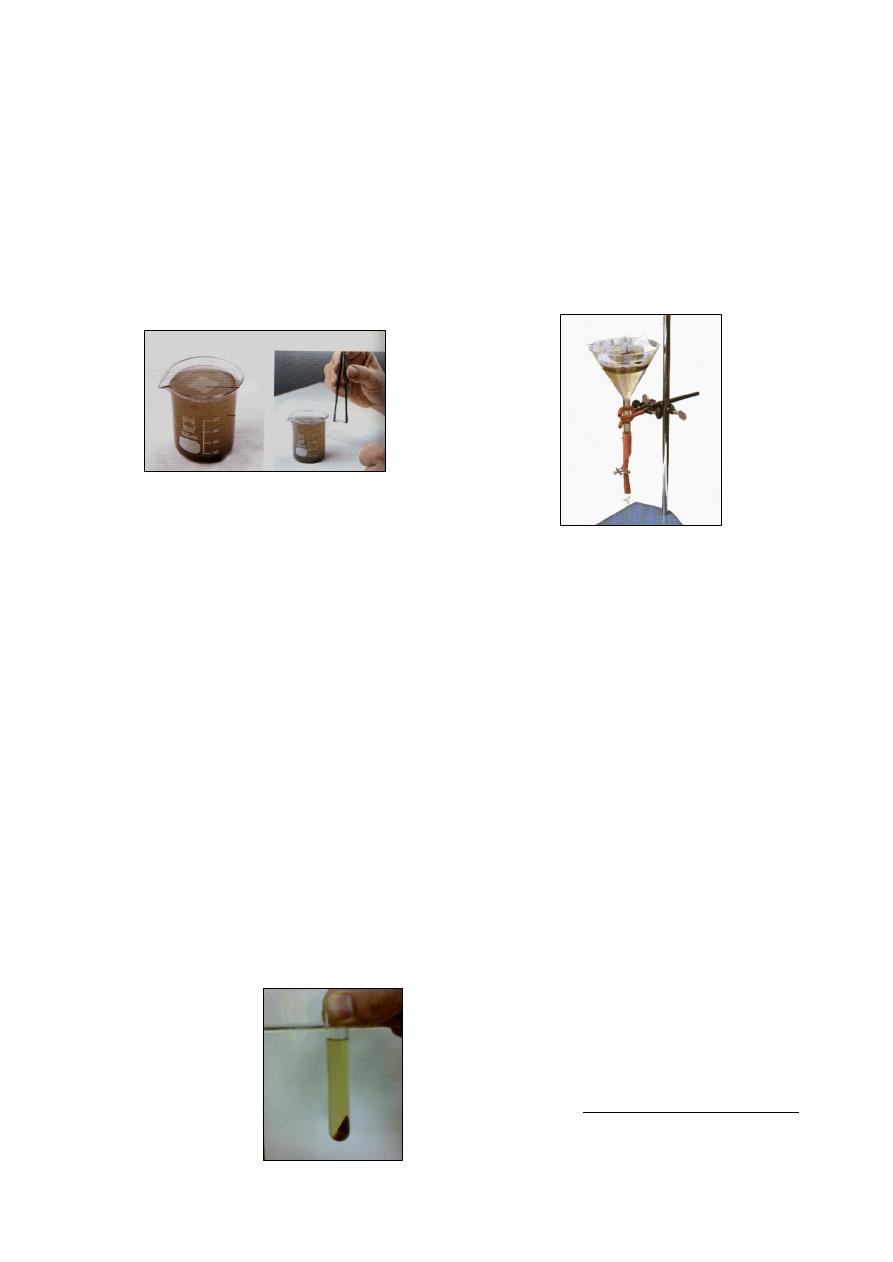
36
Strain the solution through a fine sieve to
press out the large particles.
Let the solution settle for a few minutes until
the air-bubbles have all escaped, then care-
fully place a coverglass on top of the liquid,
or fill a suitable narrow cylinder to the top,
and then place a clean coverglass over the top
of the cylinder to be in contact with the liquid
(Fig 6-1).
After about 30-40 minutes, gently remove the
coverglass, and then examined under a low
power of the microscope.
Notes:
If the eggs are kept to long in such a concen-
trated solution, they may become deformed
and unrecognizable.
Saturated sugar solution is the better; because
it is sticky, so that the eggs are well attached
with the coverglass.
3-
Sedimentation:
This method is suitable for trematode eggs,
and some of cestodes and nematodes whose eggs
do not float readily in common flotation solution.
Procedure of sedimentation:
In a 100 ml glass beaker,
± 10 g fresh feces
are intensively mixed with water by means of
spatula.
The suspension is strained through a fine
sieve. Then transfer strained mixture to a
centrifuge tube.
Centrifuge for 1-2 minutes at 1500-2000 rpm
to obtain the sediment (Fig 6-2).
The supernatant is decanted, while a portion
of the sediment transfer to a microscope slide
and then examined with a low power.
4-
Baermann techniques:
This technique used for detection of lung
worm larvae, and cultural method for specific
identification of the third stage larvae of the
strongyles and trichostrongyles.
Baermann apparatus consist of:
Glass funnel 20-25 cm in diameter.
Rubber tube about 10 cm in long.
Clip, for pinching of the tube.
The apparatus is supported in a retort ring on
a stand (Fig 6-3).
Procedure of Baermann technique:
Apply
± 20 g of fresh feces to a gauze
1
.
Fill the funnel with tap water
2
, so that the
feces are completely immersed.
Let the whole settle at room temperature for
24 hours. The larvae will come out of the
soaked feces and fall through the meshes into
the funnel neck where they are concentrated
at the bottom.
Release the clip and collect the first 3-4 drops
on a microscopic slide, or collect 5-10 ml of
the liquid, which may be drained off into a
centrifuge tube where the larvae will be in the
sediment.
Examine the nematode larvae under low
power without coverglass. The larvae will be
swimming actively.
Note:
In heavy infestation, larvae can be drawn off
in a drop of water after an hour, but when few
larvae are present, it may be necessary to leave
the Baermann set up overnight.
5-
Feces culture:
It is used for detection the presence of
helminth ova and ensuring their incubation, and
the development of larvae to the infective third
stage.
1
If the feces is very watery, more layers of gauze should be
used.
2
Maximum 30˚c.
Fig. (6-1) Flotation technique for eggs of parasite
Fig. (6-2) Sedimentation
technique for eggs of
parasites
Fig. (6-3) Baermann apparatus
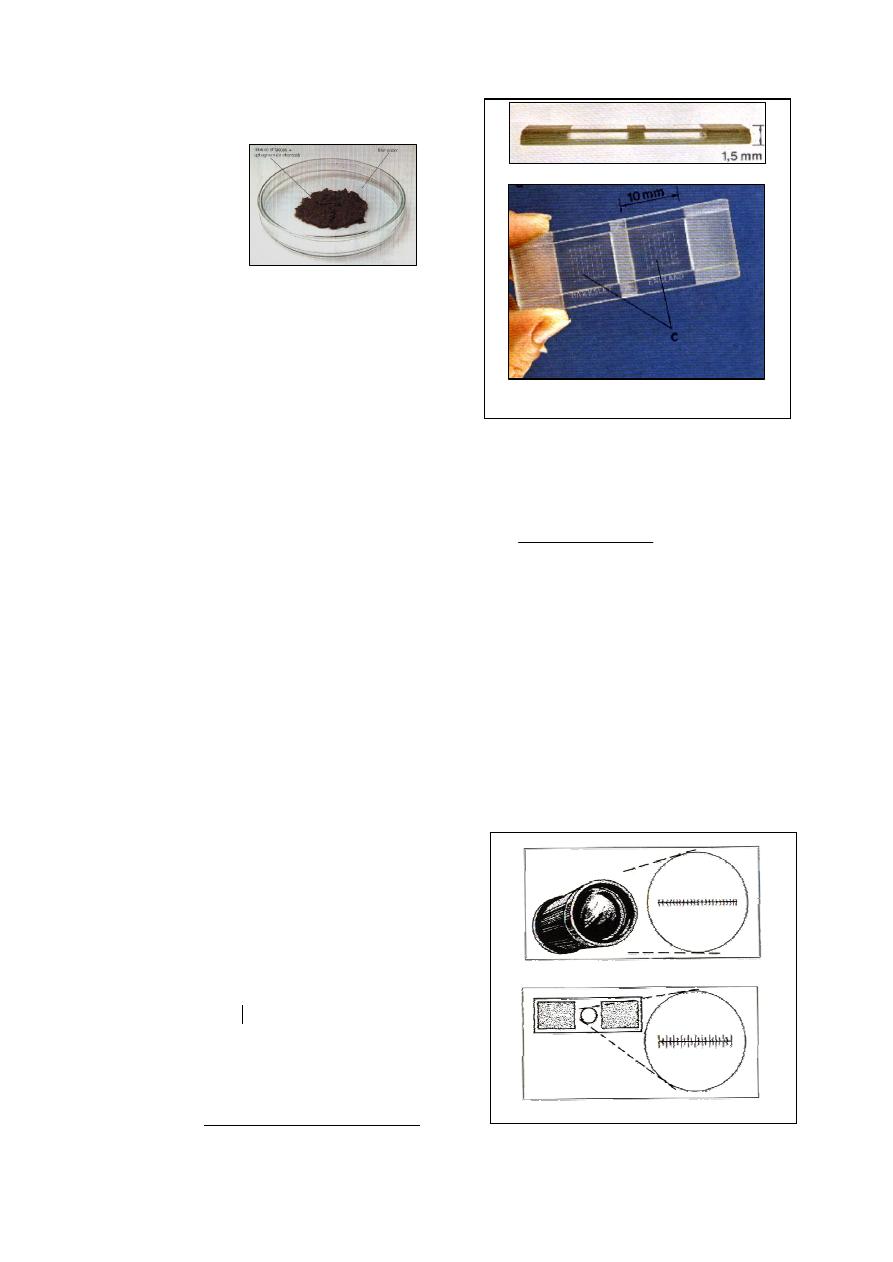
37
Procedure of feces culture:
The feces broken up and placed in a glass jar
(Fig 6-4).
Glass jar is closed and kept at a temperature
of about 26
˚c for a suitable time, usually 7
days.
After incubation, concentrate the larvae by
means of the Baermann technique.
6-
Adhesive-tape method:
This method used in horses for the
determination of Oxyuris equi; because their
eggs stick to the anal region and usually are not
found in the feces. The method use a transparent
adhesive tape 2.5 cm wide and
± 15 cm long.
Clean the area surrounding the anus day
before the sample is to be taken.
Stick the tape onto the right thumb, and
firmly press the adhesive tape to the anal skin
folds.
The adhesive tape is stuck on to a microscope
slide.
To examine the preparation, a drop of water
is placed under the tape.
The strip is then again firmly stuck and the
preparation
is
examined
under
the microscope.
II- Quantitative Methods:
To obtain more accurate information with
regard to the severity of an infection, egg count-
ing methods have been devised
1
. There are two
methods can be used: Stoll's dilution method and
McMaster method.
McMaster egg-counting technique:
Weigh 2 g of feces accurately.
Soaked it in a 60 ml of saturated solution,
then strain the solution through a fine sieve.
Fill the compartment of the counting cell in
the McMaster slide
.
After a few minutes the eggs float up to the
surface of McMaster slide and they are all in
the focus against the upper slide (Fig 6-5).
1
By means, the number of eggs per gram of feces can be
determined
.
Count the eggs at least in two compartment,
according to the following calculation:
III- Micrometry:
The calibration of eggs must be worked out
separately for each microscope because the real
magnification differs from one microscope to
another. In calibration, two scales are necessary:
Ocular micrometer glass disc, which must be
inserted into the ocular tube. It is usually
contain 100 divisions.
Stage micrometer, which is a slide etched one
millimeter divided into 100 equal space (Fig
6-6 a and b).
epg
chembers
of
Number
eggs
of
number
Total
)
(
200
Fig. (6-4) Feces culture
(feces placed in Petri
dish with charcoal)
Fig. (6-5) McMaster slide
Fig. (6-6) Micrometer scales
Compartments
of McMaster slide
(a) cross section of McMaster slide
(a) McMaster slide, showing the
compartments of the counting cell
b- stage micrometer
a- ocular micrometer
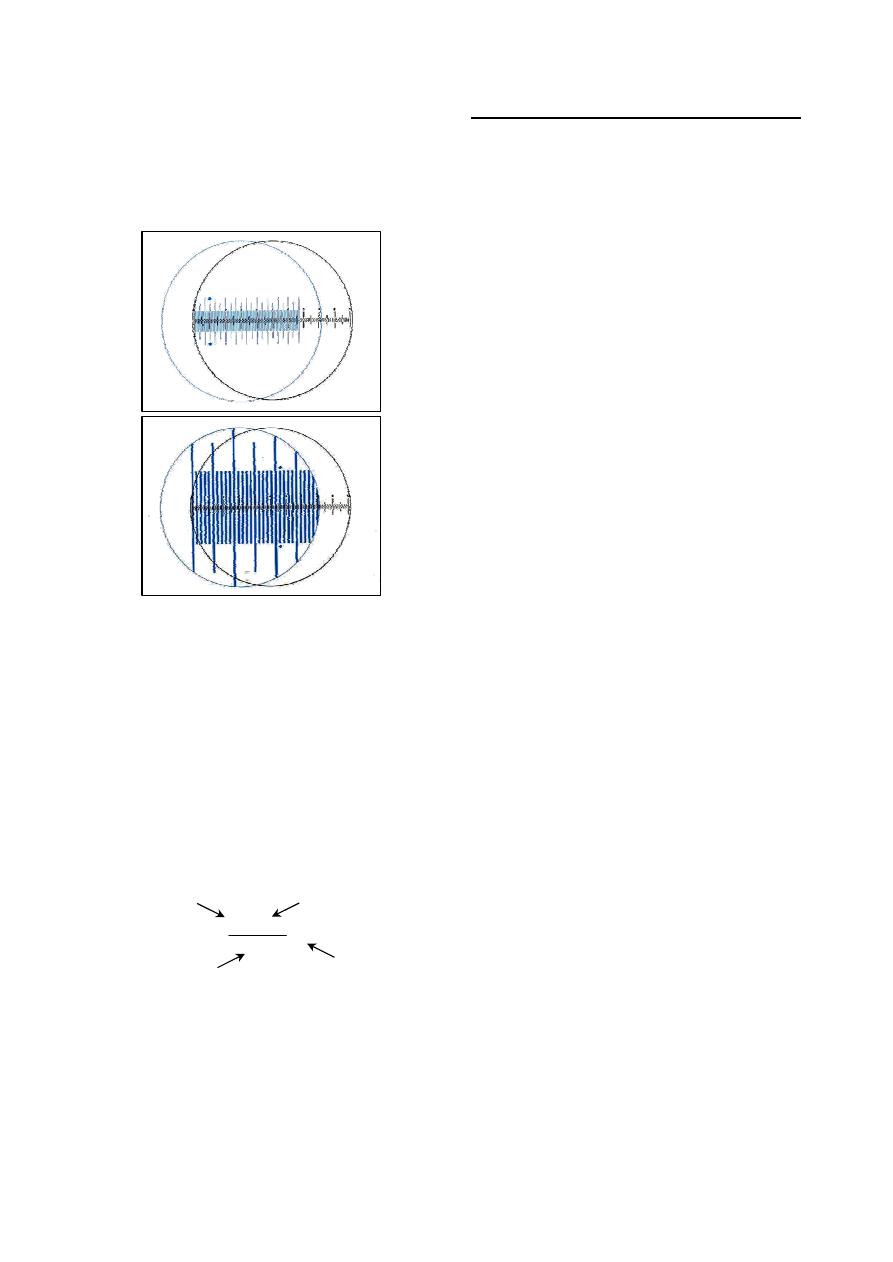
38
Procedure of calibration of the objective index:
Place the stage of micrometer on the stage of
the microscopic stage and focus until the lines
are sharp.
Place the ocular micrometer in the ocular tube
and rotate it until the scales of both ocular
and stage micrometer overlap (Fig 6-7).
Move the mechanical stage until both scales
are aligned with the zero line.
Choose the line of ocular micrometer that
exactly aligned with the middle of an object
scale line of the stage micrometer. For
example with 10x objective: 10 divisions of
the ocular micrometer are exactly super-
imposed over 15 divisions of the stage
micrometer, each small division of the stage
micrometer represent 10
µm, thus the
objective index of this microscope with 10x is
caculated as:
Thus, the length and width of the eggs are
determined by multiplication of the number
of ocular micrometer lines that calibrated
under a magnification power with the object-
tive index of that magnification power.
Note:
Fig's (6-8; 6-9; 6-10 and 6-11) showing
different eggs larvae for various worms.
Examination of Feces for Protozoa
All of previously described qualitative fecal
examination procedures may be used to detect
protozoan oocysts (Fig 6-12).
However, some protozoans pass out of the
host in trophozoites form, which are one-cell
motile organisms that lack the rigid wall of a
cyst, making flotation without distortion or death
of the trophozoites impossible. Therefore; the
direct smear, using saline and a stain, is the
preferred procedure for examination of a fecal
sample for protozoal organisms, by recognizing
their movement. Stains also may be used to
recognize certain structural characteristics.
Lugol's iodine and new methylene blue are
the common stains used with direct smear. The
acid-fast staining procedure is used to identify
cryptosporidium species in the feces.
Preparation of Lugol's iodine:
Dissolve 10 g of potassium iodide in 100 ml
of distilled water in a glass beaker.
Add 5 g of powdered iodine crystals to the
solution and stir until all of the iodine has
dissolved. This produces a 5% Lugol's solu-
tion and should be stored in an amber bottle,
away from light.
For staining, this 5% Lugol's solution must be
diluted by adding 1 part 5% Lugol's solution
to 5 parts distilled water. This staining solu-
tion must be remade every 3 weeks because it
deteriorates.
Acid-fast staining procedure:
Make a thin smear of feces using a glass
pipette and allow to air dry.
Fix the smear by heating on a hot plate for
2-3 minutes or by passing the slide through a
Bunsen burner flame, spe-cimen side up.
Flood the slide with carbol fuchsin stain and
heat the slide until the stain steams.
Remove the slide from the heat and let it sit
for 5 minutes. Rinse with tap water.
Decolorize by adding acid alcohol for 10-20
seconds, then rinse with tap water. Repeat
this step until the film on the slide appears
light pink.
Add new methylene blue stain for 20-30
seconds. Then rinse with tap water.
Blot dry with a paper towel and examine by
the oil-immersion objective.
Oocysts will appear as bright fluorescent red
objects, whereas bacteria and yeasts stain
blue.
15
10
10
15
numbers of stage
micrometer divisions
magnification power
length between 2 divisions
of stage micrometer
objective index of that
magnification power
Fig. (6-7) Overlapping of both ocular and stage micrometer
10 X
4 X
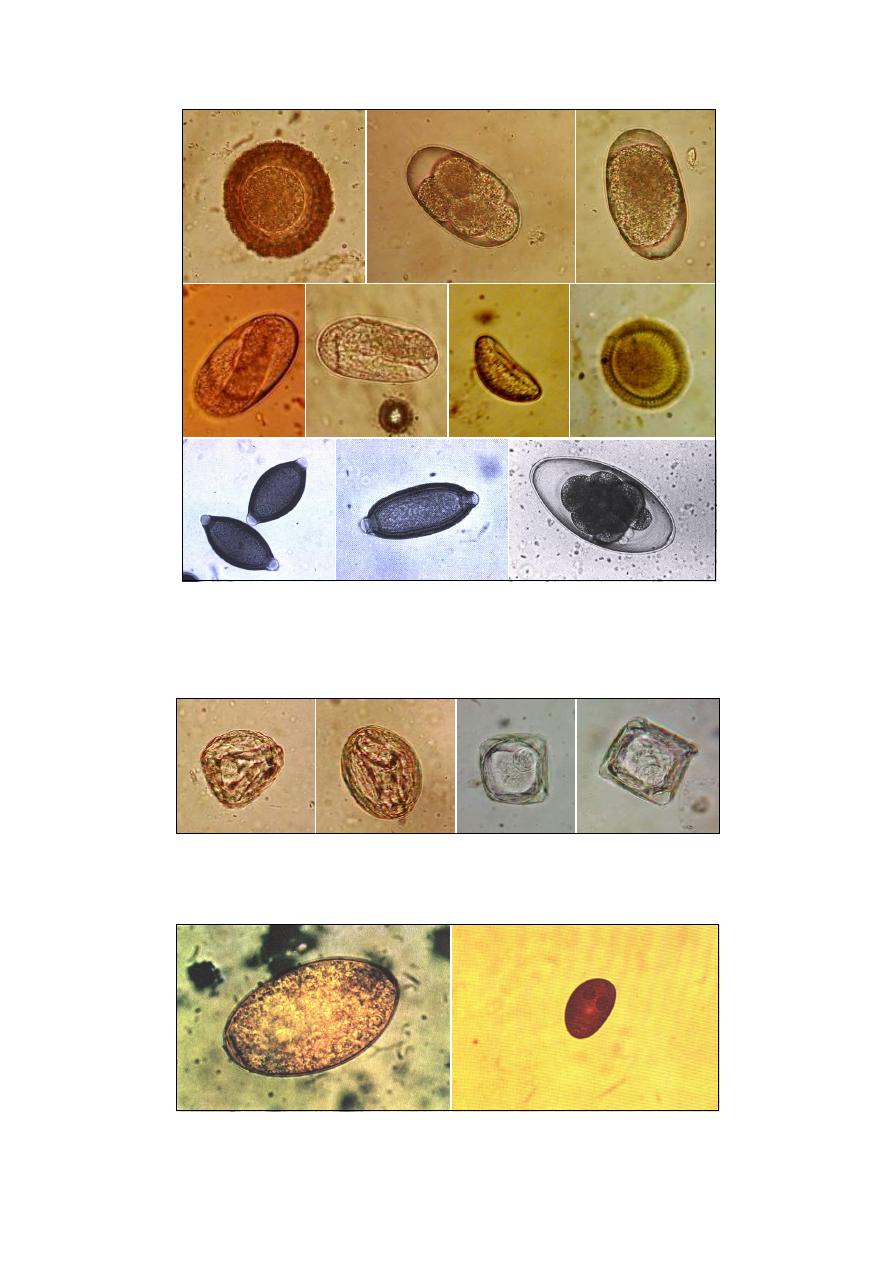
39
Fig. (6-8) Different eggs of nematodes: A- Parascaris equorum; B- Strongles spp. egg; C-
Trichostrongylus axei; D- Dictyocaulus arnfieldi; E- Strongyloides westeri; F- Skrjabinema
spp.; G- Neoascaris vitulorum; H- Tirchuis ovis; I- Capillaria spp. J- Nematodirus spp.
Fig. (6-9) Different eggs of cestodes: A- Anoplocephala perfoliata; B- Parapnocephala mamillana;
C- Monezia expansa; D- Monezia benedeni.
Fig. (6-10) Different eggs of trematodes: A- Fasciola hepatica; B- Dicrocoelium lanceatum
B
A
B
A
C
D
E
G
F
H
I
J
B
A
C
D
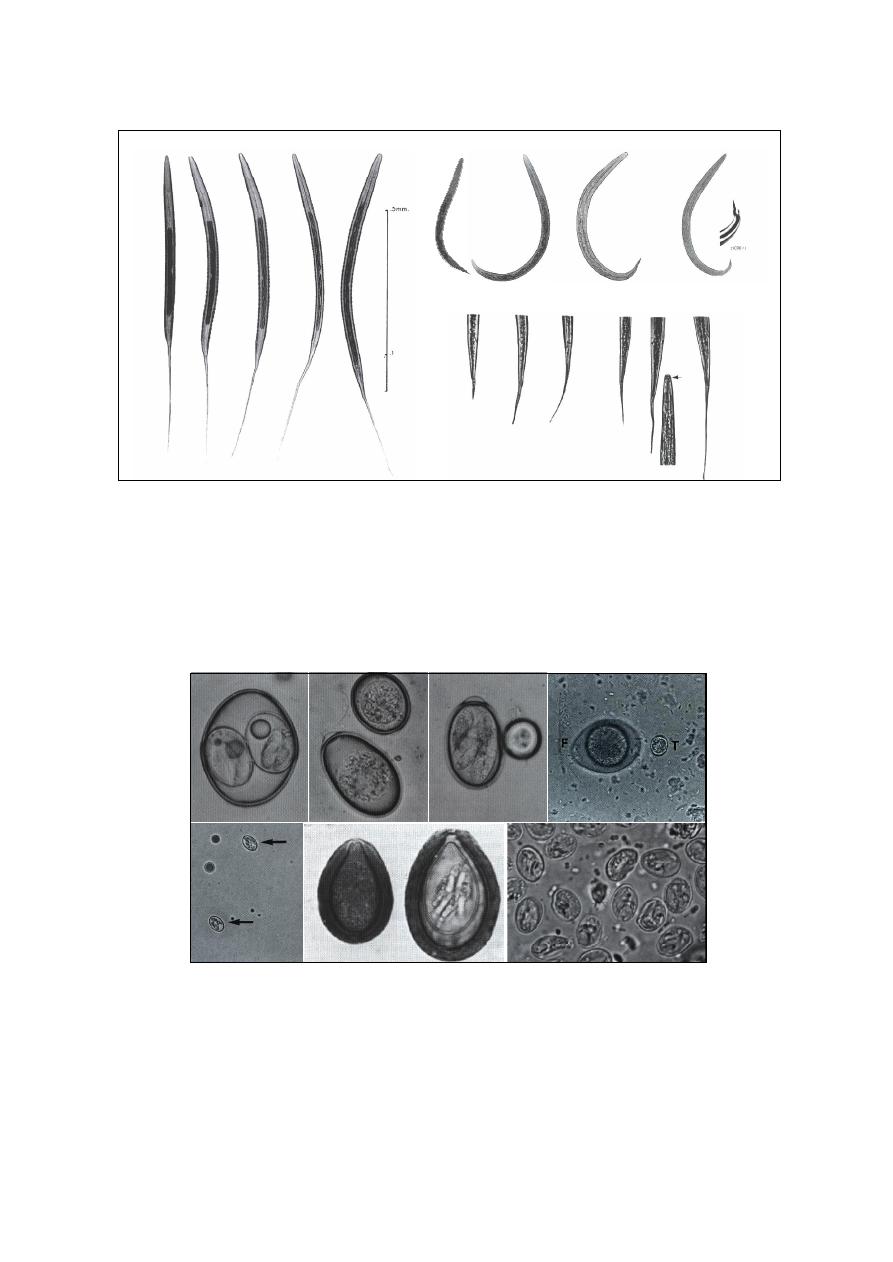
40
Fig. (6-11) Different larvae of trematodes: A- Cyathostominae (have 8 intestinal cells); B- Poteriostomum (has 16 cells);
C- Triodontophorus (has 18 cells); D- Strongylus edentatus (has 18-20 cells); E- Strongylus vulgaris (has 32 cells which
large and long); F- Dictyocaulus viviparous; G- Dictycaulus filaria (has blunt rounded tail and button at the mouth);
H- Protostrongylus rufescens (has conically tapering tail without spine); I- Muellerius capillaries (has curiously shaped
tail with a dorsal spine); J- tail of Trichostrongylus; K- tail of Ostertagia; L- tail of Bunostomum; M- tail of Haemonchus;
N- tail of Cooperia; O- tail of Oesophagostomum; P- anterior end of Cooperia showing the conspicuous oval body.
B
A
C
D
E
F
G
H
I
J
K
L
M
N
O
P
Fig. (6-12) different oocysts of protozoa found in fecal examination: A- Isospora canis
sporulated; B- Eimeria spp. one-cell stage; C- Eimeria spp. Sporulated and have a cap at one
end; D- Isospora felis -F-, Toxoplasma gondii -T-; E- Sarcocystis spp.; F- Eimeria leukarti
unsporulated (left) and sporulated (right); G- Numerous cysts of Giardia.
A
B
C
E
F
D
G
-F-
-T-
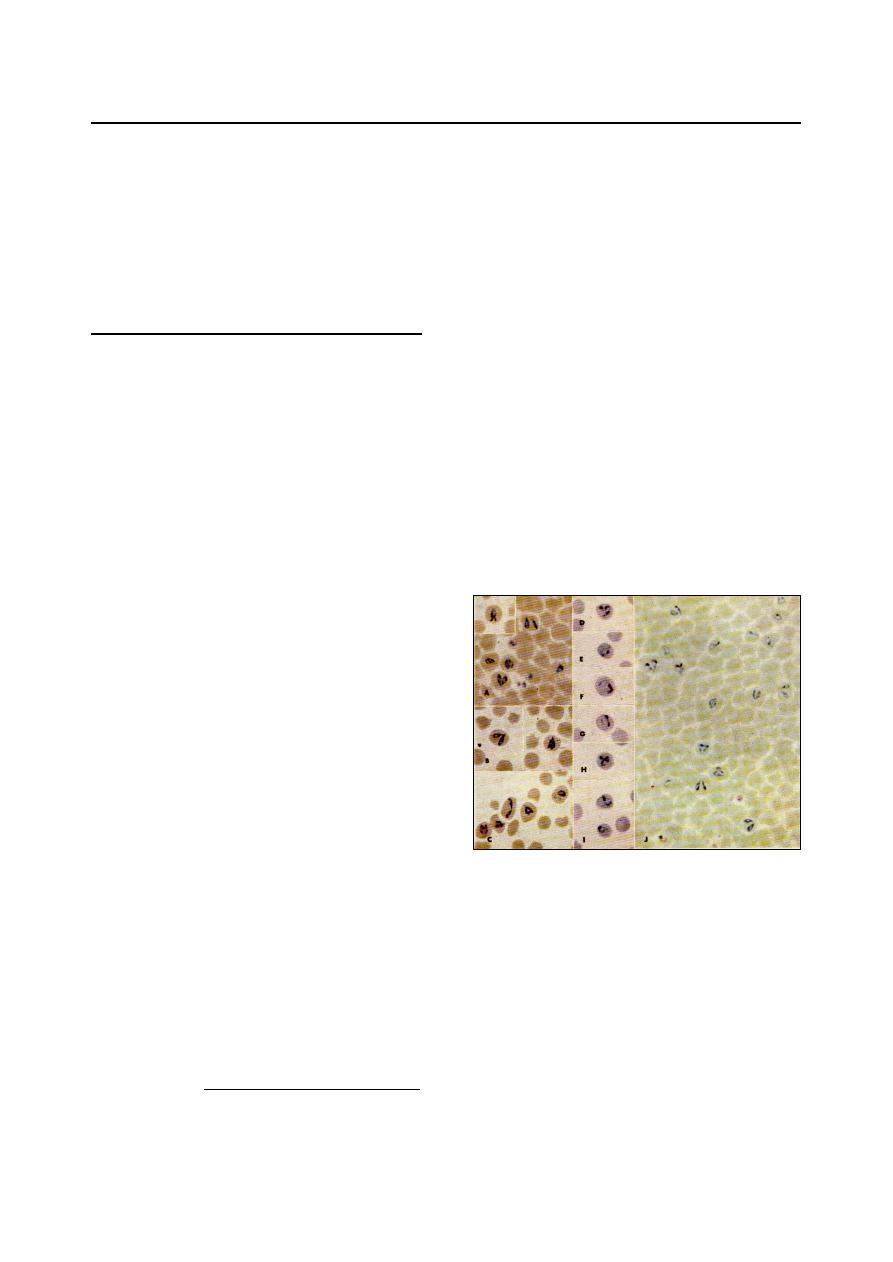
41
B
B
l
l
o
o
o
o
d
d
E
E
x
x
a
a
m
m
i
i
n
n
a
a
t
t
i
i
o
o
n
n
The blood of domestic animals infected with
various pathogenic and nonpathogenic parasites.
These blood-borne parasites include numerous
species of protozoa and several species of larval
nematodes. The diagnosis can be made based on
identification of the parasite in a proper prepared
blood films with an oil immersion objective.
Blood Protozoa
Most of the protozoan parasites that invade
the blood destroy erythrocytes. Blood should be
examined for erythrocytes of abnormal size,
shape, and poor staining reaction. The cell and
plasma should be searched for evidence of para-
sites. A routine blood smear can be examined
and is appropriate for the diagnosis. A Giemsa
stain is most effective, but Wright's stain can
also be used.
In case of chronic infection, few circulating
parasites may be present and diagnosis becomes
more difficult. Immunologic tests are also now
available for some hemoprotozoal infections.
Babesia
Babesia are an intra-erythrocytic protozoan
parasites, appear as pyriform to ovoid bodies,
and occur singly, in pairs, or as multiples inside
the erythrocytes (Fig 6-13).
There are different species of Babesia in
domestic animals:
Horse: B. equi, B. caballi.
Cattle: B. bigemina, B. bovis, B. divergens &
B. majer.
Sheep & Goat: B. ovis, B. motasi, B. folata &
B. tylori.
Dog & Cat: B. canis, B. gibsoni, B. vogeli &
B. felis.
In horses, due to the organisms are rather
difficult to demonstrated in peripheral blood
smaers, other techniques used:
a. concentration and staining technique:
1. blood sample to which EDTA has been
added is centrifuged at 1500-2000 r.p.m
for 5 minutes.
2. thin smear is made from the RBCs just
beneath the buffy coat
1
.
1
Erythrocytes containing Babesia organisms have a
density similar to that of reticulocytes; therefore,
they concentrated just below the leukocytes in a
centrifuged microhematocrit tube.
3. fixed in absolute methyl alcohol 3-5
minutes.
4. stained with Giemsa stain 30-60 minutes.
b. fixed smear technique:
1. these fixed smears of the blood are then
warmed at 45-50
ºc for 20 minute, then
placed directly into buffered distilled
warm water with the stain.
2. since fixation in the methyl alcohol is
eliminated in this procedure the RBCs
will be lacked and the parasites may be
seen free of the cells.
c. plasma concentration technique:
1. the blood treated with EDTA and allowed
to stand for 30 -60 minute.
2. the plasma is removed in its entirely and
centrifuged at 2500-3000 r.p.m for 5-10
minutes.
3. the plasma is removed and the small
button of cells that remain in the tubes'
buttom mixed and placed in a slide.
4. make a smear and stain it by Giemsa stain.
Theileria
Theileria are type of blood protozoa (Fig 6-
14), infect different animal, and have different
species:
Horse: Th. equi.
Cattle: Th. annulata, Th. parva, Th. mutans.
Sheep & Goat: Th. hirci (lestoqaurdi), Th. ovis.
Buffalo: Th. buffeli.
Fig. (6-13) Babesia bigemina in blood of ox.
Note the varied shape of the parasites: annular (I, J
to right), compact (C top right), irregular (C and E),
with double nuclei (D and H), bicornate (A inset),
and many characteristic pairs which are narrowly
divergent.
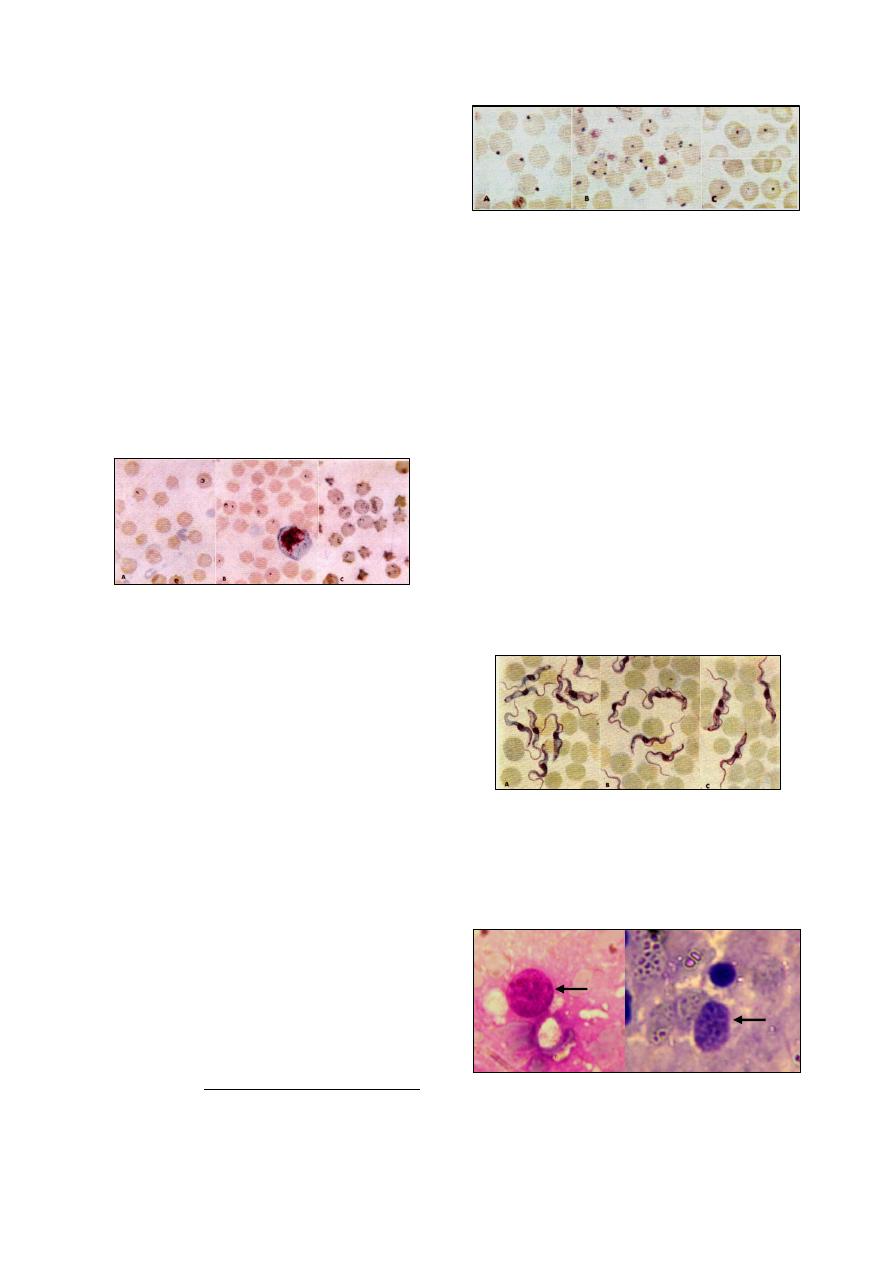
42
Methods of diagnosis
1
:
1.
Examination of thin blood smear stained with
Giemsa under oil emmersion objective. The
parasite appears as oval, round, ring, or dote-
shape inside the RBCs, and occur as a single
or as pairs. The nucleus of parasite is usually
deeply stained, and the cytoplasm stained
with light blue.
2.
Examination of lymph smears:
(a) the biopsy taken from prescapular lymph
node by sterilized syringe with needle
(18G) and spreads on the slide as for as a
thin blood films.
(b) fixed with methyl alcohol for 2-5 minutes.
(c) stain with Geimsa for 30-60 minutes.
(d) examine under oil immersion objective to
see Koch's blue bodies (Macroschizote
stage of Theileria in the lymphocyte cells)
having a size ranged from (4 -10
µ).
Anaplasma
Anaplama are rickettsia-like organisms, appear
as small, round dark purple inclusions inside the
erythrocytes. There are usually more than 1-2 per
cell. The organism must be differentiated from
Howell-jolly bodies. Anaplasma remain in focus
as long as the RBCs edge is in focus, where as
artifacts (or Howell-jolly bodies) usually appear
light in the center when slightly out of focus,
also Anaplasma are uniform in the size and have
a slight halo surrounding them but Howell-jolly
bodies are varies in their size and not surrounded
by halo.
There are two species of Anaplasma infect
different animals: A. marginale, A. centrale.
Examination of the thin blood smears stained
with Giemsa stain under oil immersion objective,
the parasite appears as spherical or dote like
shape ranged between 0.2-0.5
µ in size, found
inside the RBCs (Fig 6-15).
1
Theileria can be examined through tissue section.
The section is usually treated with Giemsa stain
which colors the protozoa differently from the host
tissue .
Trypanosoma
Trypanosoma are type of blood protozoa,
seen intercellulary and is quite large, 60-70
µ
long (Fig 6-16). There are different species of
Trypanosoma in domestic animals:
Horse: T. equiperdum, T. evansi.
Cattle: T. theileri.
Sheep & Goat: T. conolense, T. vivax, &
T. brucei.
Dog & Cat: T. cruzi.
Camel: T. evansi.
Trypanosoma can be identified by direct
smear (wet mount) technique:
1)
Put 1-2 drops of fresh blood on clean slide.
2)
Put a coverslip on the blood drops.
3)
Examine the smear under a microscope.
In chronically infected animals, examination
of blood smears is not sufficiently sensitive to
detect infection, thus a positive serology is
required for diagnosis.
Toxoplasma
Trophozoites
of Toxoplasma gondii are found
in a wide variety of tissues in many hosts (Fig 6-
17).
Fig. (6-16) Trypanosoma evansi in blood of dog.
Fig. (6-15) Anaplasma in blood of ox.
Fig. (6-14) Theileria annulata in blood of ox.
A and B light infections, C heavy infection. Not the
small size of the parasites, each with blue cytoplasm
and red nucleus; ring forms predominate but rod
forms are also seen (C).
Fig. (6-17) Toxoplasma gondii A- trophozoite isolated
from placenta; B- trophozoite isolated from semen
A
B
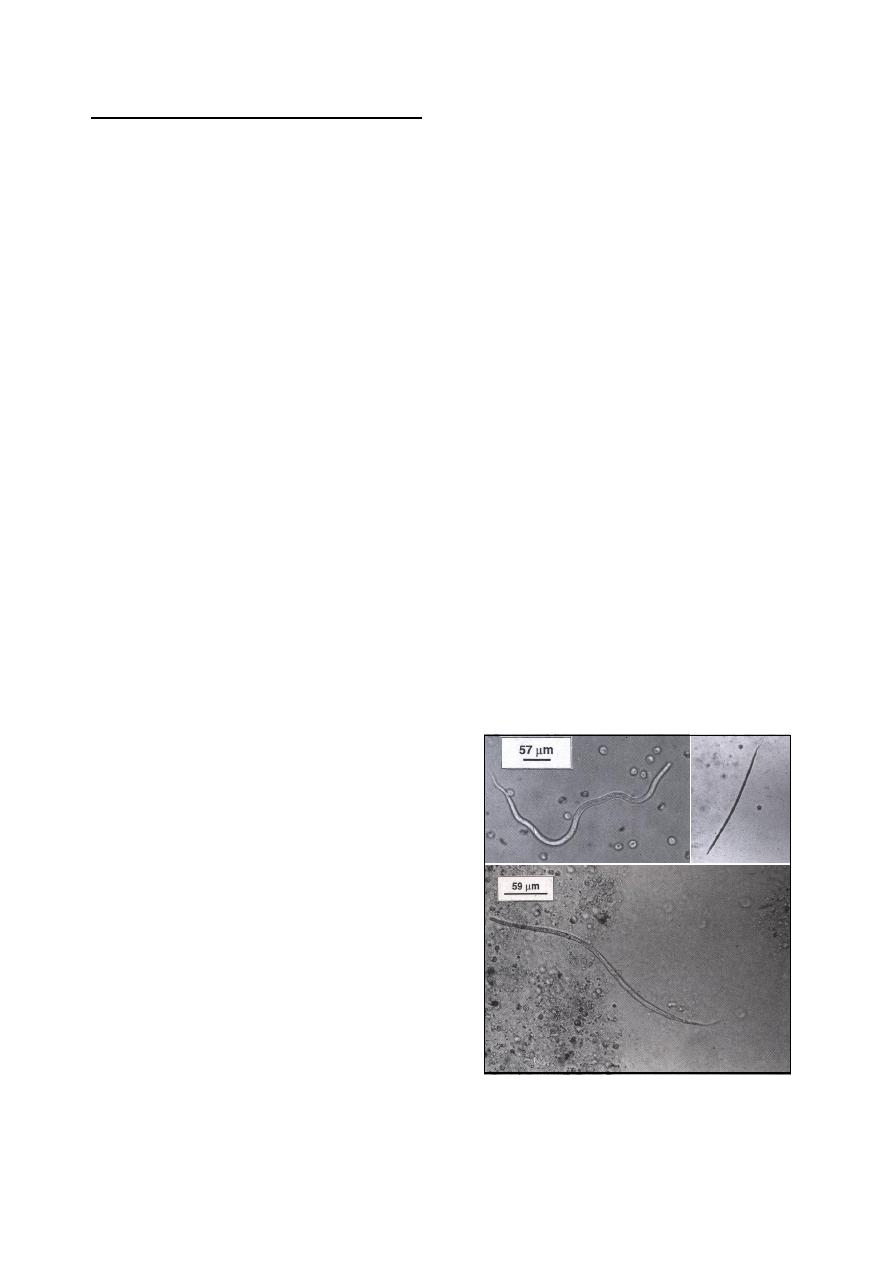
43
Blood Nematodes
There are some nematodes (filariids) whose
larvae (microfilariae) are found in the peripheral
blood (Fig 6-18). The microfilarial stage of these
parasite species remains in the circulation until
ingestion by the bloodsucking intermediate host.
The following nematodes include those filariids
whose microfilariae may be seen during micro-
scopic examination of the blood of domestic
animals:
Setaria equina, the perotonial worm of horses.
Microfilariae (190-256
µm) long are sheathed.
Setaria cervi, the peritonial worm of cattle.
Microfilariae (263-291
µm) long are sheathed.
Elaeophora schneideri, the arterial worm of
sheep. Microfilariae are 270
µm long and 17
µm thick, bluntly rounded cranially and taper-
ing caudally.
Dirofilaria immitis, the heartworm of dogs
and occasionally cats. Microfilariae 310
µm
long.
Dirofilaria striata, a rare parasite of dogs.
Microfilariae are larger than those of D.
immitis.
Dipetalonema reconditum, the subcutaneous
worm nonpathogenic filariid of dogs and its
microfilariae must be distinguished from those
of Dirofilaria immitis. Microfilariae of the D.
reconditum 250-288
µm, have blunt head,
buttonhook tail, curved body shape, and their
motion is progressive.
Microfilariae detection:
Several techniques have been used to examine
blood for Microfilaria.
1.
Direct smear (wet mount) method.
2.
Hematocrit (Buffy coat) method.
3.
Modified Knott's technique.
4.
Filter technique.
Hematocrit (Buffy coat) method::
This method is a concentrated technique, used
on a small volume of blood, but it is only slightly
more sensitive than direct smear and is not used
extensively. The procedure as follows:
Draw fresh whole blood into a microhemato-
crit tubes, as for a routine PCV test.
Centrifuge for 3 times.
Read the PCV, if desired, then find the buffy
coat layer between the red blood cells and
plasma.
Using a file, scratch the tube at the level of
the buffy coat. Carefully snap the tube and
save the part of the tube containing the buffy
coat and plasma.
Gently tap the tube onto a slide, ejecting the
buffy coat layer with a small amount of
plasma. Save the rest of the plasma for a total
protein determination, if desired.
Add a drop of saline and a drop of stain to the
buffy coat. Apply a coverslip and examine for
microfilariae.
Modified Knott's technique:
This method is a concentration technique, and
preferred for heartworm screening because it is
standard, quick, and inexpensive. It is a simple
technique that allows differentiation of micro-
filariae through staining them while lysing the
red blood cells to make the microfilariae more
visible. The procedure as follows:
Collect a sample of venous blood, do not
allow it to clot, and use it promptly.
Mix 1 ml of blood with 9 ml of 2% formalin
in a centrifuge tube.
Centrifuge the tube at 1300-1500 rpm for 5
minutes.
Discard the supernatant fluid, leaving the
sediment at the bottom of the tube.
Add 2-3 drops of 0.1% methylene blue to the
sediment. Using a pipette, mix the sediment
with the stain.
Place a drop of this mixture onto a glass slide.
Apply a coverslip and examine for micro-
filariae using the 10X objective.
Filter technique:
Kits containing filter apparatus, filters, lysing
solution, and stain are commercially available.
Fig. (6-18) A- Unfixed Dirofilaria immitis;
B- Dirofilaria immitis fixed with 2%
formalin and stained with methylene blue;
C- Dirofilaria striata.

44
M
M
i
i
s
s
c
c
e
e
l
l
l
l
a
a
n
n
e
e
o
o
u
u
s
s
P
P
a
a
r
r
a
a
s
s
i
i
t
t
i
i
c
c
E
E
x
x
a
a
m
m
i
i
n
n
a
a
t
t
i
i
o
o
n
n
Parasites of the Urinary Tract
Urine may be examined for nematode eggs
that may include Dioctophyma renale from dogs,
and Capillaria plica from carnivores.
Procedure of examination:
Collect a sample of urine free from contami-
nants.
Centrifuge the sample at 1500 rpm for 2 min.
Decant the supernatant fluid, and mount the
sediment on glass microscope slides.
Apply a coverslip and examine it.
Parasites of the Reproductive Tract
In heavy infestations, particularly in females,
the trichomonads may be seen by immediate
direct examination of mucus or exudate from the
vagina or uterus. Examine with light microscope
at a magnification sufficient to distinguish orga-
nisms 10 to 20 microns long and 3 to 15 microns
wide.
These organisms also may be found in amnio-
nic or allantoic fluids, fetal membranes, and sto-
mach contents of the fetus.
In bulls, they may be found in washing from
the preputial cavity, and rarely in seminal fluid.
If the organisms cannot be found by direct
microscopic examination, the animal must not be
declared negative until culturing has been attemp-
ted using extraxt-glucose-peptone serum (EGPS)
medium, which indicate that the trichomonads
migrate toward the bottom of the tube, whereas
yeasts and molds tends to remain at the top.
Parasites of the Eye
Adult parasites can be recovered from the
conjunctival sac and lachrymal duct. Examination
of the lachrymal secretion may reveal eggs or
first-stage larvae.
Ophthalmic examination may reveal the un-
sheathed microfilaria of Onchocerca cervicalis.
There are different species of eye worm
Thelazia (nematodes) in domestic animals:
Horses: Thelazia lacrymalis.
Cattle, Sheep and Goats: Thelazia rhodensii.
Thelazia gulosa.
Dogs: Thelazia californensis.
D
D
i
i
a
a
g
g
n
n
o
o
s
s
i
i
s
s
o
o
f
f
E
E
x
x
t
t
e
e
r
r
n
n
a
a
l
l
P
P
a
a
r
r
a
a
s
s
i
i
t
t
e
e
s
s
Many arthropods function indirectly in dis-
ease in that
transmit but do not produce disease
conditions; some may inflict their injury by bites,
stings, or other activities, and other species are
parasites. Some are both parasites and mecha-
nical and/or biological vectors of disease.
To diagnose an ectoparasitic infestation, the
technician must
be able to collect the ectoparasite
and then identify the organism involved.
Mites
The common genus of the mites include:
Sarcoptes, Pseroptes, Chorioptes, Notoedres,
Knemidocoptes,
Otodectes, Trixacarus, Demodex
and Cheyletiella (Fig 6-19).
Most common mite infestations are diagnosed
by skin scraping as follows:
The area of skin to be scraped are coated with
mineral oil.
The site selected for scraping should be at the
periphery of a lesion or the predilection site
of the suspected parasite.
The blade should be scraped back and forth
over the skin until capillary bleeding is occur.
The debris collected on the scalpel blade is
then placed on a microscope slide, cover-
slipped and examined
1
(10X).
Mites can also be collected by vacuuming,
using a commercial portable vacuum cleaner and
crevice tool, as follows:
A hose cuff on the end of the crevice tool is
inserted into a piece of 2
3
/
8
-inch plastic tube
with a 3-inch commercial milk filter between
the cuff and plastic tube.
A second hose cuff is attached to this assem-
bly and to the vacuum hose.
The body surface of both large and small
animals is then vacuumed for 5 minutes.
1
Several slides may need to be examined before mites are
found.

45
The filter is removed and the contents scraped
off into a 100-ml beaker and 3-4 ml of 10%
KOH is added.
The mixture is heated, but not boiled, to
dissolve the hair.
After cooling, the resulting material is poured
into a centrifuge tube and saturated sugar
solution is added.
The tube is centrifuged for 5 minutes and the
surface material collected and examined.
Ticks
Ticks are usually larger than mites, ranging in
length from 3-4 mm, and may reach 12 mm or
more in case of engorged females.
There are two groups of ticks are parasitic
(Fig 6-20):
Argasidae (soft ticks) that have a leathery
integument.
Otobius megnini (their larval and nymphal
stages feed on horses,
cattle,
goats and dogs.
Argas persicus (fowl ticks).
Ixodidae (hard ticks) that have a hard dorsal
shield called the scutum.
Boophilus spp.
Rhipicephalus spp.
Dermacentor spp.
Amblyomma spp.
Ixodes spp.
Ticks should be submitted for identification
in 70% alcohol.
Identification of adult ticks:
Identification of adult ticks to the level of
genus is not difficult in veterinary practice. One
of the most useful magnification for identifying
the genus of a hard tick is the shape of the basis
capitulum and mouthparts, the decoration of the
scutum, or ornamentation, is also helpful.
Use a magnifying glass or other source of low
magnification will be helpful.
For close observation (e.g. mouthparts), stan-
dard compound microscope can be used.
Identification of immature ticks:
Identification of immature tick stages is much
more difficult.
Larvae can be recognized by the presence of
only 6 legs.
Nymphs can be recognized by the presence of
8 legs, and absence of a genital pore.
Insects
Insects, like mites and ticks, also belong to
the phylum Arthropoda. All insects have bodies
composed of three parts: the head, the thorax
(which bears the legs), and the abdomen.
The insects of greatest veterinary importance
include the lice, fleas, and flies.
Lice:
Lice are wingless, dorsoventrally flattened,
and divided into two types (Fig 6-21):
Mallophaga: biting or chewing lice.
Anoplura: sucking lice.
Lice and their eggs on large mammals may be
detected by visual exam. A magnifying lens or
dissecting microscope will aid the observation.
Lice may be transferred into saline, immer-
sion oil, or Hoyer's solution on a microscope
slide with fine forceps or a swab or needle mois-
tened with the same material into which the
louse is being placed.
The organism can be recognized as a biting or
sucking louse by gross observation or low mag-
nification. Specific identification to species is
usually not required in veterinary practice.
Fleas:
Fleas are laterally compressed, wingless inse-
cts. They do not demonstrate the normal clear
delineations between body regions (head, thorax,
and abdomen) as many insects.
Fleas may be seen with the naked eye. They
can be collected from the host following incapa-
citation by quick-acting insecticides, dips, or
baths by separating the hair, locating the fleas,
and then grasping them with forceps or combing
them out with a flea comb.
Fleas should be placed in 70% ethanol for
fixation and storage. They may be cleared in 5%
potassium hydroxide to allow visualization of
reproductive structures used in identification.
Flies:
Although the wide variety of adult flies that
may attack or worry animals, several larval flies
are common and serious parasites of domestic
animals (Fig 6-22).
Oestrus ovis: the nasal bot of sheep and goats.
Hypoderma bovis: the warble fly of cattle.
Gastrophilus intestinalis, and G. nasanlis: the
horse stomach bots.
Cochliomyia hominivorax: the larvae of the
screw worm. If the screw worm infestation is
suspected, larvae should be collected in 70%
alcohol for identification.
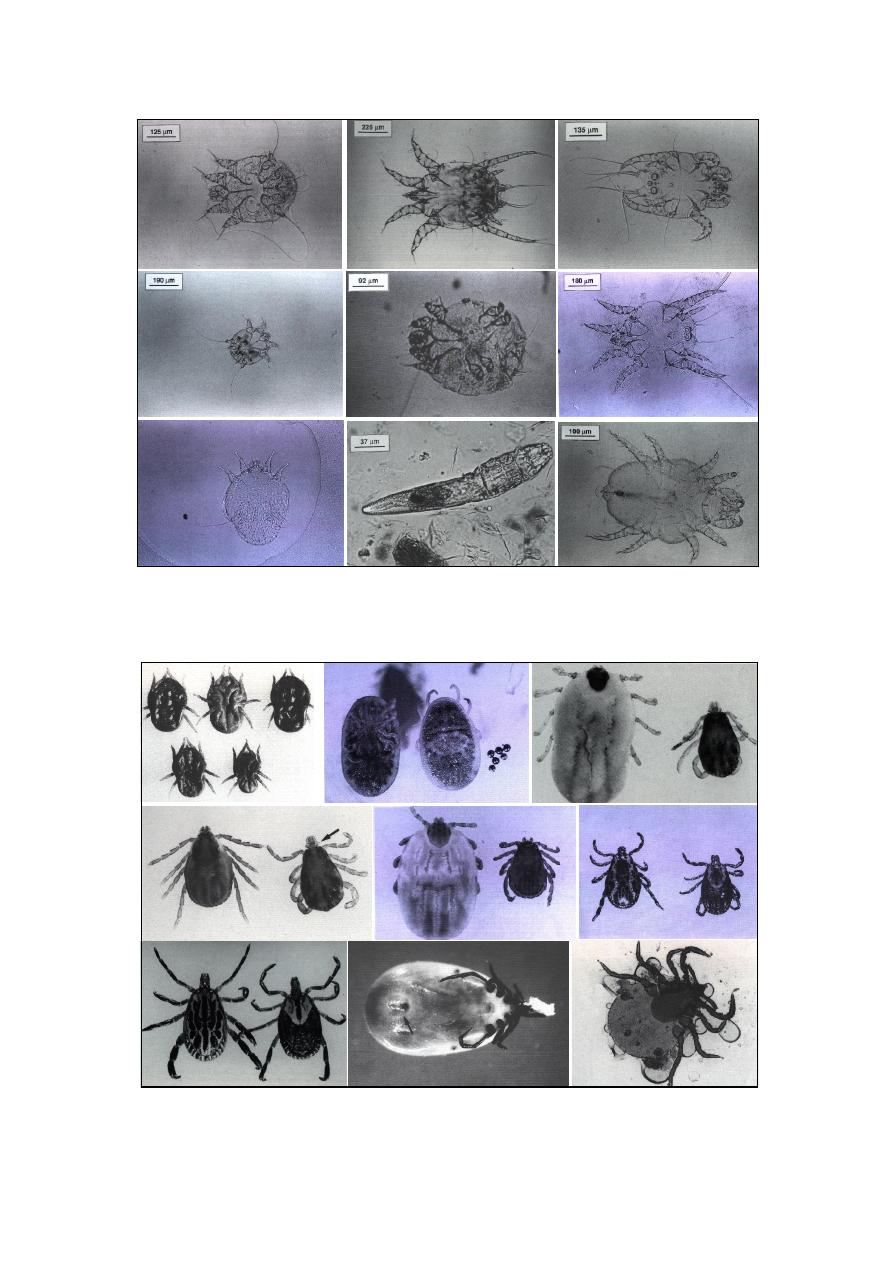
46
Fig. (6-19) A- Sarcoptes scabici male; B- Psoroptes cuniculi; C- Chorioptes bovis male; D- Notoedres cati;
E- Knemidocoptes spp.; F- Otodectes cynotis; G- Trixacarus caviae; H- Demodexi canis; I- Cheyletiella spp.
A
B
C
D
E
F
G
H
I
Fig. (6-20) A- Otobius megnini; B- Argas persicus; C- Boophilus annulata male (right), and engorged female
(left); D- Rhipicephalus sanguineus female (left) and male (right); E- Dermacentor albipictus male (right) and
engorged female (left); F- Dermacentor variabitis male (left) and female (right); G- Amblyomma maculatum male
(left) and female (right); H- Ixodes scapularis ventral view; I- Ixodes damminl nymph.
G
C
A
B
D
E
F
H
I
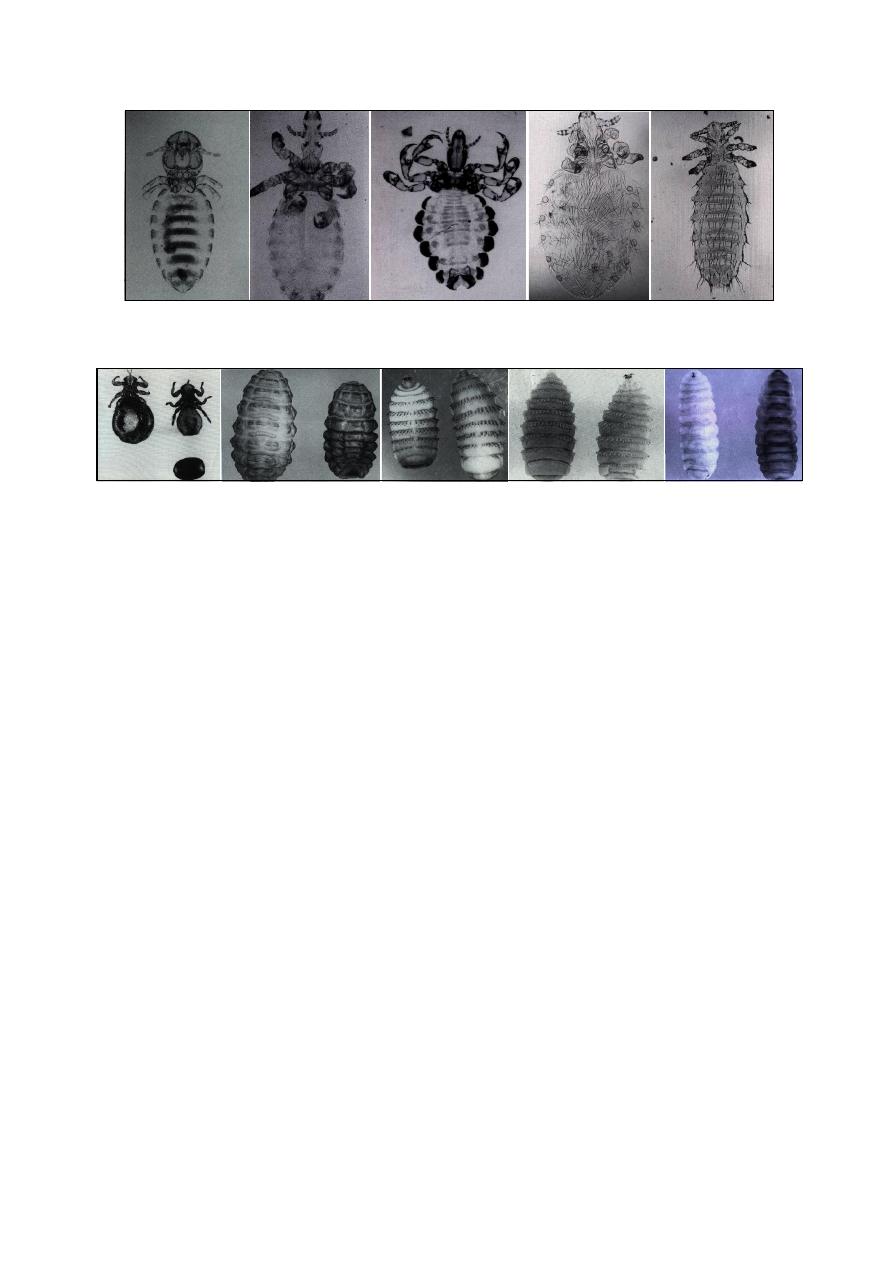
47
References
Abdul-Majeed, M. O. (2005). Clinical, pathological &
therapeutical
studies
of
gastrointestinal
infestation in draught horses in Mosul. MSc
thesis, College of Veterinary Medicine,
University of Mosul, Mosul, Iraq.
Adam, K. M. G., Paul, J. and Zaman, V. (1971).
Medical and Veterinary Protozoology: an
illustrated gaiude. London group Ltd.
Aghwan, S. S. (2005). Investigation of some infection
sources with study of immunological and
pathological effects of Toxoplasma gondii.
PhD thesis, College of Veterinary Medicine,
University of Mosul, Mosul, Iraq.
Bowmen, D. D., Lynn, R. C. & Eberhard, M. L.
(2003).
Georgis'
parasitology
for
veterinarians. 8th ed., Saunders, Elsevier
Science, USA.
Coles, E. H. (1986). Veterinary clinical pathology.
4th ed., WB Saunders Co Philadelphia,
London, Toronto.
Hussain, Kh. J. (2005). Epidemiological and
therapeutical study of internal parasites
infestation in native goats in Mosul region.
MSc. Thesis, College of Veterinary Medicine,
University of Mosul, Mosul, Iraq.
Sloss, M. W., Kemp, R. L. & Zajac, A. M. (1994).
Veterinary clinical parasitology. 6th ed.,
Blackwell Co, Iowa State Press.
Soulsby, E. J. L. (1982). Helminths, arthropods and
protozoa of domesticated animals. 7th ed.,
Philadelphia, Bailliere Tindall, London.
Thienpont, D., Rochette, F. & Vanparijs, O. F. J.
(1979). Diagnosing helminthiasis through
coprological
examination.
Janssen
Foundation, Beerse, Belgium.
Fig. (6-21) A- Bovicola equi the equine biting louse; B- Haematopinus asini the horse sucking louse; C-
Haematopinus quadripertusus the cattle tail louse; D- Linognathus setosus the canine sucking louse; E- Polyplax
spinulosa the rat sucking louse.
Fig. (6-22) A- wingless fly Melophagus ovinus female (left), male (right) and pupa (bottom); b- Hypoderma lineatum cattle
warble; C- Gastrophilus intestinalis an equine stomach bot; D- Gastrophilus nasalis an equine stomach bot; E- Oestrus ovis
the sheep nose bot fly: (left) ventral, (right) dorsal.
A
B
C
D
E
A
B
C
E
D

48
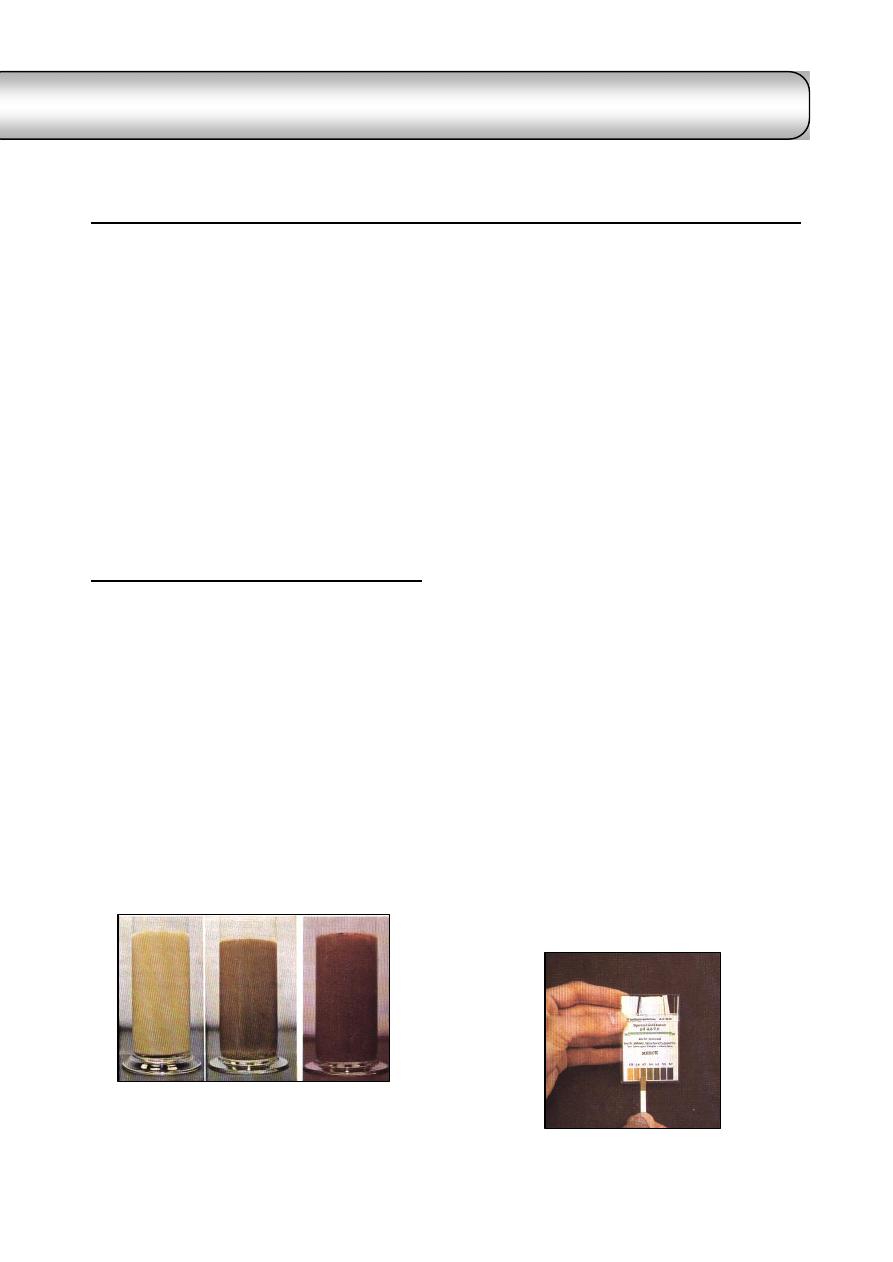
49
C
C
h
h
a
a
p
p
t
t
e
e
r
r
7
7
R
R
u
u
m
m
e
e
n
n
F
F
l
l
u
u
i
i
d
d
E
E
x
x
a
a
m
m
i
i
n
n
a
a
t
t
i
i
o
o
n
n
Rumen fluid examination often essential to
establish an accurate diagnosis of diseases of the
rumen.
The sample should be evaluated as soon as
possible after collection to minimize effects
of cooling and air exposure on protozoal
activity and pH.
Transportation of rumen fluid for long dis-
tance must be done through Jacket container.
Samples stored at room temperature (20-22)
˚c
should be examined within 9 hours of collec-
tion, while samples kept in a refrigerator
(4-5)
˚c should be examined within 24 hours.
Examination of the Fluid
Physical Examination:
(1) Color:
Normal color varies depending on the nature
of feed:
o
Olive to brownish green color: hay ration.
o
Deep green color: green ration.
o
Yellowish brown color: grain or silage.
o
Gray color: fodder beet.
Abnormal color (Fig 7-1) may be:
o
Milky gray color: grain overfeeding.
o
Greenish-black color: prolonged stasis of
the rumen, and/or decomposition of rumen
contents.
o
Gray with clot of milk: calves with abo-
masal reflex or esophageal groove failure.
(2) Odor:
Normal odor is aromatic.
Abnormal may be:
o
Ammonia smell: urea poisoning.
o
Mouldy rotting odor: protein putrefaction.
o
Intensely sour odor: excess lactic acid
production from grain or carbohydrates
overfeeding.
(3) Consistency:
Normal consistency is slightly viscous.
Abnormal consistency may be:
o
Watery: in active bacteria and protozoa.
o
Excess frothy: frothy bloat from primary
tympany or vagus indigestion.
Chemical Examination:
(1) pH:
The pH may be measured by using indicator
paper having a specificity of 0.2 pH (Fig 7-2), or,
better, an electrical pH meter.
Normal pH ranges between 6-7 in animal on
a mostly forage diet, but is lower 5.5-6.5 in
animals fed mostly grain.
Elevated pH (Rumen alkalosis):
o
Simple indigestion.
o
Urea indigestion.
o
Putrefaction of rumen ingestion.
o
Feeding on indigestible roughage.
Lowered pH (Rumen acidosis):
o
Chronic rumen acidosis (pH 5-5.5).
o
Abomasal reflex from abomasal disease.
o
Vagal indigestion.
o
Intestinal obstruction.
Fig. (7-1) abnormal colors of ruminal fluid
(a) milky gray, watery fluid: rumen acidosis
(b) brownish watery fluid: simple inactivity
(c) greenish-black fluid: decomposistion of
rumen contents
Fig. (7-2) pH indicator paper
id23737687 pdfMachine by Broadgun Software - a great PDF writer! - a great PDF creator! - http://www.pdfmachine.com http://www.broadgun.com
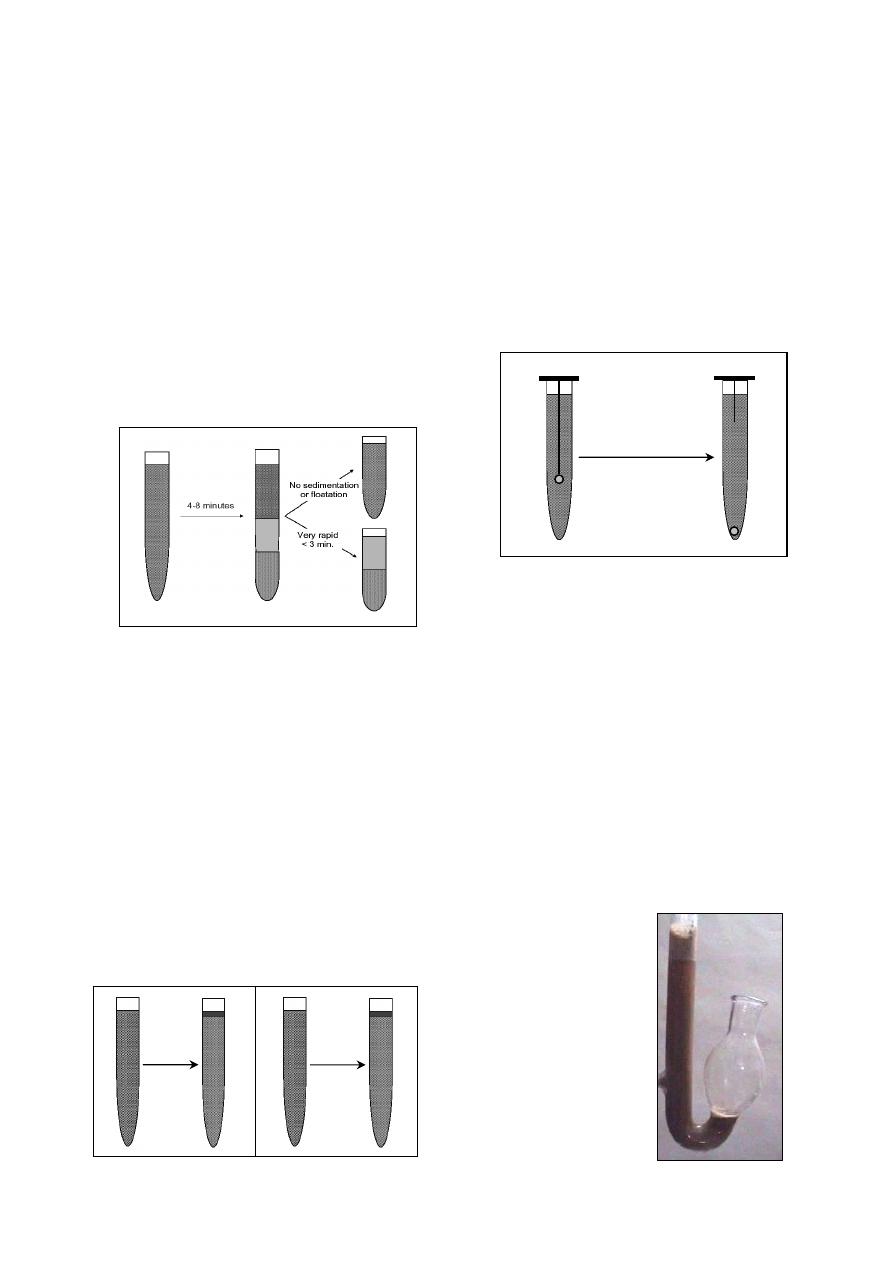
50
(2) Sedimentation activity test:
This test provides a
rapid evaluation of micro-
floral activity.
Put a sample of rumen fluid in test tube and
let to stand.
Measure the time needed for completion of
sedimentation, which is referred to as the
sediment activity time.
Normal time is 4-8 minutes.
Abnormal time may be:
o
Very rapid sedimentation with no floata-
tion occurs in rumen acidosis, prolonged
anorexia, inactive microflora from indige-
stible roughage.
o
No appreciable sedimentation and floata-
tion in frothy bloat, some cases of vagal
indigestion (Fig 7-3).
(3) Methylene blue reduction test:
This test reflects the anaerobic fermentation
metabolism of bacterial population.
Mix 20 ml of rumen content with 1 ml of
0.03% methylene blue in a test tube and let to
stand at room temperature.
Measure the time needed for color of the
mixture to be changed.
Normal rumen fluid from cattle fed on a hay
and grain diet needs 3 minutes to decolorize
leaving a narrow ring of blue color at the top
of decolorizing mixture.
Abnormal reduction of time up to 15 minutes
indicates indigestible roughage, anorexia of
several days, or rumen acidosis (Fig 7-4).
(4) Cellulose digestion test:
Mix 10 ml of rumen fluid with 0.3 ml of 16%
glucose solution in a test tube.
Immerse a thread of pure cellulose (free from
synthetic fiber). The lower end is weighted by
a glass bead (Fig 7-5).
Incubate the tube at 39
˚c.
Record the time for the bead to be dropped
free at the bottom of the tube.
A fully active rumen fluid will digest the
cellulose within 48-56 hours.
The test takes a long time and is not very
accurate.
(5) Glucose fermentation test:
This test measures indirectly the ability of
microflora to breakdown (ferment) glucose by
measuring the volume of gas formed.
0.5 ml of 16% glucose solution is added to 10
ml of rumen fluid.
Place the mixture in a fermentation saccharo-
meter (Fig 7-6) and keep at 39
˚c.
Read the result after 30 and 60 minutes:
o
The normal rate of gas formation is 1-2
ml/hour.
o
If the microbial flora is inactive, little or
no gas forms.
o
In foamy bloat, more gas is formed with
pronouncing foaming.
Fig. (7-3) Sedimentation activity test of the ruminal fluid
Fig. (7-5) Cellulose digestion test of the ruminal fluid
Fig. (7-6) Fermentation
saccharometer.
Fig. (7-4) Methylene blue reduction test of the ruminal fluid
within
3 minutes
normal
more than
3 minutes
abnormal
Record the time for
dropping of the bead
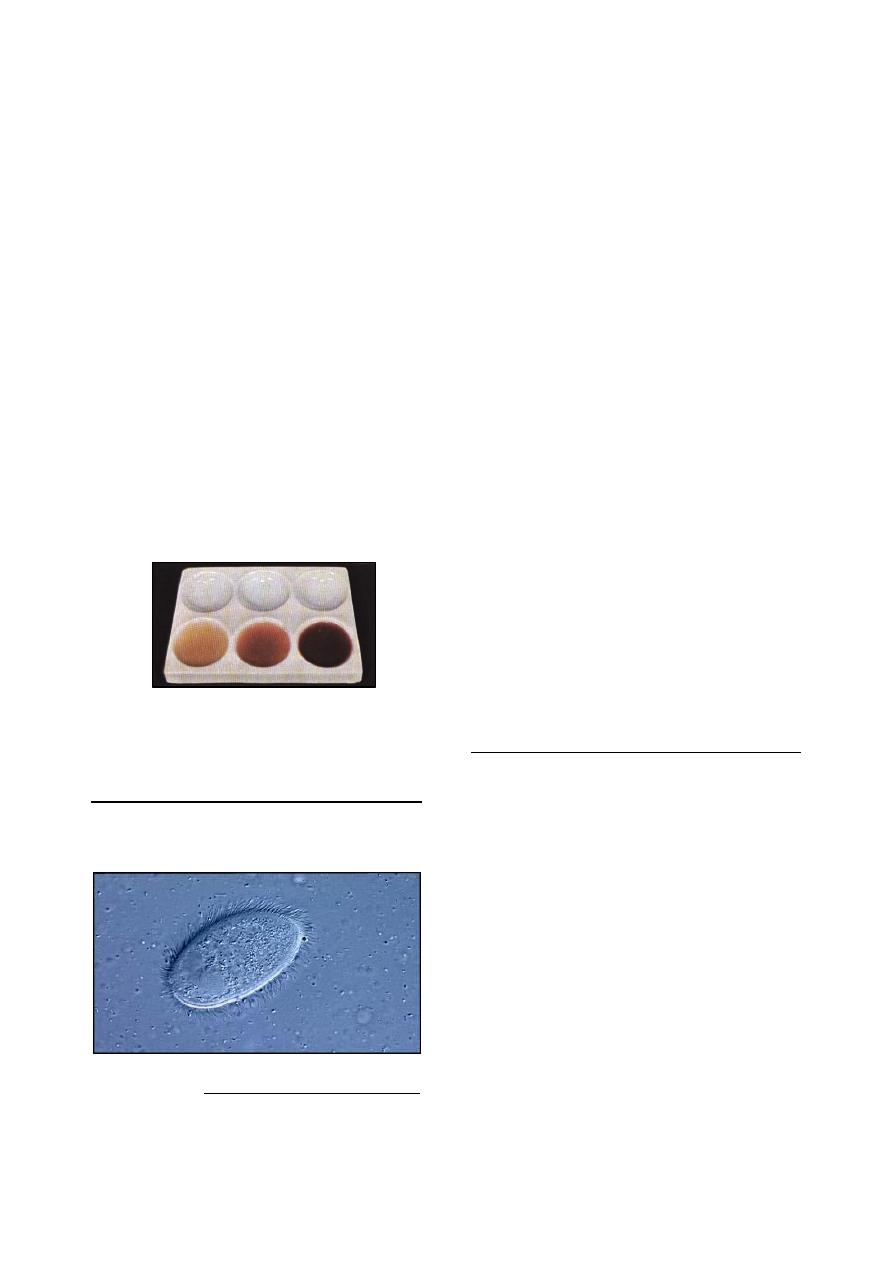
51
(6) Nitrate reduction test:
It is provide an idea on activity of microbes
that synthesize nitrogen compounds.
10 ml of sieved ruminal fluid is placed into
each of 3 test tubes and 0.2, 0.5, 0.7 ml of
0.025% potassium nitrate solution is added to
3 tubes
Put the 3 tubes in water both at 39
˚c.
Every 5 minutes, one drop from each tube is
placed in the small ceramic plate.
To each drop is added 2 drops of reagent I
1
and 2 drops of reagent II
2
.
Observe the change of color.
Sample that contain nitrates are colored red.
o
Rumen fluid of cattle fed a mixed ration
will not change in color after 5-10 minutes
in tube 1 and 20 minutes in tube II, and 30
minutes in tube III.
o
Reduction is more rapid when cattle are
green fodder or have ruminal decompo-
sition or bloat.
o
Reduction is more slower when a deficient
ration is fed or when the animal lacks the
appetite (Fig 7-7).
Examination of the Protozoa
The protozoa of the ruminal
fluid include both
ciliates (Fig 7-8) and flagellates, but only the
ciliates are of physiological importance.
1
Reagent I: 2 ml of sulphanilic acid in 30% acetic acid to
make 200 ml.
2
Reagent II: 0.6 ml alpha-naphthylamine + 16 ml
concentration acetic acid + 140 ml D.W.
Qualitative Examination:
In the qualitative examination, the motility of
the protozoa will examine in a fresh film under
low power magnification (40x to 100x).
+++ highly motile and very crowded.
++ motile and crowded.
+ sluggish motility and low number.
0 no or sporadic alive infusoria.
Quantitative examination:
Strain rumen fluid sample.
Dilute 1 ml of strained sample with 15 ml
saline solution and 5 ml Lugol's iodine
solution.
Shake gently.
Spread 0.1 ml of the mixture on glass slide in
an area under cover glass of the 22
× 50 mm.
Counting is carried out using low power
(10x). The field area of that lens is one square
millimetre.
Count 30 fields in the slide. The average
count in 30 fields represents the protozoal
count over one square millimetre area of the
field.
Multiply the average by 1100 to the protozoal
count in 0.1 mm of the diluent fluid which
represent 0.02 ml of the original sample.
Multiply the obtained figure by 50 to obtain
total protozoal per ml.
Examination of the Bacteria
Bacteria of the forestomachs are vital for
ruminants. Their concentration varies between
10
7
and 10
12
per ml of fluid rumen contents or
per gram of solid contents.
Standard bacteriological techniques such as
direct counting and culture for identification,
differentiation and colony counts have so far
found no application in the clinical examination
of rumen fluid.
Microscopical observation of the forestomach
microflora is useful for diagnosis of rumen
acidosis. Air-dried smear of rumen fluid is
stained by Gram's method, or other staining
methods as nigrosine, Congo red, modification
of Giemsa stain can be applied to fresh or fixed
specimens (Fig 7-9). Criteria used for interpret-
tation of the smear are:
Presence or absence of morphologically disti-
nguishable bacterial species characteristic of
a normal rumen flora, which called "leading
bacteria".
Fig. (7-7) Plate used in the nitrate reduction test
of the ruminal fluid
Fig. (7-8) micrograph of sheep rumenal fluid, shows a ciliated
protozoon in the midst of thousands of bacteria (the small species)
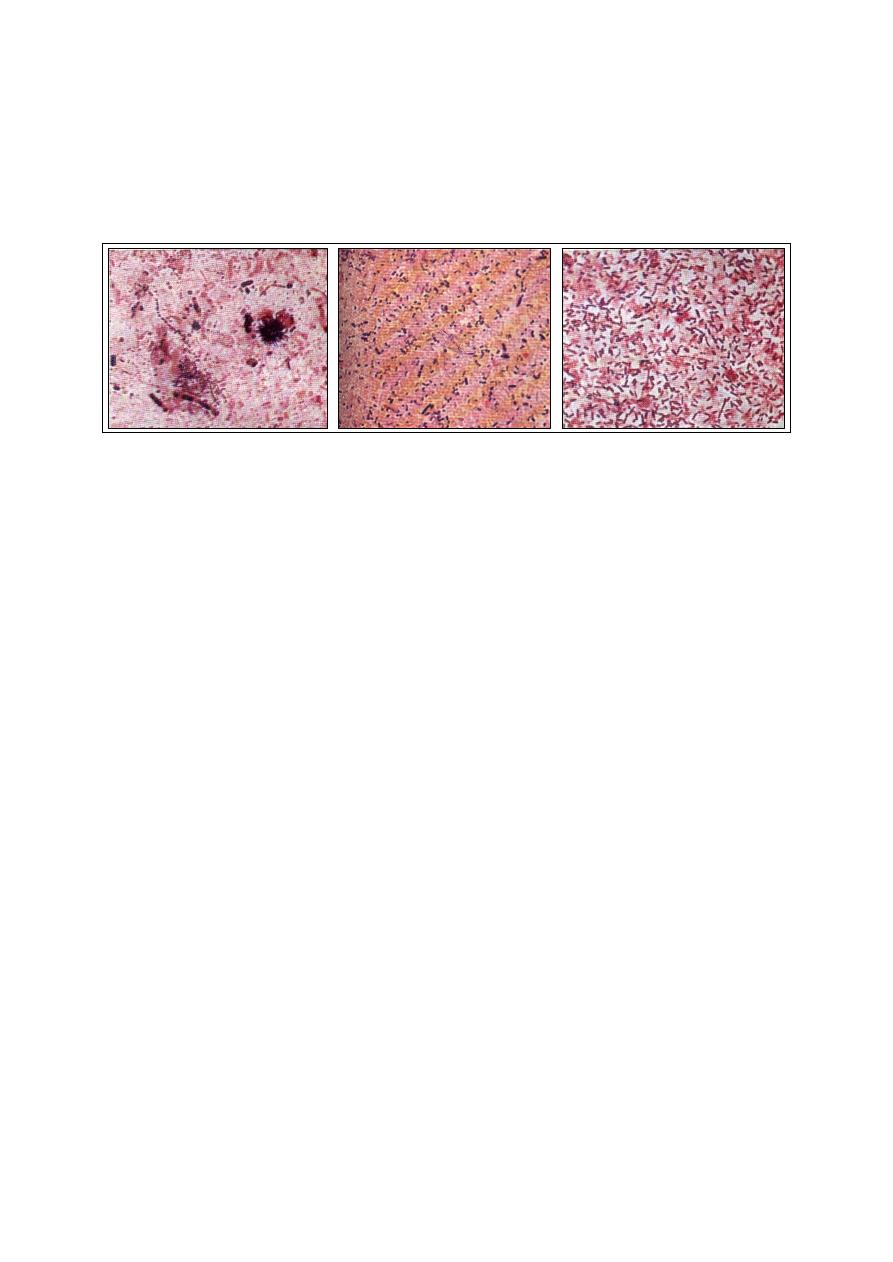
52
The multiplicity or uniformity forms.
The ratio of Gram-positive to Gram-negative
bacteria.
o
A diet rich in starch produces a more uni-
form picture, with Gram-negative cocci,
short and long rods, and a relatively high
proportion of Gram-positive cocci and rods.
o
A digestive disorder involving ruminal ina-
ctivity or decomposition may be suspected
when the leading bacteria associated with a
particular ration are absent, when there is
unusual uniformity in the microflora, or
when there are bacteria that are not normal-
ly present.
References
Rosenberger, G. (1977). Clinical Examination of
Cattle. 2
nd
ed., Verlag Paul Parey, Berlin and
Hamburg, Germany.
Fig. (7-9) smears prepared from rumen fluid, Gram staining, 1500x: (A) rumen microflora, mainly Gram-negative cocci
and rods, associated with mixed ration of hay and concentrate. (B) rumen microflora, mainly Gram-negative and relatively
uniform microflora composed of rods, cocci and Selenomonas, relatively high proportion of Gram-positive cocci and rods,
associated with a very starchy ration. (C) rumen microflora, Gram-negative largely overgrown by Gram-positive (lacto-
bacilli), associated with acute acidosis.
A
B
C

53
C
C
h
h
a
a
p
p
t
t
e
e
r
r
8
8
M
M
i
i
l
l
k
k
E
E
x
x
a
a
m
m
i
i
n
n
a
a
t
t
i
i
o
o
n
n
There are different diagnostic tests routinely
used to evaluate milk quality in animals
1
. These
include:
Physical examination of the milk by strip-cup
examination.
Chemical examination of the milk.
Indirect leukocyte count (screening tests).
Direct leukocyte count (microscopic exami-
nation).
Microbiological examination, to identify the
organism by its reaction in the culture media
as in Hotis test.
Physical Examination (Strip-cup test)
The physical examination of milk done by
strip-cup test, which look for abnormalities in
milk inside the cup, such as flakes, or clots of
milk, fibrin, and mucous. Any of which denotes
active infection of the udder. Latent infection
rarely show these changes.
Chemical Examination
I- pH Determination:
Normal milk has a pH of 6.4 - 6.8 .
Milk from affected udder is abnormally
alkaline, with degree of alkalinity depend
upon the severity of inflammation.
Abnormal milk have a pH as high as 7.4 .
pH should be determined on freshly drawn
milk, although milk held at refrigerator
temperatures for 24 - 48 hours may be used.
Contaminating milk samples or samples
containing a large number of bacteria are not
suitable for testing being exposed to a worm
temperature for a few hours (as lactose
fermenting microorganisms alter pH).
Although determination of milk pH has
limited value in detecting the existence of
udder inflammation, several methods can be
1
A positive test indicates an infected quarter, but a negative
test dose not indicate that the quarter is not infected. The
only positive method for detecting udder infection is the
bacteriological examination of a proper collected sample.
used, but the most common of which is the
use of indicators that change color at or near
the normal pH.
Both bromthymol blue and bromcresol purple
have been widely used for the detection of pH
alterations in mastitic milk.
1- Bromthymol blue test (BTB):
This test will indicate alteration associated
with most acute or subacute cases of mastitis, but
in chronic conditions there may not be sufficient
pH changes detected; because there is so little
active inflammation that exudate is not produced
in a quantity sufficient to cause a pH change.
1 ml of bromthymol blue solution
2
is pipetted
into a 15 ml capacity test tube.
5 ml of milk added with a pipette.
When BTB is added to normal milk, yellow
color appear.
Alkaline milk show green to greenish-blue
color when BTB added, depending on the
amount of alkalinity.
Increase the alkalinity is due to the presence
of exudates containing unusually large
amounts of alkaline salts derived from blood
and lymph.
In late stage of lactation, the test may give
false-positive reaction (milk at this stage
being normally more alkaline than the other
stage of lactation).
2- Bromcresol purple test (BCP):
It is used in the same manner as bromethymol
blue for determination milk pH. It has the
advantage of becoming yellow in a pH range
below 5.2 and thus abnormally acid milk may be
detected.
Add 0.5 ml of bromcresol purple solution
3
to
9.5 ml of milk.
Normal milk produces pale grayish purple
color.
Abnormal milk becomes deep purple with
increased alkalinity.
2
Bromthymol blue solution consists of: (1 g) bromthymol
blue, (160 ml) N/100 sodium hydroxide, (590 ml)
distilled water.
3
Bromcresol purple solution consists of: (0.9 g) bromcresol
purple powder, (100 ml) distilled water.
id23849687 pdfMachine by Broadgun Software - a great PDF writer! - a great PDF creator! - http://www.pdfmachine.com http://www.broadgun.com
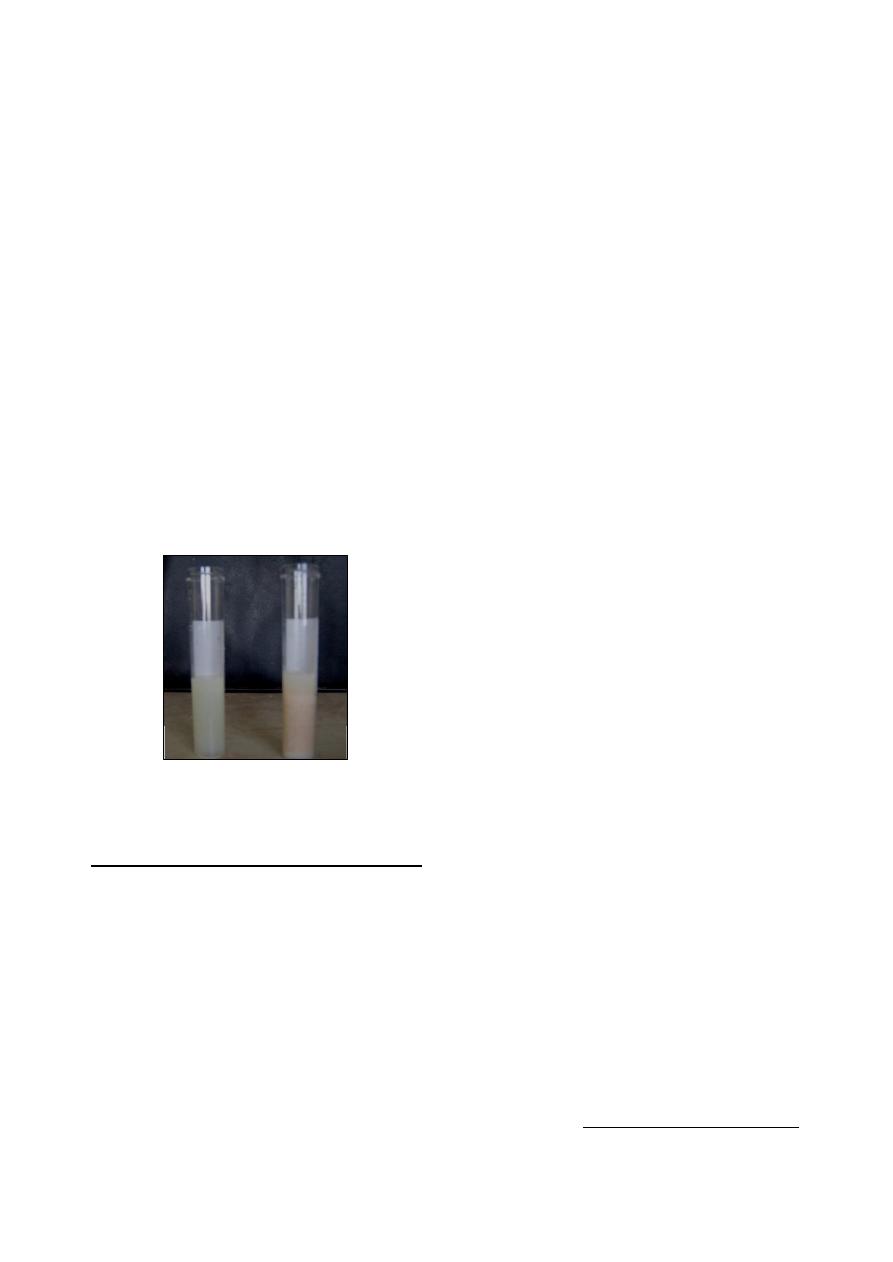
54
II- Chloride Test:
It is depend on the determination of abnormal
quantity of chloride in the milk.
Normal milk contains 0.08 - 0.14% .
Abnormal milk contains greater quantity of
chloride because of the presence of an
inflammatory exudates .
Procedure of chloride test:
Add 5ml of silver nitrate solution to 1 ml of
milk.
Add 2 drops of potassium chromate solution
and mixing by inversion of the tube.
Read the result as follows:
o
The appearance of yellow color indicates
that the sample contains more than 0.14%
chlorides (Fig 8-1, a).
o
Brownish red color indicates that the
sample contains less than 0.14% chloride
(Fig 8-2, b).
Cow in either early or late lactation may give
false positive reaction to the chloride test
because of the normal physiological process
of the udder.
Indirect Leukocyte Count
There are several tests (screening tests) reveal
information regarding the number of leukocytes
present in a milk sample.
I- Catalase Test
Most living cells, including leukocytes,
contain catalase, which is capable of decompo-
sing hydrogen peroxide to gaseous oxygen.
Catalase is not present in significant quantities in
normal milk except in the early or very late
stages of lactation.
A quantitive catalase determination reveals
information regarding to the number of leuko-
cytes present in a milk sample.
Procedure of catalase test:
Mark 15 ml screw cap test tubes at a 10 ml.
volume.
Add 1 ml of freshly prepared 3% hydrogen
peroxide and 9 ml of milk to the mark, the
hydrogen peroxide must be fresh.
Fill the test tube with water.
Cap the tube loosely and invert it in a test
tube rack placed in a shallow pan.
Incubate for 3 hours at room temperature
1
.
Measure the length of the gas column follow-
ing the incubation period.
The percentage of oxygen is calculated by the
following formula:
(Length of gas column
×
100
/
length of milk column)
40% of catalase in milk should be considered
abnormal.
30
– 40 % of catalase in milk should be
considered suspect.
II- Whiteside Test:
This test based on that the nucleic acids of the
leukocytes of milk form sodium salt with NaOH
producing a gelatinous mass to which serum
solids and fat globules become absorbed to pro-
duce a characteristic precipitate of the reaction.
Procedure of whiteside test:
On clean glass slide add 5 drops of milk.
Add one drop of sodium hydroxide solution
5%, mix with loop or glass rod.
Read after
½ to 1 minute, white flakes or
clumps indicate abnormal milk.
Interpretation of the result as follows:
o
Negative: the mixture is milky and opaque
and entirely free of precipitant. In such
animals, the leukocyte count is generally
under 500,000/ml.
o
Trace: the mixture is opaque and milky,
but fine particles of coagulated material are
present. In such milk, the total leuko-cyte
count is usually between 500,000 and 1.5
million.
o
Positive 1+: the background is less opaque
but still some what milky with larger
particles of coagulated material being
present and thickly scattered throughout
the area. The leukocyte count is usually
between 1 and 2 million.
o
Positive 2+: the background is more watery
and are large clumps of coagulated
materials are present. The total leukocyte
count is usually over 2 million.
1
Catalase reaction is dependent somewhat on temperature,
variation in room temperature should be avoided.
Fig. (8-1) Chloride test:
(a) positive result, (b) negative result
(a)
(b)
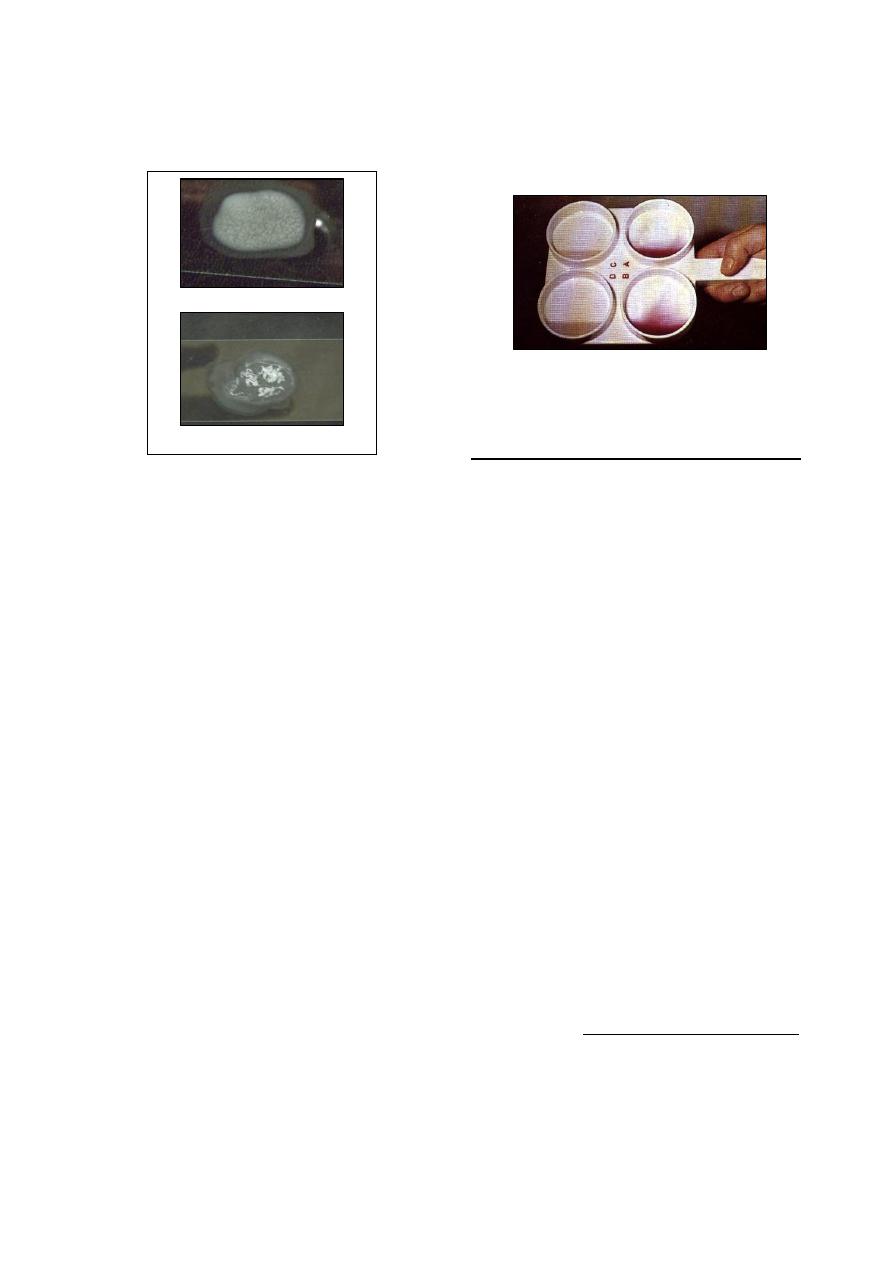
55
o
Positive 3+: the background is very watery
and whey-like, with large masses of coag-
ulated material forming into strings and
shreds.
III- California Mastitis Test (CMT):
This test is rapid, easy and simple test, and
like the White-side test, has a specifity for leuko-
cytes in milk. The reagent used consists of
anionic surface active reagent and an indicator,
bromcresol purple.
The leukocytes of milk (somatic cells) are
ruptured by the reagent releasing their DNA,
which is the principle in the test.
Procedure of California mastitis test:
A white plastic paddle of spherical design,
and having 4 shallow cups is used (Fig 8-2).
About 2 ml. of milk is needed from each
quarter.
The schalm reagent is added in equal volume
to the milk.
The reagent and milk are mixed by gentle
circular movement of the paddle in a
horizontal plane.
The reaction is visible grossly, and with
experience, the intensity of reaction, can be
graded in a manner that correlated well with
the number of somatic cells in the milk.
Result:
o
Negative: the mixture remains liquid with
no evidence of precipitate or gel formation.
o
Trace: slight precipitate which disappears
with continuous movement.
o
Positive 1+: distinct ppt., but no tendency
to gel formation.
o
Positive 2+: the mixture thickens imme-
diately with a slight gel formation. As the
mixture is caused to swirl, it tend to move
towards the center. When the motion is
stopped, the mixture covers the bottom
again.
o
Positive 3+: distinct gel formation which
tends to adhere to the bottom of the paddle.
Direct leukocyte count
With direct leukocyte count, by microscopic
techniques, the total leukocyte count can be more
accurately estimated than with the screening
methods previously described.
Care should be taken to prepare the slide and
complete the examination accurately.
It is possible to give a rough estimate as to
the number of leukocytes present on a slide
by a quick scanning of the slide.
Accurate interpretation are possible only if a
total cell count is complteted.
A direct leukocyte count is completed as
follows:
o
Mix the sample thoroughly, being sure to
disperse the cream throughout the speci-
men.
o
Using either a pipette or a standard 4-mm
loop, spread 0.1 ml of milk over an area of
cm
2
. Ordinary 1
×3 inch microslides are
employed. A card should be prepared or
purchased that outlines 1 cm
2
over which
the milk must be spread
1
.
o
Dry the slide on a flat surface.
o
Stain the slide using Newman-Lampert
stain
2
, which fix the milk film on the glass
slide, remove the fat, and provides an
excellent staining for both leukocytes and
bacteria.
1
In spreading the milk, care must be taken to ensure even
sample distribution over the entire area. Milk that is
thicker in one part of the slide than another may lead to
error in the result, particularly if care is not taken in exa-
mination of the slides.
2
Newman-Lampert stain consists from: (1.12 g) certified
powdered methylene blue, (54 ml) ethyl alcohol 95%,
(40 ml) tetrachloroethane, (60) glacial acetic acid.
Fig. (8-3) paddle used in performing
the California mastitis test
Fig. (8-2) Whiteside test
(a)- positive (1+) result
(b)- positive (3+) result
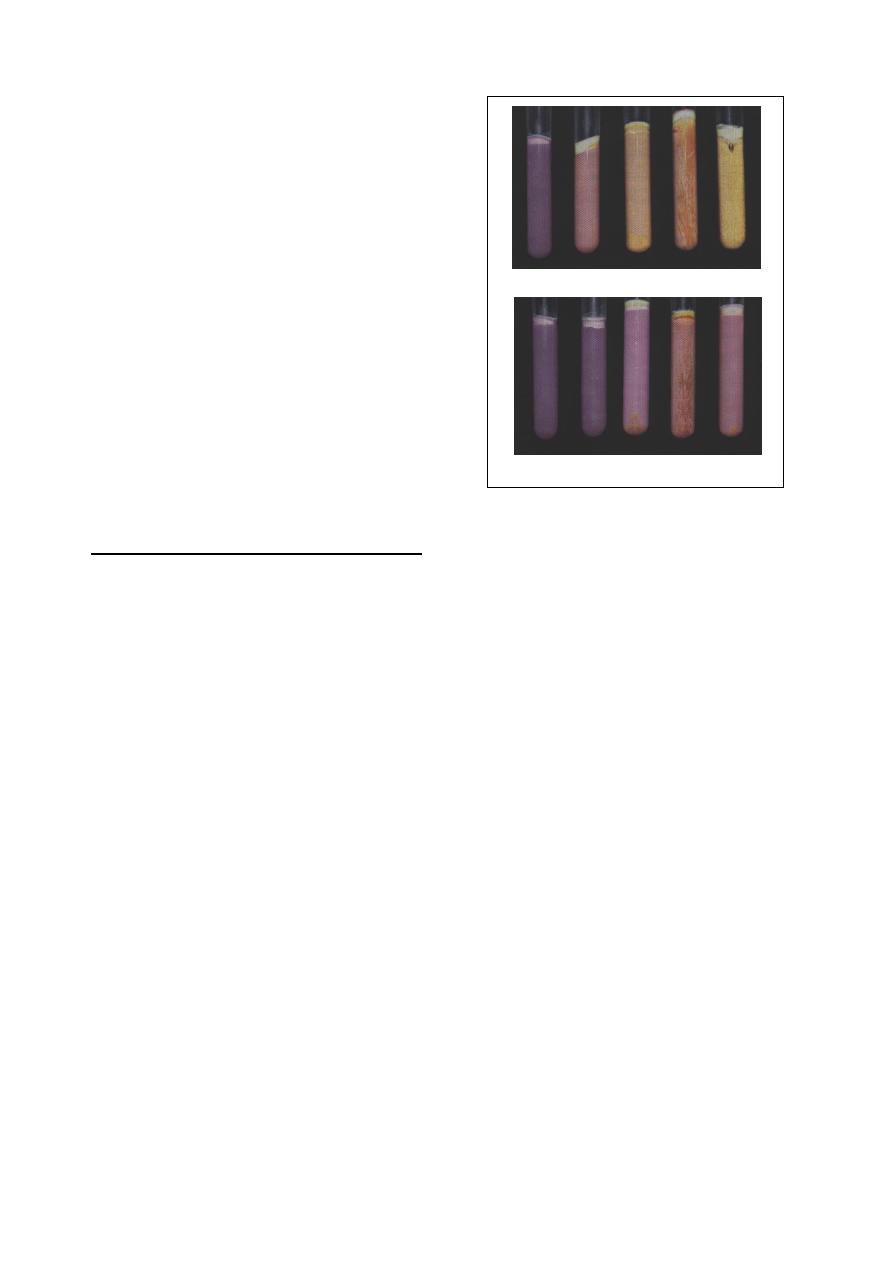
56
o
Microscopic examination should be done
carefully, with the number of fields exami-
ned depending upon the numbers of leuko-
cytes observed. For optimum accuracy, a
minimum of 50 fields should be counted.
o
The final result is calculated by multi-
plying the cells per field (average) by the
microscopic factor by 100 which will give
the number of leukocytes per millilitre.
o
In evaluating the bacteriological status, the
entire smear is examined under the high
dry objective, and if bacteria are observed,
the oil immersion objective is used to
determine morphology.
o
If the sample is incubated for 18-20 hours
and then smeared and stained, the bacterial
population will have increased greatly, and
it is possible to obtain more accurate infor-
mation regarding bacteriological popula-
tion, but less accurate estimation of the
number of leukocytes.
Hotis Test
It is accurate selective test for detection of
Streptococcus agalactia in milk from infected
quarter.
9.5 ml. of suspected milk.
0.5 ml. of 0.5% bromcresol purple solution.
Incubate for 24
– 48 hours at 37ºC .
Result:
o
Light purple, no change: Normal milk.
o
Yellow colonies on the slide of the test
tube or yellow sediment: Streptococcus
agalactia infection.
o
Red or rusty flakes (agglutinated colonies)
on the slide, or red sediment: Presence of
staphylococci or micrococi (72 hours
incubation).
o
If more than one type of organisms is
present, or when the sample is conta-
minated, as combination of changes may
obscure test reaction (Fig 8-4).
References
Al-Moula, Z. H. (2007). Clinical and diagnostic study
of sub clinical mastitis in ewes. Diploma
report, College of Veterinary Medicine,
University of Mosul, Mosul, Iraq.
Coffen, D. L. (1957). Manual of Veterinary Clinical
Pathology. 3rd ed., Bailliere Tindall and Cox,
Ltd.
Coles, E. H. (1986). Veterinary clinical pathology.
4th ed., WB Saunders Co Philadelphia,
London, Toronto.
Rosenberger, G. (1977). Clinical Examination of
Cattle. 2
nd
ed., Verlag Paul Parey, Berlin and
Hamburg, Germany.
A B
C D E
Fig. (8-4) Results of Hotis test. Appearance of
samples after incubation: A, F, negative tests: color
remains unchanged, no flake formation; B, C, D,
and E, characteristic of the several changes typical
for Streptococcus agalactiae, acid formation and
few to many yellow or brown flakes; G, purple
column, white flakes (diphtheroides); H, I, slightly
acid, rust-colored flakes (Staphylococcus aureus);
J, slightly acid, yellow sediment, no flakes
(nonhemolytic staphylococci and streptococci other
than S. agalactiae).
F G H
I
J

57
C
C
h
h
a
a
p
p
t
t
e
e
r
r
9
9
C
C
l
l
i
i
n
n
i
i
c
c
a
a
l
l
M
M
i
i
c
c
r
r
o
o
b
b
i
i
o
o
l
l
o
o
g
g
y
y
The veterinarian dealing with infectious
diseases (bacterial, viral or fungal diseases) must
know how and when to take specimens, what
examination can be completed in the office
laboratory, and how to interpret the results. A
veterinarian should be competent to perform
simple techniques that will assist the diagnosis of
infectious disease processes.
C
C
l
l
i
i
n
n
i
i
c
c
a
a
l
l
B
B
a
a
c
c
t
t
e
e
r
r
i
i
o
o
l
l
o
o
g
g
y
y
Veterinary diagnostic bacteriology concerned
with the recognition and the identification of a
large numbers of microorganisms that either
cause or are frequently associated with infectious
diseases of animals.
The accuracy of the results usually depends
on the following precautions:
Types of the sample taken.
Timing
Care of the sample collection.
Technical errors.
Interpretation of the results.
Methods of Bacteriological Diagnosis
1- Smears:
Smears used for identification of the bacteria
according to their shape, size and staining
characteristics.
Make a smear, fix it and place it on a staining
rack.
The staining solution are flooded over the
entire smear and left on the slide fore the
appropriate time.
After staining, wash the slide gently under
running tape water, and then air dried.
Stains used for bacteriological diagnosis:
(a) Gram stain:
It is used to differentiate between G
+
and G
-
bacteria. G
+
bacteria retain the crystal violet-
iodine complex and stain purple-blue, while G
-
decolorized and are stained red color by the
counter stain.
(b) Ziehl-Neelsen stain (acid-fast stain):
Bacteria whose positive to Ziehl-Neelsen
stain, such as Mycobacterium spp., stain bright
red. The background and other bacteria stain
with blue color.
(c) Modified Ziehl-Neelsen stain:
Bacteria whose positive to this stain, such
as: Nocardia asteroides, Brucella spp. and
Chlamydia psittaci stain bright red. The back-
ground and other bacteria stain with blue color.
(d) Methylene blue stain:
This stain is used specially for Pasteurella
spp. which characterized bipolarity.
(e) Giemsa stain:
This stain used to:
Stain Spirochaetes such as Borrelia anserine.
Stain
Rickettsial
organisms,
such
as
Haemobartonella felis.
Demonstrate the capsule of Bacillus anthracis.
Demonstrate the morphology of Dermatophi-
lus congolensis more clearly than Gram stain.
(f) Polychrome methylene blue stain:
This stain is used specially for Bacillus
anthracis which is stained blue, and the capsular
material stained with pale pink color.
2- Bacteriological Media:
Diagnostic bacteriological media can be
divided into the following categories:
Basic nutritive media:
These are capable of sustaining broth of the
less fastidious bacteria. Nutrient agar is an
example for these media.
Enriched media "agar media":
These are used for fastidious bacteria growth,
and usually enriched with blood, serum, or egg
yolk. Blood agar is an example for these media.
Enrichment broth:
Liquid media that are selective for a
particular bacteria, such as selenite broth for the
selection of the salmonella.
Selective agar media:
These media used for the growth of a
particular bacterium or group of bacterium, and
id23938875 pdfMachine by Broadgun Software - a great PDF writer! - a great PDF creator! - http://www.pdfmachine.com http://www.broadgun.com

58
are used extensively in diagnostic bacteriology.
They contain inhibitory substances that prevent
the growth of unwanted bacterial species.
Brilliant green and MacConkey agar are exam-
ples for these media.
Indicator media:
These are particularly useful for diagnositic
bacteriology. They are designed to:
o
Give
presumptive
identification
of
bacterial colonies due to the biochemical
reactions in the media.
o
Give color changes in the media due to
they contain fermentable sugar plus a pH
indicator.
o
Show hydrogen peroxidase production
(XLD agar) or aesculin hydrolysis
(Edwards medium).
o
Show the type of hemolysis of a particular
bacterium, such as blood agar.
Preparation of Culture Media
Use a clean glass ware "flask", that has been
rinsed free from detergents and other
chemicals.
Weigh appropriate amount of dehydrated
medium, place it in a flask, and then add
distilled water
1
to it.
Close the flask orifice by the appropriate
piece of cotton and aluminum foil.
Dehydrated media containing agar is best
dissolved by bringing to the boil with
continuous stirring using a glass rode or a hot
plate that incorporates a magnetic stirrer
system, while media not containing agar can
usually be dissolved with gentle agitation.
The media then sterilized in an autoclave at
121
˚c for 15 minutes
2
.
After autoclaving, broth or media should be
cooled in a water bath at 50
˚c.
Pour the broth into a screw-capped bottle,
while the media poured into the Petri dish,
not more than 15 ml per one Petri dish, then
allow to dry thoroughly at room temperature
or for a few hours in the incubator at 37
˚c.
Petri dishes stored agar-side upward in a
refrigerator at 4
˚c.
1
Distilled water must be used; because it is free from
chloride and heavy metal ions that can be inhibitory to
bacteria.
2
(a)
Some media, such as Edwards, contain ingredients
that can not tolerate high temperature, therefore can be
autoclaved at 115
˚c for 20 minutes, or according to
manufacture instructions.
(b) Brilliant green agar is inhibitory to many bacteria, this
brought to the boil only and not autoclaved.
Notes:
The medium is prepared in a flask with a
capacity of about twice the final volume of
the medium, to allow adequate mixing and
frothing of the medium during heating.
Some additives to medium, such as serum or
red blood cells, will not tolerate high tempe-
rature and are added as a sterile solutions
once the medium has cooled to 50
˚c.
Inoculation of Culture Media
The technique differs according to the nature
of the sample (Fig 9-1).
(a) Organs (liver, spleen, joints, etc):
Sterile the surface of the organ by smearing
it with heated spatula.
Take a part or three loopful from the
interior of the organ under the heated area.
Inoculate it on the periphery of the plate,
then streaking.
(b) Fluids (urine, sputum, exudates):
Centrifuge the sample at 3000 rpm for 15
minutes.
Discard the supernatant fluid and inoculate
the plate from the sediment.
(c) Swabs (pus, blood, feces, etc):
Replace the swabs in glucose broth (except
fecal material).
Incubate the broth containing swab at 37
˚c
for 90 minutes.
Inoculate the plate with the moist swab, or
few drops from the broth.
Reincubate the broth containing the swab
for 24 hours, for further examination or
application of sensitivity test.
Streaking of the Plate
Place a loopful of the inoculum near the
periphery of the plate.
Heat the loop and then cool it, streak the
inoculum by several perpendicular lines.
Flame and cool the loop, then streak from the
fore mentioned lines.
Lift the loop, streak the center of the plate
with zig-zag motion or lines to obtain isolated
surface colonies (Fig 9-2).
Notes:
The streaking of the plate should be done
under a septic condition inside hood.
The cover of the Petri dish should be closed
between each step.
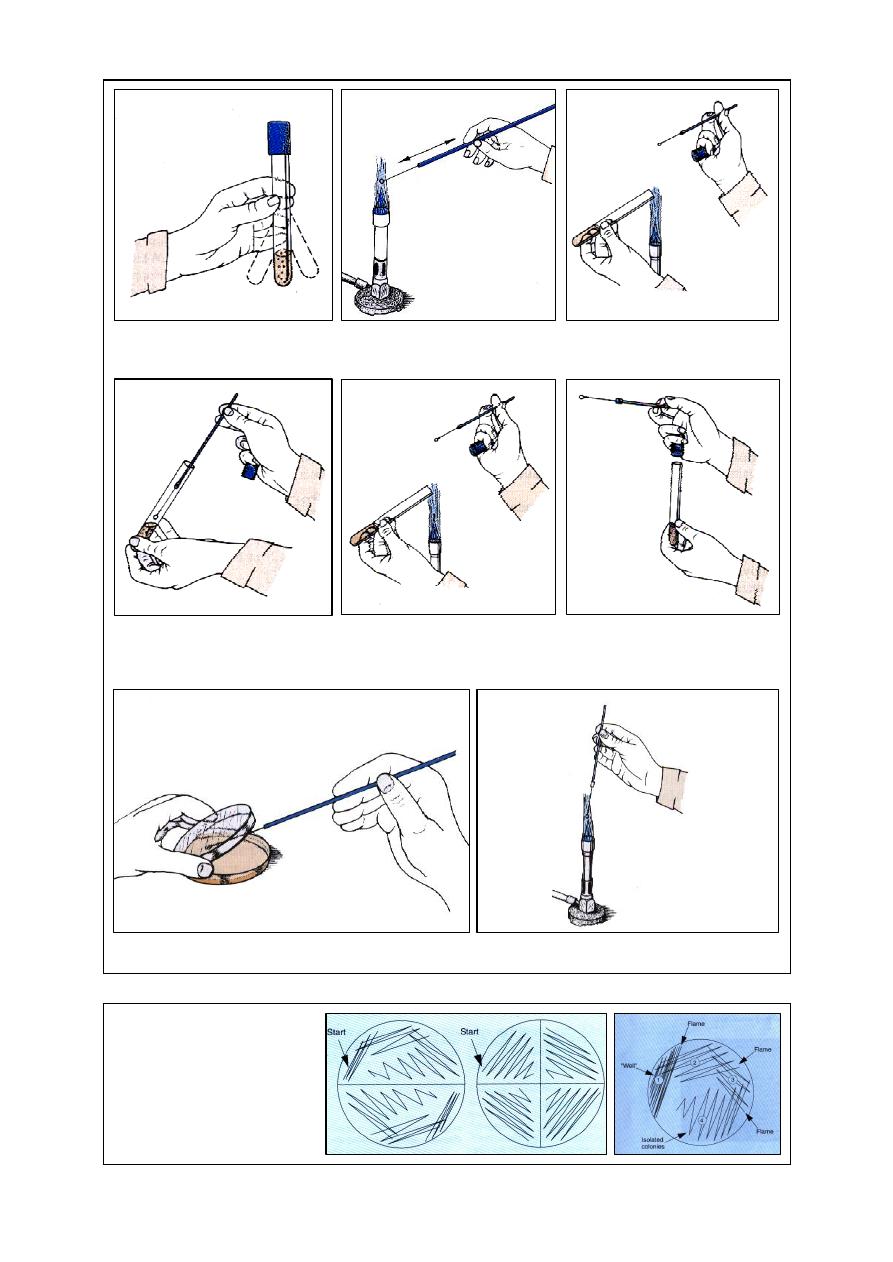
59
(a) Shake the culture tube side to side
to suspend organisms. Do not moisten
the cap on tube.
(b) Heat the loop and wire to rod-hot.
Flame the handle slightly also.
(c) Remove the cap and flame the
neck of the tube. Do not place the cap
down on the table.
(d) After allowing the loop to cool for
at least 5 seconds, remove a loopful of
organisms. Avoid touching the sides
of the tube
(e) Flame the mouth of the culture
tube again
(f) Return the cap to the tube and
place the tube in a test-tube rak
(g) Streak the plate, holding it as shown. Do not gouge into the
medium with the loop.
Fig. (9-1) Routine for inoculating a Petri plate.
(h) Flame the loop before placing it down
Fig. (9-2) Streaking the agar plates,
(a) quadrant method for obtaining
isolated bacterial colonies, (b) half
plating and quarter plating on agar
media, used only if the sample is
likely to contain small numbers of
bacteria
or
a
single bacterial species.
(a)
(b)
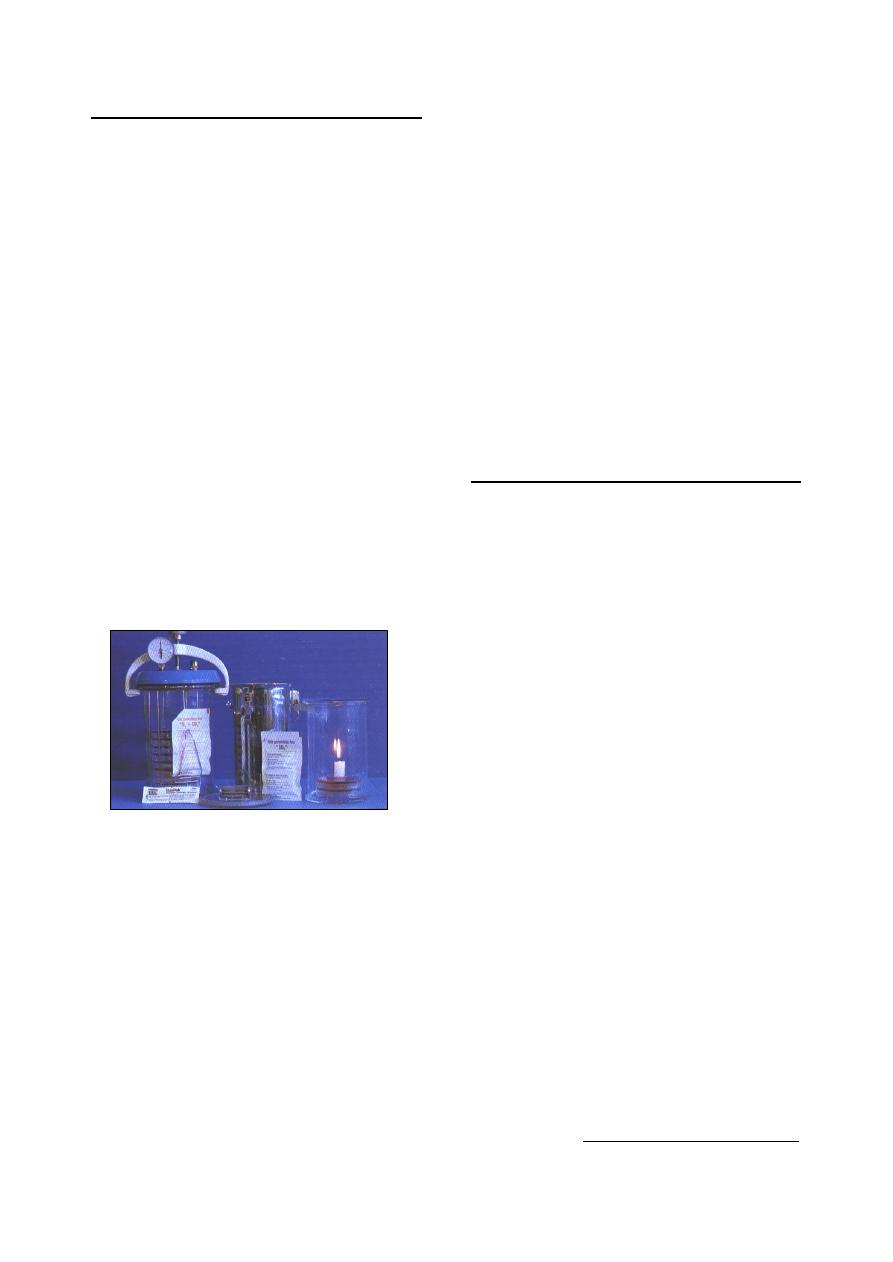
60
Incubation of the plate
(a) Incubation atmosphere:
Normal atmosphere (aerobic), for most of the
pathogenic bacteria.
5-10% CO
2
, for:
Actinobacillus pleuropneumoniae
Actinomyces viscosus
Brucella spp.
Campylobacter jejuni, and C. fetus :
(optimally 6% O
2
, 10% CO
2
, 84% N
2
)
Dermatophilus congolensis:
(need CO
2
in primary isolation only)
Francisella tularensis
Haemophilus spp.
Taylorella equigenetalis.
Anaerobic, for:
Actinomyces bovis
Bacteriodes spp.
Campylobacter mucosalis
Clostridium spp.
Eubacterium spp.
Fusobacterium spp.
Peptostreptococcus spp.
Serpulina hyodysenteriae
Culturing microorganisms under incubation
atmosphere require (Fig 9-3)
(b) Incubation temperature:
37
˚c: most of the pathogenic microorganisms.
42
˚c:
Campylobacter jejuni
Serpulina hyodysenteriae
28-30
˚c: Leptospira interrogans serovars
25
˚c:
dermatophytes except Trichophyton
verrusosum that tolerates 37
˚c.
4
˚c: for cooled enrichment of:
Listeria monocytogens (from brain).
Yersinia enterocolitica (from feces).
Y. Pseudotuberculosis
(from feces).
(c) Incubation time:
24-48 h: most of the rapidly growing bacteria.
48-72 h: the rapidly growing bacteria when
plated on selective media.
4-6 days: Brucella spp., Campylobacter spp.,
Nocardia asteroides, Mycoplasma spp., the
relatively fast-growing fungi.
2-3 weeks: most of the Dermatophytes and
Mycobacterium avium.
3-8 weeks: Mycobacterium bovis.
4-16 weeks: Mycobacterium paratuberculosis
Note:
Rickettsiae, Chlamydia psettaci, Bacillus
piliformis and some Mycobacterium are not
grown on conventional agar media. These micro-
organisms can be cultured in the yolk sac of
fertile hens' eggs and/or in selected cell cultures.
Identification of Bacteria
Identification of the bacterial pathogens
essentially depends on:
Knowledge of the animal species, clinical
signs and/or the type of pathological lesions.
Examination of stained smears made directly
from specimens.
The growth and colonial characteristics of the
bacterial pathogens on:
o
Blood agar: size and morphology of the
colonies, for example: rough colony,
smooth, pigment production, haemolysis
and and type of haemolysis.
o
Selective-indicator: through demonstration
of some biochemical reactions of the
bacterium.
The atmospheric conditions needed for the
growth.
Biochemical and other tests carried out on a
pure culture of the suspected pathogen.
Primary identification of bacteria:
Gram stained smear:
o
Bacteria either positive or negative to
Gram reaction.
o
Bacteria either coccus or rods.
Growth or absence of growth on MacConkey
agar.
Catalase and oxidase tests.
Motility test.
Oxidation-fermentation test.
Other tests including: LANA
1
test, KOH test
and susceptibility to vancomycin.
1
LANA: L-alanine-4-nitro-anilide.
Fig. (9-3) apparatus used for culturing micro-
organisms under different atmospheric conditions:
anaerobic and CO
2
jars with gas generating enve-
lops and candle jar with generates approximately
2.5% CO
2
.
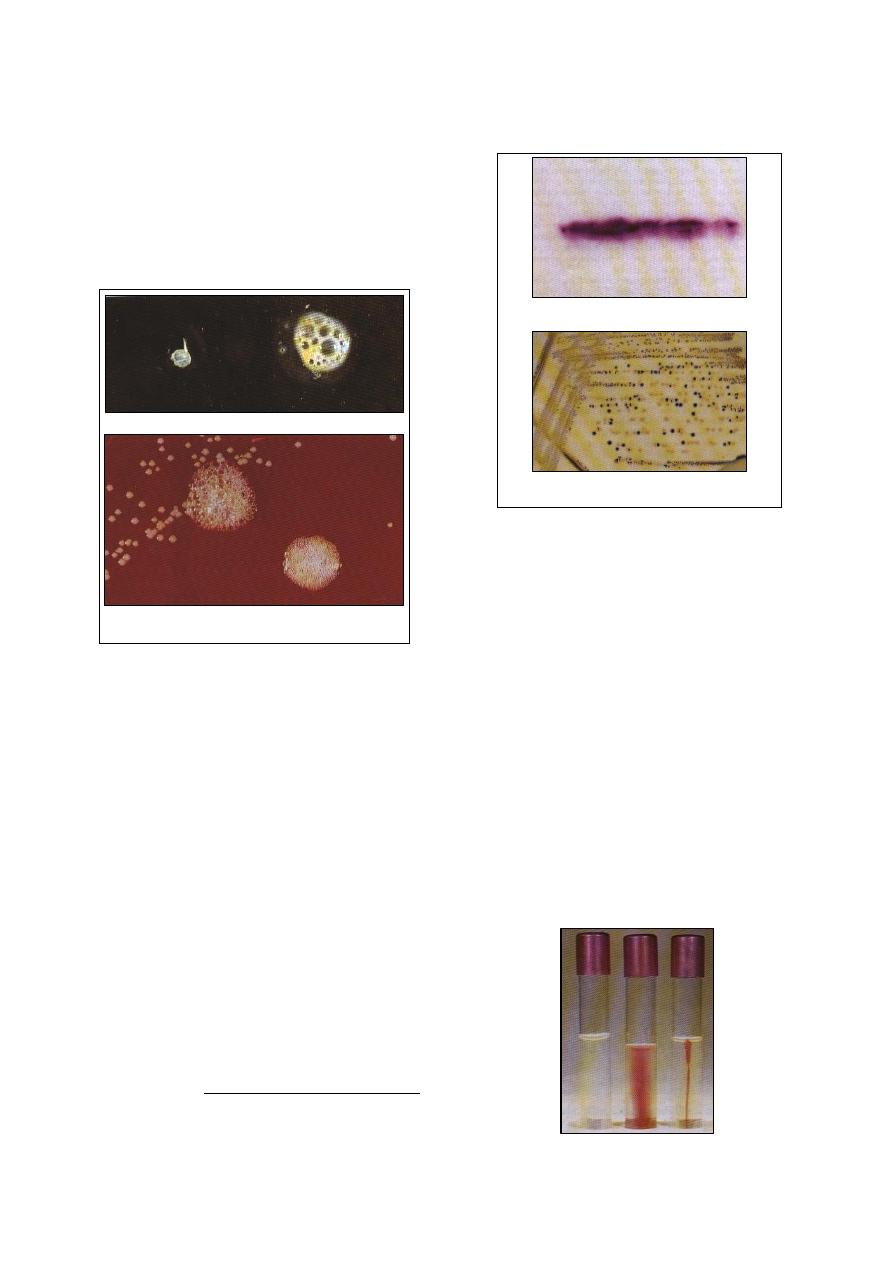
61
Catalase test:
This test detects the enzyme catalase that
converts hydrogen peroxide to water and gaseous
oxygen.
A loopful of bacterial growth is taken from
the top of the colonies
1
and place it on a clean
microscope slide.
Add a drop of 3% hydrogen peroxide
2
.
An effervescence of oxygen gas within a few
seconds indicates a
positive reaction (Fig
9-4).
Oxidase test:
This test depends on the presence of
cytochrome oxidase in a bacterial cell.
Method (1):
A piece of filter paper is moistened in a Petri
dish with 1% aqueous solution of tetramethyl
-p-phenylenediamine dihydrochloride.
The tested bacterium is streaked firmly a
cross the filter paper with a glass rod.
A dark purple color a long the streak line
within 10
seconds indicates
a positive reaction
Pseudomonas aeruginosa can be used as a
positive control organism.
Method (2):
Mix equal volumes of 1% alphabaphthol in
95% ethanol and 1% aqueous solution of p-
amino-dimethylaniline oxalate.
Place a drop of mixture on the surface of a
few colonies on blood agar plate.
1
Care must be taken when the bacterium has been grown
on blood agar; because the presence of red blood cells
can lead to a false positive reaction.
2
Hydrogen peroxide should be stored at 4
˚c in a dark bottle
.
A positive reaction is a development of a blue
color on colonies within 10-30 seconds (Fig
9-5).
Motility tests:
The majority of bacteria are motile by means
of flagella. Some bacteria tend to be motile at
ambient temperatures, but not at 37
˚c.
Semi-solid motility media are available. Tetra
zolium salts can be add to aid in the detection
of the motility.
Motility media are prepared in test tubes.
Two tubes of the medium are stab-inoculated
using a straight wire. One tube is inoculated
at room temperature, and the other at 37
˚c.
The tubes are examined for motility after 24 h
and 48 h. motile bacteria migrate through the
media which becomes turbid.
Tetrazolium salts are colorless, but as the
motile bacteria grow, the dye is incorporated
into the bacterial cells where it is reduced to
an insoluble red pigment, while a non-motile
bacteria are confined to the stab line (Fig
9-6).
(a) Catalase test on a slide, negative (left), positive (right)
(b) Positive catalase test on a blood agar
Strong reaction (left), Weak reaction (right)
Fig. (9-4) Catalase test
(a) Oxidase test, filter paper method. A purple
color with 10 seconds indicates a positive reaction
(b) Oxidase test on agar medium: blue colonies are
oxidase-positive
Fig. (9-5) Oxidase test
Fig. (9-6) Motility medium (semi-solid with TTC indicator,
from left, unimoculated, motile and non-motile bacteria
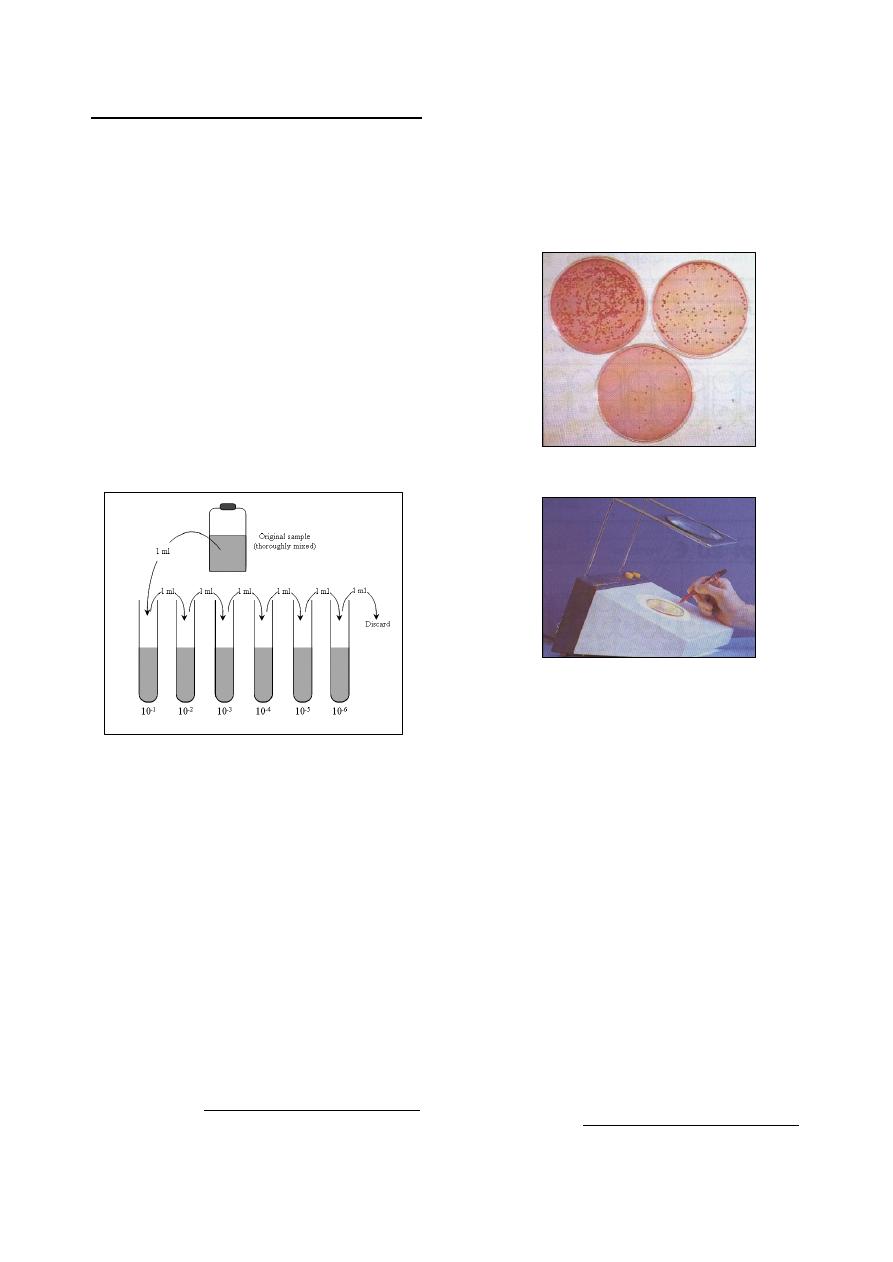
62
Bacterial Cell Counting Techniques
Some times it is necessary to enumerate
bacterial cells in fluids such as autogenous
vaccines, water, milk or urine samples. Both
viable and total counts can be carried out.
(a) Viable counting methods:
These techniques are more commonly used in
diagnostic and food hygiene procedures.
Serial ten-fold dilutions of the original fluid,
containing bacteria must first be made for each
of the methods these must be carried out as
accurately as possible to minimize a viable errors
and an aseptic technique should be used.
Preparation of ten-fold dilutions of bacterial
suspension before conducting a viable count to
find the number of bacteria/ml in the original
sample. The sample should be thoroughly mixed
before sampling and a separate pipette must be
used for every transfer step (Fig 9-7).
Spread plate method
1
:
A range of dilutions is used, and an inoculum
of 0.1 ml of each dilution is placed on the
surface of an agar plate.
The inoculum is spread rapidly over the entire
agar surface using a thin, bent glass rod or a
flame-sterilised nichrome wire, bent in a L-
shape, plate count agar, nutrient agar or even
MacConkey agar can be used if a viable
count of E. coli is required.
At least two and preferably four, plates
should be inoculated per dilution.
The plates are incubated for 24-48 hours at
25-37
˚c.
The incubation temperature will
1
There are other methods such as: Pour plate method,
Miles-Misra technique, Filtration method, Most probable
number (MPN) techniques.
depend on whether environmental or patho-
genic bacteria are being sought.
After incubation, plates inoculated with a
sample dilution yielding between 30 and 300
colonies are read for greatest accuracy.
The colony count should be an average of the
two or four plates inoculated with the selected
dilution (Fig 9-8 and 9-9).
Sample of a calculation: if there is a mean
count of 250 colonies per plate at the 10
-4
dilution and as the inoculum was 0.1 ml per
plate: the number of bacteria/0.1 ml of
original sample = 250
× 10
4
, thus the number
of bacteria/0.1 ml of original sample =
250
× 10
4
× 10 = 2.5 × 10
7
(b) Total counts of bacterial cells:
These methods do not distinguish between
viable and non-viable cells and thus the bacterial
count will include both living and dead cells.
Breed's direct smear method
2
:
This is used most commonly for counting
bacteria in milk.
A grease-free microscope slide is placed over
a template 1cm
× 1cm (area of 100 mm
2
), and
spread a 0.01 ml of sample over this area
carefully.
2
There are other methods such as: Counting chamber
method, Turbidity standards, Coulter counter.
Fig. (9-7) Preparation of ten-dilutions of bacterial
suspension. Each tube contain 9 ml of diluent
Fig. (9-8) Colony counting, surface spread technique on
MacConkey agar. The 10
-5
dilution is suitable for counting
Fig. (9-9) Colony counting using an electric counter

63
The smear is allowed to air-dry, fixed by heat
and stained with methylene blue for about 1
minute.
Examine the smear under the oil-immersion
objective. The bacterial cells should be
counted at least in 50 fields throughout the
area of the smear.
o
An average bacterial cell count per field
(N) should be obtained.
o
The radius (r) for the particular micro-
scope's oil-immersion field can be found
(in mm) using a slide and eye piece micro-
meter.
o
The area of the field will be
ð
r
2
or
approximately 3.14
× r
2
(mm
2
).
o
Bacteria/ml in sample =
2
4
2
2
14
.
3
10
100
)
14
.
3
(
)
100
(
r
N
r
field
one
of
area
mm
smear
of
area
N
The radius of the oil-immersion 0.08 mm and
so that the area of the field will be 0.25 mm
2
and bacteria/ml = N
× 4 × 10
4
C
C
l
l
i
i
n
n
i
i
c
c
a
a
l
l
V
V
i
i
r
r
o
o
l
l
o
o
g
g
y
y
Preparation of Clinical Specimens
The specimens for virus isolation are usually
taken from the affected regions. Throat swabs or
nasal swabs are taken when the infection invol-
ves the upper respiratory tract, and sputum is
taken from the lower respiratory tract infections.
Scrapings are taken from the lesions of the skin
and mucous membranes, and if vesicles are
present at these sites, the vesicle fluid is also
removed. Blood is with-drawn in the cases of
rash. In the case of serum, first sample at height
of temperature and another 1-2 weeks later.
Swabs
The swab is macerated well in the transport
medium itself used for collection.
The resulting suspension is transferred to a
centrifuge tube and centrifuged at 3,000-
5,000 rpm for 20 min.
The supernatant is collected and inoculated
into the susceptible host and stored at free-
zing temperature.
Feces
10 % suspension of the fecal material is made
using the transport medium with a screw-
capped bottle and coarse glass beads are
added and shaken vigorously.
The suspension is poured into centrifuge
tubes and centrifuged at 10,000 rpm for 20
min at 4
˚c in a refrigerated centrifuge
1
.
1
If this speed is not possible because of the absence of such
a centrifuge, it is centrifuged at 3,000-5,000 rpm for 20
min.
The upper two-thirds of the supernatant fluid
is removed for inoculation and stored at
(-20
˚c).
Vesicle fluid
It is centrifuged as described in swabs.
Inoculated using the supernatant.
Lesion scrapings
Scraping such as vesicle crusts, pock lesions,
and tongue epithelium are removed from the
buffered glycerin, put in a mortar, and
washed several times with BSS.
Using coarse washed sand it is triturated
thoroughly and a 10% suspension made in
BSS. It is centrifuged at 3,000 rpm for 20 min
and the supernatant collected.
Preparation of Washed Sand
Add about five volumes of 1 N HCL to one
volume of white sand, and soak overnight at
room temperature.
Wash in running tap-water until the effluent
is no longer acid.
Wash at least ten times in de-ionized water,
adding ten volumes of water and stirring well
at each stage.
After the last washing, drain the sand
completely and tip on to several thicknesses
of filter paper.
Cover, and dry at 1800-2000
˚c.
Sterilize in a hot-air oven (1600
˚c for 1 h).

64
Inoculation of Specimen into
Susceptible Host Systems
The clinical specimens prepared as above
may be inoculated into any of the hosts mention-
ed below depending upon the susceptibility and
practical availability:
Cell cultures.
Developing chick embryos.
Animals.
I- Cell Cultures
The cell cultures system is the method of
choice for all isolation purposes. Either primary
cell culture or established cell lines known to be
susceptible to the suspected virus may be
inoculated.
Select at monolayer culture grown in tubes
and remove the growth medium.
Wash the culture twice with BSS.
Inoculate 0.1 ml of the specimen suspension
and incubate at 370C for 60 min to allow the
virus to absorb on to the cell culture.
Add 1 ml maintenance medium (medium
devoid of serum or 2% serum) and incubate
the tube at 370C for appropriate time, e.g. 3-7
days. Keep also control tubes without any
specimen inoculum.
Observe for the effect of virus action. (It is
essential that each material be passaged in
cell culture at least three times before de-
claring any specimen negative). The presence
of viruses can be detected by observing cyto-
pathic effect.
II- Developing Chick Embryo
Several viruses such as infectious laryngo-
tracheitis, influenza, etc. are easily cultivated in a
developing chick embryo. This procedure is easy
and may find immediate acceptance in those
laboratories where cell culture facilities are not
available.
III- Laboratory Animals
Some of the viruses are easily isolated in
laboratory animals, hence in such cases labora-
tory animals may be easily employed. For
example, FMD virus is easily isolated in 5-7
day
’s suckling mice by inoculating the material
in them. This would enable the laboratory to
handle a large number of specimens and without
any cell culture and other accessory facilities.
Inoculate 0.05 ml of material intraperi-
toneally or intramuscularly into each suckling
mouse and keep one suckling mouse control
whose tip of the tail should be cut by a pair of
scissors.
Observe daily for 5-7 days. Consider any
death occurring within 24 h of inoculation as
nonspecifice and discard such mice.
Collect the dead mice. Harvest the skeletal
portion after removing the skin, the tail, the
head, and the vicera. Use the suspension
prepared from this skeletal portion either to
make further passage or to perform a
complement fixation test for identification of
the virus type. Guinea-pigs are aslo used for
cultivation of FMD virus. Sometimes large
animals such as 1-year-old cattle may be used
to isolate or passage aphthovirus. However,
use of animals should be avoided and only be
resorted to when facilities for cell culture and
chick embryo are not available.
Preparation of Cell Culture
There are three types of cell culture as
defined below:
1. Primary cells: Primary cell populations are
cells obtained from intact animal tissue and
grown on glass or plastic surfaces for the first
time.
2. Diploid cell strains: Diploid cell strains are
primary cell populations that have been
subcultivated several times, which retain the
normal chromosome constitution of the tissue
of origin, and are capable of a finite number
of subcultivations.
3. Heteroploid cell lines: Heteroploid cell lines
are cell populations that can be subcultivated
indefinitely, which reveal abnormal chromo-
some number or morphology, and possess
other properties that distinguish them from
normal cells.
Cell cultures can be grown in two ways:
1. Monolayer cultures: When cultures are grown
on a supporting surface, they are called
monolayer cultures, e.g. cultures grown in
glass or plastic bottles, flasks, tubes, petri
dishes, microtiter plates, etc. After dispensing
the cells in these vessels, they are incubated
in a stationary condition so that the cells form
a confluent monolayer.
2. Suspension cultures: When the cells are grown
in suspension and are not allowed to attach to
any support surface, such cultures are called
suspension cultures. For this purpose cell
suspension is agitated continuosly so that the
cells remain in suspension.
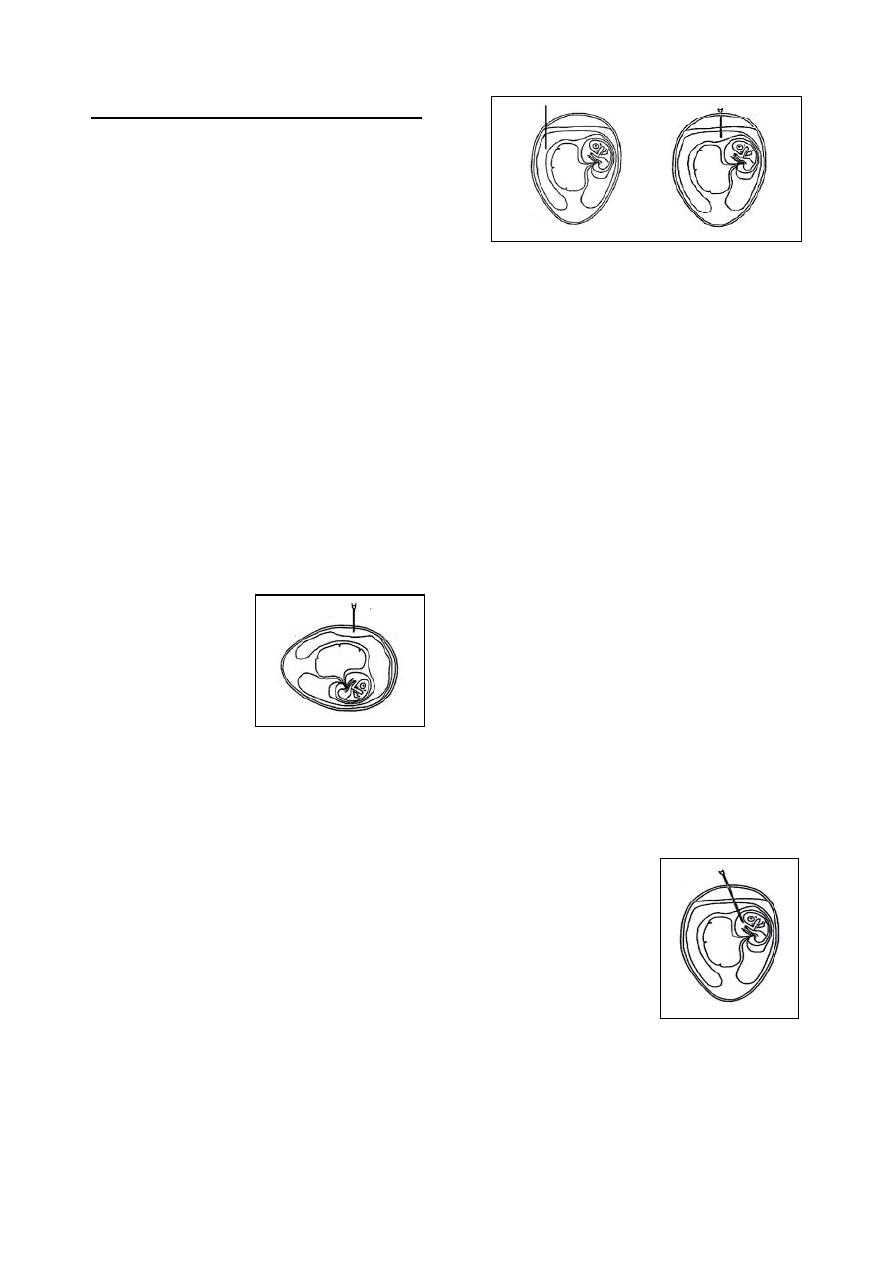
65
Virus Inoculation in Chick Embryo
1. Chorioallantoic membrane inoculation CAM
Candle the egg and mark the edge of the air-
space. Mark also a point on the side of the
egg which is not adjacent to any major
underlying blood vessel.
Sterilize the shell surface in the region of
both marked areas.
Drill a simple hole in the shell overlying the
centre of the air-space, and puncture the
underlying shell membrane with a sterile
needle or some other sharp instrument.
Cut a triangle in the shell in the marked side
of the egg, taking care not to damage the
underlying shell membrane.
Apply gentle suction to the hole overlying the
air-space, using a small rubber teat. The
CAM will then detach from the shell
membrane underneath the hole producing an
artificial air-space.
Inoculate 0.1 ml of the required fluid directly
on to the dropped CAM with a syringe.
Gently rotate the egg to distribute the
inoculum evenly.
Seal all holes, and incubate (Fig 9-12).
2. Allantoic cavity inoculation
Candle the egg and mark the edge of the air-
space. Mark also a point on the side of the
egg which is not adjacent to any major
underlying blood vessel.
Sterilize the shell in the region of both
marked areas.
Drill a simple hole in the shell overlying the
centre of the air-space, and puncture the
underlying shell membrane with a sterile
needle or some other sharp instrument.
Similarly, drill a simple hole in the shell at
the marked lateral position, but do not
puncture the shell membrane.
Inoculate 0.1 ml of the required fluid directly
into the allantoic cavity, using a 1/2 in 26
standard wire gauge (s.w.g.) needle by
inserting only 1 cm of the needle. This is
done by holding the syringe at right angles to
the long axis of the egg, and entering via the
lateral hole (Fig 9-13).
3. Amniotic cavity inoculation
Candle the egg and mark the edge of the air-
space.
Sterilize the shell in the air-space region.
Cut the shell round the entire air-space
periphery, keeping 1-2 mm above the edge of
the latter. At the same time, take care not to
damage the underlying shell membrane.
Carefully detach and discard the shell cap so
produced, keeping the egg upright.
Paint the entire shell membrane exposed at
the base of the air-space with a cotton swab
soaked in sterile liquid paraffin. This makes
the membrane transparent and enables the
embryo and its associated structures situated
underneath to be clearly seen.
Carefully tear the shell membrane and the
adjacent chorioallatios with a spatulate for-
ceps, and grasp the amniotic sac enveloping
the embryo. With extreme care, because of its
fragility, lift the amnion until it protrudes
slightly above the surface of the allantoic
fluid. (At this point it appears tent-like as it
falls from the forceps in a series of folds).
Inoculate 0.1 ml of the required fluid directly
into the amniotic cavity, using a 1 in 26 s.w.g.
needle. Proper entry into the amniotic sac is
ascertained by observing the movements of
the latter as the needle is moved to and fro
(Fig 9-14).
Seal the egg with a cover-slip and wax, as
described above and incubate. Liquid paraffin
is sterilized by autoclaving for 10 min.
Accurate inoculation of the amniotic cavity
requires adequate knowledge of the anatomy
of the developing chick embryo. It is helpful
Fig. (9-12) Chorioallantoic
(CAM) route of inoculation
Fig. (9-13) Allantoic route of inoculation
Fig. (9-14) Aminotic route
of inoculation

66
to make a few dummy inoculations of trypan
blue or other dyestuff, using the technique
described above. After the dye is inoculated,
the entire contents of the egg are carefully
decanted into a petri dish, when the embryo
and its associated structures may be readily
seen in correct relationship to each other.
4. Yolk-sac inoculation
Candle the egg and make the edge of the air-
space.
Sterilize the shell in the air-space region.
Drill a simple hole in the shell overlying the
centre of the air-space, and puncture the
underlying shell membrane with a sterile
needle or some other sharp instrument.
Inoculate 0.1 ml of the required fluid directly
into the yolksac, using a 11/2in 26 s.w.g.
needle. (This is best done by holding the egg
upright and inserting the needle vertically for
almost its entire length.
As with amniotic cavity inoculation, it is
helpful to practice the technique using trypan
blue or other dyestuff as inoculum (Fig 9-15).
C
C
l
l
i
i
n
n
i
i
c
c
a
a
l
l
M
M
y
y
c
c
o
o
l
l
o
o
g
g
y
y
Fungi can be divided into molds and yeasts.
The molds are filamentous with branching
filaments or hyphae, and usually form large
fluffy colonies on laboratory media, and
produce aerial fruiting hyphae that bear a
sexual spores.
Yeasts are oval, spherical or elongated cells,
form moist colonies larger than bacterial
colonies but unlike them.
General methods for the diagnosis of fungi
include history, clinical signs, gross pathology,
and in few cases intradermal skin tests. These are
all of value in the diagnosis of fungal infections.
The laboratory investigations include direct
microscopy, fungal isolation and identification.
Identification of the pathogenic fungi include:
The direct microscopic appearance of the
fungus in the clinical specimen.
The microscopic appearance of the fruiting
heads and spores from mould colonies, and
the morphology of the yeasts, and the type of
budding.
The morphology of the colony, and the type
of the pigmentation.
Biochemical tests.
Other tests specific to the particular fungus,
such as the gram-tube for Candida albicans.
Direct Microscopic Examination
The specimens suspected of containing fungal
pathogens range from hairs and skin scrapings to
exudates, biopsies and tissues.
1- Blue-Black ink:
Consist of:
1 part of 10% KOH.
2 part of permanent blue-black ink.
Wetting agent solution
1
.
Result:
The fungi take up the dye (ink) selectively,
and the specimen is also satisfactorily cleared by
the 10% KOH.
2- Calcoflour white:
Consist of:
Stock solution: include 1% calcoflour white,
or fluorescent brightener 28. Dissolve 1.0 g
powder in 100 ml pf distilled water with
gentle heat.
Working solution: 0.1% calcofluor white with
0.05% Evans blue dye for a counter stain.
Procedure:
1. Hair and skin samples:
Add 1 drop of 10% KOH and 1 drop of calco-
fluor white working solution to the specimens
on a microscopic slide.
The preparation is examined microscopically
under excitation light of 500 nm.
2. Exudates and fluids:
1 drop of 0.1% calcofluor white is emulsified
with the specimen on a microscopic slide and
covered with a coverslip.
1
Wetting agent solution consist of:
o
Sodium benzoate 0.15g.
o
Dioctyl sodium sulphosuccinate
0.85g.
o
Distilled water
100 ml.
Fig. (9-15) Aminotic route
of inoculation
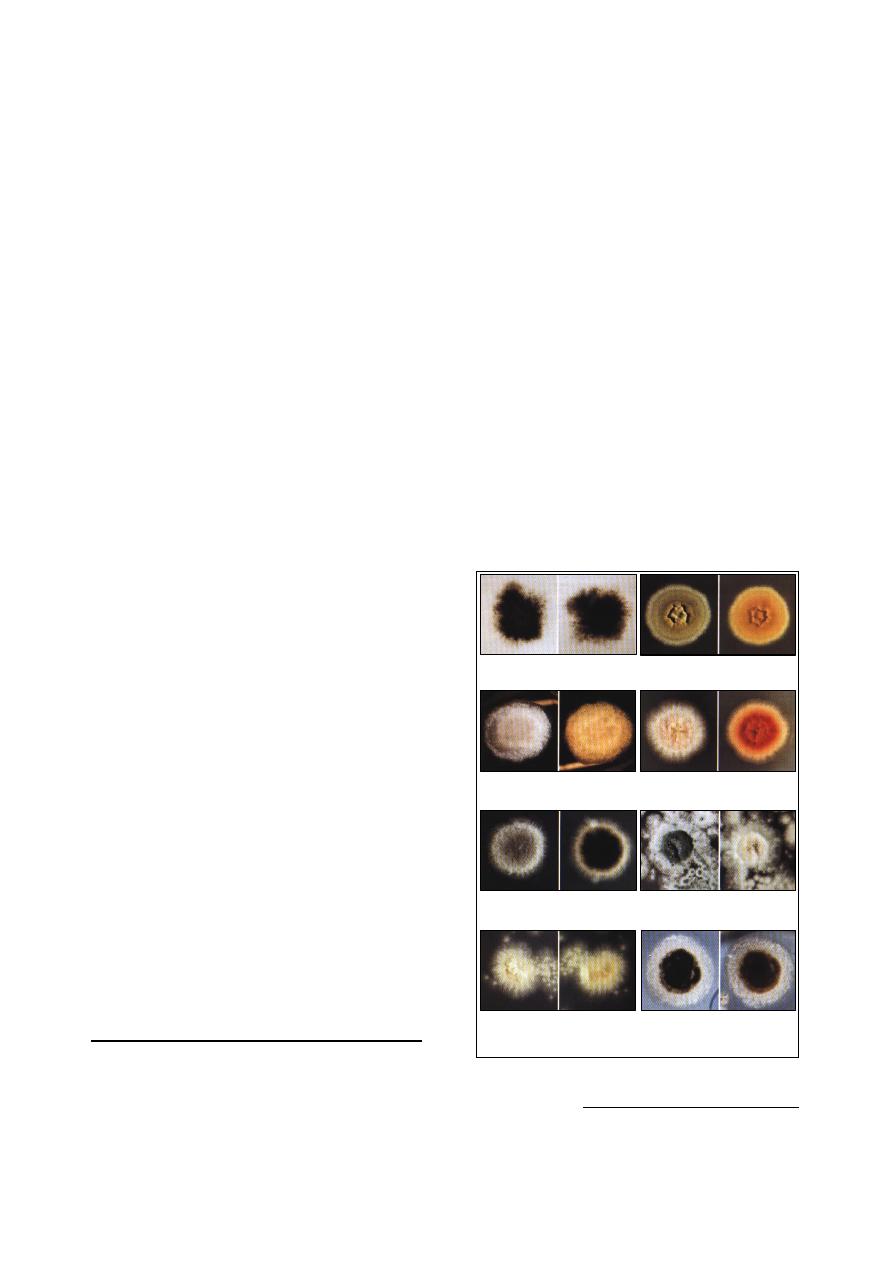
67
The preparation is examined microscopically
under excitation light of 500 nm.
3. Histopathological sections:
Either paraffin-embedded or frozen sections
can be used.
4 or 5 drops of 0.1% calcofluor white placed
on unstained sections and allowed to stand for
1 minute.
The preparation is rinsed with tap water and
counter stained with 0.05% Evans blue for 1
minute to minimize background fluorescence.
The preparation is examined microscopically
under excitation light of 500 nm.
3- India ink (Pelican brand):
Consist of:
India ink 1.0 ml.
Formalin 9.0 ml.
4- Nigrosin staining solution:
Consist of:
Nigrosin (granular)
10.0 g.
Formalin 10% 100.0 ml.
Or 1:10,000 merthiolate
100.0 ml.
The solution is placed in a bath of boiling
water for 30 minutes, and then any solvent lost
by evaporation is replaced. The solution should
be filtered twice through double filter paper.
Procedure of India ink or Nigrosin staining:
Place a drop of India ink or Nigrosin on a
microscopic slide.
Add a loopful of cerebrospinal fluid or clear
exudate, and then mix well.
Place a coverslip on the mixture and press
gently blot-up any excess fluid.
Examine under the lower and high-dry
objectives of the light microscope.
5- Lactophenol cotton blue stain:
Consist of:
Phenol crystal 20.0 g.
Glycerin
40.0 ml.
Lactic acid
20.0 ml.
Distilled water 20.0 ml.
The ingredients are dissolved by gentle heat
over a steam bath. 0.05 of cotton blue dye is
added. The solution is mixed thoroughly.
Isolation and Subculture of Fungi
Media for fungi:
The media designed to isolate pathogenic
fungi need to be selective against the faster-
growing bacteria, and more rapidly growing
contaminating fungi. Some of the more common
molds seen in (Fig 9-16).
Saboraud dextrose agar:
o
It is the most medium that commonly used.
o
It has 5.6 pH, therefore inhibit bacterial
growth.
o
It may be made more selective by adding
chloramphenicol (antibacterial), and cyclo-
hexidine (has antifungal action against
some of contaminating fungi).
Enriched media such as brain heart infusion
agar with 5% blood. Used for dimorphic
fungi when incubated at 37
˚c to convert them
from mycelial to yeast phase of growth.
Inoculation of media:
Culture made for the isolation of yeast can be
streaked with an inoculum from the specimen
as for bacterial cultures.
To isolate mold:
o
the surface of the agar should be lightly
cross-hatched at right angle in about five
sites with a sterile scalpel.
o
The specimen (such as small bits of tissue,
scabs or hair) can then be gently pushed
into the agar at these cross-hatched areas
1
.
1
If the specimen are merely pushed into the agar
surface there is the danger of the agar splitting
during incubation.
(1) Altrnaria
(a) top, (b) reverse
(2) Aspergillus
(a) top, (b) reverse
(3) Cunninghamella
(a) top, (b) reverse
(4) Fusarium
(a) top, (b) reverse
(5) Helminthosporium
(a) top, (b) reverse
(6) Penicillium
(a) top, (b) reverse
(7) Paecilomyces
(a) top, (b) reverse
(8) Syncephalastrum
(a) top, (b) reverse
Fig. (9-16) Colony characteristics of some of the
more common molds

68
References
Cruickshank, R. Duguid, J. P., Marmion, B. P. and
Swain, R. H. A. (1975). Medical microbiology.
12th ed. Edinbarch, London and New York.
Forbes, B. A., Sahm, D. F. and Weissfeld, A. S.
(2002). Diagnostic microbiology. 12th ed.
USA.
Macfadding, J. F. (1979). Biochemical test for
identification of medical bacteria. Williams
and Willkins, Baltimore, U.S.A.
Quinn, P. J., Carter, M. E., Markey, B. and Carter, G.
R. (1999). Clinical Veterinary Microbiology.
1st ed. Elservier Ltd. London.
Quinn, P. J., Markey, B. K., Carter, M. E., Donnelly,
W. J. C. and Leonard, F. C. (2002). Veterinary
Microbiology and Microbial Disease. 1st ed.
Blackwell Science Ltd., London.
Rai, A. (2005). Methods In Veterinary Virology.
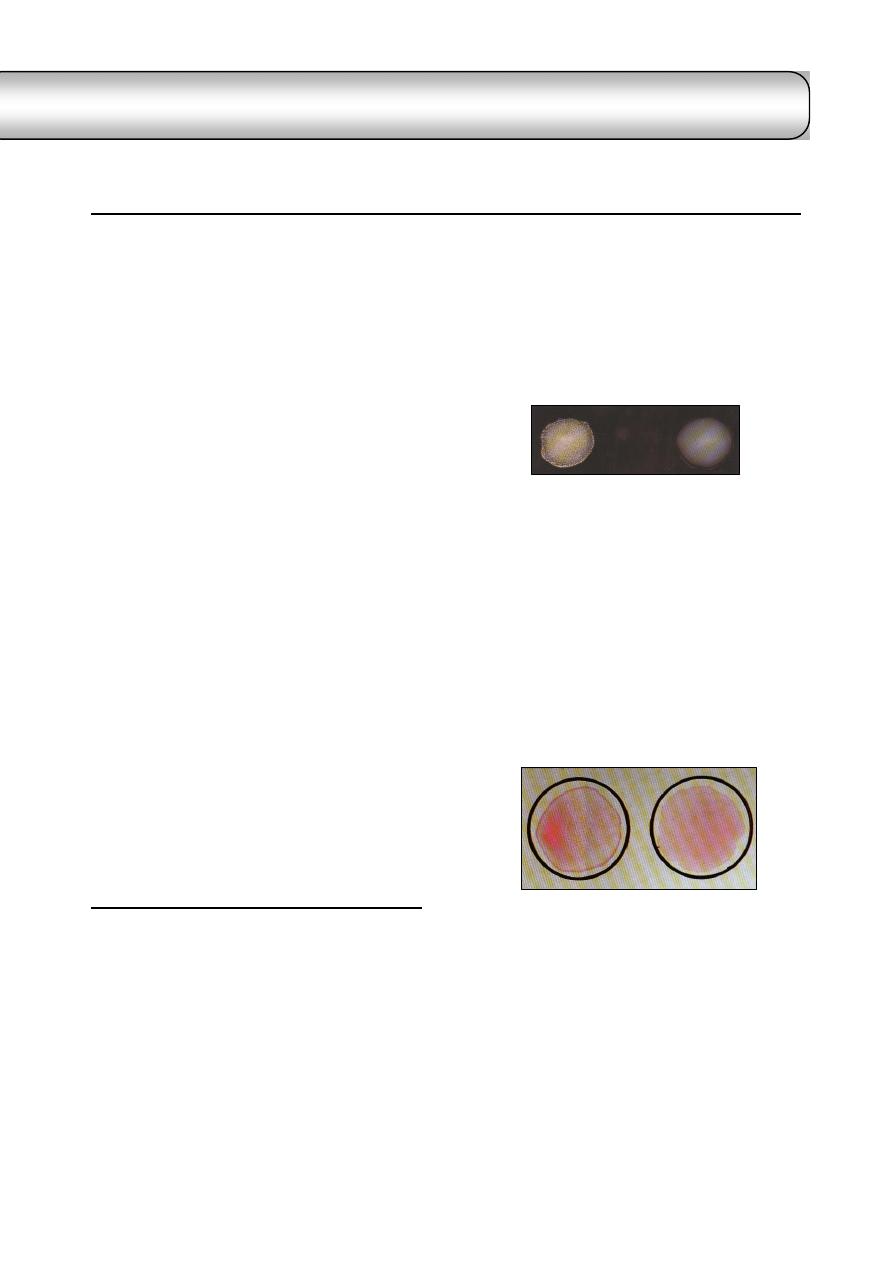
69
C
C
h
h
a
a
p
p
t
t
e
e
r
r
1
1
0
0
S
S
e
e
r
r
o
o
l
l
o
o
g
g
y
y
Some bacteria and viruses can not be
identified by biochemical properties, but can be
typed by the serological means. Also, it has been
found that the diagnosis or detection of
antibodies is more easier than the agent that
produce the disease.
There are 5 types of antibodies (immuno-
globulins) as follows:
IgM. It has large molecular weight, and
appear following initial exposure to anti-gens.
IgG. It has small molecular weight, and
comprise 80-85% of immunoglobulins. It is
the predominant immunoglobulin in the
serum, protecting against bacteria and
viruses, and neutralize bacterial toxins.
IgA. It is approximately comprise 15% of
immunoglobulins,
selectively
transported
across mucous membranes, and it is the
principal immunoglobulin in the body
secretions (secretary antibody). It is prevent
attachment of disease-producing agents to
mucous membranes surface.
IgE. It is present in a lower concentration in
the serum, and associated with allergic
reactions.
IgD. It is immature antibody, function as an
antigen receptor on B cells.
Applications of serological tests:
Determination of different serotypes of the
microorganisms or their antigenic structures.
Diagnosis
of
some
bacterial and viral diseases.
Blood groupings and medico-legal tests.
Agglutination Tests
(1) Rapid slide method
It is a rapid qualitative test used for the rapid
diagnosis and as field test for:
(a) determination of the antigenic structure of
bacteria: for typing different serotypes of
Salmonella, E. coli, Pasteurella multocida, etc.,
(Fig 10-1)
Materials required:
Fat free glass slides.
Pure colonies of suspected strain.
Diagnostic antisera.
Sterile saline.
Technique:
Make a suspension of the smooth colonies in
saline on one end of the slide, and on the
other end make a control from suspension
only.
Add 2 drops of corresponding antisera to the
suspension.
Read the result within one minute after
continuous shaking.
(b) whole blood agglutination test: for identifica-
tion of blood group and some poultry diseases.
Materials required:
Agglutination plate.
One drop of fresh blood.
Stained antigen.
Result:
Clumping and agglutination within one
minute is a positive result.
Suspension with regular turbidity is a
negative result.
(2) Tube agglutination method "slow method"
It is a quantitative test determine the level of
antibodies in serum.
Materials required:
Seven agglutination tubes.
Sterile pipettes (1 ml and 10 ml).
Known standard antigen suspension.
Serum from diseased animal.
Normal or buffered sterile saline.
Fig. (10-1) Slide agglutination test
positive reaction (left), negative reaction (right)
Fig. (10-2) Rose-Bengal plate agglutination test for
Brucella abortus (colored antigen): positive reaction
(left) and negative reaction (right)
id23988890 pdfMachine by Broadgun Software - a great PDF writer! - a great PDF creator! - http://www.pdfmachine.com http://www.broadgun.com
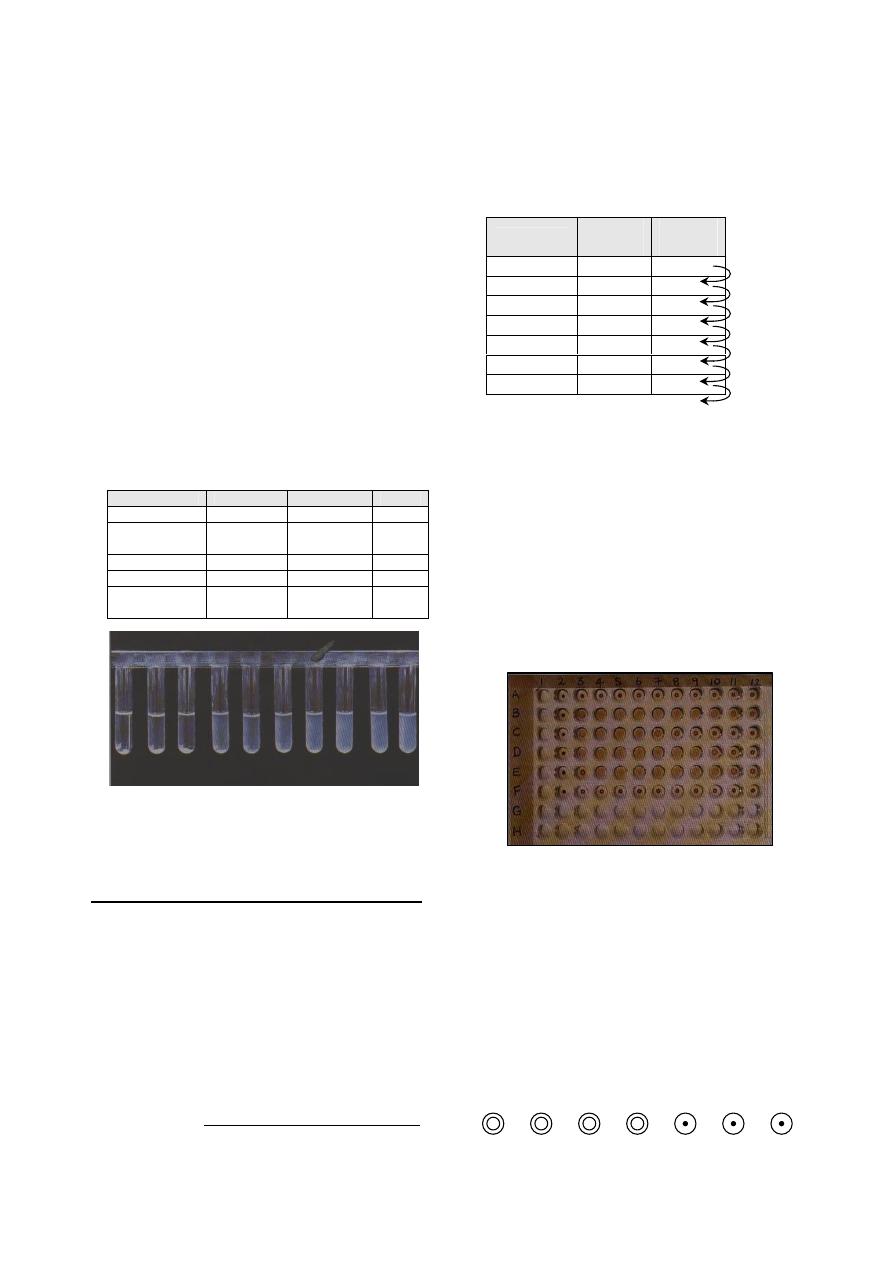
70
Technique
1
:
0.8 ml of phenol-saline is placed in the first
tube and 0.5 ml in each succeeding tube.
0.2 ml of serum under test in transferred to the
first tube and mixed thoroughly with the
phenol-saline already there.
0.5 ml of the mixture is carried over to the
second tube from which, after mixing, 0.5 ml
is transferred to the third tube, and so on
continue until the last tube from which, after
mixing, 0.5 ml of the serum dilution is disca-
rded.
This process of doubling dilutions results
in 0.5
ml
of dilutions 1:5,
1:10,
1:20, and so on.
Add to each tube 0.5 ml of antigen at the
recommended dilution and the contents of the
tube are thoroughly mixed, thus giving final
serum dilutions of 1:10. 1:20, etc.
The tubes are then incubated at 37
˚c for 20
hours
± 1 hours before the results are read.
The result are interpreted as follows (Fig 10-3)
Agglutination
Sediment
Supernatant
Rating
Complete
Complete
Water clear
++++
Nearly
complete
Nearly
complete
75% clarity
+++
Marked
Marked
50% clarity
++
Slight
Some
25% clarity
+
No
No or very
slight
Turbid or
0% clarity
-
Haemagglutination Test (HA)
It is an important test in the diagnosis of
viruses, because it provides a simple and rapid
method by which virus can be detected in inoc-
ulated eggs, tissue culture or infected material.
Materials required:
Haemagglutination
plate
or
agglutination
tubes.
Pipettes 1 ml and 10 ml, and water bath 37
ºc.
Suspected material containing the virus.
1% fowl RBCs suspension.
PBS 0.01
µ, pH 7.2.
1
There are different techniques used, the above is one
techniques, used in the diagnosis of Brucells.
Technique:
Separate plasma from RBC by centrifuge
cirated cells.
Prepare a 0.5% suspension of RBC in PBS,
Prepare twofold serial dilution (1:10 to 1:640)
of virus suspension in PBS as follows:
Dilutions
PBS
(ml)
Virus
(ml)
1:10
3.6
0.4
1:20
0.4
1:40
0.4
1:80
0.4
1:160
0.4
1:320
0.4
1:640
0.4
Add 0.4 ml of 0.5% RBC to all tubes.
Control tube contain 0.4 ml of PBS plus 0.4
ml of RBC.
Shake tubes and place them in a 37
ºc water
bath or at the appropriate temperature for the
virus concerned until control cells have
completely settled.
Result:
After lifting in room temperature for half to
one hour, read the result as (Fig 10-4):
Positive: agglutination and clumping of RBC.
Negative: precipitation of RBC.
Heamagglutination results are normally
graded 0, 1, 2, 3, or 4+. The end point is taken
to be the highest dilution of virus suspension
producing maximal agglutination (4+). This
dilution is said to contain 1HA unit per whatever
volume you used. For example:
Fig. (10-4) Indirect haemagglutination test (passive) for
measuring antibody against soluble antigen (Toxoplasma
gondii and sheep red blood cells). Column 2 downwards
contains a control well for each serum and the carrier red
cells. There are double dilutions of each serum starting at
1/8 in column 3. Interpretation: A (across), negative; B,
positive 1/1024; C, positive 1/128; D, positive 1/512; E,
positive 1/1024 and F, negative. U-type wells.
Fig. (10-3) Tube agglutination test: doubling dilutions
beginning at 1/10. The antibody titre is 1/40.
Mix, transfer 0.4 ml
Mix, transfer 0.4 ml
Mix, transfer 0.4 ml
Mix, transfer 0.4 ml
Mix, transfer 0.4 ml
Mix, transfer 0.4 ml
Mix, discard 0.4 ml
1:10
8 HA
unit
1:20
4 HA
unit
1:40
2 HA
unit
1:80
1 HA
unit
End point
1:60
1:320
1:640

71
Haemagglutination
Inhibition Test (HI)
It is depends on the fact that the virus when
mixed with its specific antibodies loses their
power to agglutinate RBCs.
HI-test is used for diagnosis of a number of
viral diseases, and for antibody estimation.
Materials required:
Haeagglutination plate and pipette.
Standard concentration of known virus.
Technique:
Make twofold serial dilutions of antiserum in
PBS, beginning at 1:10.
Distribute the serum dilution in 0.2 ml
amount in small test tubes.
Titrate the antigen as in the HA test.
Determine the dilution which contains 4 units
per 0.2 ml. for example: if the HA titer of the
virus is 1:80, this represents 1HA unit, thus a
dilution of 1:10 would contain 8HA units in
0.4 ml or 4HA units in 0.2 ml.
Include the following controls:
1.
Serum alone 1:10 dilution, 0.4 ml.
2.
Antigen alone, 4 units, 0.4 ml.
3.
Known positive serum, 1:10, 0.4 ml.
4.
Known negative serum, 1:10, 0.4 ml.
5.
As a check on dilution error or variations
in red blood cells from one batch to
another, run a back-titration on the 4
units per 0.2 ml dilution:
a.
Add 0.4 ml PBS to each of 5 test
tubes.
b.
To the first tube, add 0.4 ml of the
virus dilution (in the case above,
1:10) containing 8HA units. Mix and
transfer 0.4 ml to the second tube.
Continue and discard 0.4 ml from
the last tube.
c.
Incubate at room temperature for 30-
60 minutes.
d.
Add 0.4 ml of 0.5
ºc RBC to all
tubes, shake, place all tubes at the
appropriate temperature until control
cell have completely settled.
e.
Read the serum titer. Thus is the
highest dilution of serum inhibiting
haemagglutination by the virus and
is expressed as the reciprocal of that
serum dilution.
Result: (Fig 10-5)
Leave at 22
˚c for half to one hour.
Add 1% fowl RBCs suspension.
Let at 22
˚c for half to one hour.
Read the result as follows:
o
Positive: no agglutination of RBC.
o
Negative:
clumping
and
agglutination of RBC.
Agglutination-Lysis Test
It is a microscopic test, used for diagnosis of
different serotypes of Leptospira, and to deter-
mine the serum titer in animals suffering from
Leptospirosis.
Materials used:
Dark-field illumination microscope.
Porcelain or plastic plates with depressions.
Well grown cultures of Leptospira.
Dilutions of patient's serum.
Sterile saline.
Result:
After incubation, put 1-2 drops of the serum
antigen mixture on slide.
Read the result under dark-field illumination:
o
Positive: clumping and agglutination of
Leptospira.
o
Negative: lysis and reduction of the live
Leptospira.
Precipitation Test
It is used when the antigen is in a colloid state
(e.g. toxin or bacterial extract).
It is very useful serological test for identifying
antigenic substances of all kinds.
There are different forms for application of
the precipitation test:
(1) Flocculation Test "Ring form":
It is used for:
Diagnosis of some infectious diseases, as
Ascoli test in anthrax.
Classification of some microorganisms
Fig. (10-5) Haemagglutination-inhibition test (equine influenza
virus and human O RBCs). Top row (A) titration of virus for
haemagglutination activity to determine 1 HA unit (well7).
Test sera are in rows C, D and E with doubling dilutions
starting at 1/10. Interpretation: row C, positive 1/1280; D,
negative; E, positive 1/40. rows F, G and H contain reagent
controls. V-type wells.
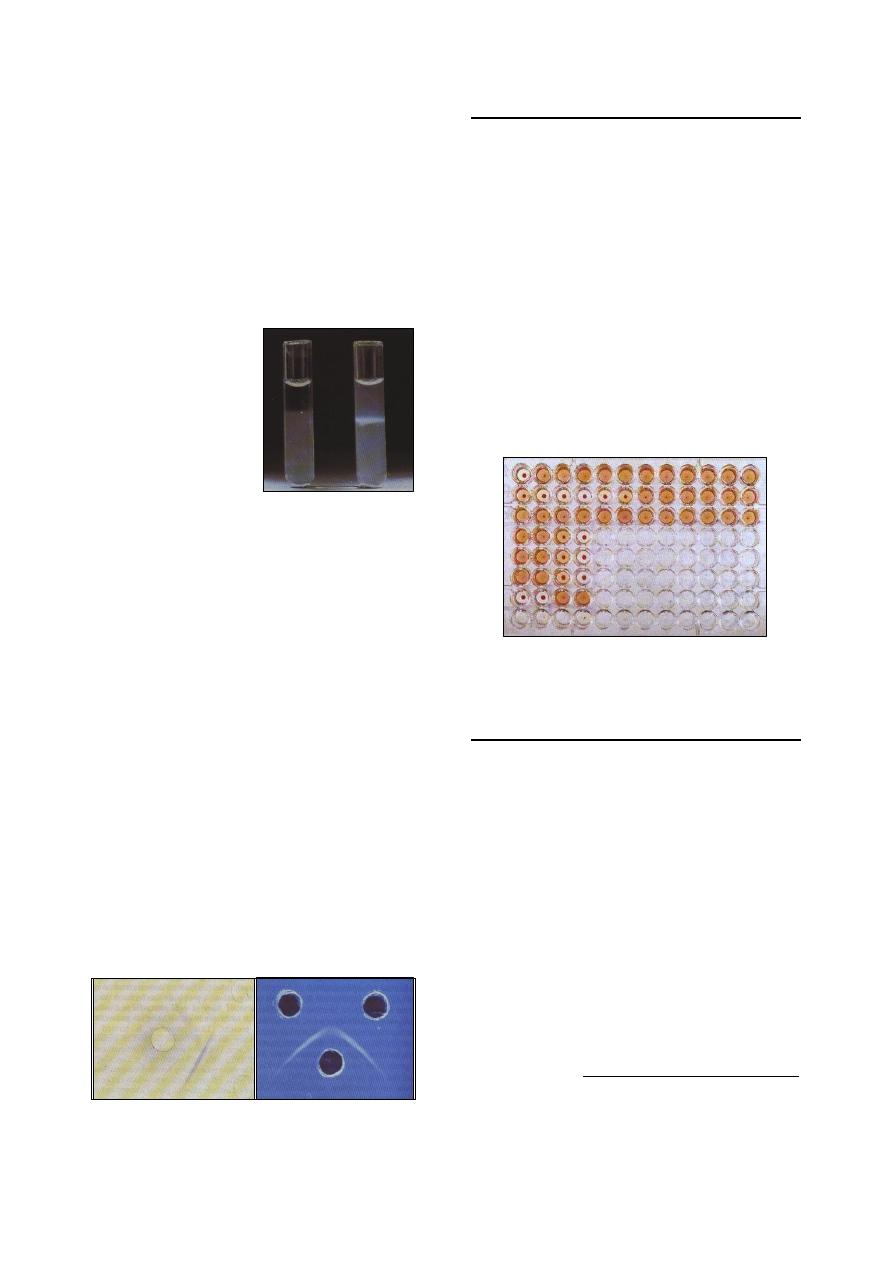
72
Typing of different types of meat and blood
spots.
Materials required:
Precipitation tubes with its rack.
Extract from lesions or microorganisms.
Specific antisera.
Result: (Fig 10-6)
Apply controls for the extract and antisera,
and read the results within 30 minutes to 1 hour:
Cloudy ring at the junction of extract and
antisera: positive.
Clear fluid: negative.
Ascoli's test:
It is used for the diagnosis of anthrax. By
means of a suitable anti-anthrax serum, the
presence of precipitinogens in the animal tissues
can be demonstrated.
Procedure:
Place 0.5 ml of anti-anthrax serum in a tube.
0.5 ml of a saline extract of the anthrax
spleen, or other organ, this can be made by
mincing the organ.
Mixed with normal saline.
Placed in a both of boiling water for few
minutes, and filtered.
A distinct whitish precipitate forms at the
junction of the two liquids.
(2) Agar Gel Diffusion Test:
Gel of agar has been used to demonstrate the
presence of diffusible antigen, by allowing
antigen and antibody to diffuse towards each
other. If the antigen and antibody are specific to
each other, precipitation lines will be formed.
The gel diffusion test is used for diagnosis of
some viral diseases as cattle plague, mucosal
disease (Fig 10-7).
Complement Fixation Test
Material required:
Wasserman's tubes.
Known standard antigen suspension.
Patient's serum (heated at 55
˚c for 30 minutes
to destroy the complement).
Complement
1
(fresh serum of guinea pigs).
Procedure:
Mix the materials
2
, and incubate in water bath
at 37
˚c for 30 minutes.
Sensitized sheep erythrocytes 5% suspension
(as indicator for the fixation of the comp-
lement).
Mix, and incubate in the water bath for 30-60
minutes, and read the result (Fig 10-8):
o
Positive: no hemolysis.
o
Negative: hemolysis.
Enzyme Linked Immunosorbent assay
(ELISA)
ELISA used for the immunodiagnosis of
infectious diseases to measure either antigen
(direct, capture or sandwich ELISA), or antibody
(indirect or competitive ELISA).
(1) Direct ELISA:
The antibody specific for the antigen to be
detected is adsorbed to the surface of the
wells of the microtiter plate.
A sample containing unidentified antigen is
then added to each well
3
.
A second antibody specific for the antigen is
then added if both the antibody adsorbed to
the wall of the well and the antibody known
to be specific for the antigen have reacted
with antigen a "sandwich" will be formed,
with the antigen between two antibody
1
The fresh complement must be standardized.
2
Apply controls for antigen, complements, and indicator.
3
If the antigen reacts specifically with the antibodies
adsorbed to the well, the antigen will be retained there
when the is washed free of unbound antigen.
Fig. (10-6) Ring precipitin test:
(left) negative, (right) positive
Fig. (10-7) Agar gel immunodiffusion: (A) reaction of
identify, the well on the left con-tained antiserum and
the wells on the right homologous antigen. (B) reaction
of partial identity showing spur formation
Fig. (10-8) Complement fixation test (CFT) for
enzootic abortion of ewes
(A)
(B)

73
molecules. This reaction is visible only
because the second added antibody is linked
to an enzyme, such as horseradish peroxidase
or alkaline phosphatase unbound enzyme
linked antibody is washed from the well.
The enzyme's substrate is added to it.
Enzymatic activity is indicated by a color
change that can be visually detected.
The test will be positive if the antigen has
reacted with adsorbed antibodies in the first
step (Fig 10-9 a). If the test antigen was not
specific for the antibody adsorbed to the wall
of the well the test will be negative because
the unbound antigen will have been washed
away.
(2) Indirect ELISA:
A known antigen from the laboratory, rather
than the antibody, is added to the shallow
wells on the plate.
The antiserum is added to the well. If the
serum contains antibody specific to the
antigen, the antibody will bind to the
adsorbed antigen. All unreacted antiserum is
washed from the well.
The conjugate (Anti-HISG) is then allowed to
react with the antigen-antibody complex.
The anti-HISG, which has been linked with
an enzyme, reacts with the antibodies that are
bound to the antigens in the well.
Finally, all unbound anti-HISG is rinsed away
and the correct substrate for the enzyme is
added. A colored enzymatic reaction occurs
in the wells in which bound antigen has
combined with antibody in the serum sample
(Fig 10-9 b).
Immunofluorescence
Immunofluorescence, like ELISA, uses a
labelled immunoglobulin for detecting anti-gen
or antibody. The label employed is a fluoro-
chrome,
usually
fluorescein
isothiocyanate
(FITC) or rhodamine isothiocyanate covalently
attached to antibody molecules. When examined
by ultra-violet light, fluorescein emits a charac-
teristic green color and rhodamine a red color.
The procedure requires a special fluorescence
microscope with mercury vapour light source.
There are many different methods of using
fluorescent-labelled antibodies in microbio-
logy and these include: direct, indirect and
sandwich methods.
Indirect immunofluorescence:
It is frequently used for the detection of
antibodies in serum. It is usually more sensitive
than the direct test because more labelled
antibody attaches per antigenic site.
Conjugated antibody is added directly to a
smear, tissue section or monolayer.
Fix on a slide.
After incubation, unbound antibody is remov-
ed by washing.
The slide is examined in a fluorescence mic-
roscope and where labelled antibody binds to
antigen bright fluorescence is evident.
References
Forbes, B. A., Sahm, D. F. and Weissfeld, A. S.
(2002). Diagnostic microbiology. 12th ed.
USA.
Macfadding, J. F. (1979). Biochemical test for
identification of medical bacteria. Williams
and Willkins, Baltimore, U.S.A.
Quinn, P. J., Carter, M. E., Markey, B. and Carter, G.
R. (1999). Clinical Veterinary Microbiology.
1st ed. Elservier Ltd. London.
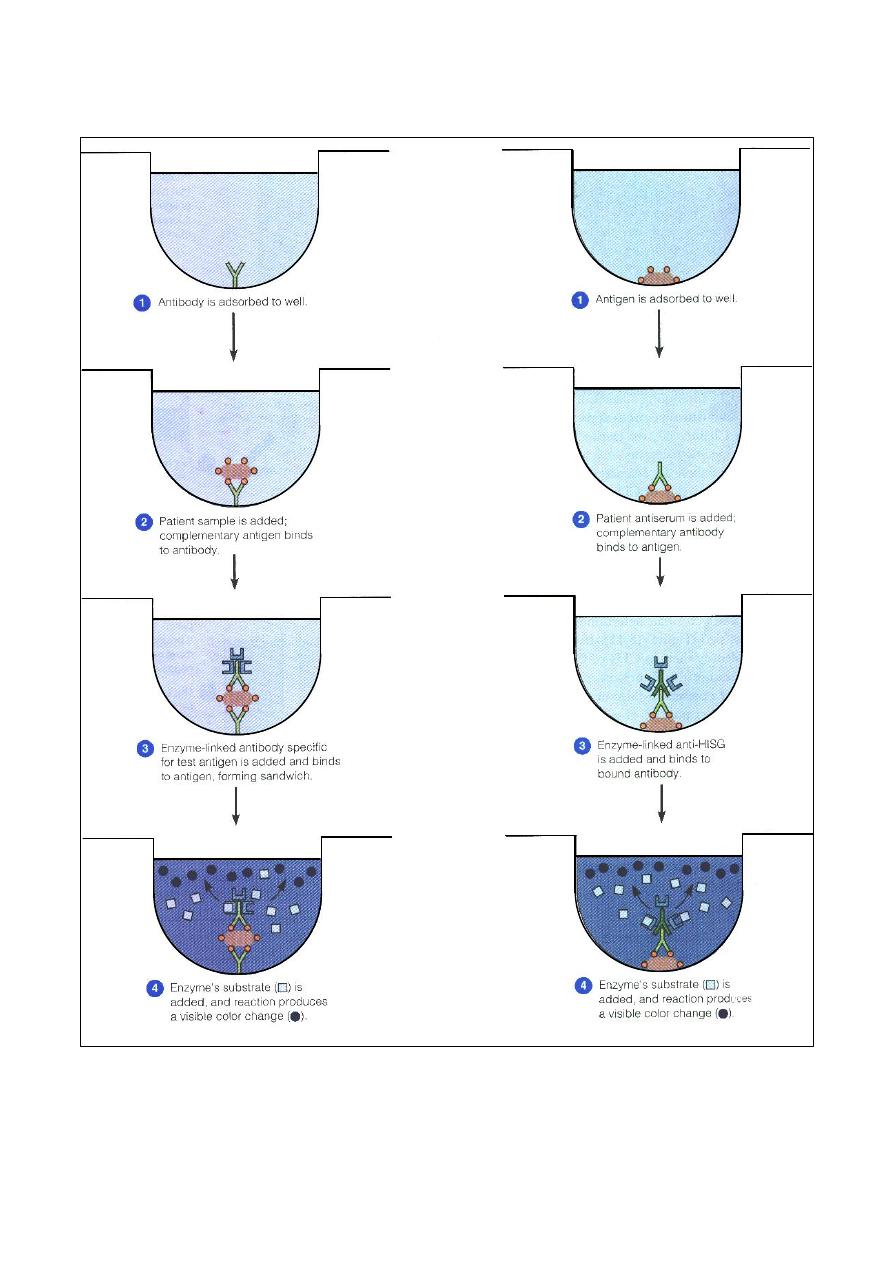
74
(a) A positive direct ELISA to detect antigens
(b) A positive indirect ELISA to detect antibodies
Fig. (10-9) The ELISA method, differentiate a direct from an indirect ELISA test
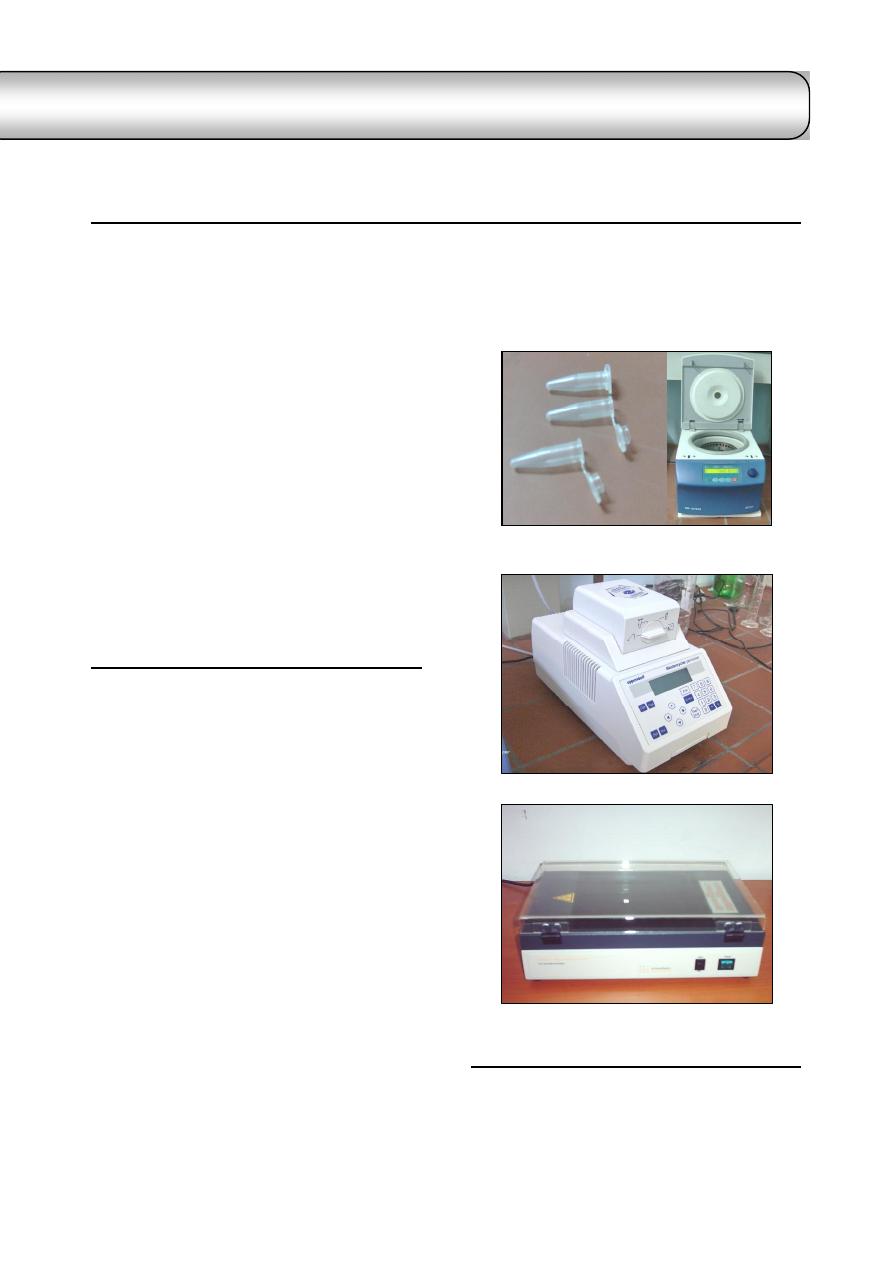
75
C
C
h
h
a
a
p
p
t
t
e
e
r
r
1
1
1
1
P
P
o
o
l
l
y
y
m
m
e
e
r
r
a
a
s
s
e
e
C
C
h
h
a
a
i
i
n
n
R
R
e
e
a
a
c
c
t
t
i
i
o
o
n
n
(
(
P
P
C
C
R
R
)
)
The PCR is an in-vitro technique which
allows the amplification of a specific deoxy-
ribonucleic acid (DNA) region that lies between
two regions of known DNA sequence to produce
large quantities of a desired sequence of DNA
from a complex mixture of heterogeneous
sequences. It is a highly sensitive procedure for:
detecting infectious agents in host tissues and
vectors, even when only a small number of
host cells are infected.
targeting and amplifying a gene sequence that
has become integrated into the DNA of
infected host cells. It can also target and
amplify unintegrated viral gene sequences.
When PCR is used for diagnosis, a great deal
of care is required to avoid contamination of the
samples because the exquisite sensitivity of the
technique can easily lead to false-positive
results.
Materials used in PCR technique
Template DNA. It is needs to be copied
during PCR. It is extracted from the organism
through different methods according to the
type of that organism and the type of sample,
using either manual method or kits,
Primers. They are short synthetic molecules
of DNA complementary to both strands and
flanking the target sequences.
Taq DNA polymerase. It is an enzymes that
reads the original DNA sequence and makes
complementary copy.
Deoxy nucleoside triphosphates (dNTPs).
They are used to create the complementary
DNA strand, and include:
o
deoxy Adenosine triphosphate (dATP)
o
deoxy Thymidine triphosphate (dTTP)
o
deoxy Guanosine triphosphate (dGTP)
o
deoxy Cytidine triphosphate (dCTP
They prepare artificially with high-purity
either as individual stock solution or
quadruple mixture (at a concentration 200
µM
each).
PCR buffer. It is used to enables the chemical
reaction to take place.
U.V. spectrophotometer
Electrophoreses
Micro centrifuge (eppendrof), and eppendrof
microfuge tube (Fig 11-1).
Thermocycler (Fig 11-2).
U.V. Transilluminator (Fig 11-3).
Procedure of PCR technique
1)
Isolation of DNA (manually or by Kits).
2)
Detection of the presence of the DNA strands
using of the electrophoreses.
3)
Estimation of DNA concentration and its
purity using U.V. spectrophotometer.
Fig. (11-2) thermocycler
Fig. (11-1) (a) eppendrof microfuge tube, (b) micro
centrifuge (eppendrof).
(a)
(b)
Fig. (11-3) U.V. Transilluminator
id24028453 pdfMachine by Broadgun Software - a great PDF writer! - a great PDF creator! - http://www.pdfmachine.com http://www.broadgun.com
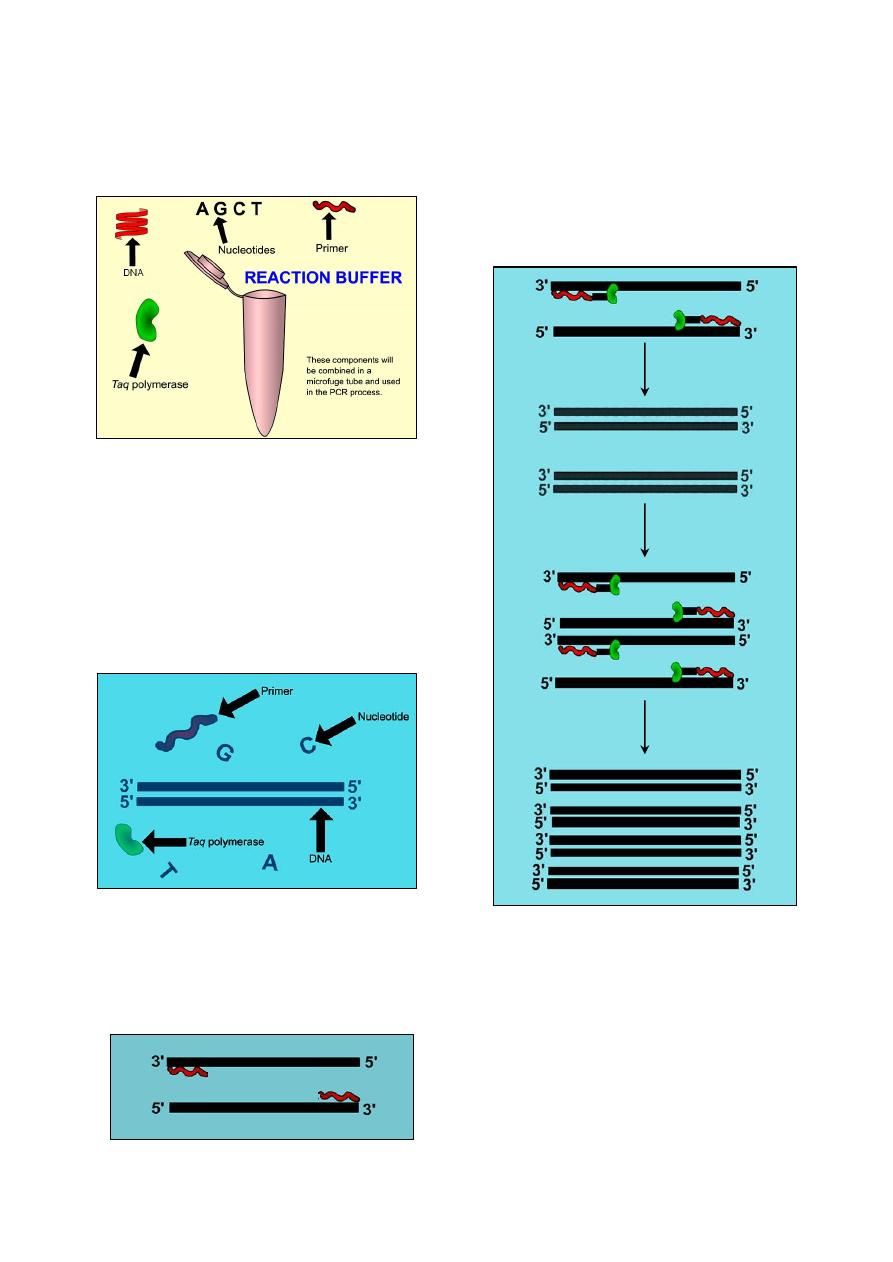
76
4)
Add (0.025
µg/µl of DNA + dNTPs + Taq
polymerase + PCR buffer + D.W. + Primer)
into eppendrof microfuge tube (Fig 11-4),
then close the lid of the tube and place it into
a thermocycler to be heated.
5)
Master thermocycler:
Step 1: denaturation.
Inside the thermocycler, the temperature
increases to 95
˚c. At this temperature the
DNA will become single stranded (Fig 11-5).
Step 2: anneling:
The eppendrof microfuge tube is cooled
(54
˚c) and the primers bind to their respective
complimentary sequences on the DNA (Fig
11-6).
Step 3: extension:
Once the primers have bound, the
eppendrof microfuge tube is warmed to
72
˚c allowing Taq polymerase to bind to
the primers.
After the Taq has bound, it reads the
original DNA strand and adds nucleotides
to extend the length of the complimentary
copy (Fig 11-7).
This process will continue, and in just a
few hours, millions of identical DNA
copies will be made.
6)
Detection of DNA amplification , using the
electrophoreses
7)
Staining of the DNA bands that found in the
gel with ethidium bromide.
8)
Detection of the stained bands using U.V.
Transilluminator
.
Fig. (11-4): components of PCR:
DNA: genetic code to be copied.
Nucleotides: used to create the complimentary DNA strand.
Primer: specific to the section of DNA to be copied.
Reaction buffer: enables the chemical reaction to take place.
Taq polymerase: enzyme that reads the original DNA
sequence and makes a complimentary copy.
Fig. (11-5): Break of the bonds between the two DNA
strands leading to separation of the strands.
Fig. (11-7): Adding of nucleotides to extend the length
of the complimentary copy, and the two copies of DNA
have now become four.
Fig. (11-6): Binding of the
primers to their respective
complimentary sequences on the DNA.
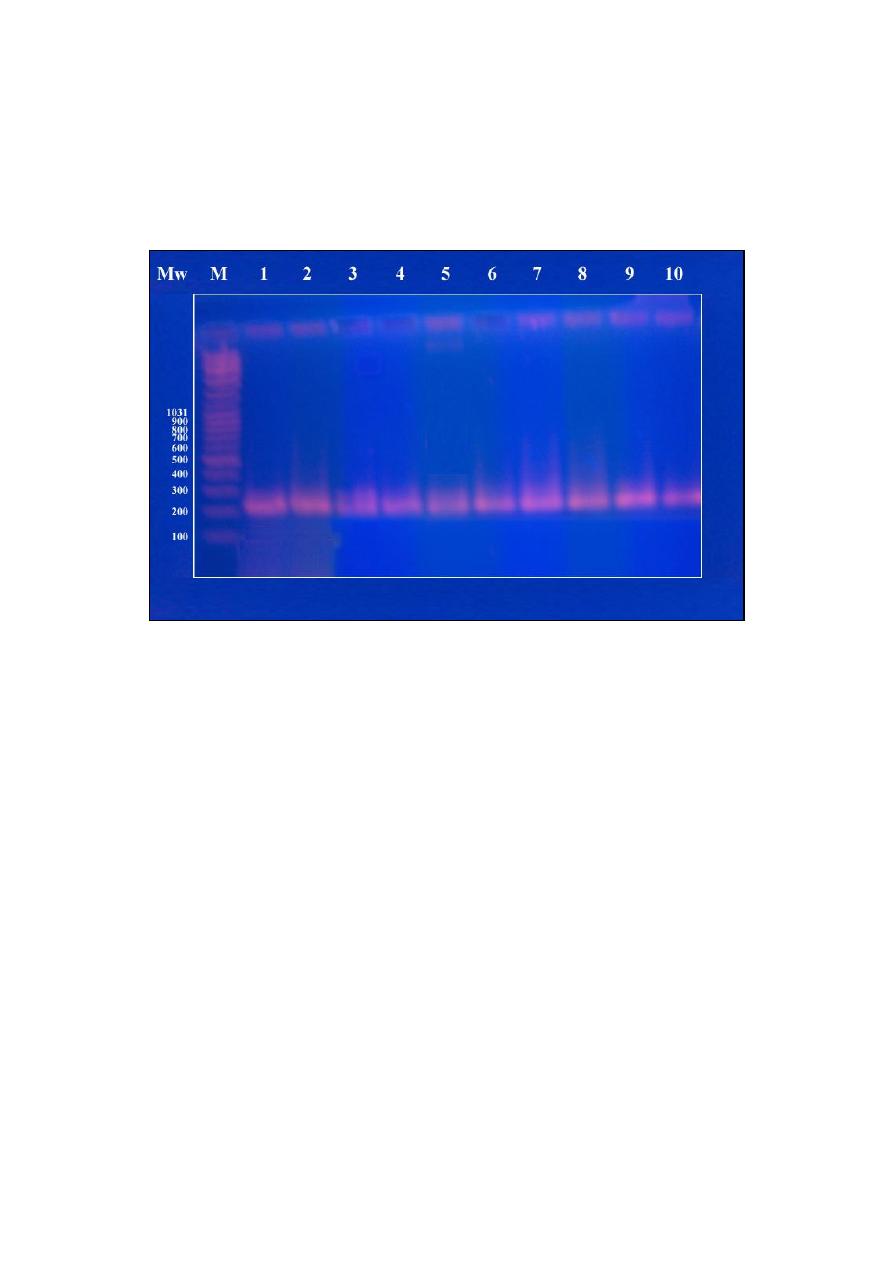
77
9)
Image the stained bands by digital camera.
10)
With the samples, we run a standard marker
whose molecular weight is known. The bands
of the samples compared with the bands of
that standard marker in order to measure the
molecular weight of the samples.
Example:
(Fig 11-8) show an image of PCR for identi-
fication the presence of brucella genus using
Brucella B4/B5 (223 bp).
There is a presence of bands of the samples
(1-10 in Fig 11-8) at 223 Mw that indicate that
the samples positive for brucella.
References
Mustafa, H. A. M. (2006). Detection Of Brucellosis In
sheep Using PCR With Other Serological
Tests. MSc thesis, College of Veterinary
Medicine, University of Mosul, Mosul, Iraq.
Sandall, L. (2002). Polymerase chain reaction.
Institute of Agriculture and Natural Resources,
University of Nebraska. (Flash program).
Tiwari, A. K., Gupta, P. K., Rai, A. and Mohan, C. M.
(2005). Protocols in Veterinary Biotechnology.
www.vaccinetechnology.org.
Fig. (11-8) results of DNA amplification using Brucella B4/B5 (223 bp) primer
(Mw): molecular weight of the standard marker.
(M): the bands of the standard marker.
(1-10): the bands of the brucella that has been measured.

78

- 79 -
A
A
p
p
p
p
e
e
n
n
d
d
i
i
x
x
S
S
t
t
a
a
i
i
n
n
s
s
Giemsa stain
Preparation of stock solution:
Giemsa powder
………………..………………………………………….... 1 gm
Glycerin
…………………………………………………………………... 66 ml
Alcohol, methyl
…………………………………………………………… 66 ml
In a mortar, mix well the Giemsa powder and glycerin.
Place the mixture in the oven at 60
˚c for 2 hours.
Add 66 ml of methyl alcohol to the mixture.
Preparation of working solution:
Giemsa solution (stock) .
……………………………………………….... 1.25 ml
Alcohol, methyl
………………………………………………………… 1.5 ml
Distilled water
……………………………………………………….…… 50 ml
Mix all solutions well, then stain the blood film.
Staining of blood film:
Fix the blood film in absolute methyl alcohol for 3-5 minutes and allow it to air dry.
Fill a Coplin jar with working Giemsa solution sufficiently to cover the slides completely.
Place the dry fixed blood film inside the Coplin jar that containing working Giemsa solution, and
leave it for 30 minutes.
After 30 minutes, lift the slide of blood film from the Coplin jar, wash it with distilled water and
air dry.
Leishman's stain
This stain should be stored in the solid form. In warm climates solutions deteriorate within a few
weeks.
Powdered Leishman's stain
……………..…………………….…………. 150 gm
Methyl alcohol, pure
……………………………………………………... 100 ml
Pour the methanol into a dark bottle.
Add the dye and close the bottle with a glass stopper. The dye dissolves slowly.
The bottle should be shaken from time to time during the next two days.
Method for thin films:
Place the slide with side up in a staining dish or support it on two glass rods over a sink.
Cover the film with a measured quantity of stain, i.e. 5-10 drops, and leave for two minutes.
Add double the quantity of buffered water (pH 7.2), i.e. 10-20 drops, and rock the slide gently to
mix.
Leave for 10-15 minutes.
Wash by flooding the slide with buffered distilled water.
Stand upright to drain and dry.
Method for thick films:
Immerse the slide in water until the red color (haemoglobin) has disappeared.
Stand the slide upright to dry. Then proceed as thin films from steps 1 to 6.
id24081890 pdfMachine by Broadgun Software - a great PDF writer! - a great PDF creator! - http://www.pdfmachine.com http://www.broadgun.com

- 80 -
Modified Wright's stain for Dip Technique
Reagents:
Powdered Wright's stain
………………..…………………….…………. 0.1 gm
Absolute methyl alcohol
……………………………………………….... 60 ml
Dissolve the powdered Wright's stain in the absolute methyl alcohol.
Add 10 ml of pure white glycerine to the dissolved stain.
Store the stain in a tightly stoppered brown bottle, and let it age.
Procedure:
Three screwcapped Coplin jars are used. They are filled with 95% ethyl alcohol, Wright's stain,
and phosphate buffer
1
or neutral distilled water, respectively.
Place the dried blood film or bone marrow film in alcohol for 20-30 seconds
2
.
Without washing or drying, place the slide in the stain for 2-4 minutes. The length of time will
depend on the batch stain being used and the thickness of the smear.
Again without washing, place the slide in the buffer solution or distilled water for 2-3 minutes, 2-3
drops of Wright's stain should be added prior to use.
Rinse slides in running water for a few seconds. Do not over-rinse.
Gram stain
Gentian violet:
Crystal violet
………………..………………………………………….... 2 gm
Ethanol 95% (vol/vol)
…………………………………………………... 20 ml
Ammonium oxalate
………………………………………………………. 0.8 g
Distilled water
……………………………………………………………. 80 ml
The crystal violet is dissolved in the ethanol.
The ammonium oxalate is dissolved in the distilled water.
The two solutions are added together.
To aid the dissolving process, both mixtures are agitated in a bath of hot water.
Gram's iodine:
iodine
………………..…………………………………………………....... 1 gm
Potassium iodide
…………..……………………………………...………... 2 gm
Distilled water
……………………………………………………………. 200 ml
The iodide crystals and the potassium iodide are ground together in a mortar and the distilled
water is added slowly.
If necessary, the mixtures can be agitated in a bath of hot water to aid dissolution.
This solution should be prepared fresh every two to three weeks.
Decolourizer:
Ethanol 95% (vol/vol)
Dilute carbol fuchsin (counter stain):
Concentrated carbol fuchsin
……………………………………………... 10 ml
Distilled water
……………………………………………………………. 90 ml
Technique:
Prepare a slide and allow it to dry.
Fix the slide by gently heating over a low flame of a Bunsen burner.
1
Phosphate buffer is prepared as follows: (3.8 gm) Na
2
HPO
4
, (5.47 gm) KH
2
PO
4
, dissolved in 500 ml distilled water and bring
total volume to 1000 ml, using a volumetric flask.
2
A longer period is required for thick bone marrow films.

- 81 -
Cool the slide and stain for 1
1
/
2
to 2 minutes with gentian violet.
Wash with water.
Treat with Gram's iodine for at least one minute.
Wash wit water.
Decolorize for a few seconds.
Wash with water.
Add the counterstain for
1
/
2
to 1 minutes.
Wash, blot dry, and examine under the oil immersion lens.
Acid-Fast stain (Ziehl-Neelsen stain)
Ziehl-Neelsen carbolfuchsin:
Concentrated carbol fuchsin
……………………………………………... 3 gm
Ethyl alcohol 95%
………………………………………………………. 100 ml
Phenol
…………………………………………………………………...…. 5 gm
Distilled water
……………………………………………………………. 100 ml
Dissolve the concentrated carbal fuchsin in ethyl alcohol to obtain alcoholic basic fuchsin.
Dissolve the phenol in distilled water to obtain 5% phenol.
Mix 10 ml of alcoholic carbal fuchsin and 90 ml of 5% phenol, let stand for 24 hours, and filter.
Decolourizer (Acid-alcohol):
Concentrated hydrochloric acid
…………………………………………….. 2 ml
Ethyl alcohol 95%
………………………………………………………. 98 ml
Counterstain (methylene blue):
Methylene blue
…………………………………………………………….. 8 gm
Ethyl alcohol 95%
………………………………………………………. 300 ml
distilled water
………………………………………………………… 1300 ml
Potassium hydroxide
………………………………………………….… 0.13 gm
Technique:
Prepare a smear, dry it and then fix by gently heat.
Cover the smear with Ziehl-Neelsen carbolfuchsin and steam gently for 5 minutes.
Wash with tap water.
Decolorize with acid-alcohol until the film is colorless.
Wash with water.
Counterstain with methylene blue for 5-20 seconds, depending upon the thicjness of the smear.
Wash with water and dry.
Modified Ziehl-Neelsen stain
Ziehl-Neelsen carbolfuchsin:
Same formula as for Acid-Fast (Ziehl-Neelsen) stain.
Decolourizer (acetic acid):
Concentrated acetic acid
…………...……………………………………….. 1 ml
Distilled water
……………………………………………………………. 200 ml
Counterstain (methylene blue):
Same formula as for Acid-Fast (Ziehl-Neelsen) stain.

- 82 -
Methylene blue stain
This stain is used especially for Pasteurella spp. Which characterized by bipolarity.
Reagents:
Methylene blue
…………...………………………………………………... 1 gm
Distilled water
……………………………………………………………. 100 ml
Technique:
Prepare a smear and dry it.
Cover the smear with methylene blue for 2 minutes.
Wash with tap water and allow to dry.
Polychrome Methylene blue stain
This stain is methylene blue solution that has been allowed to oxidise by storing it exposed to the
air (loosely plugged) for several months. It is used for Bacillus anthracis.
Reagents:
Methylene blue
………………………………………………………… 0.3 gm
Ethanol 95%
…………………………………………….………………. 30 ml
Potassium hydroxide (KOH) 0.01%
……………………………...……… 100 ml
0.3 gm methylene blue is dissolved in 30 ml 95% ethanol.
100 ml of 0.01% potassium hydroxide (KOH) is mixed with methylene blue solution. Ideally, this
should be allowed to stand exposed to the air, with occasional shaking for at least 1 year to
oxidase and mature.
Technique:
Prepare a smear from a suspected case, and dry it.
Flame-fixed and flooded with the stain for 2-3 minutes.
Wash the smear and dry it.
The rods of Bacillus anthracis stain blue and the capsular material stain pale pink color.
Note:
Any suspected anthrax material should be handled with care and the stained slides autoclaved
after use. Viable spores may be present on the slide after staining.

- 83 -
N
N
o
o
r
r
m
m
a
a
l
l
L
L
a
a
b
b
o
o
r
r
a
a
t
t
o
o
r
r
y
y
V
V
a
a
l
l
u
u
e
e
s
s
Hematology
Parameter (Unit)
Horse
Cattle
Sheep
Goat
Dog
Cat
RBCs (
× 10
6
/
µL)
6.0
– 10.4
5.0
– 10.0
9.0
– 15.0
8.0
– 18.0
4.95
– 7.87
5.0
– 10.0
WBCs (
× 10
3
/
µL)
5.6
– 12.1
4.0
– 12.0
4.0
– 12.0
4.0
– 13.0
5.0
– 14.1
5.5
– 19.5
Segmented neutrophils (
× 10
3
/
µL)
2.9
– 8.5
0.6
– 4.0
0.7
– 6.0
1.2
– 7.2
2.9
– 12.0
2.5
– 12.5
Band neutrophils (
× 10
3
/
µL)
0.0
– 0.1
0.0
– 0.1
Rare
Rare
0.0
– 0.45
0.0
– 0.3
Lymphocytes (
× 10
3
/
µL)
1.16
– 5.1
2.5
– 7.5
2.0
– 9.0
2.0
– 9.0
0.4
– 2.9
1.5
– 7.0
Monocytes (
× 10
3
/
µL)
0.0
– 0.7
0.0
– 0.9
0.0
– 0.75
0.0
– 0.55
0.1
– 1.4
0.0
– 0.9
Eosinophils (
× 10
3
/
µL)
0.0
– 0.78
0.0
– 2.4
0.0
– 1.0
0.
– 0.65
0.0
– 1.3
0.0
– 0.8
Basophils (
× 10
3
/
µL)
0.0
– 0.3
0.0
– 0.2
0.0
– 0.3
0.0
– 0.12
0.0
– 0.14
0.0
– 0.2
Reticulocytes (%)
0
0
0
0
0.0
– 1.5
0.0
– 1.0
Absolute reticulocytes count (
× 10
3
/
µL)
0
0
0
0
< 80
< 60
Platelet count (
× 10
3
/
µL)
117
– 256
100
– 800
2.5
– 7.5
3.0
– 6.0
211
– 621
300
– 800
Hematocrit "PCV" (%)
27
– 43
24
– 46
27.0
– 45.0
22
– 38.0
35
– 57
30
– 45
Haemoglobin "Hb" (g/dl)
10.1
– 16.1
8.0
– 15.0
9.0
– 15.0
8.0
– 12.0
11.9
– 18.9
9.8
– 15.4
Mean corpuscular volume "MCV" (fl)
37
– 49
40
– 60
28.0
– 40.0
16.0
– 25.0
66
– 77
39
– 55
Mean corpuscular Hb "MCH" (pg)
13.7
– 18.2
11
– 17
8.0
– 12.0
5.2
– 8.0
21.0
– 26.2
13
– 17
Mean corpasculer Hb conce. "MCHC" (g/dl)
35.3
– 39.3
30
– 36
31.0
– 34.0
30.0
– 36.0
32.0
– 36.3
30
– 36
Erythrocytes Sedimentation Rate "ESR" (minute)
15
–38/20 min. 2.25–4/24 h.
3
–8.5/24 h.
2
–2.5/24 h.
1
–6/30 min.
7
–23/60 min.
Whole blood clotting time (minute)
3
– 15
3
– 15
1
– 6
2.5
– 11.5
4
5.2
± 0.2
Bleeding time (minute)
1
– 5
1
– 5
-
-
1
– 5
1
– 5
Myeloid/Erythroid ratio (M/E)
0.9-3.8 : 1
0.3-1.9 : 1
0.8-1.7 : 1
0.7-1.0 : 1
0.75-2.4 : 1
0.6-3.9 : 1

- 84 -
Biochemistry
Parameter (Unit)
Horse
Cattle
Sheep
Goat
Dog
Cat
Total protein "serum" (g/dl)
5.6
– 7.6
6.7
– 7.5
6.0
– 7.9
6.1
– 7.4
5.4
– 7.5
6.0
– 7.9
Albumin (g/dl)
2.6
– 4.1
2.5
– 3.8
2.4
– 3.0
2.3
– 3.6
2.3
– 3.1
2.8
– 3.9
Globulin "total" (g/dl)
2.6
– 4.0
3.0
– 3.5
3.2
– 5.0
2.7
– 4.4
2.7
– 4.4
2.6
– 5.1
Albumin/Globulin ratio (A/G)
6.2
– 14.6
8.4
– 9.4
4.2
– 7.6
6.3
– 12.6
0.6
– 1.1
0.6
– 1.1
Plasma
Proteins
Fibrinogen (mg/dl)
200
– 400
200
– 700
200
– 500
200
– 300
150
– 300
150
– 300
Sodium (mEq/L)
128
– 142
136
– 144
145
– 152
137
– 152
142
– 152
146
– 156
Potassium (mEq/L)
3.0
– 5.0
3.9
– 5.8
3.9
– 4.5
3.8
– 5.7
3.9
– 5.1
3.7
– 6.1
Electrolytes
Chloride (mEq/L)
98
– 110
95
– 110
95
– 103
100
– 111
110
– 124
115
– 130
Calcium (mg/dl)
11.2
– 13.6
9.7
– 12.4
11.5
– 13
9.0
– 11.5
9.1
– 11.7
8.7
– 11.7
Phosphorus (mg/dl)
3.1
– 5.6
5.6
– 6.5
5.0
– 7.3
3.7
– 9.7
2.9
– 5.3
3.0
– 6.1
Magnesium (mg/dl)
2.2
– 2.8
1.8
– 2.3
2.2
– 2.8
2.1
– 2.9
1.6
– 2.4
1.7
– 2.6
Minerals
Iron "serum" (
µg/dl)
91
– 199
57
– 162
166
– 222
-
94
– 122
68
– 215
pH
7.32
– 7.44
7.35
– 7.50
7.32
– 7.50
-
7.31
– 7.42
7.24
– 7.40
Bicarbonate "HCO
3
–
" (mEq/L)
23
– 32
20
– 30
21
– 28
-
17
– 24
17
– 24
PCO
2
38
– 46
34
– 45
38
– 45
-
29
– 42
29
– 42
Acid-Base
balance
PO
2
94
92
-
-
85
– 95
85
– 95
Blood urea nitrogen "BUN" (mg/dl)
10
– 24
6.0
– 27
8.0
– 27
12.6
– 25.8
8
– 28
19
– 34
Creatinine (mg/dl)
0.9
– 1.9
1.0
– 2.0
1.2
– 1.9
0.7
– 1.5
0.5
– 1.7
0.9
– 2.2
Nitrogenous
substances
Ammonia (
µg/dl)
13
– 110
-
-
-
19
– 120
0
– 90
Glucose (mg/dl)
75
– 115
45
– 75
50
– 80
48
– 76
76
– 119
60
– 120
Ketones
Acetoacetate (mg/dl)
0.24
– 0.36
0
– 1.1
0.24
– 0.36
-
0
– 0.36
-
Acetone (mg/dl)
0
– 10
0
– 10
0
– 10
-
-
-
Carbohydrate
Â-hydroxybutyrate (mg/dl)
0.55
– 0.80
5.9
– 13.9
4.7
– 6.7
-
0.24
– 0.36
-
Total Bilirubin (mg/dl)
1.0
– 2.0
0.01
– 1.5
0.1
– 0.5
0.1
– 0.2
0.0
– 0.3
0.0
– 0.1
Direct Bilirubin "conjugated" (mg/dl)
0.0
– 0.4
0.04
– 0.44
0
– 0.27
-
0.0
– 0.3
0.0
– 0.1
Bile acids "fasting" (
µg/ml)
4
– 8
<50
<9
-
0
– 8
0
– 5
Cholesterol (mg/dl)
46
– 180
65
– 220
43
– 103
64
– 136
135
– 278
71
– 156
Bilirubin and
fat
metabolism
Triglycerides (mg/dl)
4
– 44
0
– 14
-
-
40
– 169
27
– 94
Creatine phosphokinase "CPK" (U/L)
2.4
– 23.4
4.8
– 12.1
8.1
– 12.9
0.8
– 8.9
1.15
– 28.40
7.2
– 28.2
Plasma
enzymes
Alkaline phosphatase "AP" (U/L)
140
– 403
0
– 500
70
– 390
61
– 283
1
– 114
0
– 45

- 85 -
Biochemistry: continue
Parameter (Unit)
Horse
Cattle
Sheep
Goat
Dog
Cat
Aspartate aminotransferase "AST" (U/L)
220
– 600
78
– 132
60
– 280
66
– 230
13
– 15
7
– 38
Alanine aminotransferase "ALT" (U/L)
3
– 23
11
– 40
22
– 38
15
– 52
10
– 109
25
– 97
Gamma-glutamyl transferase "GGT" (U/L)
4
– 44
6.1
– 17.4
20
– 52
20
– 50
1.0
– 9.7
1.8
– 12.0
Sorbitol dehydrogenase "SDH" (U/L)
1.9
– 5.8
4.3
– 15.3
5.8
– 28
9.3
– 20.7
3.1
– 7.9
2.4
– 6.1
Plasma
enzymes
Lactate dehydrogenase "LDH" (U/L)
160
– 410
692
– 1445
240
– 440
87.5
– 265.5
24
– 219
35
– 224
Cortisol (
µg/dl)
1.3
– 2.9
0.47
– 0.75
1.4
– 3.1
-
0.96
– 6.81
0.33
– 2.57
Thyroxine "T4" (
µg/dl)
1.16
– 2.14
4.2
– 8.6
-
-
-
-
Hormones
Triiodothyronine "T3" (ng/dl)
31.5
– 53.5
-
-
-
82
– 138
15 - 104
Carotene (
µg/dl)
20
– 175
25
– 950
0
– 20
-
35
– 90
(188)
Carotenol (
µg/dl)
9
– 16
10
– 30
20
– 45
-
0
– 5
50
– 195
Vitamins
Vitamin B
12
(pg/ml)
-
-
-
-
170
– 180
-

- 86 -
Summary of some commonly used biochemical tests for the identification of bacteria
Result
Test
Medium
Incubation (aerobic)
Product tested for
Test reagent
Negative
Positive
Citrate utilization
Simmons citrate
inoculate solid agar
slant
Up to 7 days at 37
˚c
Ability to use citrate
as sole carbonate
source
Bromothymol blue
Green pH (6.9)
Blue pH (7.6)
Gelatin liquefaction
Nutrient gelatin stab
inoculation
22
˚c for 30 days or
37
˚c for 14 days
Proteolytic activity
(gelatinases) and
gelatin liquefied
No liquefaction
Liquefaction
(not solid at +4
˚c)
Hydrogen sulphide
Lead acetate paper
strip suspended over
trypticase soy broth or
serum glucose agar
slants
35
˚c for up to 7 days
change lead acetate
strip daily
Hydrogen sulphide
gas product on
No change on lead
acetate strip
Blackening of the
lead acetate strip
Indole test
Tryptone water
1-2 days at 30
˚c
Tryptophan split to
indole
Add 0.5 ml Kovac's
reagent to medium and
shake read in 1 minute
Reagent layer yellow
Reagent layer
deep red
Methyl red test (MR)
Glucose phosphate
peptone water (5ml)
(MR-Vp broth)
2 days at 37
˚c or
3-5 days at 30
˚
Small molecular
weight acids such as
formic and acetic
MR reagent 5 drops to
medium
Yellowish
Red (acid)
pH 4.4-6.0
Nitrate reduction
Nitrate broth (0.1%
KNo
3
) 5ml
24 hours at 37
˚c
(rarely up to 5 days)
Nitrate (No
3
)
Nitrite (No
2
)
Nitrogen gas (N
2
)
Reagents for nitrate A
and B, add 5 drops of
each reagent shake
and wait 1-2 minutes
Colorless (no nitrate
present) add pinch of Zn
dust
No
3
converted
to No
2
red (No
3
not
reduced)
Red (No
3
to No
2
)
Colorless
(No
3
reduced to N
2
)
Voges-proskeuer
(VP) test
5 ml glucose phosphate
peptone water
(MR-VP broth)
3 to 5 days at 30
˚c
Acetone derived from
glucose
3 ml of 5% alphanaph-
thol in absolute ethyl
alcohol and then 1 ml of
40% KOH shake and
leave for 5 minutes
Colorless
Red
Urease test
Christensen media
(1) urea agar base +
2% urea (slant)
(2) urea broth base +
2% use a heavy
inoculum
Up to 24 hours
at 37
˚c
Urease splits urea
with formalin of
anemia (alkaline)
Phenol red
Yellow
Red
(alkaline)

- 87 -
Primary identification of Gram-positive bacteria. (Cat.= catalase, Ox.- = oxidase, + = positive reaction, - = negative
reaction,
± = variable, * = motile, ** = anaerobic).
Gram- Positive
Bacteria
Cocci
Rods
Oxidative
Cat.+/Ox.
±
Fermentative
Cat.+/Ox.-
Fermentative
Cat.-/Ox.-
Unreactive
Cat.+/Ox.-
Micrococcus spp.
Staphylococcus spp.
Streptococcus spp.
Rhodococcus equi
Oxidative
Cat.+/Ox.
±
Fermentative
Cat.+/Ox.-
Fermentative
Cat.-/Ox.-
Unreactive
Cat.+/Ox.-
Nocardia asteriodes
Bacillus spp.* (some)
Actinomyces viscosus
Bacillus spp.* (some)
Corynebacterium spp.
Listeria spp.*
Actinomyces spp.** (most)
Actinomyces pyogenes
Erysipelothrix spp.
Clostridium spp.**/*
Eubacterium spp.**
Lactobacillus spp.
Rhodococcus equi

- 88 -
Primary identification of Gram-negative bacteria. (Cat.= catalase, Ox.- = oxidase, + = positive reaction, - = negative
reaction,
± = variable, * = motile).
Gram- Negative
Bacteria
Cocci
Rods
No growth on
MacConkey
Growth on
MacConkey
Oxidative
Cat.+/Ox.+
Oxidative or
Unreactive
Cat.+/Ox.+
Neisseria spp.
Branhamella spp.
Acinetobacter spp.
No growth on
MacConkey
Growth on
MacConkey
Oxidative
Cat.+/Ox.+
Flavobacterium spp.
Fermentative
Cat.+/Ox.+
Pasteurella spp. (most)
Unreactive
Cat.+/Ox.+
Brucella spp.
Haemophillus spp.
Pasteurella anatipestifer
Taylorella equigenitalis
Unreactive
Cat.
±/Ox.+ Moraxella spp.
Campylobacter spp.
Unreactive
Cat.-/Ox.+
Francisella tularensis
Oxidative
Cat.+/Ox.+
Pseudomonas spp.* (most)
Fermentative
Cat.+/Ox.+
Aeromonas spp.*
Pasteurella haemolytica
Plesinomonas spp.*
Fermentative
Cat.
±/Ox.± Actinobacillus spp.
Fermentative
Cat.+/Ox.-
Enterobacteriaceae*
Pasteurella caballi
Unreactive
Cat.+/Ox.+
Bordetella spp.*
Alcaligenes spp.*
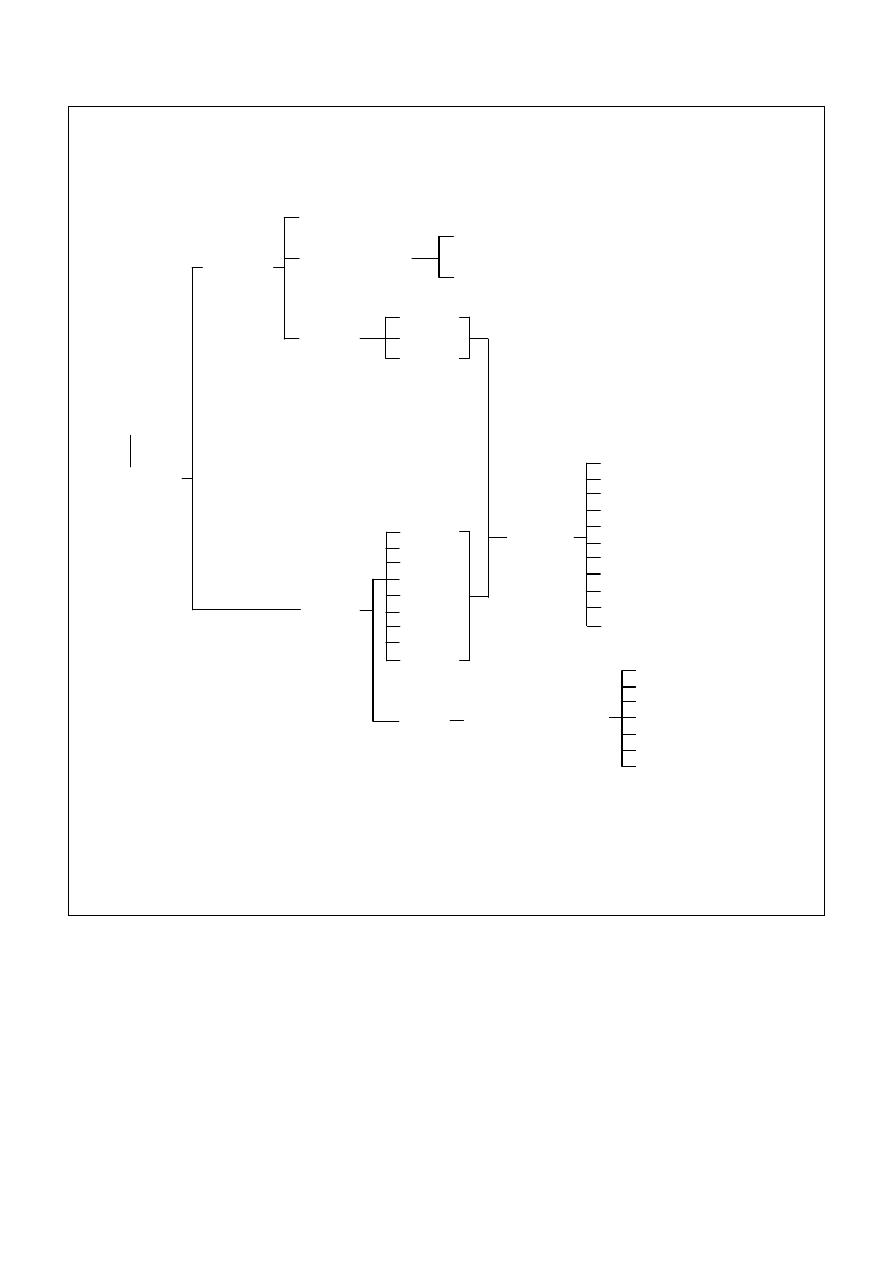
- 89 -
History
Clinical signs
Pathology
Gross lesions
Histopathology
Chemical staining
Immunocyto-chemical staining
(Cryostat)
Sample
Tissue
Fluid
Scraping
Sample
Scab
Feces
Scraping
Sputum
Blood
Aspirate
Urine
Milk
Biopsy
Serum
Presence
of virus
CFT
HA
AGID
ELISA
EM
Immuno-cytochemical staining
RIA
Virus isolation
PCR
In situ hybridization
Latex agglutination
Presence of antiviral
antibody
AGID
HAI
IFAT or IP
ELISA
VN
RIA
CFT
Viral diagnosis. AGID: agar gel immunodiffusion, CFT: complement fixation test, ELISA: enzyme-linked
immunosorbent assay, EM: electron microscopy, HA: hemagglutination, HAI: hemagglutination-inhibition,
IFAT: indirect fluorescent antibody technique, IP: immunoperoxidase, PCR: polymerase chain reaction,
RIA: radioimmunoassay, VN: virus neutralization.

- 90 -
References
Adam, K. M. G., Paul, J. and Zaman, V. (1971).
Medical and Veterinary Protozoology: an
illustrated gaiude. London group Ltd.
Aiello, S. E. (1998). The Merck veterinary manual.
8th ed., Merck & Co Inc., USA.
Coles, E. H. (1986). Veterinary clinical pathology. 4
th
ed., WB Saunders Co Philadelphia, London,
Toronto.
Latimer, K. S., Mahaffey, E. A. and Prasse, K. W.
(2003). Duncan and Prasse's Veterinary
Laboratory Medicine: Clinical Pathology. 4th
ed., Blackwell Publishing Co., U.S.A
Luna, L. G. (1968). Manual of histological staining
methods of the armed forces institute of
pathology. 3rd ed., Mcgraw-Hill Book Co.
Macfadding, J. F. (1979). Biochemical test for
identification of medical bacteria. Williams
and Willkins, Baltimore, U.S.A.
Quinn, P. J., Carter, M. E., Markey, B. and Carter, G.
R. (1999). Clinical Veterinary Microbiology.
1st ed. Elservier Ltd. London.
Quinn, P. J., Markey, B. K., Carter, M. E., Donnelly,
W. J. C. and Leonard, F. C. (2002). Veterinary
Microbiology and Microbial Disease. 1st ed.
Blackwell Science Ltd., London.
Radostits, O. M., Gay, C. C., Hinchcliff, K. W. and
Constable, P.D. (2007). Veterinary medicine:
A textbook of the diseases of cattle, sheep,
pigs, goats and horses. 10th ed., WB Saunders
Co.