First stage – College of Medicine – University of Mosul / Nineveh
Computer Science/
Lecture 3
Assistant Lecturer: Zina Abdul Salam
EXCEL 2013
1
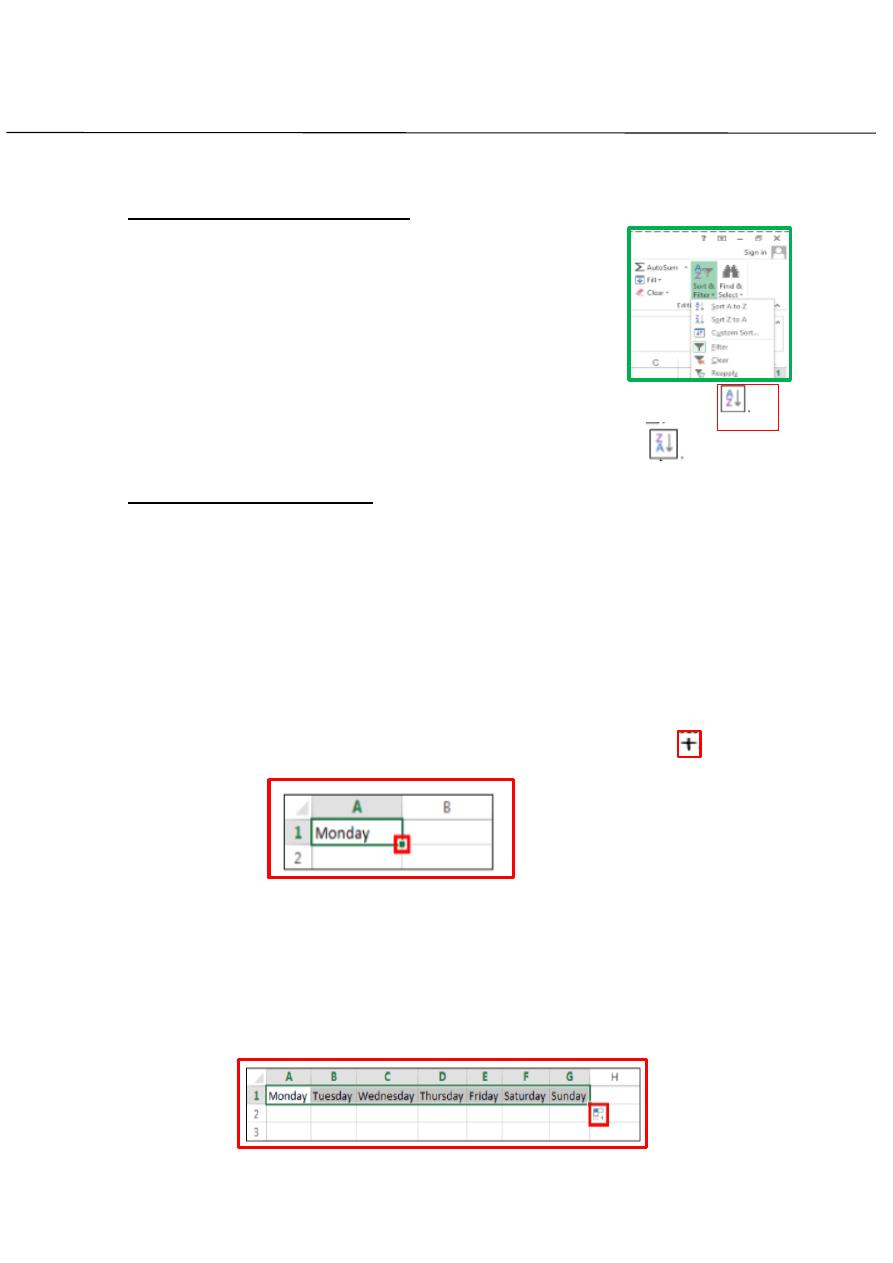
Sorting data by a Single Column:
To sort the data in wok sheet by a single column.
1- Select a cell in the column that you want to sort by.
2- On the Data tab, in the Sort& Filter group, do one of
the following:
a-To sort in ascending order, click the Ascending button
.
b- To sort descending order, click the Descending button.
Entering data using Auto Fill
The Auto Fill feature automatically fills in data based on the data in
adjacent cells. You can use it to enter data in a series (such as months, days
of the week, and quarters).or copy values to formulas to adjacent cell. To
enter data using auto fill:
1- Select the cell that contain the first value of a series you want to
extend or the data you want to copy.
2- Point to the Fill handle (the green square) in the lower-right corner of
the selected cell. The mouse pointer changes to a black plus sign
3- Drag the Fill handle over the cell that you want to fill. As you drag, screen
tip appears showing the data that will be entered in each cell.
4- Release the mouse button. Excel fills the cells based on the contents of
the first cell, the Auto Fill option button appears in the lower- right corner
of the last cell.
First stage – College of Medicine – University of Mosul / Nineveh
Computer Science/
Lecture 3
Assistant Lecturer: Zina Abdul Salam
EXCEL 2013
2
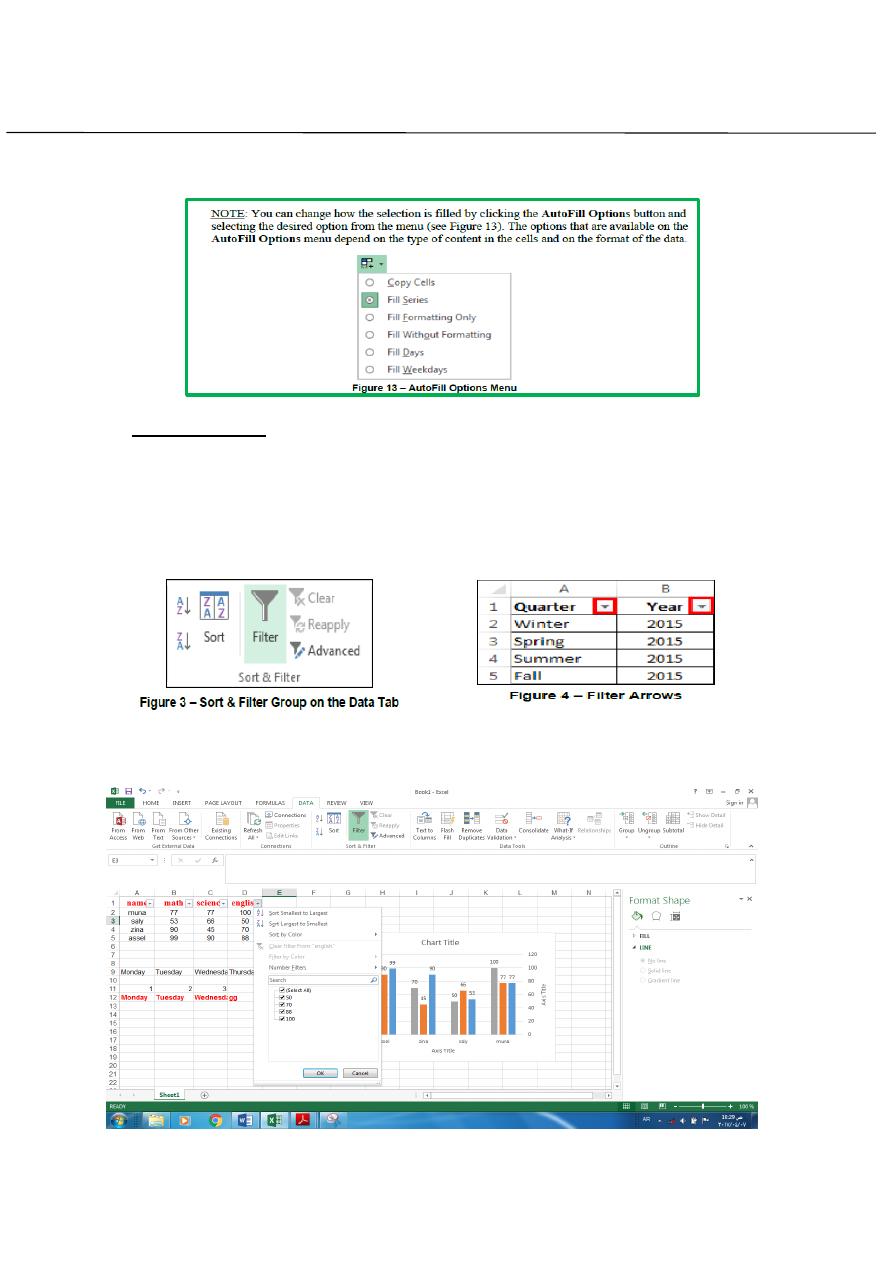
Filtering Cells
Filtering or temporarily hiding data in a spreadsheet very easy. This
allows you to focus on specific spreadsheet entries To Filter Data:
1. Select a cell within the range that you want to filter
2. On the data tab, in the Sort& Filter group, click filter button (see
figure3).Filter arrows appear to each column heading (see figure4).
3.deselect the (select All) check box at the top of the list and then
select check box next to the value you want.
First stage – College of Medicine – University of Mosul / Nineveh
Computer Science/
Lecture 3
Assistant Lecturer: Zina Abdul Salam
EXCEL 2013
3
To Clear One Filter:
1. Select one of the drop-down arrows next to a filtered column.
2. Choose Clear Filter From...
3. To remove all filters, click the Filter
command.
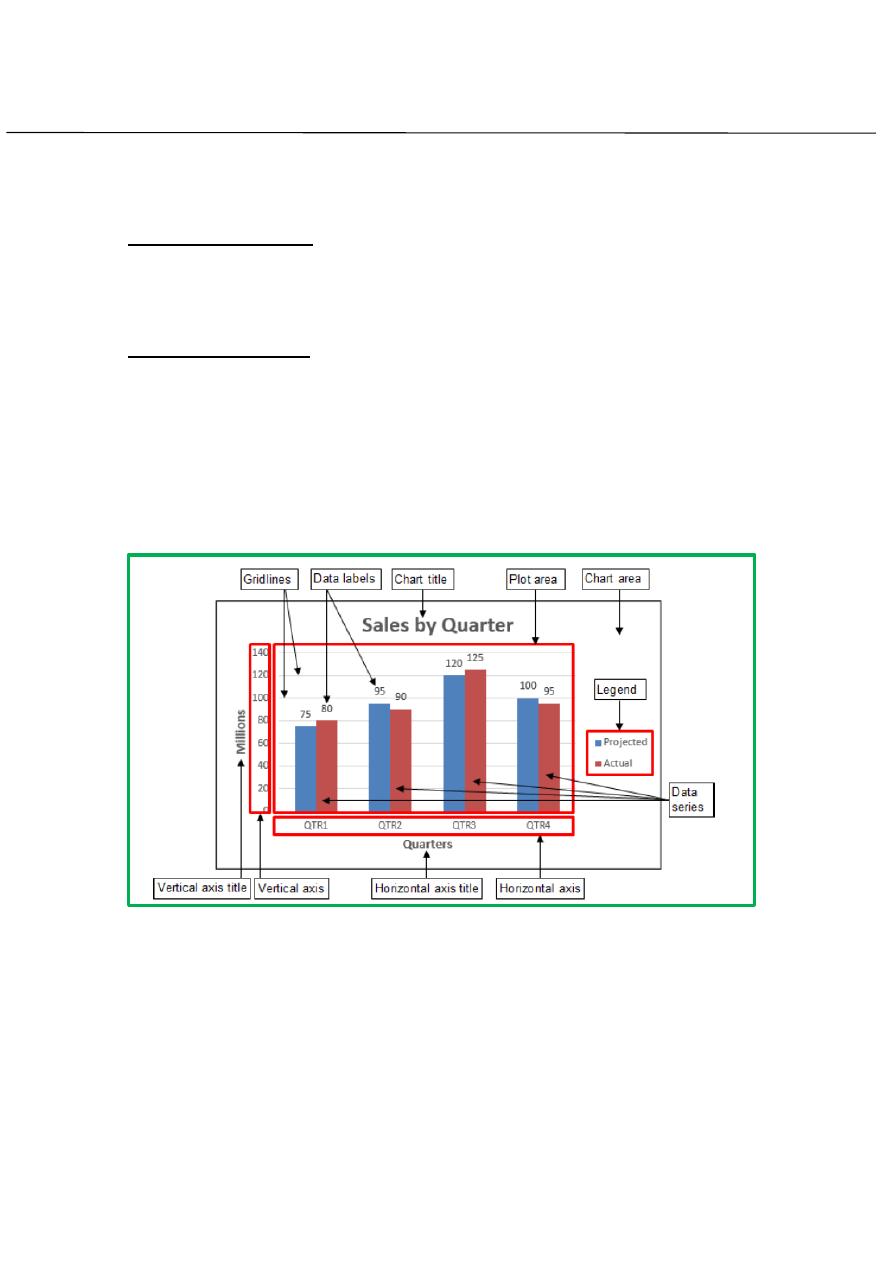
Working with charts:
A chart is agraphical representation of numerical data. You use chart to
make it easier to spot trends, highlight important changes, or compare
individual figures. A chart is composed of many element , some of these
element are displayed by default, others can be added as needed. You
can also remove chart element that you do not want to display. Not all
element appear in every chart type.
First stage – College of Medicine – University of Mosul / Nineveh
Computer Science/
Lecture 3
Assistant Lecturer: Zina Abdul Salam
EXCEL 2013
4
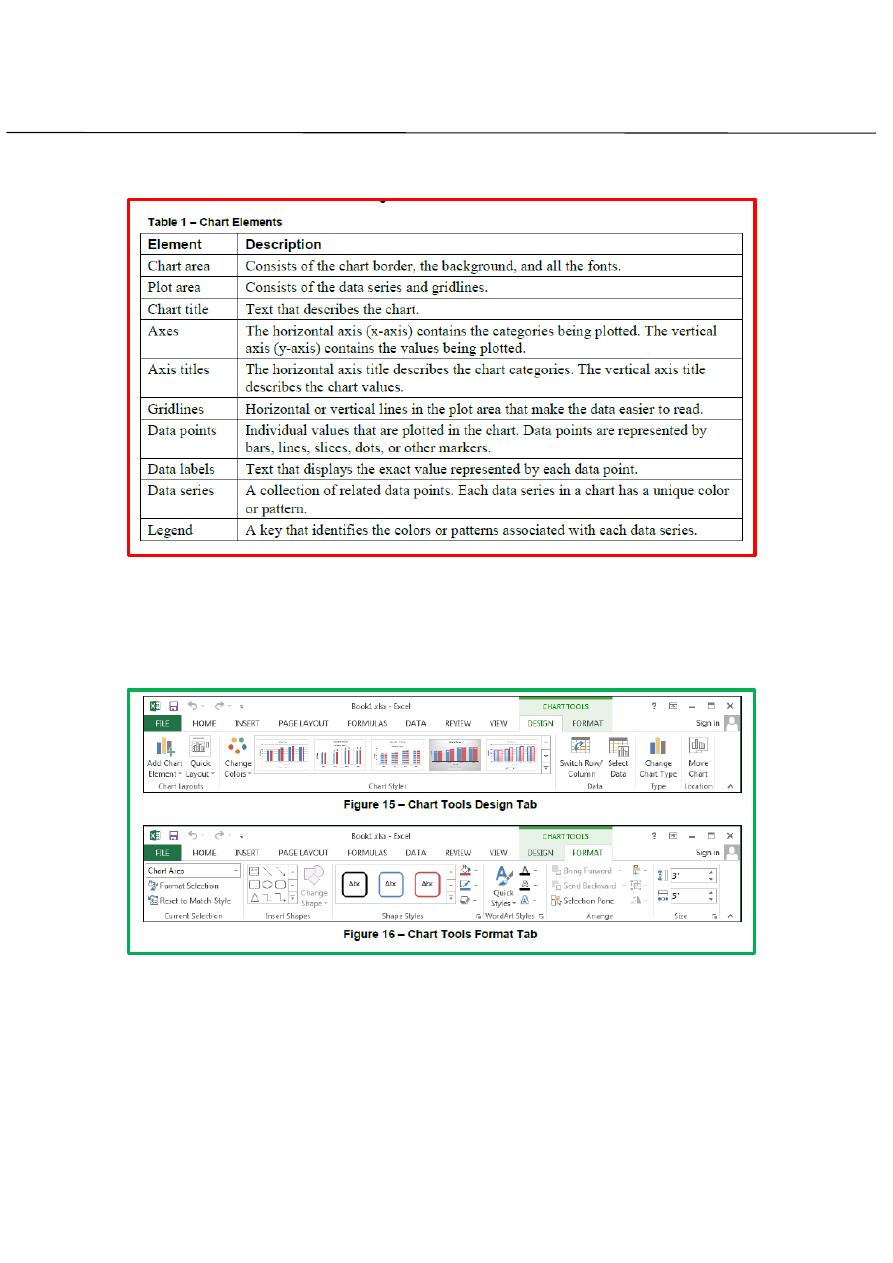
When a chat is selected, the chart tools contextual tabs
(Design and Format) become available on the Ribbon. You can use the
commands on these tabs to change the design, and appearance of the
chart.
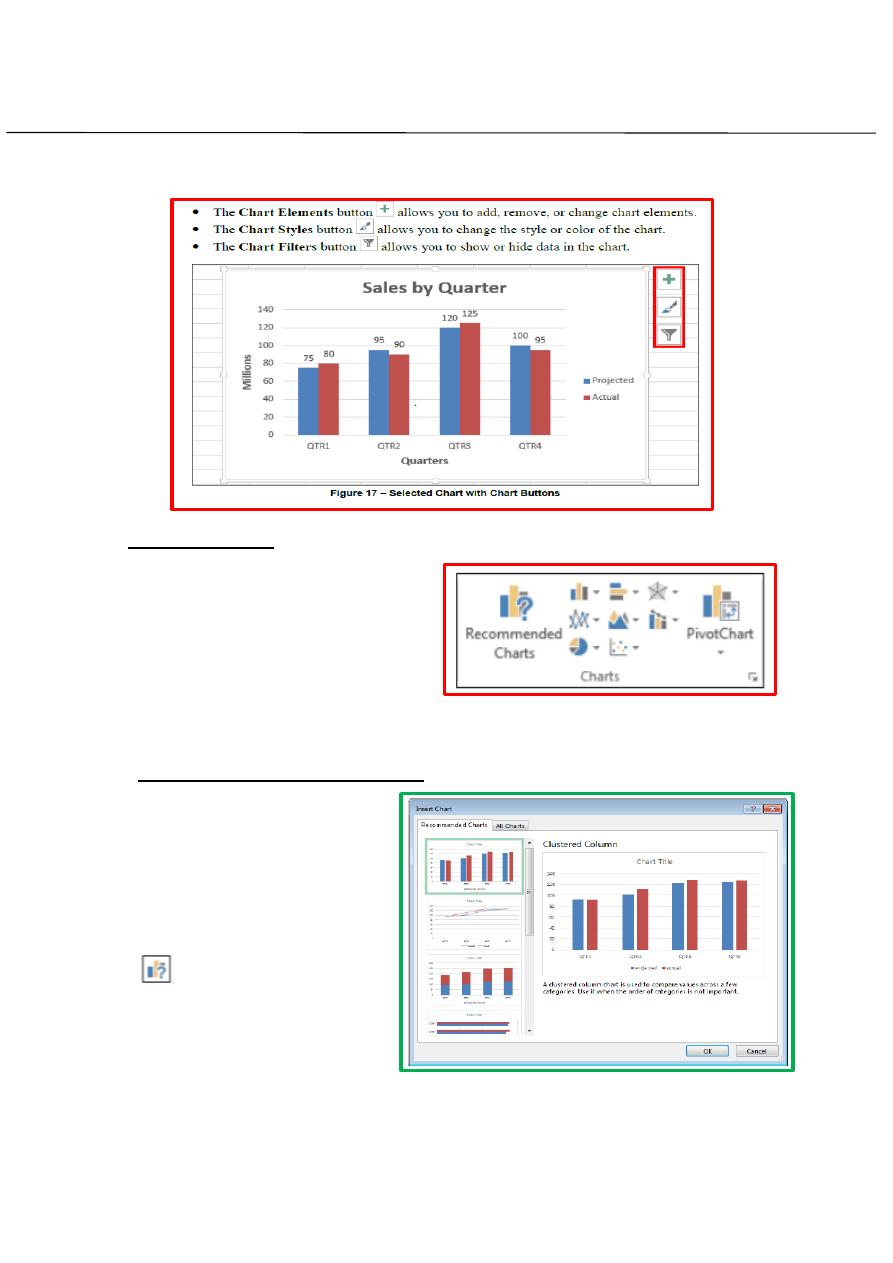
When a chart is selected, three buttons appear in the upper-right corner
of the chart. These Buttons provide quick access to the most common
and useful chart customization features.
First stage – College of Medicine – University of Mosul / Nineveh
Computer Science/
Lecture 3
Assistant Lecturer: Zina Abdul Salam
EXCEL 2013
5
:
To create a chart
1- Select the cells that contain the
data you want to include in the
chart.
2- On the insert tab, in the Charts
group, click the chart type that
you want to use, and then click the desired chart subtype. The chart
appears in the worksheet.
To create a recommended chart:
1- Select the cells that
contain the data you want
include in the chart.
2- On the Insert tab, in the
chart
group,
click
the
recommended Charts button
.
3- In the insert chart dialog
box,
on
the
Recommended Charts tab.
Select one of the recommended chart in the left pane, and then click the
OK button.
First stage – College of Medicine – University of Mosul / Nineveh
Computer Science/
Lecture 3
Assistant Lecturer: Zina Abdul Salam
EXCEL 2013
6
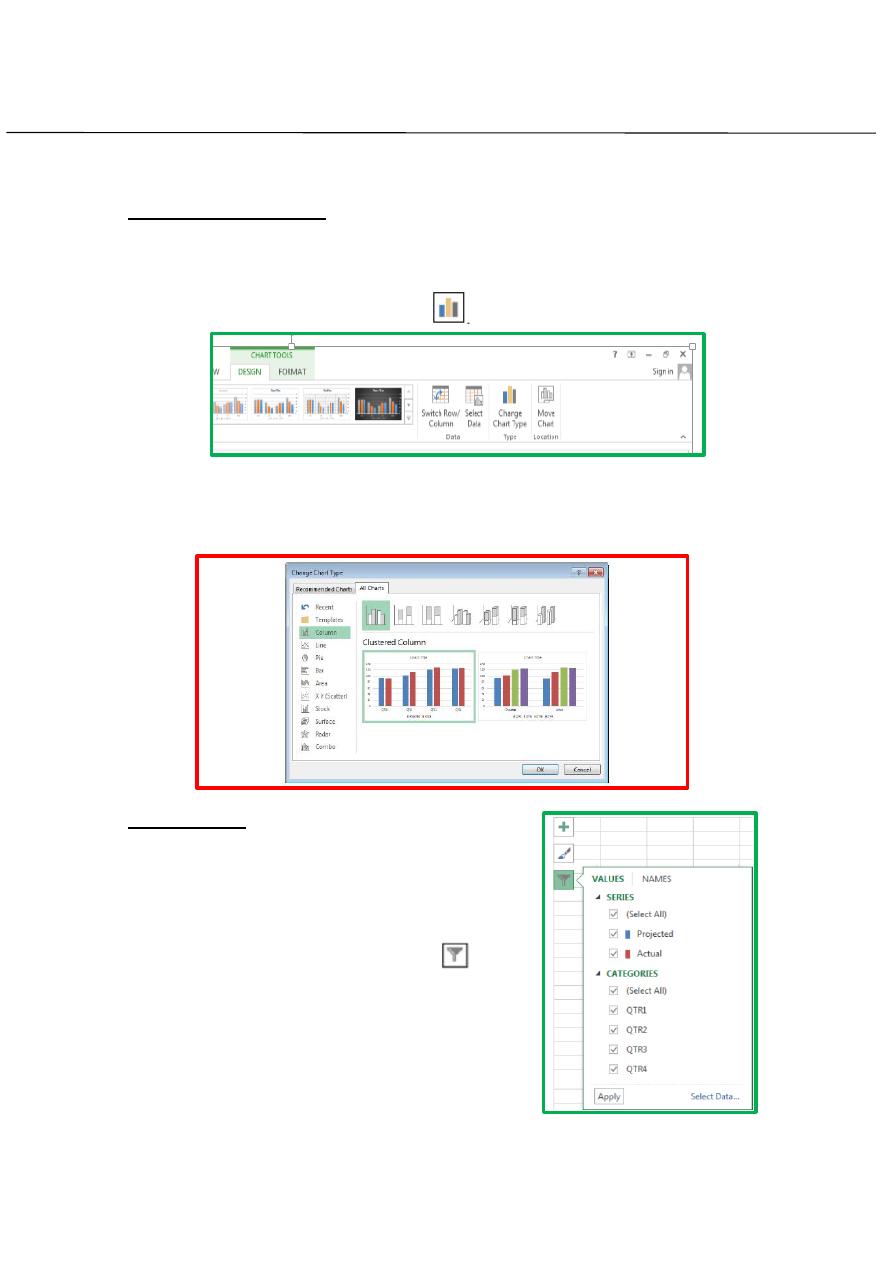
:
Change the chart type
1- Select the chart you want to change.
2- Under chart tool, on the Design tab, in the Type group, click the
change chart type button
3- I n the change chart type , Select the desiered chart in the left
pane, select the desierd chart subtype in the right pane, and
then click OK button.
filter a chart :
To filter a chart
1- Select the chart that you want to
filter.
2- Click the chart Filter button
next
to the chart, deselect the check boxes
next to series or categories that you
want to hid, and then click the Apply
button.
First stage – College of Medicine – University of Mosul / Nineveh
Computer Science/
Lecture 3
Assistant Lecturer: Zina Abdul Salam
EXCEL 2013
7
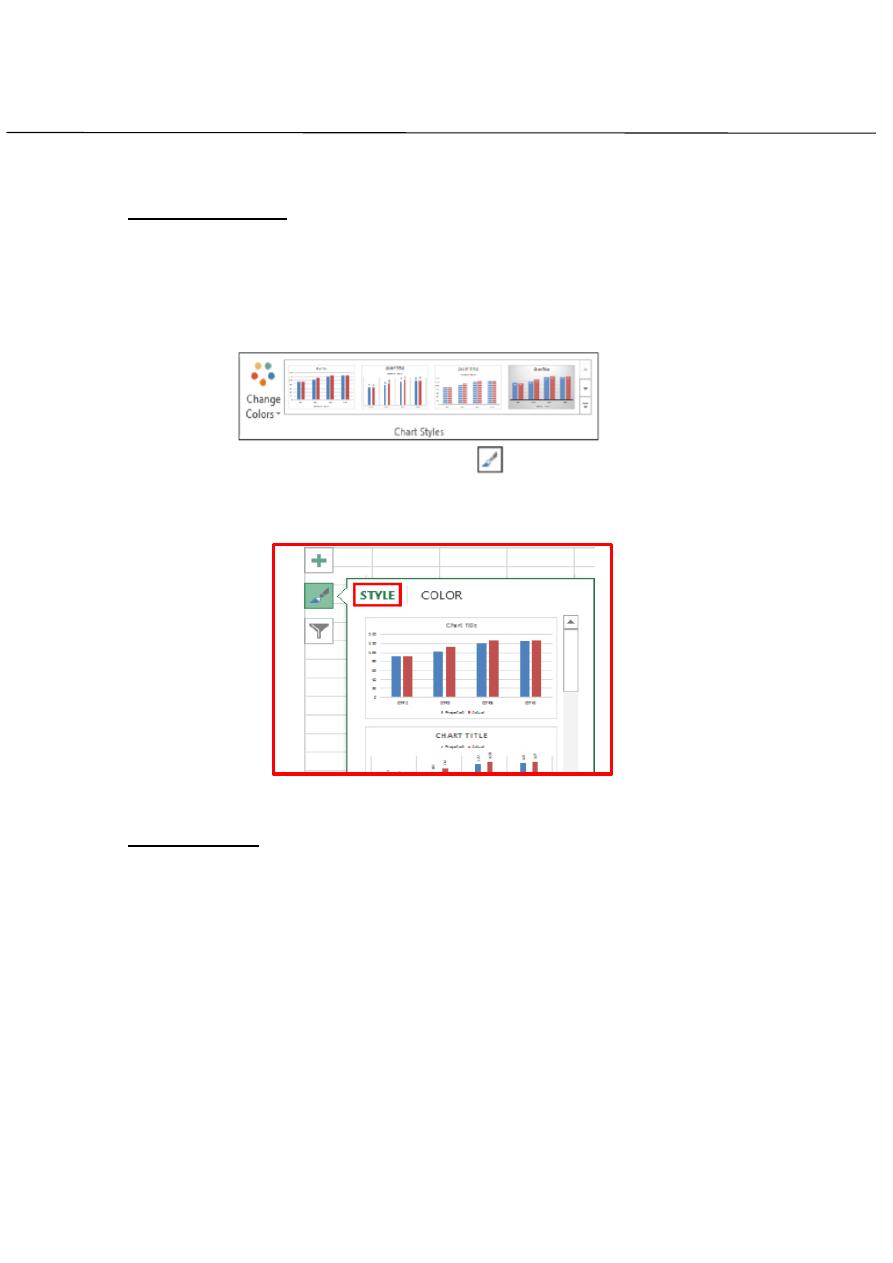
Format chart style
1.Select the chart you want to format.
2.do one of the following:
Under the Chart Tool, on the Design tab, in the Chart style
group, and then click the desierd style.
Click the Chart style button
next to chart, and thenclick
the desierd style on the Style tab of the Chart styles gallery
Deleting Chart:
If you no longer need a chart, you can delete it from the work book by
select the chart you want to delete and press Delete key.
To delete the chart sheet Right click on sheet tab and click delete.