Chapter 9 - 1
ISSUES TO ADDRESS...
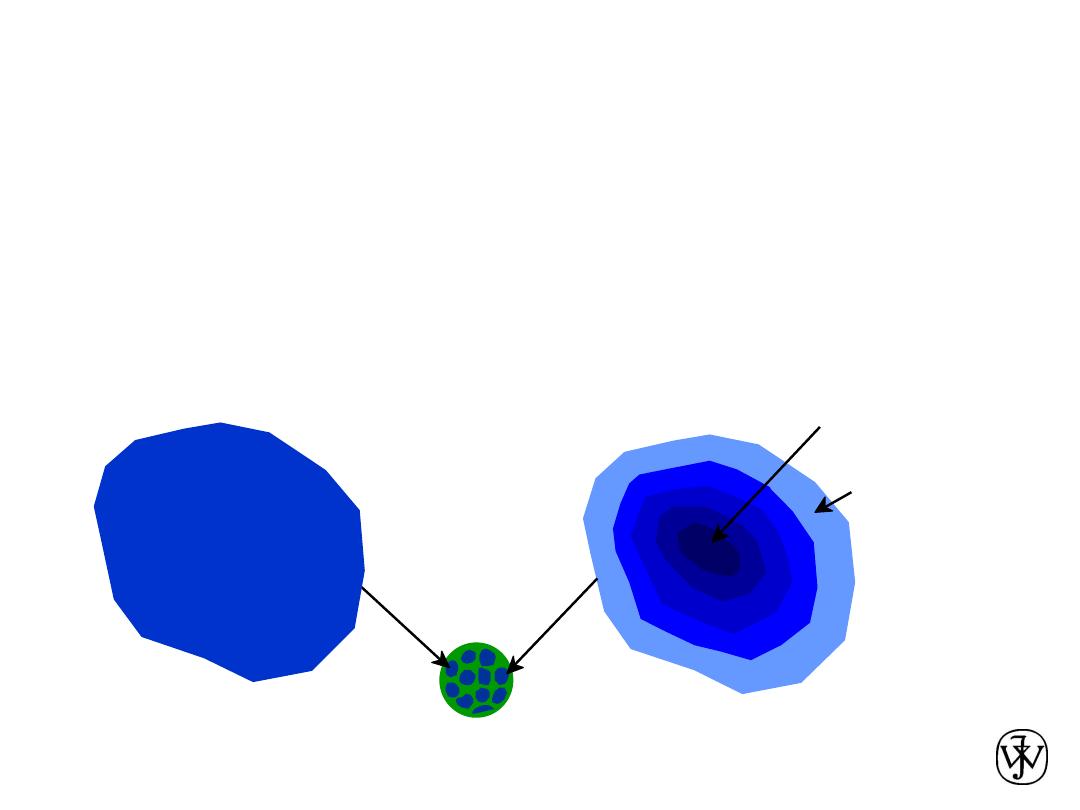
• When we combine two elements...
what is the resulting equilibrium state?
• In particular, if we specify...
-- the composition (e.g., wt% Cu - wt% Ni), and
-- the temperature (T
)
then...
How many phases form?
What is the composition of each phase?
What is the amount of each phase?
Chapter 9: Phase Diagrams
Phase B
Phase A
Nickel atom
Copper atom
Chapter 9 - 2
Phase Equilibria: Solubility Limit
Question:
What is the
solubility limit for sugar in
water at
20ºC
?
Answer:
65 wt% sugar
.
At 20ºC, if C < 65 wt% sugar:
syrup
At 20ºC,
if C > 65 wt% sugar:
syrup + sugar
65
•
Solubility Limit
:
Maximum concentration for
which only a single phase
solution exists.
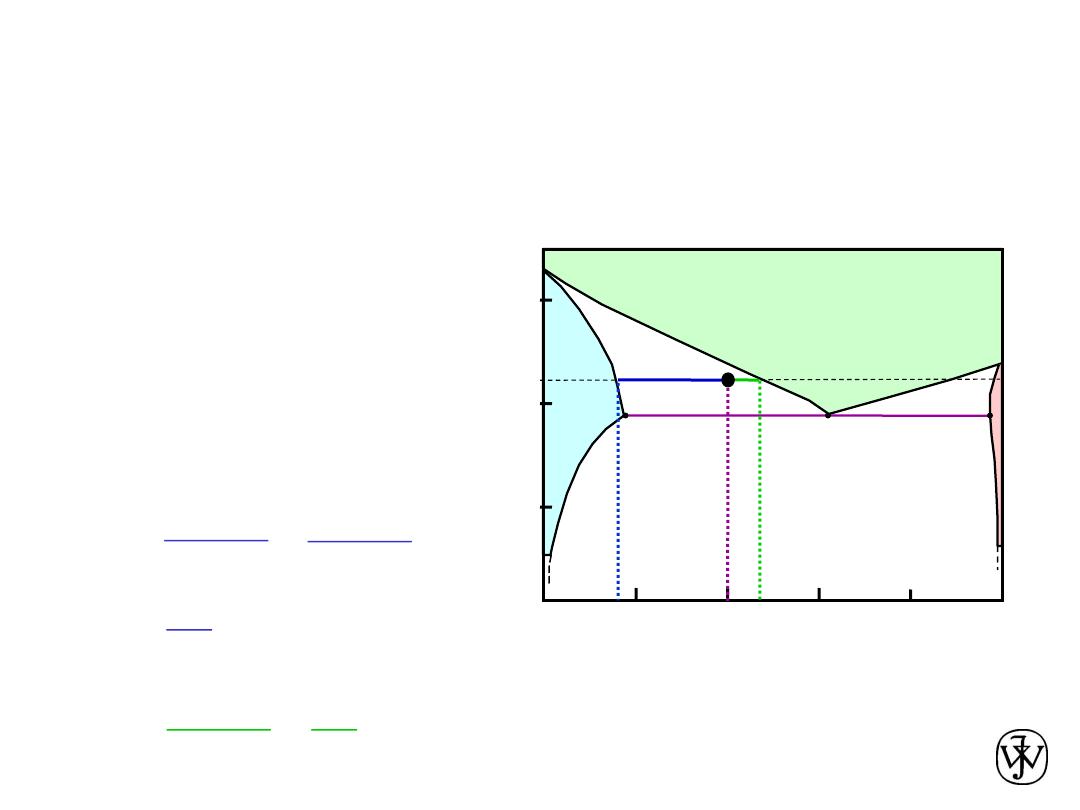
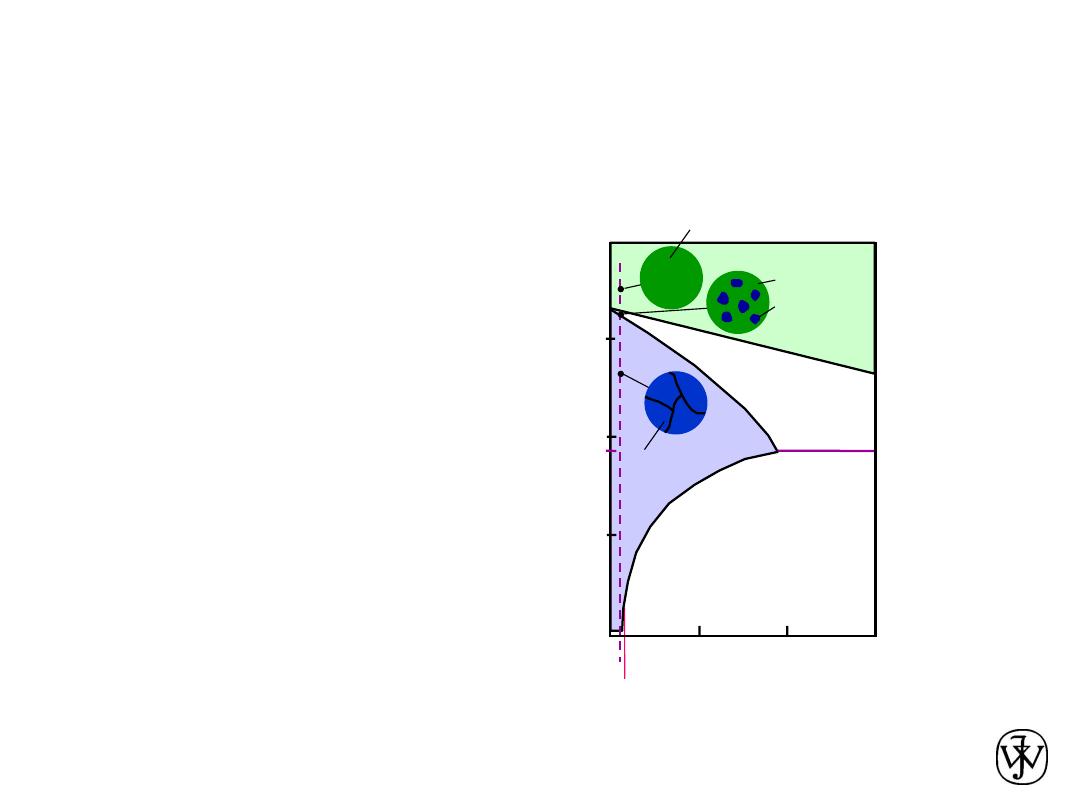
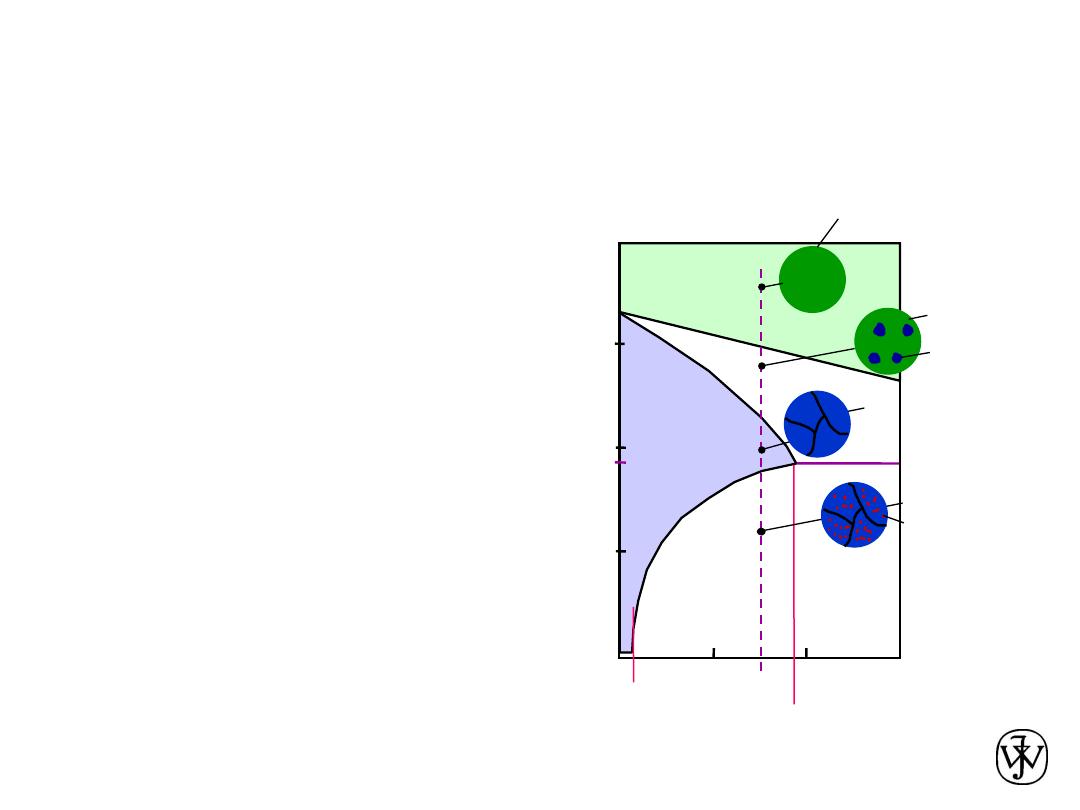
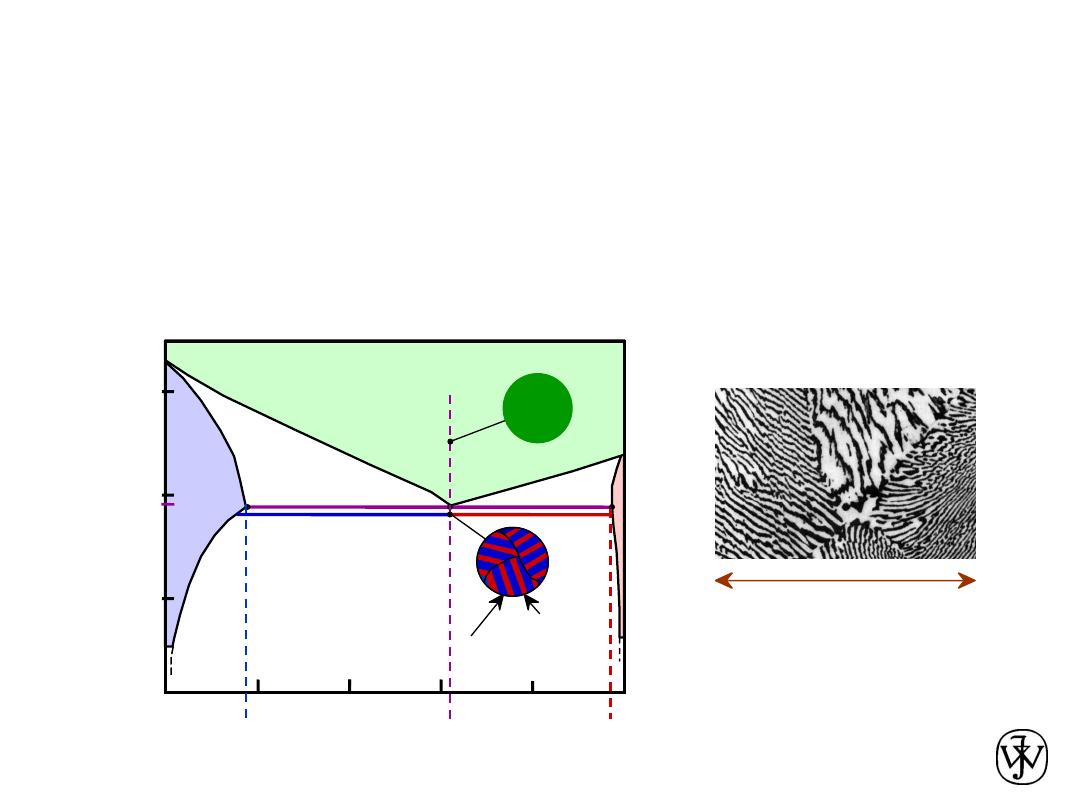
Sugar/Water Phase Diagram
Sugar
Tem
pera
ture
(ºC)
0
20
40
60
80
100
C
= Composition (wt% sugar)
L
(liquid solution
i.e., syrup)
Solubility
Limit
L
(liquid)
+
S
(solid
sugar)
20
4
0
6
0
8
0
10
0
W
ater
Adapted from Fig. 9.1,
Callister & Rethwisch 8e.
•
Solution
– solid, liquid, or gas solutions, single phase
•
Mixture
– more than one phase
Chapter 9 - 3
•
Components
:
The elements or compounds which are present in the alloy
(e.g., Al and Cu)
•
Phases
:
The physically and chemically distinct material regions
that form
(e.g.,
a
and
b
).
Aluminum-
Copper
Alloy
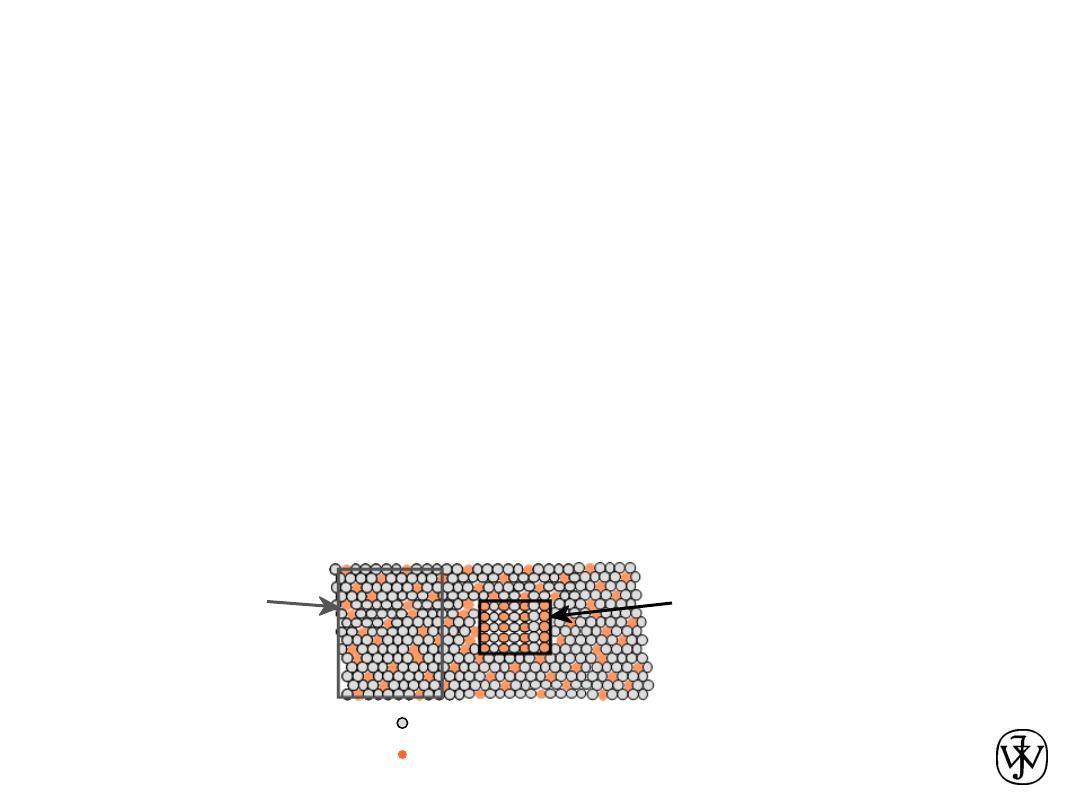
Components and Phases
a
(darker
phase)
b
(lighter
phase)
Adapted from chapter-
opening photograph,
Chapter 9, Callister,
Materials Science &
Engineering: An
Introduction, 3e.
Chapter 9 - 4
70 80
100
60
40
20
0
Tempe
ratu
re
(ºC)
C = Composition (wt% sugar)
L
(
liquid solution
i.e., syrup)
20
100
40
60
80
0
L
(liquid)
+
S
(solid
sugar)
Effect of Temperature & Composition
• Altering T can change # of phases: path
A
to
B
.
• Altering C can change # of phases: path
B
to
D
.
water-
sugar
system
Adapted from Fig. 9.1,
Callister & Rethwisch 8e.
D
(100ºC,C = 90)
2 phases
B
(100ºC,C = 70)
1 phase
A
(20ºC,C = 70)
2 phases
Chapter 9 - 5
Criteria for Solid Solubility
Crystal
Structure
electroneg
r (nm)
Ni
FCC
1.9
0.1246
Cu
FCC
1.8
0.1278
• Both have the same crystal structure (FCC) and have
similar electronegativities and atomic radii (
W. Hume
–
Rothery rules
) suggesting high mutual solubility.
Simple system
(e.g., Ni-Cu solution)
• Ni and Cu are totally soluble in one another for all proportions.
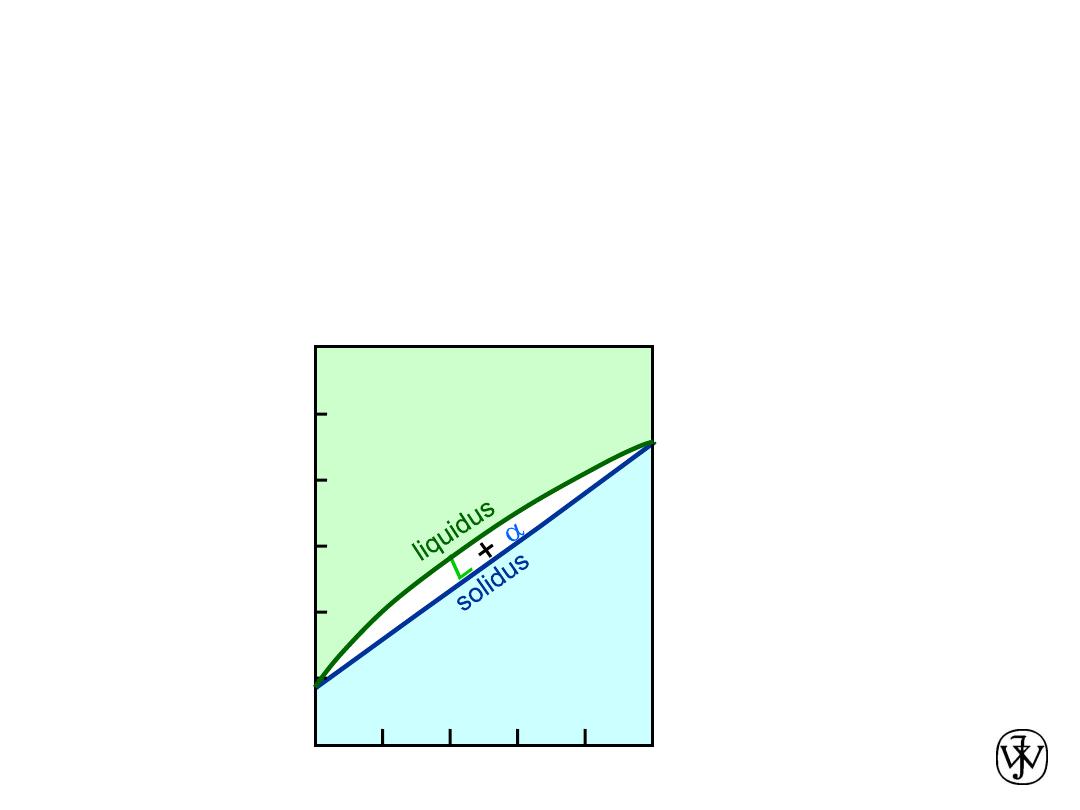
Chapter 9 - 6
Phase Diagrams
• Indicate phases as a function of T, C, and P.
• For this course:
- binary systems: just 2 components.
- independent variables: T and C
(P = 1 atm is almost always used).
Phase
Diagram
for Cu-Ni
system
Adapted from Fig. 9.3(a), Callister &
Rethwisch 8e. (Fig. 9.3(a) is adapted from
Phase Diagrams of Binary Nickel Alloys,
P. Nash (Ed.), ASM International,
Materials Park, OH (1991).
• 2 phases:
L
(liquid)
a
(FCC solid solution)
• 3 different phase fields:
L
L +
a
a
wt% Ni
20
40
60
80
100
0
1000
1100
1200
1300
1400
1500
1600
T
(ºC)
L (liquid)
a
(FCC solid
solution)
Chapter 9 - 7
Cu-Ni
phase
diagram
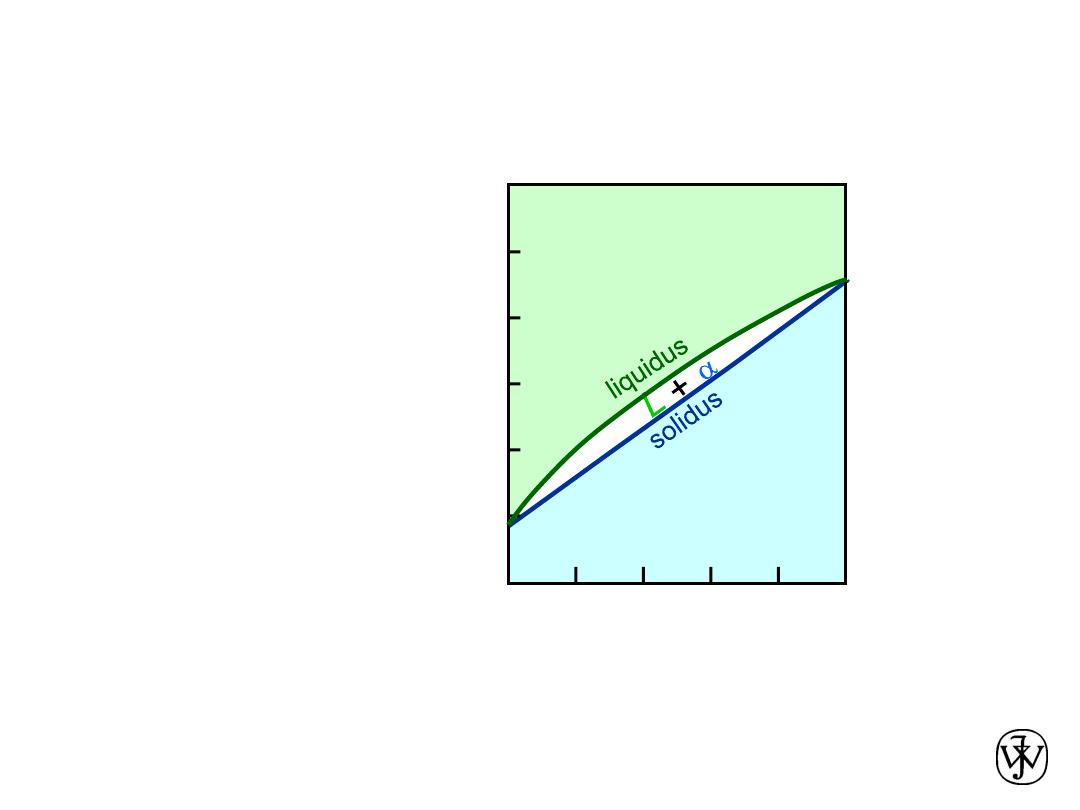
Isomorphous Binary Phase Diagram
• Phase diagram:
Cu-Ni system.
• System is:
Adapted from Fig. 9.3(a), Callister &
Rethwisch 8e. (Fig. 9.3(a) is adapted from
Phase Diagrams of Binary Nickel Alloys,
P. Nash (Ed.), ASM International,
Materials Park, OH (1991).
--
binary
i.e., 2 components:
Cu and Ni.
--
isomorphous
i.e., complete
solubility of one
component in
another;
a
phase
field extends from
0 to 100 wt% Ni.
wt% Ni
20
40
60
80
100
0
1000
1100
1200
1300
1400
1500
1600
T
(ºC)
L (liquid)
a
(FCC solid
solution)
Chapter 9 -
wt% Ni
20
40
60
80
100
0
1000
1100
1200
1300
1400
1500
1600
T
(ºC)
L (liquid)
a
(FCC solid
solution)
Cu-Ni
phase
diagram
8
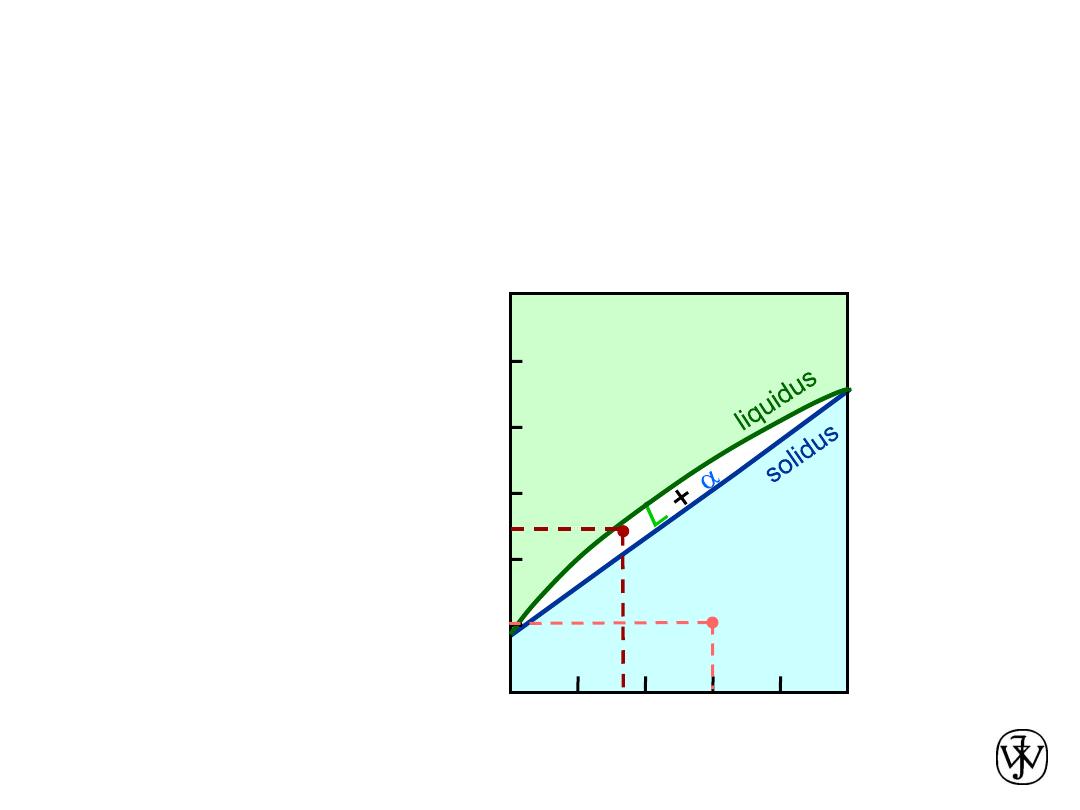
Phase Diagrams
:
Determination of phase(s) present
• Rule 1:
If we know T and C
o
, then we know:
-- which phase(s) is (are) present.
• Examples:
A
(1100ºC, 60 wt% Ni):
1 phase:
a
B
(1250ºC, 35 wt% Ni):
2 phases: L +
a
B
(12
50
ºC,35
)
A
(1100ºC,60)
Adapted from Fig. 9.3(a), Callister &
Rethwisch 8e. (Fig. 9.3(a) is adapted from
Phase Diagrams of Binary Nickel Alloys,
P. Nash (Ed.), ASM International,
Materials Park, OH (1991).
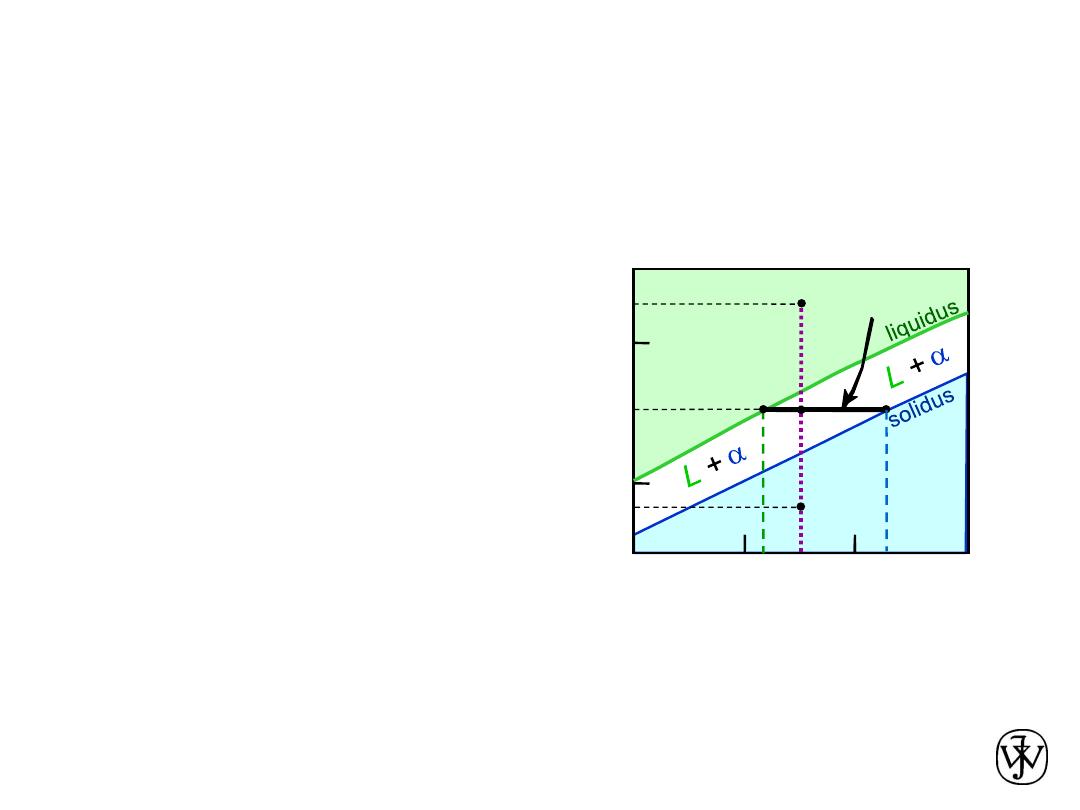
Chapter 9 - 9
wt% Ni
20
1200
1300
T
(ºC)
L (liquid)
a
(solid)
30
40
50
Cu-Ni
system
Phase Diagrams
:
Determination
of phase compositions
• Rule 2:
If we know T and C
0
, then we can determine:
-- the composition of each phase.
• Examples:
T
A
A
35
C
0
32
C
L
At T
A
= 1320ºC:
Only Liquid (L) present
C
L
= C
0
( = 35 wt% Ni)
At T
B
= 1250ºC:
Both
a
and L present
C
L
= C
liquidus
( = 32 wt% Ni)
C
a
= C
solidus
( = 43 wt% Ni)
At T
D
= 1190ºC:
Only Solid (
a
) present
C
a
= C
0
( = 35 wt% Ni)
Consider C
0
= 35 wt% Ni
D
T
D
tie line
4
C
a
3
Adapted from Fig. 9.3(a), Callister &
Rethwisch 8e. (Fig. 9.3(a) is adapted from
Phase Diagrams of Binary Nickel Alloys, P.
Nash (Ed.), ASM International, Materials
Park, OH (1991).
B
T
B
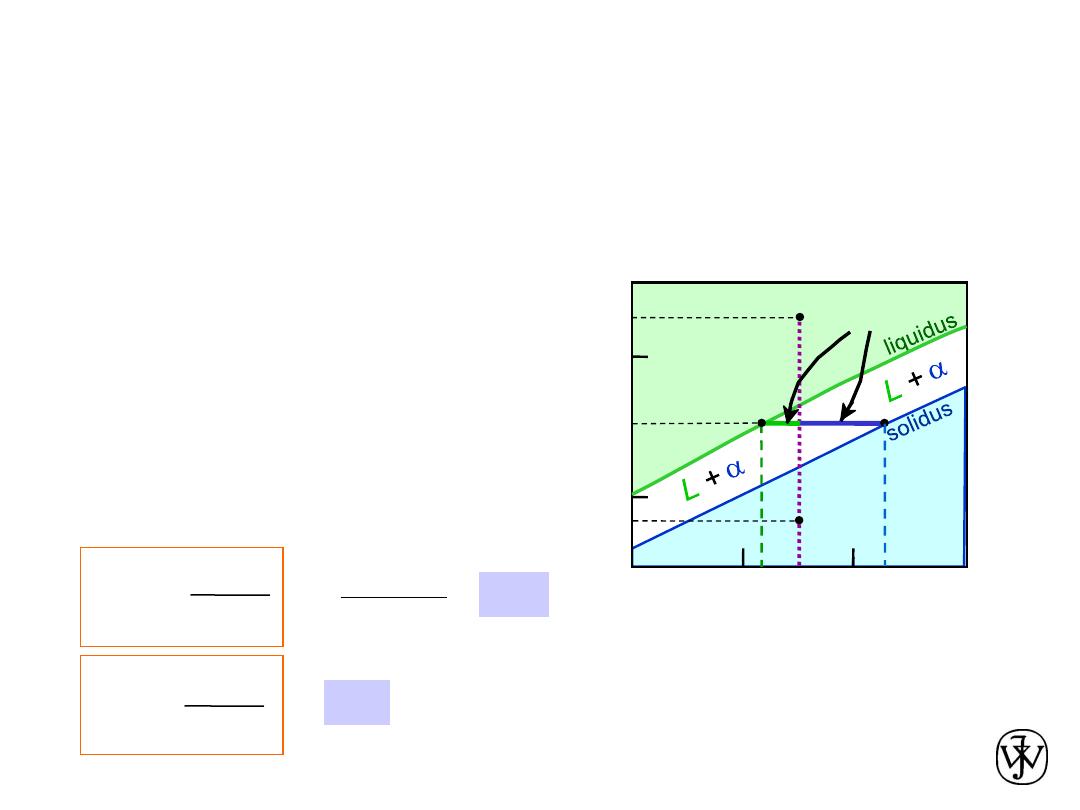
Chapter 9 - 10
• Rule 3:
If we know T and C
0
, then can determine:
-- the weight fraction of each phase.
• Examples:
At T
A
: Only Liquid (L) present
W
L
= 1.00, W
a
= 0
At T
D
:
Only Solid
(
a
) present
W
L
= 0, W
a
= 1.00
Phase Diagrams
:
Determination of phase
weight fractions
wt% Ni
20
1200
1300
T
(ºC)
L (liquid)
a
(solid)
3
0
4
0
5
0
Cu-Ni
system
T
A
A
35
C
0
32
C
L
B
T
B
D
T
D
tie line
4
C
a
3
R
S
At T
B
:
Both
a
and L present
73
.
0
32
43
35
43
= 0.27
W
L
S
R
+
S
W
a
R
R
+
S
Consider C
0
= 35 wt% Ni
Adapted from Fig. 9.3(a), Callister &
Rethwisch 8e. (Fig. 9.3(a) is adapted from
Phase Diagrams of Binary Nickel Alloys, P.
Nash (Ed.), ASM International, Materials
Park, OH (1991).
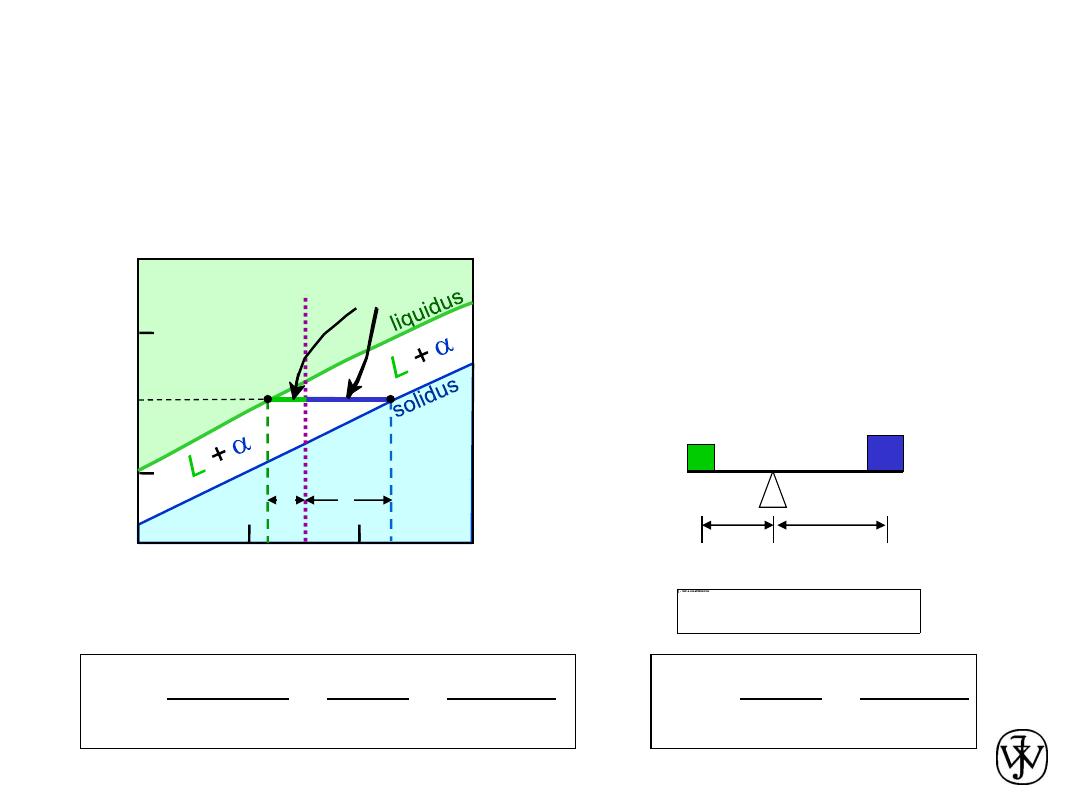
Chapter 9 - 11
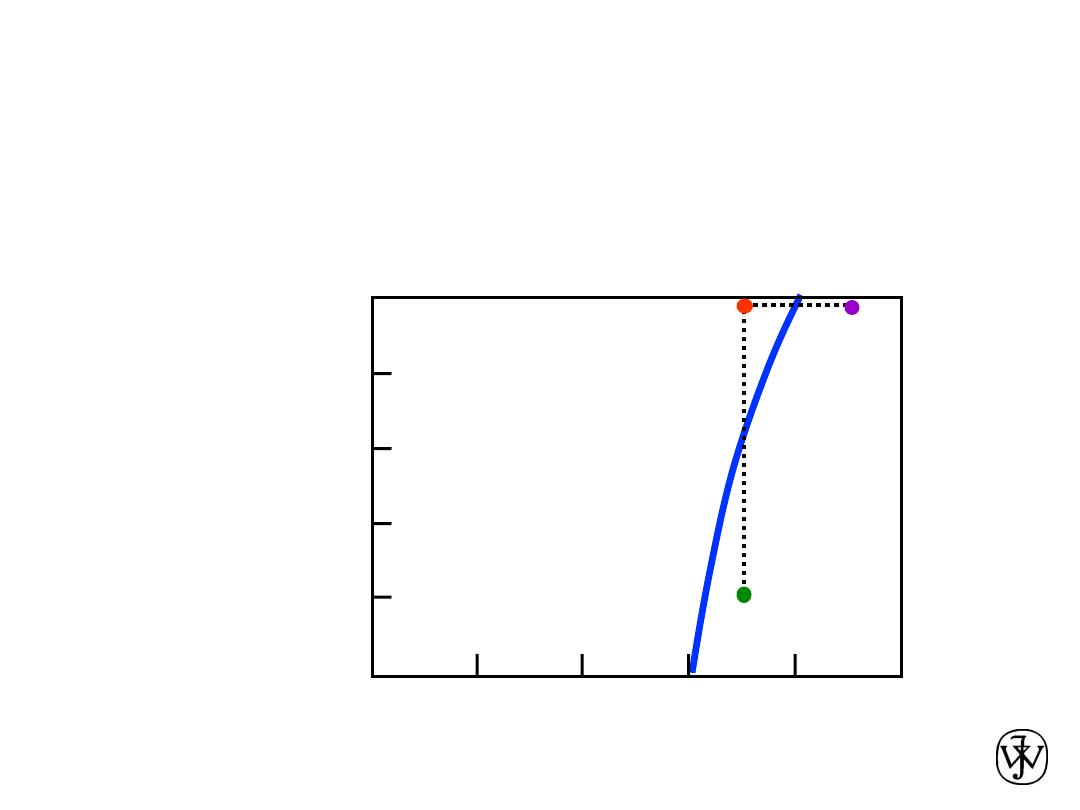
• Tie line – connects the phases in equilibrium with
each other
– also sometimes called an
isotherm
The Lever Rule
What fraction of each phase?
Think of the tie line as a lever
(teeter-totter)
M
L
M
a
R
S
L
L
L
L
L
L
C
C
C
C
S
R
R
W
C
C
C
C
S
R
S
M
M
M
W
a
a
a
a
a
0
0
wt% Ni
20
1200
1300
T
(ºC)
L (liquid)
a
(solid)
3
0
4
0
5
0
B
T
B
tie line
C
0
C
L
C
a
S
R
Adapted from Fig. 9.3(b),
Callister & Rethwisch 8e.
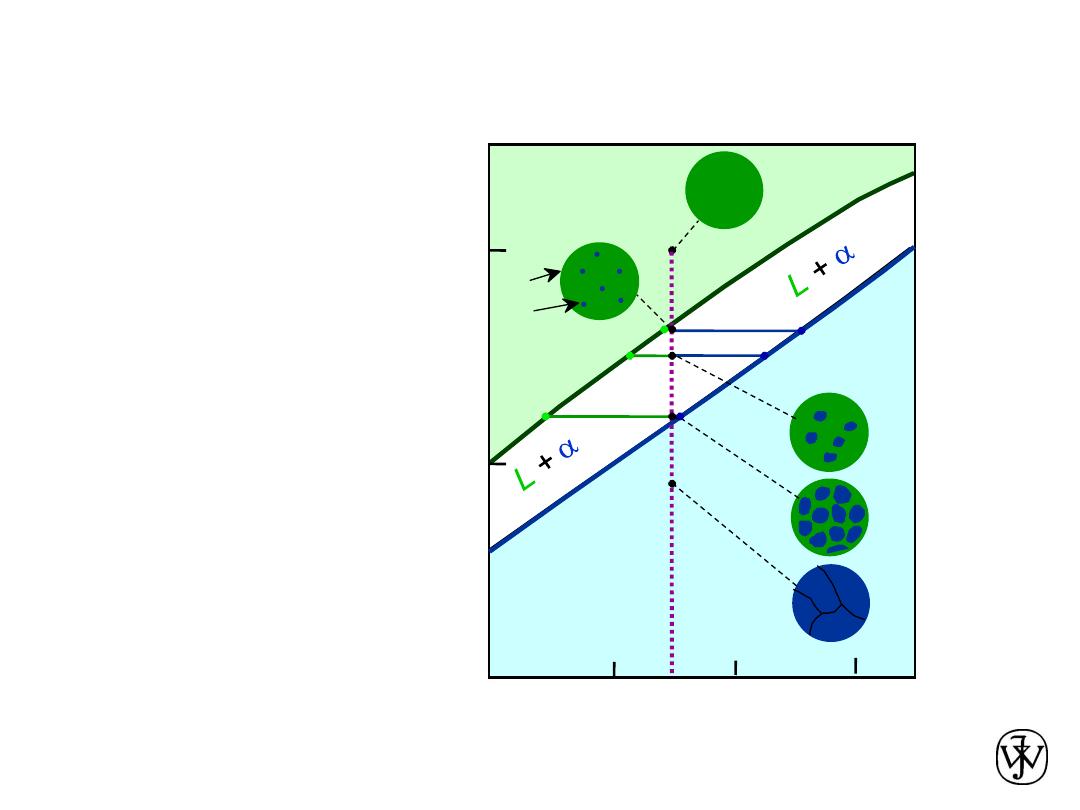
Chapter 9 - 12
wt% Ni
20
120 0
130 0
3 0
4 0
5 0
110 0
L (liquid)
a
(solid)
T
(ºC)
A
35
C
0
L: 35wt%Ni
Cu-Ni
system
• Phase diagram:
Cu-Ni system.
Adapted from Fig. 9.4,
Callister & Rethwisch 8e.
• Consider
microstuctural
changes that
accompany the
cooling of a
C
0
= 35 wt% Ni alloy
Ex: Cooling of a Cu-Ni Alloy
46
35
43
32
a
: 43 wt% Ni
L: 32 wt% Ni
B
a
: 46 wt% Ni
L: 35 wt% Ni
C
E
L: 24 wt% Ni
a
: 36 wt% Ni
24
36
D
Chapter 9 -
• Slow rate of cooling:
Equilibrium structure
• Fast rate of cooling:
Cored structure
First
a
to solidify:
46 wt% Ni
Last
a
to solidify:
< 35 wt% Ni
13
• C
a
changes as we solidify.
• Cu-Ni case:
First
a
to solidify has C
a
= 46 wt% Ni.
Last
a
to solidify has C
a
= 35 wt% Ni.
Cored vs Equilibrium Structures
Uniform C
a
:
35 wt% Ni
Chapter 9 - 14
Mechanical Properties:
Cu-Ni System
• Effect of solid solution strengthening on:
-- Tensile strength (TS)
-- Ductility (%EL)
Adapted from Fig. 9.6(a),
Callister & Rethwisch 8e.
T
ens
ile
St
re
ngth
(MPa)
Composition, wt% Ni
Cu
Ni
0 20 40 60 80 100
200
300
400
TS for
pure Ni
TS for pure Cu
Elongation
(%
EL
)
Composition, wt% Ni
Cu
Ni
0 20 40 60 80 100
20
30
40
50
60
%EL
for
pure Ni
%EL
for pure Cu
Adapted from Fig. 9.6(b),
Callister & Rethwisch 8e.
Chapter 9 - 15
2 components
has a special composition
with a min. melting T.
Adapted from Fig. 9.7,
Callister & Rethwisch 8e.
Binary-Eutectic Systems
• 3 single phase regions
(L,
a
,
b
)
• Limited solubility:
a
: mostly Cu
b
: mostly Ag
• T
E
: No liquid below T
E
: Composition at
temperature T
E
• C
E
Ex.: Cu-Ag system
Cu-Ag
system
L (liquid)
a
L
+
a
L
+
b
b
a
b
C , wt% Ag
20
40
60
80
100
0
200
1200
T
(ºC)
400
600
800
1000
C
E
T
E
8.0
71.9 91.2
779ºC
Ag)
wt%
1.2
9
(
Ag)
wt%
.0
8
(
Ag)
wt%
9
.
71
(
b
a
L
cooling
heating
•
Eutectic reaction
L(C
E
)
a
(C
a
E
) +
b
(C
b
E
)
Chapter 9 - 16
L
+
a
L
+
b
a
+
b
200
T
(ºC)
18.3
C, wt% Sn
20
60
80
100
0
300
100
L (liquid)
a
183ºC
61.9
97.8
b
• For a 40 wt% Sn-60 wt% Pb alloy at 150ºC, determine:
-- the phases present
Pb-Sn
system
EX 1: Pb-Sn Eutectic System
Answer:
a
+
b
-- the phase compositions
-- the relative amount
of each phase
150
40
C
0
11
C
a
99
C
b
S
R
Answer:
C
a
= 11 wt% Sn
C
b
= 99 wt% Sn
W
a
=
C
b
- C
0
C
b
- C
a
=
99 - 40
99 - 11
=
59
88
= 0.67
S
R+S
=
W
b
=
C
0
- C
a
C
b
- C
a
=
R
R+S
=
29
88
= 0.33
=
40 - 11
99 - 11
Answer:
Adapted from Fig. 9.8,
Callister & Rethwisch 8e.
Chapter 9 - 17
Answer:
C
a
= 17 wt% Sn
-- the phase compositions
L
+
b
a
+
b
200
T
(ºC)
C, wt% Sn
20
60
80
100
0
300
100
L (liquid)
a
b
L
+
a
183ºC
• For a 40 wt% Sn-60 wt% Pb alloy at 220ºC, determine:
-- the phases present:
Pb-Sn
system
EX 2: Pb-Sn Eutectic System
-- the relative amount
of each phase
W
a
=
C
L
- C
0
C
L
- C
a
=
46 - 40
46 - 17
=
6
29
= 0.21
W
L
=
C
0
- C
a
C
L
- C
a
=
23
29
= 0.79
40
C
0
46
C
L
17
C
a
220
S
R
Answer:
a
+
L
C
L
= 46 wt% Sn
Answer:
Adapted from Fig. 9.8,
Callister & Rethwisch 8e.
Chapter 9 - 18
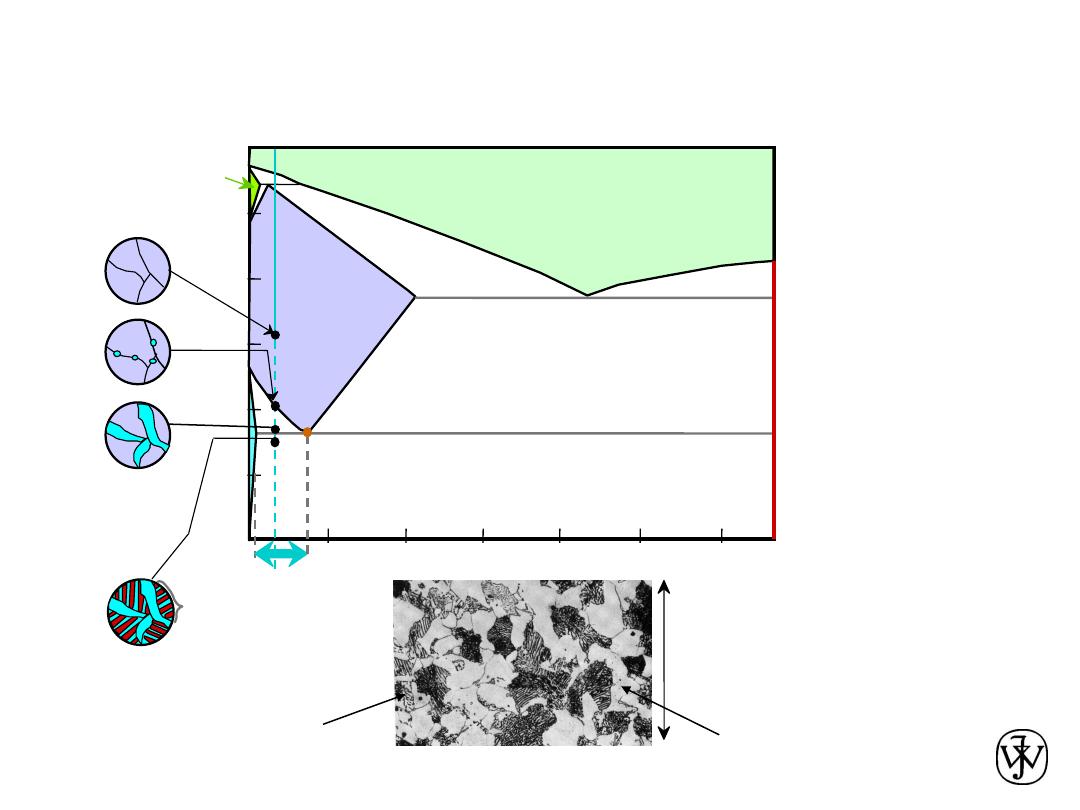
• For alloys for which
C
0
< 2 wt% Sn
• Result: at room temperature
-- polycrystalline with grains of
a
phase having
composition
C
0
Microstructural Developments
in Eutectic Systems I
0
L
+
a
200
T
(ºC)
C , wt% Sn
10
2
20
C
0
300
100
L
a
30
a
+
b
400
(room T solubility limit)
T
E
(Pb-Sn
System)
a
L
L: C
0
wt% Sn
a
: C
0
wt% Sn
Adapted from Fig. 9.11,
Callister & Rethwisch 8e.
Chapter 9 - 19
• For alloys for which
2 wt% Sn < C
0
< 18.3 wt% Sn
• Result:
at temperatures in
a
+
b
range
-- polycrystalline with
a
grains
and small
b
-phase
particles
Adapted from Fig. 9.12,
Callister & Rethwisch 8e.
Microstructural Developments
in Eutectic Systems II
Pb-Sn
system
L
+
a
200
T
(ºC)
C , wt% Sn
10
18.3
20
0
C
0
300
100
L
a
30
a
+
b
400
(sol. limit at T
E
)
T
E
2
(sol. limit at T
room
)
L
a
L: C
0
wt% Sn
a
b
a
: C
0
wt% Sn
Chapter 9 - 20
• For alloy of composition C
0
= C
E
• Result:
Eutectic microstructure (lamellar structure)
-- alternating layers (lamellae) of
a
and
b
phases.
Adapted from Fig. 9.13,
Callister & Rethwisch 8e.
Microstructural Developments
in Eutectic Systems III
Adapted from Fig. 9.14,
Callister & Rethwisch 8e.
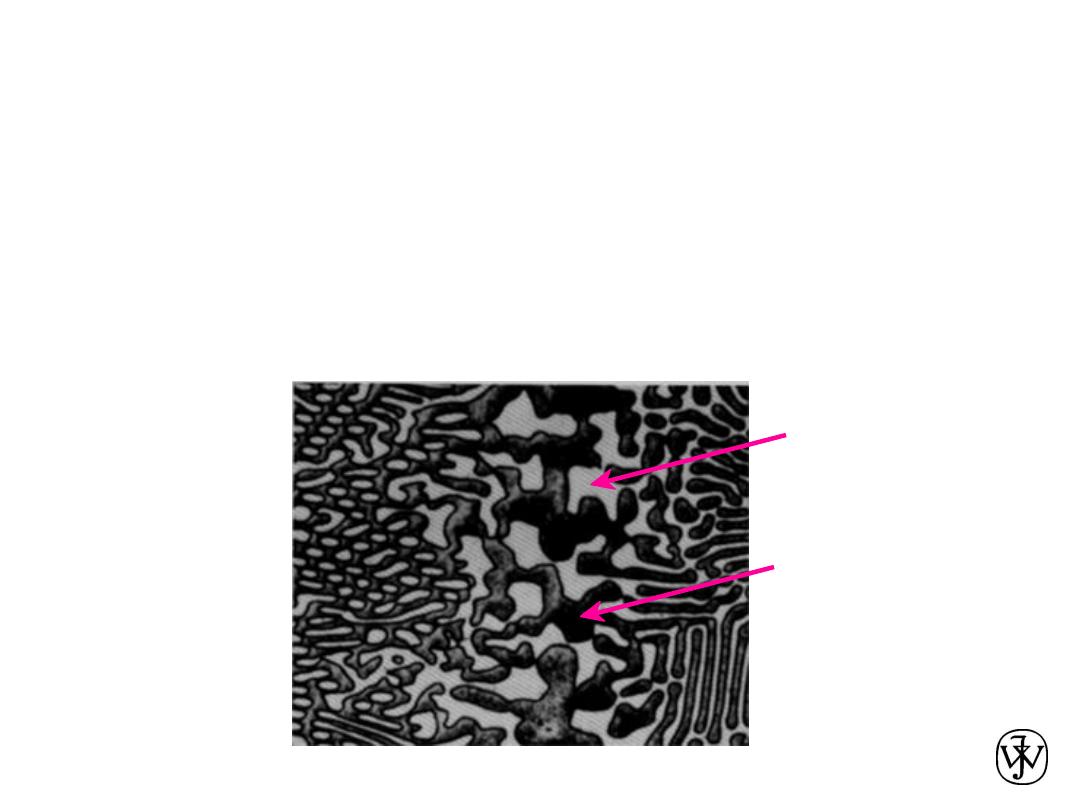
160
m
Micrograph of Pb-Sn
eutectic
microstructure
Pb-Sn
system
L
b
a
b
200
T
(ºC)
C, wt% Sn
20
60
80
100
0
300
100
L
a
b
L
+
a
183ºC
40
T
E
18.3
a
: 18.3 wt%Sn
97.8
b
: 97.8 wt% Sn
C
E
61.9
L: C
0
wt% Sn
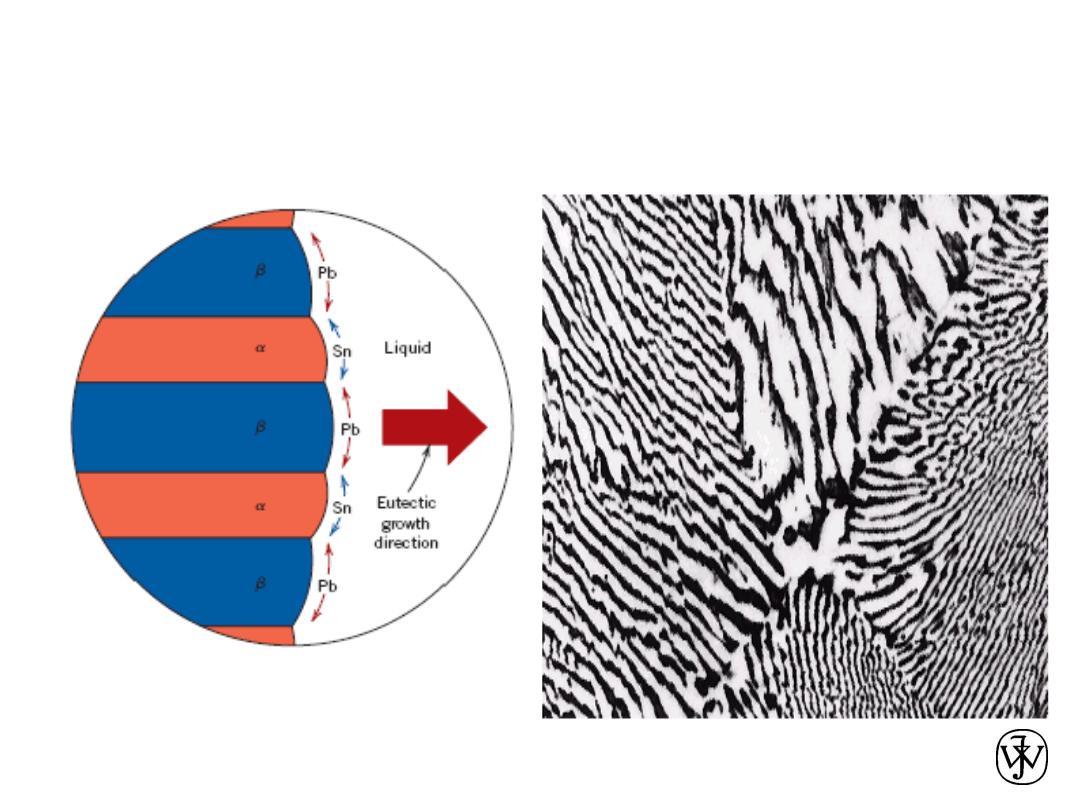
Chapter 9 - 21
Lamellar Eutectic Structure
Adapted from Figs. 9.14 & 9.15, Callister
& Rethwisch 8e.
Chapter 9 - 22
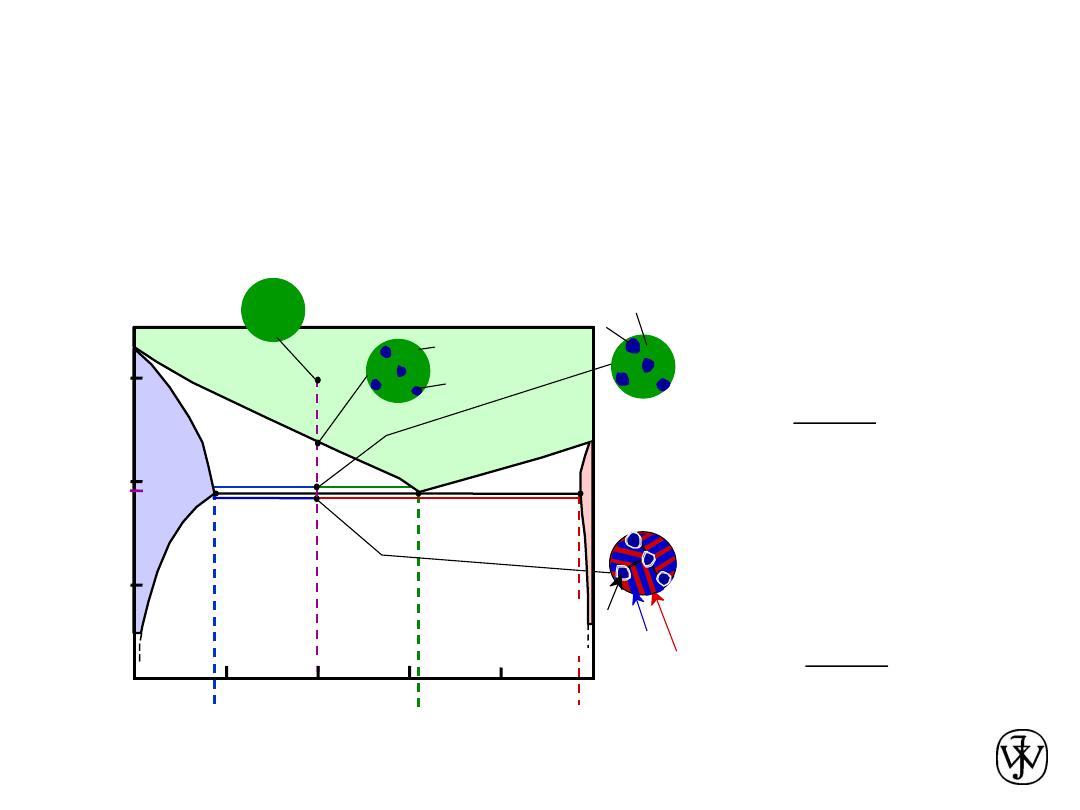
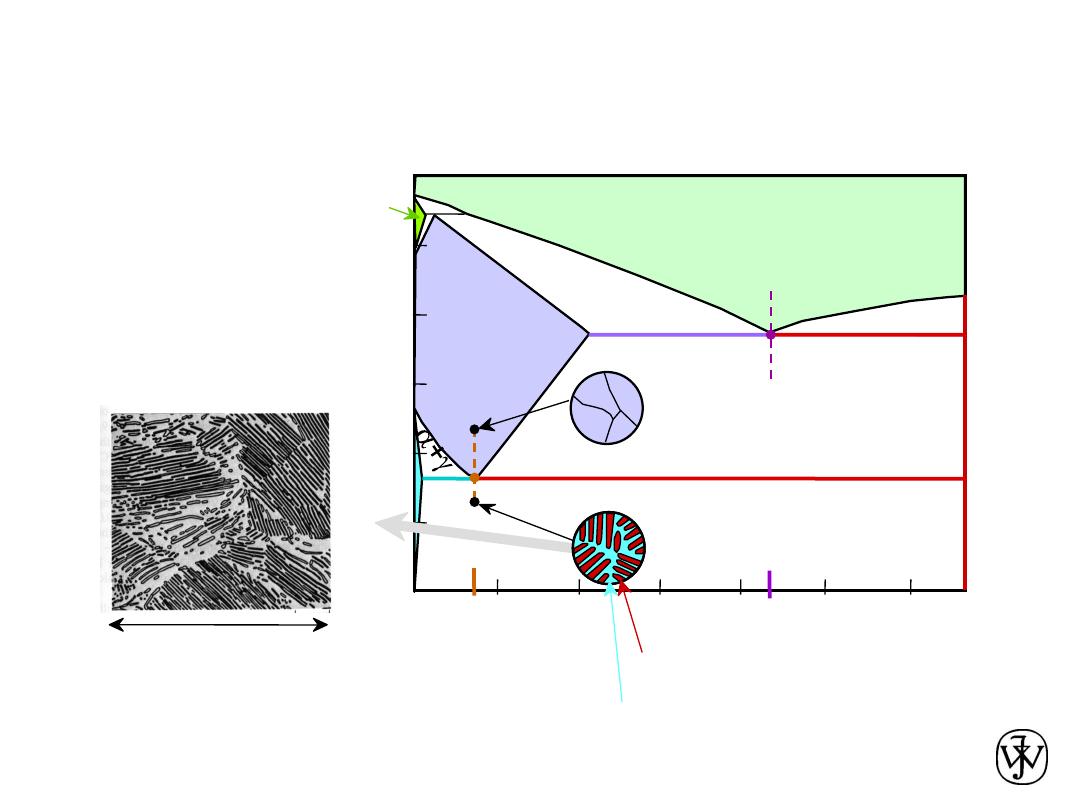
• For alloys for which 18.3 wt% Sn < C
0
< 61.9 wt% Sn
• Result:
a
phase particles and a eutectic microconstituent
Microstructural Developments
in Eutectic Systems IV
18.3
61.9
S
R
97.8
S
R
primary
a
eutectic
a
eutectic
b
W
L
= (1- W
a
) = 0.50
C
a
= 18.3 wt% Sn
C
L
= 61.9 wt% Sn
S
R
+
S
W
a
=
= 0.50
• Just above T
E
:
• Just below T
E
:
C
a
= 18.3 wt% Sn
C
b
= 97.8 wt% Sn
S
R
+
S
W
a
=
= 0.73
W
b
= 0.27
Adapted from Fig. 9.16,
Callister & Rethwisch 8e.
Pb-Sn
system
L
+
b
200
T
(ºC)
C, wt% Sn
20
60
80
100
0
300
100
L
a
b
L
+
a
40
a
+
b
T
E
L: C
0
wt% Sn
L
a
L
a
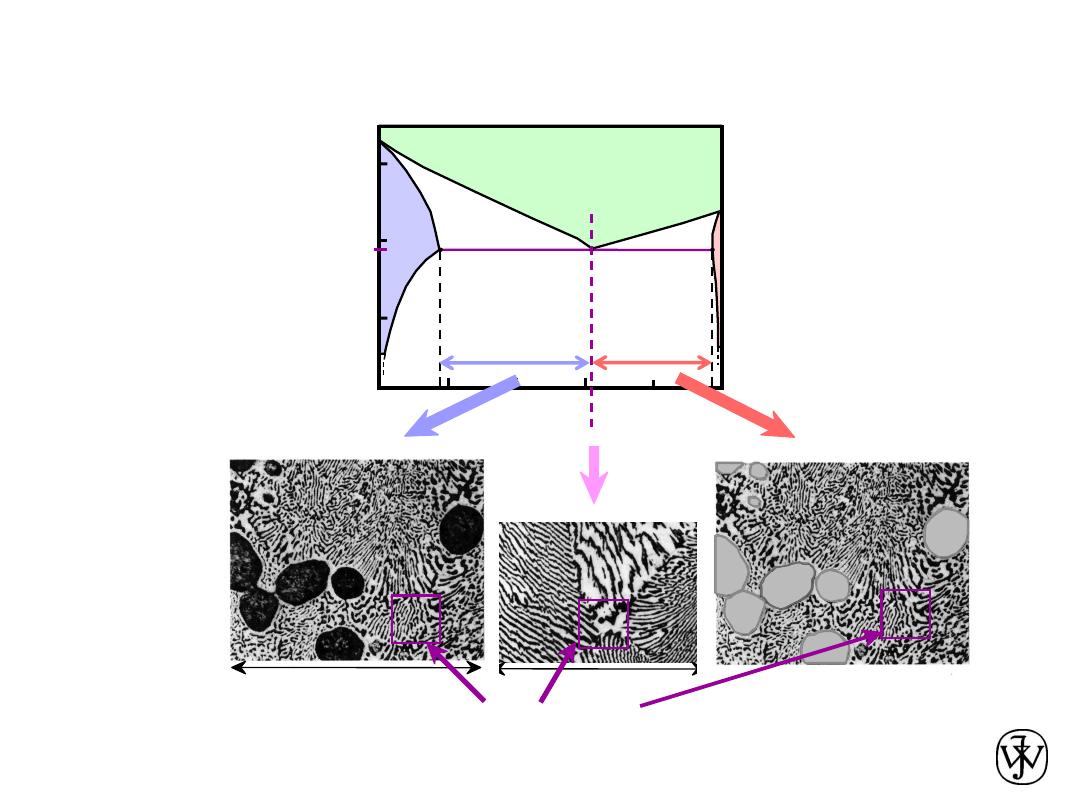
Chapter 9 - 23
L
+
a
L
+
b
a
+
b
200
C, wt% Sn
20
60
80
100
0
300
100
L
a
b
T
E
40
(Pb-Sn
System)
Hypo
eutectic &
Hyper
eutectic
Adapted from Fig. 9.8,
Callister & Rethwisch 8e.
(Fig. 10.8 adapted from
Binary Phase Diagrams,
2nd ed., Vol. 3, T.B.
Massalski (Editor-in-Chief),
ASM International,
Materials Park, OH, 1990.)
160
m
eutectic micro-constituent
Adapted from Fig. 9.14,
Callister & Rethwisch 8e.
hypereutectic: (illustration only)
b
b
b
b
b
b
Adapted from Fig. 9.17,
Callister & Rethwisch 8e.
(Illustration only)
(Figs. 9.14 and 9.17
from Metals
Handbook, 9th ed.,
Vol. 9,
Metallography and
Microstructures,
American Society for
Metals, Materials
Park, OH, 1985.)
175
m
a
a
a
a
a
a
hypoeutectic: C
0
= 50 wt% Sn
Adapted from
Fig. 9.17, Callister &
Rethwisch 8e.
T
(ºC)
61.9
eutectic
eutectic: C
0
=
61.9
wt% Sn
Chapter 9 - 24
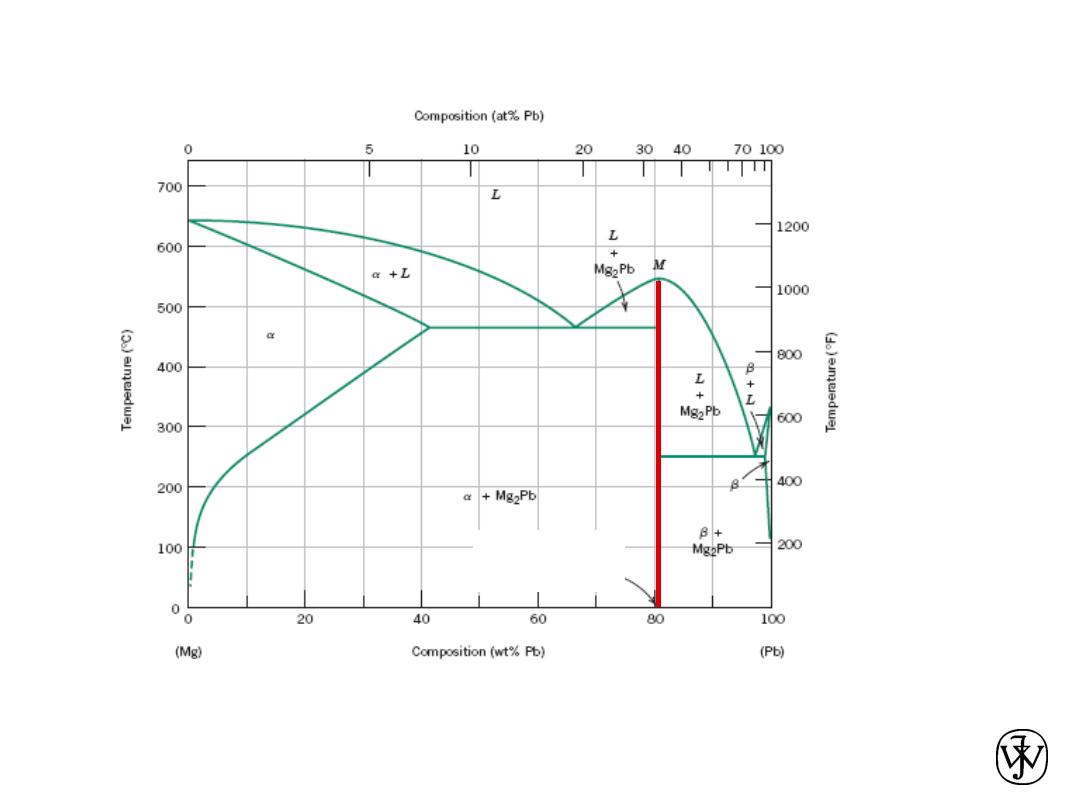
Intermetallic Compounds
Mg
2
Pb
Note: intermetallic compound exists as a line on the diagram - not an
area - because of stoichiometry (i.e. composition of a compound
is a fixed value).
Adapted from
Fig. 9.20, Callister &
Rethwisch 8e.
Chapter 9 - 25
• Eutectoid
– one solid phase transforms to two other
solid phases
S
2
S
1
+S
3
a
+ Fe
3
C (For Fe-
C, 727ºC, 0.76 wt% C)
intermetallic compound
- cementite
cool
heat
Eutectic, Eutectoid, & Peritectic
• Eutectic
- liquid transforms to two solid phases
L
a
+
b
(For Pb-
Sn, 183ºC, 61.9 wt% Sn)
cool
heat
cool
heat
• Peritectic
- liquid and one solid phase transform to a
second solid phase
S
1
+ L S
2
+ L
(For Fe-
C, 1493ºC, 0.16 wt% C)
Chapter 9 - 26
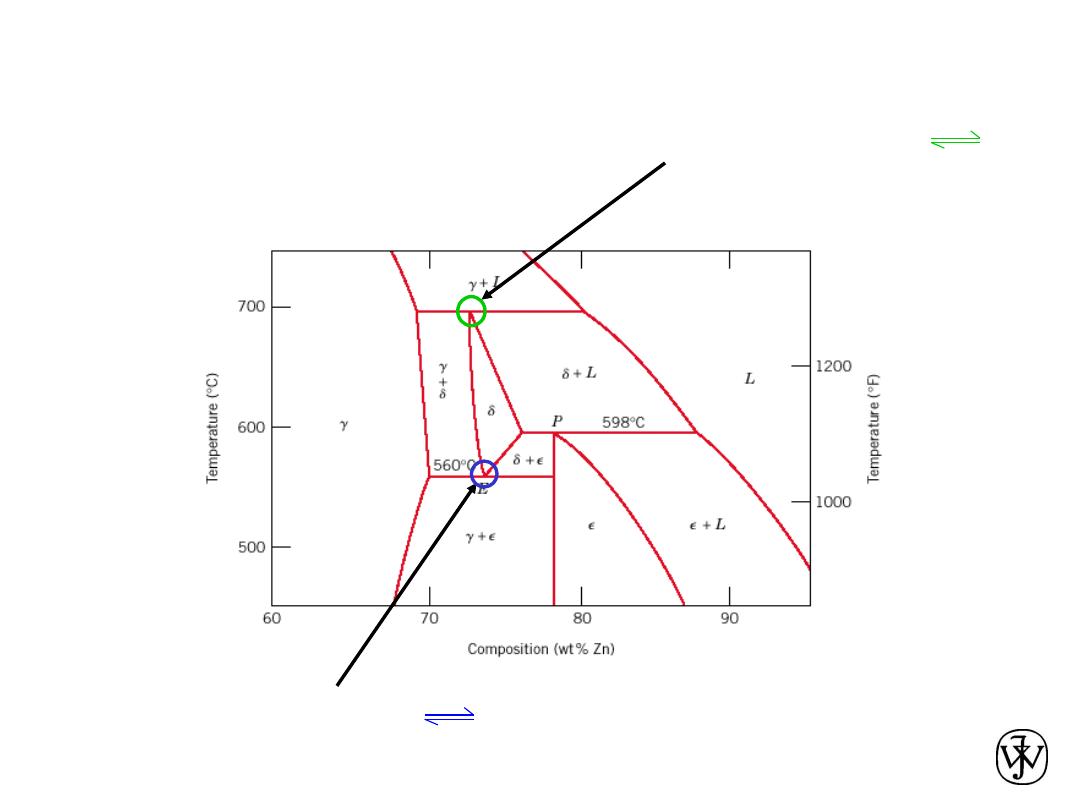
Eutectoid & Peritectic
Cu-Zn Phase diagram
Adapted from Fig. 9.21,
Callister & Rethwisch 8e.
Eutectoid transformation
+
Peritectic transformation
+ L
Chapter 9 - 27
Iron-Carbon (Fe-C) Phase Diagram
• 2 important
points
- Eutectoid (B):
a
+ Fe
3
C
- Eutectic (A):
L
+ Fe
3
C
Adapted from Fig. 9.24,
Callister & Rethwisch 8e.
Fe
3
C
(c
emen
tit
e)
1600
1400
1200
1000
800
600
400
0
1
2
3
4
5
6
6.7
L
(austenite)
+L
+Fe
3
C
a
+Fe
3
C
(Fe)
C, wt% C
1148ºC
T
(ºC)
a
727ºC = T
eutectoid
4.30
Result: Pearlite =
alternating layers of
a
and Fe
3
C phases
120
m
(Adapted from Fig. 9.27,
Callister & Rethwisch 8e.)
0.76
B
A
L+Fe
3
C
Fe
3
C (cementite-hard)
a
(ferrite-soft)
Chapter 9 - 28
Fe
3
C
(c
ementit
e)
1600
1400
1200
1000
800
600
400
0
1
2
3
4
5
6
6.7
L
(austenite)
+L
+
Fe
3
C
a
+
Fe
3
C
L+Fe
3
C
(Fe)
C, wt% C
1148ºC
T
(ºC)
a
727ºC
(Fe-C
System)
C
0
0.
76
Hypo
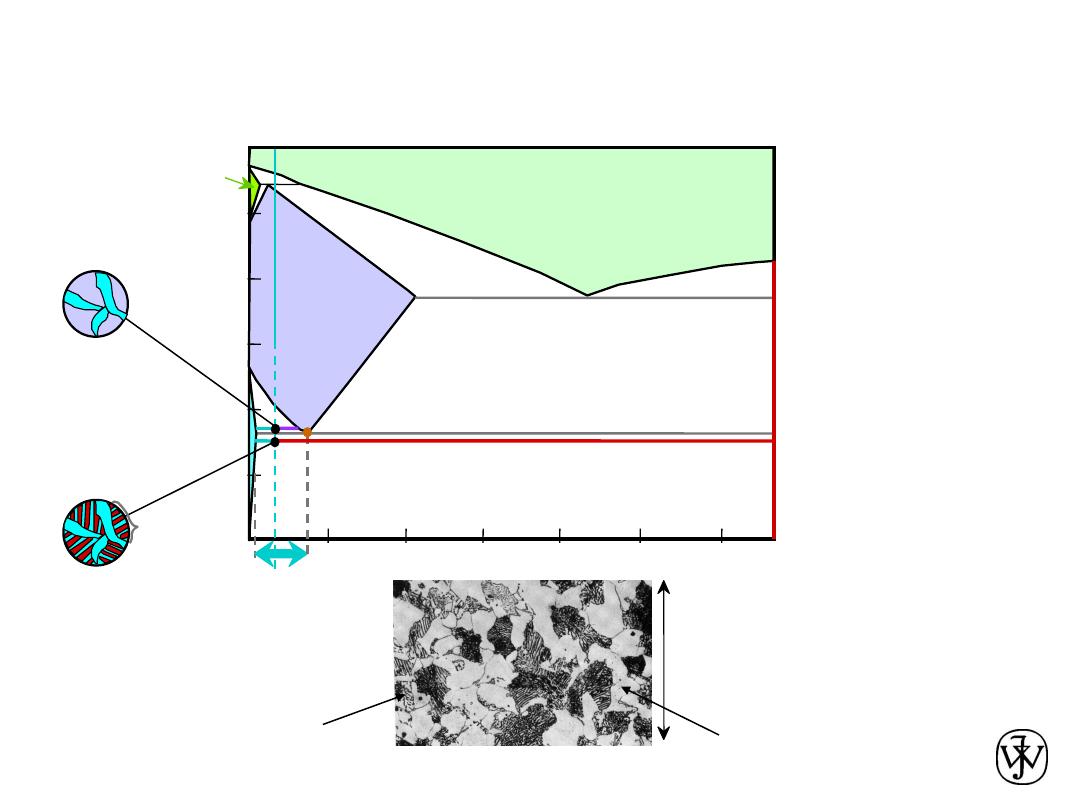
eutectoid Steel
Adapted from Figs. 9.24
and 9.29,Callister &
Rethwisch 8e.
(Fig. 9.24 adapted from
Binary Alloy Phase
Diagrams, 2nd ed., Vol.
1, T.B. Massalski (Ed.-in-
Chief), ASM International,
Materials Park, OH,
1990.)
Adapted from Fig. 9.30, Callister & Rethwisch 8e.
proeutectoid ferrite
pearlite
100
m
Hypoeutectoid
steel
a
pearlite
a
a
a
Chapter 9 - 29
Fe
3
C
(c
ementit
e)
1600
1400
1200
1000
800
600
400
0
1
2
3
4
5
6
6.7
L
(austenite)
+L
+
Fe
3
C
a
+
Fe
3
C
L+Fe
3
C
(Fe)
C, wt% C
1148ºC
T
(ºC)
a
727ºC
(Fe-C
System)
C
0
0.
76
Hypo
eutectoid Steel
a
a
a
s
r
W
a
=
s
/(
r
+
s
)
W
=(1 -
W
a
)
R
S
a
pearlite
W
pearlite
=
W
W
a
’
=
S
/(
R
+
S
)
W
=(1
–
W
a
’
)
Fe
3
C
Adapted from Figs. 9.24
and 9.29,Callister &
Rethwisch 8e.
(Fig. 9.24 adapted from
Binary Alloy Phase
Diagrams, 2nd ed., Vol.
1, T.B. Massalski (Ed.-in-
Chief), ASM International,
Materials Park, OH,
1990.)
Adapted from Fig. 9.30, Callister & Rethwisch 8e.
proeutectoid ferrite
pearlite
100
m
Hypoeutectoid
steel
Chapter 9 - 30
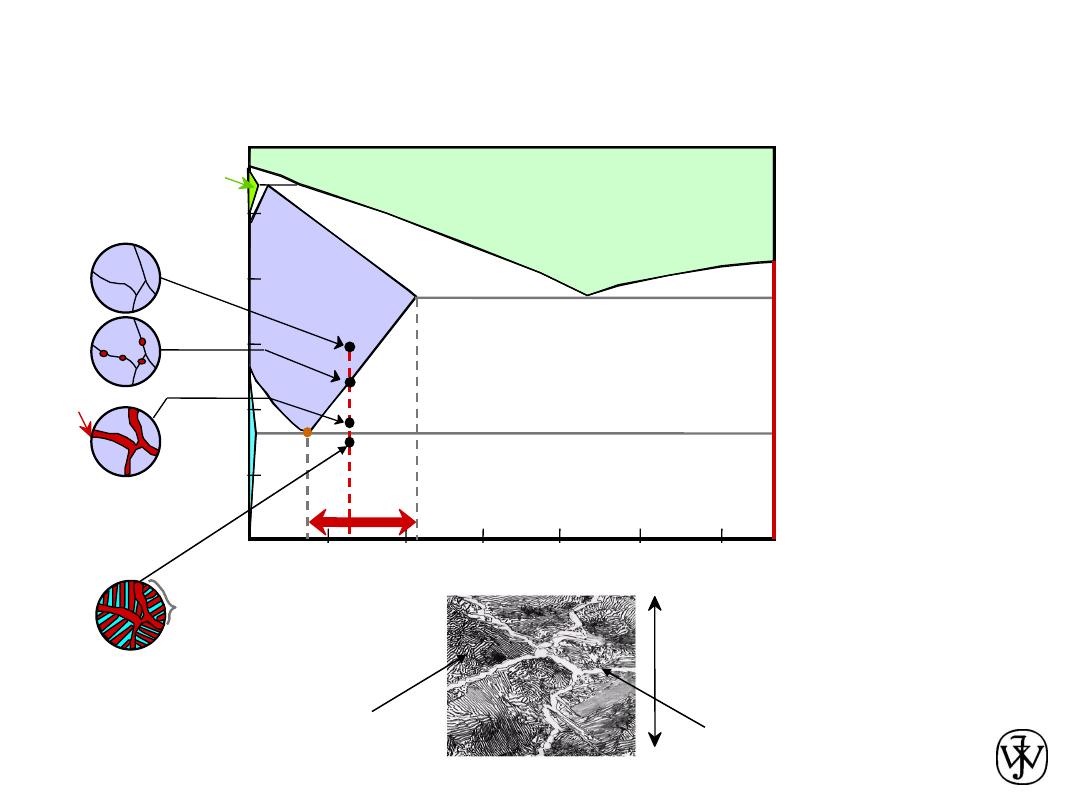
Hyper
eutectoid Steel
Fe
3
C
(c
ementit
e)
1600
1400
1200
1000
800
600
400
0
1
2
3
4
5
6
6.7
L
(austenite)
+L
+Fe
3
C
a
+Fe
3
C
L+Fe
3
C
(Fe)
C, wt%C
1148ºC
T
(ºC)
a
Adapted from Figs. 9.24
and 9.32,Callister &
Rethwisch 8e. (Fig. 9.24
adapted from Binary Alloy
Phase Diagrams, 2nd
ed., Vol. 1, T.B. Massalski
(Ed.-in-Chief), ASM
International, Materials
Park, OH, 1990.)
(Fe-C
System)
0
.7
6
C
0
Fe
3
C
Adapted from Fig. 9.33, Callister & Rethwisch 8e.
proeutectoid Fe
3
C
60
m
Hypereutectoid
steel
pearlite
pearlite
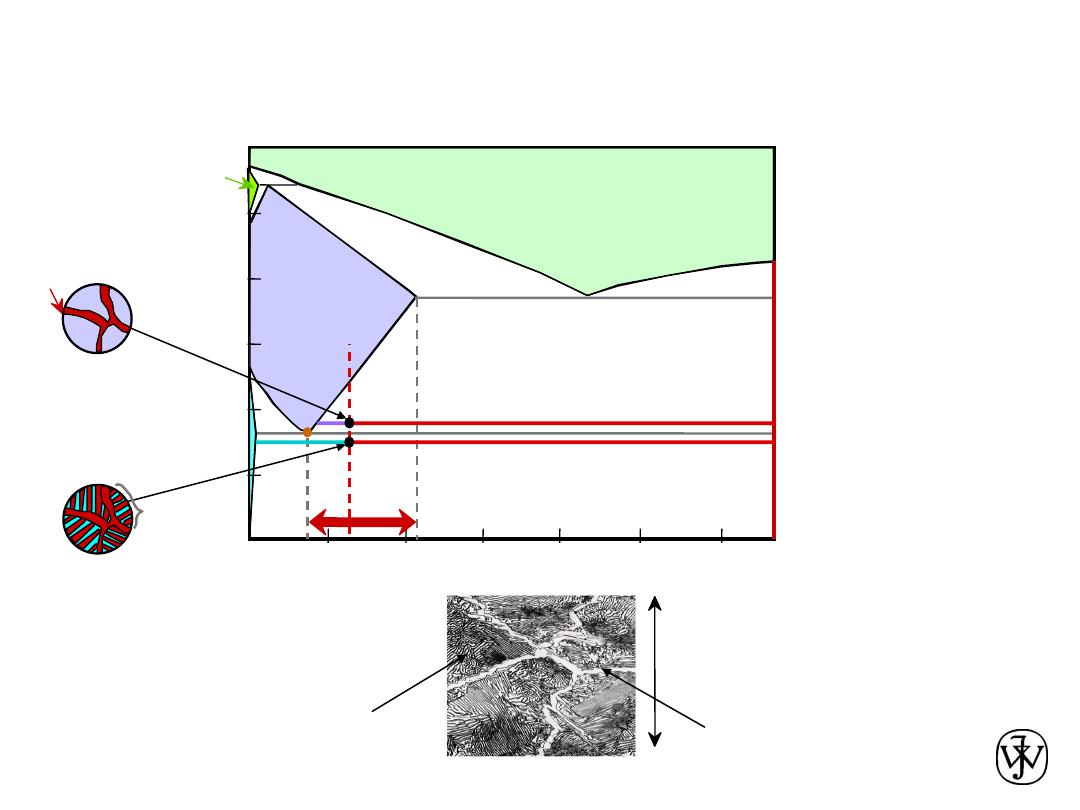
Chapter 9 - 31
Fe
3
C
(c
ementit
e)
1600
1400
1200
1000
800
600
400
0
1
2
3
4
5
6
6.7
L
(austenite)
+L
+Fe
3
C
a
+Fe
3
C
L+Fe
3
C
(Fe)
C, wt%C
1148ºC
T
(ºC)
a
Hyper
eutectoid Steel
(Fe-C
System)
0
.7
6
C
0
pearlite
Fe
3
C
x
v
V
X
W
pearlite
=
W
W
a
=
X
/(
V
+
X
)
W
=(1 -
W
a
)
Fe
3
C’
W
=(1-
W
)
W
=
x
/(
v
+
x
)
Fe
3
C
Adapted from Fig. 9.33, Callister & Rethwisch 8e.
proeutectoid Fe
3
C
60
m
Hypereutectoid
steel
pearlite
Adapted from Figs. 9.24
and 9.32,Callister &
Rethwisch 8e. (Fig. 9.24
adapted from Binary Alloy
Phase Diagrams, 2nd
ed., Vol. 1, T.B. Massalski
(Ed.-in-Chief), ASM
International, Materials
Park, OH, 1990.)

Chapter 9 - 32
Example Problem
For a 99.6 wt% Fe-0.40 wt% C steel at a
temperature just below the eutectoid,
determine the following:
a) The compositions of Fe
3
C and ferrite (
a
).
b) The amount of cementite (in grams) that
forms in 100 g of steel.
c) The amounts of pearlite and proeutectoid
ferrite (
a
) in the 100 g.
Chapter 9 - 33
Solution to Example Problem
b) Using the lever rule with
the tie line shown
a) Using the RS tie line just below the eutectoid
C
a
= 0.022 wt% C
C
Fe
3
C
= 6.70 wt% C
Fe
3
C
(c
ementit
e)
1600
1400
1200
1000
800
600
400
0
1
2
3
4
5
6
6.7
L
(austenite)
+L
+
Fe
3
C
a
+
Fe
3
C
L+Fe
3
C
C
, wt% C
1148ºC
T
(ºC)
727ºC
C
0
R
S
C
Fe C
3
C
a
Amount of Fe
3
C in 100 g
= (100 g)W
Fe
3
C
= (100 g)(0.057) = 5.7 g
Chapter 9 - 34
Solution to Example Problem (cont.)
c) Using the VX tie line just above the eutectoid and
realizing that
C
0
= 0.40 wt% C
C
a
= 0.022 wt% C
C
pearlite
= C
= 0.76 wt% C
Fe
3
C
(c
ementit
e)
1600
1400
1200
1000
800
600
400
0
1
2
3
4
5
6
6.7
L
(austenite)
+L
+
Fe
3
C
a
+
Fe
3
C
L+Fe
3
C
C, wt% C
1148ºC
T
(ºC)
727ºC
C
0
V
X
C
C
a
Amount of pearlite in 100 g
= (100 g)W
pearlite
= (100 g)(0.512) = 51.2 g
Chapter 9 - 35
Alloying with Other Elements
• T
eutectoid
changes:
Adapted from Fig. 9.34,Callister & Rethwisch 8e.
(Fig. 9.34 from Edgar C. Bain, Functions of the
Alloying Elements in Steel, American Society for
Metals, 1939, p. 127.)
T
Eutectoid
(ºC
)
wt. % of alloying elements
Ti
Ni
Mo
Si
W
Cr
Mn
• C
eutectoid
changes:
Adapted from Fig. 9.35,Callister & Rethwisch 8e.
(Fig. 9.35 from Edgar C. Bain, Functions of the
Alloying Elements in Steel, American Society for
Metals, 1939, p. 127.)
wt. % of alloying elements
C
eu
tec
toid
(w
t%
C)
Ni
Ti
Cr
Si
Mn
W
Mo

Chapter 9 - 36
•
Phase diagrams
are useful tools to determine:
-- the number and types of phases present,
-- the
composition
of each phase,
-- and the weight fraction of each phase
given the temperature and composition of the system.
• The microstructure of an alloy depends on
-- its composition, and
-- whether or not cooling rate allows for maintenance of
equilibrium.
• Important phase diagram phase transformations include
eutectic
,
eutectoid
, and
peritectic
.
Summary