
ISSUES TO ADDRESS...
•
Stress
and
strain
: What are they and why are
they used instead of load and deformation?
•
Elastic
behavior: When loads are small, how much
deformation occurs? What materials deform least?
•
Plastic
behavior: At what point do dislocations
cause permanent deformation? What materials are
most resistant to permanent deformation?
1
•
Toughness
and
ductility
: What are they and how
do we measure them?
CHAPTER 6:
MECHANICAL PROPERTIES
• Ceramic Materials:
What special provisions/tests are
made for ceramic materials?

Many materials, when in service, are subjected to forces
or loads; examples include the aluminum alloy from which
an airplane wing is constructed and the steel in an
automobile axle.
In such situations it is necessary to know the
characteristics of the material and to design the member
from which it is made such that any resulting deformation
will not be excessive and fracture will not occur.
The mechanical behavior of a material reflects the
relationship between its response or deformation
to an applied load or force.Key mechanical design
properties are stiffness, strength, hardness, ductility, and
toughness.

Factors to be considered include the nature of the
applied
load
and
its
duration,
as
well
as
the
environmental conditions.
It is possible for the load to be tensile, compressive, or
shear, and its magnitude may be constant with time, or it
may fluctuate continuously.
Application time may be only a fraction of a second, or it
may extend over a period of many years.
Service temperature may be an important factor.

Elastic deformation
is the deformation in which stress and
strain are linearly proportional.
So, the slope of line is E which may be thought as
the stiffness or material’s resistance
to elastic deformation.
Elastic deformation is reversible (nonpermanent),
specimen returns to its original shape when
applied load is released
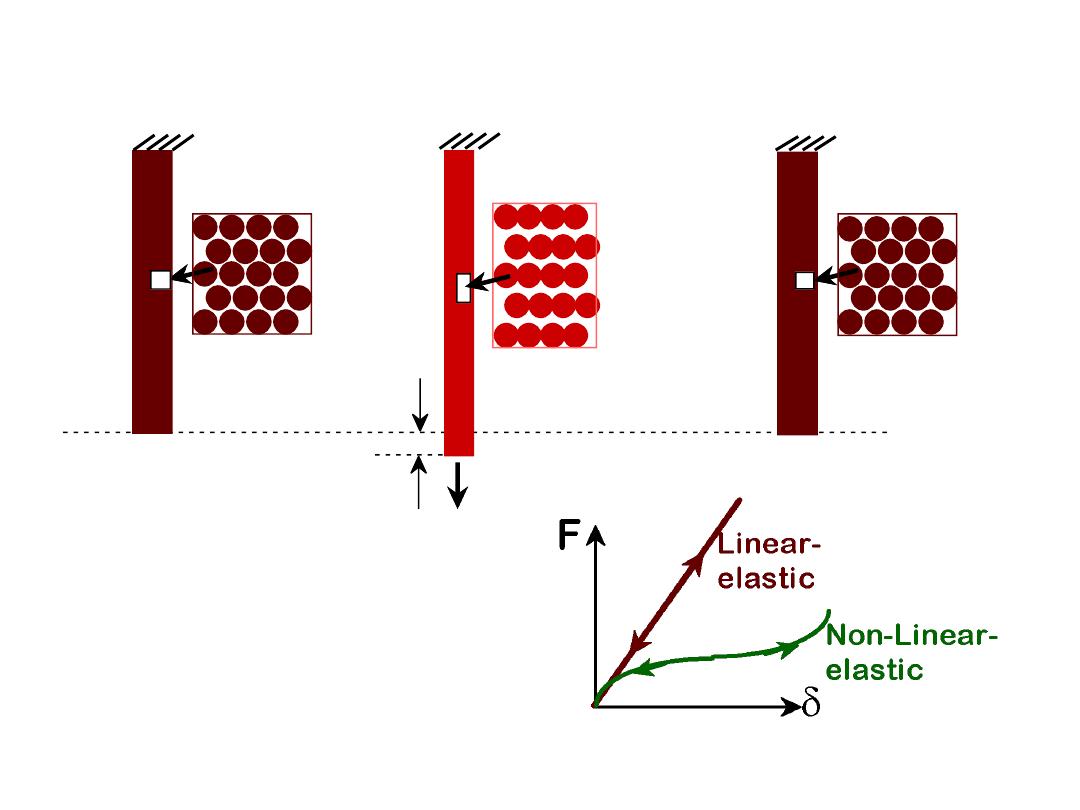
F
bonds
stretch
return to
initial
2
1. Initial
2. Small load
3. Unload
Elastic means
reversible
!
ELASTIC DEFORMATION

For most metallic materials, elastic deformation persists only to
strains of about 0.005.
As the material is deformed beyond this point, the stress and
strains are no longer linearly proportional
(Hook’s law is not valid) and permanent (nonrecoverable) or
plastic deformation occurs
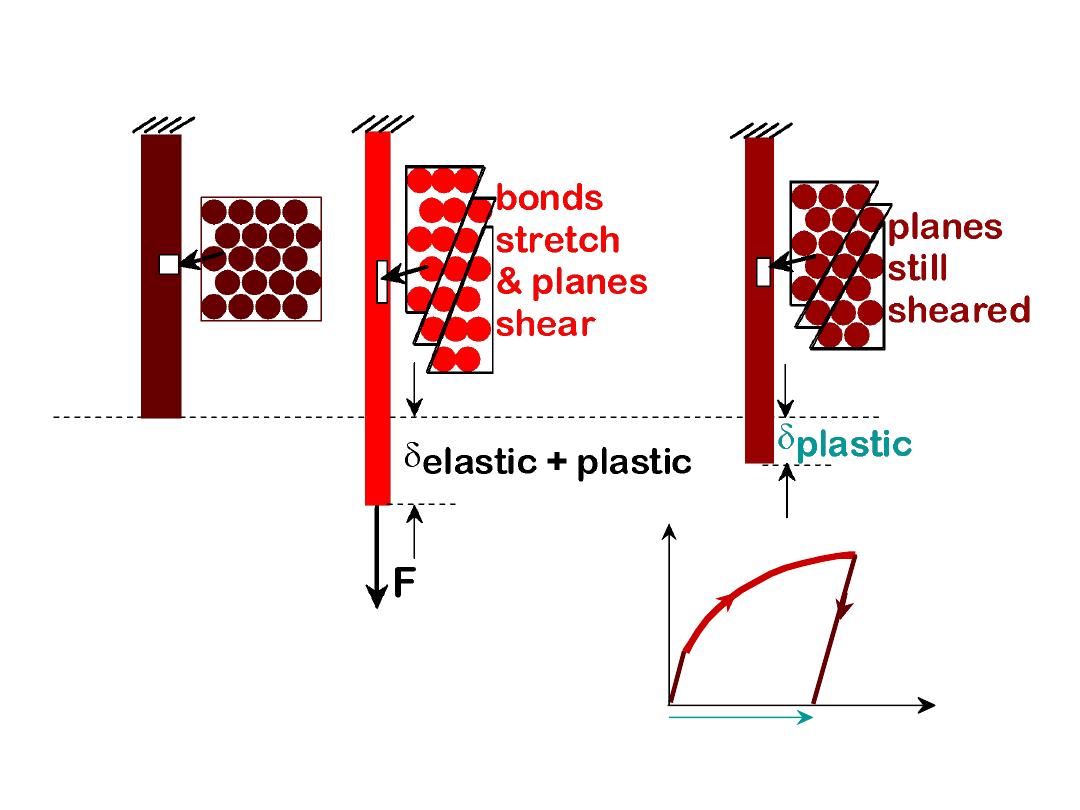
3
1. Initial
2. Small load
3. Unload
Plastic means
permanent
!
F
linear
elastic
linear
elastic
plastic
PLASTIC DEFORMATION
(METALS)

If a load is static or changes relatively slowly with time and
is applied uniformly over a cross section or surface of a
member, the mechanical behavior may be ascertained by
a simple stress
–strain test; these are most commonly
conducted for metals at room temperature.
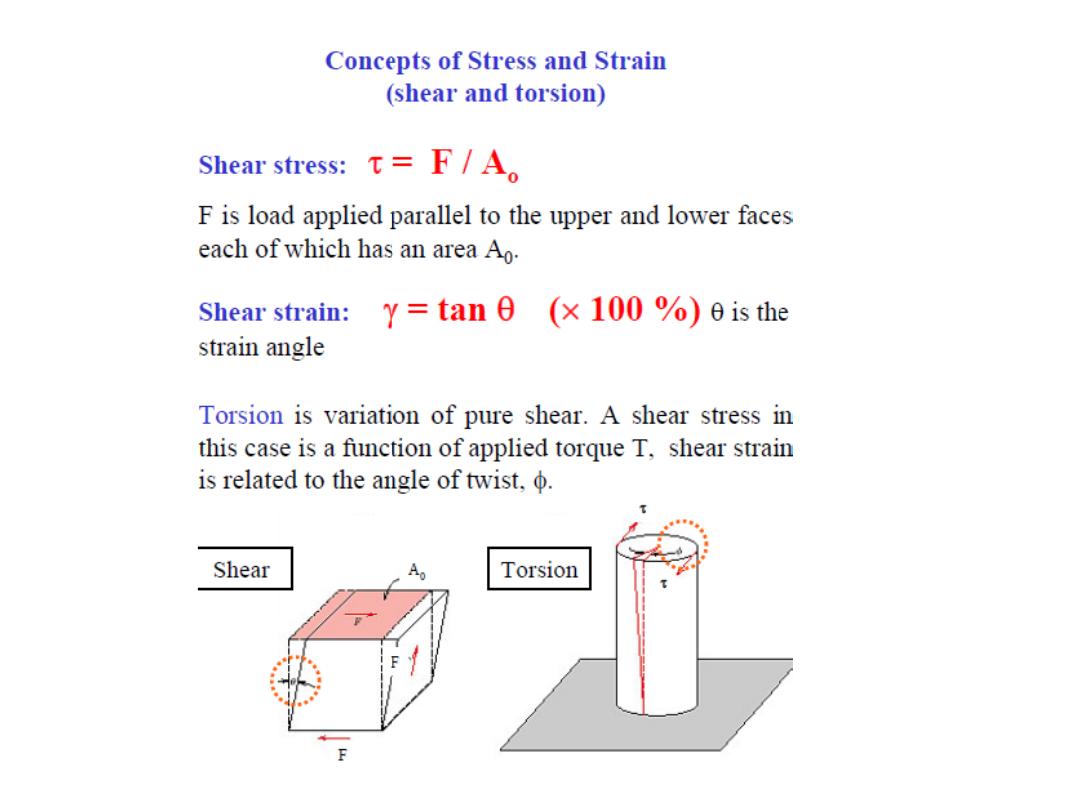
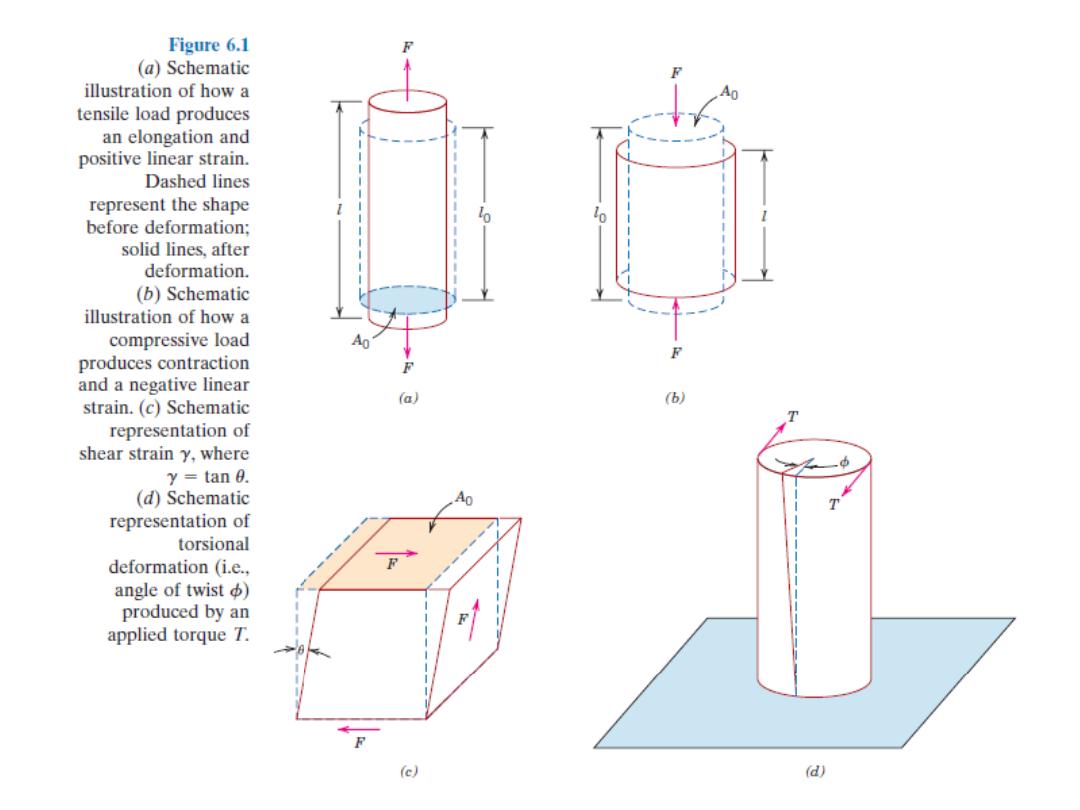
There are three principal ways in which a load may
be applied: namely, tension, compression, and shear.

One of the most common mechanical stress
–strain tests
is performed in tension. The tension test can be used to
ascertain several mechanical properties of materials that
are important in design.
Engineering stress is defined as the instantaneous load
divided by the original specimen cross-sectional area.
Engineering strain is expressed as the change in length
(in the direction of load application) divided by the
original length.
4
•
Tensile
stress,
s:
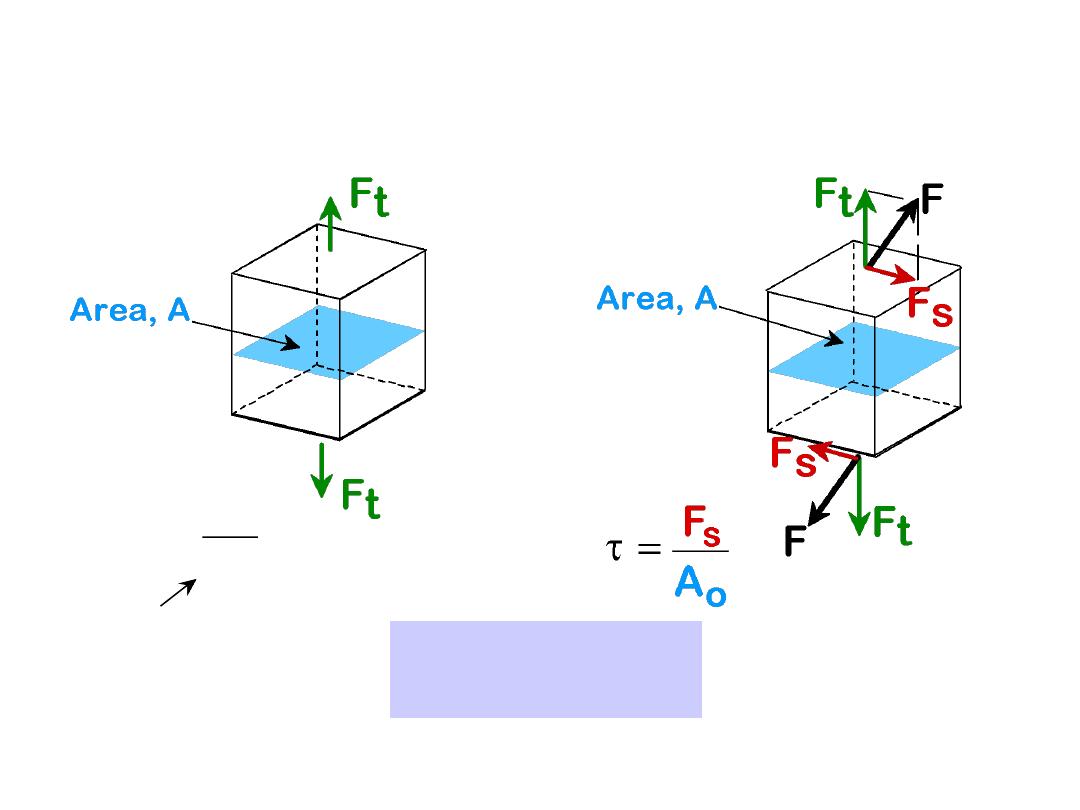
•
Shear
stress,
t:
s
F
t
A
o
original area
before loading
Stress has units:
N/m
2
or lb/in
2
ENGINEERING STRESS
F is the instantaneous load applied perpendicular to the specimen cross section,
in units of newtons (N) or pounds force (lbf)
8
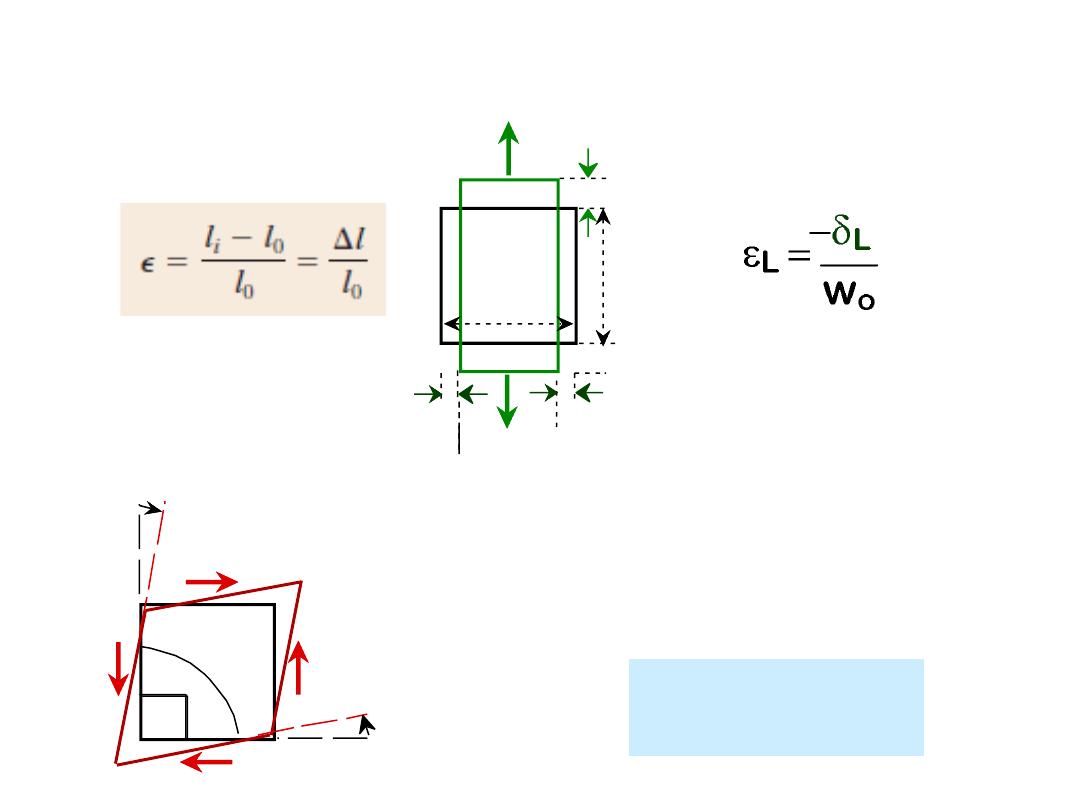
•
Tensile
strain:
•
Lateral
strain:
•
Shear
strain:
/2
/2
/2 -
/2
/2
/2
L
/2
L
/2
L
o
w
o
= tan
Strain is always
dimensionless.
ENGINEERING STRAIN
l
0
is the original length
before any load is
applied,
li
is
the
instantaneous length.

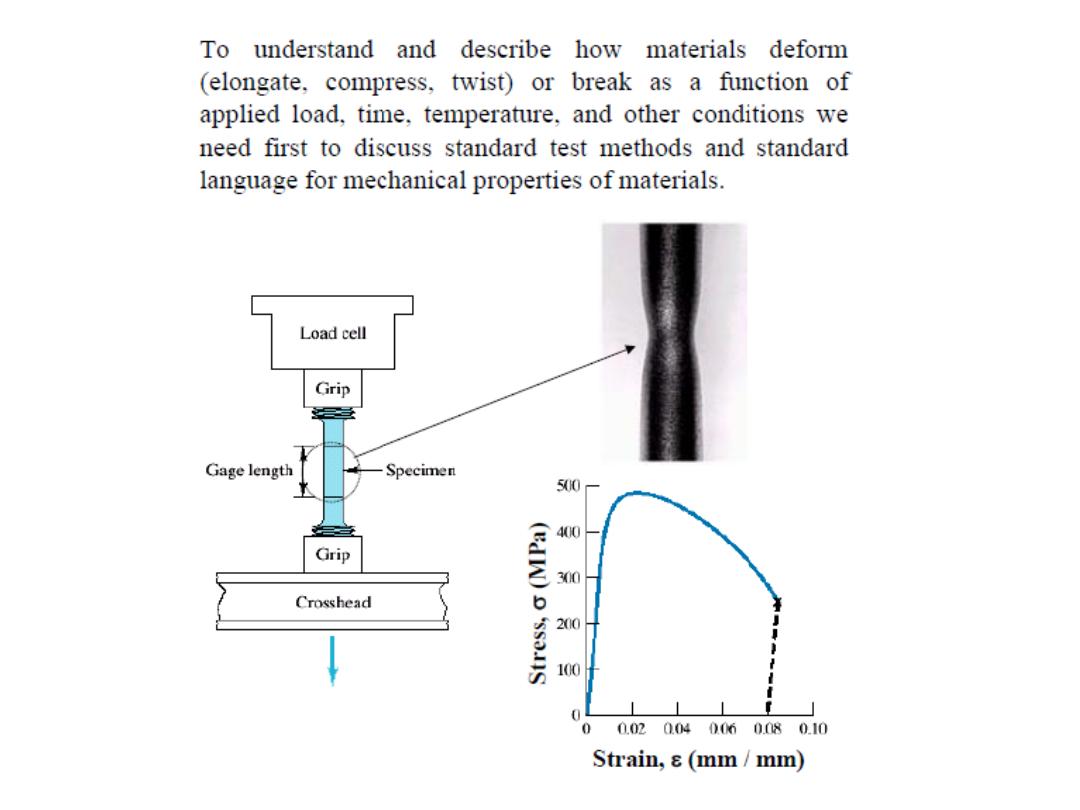
A standard tensile specimen is shown in Figure.
Normally, the cross section is circular, but rectangular
specimens are also used. This
“dogbone” specimen
configuration
was
chosen
so
that,
during
testing,
deformation is confined to the narrow center region
(which has a uniform cross section along its length), and
also to reduce the likelihood of fracture at the ends of the
specimen.
The tensile testing machine is designed to elongate the
specimen at a constant rate and to continuously and
simultaneously measure the instantaneous applied load (with a
load cell) and the resulting elongations (using an extensometer).
A stress–strain test typically takes several minutes to perform
and is destructive; that is, the test specimen is permanently
deformed and usually fractured.
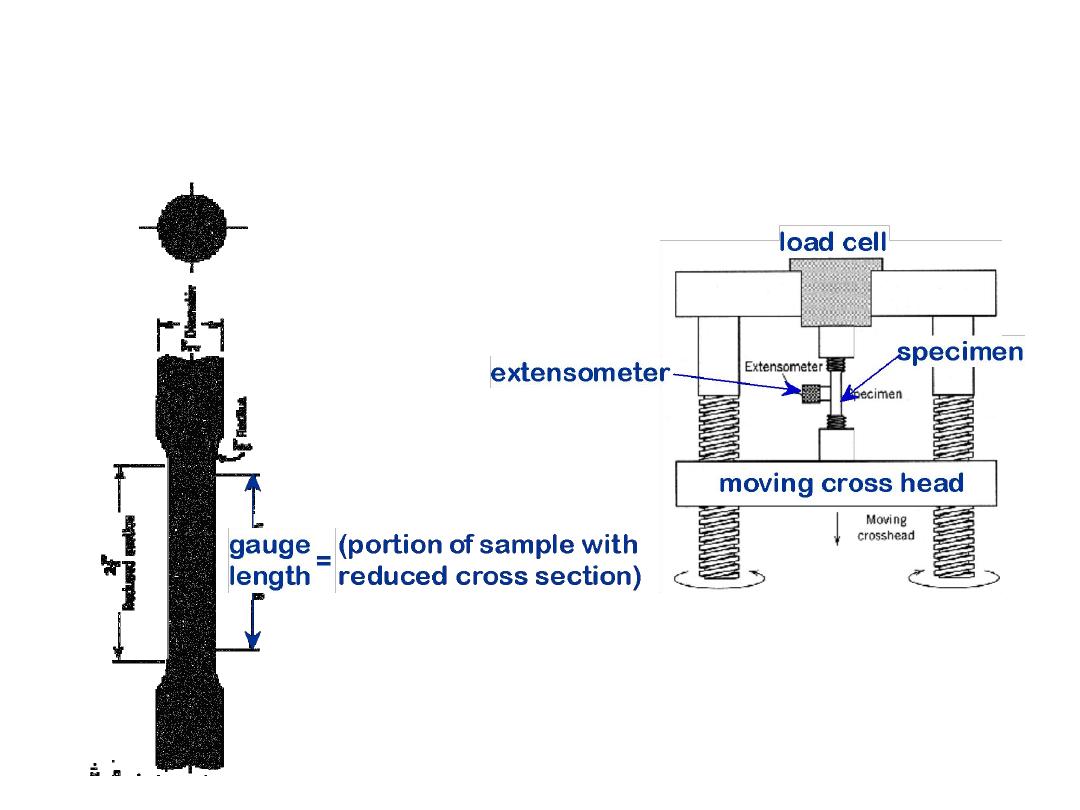
• Typical tensile specimen
9
• Other types of tests:
--compression:
brittle
materials (e.g., concrete)
--torsion:
cylindrical tubes,
shafts.
• Typical tensile
test machine
Adapted from Fig. 6.2,
Callister 6e.
Adapted from Fig. 6.3,
Callister 6e.
(Fig. 6.3 is taken from H.W. Hayden,
W.G. Moffatt, and J. Wulff,
The
Structure and Properties of
Materials, Vol. III, Mechanical
Behavior, p. 2, John Wiley and Sons,
New York, 1965.)
STRESS-STRAIN TESTING

Stress
–Strain Behavior
• A material that is stressed first undergoes elastic, or
nonpermanent, deformation.
• When most materials are deformed elastically, stress and strain
are proportional
— that is, a plot of stress versus strain is linear.
• For tensile and compressive loading, the slope of the linear
elastic region of the stress
–strain curve is the modulus of elasticity
(E), per
Hooke’s law.
• For a material that exhibits nonlinear elastic behavior, tangent
and secant moduli are used.
• On an atomic level, elastic deformation of a material corresponds
to the stretching of interatomic bonds and corresponding slight
atomic displacements.
• For shear elastic deformations, shear stress and shear strain are
proportional to one another.The constant of proportionality is the
shear modulus (G).
• Elastic deformation that is dependent on time is termed
anelastic.

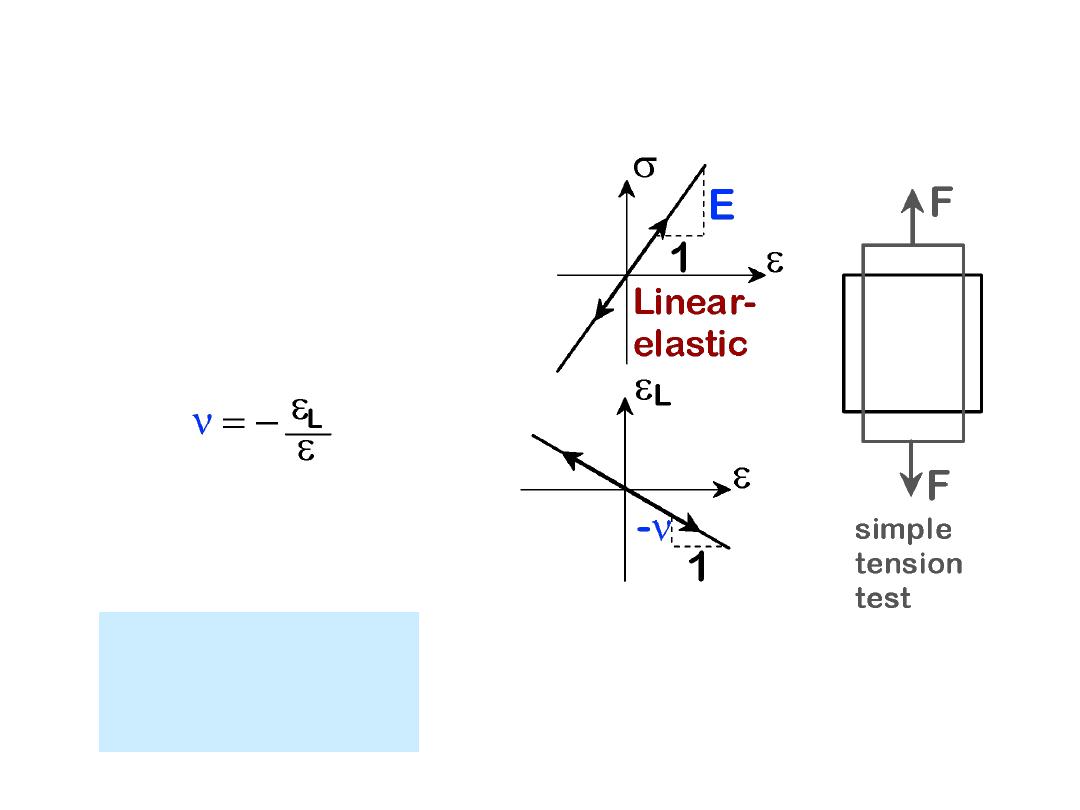
Another elastic parameter, Poisson’s ratio (v),
represents the negative ratio of transverse and
longitudinal strains
•
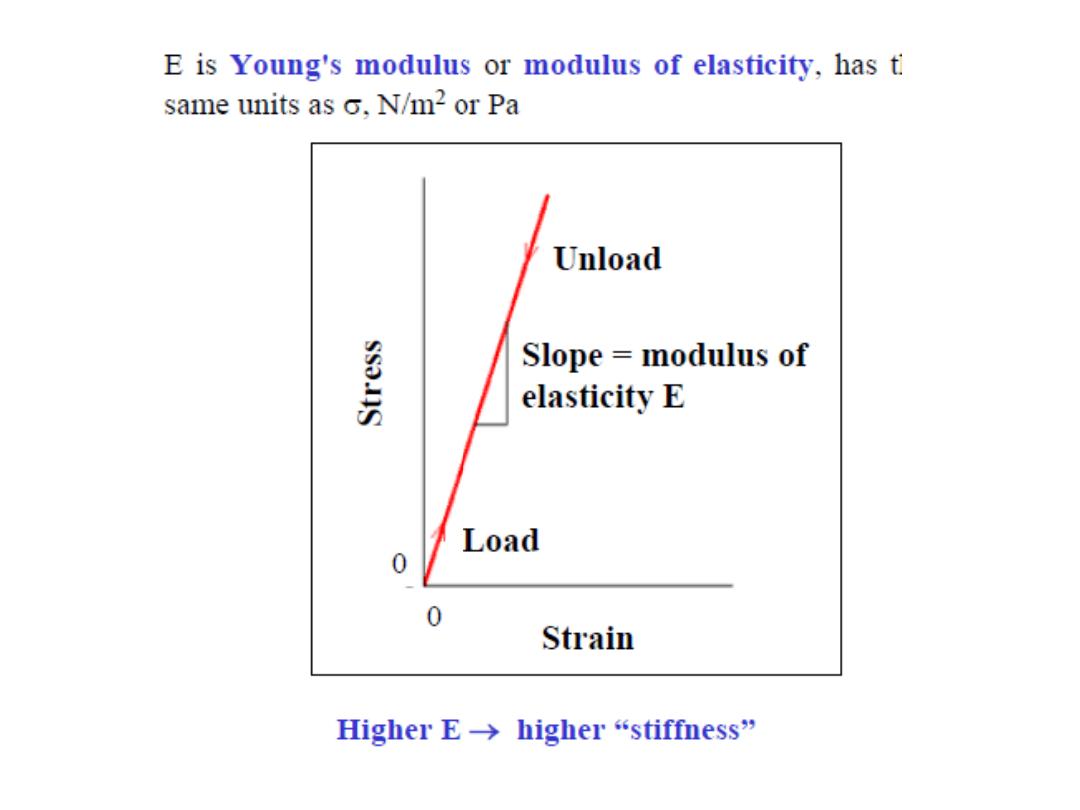
Modulus of Elasticity, E
:
(also known as Young's modulus)
10
•
Hooke's Law
:
s =
E
e
•
Poisson's ratio,
n
:
metals:
n ~ 0.33
ceramics: ~0.25
polymers: ~0.40
Units:
E: [GPa] or [psi]
n: dimensionless
LINEAR ELASTIC PROPERTIES
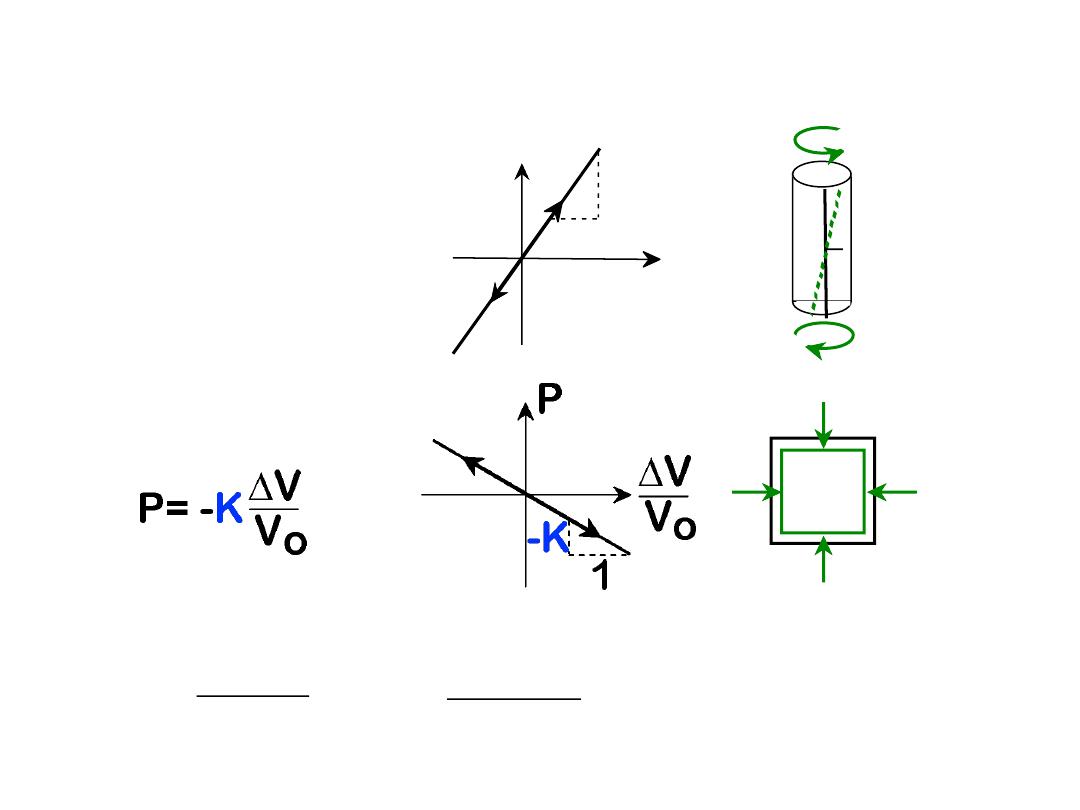
• Elastic
Shear
modulus, G:
12
t
1
G
t =
G
• Elastic
Bulk
modulus, K:
• Special relations for isotropic materials:
P
P
P
M
M
G
E
2(1
n)
K
E
3(1
2n)
simple
torsion
test
pressure
test: Init.
vol =V
o
.
Vol chg.
=
DV
OTHER ELASTIC PROPERTIES
13
0.2
8
0.6
1
Magnesium,
Aluminum
Platinum
Silver, Gold
Tantalum
Zinc, Ti
Steel, Ni
Molybdenum
Graphite
Si crystal
Glass-soda
Concrete
Si nitride
Al oxide
PC
Wood( grain)
AFRE( fibers)*
CFRE*
GFRE*
Glass fibers only
Carbon fibers only
Aramid fibers only
Epoxy only
0.4
0.8
2
4
6
10
20
40
60
80
100
200
600
800
1000
1200
400
Tin
Cu alloys
Tungsten
<100>
<111>
Si carbide
Diamond
PTFE
HDPE
LDPE
PP
Polyester
PS
PET
CFRE( fibers)*
GFRE( fibers)*
GFRE(|| fibers)*
AFRE(|| fibers)*
CFRE(|| fibers)*
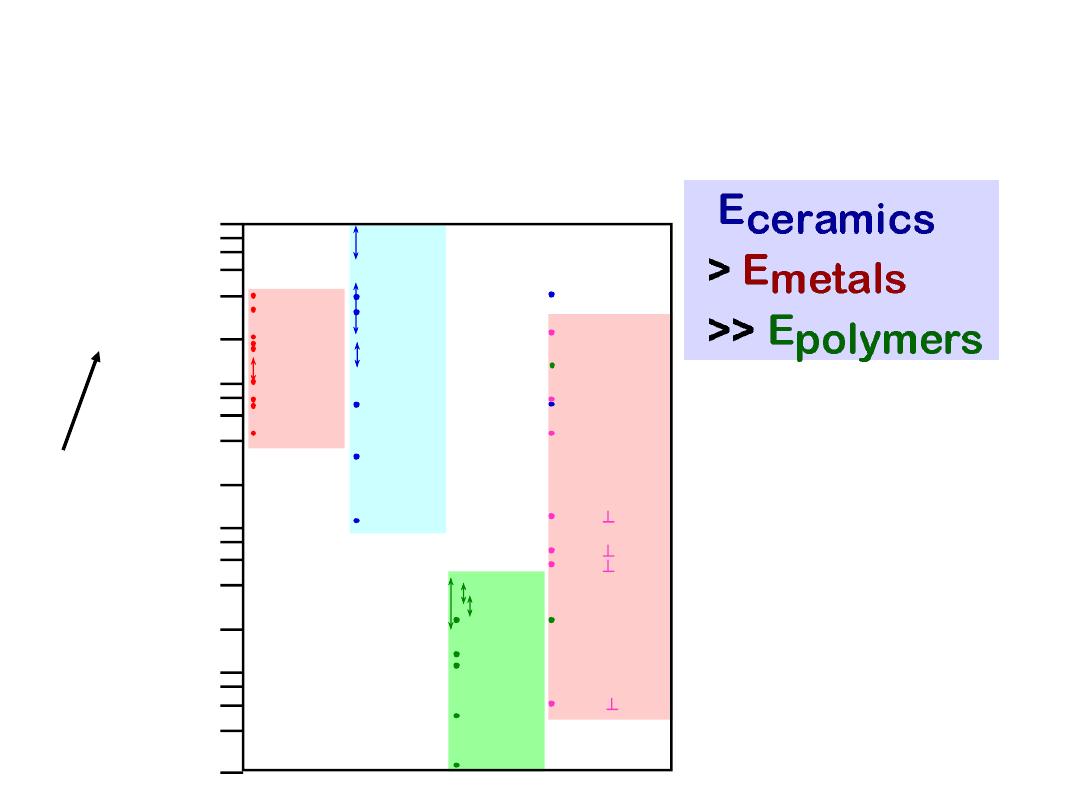
Metals
Alloys
Graphite
Ceramics
Semicond
Polymers
Composites
/fibers
E(GPa)
109 Pa
YOUNG’S MODULI:
COMPARISON
15
• Simple tension test:
(at lower temperatures, T < T
melt
/3)
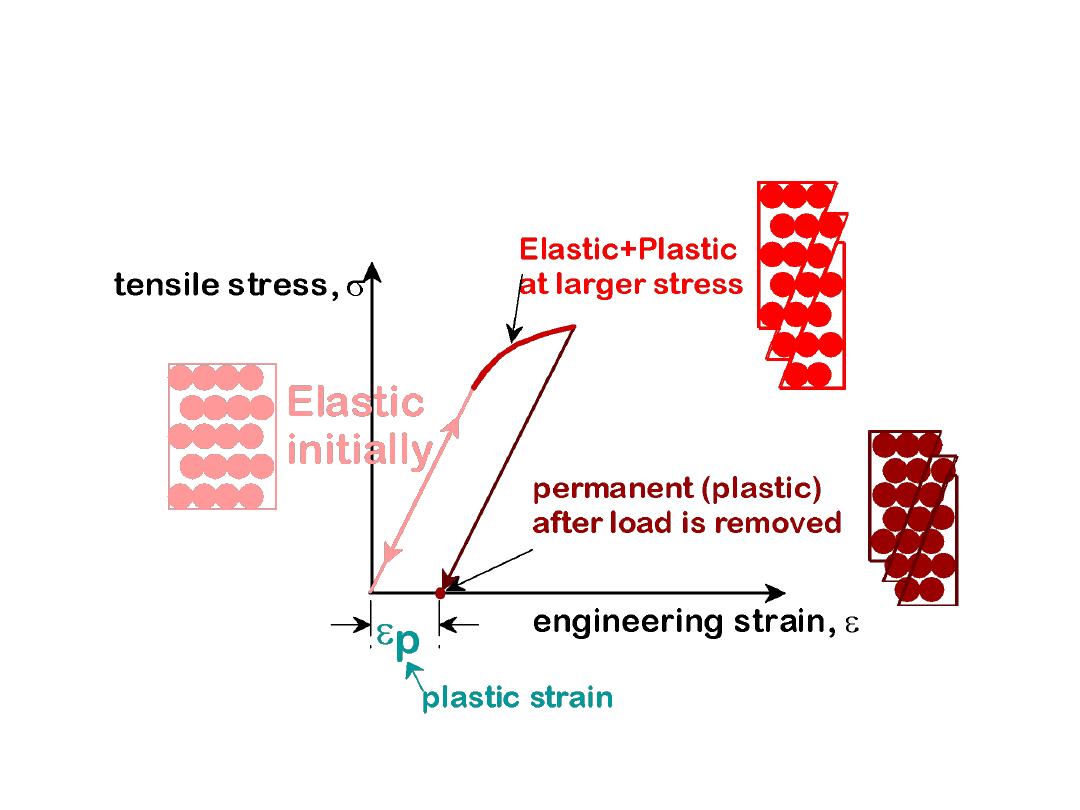
PLASTIC (PERMANENT)
DEFORMATION
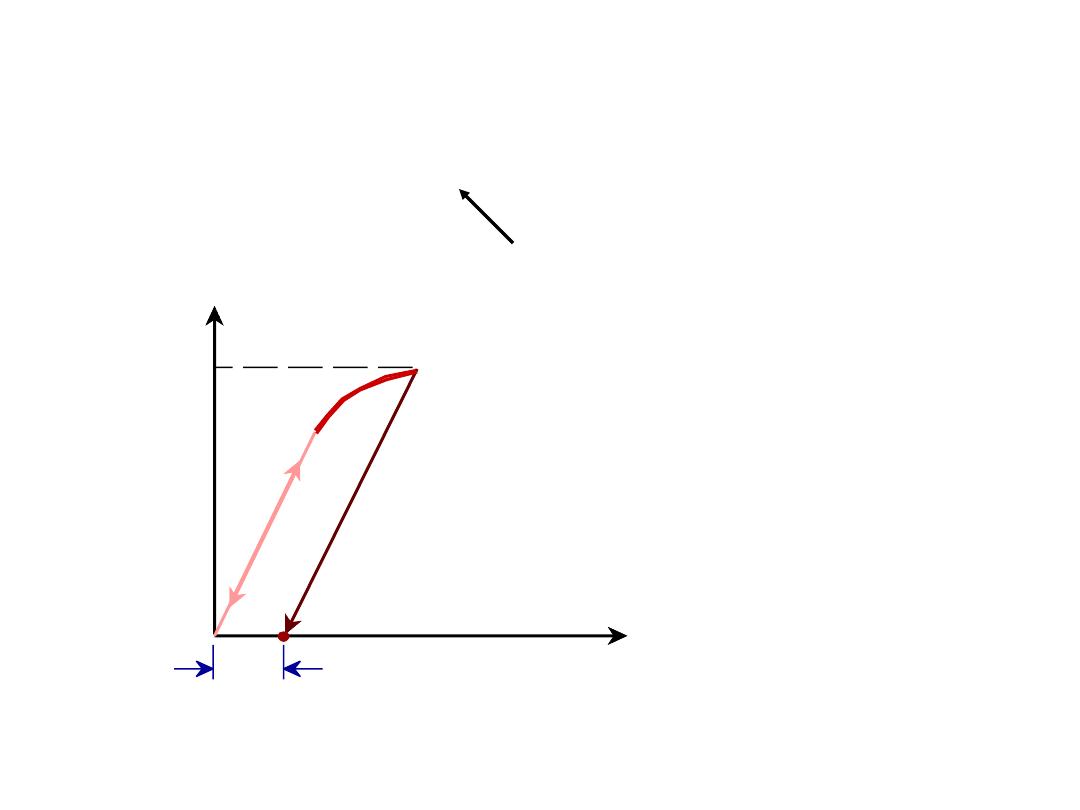
16
• Stress at which
noticeable
plastic deformation has
occurred.
when
e
p
= 0.002
tensile stress,
s
engineering strain,
e
sy
ep = 0.002
YIELD STRENGTH,
s
y
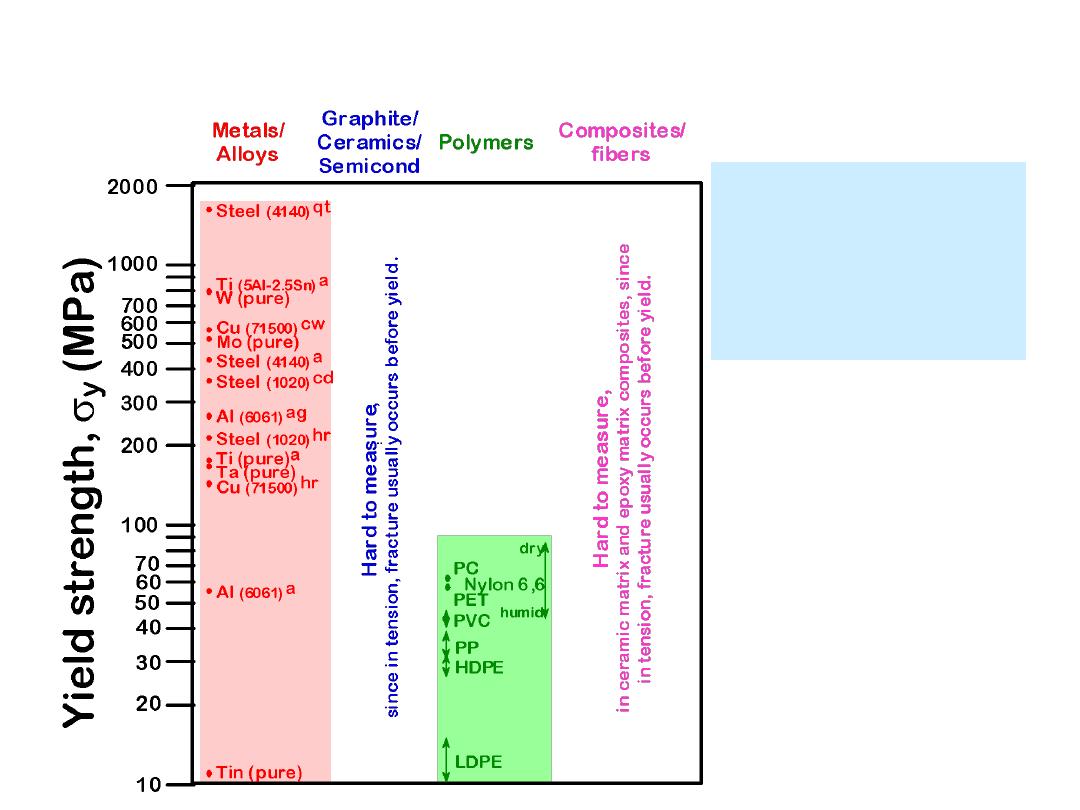
17
Room T values
sy(ceramics)
>>
sy(metals)
>>
sy(polymers)
Based on data in Table B4,
Callister 6e
.
a = annealed
hr = hot rolled
ag = aged
cd = cold drawn
cw = cold worked
qt = quenched & tempered
YIELD STRENGTH: COMPARISON
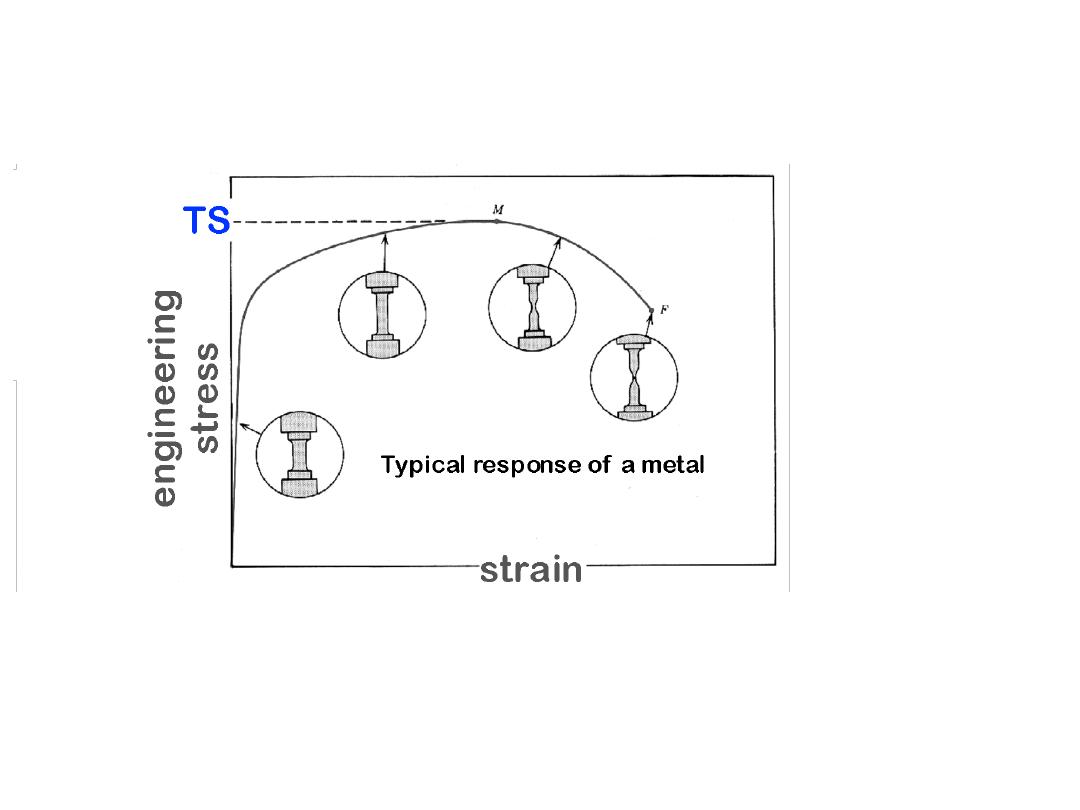
18
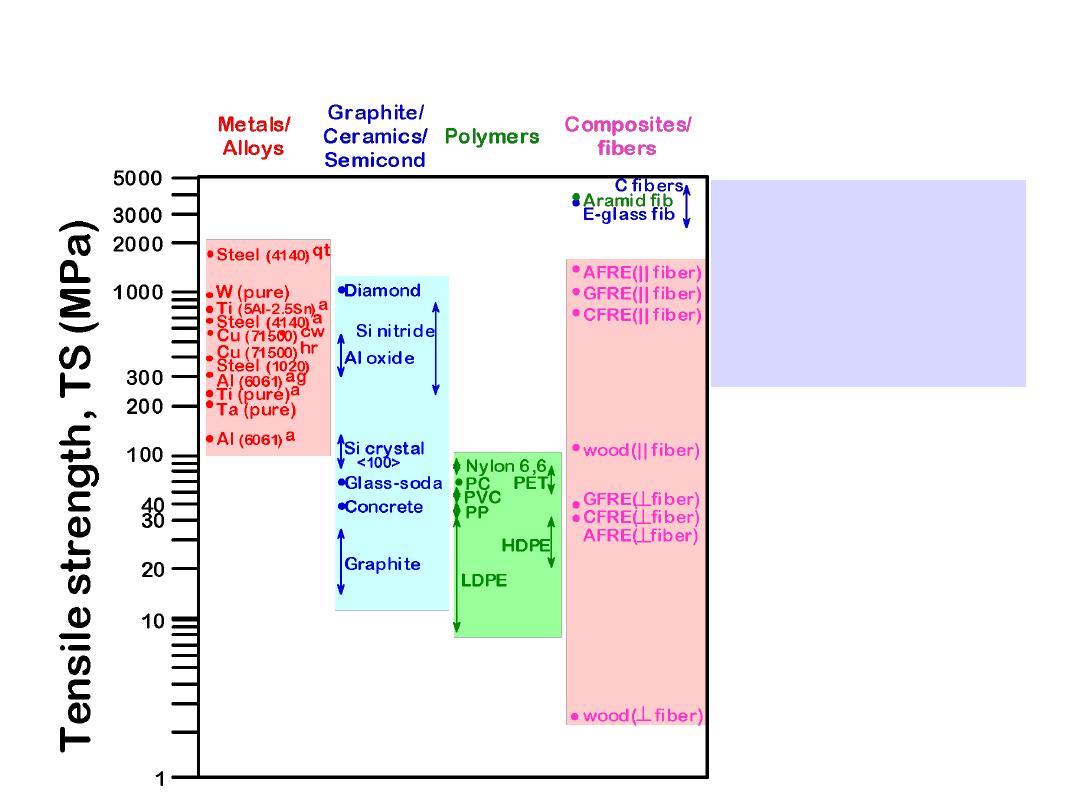
• Maximum possible engineering stress in tension.
• Metals:
occurs when noticeable
necking
starts.
• Ceramics:
occurs when
crack propagation
starts.
• Polymers:
occurs when
polymer backbones
are
aligned and about to break.
Adapted from Fig. 6.11,
Callister 6e.
TENSILE STRENGTH, TS
19
Room T values
TS(ceram)
~
TS
(met)
~
TS(comp)
>>
TS(poly)
Based on data in Table B4,
Callister 6e
.
a = annealed
hr = hot rolled
ag = aged
cd = cold drawn
cw = cold worked
qt = quenched & tempered
AFRE, GFRE, & CFRE =
aramid, glass, & carbon
fiber-reinforced epoxy
composites, with 60 vol%
fibers.
TENSILE STRENGTH:
COMPARISON

Ductility
is another important mechanical property. It
is a measure of the degree
of plastic deformation that has been sustained at
fracture. A metal that experiences
very little or no plastic deformation upon fracture is
termed brittle.
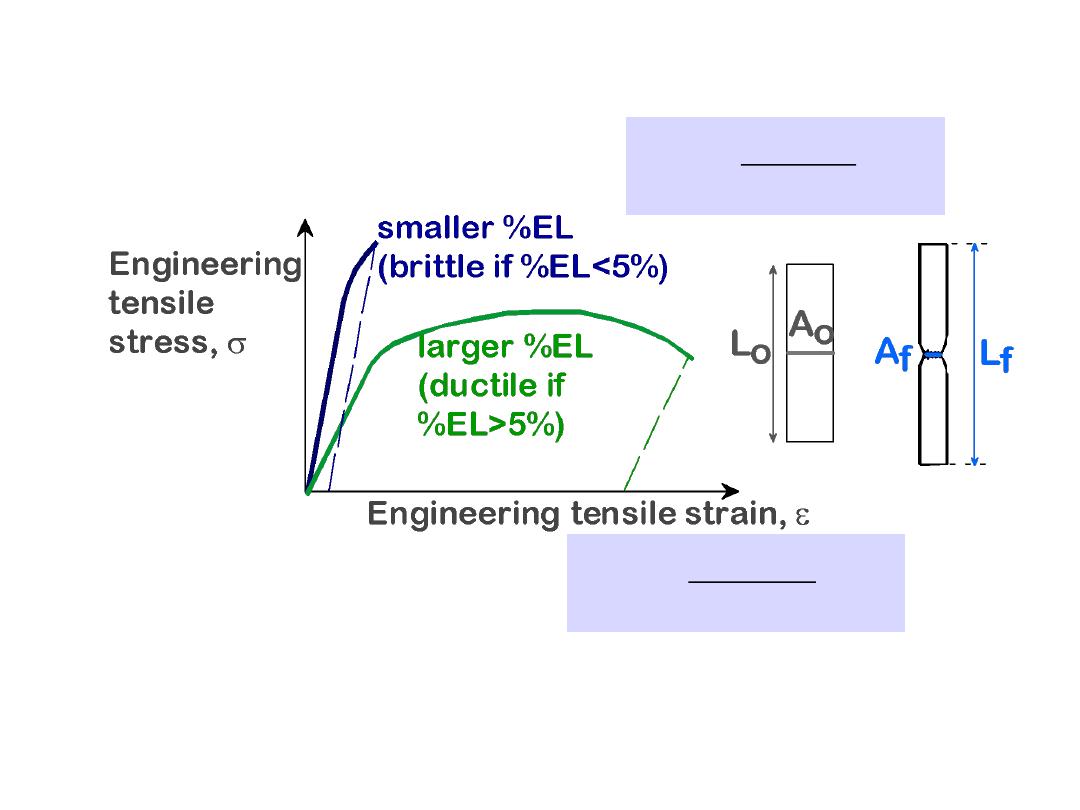
• Plastic tensile strain at failure:
20
• Another ductility measure:
%AR
A
o
A
f
A
o
x100
• Note:
%AR and %EL are often comparable.
--Reason: crystal slip does not change material volume.
--%AR > %EL possible if internal voids form in neck.
%EL
L
f
L
o
L
o
x100
Adapted from Fig. 6.13,
Callister 6e.
DUCTILITY, %EL

Toughness
is a mechanical term that may be used in several
contexts. For one, toughness (or more specifically, fracture
toughness) is a property that is indicative of a material’s
resistance to fracture when a crack (or other stress-
concentrating defect) is present.
Because it is nearly impossible (as well as costly) to
manufacture materials with zero defects (or to prevent damage
during service), fracture toughness is a major consideration for
all structural materials.
Another way of defining toughness is as the ability of a material
to absorb energy and plastically deform before fracturing.
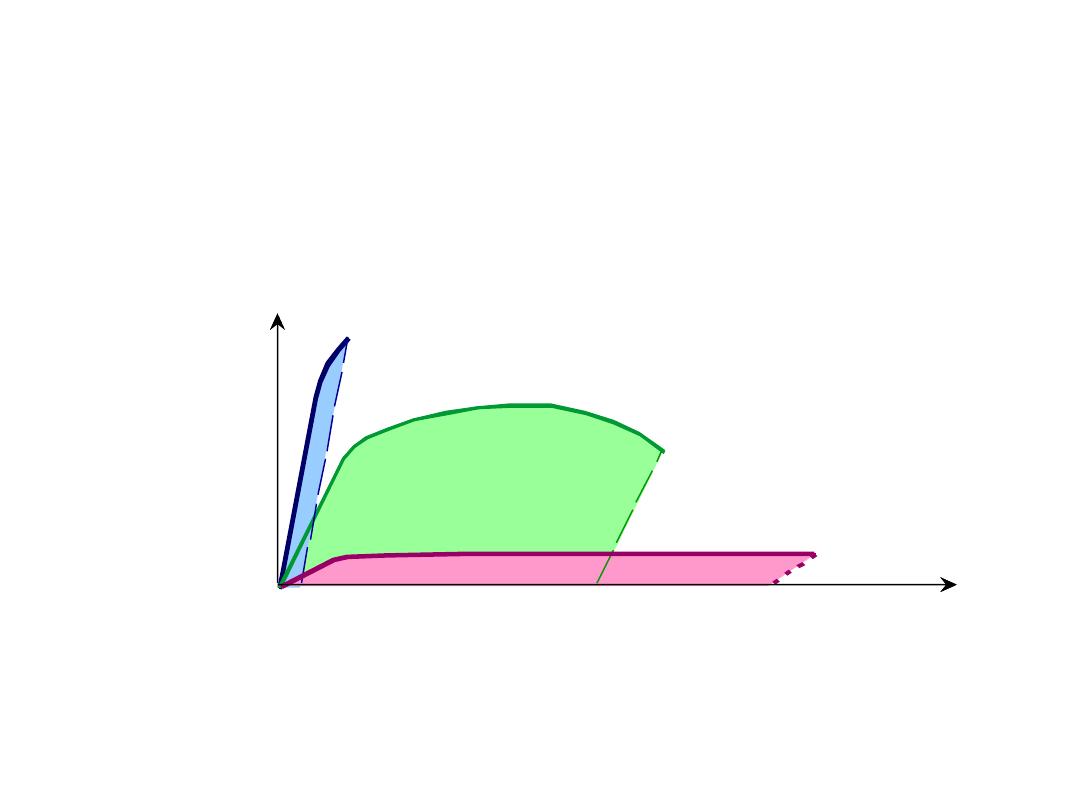
• Energy to break a unit volume of material
• Approximate by the area under the stress-strain
curve.
21
smaller toughness-
unreinforced
polymers
Engineering tensile strain,
e
Engineering
tensile
stress,
s
smaller toughness (ceramics)
larger toughness
(metals, PMCs)
TOUGHNESS

Another mechanical property that may be important to
consider is
hardness,
which is a measure of a
material’s
resistance to localized plastic deformation (e.g., a small dent
or a scratch).
Early hardness tests were based on natural minerals with a
scale constructed solely on the ability of one material to
scratch another that was softer.
A qualitative and somewhat arbitrary hardness indexing
scheme was devised, termed the Mohs scale, which ranged
from 1 on the soft end for talc to 10 for diamond.
Quantitative hardness techniques have been developed over
the years in which a small indenter is forced into the surface
of a material to be tested, under controlled conditions of load
and rate of application.
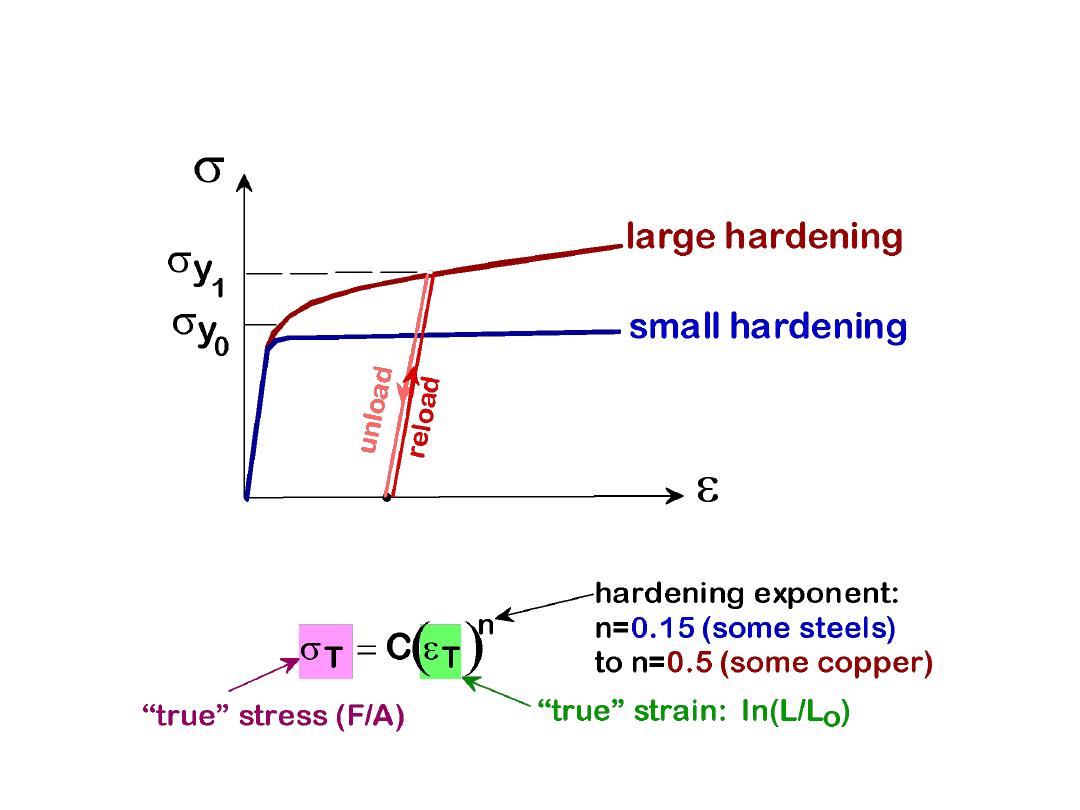
• An increase in
s
y
due to plastic deformation.
22
• Curve fit to the stress-strain response:
HARDENING
23
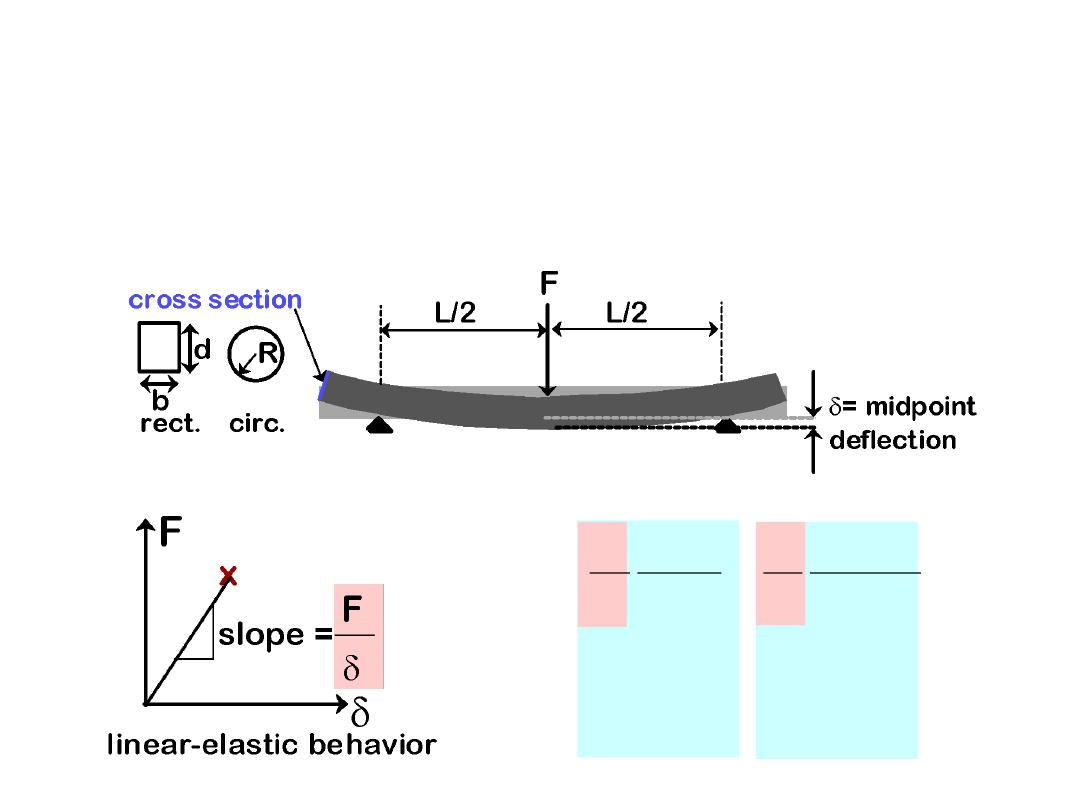
•
Room T behavior is usually elastic, with brittle failure.
•
3-Point Bend Testing
often used.
--tensile tests are difficult for brittle materials.
•
Determine elastic modulus according to:
E
F
L
3
4bd
3
F
L
3
12
R
4
rect.
cross
section
circ.
cross
section
Adapted from Fig.
12.29,
Callister 6e.
MEASURING ELASTIC MODULUS
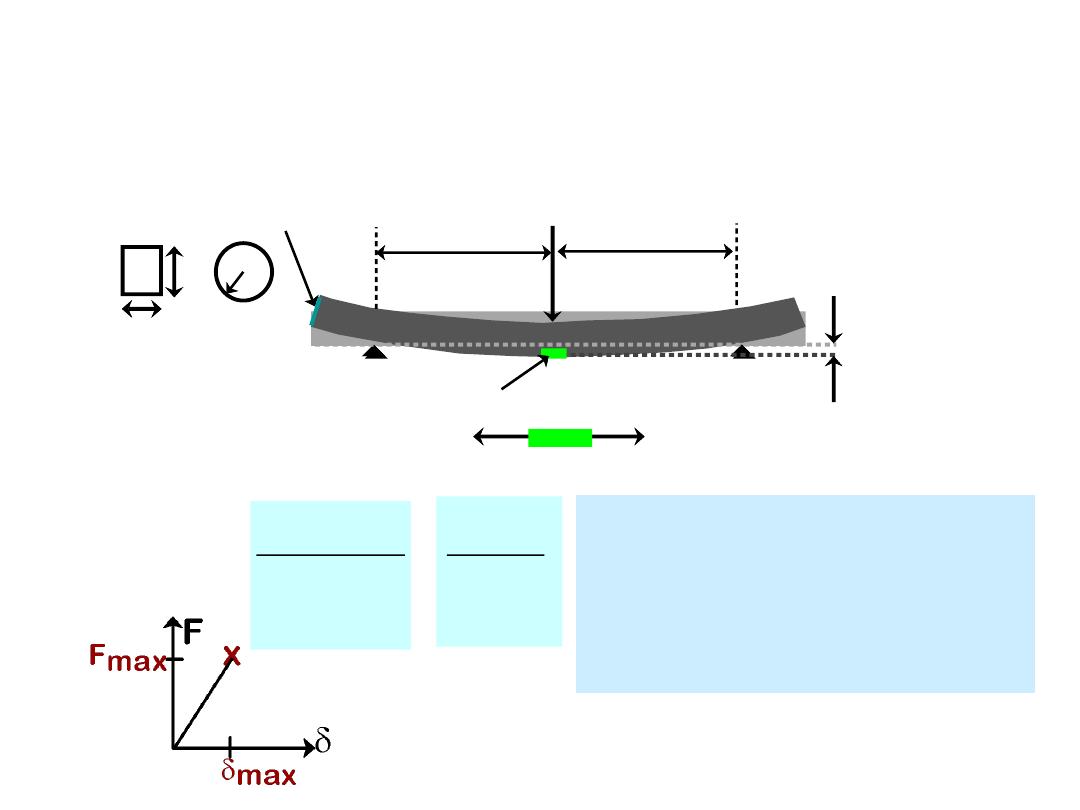
24
•
3-point bend test to measure room T strength.
F
L/2
L/2
cross section
R
b
d
rect.
circ.
location of max tension
•
Flexural strength:
rect.
s
fs
s
m
fail
1.5F
max
L
bd
2
F
max
L
R
3
•
Typ. values:
Material
sfs(MPa) E(GPa)
Si nitride
Si carbide
Al oxide
glass (soda)
700-1000
550-860
275-550
69
300
430
390
69
Adapted from Fig.
12.29,
Callister 6e.
Data from Table 12.5,
Callister 6e.
MEASURING STRENGTH
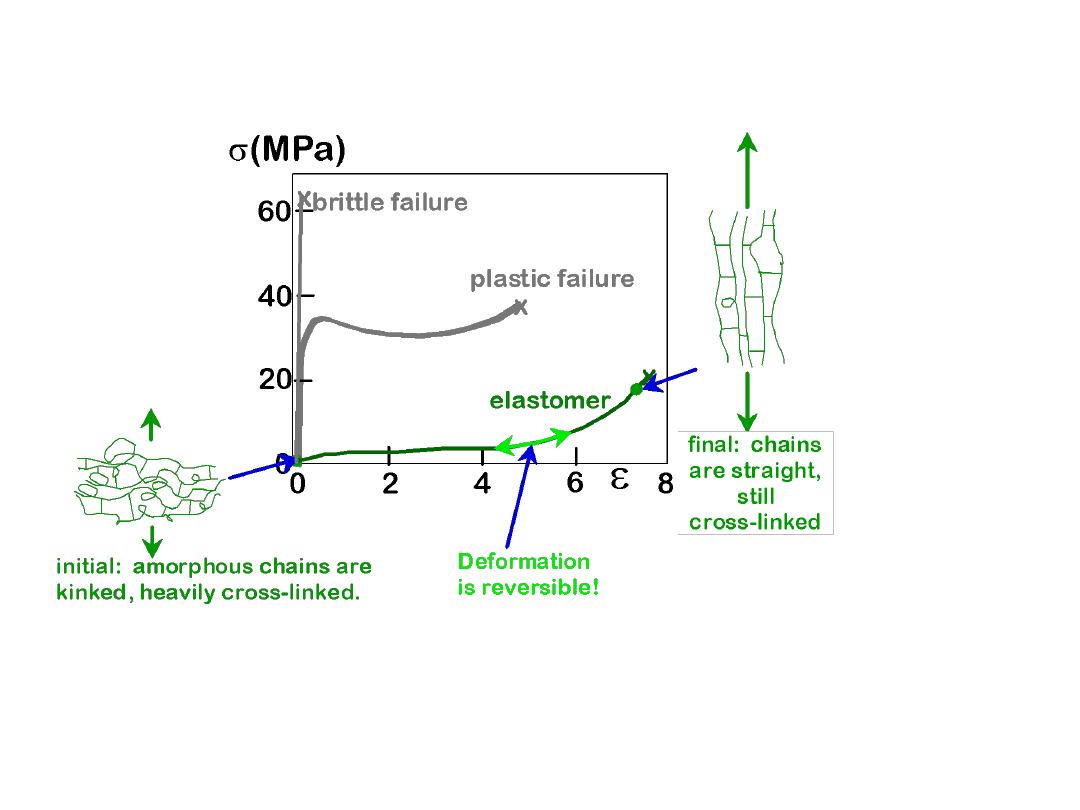
25
• Compare to responses of other polymers:
--brittle response
(aligned, cross linked & networked case)
--plastic response
(semi-crystalline case)
Stress-strain curves
adapted from Fig.
15.1,
Callister 6e.
Inset figures along
elastomer curve
(green) adapted from
Fig. 15.14,
Callister
6e. (Fig. 15.14 is from
Z.D. Jastrzebski,
The
Nature and Properties
of Engineering
Materials, 3rd ed.,
John Wiley and Sons,
1987.)
TENSILE RESPONSE: ELASTOMER
CASE
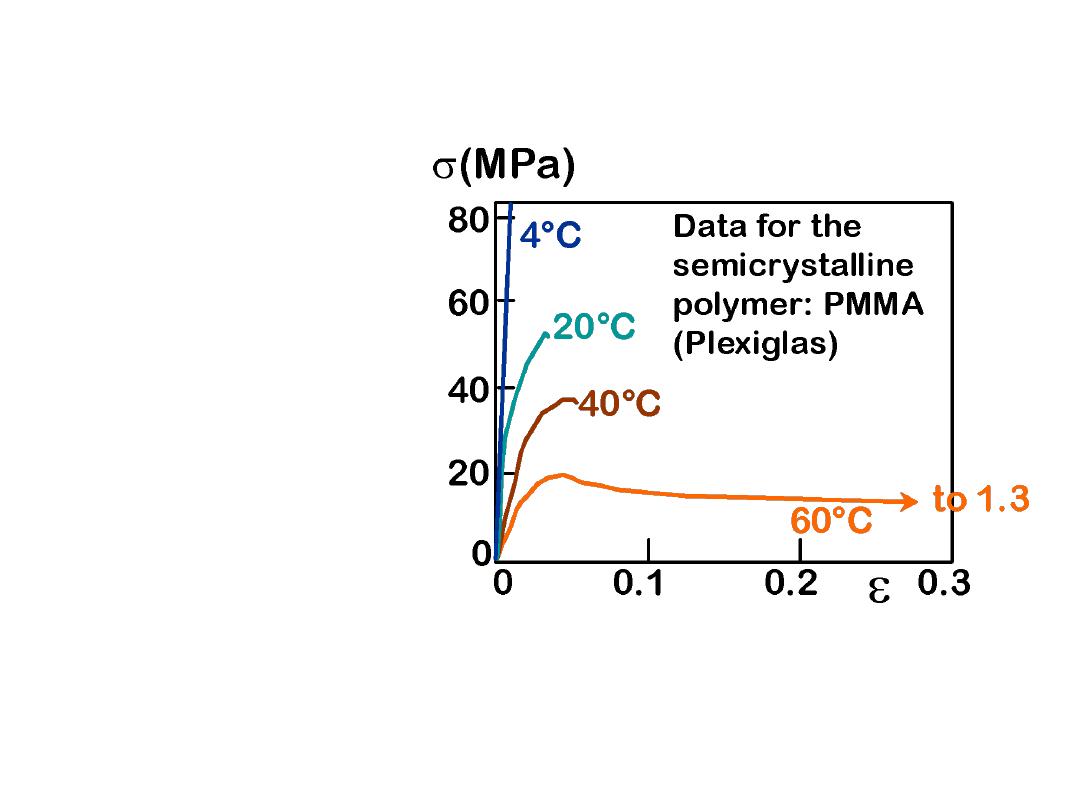
26
• Decreasing T...
--increases E
--increases TS
--decreases %EL
• Increasing
strain rate...
--same effects
as decreasing T.
Adapted from Fig. 15.3,
Callister 6e. (Fig. 15.3 is from T.S. Carswell
and J.K. Nason, 'Effect of Environmental Conditions on the
Mechanical Properties of Organic Plastics",
Symposium on Plastics,
American Society for Testing and Materials, Philadelphia, PA, 1944.)
T AND STRAIN RATE:
THERMOPLASTICS
27
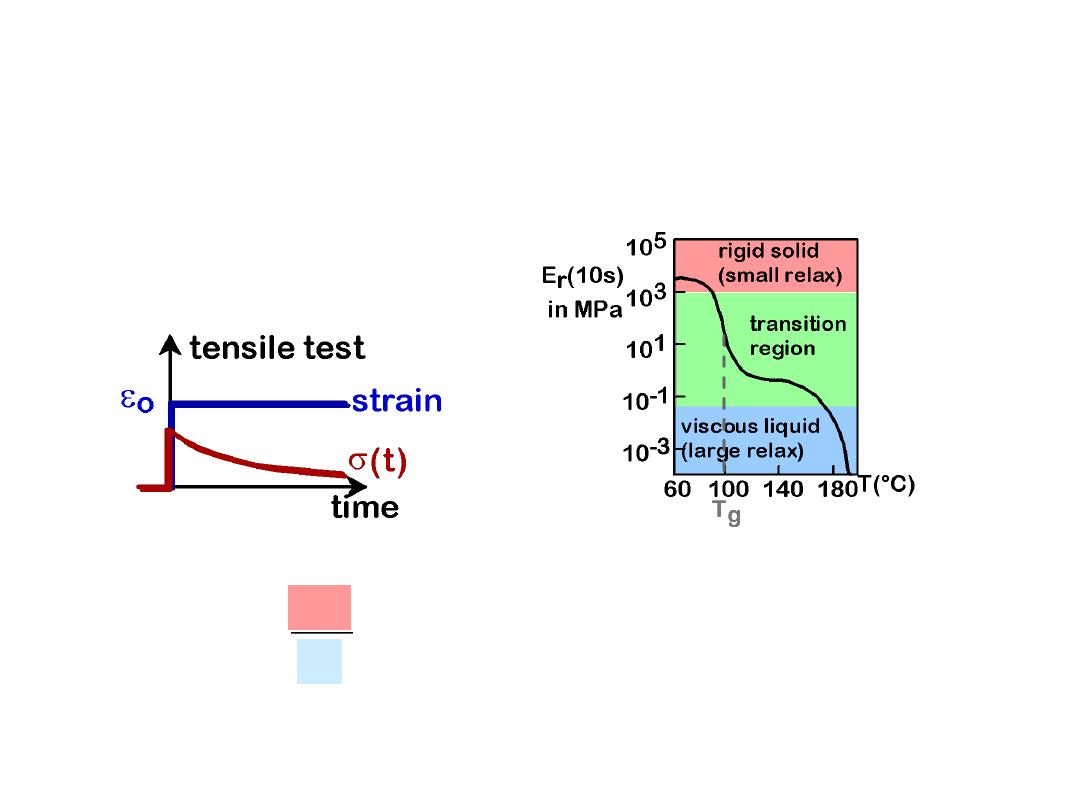
•
Stress relaxation test
:
E
r
(t )
s(t )
e
o
--strain to
e
o
and hold.
--observe decrease in
stress with time.
•
Relaxation modulus
:
• Data:
Large drop in E
r
for T > T
g
.
(amorphous
polystyrene)
•
Sample T
g
(C) values:
PE (low M
w
)
PE (high M
w
)
PVC
PS
PC
-110
- 90
+ 87
+100
+150
Adapted from Fig.
15.7,
Callister 6e.
(Fig. 15.7 is from
A.V. Tobolsky,
Properties and
Structures of
Polymers, John
Wiley and Sons,
Inc., 1960.)
Selected values
from Table 15.2,
Callister 6e.
TIME DEPENDENT
DEFORMATION
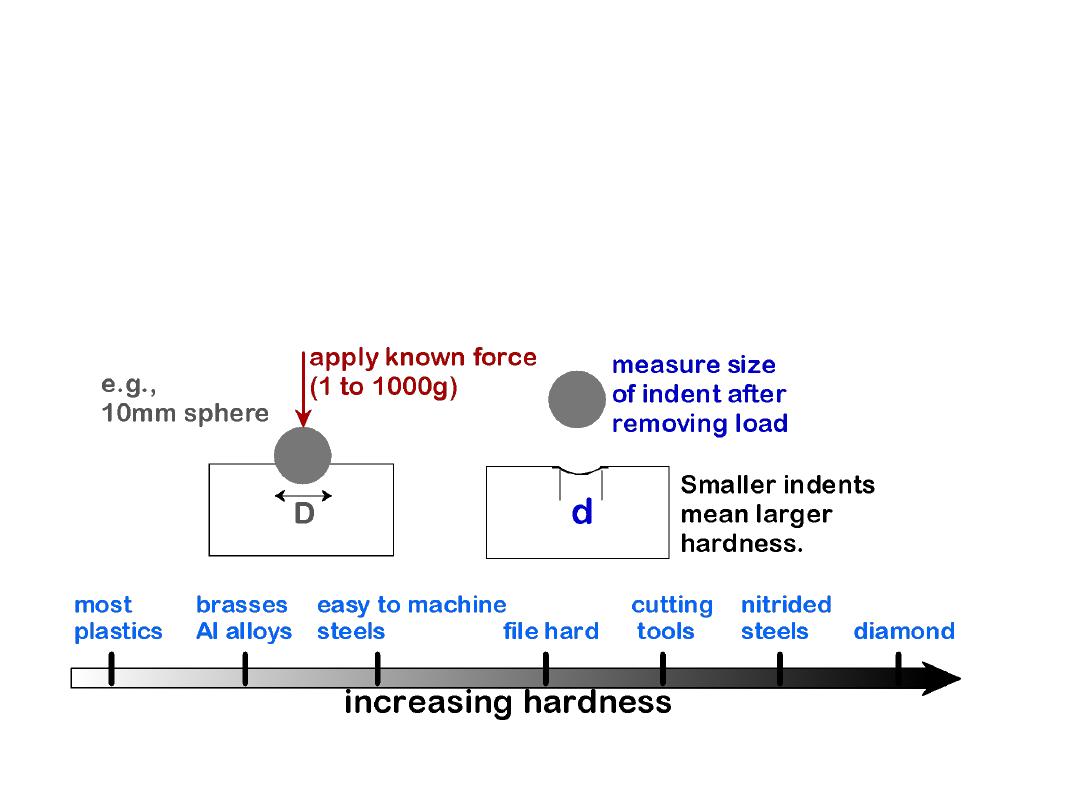
• Resistance to permanently indenting the surface.
• Large hardness means:
--resistance to plastic deformation or cracking in
compression.
--better wear properties.
28
Adapted from Fig. 6.18,
Callister 6e. (Fig. 6.18 is adapted from G.F. Kinney, Engineering Properties
and Applications of Plastics, p. 202, John Wiley and Sons, 1957.)
HARDNESS
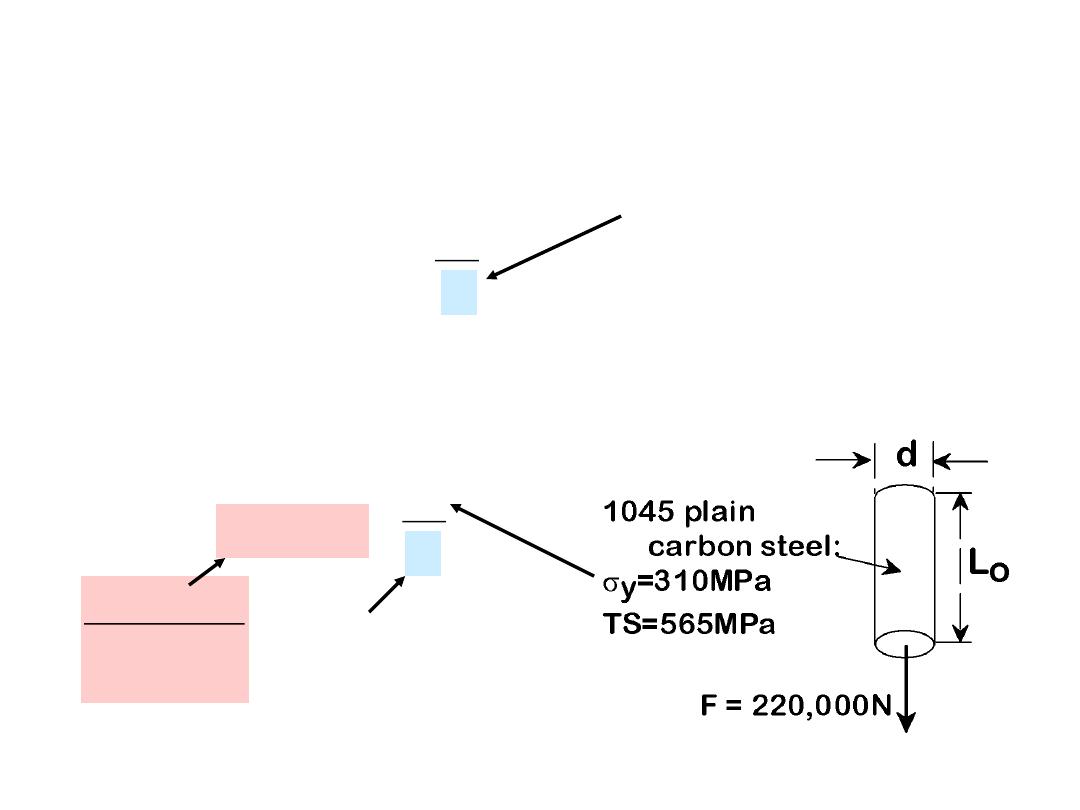
• Design uncertainties mean we do not push the limit.
•
Factor of safety, N
29
s
working
s
y
N
Often N is
between
1.2 and 4
• Ex:
Calculate a diameter, d, to ensure that yield does
not occur in the 1045 carbon steel rod below. Use a
factor of safety of 5.
s
working
s
y
N
220, 000N
d
2
/ 4
5
DESIGN OR SAFETY FACTORS
41
Thermal Expansion
Materials change size when temperature
is changed
)
(
α
initial
final
initial
initial
final
T
T
linear coefficient of
thermal expansion (1/K or 1/
°C)
T
initial
T
final
initial
final
T
final
>
T
initial
42
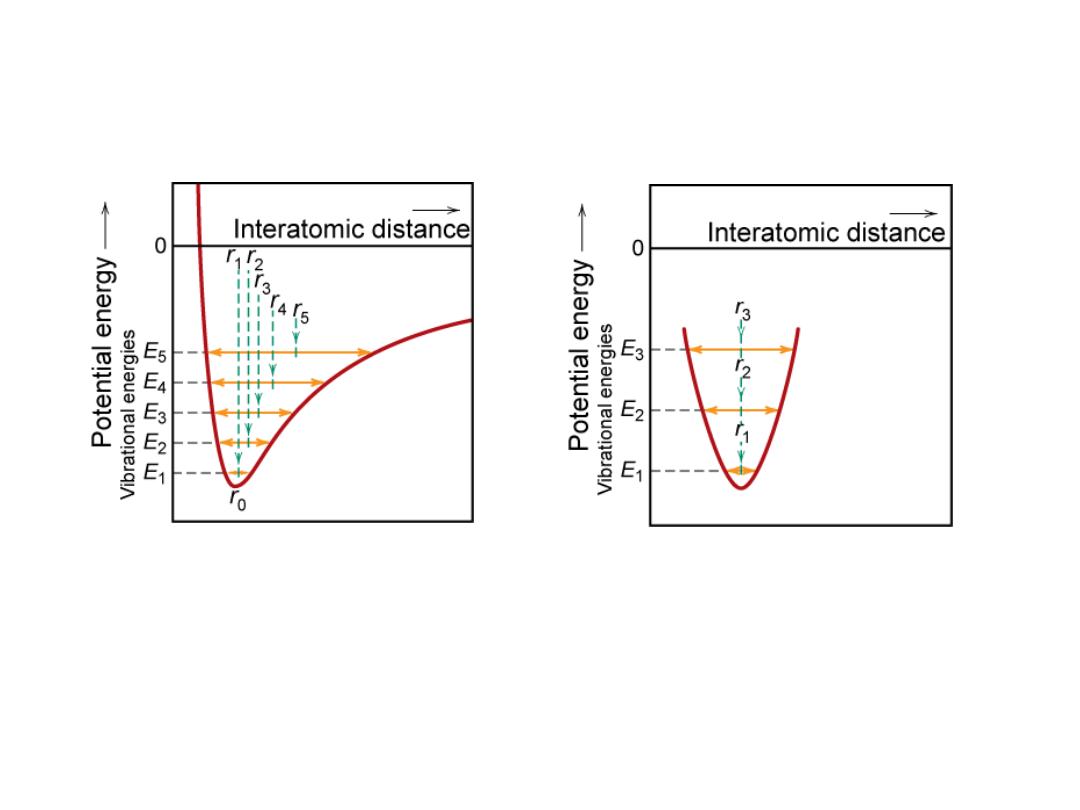
Atomic Perspective: Thermal Expansion
Asymmetric curve:
-- increase temperature,
-- increase in interatomic
separation
-- thermal expansion
Symmetric curve:
-- increase temperature,
-- no increase in interatomic
separation
-- no thermal expansion

43
Coefficient of Thermal Expansion: Comparison
• Q: Why does
a
generally decrease
with increasing
bond energy?
Polypropylene
145-180
Polyethylene
106-198
Polystyrene
90-150
Teflon
126-216
• Polymers
• Ceramics
Magnesia (MgO)
13.5
Alumina (Al
2
O
3
)
7.6
Soda-lime glass
9
Silica (cryst. SiO
2
)
0.4
• Metals
Aluminum
23.6
Steel
12
Tungsten
4.5
Gold
14.2
a
(10
-6
/
C)
at room T
Material
Polymers have larger
a
values because of
weak secondary bonds
inc
re
as
ing
a

44
• Occur due to:
-- restrained thermal expansion/contraction
-- temperature gradients that lead to differential
dimensional changes
Thermal Stresses
Ea (T
0
T
f
)
Ea DT
Thermal stress
s

•
Stress
and
strain
: These are size-independent
measures of load and displacement, respectively.
•
Elastic
behavior: This reversible behavior often
shows a linear relation between stress and strain.
To minimize deformation, select a material with a
large elastic modulus (E or G).
•
Plastic
behavior: This permanent deformation
behavior occurs when the tensile (or compressive)
uniaxial stress reaches
s
y
.
30
•
Toughness
: The energy needed to break a unit
volume of material.
•
Ductility
: The plastic strain at failure.
SUMMARY