


925 W. Kenyon Ave., Unit 12
Englewood, Colorado 80110
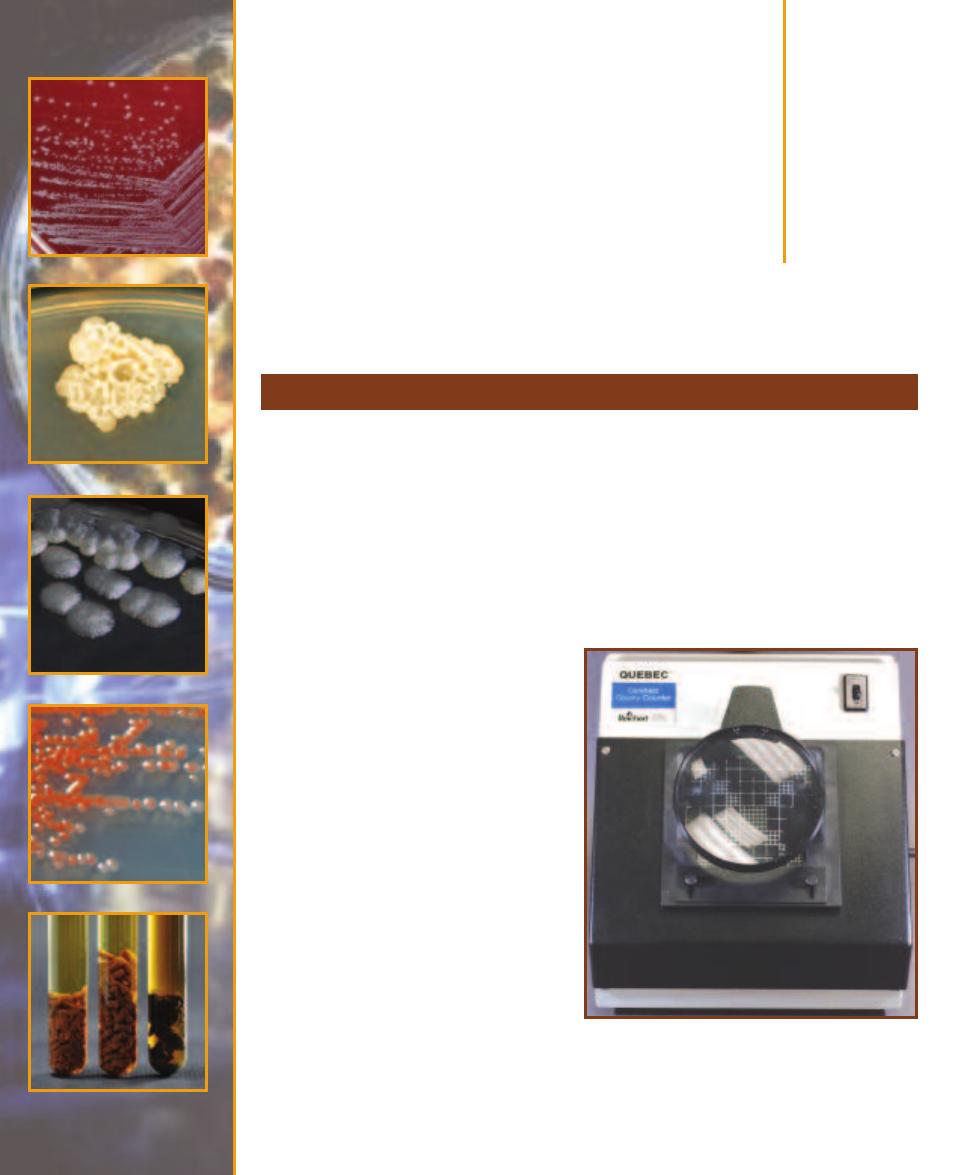
A Photographic Atlas
f o r t h e
Microbiology
L A B O R A T O R Y
4th EDITION
Michael J. Leboffe
San Diego City College
Burton E. Pierce

Copyright © 2011 by Morton Publishing Company
ISBN: 978-089582-872-9
Library of Congress Control Number: 2010942487
10 9 8 7 6 5 4 3 2 1
All rights reserved. No part of this publication may be reproduced,
stored in a retrieval system, or transmitted, in any form or by any
means, electronic, mechanical, photocopying, recording, or otherwise,
without the prior written permission of the copyright owners.
Printed in the United States of America
Book Team
Publisher:
Douglas N. Morton
Biology Editor:
David Ferguson
Production Manager:
Joanne Saliger
Production Assistant:
Desiree Coscia
Typography:
Ash Street Typecrafters, Inc.
Cover Design:
Bob Schram, Bookends, Inc.
This book is dedicated to
Michele Elaine Pierce (1950–2010)
Loving wife, mother, and grandmother,
former student,
and skilled and caring Nurse Practitioner
A
s my fingers hit the keys of my laptop, I realize that I am, after a long, seemingly endless process,
within days of completing the fourth edition of A Photographic Atlas for the Microbiology
Laboratory. At this stage of a book’s life, a new edition ought to be just a matter of touching up
the previous edition. Or so I thought. But, PAML 4e has presented its share of challenges.
First, and foremost, is the fact that this is the first project (out of three previous Atlas editions, three
editions of Microbiology Laboratory Theory and Application, one edition of Microbiology Laboratory
Theory and Application—Brief Edition, and three editions of Exercises for the Laboratory Manual) I
have worked on without my longtime friend and colleague, Burt Pierce. Burt made the courageous and
healthy decision to retire and move to Portland, OR, to enjoy life with his wife, three dogs, and two cats
(notice the absence of any microbes in the family). Yet, while he was not an active participant, his influ-
ence remains in this edition. A majority of his written and photographic contributions are still here, and
I have tried to live up to his eye for detail, his demand for excellence, and his dedication to knowing our
readership. His philosophy was that even though we were writing for undergraduate students and not
professionals, there was no excuse for “dumbing down the material”; he had a steadfast faith in the
intelligence of our readers. Long ago, I was impressed by a speech made by a former San Diego City
College president, in which she appealed for teamwork between faculty, staff and administration with
the phrase, “None of us is as good as all of us.” She was right about the college, and it has been equally
applicable to the books Burt and I have co-authored. Our skills complemented one another and the
books were clearly better because of it. But beyond the production of books, and the associated blood,
sweat, and tears, what mattered most was the friendship and satisfaction of a collective “job well done.”
As the old beer commercial said, “(Burt), I love ya, man!”
A second challenge was that the Atlas has slowly accumulated much more text in support of the
photos. When we did the first edition, the Atlas broke the mold at Morton Publishing by including
much more explanatory text for the photos beyond captions. (In fact, the captions were criticized for
not being very informative!) Burt and I maintained that microbiology, by nature, is very different from
other disciplines and required background material; a photo album wouldn’t suffice. While we have
continued to add photos and expand coverage in each edition, the increase in text has considerably
outpaced the photos. (For those of you who have been with us through all four editions, compare
photograph sizes in the first edition to this one!) Writing is not easy for me. But, I’ve finished reading
the proofs and somehow it got written. Chalk up another challenge being met.
In many ways, this edition is like a first edition. Coverage has expanded from being primarily a
book with a medical microbiology emphasis to one with a more balanced emphasis of microbiology in
general. Following is a summary of the major changes in this edition.
䢇
The original artwork has been replaced with professional renderings. Many of the older photos
have been replaced with newer ones, and many new photos have been added. Between the artwork
and photos, over 200 new figures (representing approximately 25% of the total) can be found.
䢇
Four new chapters have been added. Chapter 1 provides an introduction to microbiology and
presents a perspective on the places Bacteria and Archaea occupy in the biological world. It also
expands the justification for the book’s reorganization (see the following paragraph). Chapter 11
covers some of the most important groups within the Domain Bacteria. Chapters 13 and 14 do the
same for the Domains Archaea and Eukarya, respectively.
䢇
Chapters have been resequenced to better reflect the process followed by a working microbiologist,
so isolation techniques and selective media have been moved up to Chapter 2. The chapters that
follow continue the process: growth patterns (Chapter 3), microscopy and staining (Chapters 4, 5,
and 6), biochemical testing (Chapter 7), serological testing (Chapter 8), and molecular techniques
(Chapter 9). The next chapters cover the microbes themselves, beginning with viruses (Chapter 10),
iii
Preface

and followed by chapters on Domain Bacteria (Chapters
11 and 12), Domain Archaea (Chapter 13), and Domain
Eukarya (Chapters 14 through 17). The book finishes with
chapters on quantitative techniques (Chapter 18), medical,
environmental, and food microbiology (Chapter 19), and
host defenses (Chapter 20). An appendix illustrating major
metabolic pathways combined with tables to show reac-
tants and products of each completes this edition.
䢇
In addition to the brand new chapters, artwork, and pho-
tos, some new topics have been added to established chap-
ters. Other topics have been expanded. Chapter 2 now
includes Bacteroides Bile Esculin Agar, BIGGY Agar,
Columbia CNA Agar, and Pseudomonas Isolation Agar.
Cooked Meat Broth was added to Chapter 3 and the
anaerobic jar has been updated. Chapter 4 has expanded
coverage of electron microscopy. Parasporal crystal stain
and cell wall stain have been added to Chapter 6. DNase
Test Agar has been expanded in Chapter 7. The Winograd-
sky column and sulfur cycle have been added to Chap-
ter19, and the nitrogen cycle has been expanded.
Speaking for both Burt and me, we hope you find this edition
of the Photographic Atlas for the Microbiology Laboratory
more useful than ever.
Mike
La Mesa, CA
December 2010
Acknowledgments
Each edition builds upon previous editions and the list of people
to whom we are indebted for their generous help and support
continues to get longer and longer. These gracious people have
been acknowledged in previous editions and, sadly, due to space
limitations, must be thanked collectively here. Please realize this
doesn’t mean we have forgotten you! That being said, following
are the people who have contributed to this edition.
As always, thanks to the Morton Publishing team for their
continued support and friendship. Specifically, thanks to Doug
Morton, President, and Chrissy DeMier, Business Manager, for
their outstanding business model; to David Ferguson, Biology
Editor, for his advice, patience, and gentle nudging (keep the
elbows and stick down, though); Carter Fenton, Sales and
Marketing Manager for executing the business model; Desireé
Coscia, Project Manager for her assistance and attention to
details; and all of Morton Publishing Company employees for
their hard work and good nature. Thanks also goes to the
extended Morton Publishing book team: Joanne Saliger and
Patricia Billiot of Ash Street Typecrafters, Inc. for their charac-
teristically high quality production and proofreading talents;
Bob Schram of Bookends, Inc. for the cover design; and Marina
Siuchong of Imagineering Art for the new artwork.
Reviewers of the 3rd edition were Susan Koval (University
of Western Ontario), Kathleen Richardson (Portland Commu-
nity College), and Marva Volk (Tulsa Community College).
Thanks to all of you for your thoughtful and useful comments
for improving the Atlas.
Thanks to our colleagues in the Biology Department at San
Diego City College for their understanding, support, and in
some cases, participation. In alphabetical order: Donna DiPaolo,
Anita Hettena, Tom Kaido, Sabine Kurz-Camacho, Roya
Lahijani, Martha Myers, Debra Reed, Erin Rempala, David
Singer, Minou Spradley (Acting Dean, but still one of us),
Laura Steininger, Eri Suzuki, Carla Sweet, Hector Valtierra,
Muu Vu, and Gary Wisehart.
Thanks to Patricia McVay, Lab Director, AnnaLiza
Manlutack, and Let Negado of the San Diego Public Health
Laboratory for supplying slide preparations.
The following people contributed materials, time, cultures,
photographs, and/or expertise to this project: Esther Angert
(Cornell University Department of Microbiology), Steve Barlow
(San Diego State University Electron Microscope Facility),
Steven Byers, John Crawley (Focus Design), Marlene DeMers
(San Diego State University Microbiology Department), Tom
Gibson (San Diego State University Microbiology Department),
Christie Hendrix (National Park Service), Hisahi ITO (Mitsu -
bishi Gas Chemical Company, Inc., Oxygen Absorbers Division),
Ian and Todd Malloy (Crikey Adventure Tours), Chris Nutting
(Ward’s Natural Science), Robert van Ommering (van Ommer-
ing Dairy) Tammy Wert (National Park Service), and Karsten
Zengler (University of California San Diego, Department of
Bioengineering). Individuals whose public domain photos we
used are acknowledged in the photo’s caption.
We also appreciate the contributions made by General
Microbiology classes at San Diego City College over the years.
You have shown us firsthand how to improve our books.
I owe a lot to friends, many of whom have been mentioned
previously, who have made valiant efforts to keep me grounded
and maintain a healthy perspective on Life (which is still a
work in progress). Thanks in particular to Kristine Rickards
and Alexandria Murallo.
And finally, thanks to the ever-growing gang of Leboffes:
wife Karen, children Nathan, Alicia, Eric, and by marriage,
Jenny, and grandchildren Selah and Josiah. Special thanks go to
Alicia for reading the manuscript with a fresh, well-educated
eye. It really drove home the point that my babies have grown
up when one is correcting my grammar!
Alas, even with all this help, I have come to grips with the
realization that nothing is perfect, and that I am ultimately
responsible for errors, omissions, and poor judgment in the
final product. Comments for improvement are welcome. I can
be reached through the publisher.
iv
䢇
A Photographic Atlas for the Microbiology Laboratory
SECTION
1
Introduction
1
A Tribute to the Past, a Moment in the Present, and an Openness to the Future
1
SECTION
2
Isolation Techniques and Selective Media
5
Streak Plate Methods of Isolation
5
Bacteroides Bile Esculin (BBE) Agar
7
Bismuth Sulfite Glucose Glycine Yeast (BiGGY) Agar
7
Chocolate II Agar
8
Columbia CNA With 5% Sheep Blood Agar
9
Desoxycholate Agar
9
Endo Agar
11
Eosin Methylene Blue Agar
11
Hektoen Enteric Agar
12
MacConkey Agar
13
Mannitol Salt Agar
14
Phenylethyl Alcohol Agar
15
Pseudomonas Isolation Agar
15
Salmonella–Shigella Agar
16
Tellurite Glycine Agar
16
TCBS Agar
17
Xylose Lysine Desoxycholate Agar
18
SECTION
3
Bacterial Growth
19
Growth Patterns on Agar
19
Growth Patterns in Broth
27
Aerotolerance
28
Cultivation of Anaerobes—Anaerobic Jar
29
Cultivation of Anaerobes—Thioglycollate Broth
30
Cultivation of Anaerobes—Cooked Meat Broth
30
SECTION
4
Microscopy
31
Types of Microscopy
31
SECTION
5
Bacterial Cellular Morphology and Simple Stains
37
Simple Stains
37
Negative Stain
38
A Gallery of Bacterial Cell Diversity
39
v
Contents
SECTION
6
Bacterial Cell Structures
and Differential Stains
45
Gram Stain
45
Acid-fast Stain
49
Capsule Stain
51
Endospore Stain
51
Flagella Stain
54
Wet Mount and Hanging Drop Preparations
55
Miscellaneous Structures
56
SECTION
7
Differential Media
57
API 20 E Identification System
for Enterobacteriaceae and
Other Gram-negative Rods
57
Bacitracin Susceptibility Test
58
-Lactamase Test
59
Bile Esculin Test
60
Blood Agar
61
CAMP Test
62
Casein Hydrolysis Test
62
Catalase Test
63
Citrate Utilization Test
64
Coagulase Tests
65
BBL CRYSTAL™ Identification System—
Enteric/Nonfermenter (E/NF)
66
Decarboxylation Test
67
DNase Test Agars
68
Enterotube
®
II
70
Fermentation Tests (Purple Broth
and Phenol Red Broth)
71
Gelatinase Hydrolysis Test
73
Indole Test (SIM Medium)
74
Kligler’s Iron Agar
75
Lipase Test
77
Litmus Milk Medium
78
Lysine Iron Agar
80
Malonate Test
81
Methyl Red Test
82
Motility Test
82
Nitrate Reduction Test
83
Novobiocin Susceptibility Test
85
ONPG Test
86
Optochin Susceptibility Test
87
Oxidase Test
87
Oxidation–Fermentation Test
89
Phenylalanine Deaminase Test
91
PYR Test
91
Starch Hydrolysis
92
Sulfur Reduction (SIM Medium)
93
SXT Susceptibility Test
94
Triple Sugar Iron Agar
95
Urease Tests
96
Voges-Proskauer Test
98
SECTION
8
Serology
99
Precipitation Reactions
99
Agglutination Reactions
101
Enzyme-Linked
Immunosorbent Assay (ELISA)
103
Fluorescent Antibody (FA) Technique
105
Western Blot Technique
106
SECTION
9
Molecular Techniques
109
DNA Extraction
109
Electrophoresis
110
Polymerase Chain Reaction
111
DNA Sequencing
112
Ultraviolet Radiation Damage and Repair
114
Ames Test
115
SECTION
10
Viruses
117
Introduction to Viruses
117
Human Immunodeficiency Virus (HIV)
119
Viral Cytopathic Effects in Cell Culture
120
Hemadsorption in Cell Culture
122
vi
䢇
A Photographic Atlas for the Microbiology Laboratory
vi
SECTION
11
Domain Bacteria
123
Phylum Aquificae
123
Phylum Thermotogae
123
Phylum “Deinococcus-Thermus”
124
Phylum Chloroflexi
125
Phylum Spirochaetes
125
Phylum Cyanobacteria
125
Phylum Proteobacteria
127
Phylum Firmicutes
130
Phylum Actinobacteria
131
SECTION
12
Bacterial Pathogens
133
Aeromonas hydrophila
133
Bacillus anthracis
134
Bacillus cereus
135
Bacteroides fragilis
136
Bordetella pertussis
136
Borrelia burgdorferi
137
Brucella melitensis
138
Campylobacter jejuni
139
Citrobacter spp.
139
Clostridium botulinum
140
Clostridium difficile
141
Clostridium perfringens
142
Clostridium septicum
142
Clostridium tetani
143
Corynebacterium diphtheriae
143
Escherichia coli
144
Fusobacterium spp.
145
Haemophilus influenzae
146
Helicobacter pylori
147
Klebsiella pneumoniae
147
Legionella pneumophila
148
Listeria monocytogenes
149
Mycobacterium leprae
150
Mycobacterium tuberculosis
150
Neisseria gonorrhoeae
151
Neisseria meningitidis
152
Nocardia asteroides
152
Proteus mirabilis
153
Pseudomonas aeruginosa
154
Salmonella enteritidis
155
Salmonella typhi
156
Shigella dysenteriae
156
Staphylococcus aureus
157
Staphylococcus epidermidis
158
Streptococcus agalactiae
159
Streptococcus mutans
159
Streptococcus pneumoniae
160
Streptococcus pyogenes
161
Treponema pallidum
162
Vibrio cholerae
162
Yersinia pestis
163
SECTION
13
Domain Archaea
165
Crenarchaeota
165
Euryarchaeota
166
SECTION
14
Domain Eukarya:
Simple Eukaryotes
169
Group Excavata
169
Group Chromalveolata
170
Group Rhizaria
174
Group Archaeplastida
174
Group Unikonta
176
SECTION
15
Fungi of Clinical Importance
183
Yeasts of Medical Importance
183
Monomorphic Molds
185
Dimorphic Molds
190
SECTION
16
Protozoans of
Clinical Importance
193
Group Excavata
193
Group Chromalveolata
196
Group Unikonta
200
SECTION
17
Parasitic Helminths
203
Trematode Parasites Found
in Clinical Specimens
203
Cestode Parasites Found
in Clinical Specimens
207
Nematode Parasites Found
in Clinical Specimens
211
Contents
䢇
vii
vii
SECTION
18
Quantitative Microbiology
217
Standard Plate Count (Viable Count)
217
Direct Count (Petroff-Hausser)
219
Plaque Assay for Determination
of Phage Titer
220
Urine Streak—Semiquantitative Method
222
SECTION
19
Medical, Environmental,
and Food Microbiology
223
Antimicrobial Susceptibility Test
(Kirby-Bauer Method and E Test)
223
Sample Collection and Transport
225
Environmental Sampling:
The RODAC™ Plate
226
Colilert
®
Method
for Testing Drinking Water
227
Membrane Filter Technique
228
Multiple Tube Fermentation Method
for Total Coliform Determination
229
Bioluminescence
231
Winogradsky Column
231
Nitrogen Cycle
232
Sulfur Cycle—Introduction
235
Methylene Blue Reductase Test
237
Snyder Test
237
SECTION
20
Host Defenses
239
Differential Blood Cell Count
239
Other Immune Cells and Organs
241
APPENDIX
A
Biochemical Pathways
243
Oxidation of Glucose: Glycolysis,
Entner-Doudoroff, and
Pentose-Phosphase Pathways
243
Oxidation of Pyruvate:
The Krebs Cycle and Fermentation
246
References
251
Index
253
viii
Introduction
The authors are of the generation where biologists placed all organisms into two kingdoms: the
Animal Kingdom and the Plant Kingdom. It was easy—anything that wasn’t an animal was a
plant, and so we had such diverse organisms as bacteria, yeast, and mushrooms placed in the same
kingdom as roses and pine trees. Oh, and of course the simple nucleated cells (such as Euglena and
Amoeba) were categorized based on their degree of resemblance to plants or animals.
Then came a big revolution based on information revealed by the electron microscope. It was
found that some cells (subsequently called prokaryotes) do not have their genetic material encased
inside a membranous nucleus. In fact, those that do (subsequently called eukaryotes) not only
enclose their nucleus in membrane, but also have all kinds of membranous compartments within
their cytoplasm. Endoplasmic reticulum, Golgi bodies, mitochondria, and many other structures
were seen or clearly seen for the first time. Prokaryotes had none of these structures; their interior
is very simple by comparison. (Figure 1-1 illustrates the obvious difference between prokaryotic
and eukaryotic cells visible with the light microscope: size.) This led to a restructuring of biology
at the kingdom level based on presence or absence of a nucleus, mode of nutrition (photosynthetic
or not), and degree of complexity. All prokaryotes (bacteria) were placed in the Kingdom Monera.
The eukaryotes were divided into four kingdoms: Fungi, Metaphyta (for the plants), Metazoa
(for the animals), and Protista
(for all the simple eukaryotes
that didn’t “fit” in the other three
kingdoms). This system served us
well over the second half of the
20th Century.
New technology allowing us to
compare organisms at the molecu-
lar level led to another big revolu-
tion—including the addition of a
taxonomic category more inclusive
than Kingdom: the Domain. Based
on comparisons of ribosomal RNA
(rRNA), DNA, and proteins, the
biological world is now seen to
be composed of three Domains:
Bacteria (comprising all bacteria),
Archaea (formerly the archaeo -
bacteria), and Eukarya (comprising
A Tribute to the Past, a Moment in the Present,
and an Openness to the Future
1
S E C T I O N
1
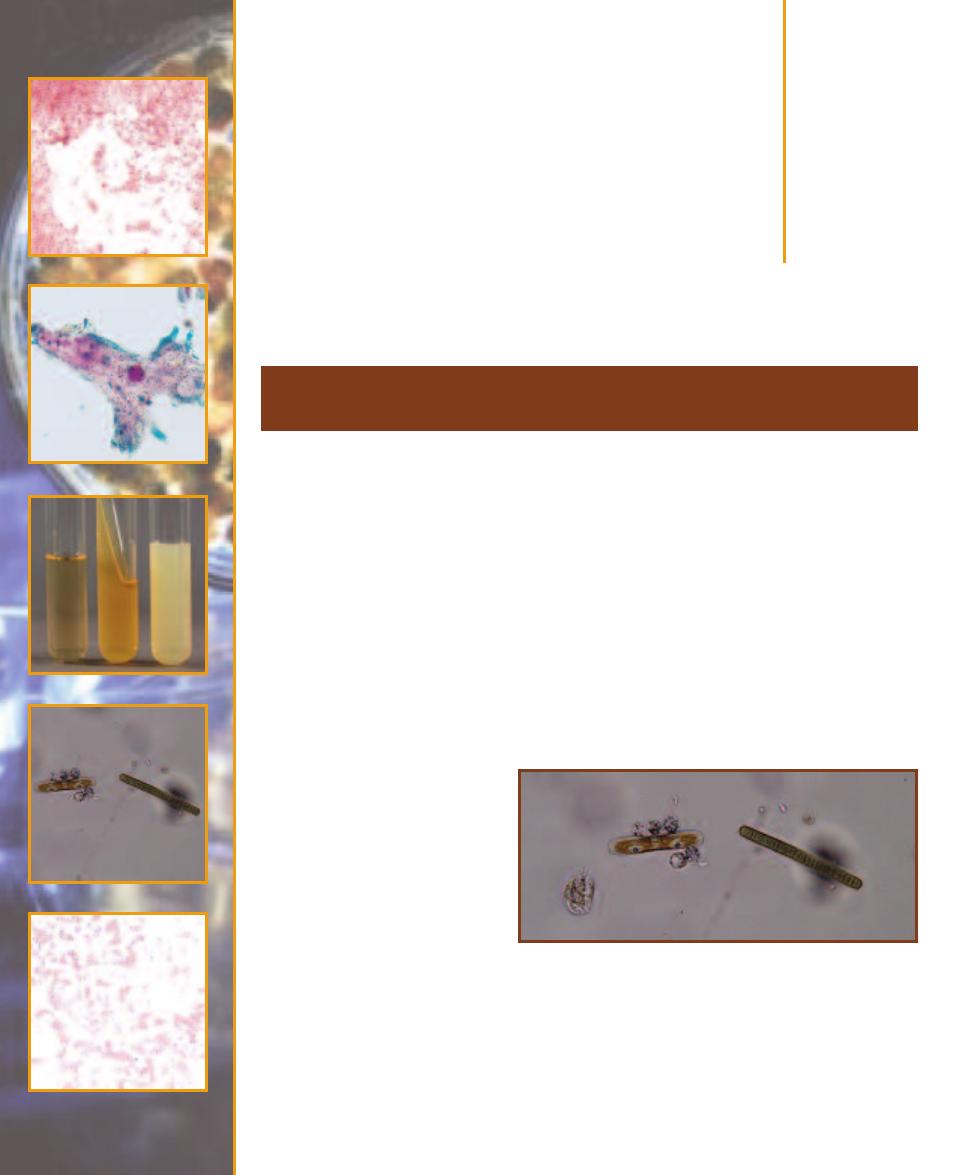
1-1
C
OMPARISON OF
P
ROKARYOTIC AND
E
UKARYOTIC
C
ELL
S
IZES
This micrograph is from a marine mud sample. Various cell types are
bunched because the slide was drying out. The eukaryotic cells are the
ciliate at the left, the golden brown diatom to its right, and the five,
unidentified protists clinging to the diatom (gasping for oxygen it pro-
duces during photosynthesis!). Nuclei are not visible in these particular
eukaryotes because the slide was unstained. The prokaryotes are the
white specks (which are various bacteria) in the background and the
greenish cyanobacterium at the right. The cyanobacterium looks to be
the largest of the bunch, but it is a filament of cells stacked crosswise
along the filament. Each cell is really small and lacks a nucleus.

all eukaryotes.) A short list of defining characteristics for each
domain is given in Table 1-1; Figure 1-2 illustrates their evo-
lutionary history (phylogeny) as currently perceived by many
biologists.
1
Examples are shown in Figures 1-3 through 1-6.
In the past editions we have ignored this new system,
in large part because our emphasis had been on medical
bacteriology. But now we have expanded coverage of the
Atlas to include more aspects of general microbiology and
this demands that we address the current taxonomy. Of
course, we realize that even as this is being written, micro-
bial taxonomy itself is being rewritten to be in line with new
information gathered by working microbiologists. This is
the way of Science.
A final note relates to the use of the term “prokaryote.”
There is a growing sentiment among microbiologists that
“prokaryote” is not a valid designation because it includes
representatives (Bacteria and Archaea) on different, ancient
lineages. This is an argument to be settled by others more
knowledgeable than we. So, until a decision is reached,
we will continue to use “prokaryote” because it is such a
convenient term!
The Working Microbiologist
Traditionally, the role of microbiologists has been to isolate
a microbe from a mixed culture, grow the isolate in a pure
culture, and then identify the isolate. A culture is composed
of one or more kinds of organisms grown under artificial,
but suitable conditions. If more than one species is present,
it is said to be a mixed culture. If only one species is present,
it is said to be a pure culture. Cultures may be grown in or
on different kinds of media. A medium is the material that
contains essential resources for growth (a carbon source, a
nitrogen source, a sulfur source, and so on). Gases, such as
oxygen, carbon dioxide, or diatomic nitrogen are generally
not supplied by the medium, but must be made available in
the culture container. A medium may be solid with nutrients
2
䢇
A Photographic Atlas for the Microbiology Laboratory
Characteristic (Present in at Least Some Species)
Bacteria
Archaea
Eukarya
Genetic
Genome surrounded by nuclear membrane
No
No
Yes
Membrane-bound organelles
No
No
Yes
DNA molecule covalently bonded into circular form
Yes
Yes
No
Introns common
No
No
Yes
Operons present
Yes
Yes
No
Plasmids present
Yes
Yes
Rare
mRNA processing (poly-A tail and capping)
No
No
Yes
Metabolism
Oxygenic photosynthesis
Yes
No
Yes
Anoxygenic photosynthesis
Yes
No
No
Methanogenesis
No
Yes
No
Nitrogen fixation
Yes
Yes
No
Chemolithotrophic metabolism
Yes
Yes
No
Cell Structure
Cell wall of peptidoglycan
Most
Never
Never
Ester-linked, straight-chained fatty acids in membrane
Yes
No
Yes
Ether-linked, branched aliphatic chains in membrane
No
Yes
No
Ribosome type
70S
70S
80S
Comparison of the Three Domains
T A B L E
1-1
1
Other interpretations for the relationships between the three domains have
been made. No consensus has been reached on which, if any, is most correct.
SECTION 1
䢇
Introduction
䢇
3
Archaea
Bacteria
Eukarya
Crenarchaeota
Euryarchaeota
Sulfur thermophiles
Thermophiles
Halophiles
Methanogens
Opisthokonts
Stramenopiles
Amoebozoans
Alveolates
Unikonta
Chromalveolata
Archaeplastida
Rhizaria
Excavata
Green
nonsulfur
bacteria
Gram-positive
bacteria
Proteobacteria/
mitochondria
Cyanobacteria/
chloroplast
Spirochetes
Thermus/
Deinococcus
Thermotoga
Aquifex
Universal
common
ancestor
Prokaryotes
Eukaryotes
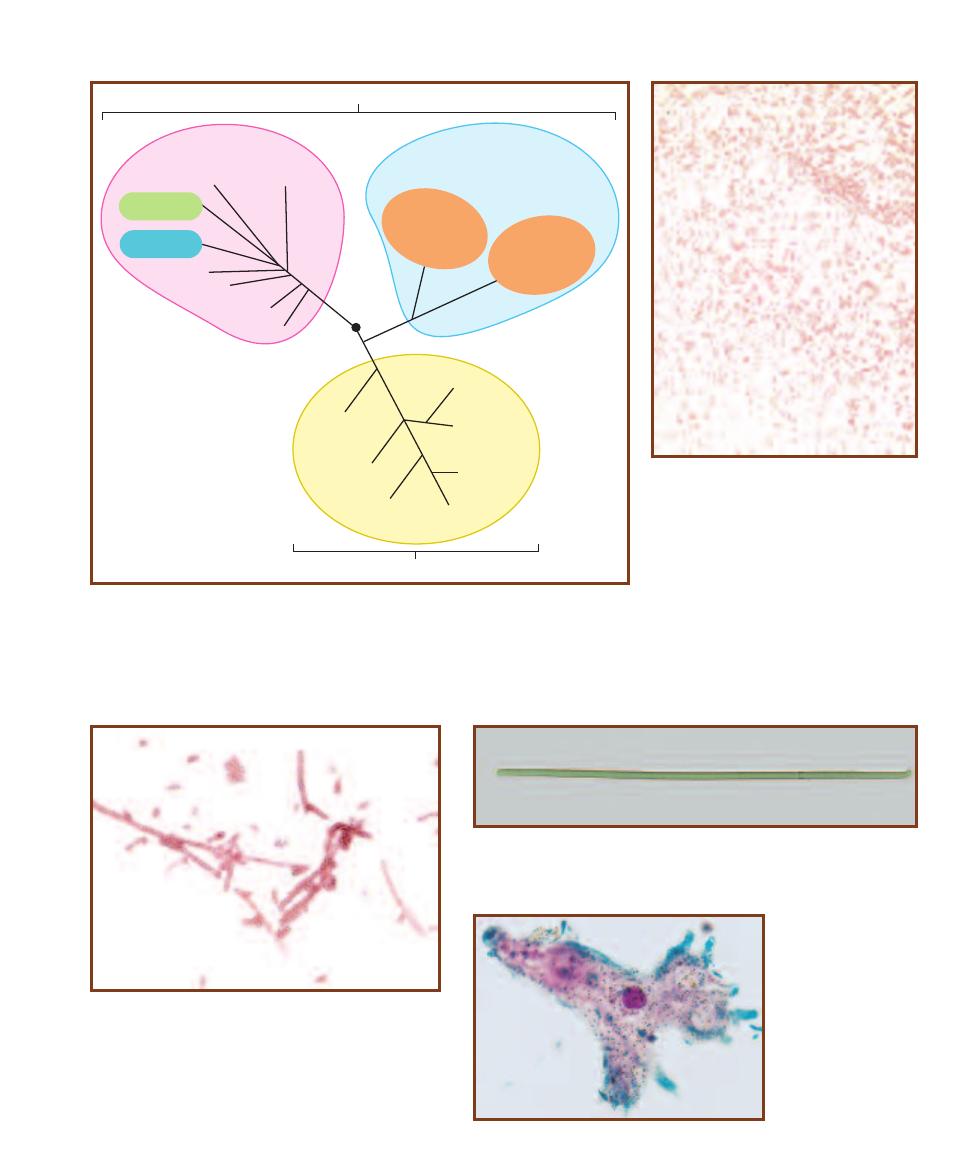
1-2
T
HE
T
HREE
D
OMAINS OF
L
IFE
The domains are based on 16S (in prokaryotes) and 18S
(in eukaryotes) rRNA sequence comparisons. The Archaea and Bacteria are prokaryotic domains,
each containing an as yet undetermined number of kingdoms. (Bacteria may comprise as many
as 50 kingdoms, Archaea perhaps only 3.) Kingdom Eukarya includes all the eukaryotic organisms
and is divided into the familiar Fungus, Plant, and Animal Kingdoms. The remaining eukaryotes
(“Protists”) will probably be broken up into 5 or more kingdoms as we learn more. Every kingdom
has species that are “microbial” with the exception of the Plant and Animal Kingdoms.
1-3
E
SCHERICHIA COLI
—A B
ACTERIUM
E. coli is the most studied and most well known
of the Bacteria. It is a natural inhabitant of
mammalian colons. Cells are about 1.0 µm
wide by 2.0 to 4.0 µm long.
1-4
O
SCILLATORIA
—A C
YANOBACTERIUM
Oscillatoria is a filamentous
cyanobacterium. That is, the organism is made of cells stacked together. This
specimen is about 90 cells long, with individual cells about 7 µm wide. These
Bacteria are capable of photosynthesis that produces oxygen, just like plants.
1-6
A
MOEBA
—A
E
UKARYOTIC
M
ICROBE
Amoebas are charac -
terized by the ability to
stream their cytoplasm
and produce pseudo pods
that allow them to move
and engulf prey. Notice
the nucleus within the
cell.
1-5
H
ALOBACTERIUM
—A
N
A
RCHAEAN
Halobacterium is
an extreme halophile. That is, it grows in environments with
salt concentrations approaching 25%. Gas vacuoles in the cells
cause them to float to the surface.
suspended in the solidifying agent (usually agar) or it may be
a liquid broth. Examples are shown in Figures 1-7 and 1-8.
Identification requires a pure culture because most
microbes are not identified based on appearance or posses-
sion of unique physical structures (Figure 1-9). Rather, the
identification (diagnostic) process usually involves running
biochemical tests and recording the results. When enough
relevant tests are run, the results are compared to a standard
database of test results. The best fit leads to a provisional
identification of the isolate. If the tests are run on a mixed
culture, the results will be a composite of both organisms’
positive results and will most likely lead to misidentifica-
tion! The famous German physician and microbiologist
Robert Koch said, “The pure culture is the foun dation for
all research on infectious disease.” He was right.
All this background is a way of giving this edition of the
Atlas some structure that wasn’t present in previous editions.
The earlier sections are devoted primarily to bacteriology
and progress as a working microbiologist would as he/she
tries to identify an isolate. Section 2 addresses methods by
which bacteria can be isolated. Once isolation is achieved,
Section 3 provides information on how species can be differ-
entiated based on macroscopic features. Sections 4, 5, and 6
carry this preliminary identification process on to include
microscopic features. Section 7 presents differential physio-
logical tests commonly used during the identification process.
Section 8 does the same for diagnostic serological tests. This
is followed by Molecular Techniques (Section 9), which
includes an introduction to some techniques used in identi -
fication and a couple of others that are not. From here, we
depart from the process of diagnostics to the subjects: the
microbes themselves. Section 10 covers viruses, Sections 11
and 12 are devoted to Bacteria, and Section 13 addresses
Archaea. Eukaryotic microbes, which are identified in large
part by microscopic structural features, are covered in
Sections 14 through 17. The Atlas concludes with three
sections devoted to miscellaneous, albeit important, topics:
Quantitative Techniques (Section 18), Medical, Environ -
mental, and Food Microbiology, (Section 19), and Host
Defenses (Section 20).
4
䢇
A Photographic Atlas for the Microbiology Laboratory
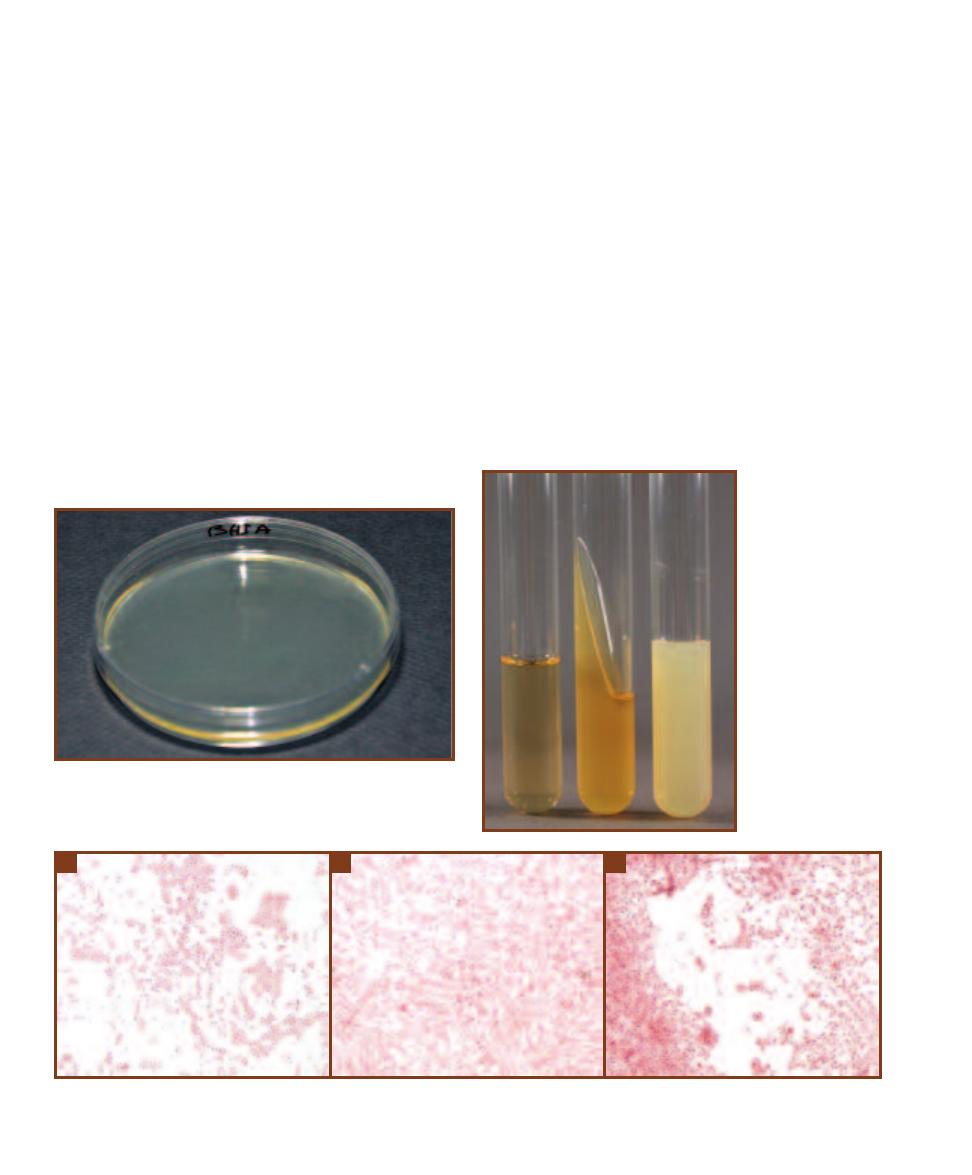
1-7
A
N
A
GAR
P
LATE
BHIA stands for “Brain Heart Infusion Agar.”
The 1.5–2% agar in the medium acts as a solidifying agent to suspend
the nutrients—extracts of brain and heart tissues. Agar plates are usually
used for isolating organisms from a mixed culture (Section 2).
1-8
T
UBED
M
EDIA
From left to right: a
broth, an agar slant, and
an agar deep tube. The
solid media are liquid
when they are removed
from the autoclave
(where they get steril-
ized). Agar deeps are
allowed to cool and
solidify in an upright
position, whereas agar
slants are cooled and
solidified on an angle.
Broths are often used to
produce fresh cultures,
slants are used to main-
tain stock cultures, and
agar deeps are used for
many biochemical tests
requiring low oxygen
levels.
1-9
I
MAGINE
T
RYING TO
I
DENTIFY
T
HESE
T
HREE
B
ACTERIAL
G
ENERA
U
SING
O
NLY
T
HEIR
M
ICROSCOPIC
A
PPEARANCE
!
A
Alcaligenes faecalis.
B
Citrobacter koseri.
C
Salmonella typhimurium.
A
B
C

Isolation
Techniques and
Selective Media
䢇
Purpose
The identification process of an unknown microbe relies on obtaining a pure culture of that organ-
ism. The streak plate method produces individual colonies on an agar plate. A portion of an isolated
colony then may be trans ferred to a sterile medium to start a pure culture.
䢇
Principle
A microbial culture consisting of two or more species is said to be a mixed culture, whereas a
pure culture contains only a single species. Obtaining isolation of individual species from a mixed
sample is generally the first step in identifying an organism. A commonly used isolation technique
is the streak plate.
In the streak plate method of isolation, a bacterial sample (always assumed to be a mixed cul-
ture) is streaked over the surface of a plated agar medium (Figure 2-1). During streak ing, the cell
density decreases, eventually leading to individual cells being deposited separately on the agar sur-
face. Cells that have been sufficiently isolated will grow into colonies consisting only of the original
cell type. Because some colonies form from individual cells and others from pairs, chains, or clusters
of cells, the term colony-forming unit (CFU) is a more correct description of the colony origin.
A common streaking technique is the quadrant method, which uses the four-streak pattern
shown in Figures 2-2 and 2-3. Streaking for isolation is frequently performed on selective media
Streak Plate Methods of Isolation
2
S E C T I O N
5
2-1
S
TREAKING A
P
LATE
Hold the plate comfortably
and streak with the edge of the loop. Be careful not to cut
the agar.
III
II
I
IV
2-2
T
HE
Q
UADRANT
M
ETHOD
As shown, the
quadrant method of streaking for isolation involves
four individual streaks. The best results are obtained
when the loop is flamed between streaks.
designed to encourage growth of certain types of organisms while inhib -
iting growth of others. The selective media considered in this section are
used specifically to isolate pathogenic bacteria and yeast from human or
environmental samples containing a mixture of organisms. Some selec-
tive media contain indicators that expose differences between organisms.
Such media are considered to be selective and differential. See Tables 2-1,
2-2, and 2-3 for summaries of terms related to organisms and media,
and roles of common ingredients found in selective media.
6
䢇
A Photographic Atlas for the Microbiology Laboratory
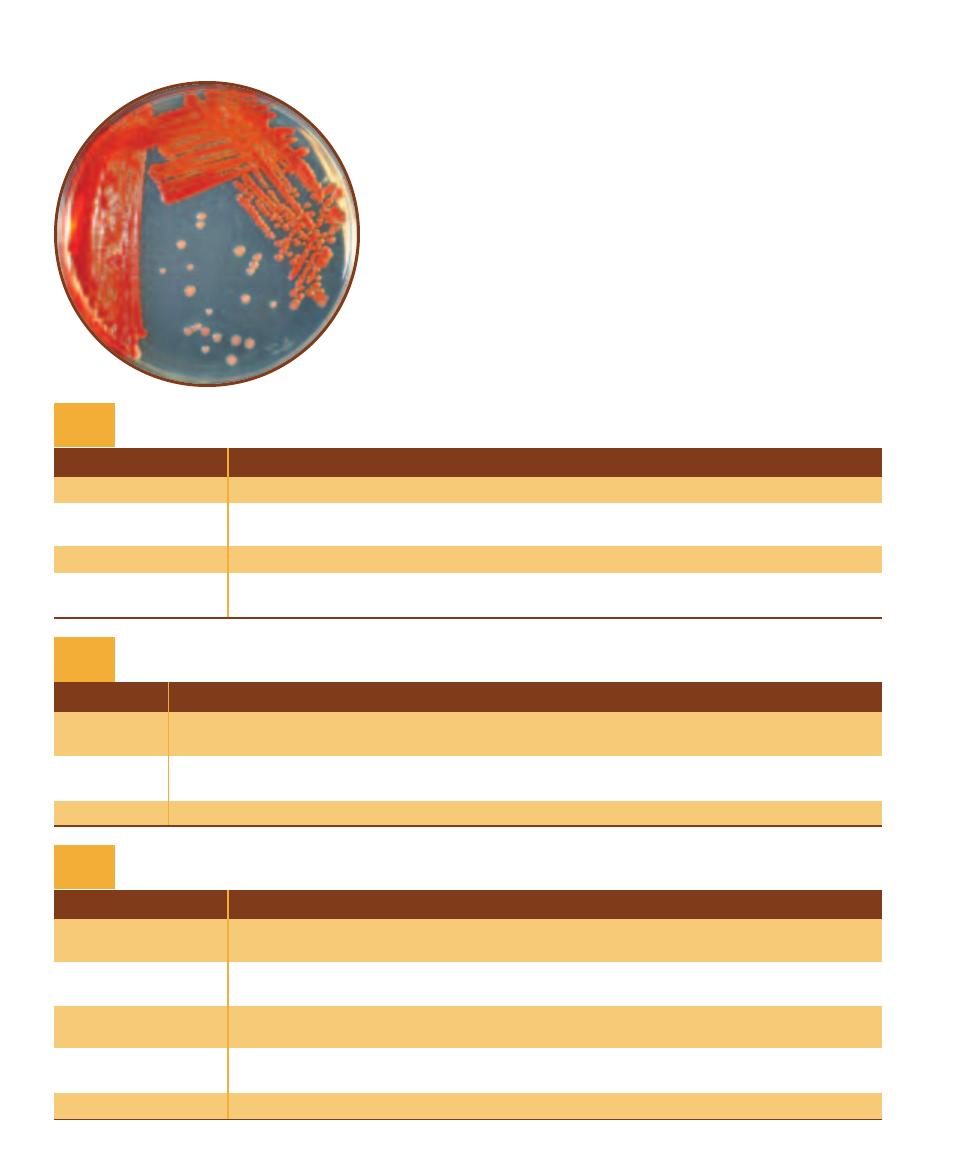
2-3
S
TREAK
P
LATE OF
S
ERRATIA MARCESCENS
Note
the decreasing density of growth in the four streak
patterns. On this plate, isolation is first ob tained in the
fourth streak. A portion of an individual colony may be
transferred to a sterile medium to start a pure culture.
Term
Definition
Defined medium
A medium in which the chemical identity and exact amounts of all ingredients are known.
Undefined (complex)
A medium in which at least one ingredient is of unknown identity or amount.
medium
Selective medium
A medium that contains an inhibitor to prevent or slow the growth of undesired organisms.
Differential medium
A medium that is formulated in such a way that differences in the biochemistry/physiology
between organisms will be detected.
Terms Related to Media
T A B L E
2-1
Term
Definition
Enteric
Refers to any gut bacterium, but usually to members of the Enterobacteriaceae, which are Gram-negative
rods that ferment glucose and share other features in common.
Coliform
A member of the Enterobacteriaceae that produces acid (and gas) from lactose fermentation.
(Note: this shared ability is useful for identification purposes, but is not of taxonomic significance.)
Noncoliform
A member of the Enterobacteriaceae that does not ferment lactose.
Terms Related to Organisms
T A B L E
2-2
Ingredient
Role
pH indicator
Plays a major role in making a medium differential; it detects acid or base production,
depending on the medium.
Bile salts (oxgall)
Used to select against organisms incapable of surviving passage through the gut, especially
Gram-positives.
Lactose
Used as the fermentable carbohydrate in media that differentiate between coliforms and
noncoliforms.
Thiosulfate
Used as an electron acceptor by organisms capable of reducing sulfur to H
2
S.
(in some form)
Ferric ion
Used as an indicator of sulfur reduction by reacting with H
2
S to form a black precipitate.
Common Ingredients in Selective Media and Their Roles
T A B L E
2-3
SECTION 2
䢇
Isolation Techniques and Selective Media
䢇
7
䢇
Purpose
Bacteroides fragilis is the most abundant bacterium found in the human colon,
reaching densities of 10
11
cells per gram of feces! It also is the most common
anaerobic human pathogen. BBE Agar is a selective and differential medium
used for the isolation and presumptive identification of B. fragilis and its close
relatives (B. fragilis group).
䢇
Principle
Nutrition is supplied by a base medium of tryptic soy agar, which includes
digests of casein (milk protein) and soybean meal. Other anaerobes in the
sample are inhibited by oxgall (bile). Facultative anaerobes, also abundant in
feces, compete with obligate anaerobes when grown anaerobically. These are
inhibited by the antibiotic gentamicin. The medium also includes esculin, which
B. fragilis is capable of hydrolyzing to produce esculetin. Esculetin in turn
reacts with ferric ion in the medium to produce a brown coloration around
B. fragilis growth (Figures 7-7 and 7-8). Presumptive identification of B. fragilis
is based on its ability to grow on BBE and darken the medium (Figure 2-4).
Bacteroides Bile Esculin (BBE) Agar
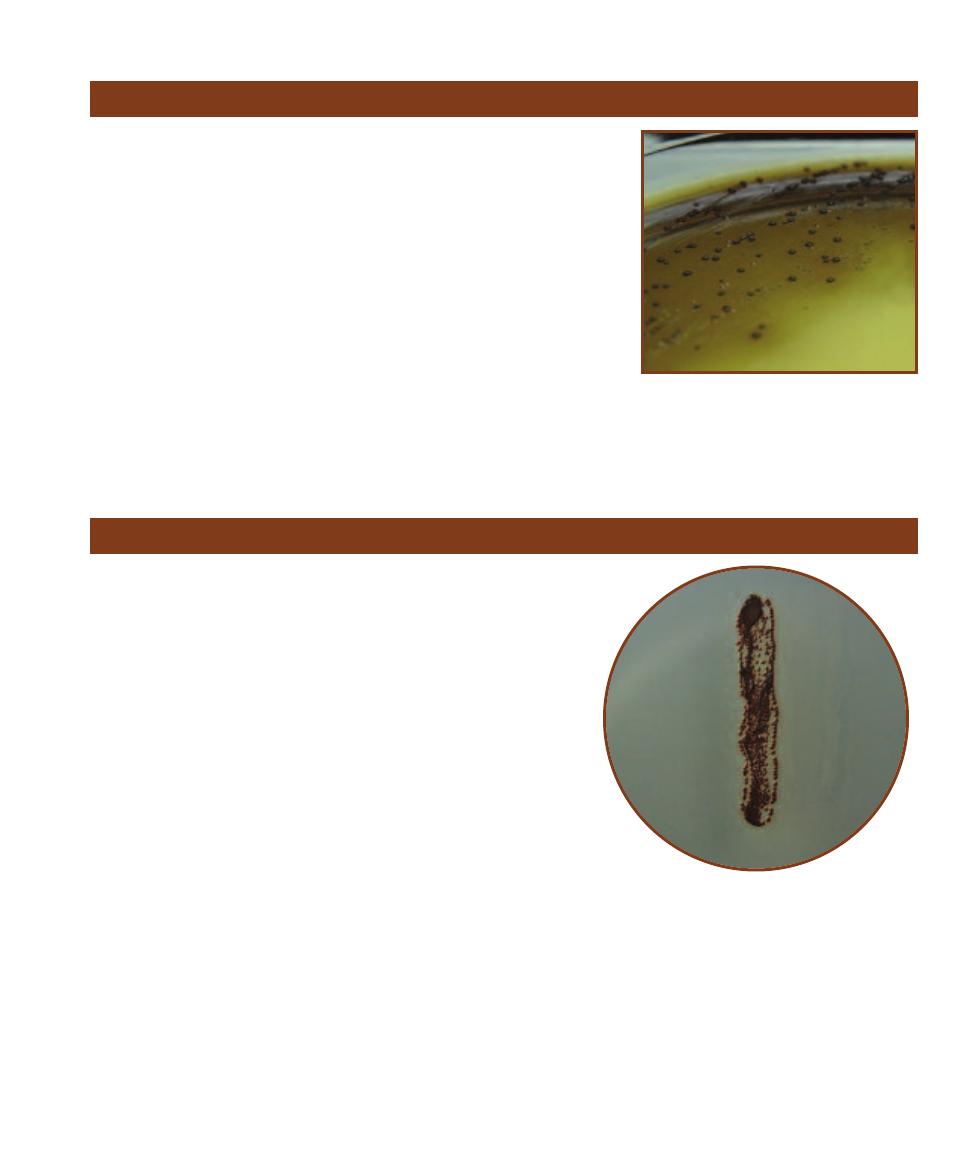
2-4
B
ACTEROIDES
B
ILE
E
SCULIN
A
GAR
This is
a streak plate of a fecal specimen on BBE. The
larger colonies within the darkened medium are
presumptively identified as B. fragilis group. The
smaller, lighter colonies not producing darkening
of the medium are something other than B. fragilis.
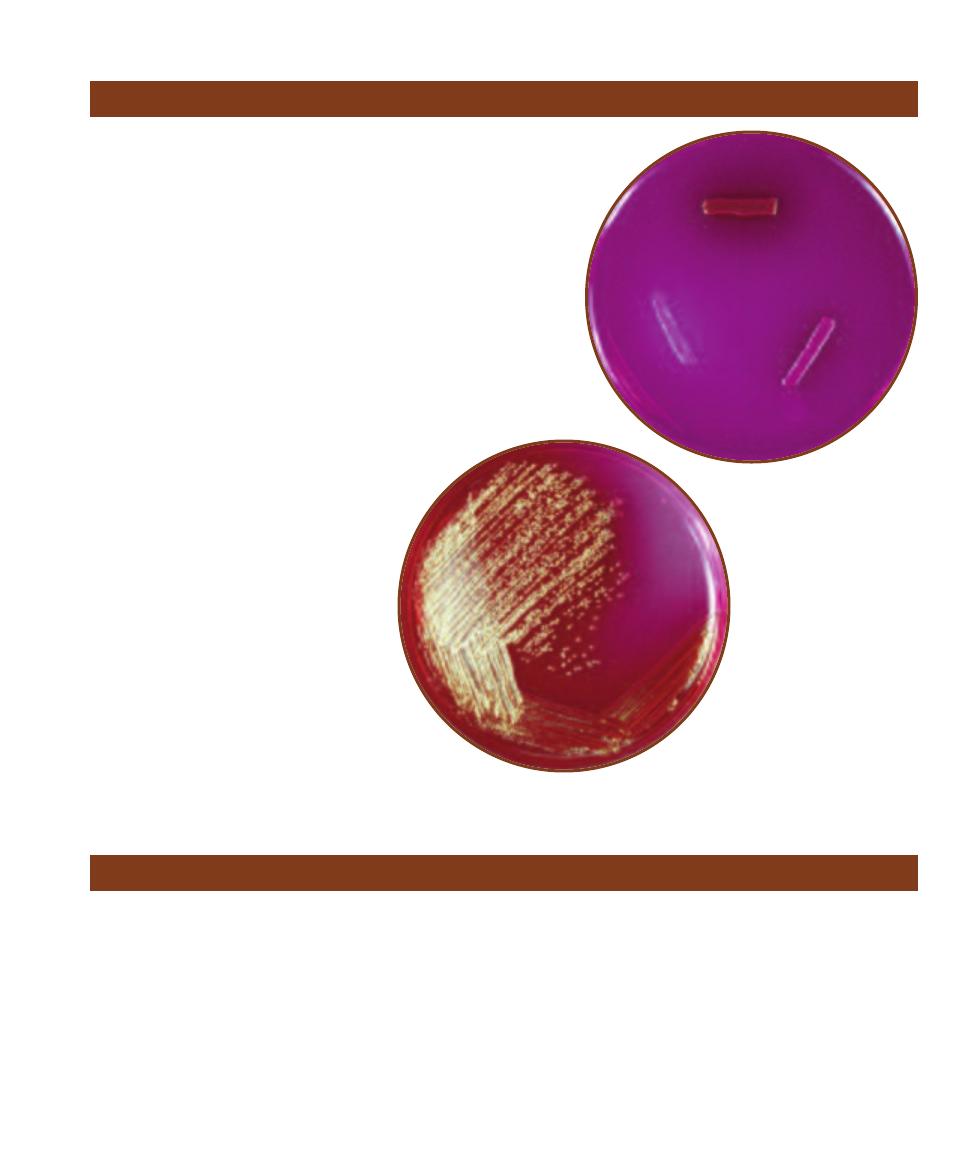
Bismuth Sulfite Glucose Glycine Yeast (BiGGY) Agar
䢇
Purpose
BiGGY Agar is a selective and differential medium used to isolate
species of the yeast Candida. Presumptive identification of Candida
spp. is also possible because of the differential results. Candida
albicans is a common inhabitant of the normal flora of the oral
cavity, gastrointestinal tract, and vagina, but it is also an opportunistic
pathogen, especially in immunocompromised individuals. For more
information, please refer to page 183.
䢇
Principle
Carbon, nitrogen, and other nutrients are supplied by yeast extract
and dextrose, whereas glycine stimulates growth. During autoclaving,
sodium sulfite and bismuth ammonium citrate react to form bismuth
sulfite, which is inhibitory to most bacteria, but not Candida species.
Candida species reduce the bismuth sulfite (at slightly acidic or neutral
pH) and produce a brown pigment within, and sometimes around, the
colonies (Figure 2-5).
2-5
B
I
GGY A
GAR
The ability to grow combined
with the brown color (due to bismuth sulfite reduction)
provides provisional identification of Candida albicans.
䢇
Purpose
Chocolate II Agar is used for isolation and cultivation of Neisseria
(Figures 2-6 and 2-7) and Haemophilus (Figure 2-8) species.
䢇
Principle
Chocolate II Agar is made with a blend of casein, peptones, phosphate
buffer, corn starch, and bovine hemoglobin. It also contains an enrichment
supplement of amino and nucleic acids to encourage growth of Neisseria
species and provide the X and V blood factors required by Haemophilus
species (Figure 12-28).
This plated medium is typically streaked for isolation and incubated
at 37°C in an aerobic environment enriched with carbon dioxide. Sub -
cultures of colonies can then be grown on slanted media and used for
diagnostic purposes.
8
䢇
A Photographic Atlas for the Microbiology Laboratory
2-7
N
EISSERIA MENINGITIDIS ON
C
HOCOLATE
II A
GAR
Compare colony size with Figure 2-6. N. meningitidis
colonies on Chocolate II Agar are typically large, blue-
gray and mucoid.
2-8
H
AEMOPHILUS INFLUENZAE ON
C
HOCOLATE
II
A
GAR
Notice the large, smooth, mucoid colonies.
Chocolate II Agar
2-6
N
EISSERIA GONORRHOEAE ON
C
HOCOLATE
II A
GAR
Compare colony size with Figure 2-7.
N. gonorrhoeae colonies on Chocolate Agar are
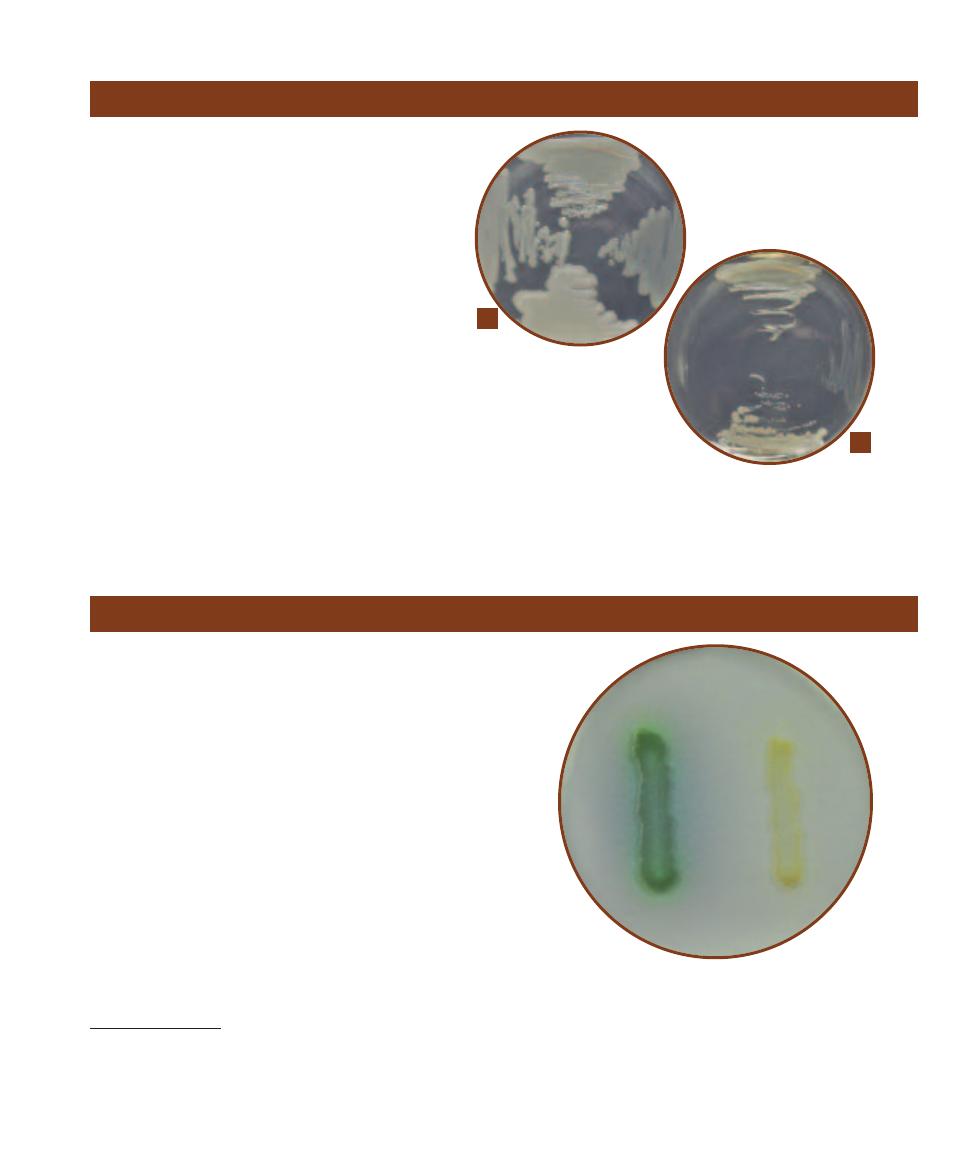
typically colorless.

䢇
Purpose
Columbia CNA with 5% Sheep Blood Agar is used to isolate and
differentiate staphylococci, streptococci, and enterococci, primarily
from clinical specimens.
䢇
Principle
Columbia CNA with 5% Sheep Blood Agar is an un defined, differ-
ential, and selective medium that allows growth of Gram-positive
organisms (especially staphy lococci, streptococci, and enterococci)
and stops or inhibits growth of most Gram-negative organisms
(Figure 2-9). Casein, digest of animal tissue, beef extract, yeast
extract, corn starch, and sheep blood provide a range of carbon
and energy sources to support a wide variety of organisms. In
addition, sheep blood supplies the X factor (heme) and yeast
extract provides B-vitamins. The antibiotics colistin and nalidixic
acid (CNA) act as selective agents against Gram-negative organisms
by affecting membrane integrity and interfering with DNA replica-
tion, respectively. They are particularly effective against Klebsiella,
Proteus, and Pseudomonas species. Further, sheep blood makes
possible differentiation of Gram-positive organisms based on
hemolytic reaction (Figures 7-10 to 7-12).
SECTION 2
䢇
Isolation Techniques and Selective Media
䢇
9
Columbia CNA With 5% Sheep Blood Agar
2-9
C
OLUMBIA
CNA
WITH
5% S
HEEP
B
LOOD
A
GAR
This
plate was inoculated with four organisms—two Gram-positive
cocci, and two Gram-negative rods. Only the Gram-positive
organisms (left and top quadrants) grow well on the Columbia
CNA agar. The two Gram-negatives either didn’t grow (bottom)
or grew poorly (right). Further, the top Gram-positive is -
hemolytic, whereas the one on the left is nonhemolytic.
Desoxycholate Agar
䢇
Purpose
Desoxycholate (DOC) Agar is used for isolation and differ-
entiation among the Enterobacteriaceae. It is also used to
detect coliform bacteria in dairy products.
䢇
Principle
Desoxycholate Agar is a selective and differential medium
containing lactose, sodium desoxycholate, and neutral red
dye. Lactose is a fermentable carbohydrate, desoxycholate is
a Gram-positive inhibitor, and neutral red, which is color-
less above pH 6.8 and red below, is added as a pH indicator.
Neutral red will reveal lactose fermentation (Figure 2-10)
by turning the bacterial growth red where acid products
have lowered the pH (Figures 2-11 and 2-12). Lactose non-
fermenters will remain their natural color or the color of the
medium. Thus, the characteristics to look for on DOC are
the quality of growth and color production.
10
䢇
A Photographic Atlas for the Microbiology Laboratory
O
HOCH
2
HO
OH
OH
OH
b-D-Glucose
O
HOCH
2
HO
OH
OH
OH
b-D-Galactose
O
HOCH
2
HO
OH
OH
O
HOCH
2
OH
OH
OH
b-D-Lactose
O
b-galactosidase
H
2
O
O
HOCH
2
HO
OH
OH
OH
a-D-Glucose
Mutarotation
Glycolysis
O
P OCH
2
HO
OH
OH
OH
Glucose-6-P
ATP
O
HOCH
2
HO
OH
OH
O P
Glucose-1-P
Galactokinase
Phospho-
glucomutase
ADP
C
CH3
O
COO
-
Pyruvate
R COOH
Hexokinase
O
HOCH
2
HO
OH
OH
Galactose-1-P
O P
Epimerase
Mutarotation
Fermentation
ATP
ADP
2ADP
2NAD
+
NADH+H+
2ATP
Organic Acid
(lowers pH)
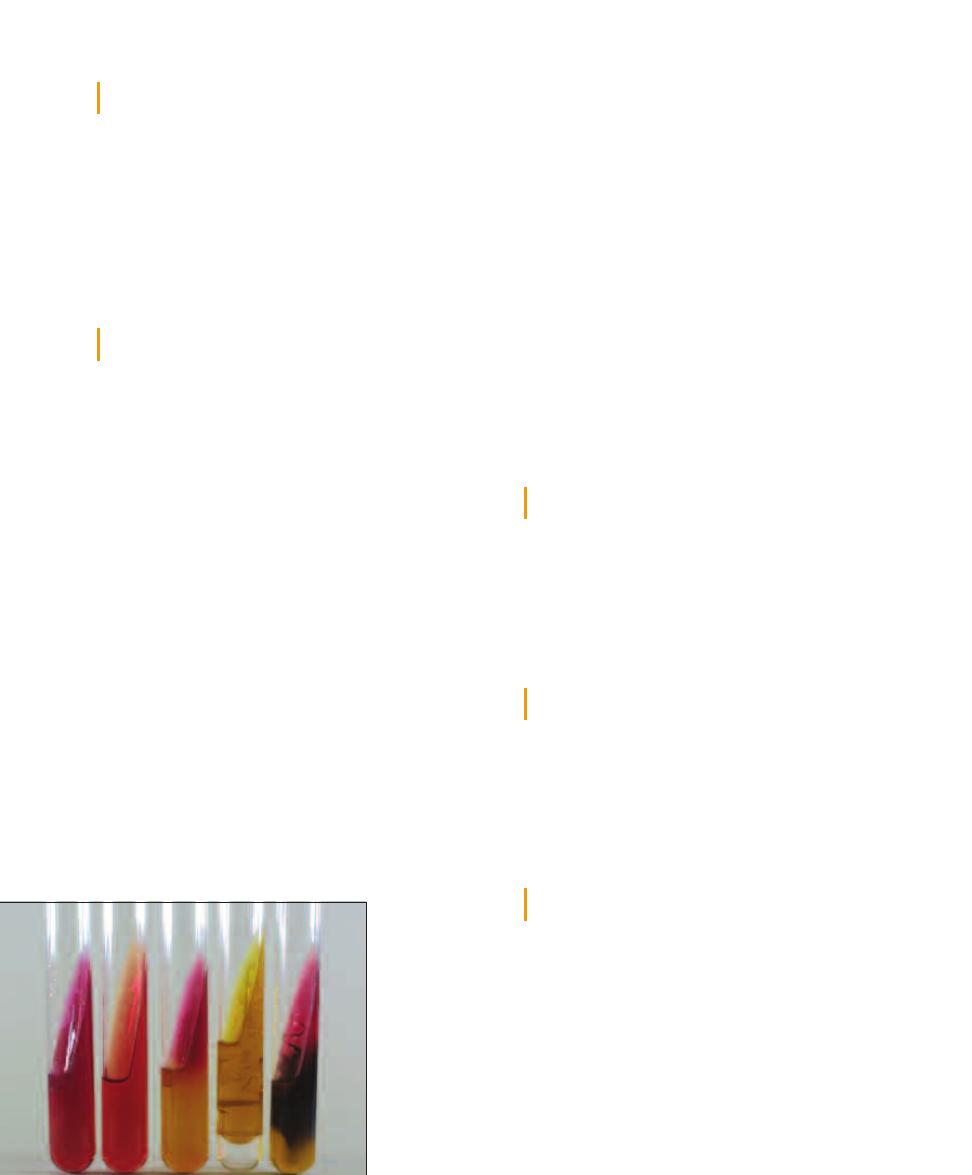
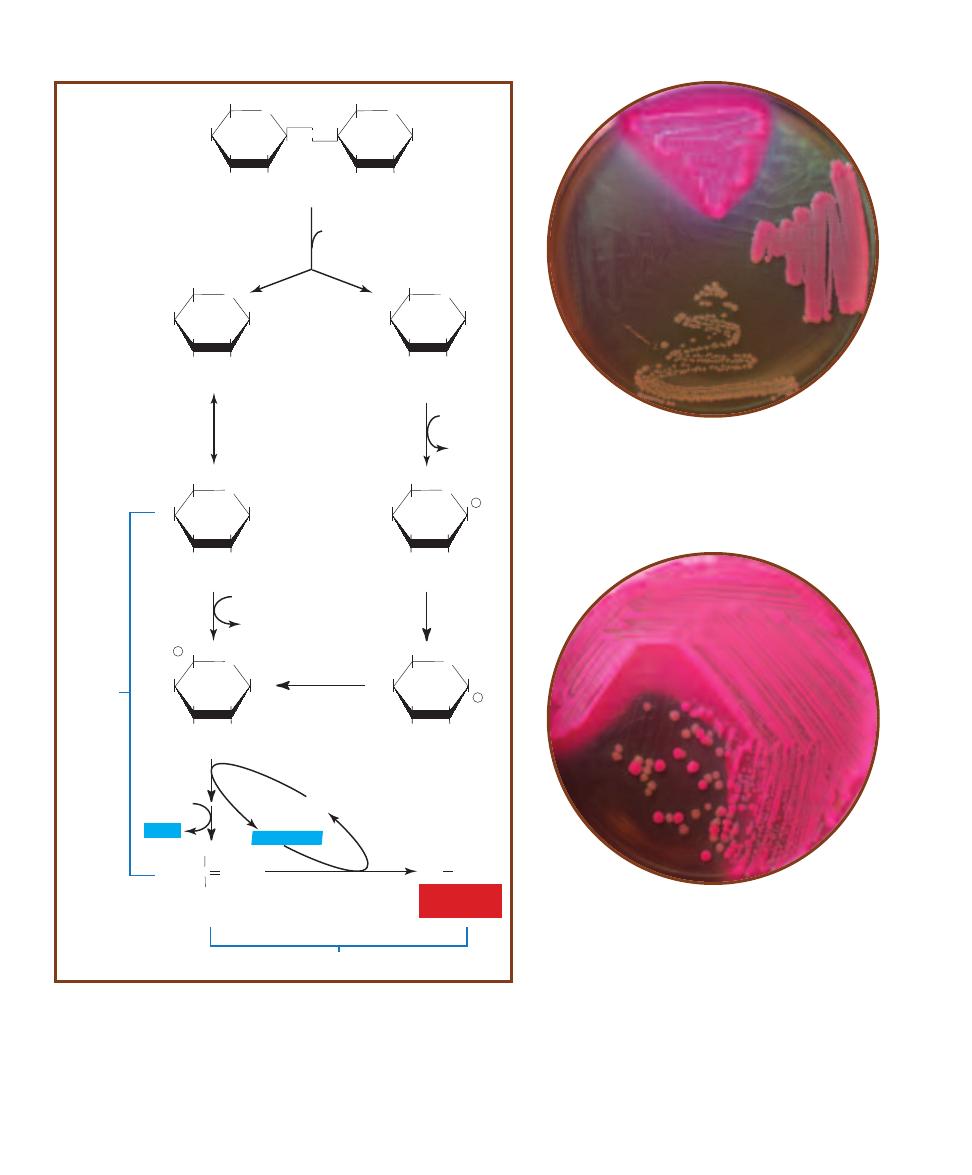
2-10
L
ACTOSE
F
ERMENTATION WITH
A
CID
E
ND
P
RODUCTS
2-11
D
ESOXYCHOLATE
A
GAR
DOC medium inoculated
with (clockwise from top): Escherichia coli, Enterobacter
aerogenes, Shigella flexneri, and Enterococcus faecalis. Note
the inhibition of the Gram- positive E. faecalis. Note also the
red coloring of the lactose fermenting coliforms E. coli and E.
aerogenes.
2-12
D
ESOXYCHOLATE
A
GAR
S
TREAKED FOR
I
SOLATION
DOC medium inoculated with the coliform Escherichia coli
(pink) and Shigella flexneri (buff). The color difference is be-
cause Shigella is a noncoliform and doesn’t ferment lactose.
䢇
Purpose
Endo agar is used to detect fecal contamination in
water and dairy products. Whereas its current use
is to isolate and identify the presence of enteric
lactose fermenters (coliforms), its original use was
to isolate and identify Salmonella typhi, a lactose
nonfermenter (noncoliform).
䢇
Principle
Endo Agar contains color indicators sodium
sulfite and basic fuchsin (which also double as
Gram-positive inhibitors). Lactose is included as
a fermentable carbohydrate. Lactose fermenters
(Figure 2-10) growing on the medium will appear
red or pink and darken the medium slightly due to
the reaction of sodium sulfite with the fermenta-
tion intermediate acetaldehyde. Refer to the
Appendix for more details on fermentation.
Lactose nonfermenters produce colorless to
slightly pink growth (Figure 2-13). Some
lactose fermenters, such as Escherichia coli
and Klebsiella pneumoniae produce large
amounts of acid, which gives the colonies
a metallic sheen (Figure 2-14).
SECTION 2
䢇
Isolation Techniques and Selective Media
䢇
11
Endo Agar
2-13
E
NDO
A
GAR
Endo Agar inoculated
with Escherichia coli
(top), Enterobacter
aerogenes (lower
right) and Shigella
sonnei (lower left).
Notice the differ-
ence in the inten-
sity of the pink
between E. aero-
genes (a coliform)
and S. sonnei (a
noncoliform).
2-14
M
ETALLIC
S
HEEN
Endo Agar streaked with
Escherichia coli to illustrate
the metallic sheen resulting
from large amounts of acid
produced during lactose
fermentation.
Eosin Methylene Blue Agar
䢇
Purpose
Eosin Methylene Blue (EMB) Agar is used for isolation of
fecal coliforms. EMB Agar can be streaked for isolation or
used in the Membrane Filter Technique as discussed on page
228.
䢇
Principle
Eosin Methylene Blue agar contains peptone, lactose, sucrose,
and the dyes eosin Y and methylene blue. The sugars pro-
vide fermentable substrates to encourage growth of fecal
coliforms. The dyes inhibit growth of Gram-positive organ-
isms and, under acidic conditions, also produce a dark purple
complex usually accompanied by a green metallic sheen.
This green metallic sheen serves as an indicator of the vig -
orous lactose and/or sucrose fermentation typical of fecal
coliforms. Smaller amounts of acid production (typical of
Enterobacter aerogenes and slow lactose fermenters) result
in a pink coloration of the growth. Nonfermenters remain
their normal color or take on the coloration of the medium
(Figures 2-15 and 2-16).
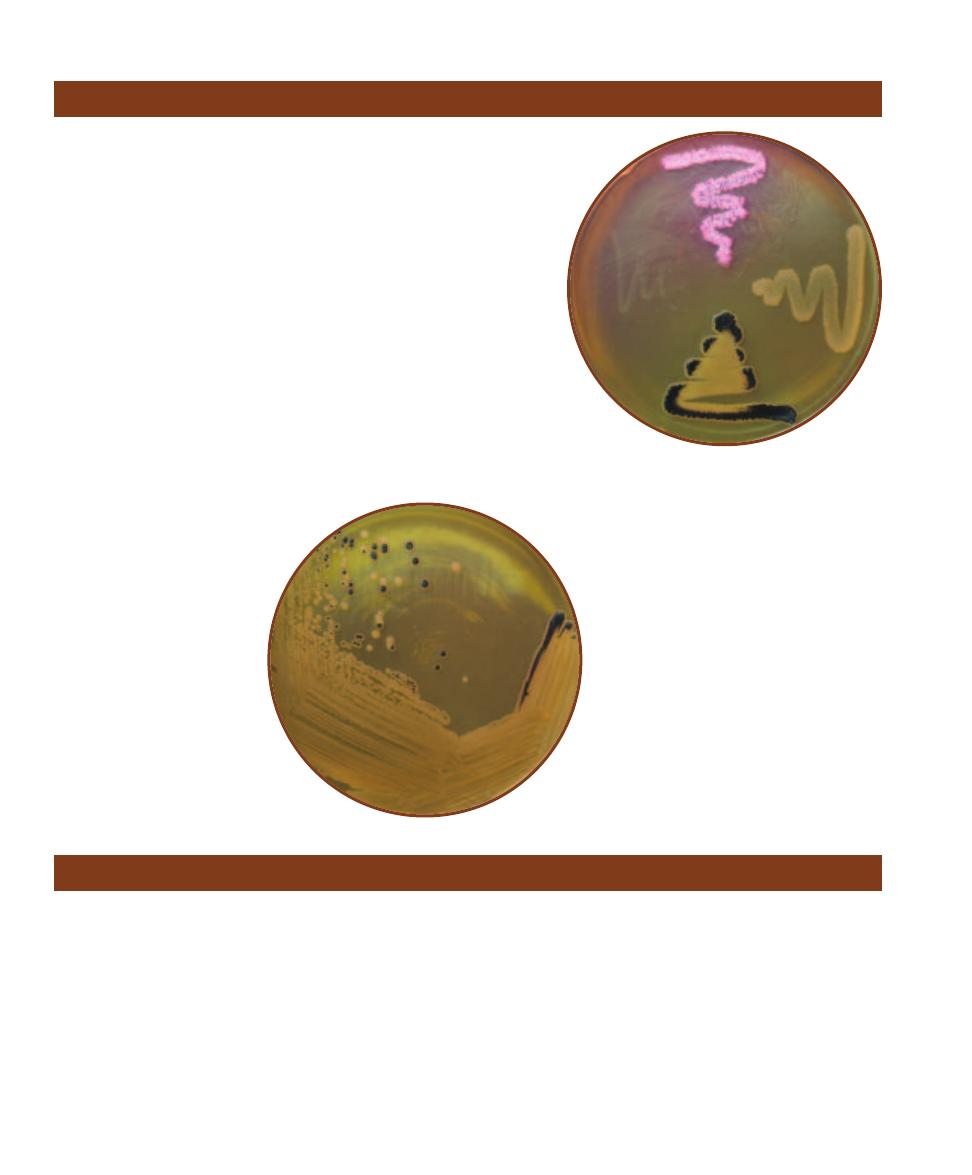
䢇
Purpose
Hektoen Enteric (HE) Agar is used to isolate and differentiate
Salmonella and Shigella species from other Gram-negative enteric
organisms.
䢇
Principle
Hektoen Enteric Agar is an undefined medium designed to isolate
Salmonella and Shigella species from other enterics based on the
ability to ferment lactose, sucrose, or salicin, and to reduce sulfur to
hydrogen sulfide gas (H
2
S). In addition to the three sugars, sodium
thiosulfate is included as a source of sulfur. Ferric ammonium citrate
is added to react with H
2
S and form a black precipitate. Bile salts are
included to inhibit most Gram-positive cocci. Bromthymol blue and
acid fuchsin dyes are added as color indicators.
Differentiation is possible as a result of the various colors pro-
duced in the colonies and in the agar. Enterics that produce acid
from fermentation will produce yellow to salmon-pink colonies.
Organisms like Salmonella, Shigella, and Proteus that do not fer-
ment any of the sugars produce blue-green colonies. Proteus and
Salmonella species that reduce sulfur to H
2
S form colonies contain-
ing a black precipitate. Refer to Figures 2-17 and 2-18.
12
䢇
A Photographic Atlas for the Microbiology Laboratory
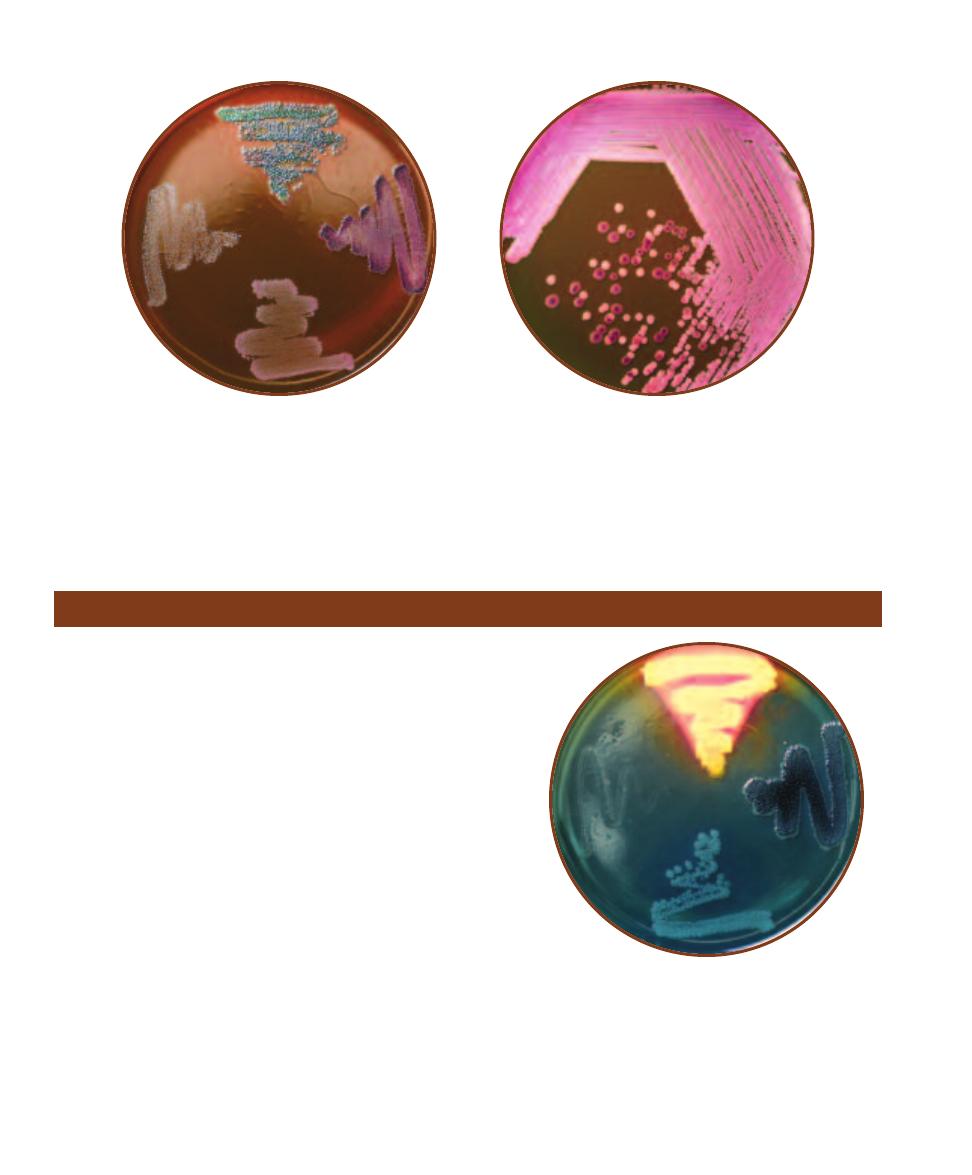
2-16
E
OSIN
M
ETHYLENE
B
LUE
A
GAR
S
TREAKED
FOR
I
SOLATION
EMB agar inoculated with Escherichia
coli and Salmonella typhimurium. Note the dark centers
in the E. coli colonies. S. typhimurium is a noncoliform
and remains its natural color.
Hektoen Enteric Agar
2-17
H
EKTOEN
E
NTERIC
A
GAR
HE Agar inoculated
with (clockwise from top), Escherichia coli, Proteus
mirabilis, Shigella flexneri, and Enterococcus faecalis.
E. coli produces yellow color because acid is an end-
product of its fermentation of lactose. P. mirabilis does
not ferment lactose but does produce a black precipitate
from the reaction between ferric ammonium citrate in
the medium and H
2
S from sulfur reduction. Shigella is
also a lactose nonfermenter and is blue-green; it is not
a sulfur reducer. E. faecalis is inhibited by the bile salts.
2-15
E
OSIN
M
ETHYLENE
B
LUE
A
GAR
EMB agar
inoculated with (clockwise from top) Escherichia coli,
Enterobacter aerogenes, Salmonella typhimurium, and
Enterococcus faecalis. Note the characteristic green
metallic sheen of E. coli and the pink coloration with
slight darkening of E. aerogenes. Both organisms are
coli forms; the difference in color is due to the degree
of acid pro duction. Some E. coli strains appear black
without the green sheen or produce colonies with dark
centers. See Figure 2-16.
䢇
Purpose
MacConkey Agar is used to isolate and differentiate members of the
Entero bacteriaceae based on the ability to ferment lactose. Variations on
the standard medium include MacConkey Agar w/o CV (without crystal
violet) to allow detection of Gram-positive cocci or MacConkey Agar CS
to control swarming bacteria (such as Proteus) that interfere with other
results.
䢇
Principle
MacConkey Agar is a selective and differential medium containing lactose,
bile salts, neutral red, and crystal violet. Bile salts and crystal violet inhibit
growth of Gram-positive bacteria. Neutral red dye is a pH indicator that is
colorless above a pH of 6.8 and red at a pH below 6.8. Acid accumulating
from lactose fermentation turns the dye
red. Lactose fermenters turn a shade
of red on MacConkey agar
whereas lactose nonfermenters
remain their normal color or
the color of the medium
(Figures 2-19 and 2-20).
Formulations without
crystal violet allow
growth of Enterococcus
and some species of
Staphylococcus, which
ferment the lactose
and appear pink on
the medium.
SECTION 2
䢇
Isolation Techniques and Selective Media
䢇
13
2-18
H
EKTOEN
E
NTERIC
A
GAR
S
TREAKED
FOR
I
SOLATION
HE agar streaked with Salmonella
typhimurium and Escherichia coli. Note the black
Salmonella colonies due to sulfur reduction and
the yellow E. coli colonies due to lactose fermen-
tation with acid end-products.
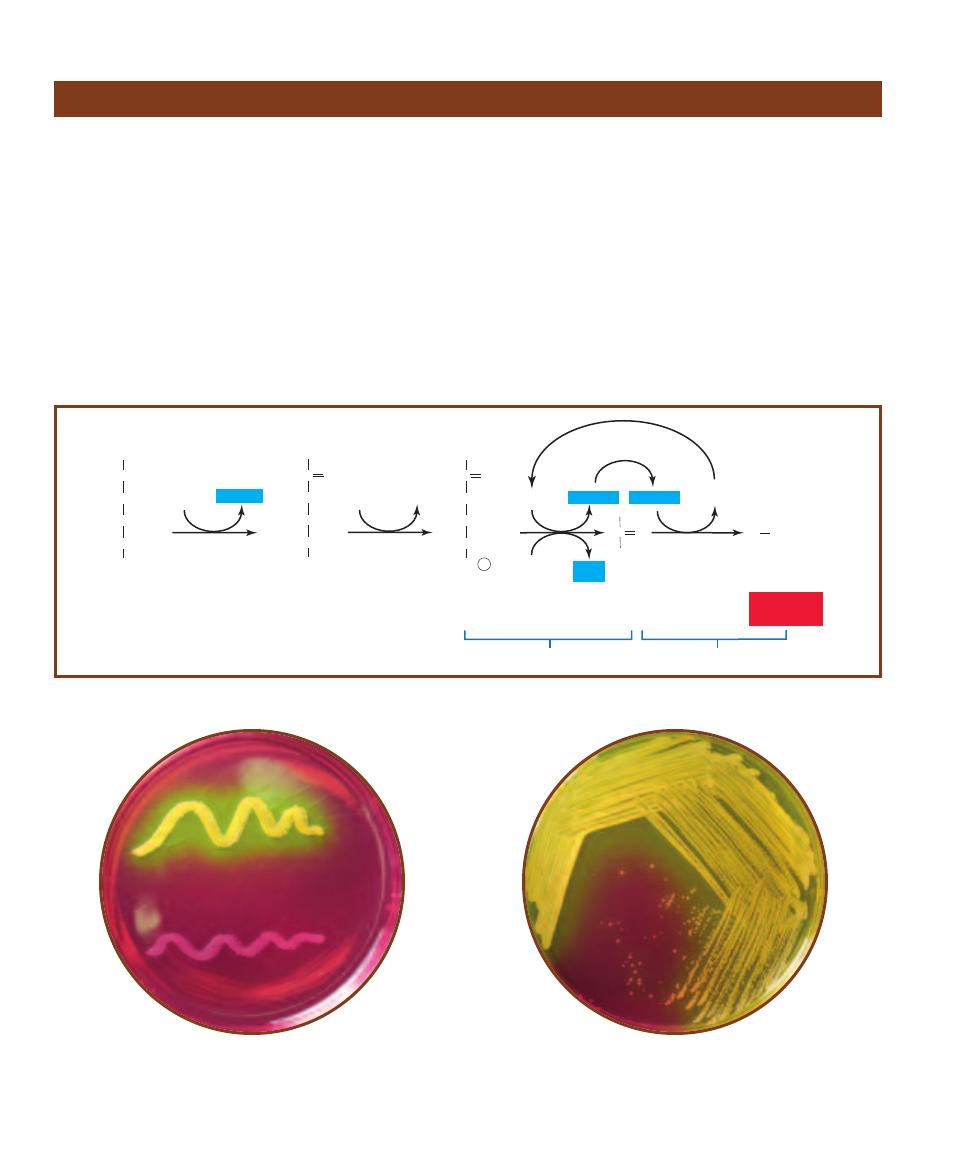
MacConkey Agar
2-19
M
AC
C
ONKEY
A
GAR
MacConkey Agar
inoculated with (clockwise from top) Escherichia
coli, Entero bacter aerogenes, Shigella sonnei, and
Proteus mirabilis. E. coli and E. aerogenes produce
pink color from acid-producing lactose fermenta-
tion. S. sonnei and P. mirabilis, both lactose non-
fermenters, remain their normal color. Note the
precipitated bile salts around the E. coli, also
shown in Figure 2-20.
2-20
M
AC
C
ONKEY
A
GAR
S
TREAKED FOR
I
SOLATION
MacConkey Agar inoculated with
Escherichia coli and Shigella flexneri. Note the
precipitated bile salts around the E. coli
caused by acid from lactose fermentation.
䢇
Purpose
Mannitol Salt Agar (MSA) is used for isolation and differ -
entiation of pathogenic staphylococci, principally Staphylo-
coccus aureus.
䢇
Principle
Mannitol Salt Agar contains the carbohydrate mannitol,
7.5% sodium chloride (NaCl), and the pH indicator phenol
red. Phenol red is yellow below pH 6.8, red at pH 7.4 to
8.4, and pink above 8.4. The sodium chloride makes this
medium selective for staphylococci since most other bac teria
cannot survive in this level of salinity. The pathogenic
species of Staphylococcus ferment mannitol (Figure 2-21)
and produce acid, which turns the pH indicator yellow.
Nonpathogenic staphylococcal species grow, but produce
no color change. Refer to pages 71–73 and Figure A-5 in
the Appendix for more information on fermentation.
The development of yellow halos around the bacterial
growth is presumptive evidence that the organism is a path-
ogenic Staphylococcus (usually S. aureus). Good growth
that produces no color change is presumptive evidence for
nonpathogenic Staphylococcus (Figures 2-22 and 2-23).
With few exceptions, organisms that grow poorly on the
medium are not staphylococci.
14
䢇
A Photographic Atlas for the Microbiology Laboratory
Mannitol Salt Agar
Glycolysis
C
CH
3
O
COO
-
Pyruvate
2NAD+
2ADP
R COOH
2NAD+
HOCH
H
2
COH
HOCH
HCOH
H
2
COH
C O
H
2
COH
HCOH
HOCH
HCOH
H
2
CO P
C O
H
2
COH
HCOH
HOCH
HCOH
H
2
COH
NAD+
Mannitol
D-Fructose
D-Fructose-6-P
Mannitol
Dehydrogenase
ADP
ATP
Fructokinase
HCOH
Fermentation
NADH+H+
2NADH+H+
2NADH+H+
2ATP
(net)
Organic Acid
(lowers pH)
2-21
M
ANNITOL
F
ERMENTATION WITH
A
CID
E
ND
-P
RODUCTS
The organic acids produced lower the pH and turn the medium yellow.
2-22
M
ANNITOL
S
ALT
A
GAR
MSA inoculated with
Staphylococcus aureus (top) and S. epidermidis (bottom).
(Note: Some strains of S. epidermidis are inhibited by
this medium). The yellow halo around S. aureus is due
to mannitol fermentation with acid end products.
2-23
M
ANNITOL
S
ALT
A
GAR
S
TREAKED FOR
I
SOLATION
MSA inoculated with Staphylococcus aureus and Staphylococcus
epidermidis. The growth shown in this photo is typical of the two
species on this medium; the colonies of S. epidermidis are small
and red whereas those of S. aureus are slightly larger and yellow.
䢇
Purpose
Phenylethyl (PEA) Alcohol Agar is used to
isolate staphylococci and streptococci from
specimens containing mixtures of bacterial
flora. It is typically used for specimens
thought to also contain Escherichia coli,
or strains of Proteus. When prepared with
5% sheep blood, it is used for cultivation of
Gram-positive anaerobes.
䢇
Principle
PEA is an undefined, selective medium that
allows growth of Gram-positive organisms
and stops or inhibits growth of most Gram-
negative organisms (Figure 2-24). The active
ingredient, phenylethyl alcohol, functions
by interfering with DNA synthesis in Gram-
negative organisms.
SECTION 2
䢇
Isolation Techniques and Selective Media
䢇
15
Phenylethyl Alcohol Agar
2-24
B
RAIN
H
EART
I
NFUSION
A
GAR VS
. P
HENYLETHYL
A
LCOHOL
A
GAR
A
Growth on Brain Heart
Infusion Agar. Clockwise from the
top: Staphylococcus aureus, Escherichia
coli, Enterococcus faecium, and Klebsiella
pneumoniae. All show decent growth on BHIA.
B
The same organisms inoculated in the same positions of PEA. Notice that
S. aureus and E. faecium grow well on both plates. E. coli and K. pneumoniae are
inhibited by PEA, but E. coli is not completely stopped from growing.
Pseudomonas Isolation Agar
䢇
Purpose
Pseudomonas Isolation Agar (PIA) is a selective and differ-
ential medium used to isolate nonfermenting Gram-negative
bacteria in clinical samples, especially Pseudomonas species.
It also allows differentiation of P. aeruginosa, a major cause
of nosocomial infections (often from contamination of hos-
pital equipment), from other pseudomonads based on its
production of the pigment pyocyanin.
䢇
Principle
The fatty acid synthesis inhibitor, Irgasan
®1
(also known as
Triclosan), is inhibitory to many Gram-positive and Gram-
negative species. Pseudomonas species are not affected by its
activity (at its concentration in the medium) due to a mem-
brane efflux pump. Carbon and nitrogen are provided by
peptone and glycerol. Pyocyanin production is promoted by
potassium sulfate, magnesium chloride, and glycerol.
1
Irgasan is a registered trademark of Ciba-Geigy.
2-25
P
SEUDOMONAS
I
SOLATION
A
GAR
Pseudomonas aeruginosa
is on the left; P. fluorescens is on the right. Notice the greenish color of
P. aeruginosa due to the pigment pyocyanin.
A
B
16
䢇
A Photographic Atlas for the Microbiology Laboratory
䢇
Purpose
Salmonella-Shigella (SS) Agar is a selective medium originally used for
the isolation of Salmonella and many Shigella species (i.e., lactose non -
fermenting enteric bacteria) from the lactose fermenting enterics (the
coliforms). It is no longer recommended for isolation of Shigella, since
Hektoen and XLD agars are more effective, but is still of use in isolating
Salmonella species.
䢇
Principle
Salmonella-Shigella Agar is an undefined, differential, and selective
medium with bile salts and brilliant green dye acting as the selective
agents against Gram-positives and many Gram-negatives. Lactose is
included as a fermentable carbohydrate and sodium thiosulfate provides
a source of reduceable sulfur. Neutral red is the pH indicator and ferric
citrate reacts with H
2
S to form a black precipitate, thus indicating sulfur
reduction. Lactose fermenters will produce reddish colonies as neutral
red changes from colorless to red in the low pH. Salmonella and Shigella
species will be their natural color due to their
inability to ferment lactose. Salmonella
and Proteus species typically reduce
sulfur, which is indicated by
colonies with black centers.
Refer to Figures 2-26
and 2-27.
Salmonella–Shigella Agar
2-26
S
ALMONELLA
-S
HIGELLA
A
GAR
SS Agar
inoculated with (clockwise from top) Escherichia
coli, Shigella flexneri, Salmonella typhimurium, and
Enterococcus faecalis. Note the pink color of E. coli
due to acid production during lactose fermen -
tation. Note also the black precipitate in the
Salmonella growth due to the reaction of ferric
citrate in the medium with H
2
S produced from
sulfur reduction. This phenomenon produces
black colonies when the organism is streaked
for isolation (Figure 2-27). Growth of E. faecalis
is inhibited by bile salts and brilliant green dye.
2-27
S
ALMONELLA
-S
HIGELLA
A
GAR
S
TREAKED FOR
I
SOLATION
SS Agar inoculated
with Salmonella typhimurium and Shigella
flexneri. Note the colonies with black centers
and clear edges characteristic of Salmonella on
this medium.
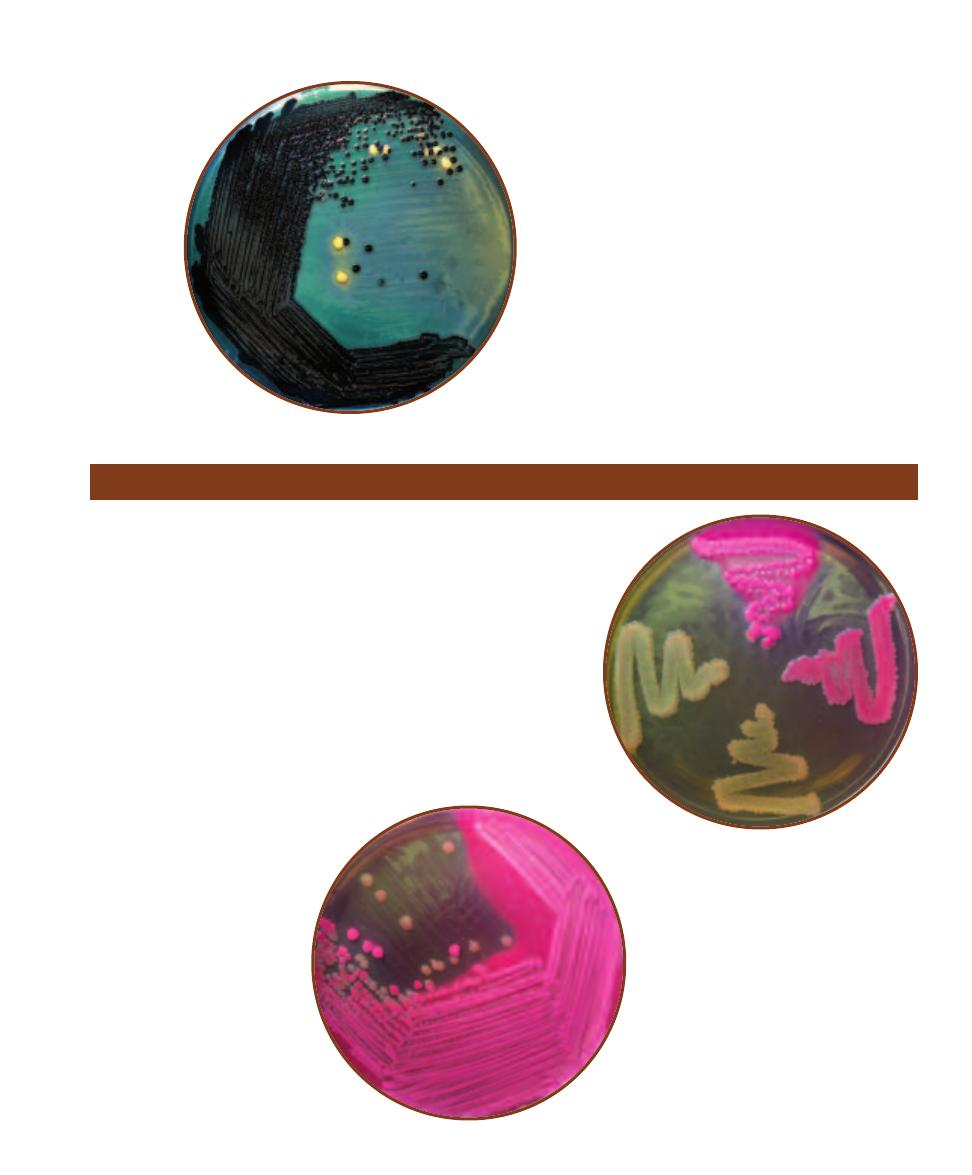
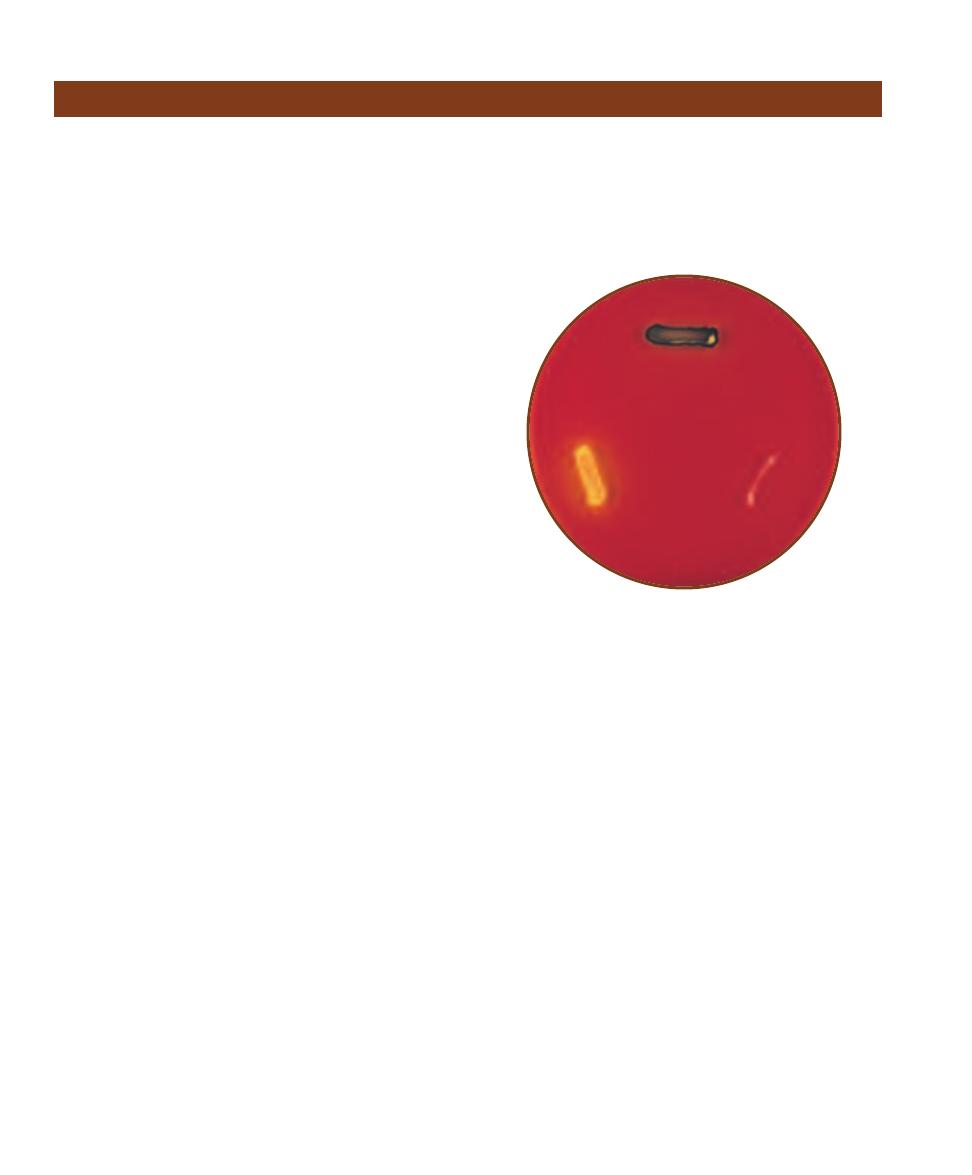
Tellurite Glycine Agar
䢇
Purpose
Tellurite Glycine Agar is an undefined, selective, and differ -
ential medium used for the isolation of coagulase-positive
staphylococci from various sources. The most common and
clinically important coagulase- positive staphylococcus is
Staphylococcus aureus.
䢇
Principle
Among the ingredients of Tellurite Glycine Agar are the
carbohydrate mannitol, potassium tellurite, and lithium
chloride. Organisms, such as the coagulase- positive Staphy-
lococcus aureus, are able to ferment the mannitol and
reduce the tellurite. When tellurite is reduced it produces
a precipitate that turns the colonies black. Therefore, an
organism that grows well on the medium and produces
black colonies is likely S. aureus and is thus differentiated
from coagulase-negative staphylococci and Gram-negative
bacteria (Figure 2-28).
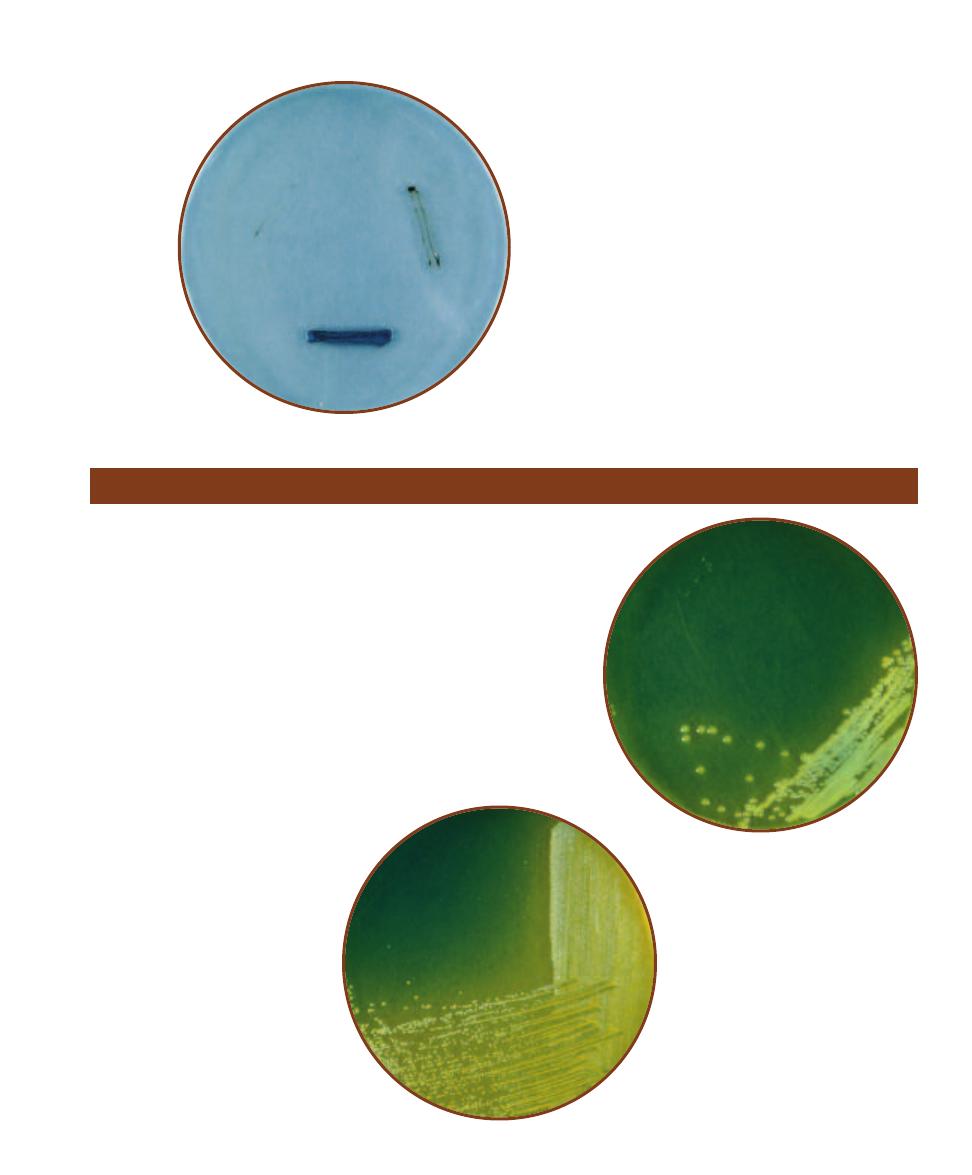
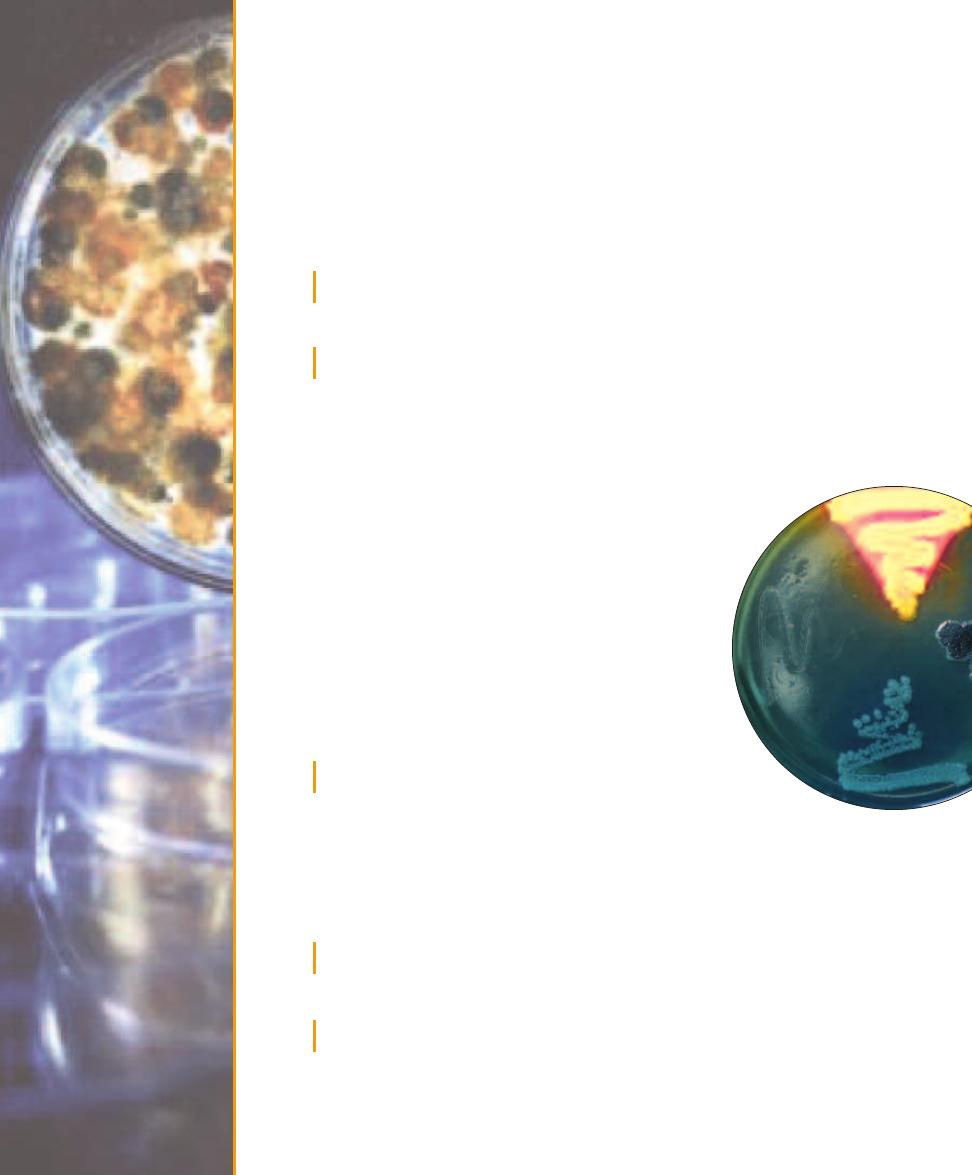
䢇
Purpose
Thiosulfate Citrate Bile Sucrose (TCBS) Agar is an undefined, selective,
and differential medium used for the primary isolation of Vibrio species.
Clinical and nonclinical specimens suspected of fecal contamination
are streaked on TCBS in an effort to recover Vibrio cholerae, the most
important pathogen of the genus.
䢇
Principle
The medium’s alkaline pH (8.6) promotes growth of Vibrio spp.,
especially that of V. cholerae. Oxgall and sodium cholate are included
to inhibit the growth of Gram-positive bacteria. Sucrose is the ferment -
able carbohydrate and sodium thiosulfate is included as an electron
acceptor for sulfur reducers. Bromthymol blue is the pH
indicator and ferric ammonium citrate is in-
cluded to indicate sulfur reduction.
Sucrose fermenters producing acid
end-products (such as Vibrio cholerae)
form yellow colonies (Figure 2-29)
while those of sucrose nonfer-
menters are blue. Some Enterococci
ferment sucrose but are inhibited
by the oxgall. These organ isms, as
shown in Figure 2-30, produce
small yellow colonies. Species
able to reduce thio sulfate to H
2
S
produce black colonies due to the
reaction of H
2
S with the ferric ion
in the medium.
SECTION 2
䢇
Isolation Techniques and Selective Media
䢇
17
2-28
T
ELLURITE
G
LYCINE
A
GAR
Clockwise from
the top right: Gram-positive, coagulase-negative
Staphylococcus epidermidis, Gram-positive, coagulase-
positive Staphylococcus aureus, and Gram-negative
Escherichia coli, grown on Tellurite Glycine Agar. Notice
that E. coli is inhibited, and that the two staphylococci
may be differentiated by their ability to reduce sulfur
and turn the growth black.
TCBS Agar
2-29
V
IBRIO CHOLERAE
S
TREAKED ON
TCBS A
GAR
The large, yellow colonies are
indicative of Vibrio cholerae.
2-30
E
NTEROCOCCUS FAECALIS
S
TREAKED
ON
TCBS A
GAR
This Gram-positive coccus
may also be recovered from fecally contami-
nated samples; however, its yellow colonies
are much smaller than those of V. cholerae.
Compare the E. faecalis colonies with those in
Figure 2-29.
䢇
Purpose
Xylose Lysine Desoxycholate (XLD) Agar is a selective and
differential medium used to isolate and identify Shigella and
Providencia from stool samples.
䢇
Principle
XLD Agar is a selective and differential medium containing
sodium desoxycholate, xylose, L-lysine, and ferric ammo-
nium citrate. Desoxycholate is a Gram- positive inhibitor,
xylose is a fermentable carbohydrate, L-lysine is an amino
acid provided for decarboxylation (See Decarboxylation,
page 67), and ferric ammonium citrate is an indicator to
mark the presence of hydrogen sulfide gas (H
2
S) from sulfur
reduction. Phenol red, which is yellow when acidic and red
or pink when alkaline, is added as a pH indicator.
Organisms that ferment xylose will acidify the medium
and produce yellow colonies. Organisms able to remove the
carboxyl group from (decarboxylate) L-lysine will release
alkaline products and produce red colonies. Organisms
able to reduce sulfur will produce a black precipitate in the
growth due to the reaction of ferric ammonium citrate with
H
2
S.
Shigella and Providencia, which do not ferment xylose
but decarboxylate lysine, appear red on the medium.
Salmonella species, which ferment xylose but then decar-
boxylate the lysine also appear as red colonies but with
black centers due to the reduction of sulfur to H
2
S. Other
enterics that would ordinarily revert to decarboxylation
after exhausting the sugar and alkalinize the medium are
prevented from doing so by the high sugar content and the
short incubation time. These organisms appear yellow on
the medium (Figure 2-31).
18
䢇
A Photographic Atlas for the Microbiology Laboratory
Xylose Lysine Desoxycholate Agar
2-31
X
YLOSE
L
YSINE
D
ESOXYCHOLATE
A
GAR
XLD agar inoculated with (clockwise from top): Proteus
mirabilis (positive for sulfur reduction), Salmonella
typhimurium (atypically negative for sulfur reduction),
and Escherichia coli (positive for lactose fermentation).
Bacterial Growth
䢇
Purpose
Recognizing different bacterial growth morphologies on agar plates is a useful and often crucial
step in the identifi cation process. Agar slants are typically used for cultivation of pure cultures.
Bacteria also frequently display distinct morphological color and texture on agar slants.
䢇
Principle
When a single bacterial cell is deposited on a solid nutrient medium, it begins to divide. One cell
makes two, two make four, four make eight . . . one million make two million, and so on. Eventu-
ally a colony appears where the original cell was deposited. Once the purity of a colony has been
confirmed by an appropriate staining procedure (Sections 5 and 6), cells can then be transferred to
a sterile medium to begin a pure culture.
Color, size, shape, and texture of
microbial growth are determined by the
genetic makeup of the organism. However,
organismal genetic expression is also greatly
influenced by environmental factors includ-
ing nutrient availability, temperature, and
incubation time. Colony characteristics may
be viewed with the naked eye or with the
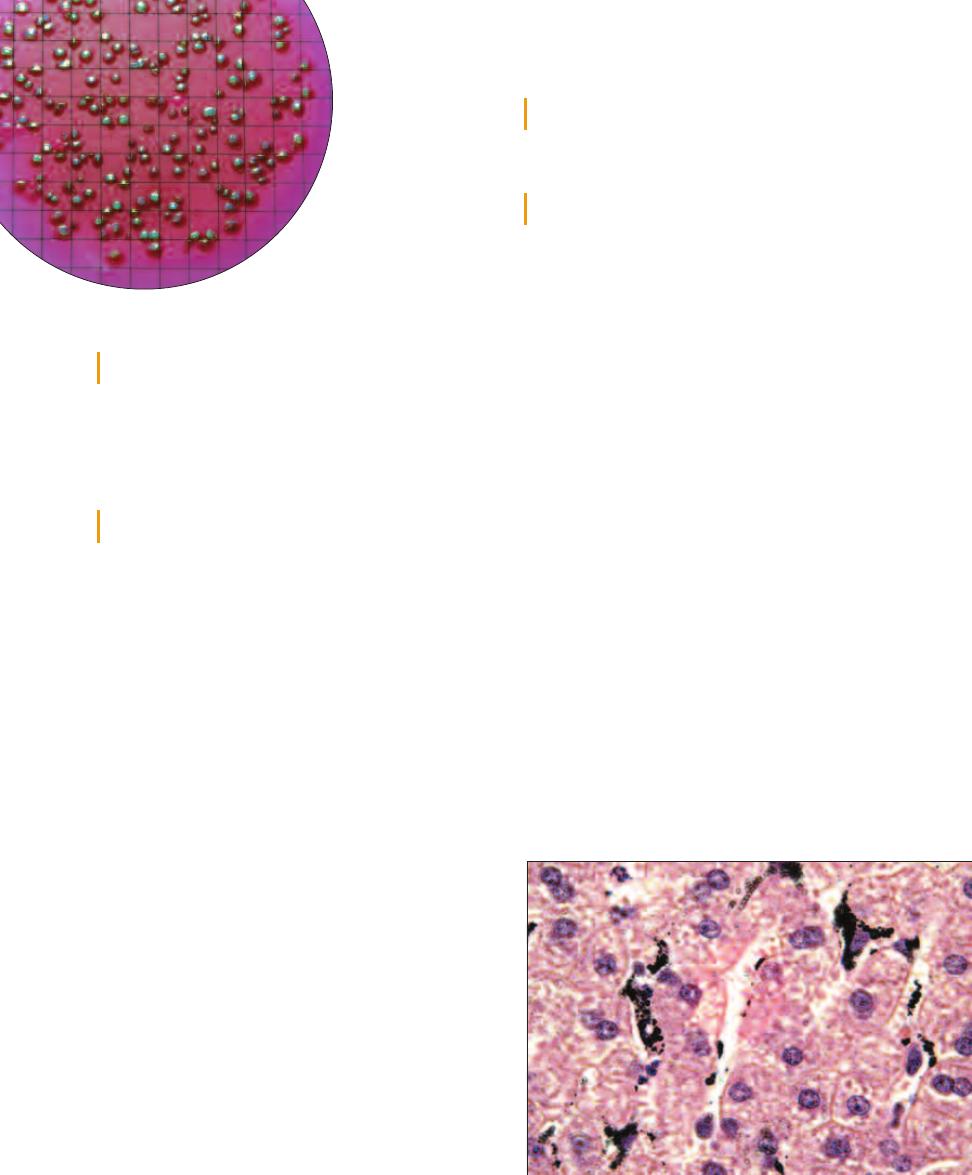
assistance of a colony counter (Figure 3-1).
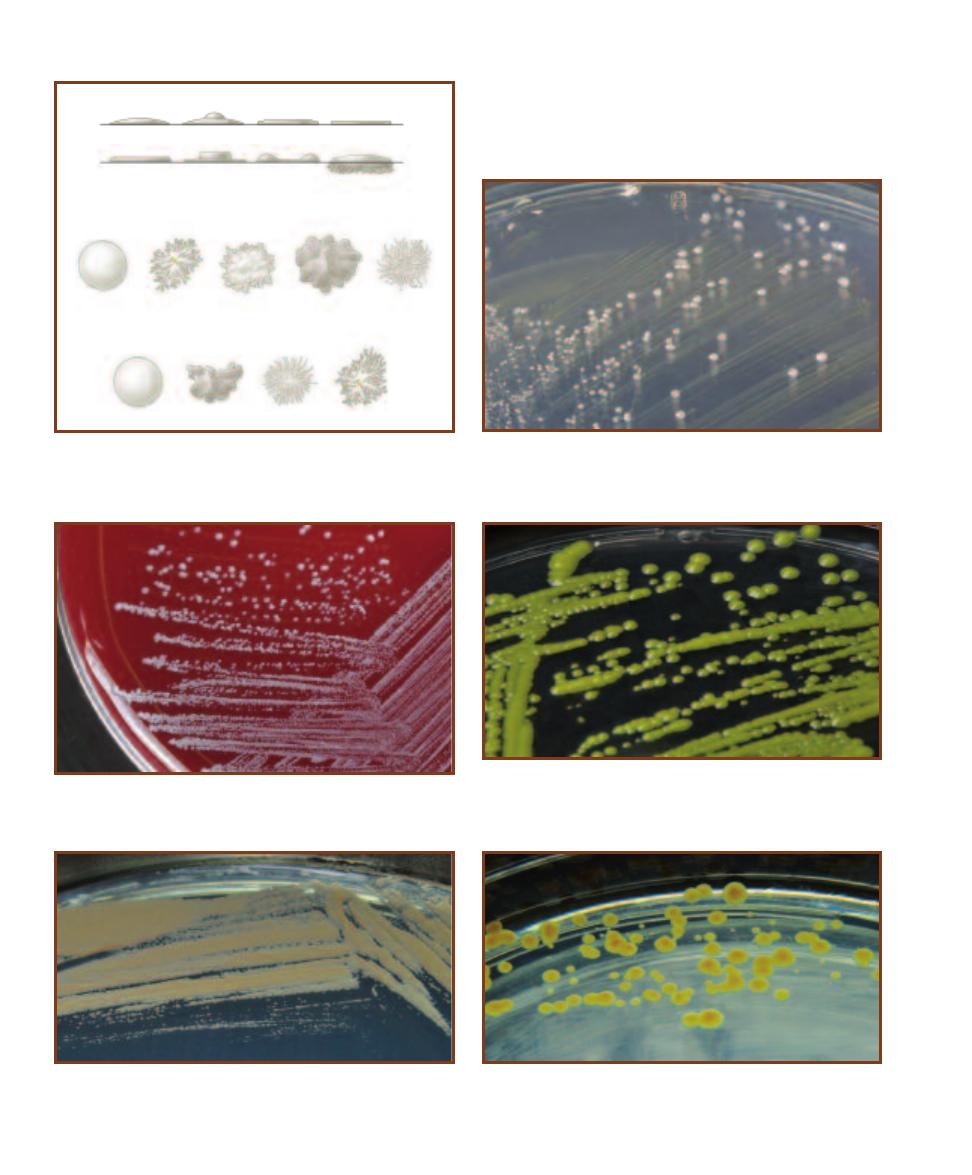
The basic categories of growth include
colony shape, margin (edge), elevation, color,
and texture (Figure 3-2). Colony shape may
be described as circular, irregular, or punc -
tiform (tiny). The margin may be entire
(smooth, with no irregularities), undulate
(wavy), lobate (lobed), filamentous, or rhi-
zoid (branched like roots). Colony elevations
include flat, raised, convex, pulvinate (very
convex), and umbonate (raised in the center).
Colony texture may be moist, mucoid, or
dry. Pigment production is another useful
characteristic and may be combined with
optical properties such as opaque, trans -
lucent, shiny, or dull.
Growth Patterns on Agar
3
S E C T I O N
19
3-1
T
HE
C
OLONY
C
OUNTER
Subtle differences in colony
shape and size can best be viewed on the colony counter.
The transmitted light and magnifying glass allow observa-
tion of greater detail, however, colony color is best deter-
mined with reflected light. The grid in the background is used
as a counting aid. Each big square is a square centimeter.
Figures 3-3 through 3-31 show a variety of bacterial
colony forms and characteristics. Where applicable, con-
trasting environmental factors are indicated. Figures 3-32
and 3-34 show growth characteristics on agar slants.
20
䢇
A Photographic Atlas for the Microbiology Laboratory
3-2
A S
AMPLING OF
B
ACTERIAL
C
OLONY
F
EATURES
These terms
are used to describe colonial morphology. Descriptions also should
include color, surface characteristics (dull or shiny), consistency (dry,
butyrous-buttery, or moist) and optical properties (opaque or translucent).
Convex
Umbonate
Plateau
Flat
R
Elevation
M
Raised
Raised,
spreading
edge
Flat, raised
margin
Growth into
medium
Margin
Smooth,
entire
Rhizoid
Irregular
(erose)
Lobate
Filamentous
Round
Irregular
E
Whole colony
Filamentous
Rhizoid
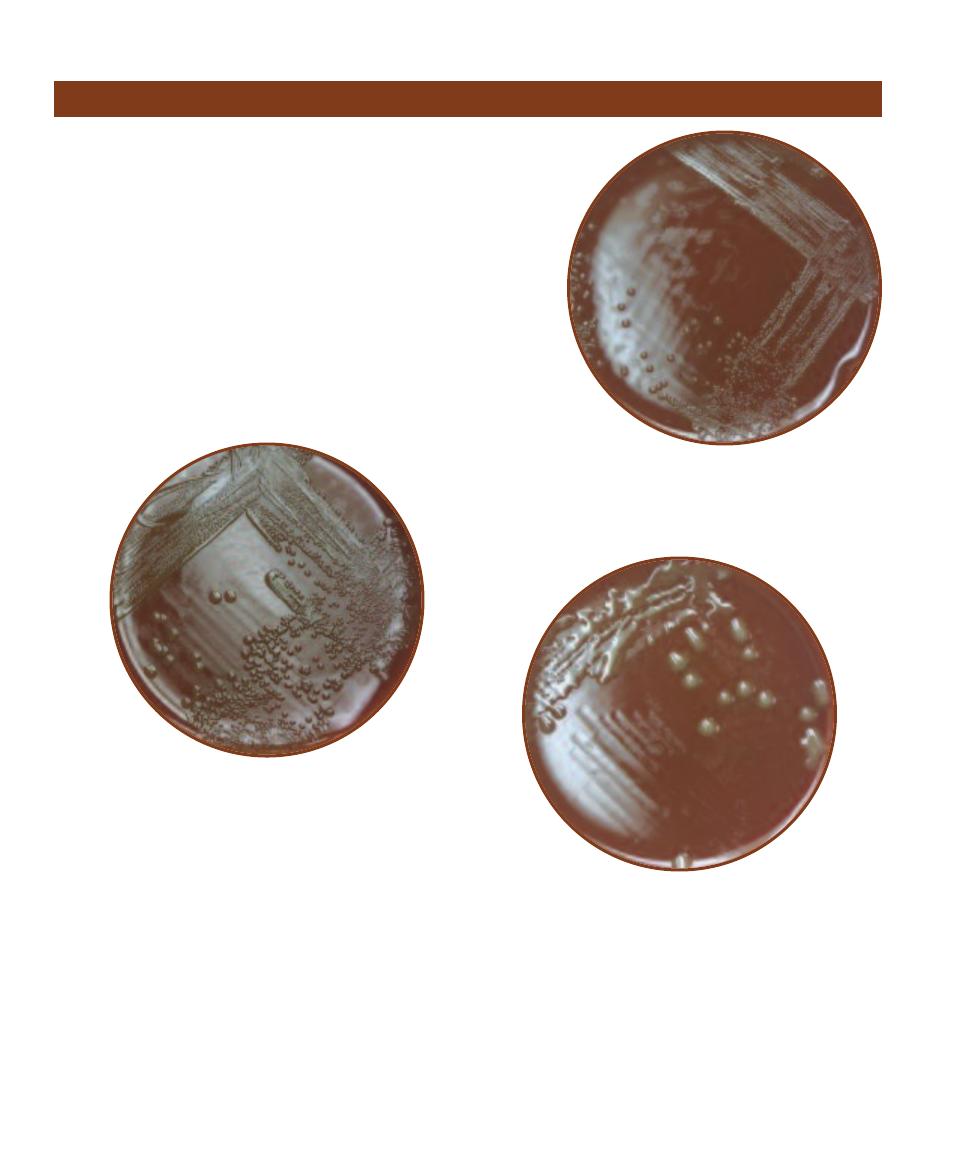
3-3
E
NTEROCOCCUS FAECIUM
G
ROWN ON
N
UTRIENT
A
GAR
The
colonies are white, circular, convex, smooth, and have an entire margin.
E. faecium (formerly known as Streptococcus faecium) is found in human
and animal feces.
3-4
S
TAPHYLOCOCCUS EPIDERMIDIS
G
ROWN ON
S
HEEP
B
LOOD
A
GAR
The colonies are white, raised, circular, and entire. S. epidermidis
is an opportunistic pathogen.
3-5
M
ICROCOCCUS LUTEUS
G
ROWN ON
B
RAIN
H
EART
I
NFUSION
A
GAR
These colonies are yellow, smooth, and convex with a regular
margin. They range in size from 1 to 3 mm. M. luteus is common in soil,
dust, and on human skin.
3-6
K
OCURIA ROSEA
G
ROWN ON
B
RAIN
H
EART
I
NFUSION
A
GAR
Pink, punctiform (these are less than 1 mm in diameter), smooth, regu-
lar colonies typify K. rosea, an inhabitant of water, dust, and salty foods.
3-7
S
ARCINA AURANTIACA
G
ROWN ON
B
RAIN
H
EART
I
NFUSION
A
GAR
S. aurantiaca produced yellow-orange, smooth, convex, regular
colonies on BHIA. These are between 1 to 3 mm in diameter.
SECTION 3
䢇
Bacterial Growth
䢇
21
3-8
R
HODOCOCCUS RHODOCHROUS
G
ROWN ON
B
RAIN
H
EART
I
NFUSION
A
GAR
These colonies are reddish-pink,
smooth, and convex with a regular
margin. They are about 1 mm in diameter.
Rhodococcus species are soil organisms.
3-9
C
OMPARISON OF
F
OUR
B
ACILLUS
S
PECIES
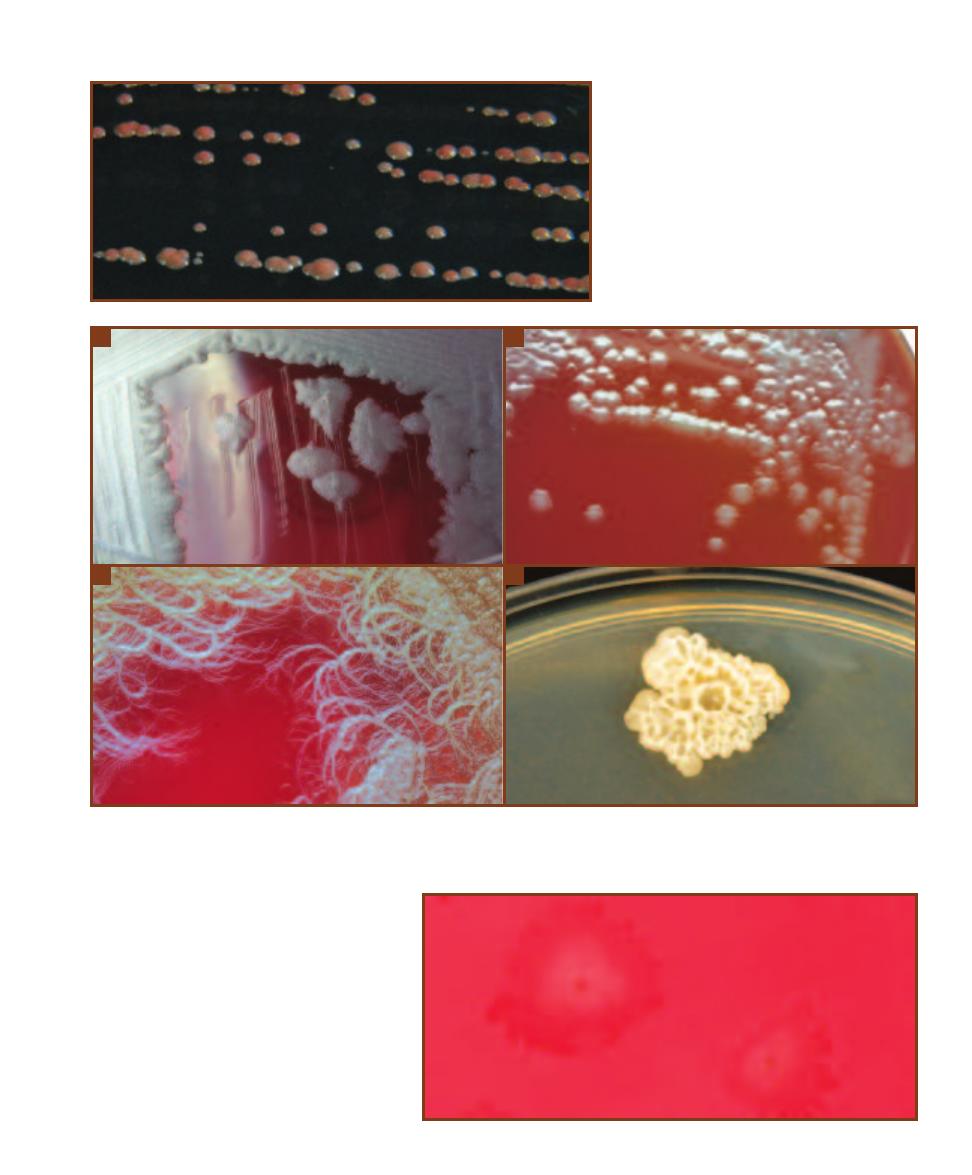
A
B. cereus grown on Blood Agar produces distinctively large (up to 7 mm), gray, granular, irregu-
lar colonies. They often produce a “mousy” smell. Also note the extensions of growth along the streak line.
B
B. anthracis colonies resemble B. cereus,
but are usually smaller and adhere to the medium more tenaciously.
C
B. mycoides produces rapidly spreading, rhizoid colonies.
D
This unknown
Bacillus isolated as a laboratory contaminant produced wrinkled, irregular colonies with an undulate (wavy) margin.
A
B
C
D
3-10
“M
EDUSA
H
EAD
” C
OLONIES OF
C
LOSTRIDIUM
SPOROGENES ON
B
LOOD
A
GAR
These irregularly circular
colonies have a raised, yellow center and a flat, spreading
edge of tangled filaments (reminiscent of the mythological
creature Medusa, who had snakes for hair!). They vary in
size from 2 to 6 mm.
22
䢇
A Photographic Atlas for the Microbiology Laboratory
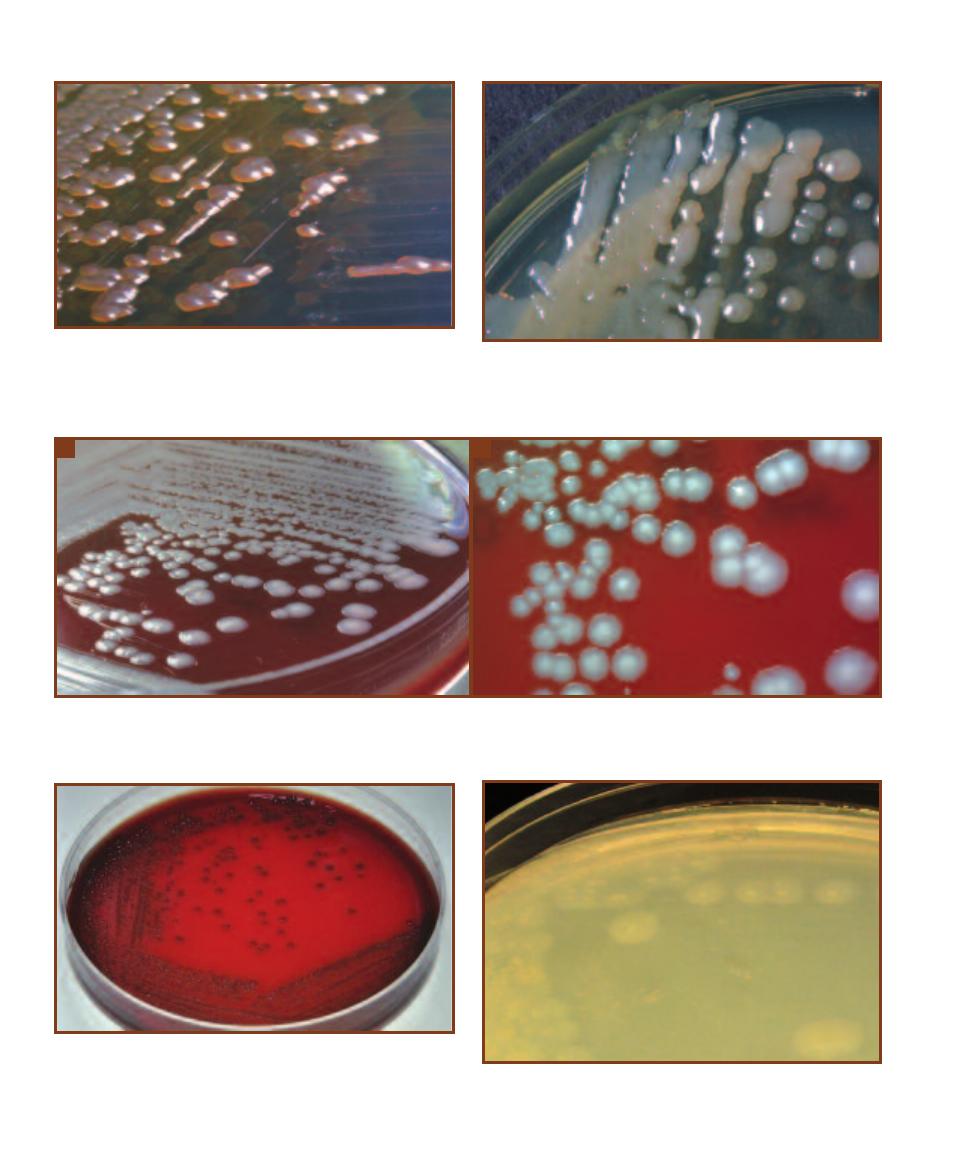
3-11
P
ROVIDENCIA STUARTII
G
ROWN ON
N
UTRIENT
A
GAR
The
colonies are shiny, buff, and convex. P. stuartii is a frequent isolate in
urine samples obtained from hospitalized and catheterized patients.
P. stuartii is highly resistant to antibiotics.
3-12
K
LEBSIELLA PNEUMONIAE
G
ROWN ON
N
UTRIENT
A
GAR
The
colonies are mucoid, raised, and shiny. While it is a normal inhabitant
of the human intestinal tract, it is associated with community-acquired
pneumonia and nososomial urinary tract infections.
3-13
A
LCALIGENES FAECALIS
C
OLONIES ON
S
HEEP
B
LOOD
A
GAR
The colonies of this opportunistic pathogen are umbonate with an opaque
center and a spreading edge.
A
Side view. Note the raised center.
B
Close-up of the A. faecalis colonies showing spreading edge.
A
B
3-14
C
ITROBACTER KOSERI
G
ROWN ON
S
HEEP
B
LOOD
A
GAR
The
colonies are round, smooth, and opaque with a regular margin. This
species is also able to partially hemolyze red blood cells (␣-hemolytic),
as evidenced by the greening around each colony. They range in size
from 1 to 2 mm.
3-15
E
RWINIA AMYLOVORA
G
ROWN ON
B
RAIN
H
EART
I
NFUSION
A
GAR
These colonies are whitish, transluscent, spreading, and umbon-
ate. Erwinia species are plant pathogens.
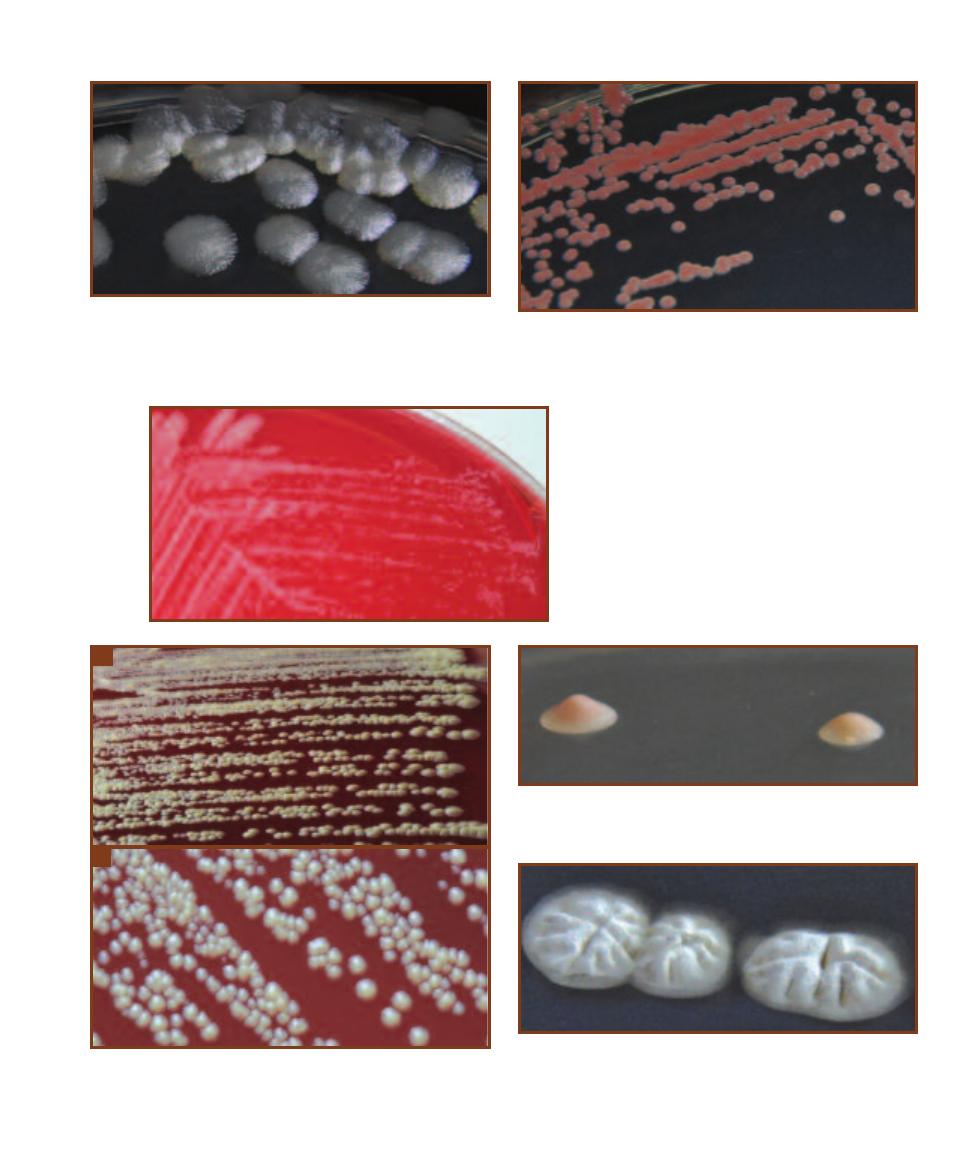
SECTION 3
䢇
Bacterial Growth
䢇
23
3-16
R
HIZOBIUM LEGUMINOSARUM
G
ROWN ON
B
RAIN
H
EART
I
NFUSION
A
GAR
The colonies are convex, circular, and filamentous.
They are translucent at the edges and about 5 mm in diameter.
R. leguminosarum is capable of producing root nodules (tumors)
in many legumes and subsequently fixing atmospheric nitrogen.
3-17
D
EINOCOCCUS RADIODURANS
G
ROWN ON
T
RYTPICASE
S
OY
A
GAR
These small (between 1 and 2 mm in diameter), round, convex,
and regular colonies took 36 hours to develop the orange color. This
species is highly resistant to ionizing radiation.
3-18
M
YCOBACTERIUM SMEGMATIS
G
ROWN
ON
S
HEEP
B
LOOD
A
GAR
The colonies of this
slow growing relative of M. tuberculosis are
punctiform.
3-19
C
ORYNEBACTERIUM XEROSIS
G
ROWN ON
S
HEEP
B
LOOD
A
GAR
A
As seen in this view from the side, the colonies are dull, buff,
and convex.
B
Close-up of circular C. xerosis colonies. C. xerosis is rarely
an opportunistic pathogen.
A
B
3-20
U
MBONATE
C
OLONY OF AN
A
NAEROBIC
L
AB
C
ONTAMINANT
The colony on the left is truly umbonate. The one on the right is getting
there. Their diameters are about 3 mm.
3-21
S
TREPTOMYCES GRISEUS
G
ROWN ON
B
RAIN
H
EART
I
NFUSION
A
GAR
These colonies are circular and ridged with a granular appear-
ance. At a later stage of development, they produce yellow reproductive
spores. Growth of streptomycetes is associated with an “earthy” smell.
This one plate fragranced the entire incubator!
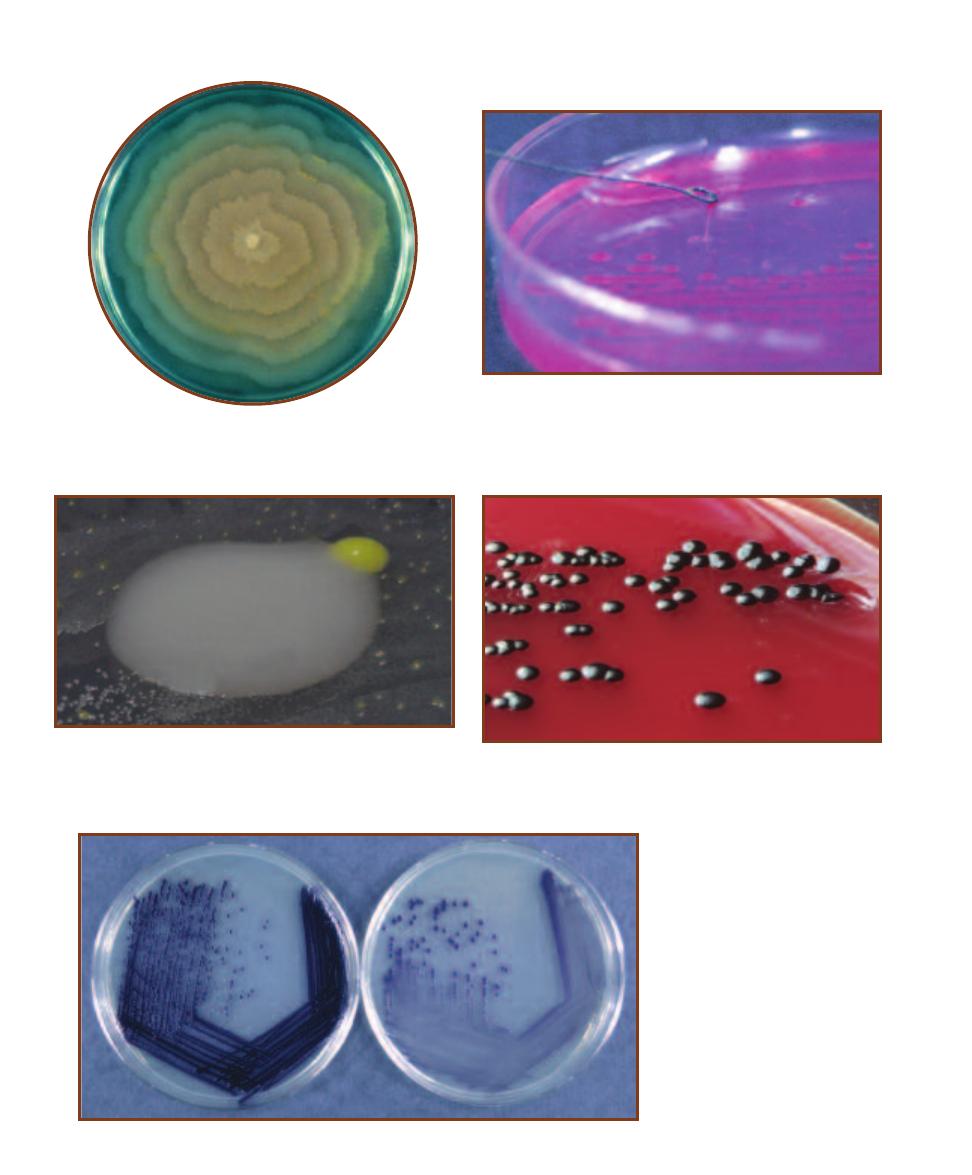
24
䢇
A Photographic Atlas for the Microbiology Laboratory
3-22
S
WARMING
G
ROWTH
P
ATTERN
Members of the genus
Proteus will swarm at certain intervals and produce a pattern of
concentric rings due to their motility. This is a photograph of
P. vulgaris demonstrating swarming behavior on DNase agar.
3-23
M
UCOID
C
OLONIES
Pseudomonas aeruginosa grown on Endo
agar demonstrates a mucoid texture. P. aeruginosa is found in soil and
water, and can cause infections in burn patients.
3-24
B
UTYROUS
C
OLONY OF AN
U
NKNOWN
S
OIL
I
SOLATE
This
12 mm colony was found on a Glycerol Yeast Extract plate inoculated
with a diluted soil sample. It was almost liquid in composition, some-
thing that is indicated by its contact with the yellow colony to its right.
3-25
C
HROMOBACTERIUM VIOLACEUM
G
ROWN ON
S
HEEP
B
LOOD
A
GAR
C. violaceum produces shiny, purple, convex colonies. It is found
in soil and water, and rarely produces infections in humans.
3-26
I
NFLUENCE OF
N
UTRIENT
A
VAILABILITY ON
P
IGMENT
P
RODUCTION
Pigment production may be influenced
by environmental factors such as
nutrient availability. Chromobacterium
violaceum produces a much more intense
purple pigment when grown on Trypti -
case Soy Agar (left) than when grown on
Nutrient Agar, a less nutritious medium
(right).
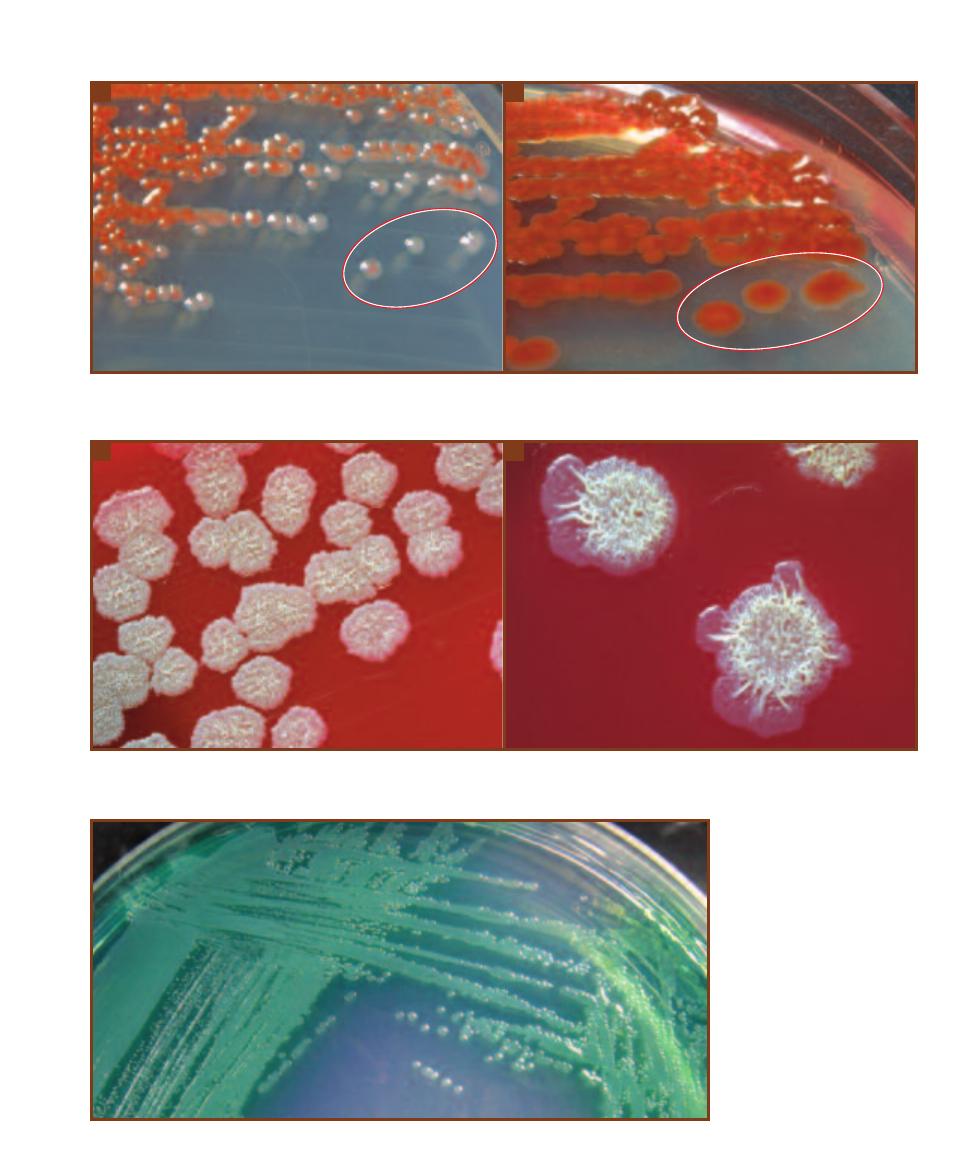
SECTION 3
䢇
Bacterial Growth
䢇
25
3-27
I
NFLUENCE OF
A
GE ON
P
IGMENT
P
RODUCTION
A
Serratia marcescens grown on Sheep Blood Agar after 24 hours.
B
The same plate of
S. marcescens after 48 hours. Note in particular the change in the 3 colonies in the lower right (encircled).
A
B
3-28
E
FFECT OF
A
GE ON
C
OLONY
M
ORPHOLOGY
A
Close-up of Bacillus subtilis on Sheep Blood Agar after 24 hours of incubation.
B
Close-up of
B. subtilis on Sheep Blood Agar after 48 hours. Note the wormlike appearance.
A
B
3-29
D
IFFUSIBLE
P
IGMENT OF
P
SEUDOMONAS AERUGINOSA
The
blue-green pigment pyocyanin often
makes P. aeruginosa easy to identify.
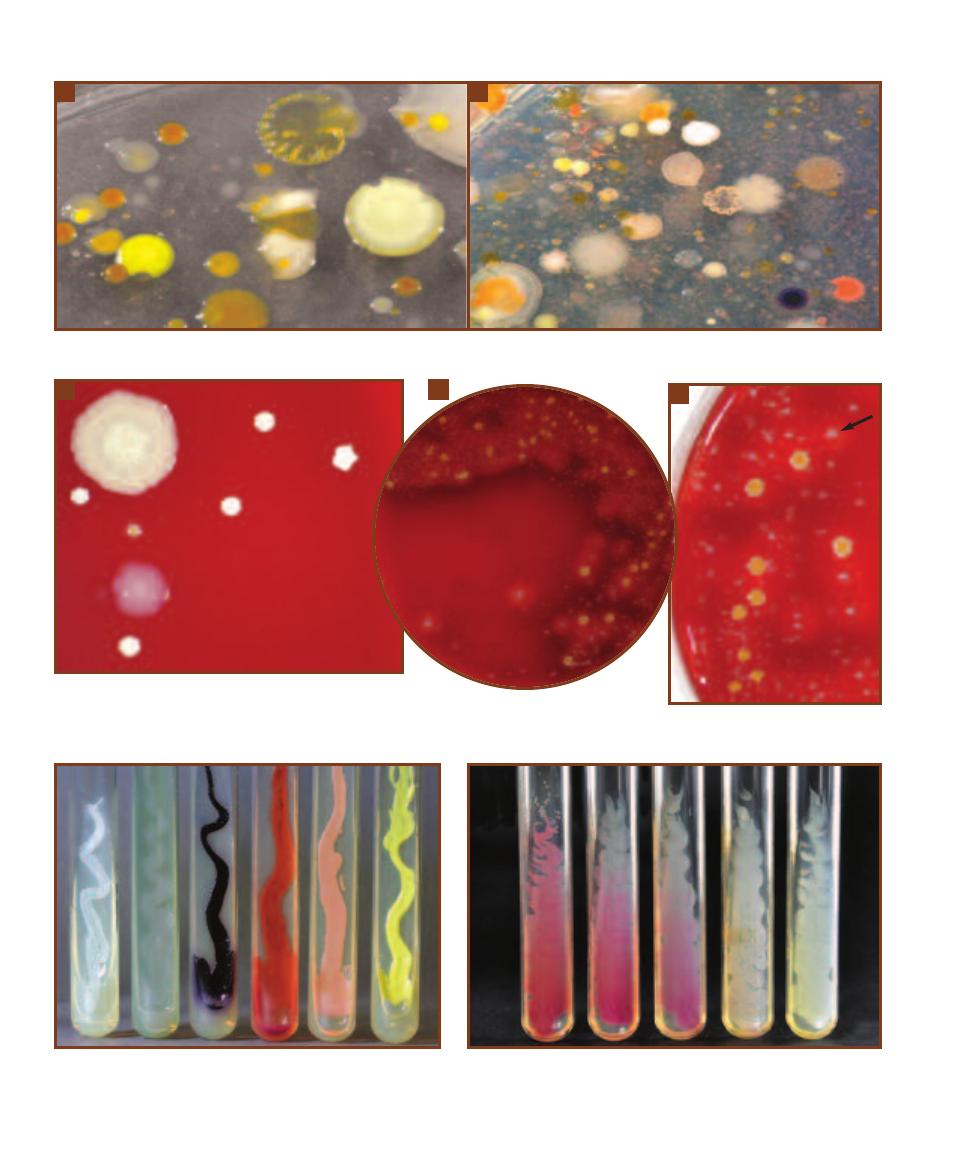
26
䢇
A Photographic Atlas for the Microbiology Laboratory
3-30
T
WO
M
IXED
S
OIL
C
ULTURES ON
N
UTRIENT
A
GAR
These plates show the morphological diversity present in two soil samples.
A
B
A
3-31
T
HREE
T
HROAT
C
ULTURES ON
S
HEEP
B
LOOD
A
GAR
A
There are probably five different species on this plate.
B
Note the ␣-hemolysis (darkening of the agar;
see page 61 for more information) shown by much of the growth.
C
This is a close-up of the same plate as in
B
. Note the weak -hemolysis of the
white colony in the upper right (arrow). White growth with -hemolysis is characteristic of Staphylococcus aureus.
3-32
P
IGMENT
P
RODUCTION ON
S
LANTS
From left to right,
Staphylococcus epidermidis (white), Pseudomonas aeruginosa (green),
Chromobacterium violaceum (violet), Serratia marcescens (red/orange),
Kocuria rosea (rose), and Micrococcus luteus (yellow).
C
B
3-33
I
NFLUENCE OF
T
EMPERATURE ON
P
IGMENT
P
RODUCTION
Serratia
marcescens was grown for 48 hours on Trypticase Soy Agar slants at five
different temperatures. From left to right: 25°C, 30°C, 33°C, 35°C, and 37°C.
A difference of 2°C makes the difference between being pigmented or not!
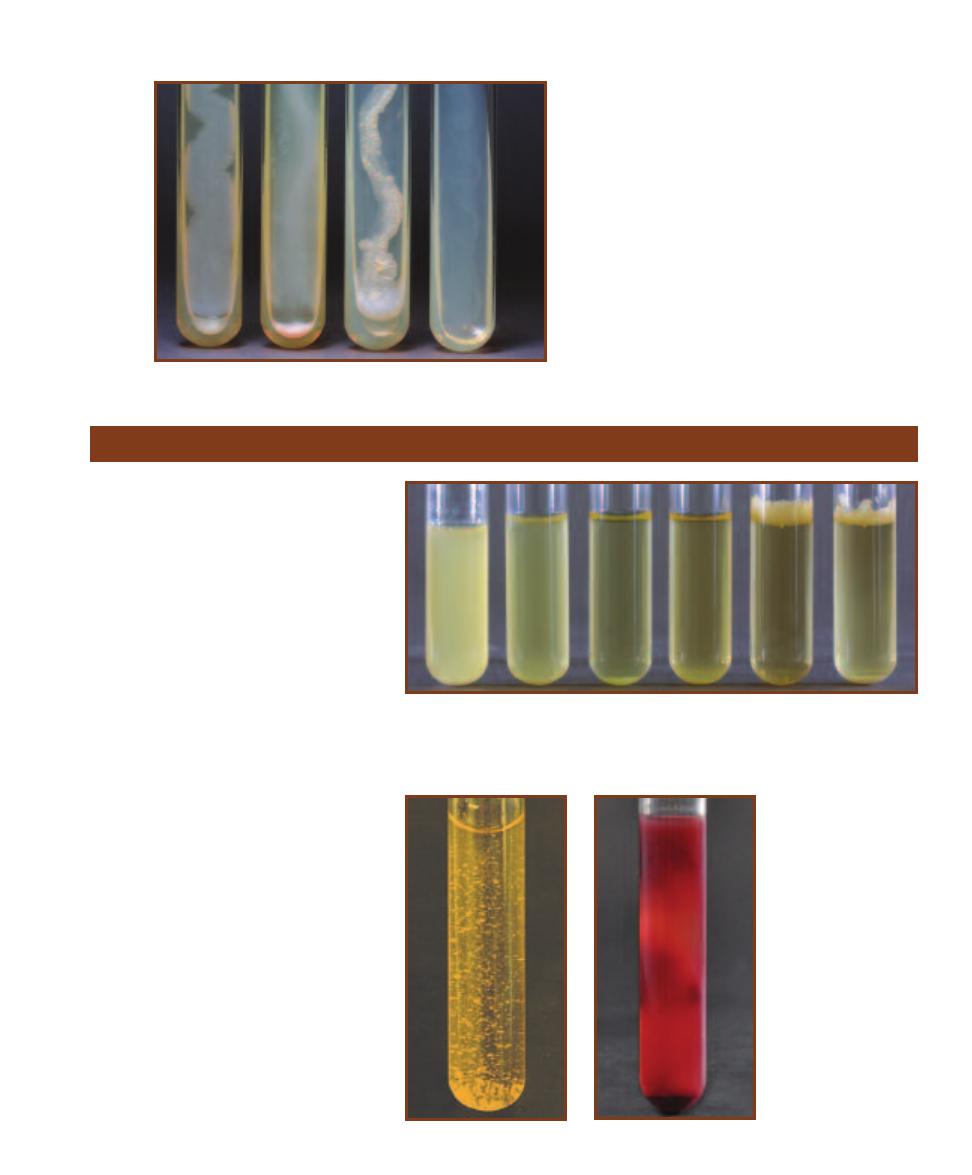
SECTION 3
䢇
Bacterial Growth
䢇
27
3-34
G
ROWTH
T
EXTURE ON
S
LANTS
From
left to right, Bacillus spp. (flat, dry), Alcaligenes
faecalis (spreading edge), Mycobacterium phlei
(crusty/friable), Lactobacillus plantarum (trans-
parent, barely visible).
Growth Patterns in Broth
䢇
Purpose
Bacterial genera—and frequently different
species within a genus—demonstrate
characteristic growth patterns in broth
that provide useful information when
attempting to identify an organism.
䢇
Principle
Microorganisms cultivated in broth display
a variety of growth characteristics. Some
organisms float on top of the medium and
produce a type of surface membrane called
a pellicle; others sink to the bottom as
sediment. Some bacteria produce uniform
fine turbidity while others appear to clump
in what is called flocculent growth. Refer
to Figures 3-35 and 3-36. Figure 3-37
shows an example of a pigmented species
(Rhodospirillum rubrum) in broth.
3-35
G
ROWTH
P
ATTERNS IN
B
ROTH
From left to right in pairs (by type of organism):
Enterobacter aerogenes and Citrobacter diversus—motile members of Enterobacteriaceae
(uniform fine turbidity), Enterococcus faecalis and Staphylococcus aureus—nonmotile Gram-
positive cocci (sediment), Mycobacterium phlei and Mycobacterium smegmatis (relatives of
Mycobacterium tuberculosis)—nonmotile with a waxy cell wall (pellicle).
3-36
F
LOCCULENCE IN
B
ROTH
This is a Streptococcus species from
a throat culture demonstrating
flocculence in Todd- Hewitt Broth.
3-37
P
IGMENT IN
B
ROTH
Rhodospirillum
rubrum has a red color due
to carotenoid pigments. It
grows as a photohetero -
troph in the presence of
light and the absence of
oxygen.
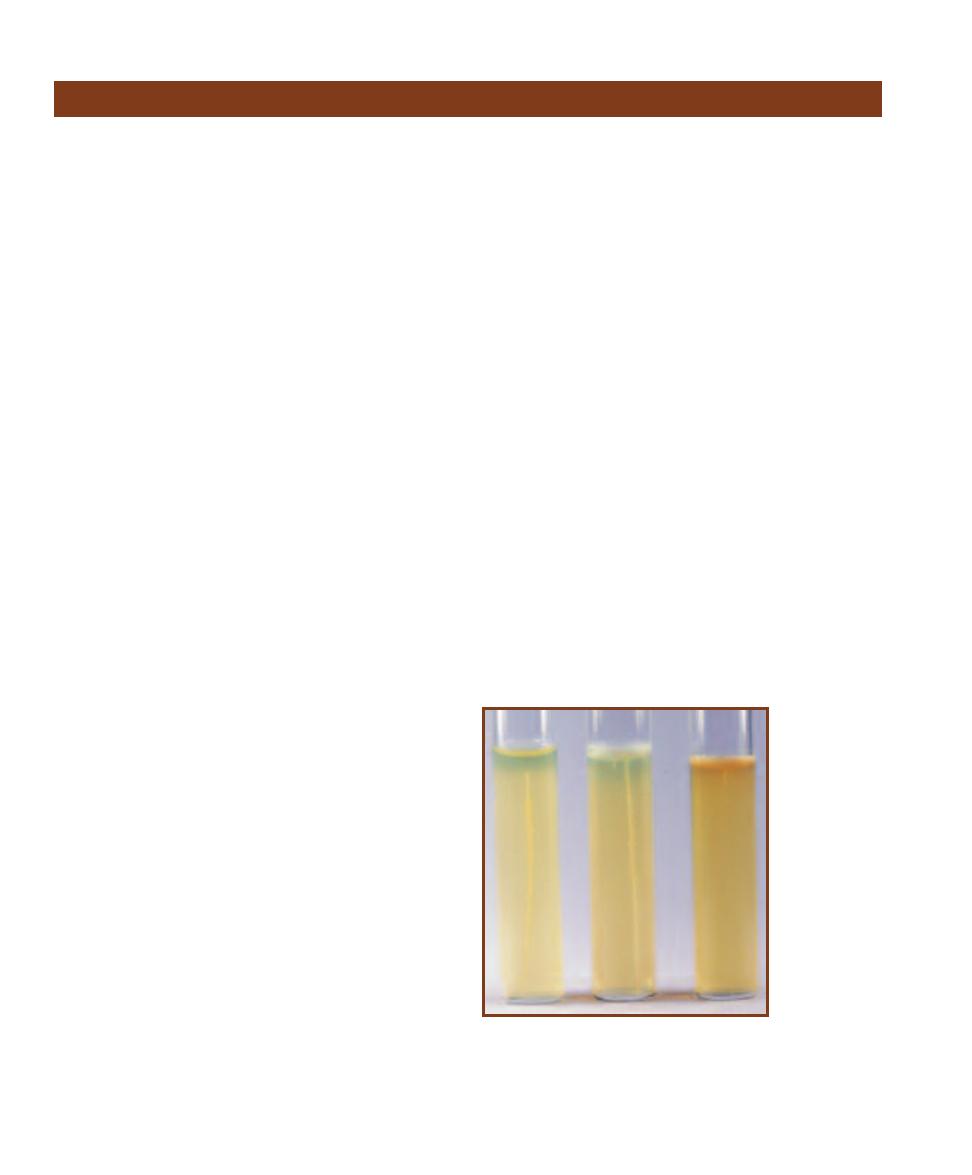
28
䢇
A Photographic Atlas for the Microbiology Laboratory
Aerotolerance
䢇
Purpose
The two procedures discussed here—agar deep stabs and
agar shakes—are good visual indicators of oxygen tolerance
(aerotolerance) in microorganisms.
䢇
Principle
Most microorganisms can survive within a range of envi-
ronmental conditions, but not surprisingly, tend to produce
growth with the greatest density in the areas where condi-
tions are most favorable. One important resource influencing
microbial growth is oxygen. Some organisms require oxygen
for their metabolic needs. Some other organisms are not
affected by it at all. Still other organisms cannot even survive
in its presence. This ability or inability to live in the presence
of oxygen is called aerotolerance.
Most growth media are sterilized in an autoclave during
preparation. This process not only kills unwanted microbes,
but also removes most of the free oxygen from the medium
as well. After the medium is removed from the autoclave
and allowed to cool, the oxygen begins to diffuse back in.
In tubed media (both liquid and solid) this process creates
a gradient of oxygen concentrations, ranging from aerobic
at the top, nearest the source of oxygen, to anaerobic at the
bottom. Because of microorganisms’ natural tendency to
proliferate where the oxygen concentration best suits their
metabolic needs, differing degrees of population density will
develop in the medium over time that can be used to visually
examine their aerotolerance.
Obligate (strict) aerobes, organisms that require oxygen
for respiration, grow at the top where oxygen is most plenti-
ful. Facultative anaerobes grow in the presence or absence of
oxygen. When oxygen is available, they respire aerobically.
When oxygen is not available, they either respire anaerobi-
cally (reducing sulfur or nitrate instead of oxygen) or ferment
an available substrate. Refer to the Appendix and Section 7
for more information on anaerobic respiration and fermenta-
tion. Where an oxygen gradient exists, facultative anaerobes
grow throughout the medium but are more dense at the top.
Aerotolerant anaerobes (or simply “aerotolerants”—not
to be confused with “aerotolerance”), organisms that don’t
require oxygen and are not adversely affected by it, live
uniformly throughout the medium. Aerotolerant anaerobes
ferment even in the presence of free oxygen. Microaero -
philes, as the name suggests, survive only in environments
containing lower than atmospheric levels of oxygen. Some
microaerophiles called capnophiles can survive only if carbon
dioxide levels are elevated. Microaerophiles will be seen
somewhere near the middle or upper middle region of the
medium. Finally, obligate (strict) anaerobes are organisms
for which even small amounts of oxygen are lethal and,
therefore, will be seen only in the lower regions of the
medium, depending on how far into the medium the oxygen
has diffused.
Agar deep stabs are prepared with Tryptic Soy Agar
(TSA) enriched with yeast extract to promote growth of a
broad range of organisms. Oxygen, which is removed from
the medium during preparation and autoclaving, immediately
begins to diffuse back in as the agar cools and solidifies.
This process creates a gradient of oxygen concentrations in
the medium, ranging from aerobic at the top to anaerobic at
the bottom.
Agar deeps are stab-inoculated with an inoculating
needle to introduce as little air as possible. The location of
growth that develops indicates the organism’s aerotolerance
(Figure 3-38).
Agar shakes are also prepared with enriched TSA, but
differ from agar deep stabs in that, after autoclaving, they
are cooled to 45°C and placed in a warm water bath until
time for inoculation. Agar shakes are inoculated in liquid
form, mixed gently to distribute the bacteria evenly through-
out the medium, and allowed to solidify. Like agar deep
stabs, the location of growth that develops in agar shakes
indicates the aerotolerance of the organism (Figure 3-39).
3-38
A
GAR
D
EEP
S
TAB
T
UBES
From left to right:
Clostridium
butyricum (strict
anaerobe),
Staphylococcus
aureus (facultative
anaerobe), and
Pseudomonas
aeruginosa (strict
aerobe).
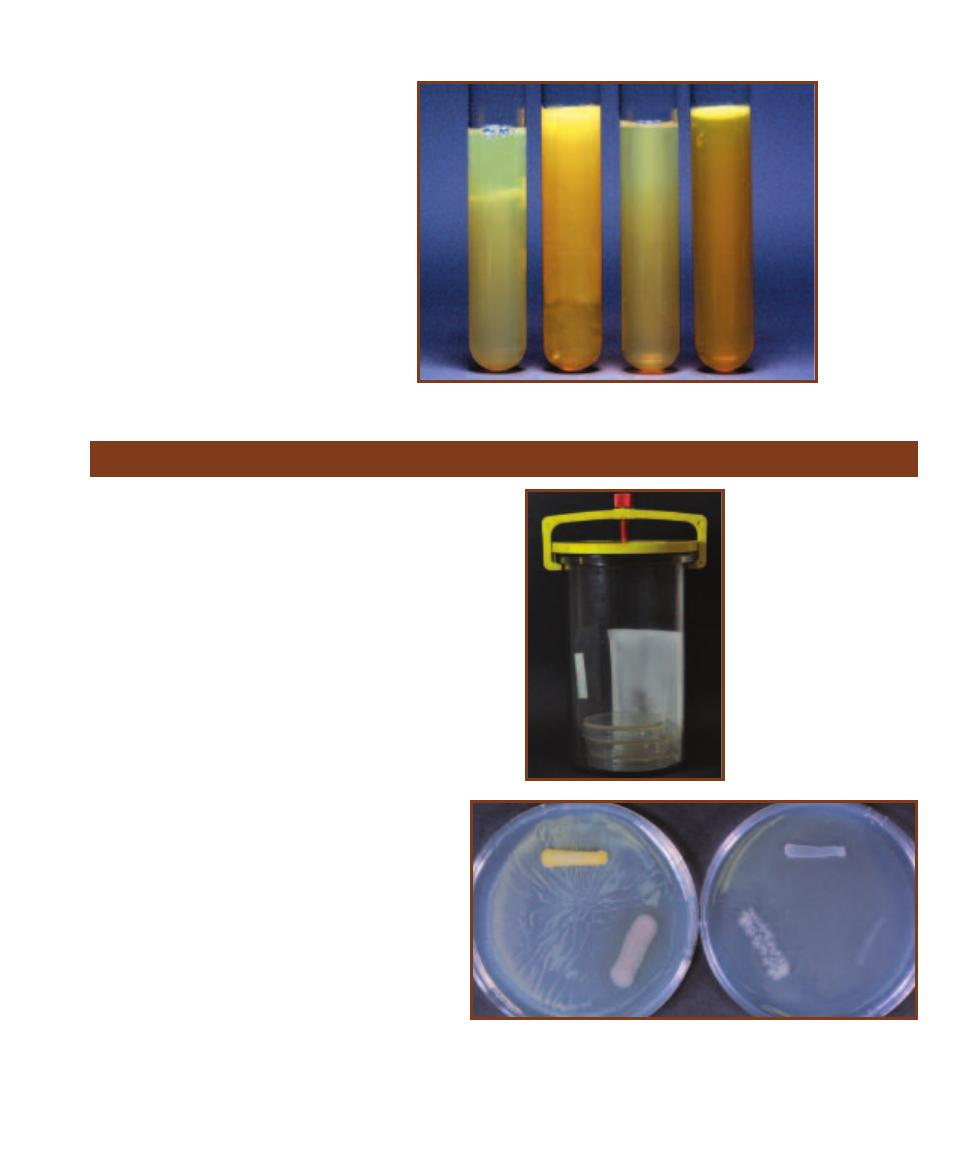
SECTION 3
䢇
Bacterial Growth
䢇
29
3-39
A
GAR
S
HAKE
T
UBES
From
left to right, Clostridium butyricum (strict
anaerobe), Escherichia coli (facultative
anaerobe), uninoculated control, and
Pseudomonas aeruginosa (strict aerobe).
Cultivation of Anaerobes—Anaerobic Jar
䢇
Purpose
Cultivation of obligate anaerobes and microaerophiles requires
providing an environment in which oxygen is either absent or
considerably reduced. Various methods have been devised to
provide these environments, three of which are covered in the
remainder of Section 3.
The anaerobic jar (Figure 3-40) is used to grow obligate
anaerobes and microaerophiles. Because it is the atmosphere
within the jar that is anaerobic, the jar can be incubated in a
normal incubator alongside aerobically grown cultures.
䢇
Principle
Inoculated plates or tubes are placed in the jar and the
appropriate gas-generating sachet is activated. In the case
of the Anaerogen
TM
Gas Generating System by Oxoid,
simply opening the packet inside the jar and imme -
diately clamping the lid on the jar is all that is neces-
sary. Ascorbic acid in the packet reacts with free
oxygen and in turn releases CO
2
. Within 30 minutes,
the atmosphere inside the jar is less than 1% O
2
and
between 9 and 13% CO
2
. A methy lene blue (or some
other) indicator strip is also placed inside the jar. It
will turn blue if exposed to air, thus acting as a con-
trol to ensure anaerobic conditions have been pro-
duced. Figure 3-41 shows two plates inoculated with
the same organisms, but one was incubated anaero -
bically while the other was incubated aerobically.
The Oxoid Campygen
TM
sachet works in a simi-
lar way, but produces 5% O
2
, 10% CO
2
, and 85%
N
2
. It is designed for growing microaerophiles, such
as Campylobacter jejuni.
3-40
T
HE
A
NAEROBIC
J
AR
Note the sachet and the white
in dicator strip inside the jar. The
sachet has performed properly,
reducing the oxygen level within
the jar to less than 1%, as evi-
denced by the indicator strip. If
the indi cator were blue, it would
mean free oxygen remained in
the jar and the resulting growth
would be in question relative to
its ability to survive in anaerobic
conditions.
3-41
P
LATES
I
NCUBATED
I
NSIDE AND
O
UTSIDE THE
A
NAEROBIC
J
AR
Both Nutrient Agar plates were inoculated with Staphylococcus aureus (top),
Pseudomonas aeruginosa (right), and Clostridium sporogenes (left). The plate
on the left was incubated aerobically outside the jar; the plate on the right was
incubated inside the anaerobic jar. Note the relative amounts of growth of the
three organisms.
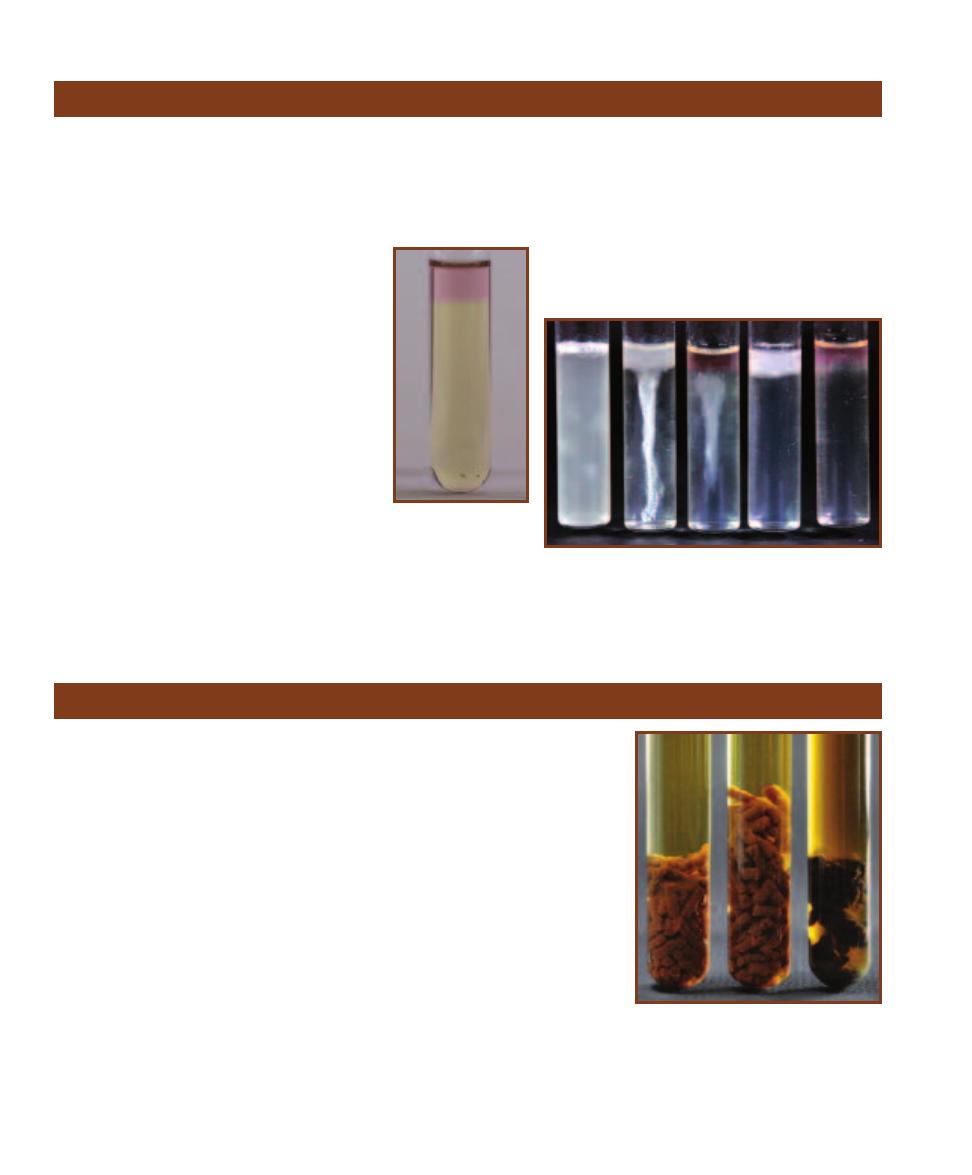
30
䢇
A Photographic Atlas for the Microbiology Laboratory
Cultivation of Anaerobes—Thioglycollate Broth
䢇
Purpose
Fluid Thioglycollate Medium is a simple, inexpensive system
for cultivating small numbers of anaerobic or microaerophilic
bacteria. It is a liquid medium formulated to promote growth
of a wide variety of fastidious anaerobic and microaerophilic
microorganisms.
䢇
Principle
Fluid Thioglycollate Medium is prepared as a
basic medium or with a variety of supplements,
depending on the specific needs of organisms
being cultivated. As such, it is appropriate for
a broad variety of aerobic and anaerobic,
fastidious and nonfastidious organisms. It is
particularly well adapted for cultivation of
strict anaerobes and microaerophiles.
Key components of the medium are yeast
extract, pan creatic digest of casein, dextrose,
sodium thioglycollate, L-cystine, and resazurin.
Yeast extract and pancreatic digest of casein
provide nutrients; sodium thioglycollate and L-
cystine reduce oxygen to water; and resazurin
(pink when oxidized, colorless when reduced)
acts as an indicator. A small amount of agar is
included to slow oxygen diffusion.
Oxygen is removed from the medium during auto claving
but begins to diffuse back in as the tubes cool to room tem-
perature. This produces a gradient of concentrations from
fully aerobic at the top to anaerobic at the bottom. Thus,
fresh media will appear clear to straw colored with a pink
region at the top where the dye has become oxi-
dized (Figure 3-42). Figure 3-43 demonstrates some
basic bacterial growth patterns in the medium as
influenced by the oxygen gradient.
3-42
A
EROBIC ZONE
IN
T
HIOGLYCOLLATE
M
EDIUM
Note the
pink region in the top
(oxidized) portion of
the broth. The bottom
(reduced) portion of
the medium remains
colorless.
3-43
G
ROWTH
P
ATTERNS IN
T
HIOGLYCOLLATE
M
EDIUM
Growth patterns of a variety of organisms are shown in these
Fluid Thioglycollate Broths. Pictured from left to right are:
aerotolerant anaerobe, facultative anaerobe, strict anaerobe,
strict aerobe, and microaerophile. Compare these tubes with
the uninoculated broth in Figure 3-42.
Cultivation of Anaerobes—Cooked Meat Broth
䢇
Purpose
The purpose of Cooked Meat Broth is to grow anaerobes, especially pathogenic
clostridia such as Clostridium per fringens, C. tetani, C. botulinum, and C. difficile.
Certain clostridia are proteolytic, whereas others are saccharolytic.
Because it is the medium that becomes anaerobic, these tubes can be incubated
in an aerobic incubator, thus eliminating the need for expensive equipment.
䢇
Principle
Cooked Meat Broth (Figure 3-44) is a nutrient-rich medium, with beef heart, peptone,
and dextrose acting as carbon and nitrogen sources. The beef heart is in the form of
meat par ticles, whereas the other ingredients are dissolved in the broth. Anaerobic
conditions occur as a result of several factors. One, cardiac muscle contains gluta -
thione, a tripeptide that can reduce free molecular oxygen in the medium. Two, the
meat is cooked prior to use. This denatures proteins and exposes their sulfhydryl
groups, which perform the same function—oxygen reduction. Lastly, the medium
with caps loosened is either incubated in an anaerobic jar for 24 hours to remove O
2
or boiled to drive off the O
2
. Caps are immediately tightened to prevent the reentry
of O
2
. Blackening and disintegration of the meat particles indicate proteolytic growth.
Acid (not indicated directly) and gas production indicate saccharolytic growth.
3-44
C
OOKED
M
EAT
B
ROTH
The meat
particles are visible in each broth. From left
to right: Clostridium butyricum, uninocu-
lated, C. sporogenes. Blackening of the meat
particles by C. sporogenes is indicative of
pro teolytic activity. C. butyri cum grew, but
is not proteolytic.
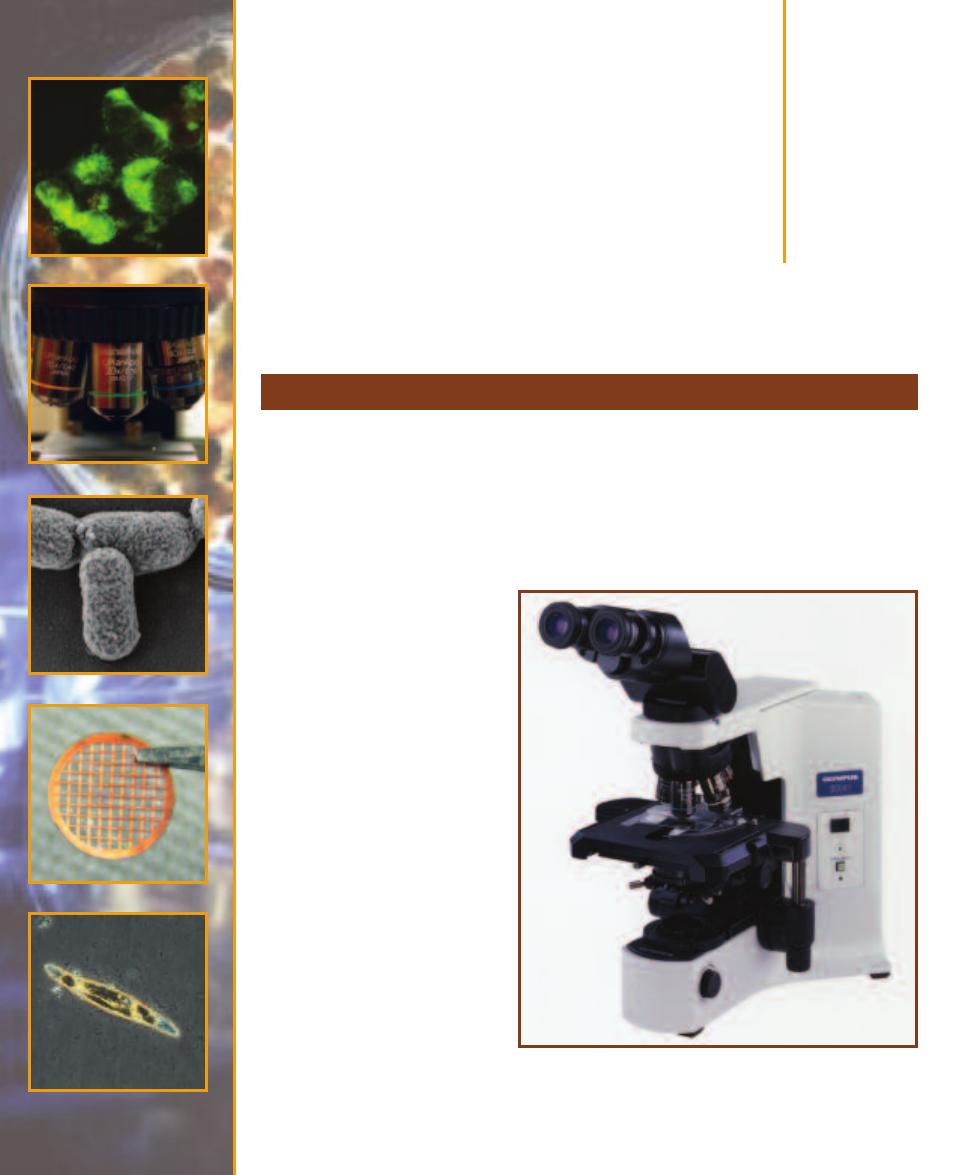
Microscopy
Types of Microscopy
4
S E C T I O N
31
The earliest microscopes used visible light to create images and were little more than magnifying
glasses. Today, more sophisticated compound light microscopes (Figure 4-1) are routinely used in
microbiology laboratories. The various types of light microscopy include bright-field, dark-field,
fluorescence, and phase contrast microscopy (Figure 4-2). Although each method has specific
applications and advantages, bright-field microscopy is most commonly used in introductory
classes and clinical laboratories. Many research applications use electron microscopy because of
its ability to produce higher quality images of greater magnification.
Light Microscopes
Bright-field microscopy produces
an image made from light that is
transmitted through a specimen
(Figure 4-2A). The specimen re-
stricts light transmission and ap-
pears “shadowy” against a bright
background (where light enters
the microscope unimpeded). Be-
cause most biological specimens
are transparent, contrast between
the specimen and the background
can be improved with the applica-
tion of stains to the specimen (see
Sections 5 and 6). The price of
improved contrast is that the
staining process usually kills cells.
This is especially true of bacterial
staining protocols.
Image formation begins with
light coming from an internal or an
external light source (Figure 4-3).
It passes through the condenser
lens, which concentrates the light
and makes illumination of the
specimen more uniform. Refrac -
tion (bending) of light as it passes
4-1
A B
INOCULAR
C
OMPOUND
M
ICROSCOPE
A quality microscope
is an essential tool for microbiologists. Most are assembled with ex-
changeable component parts and can be customized to suit the particu-
lar needs of the user.
Photograph courtesy of Olympus America Inc.
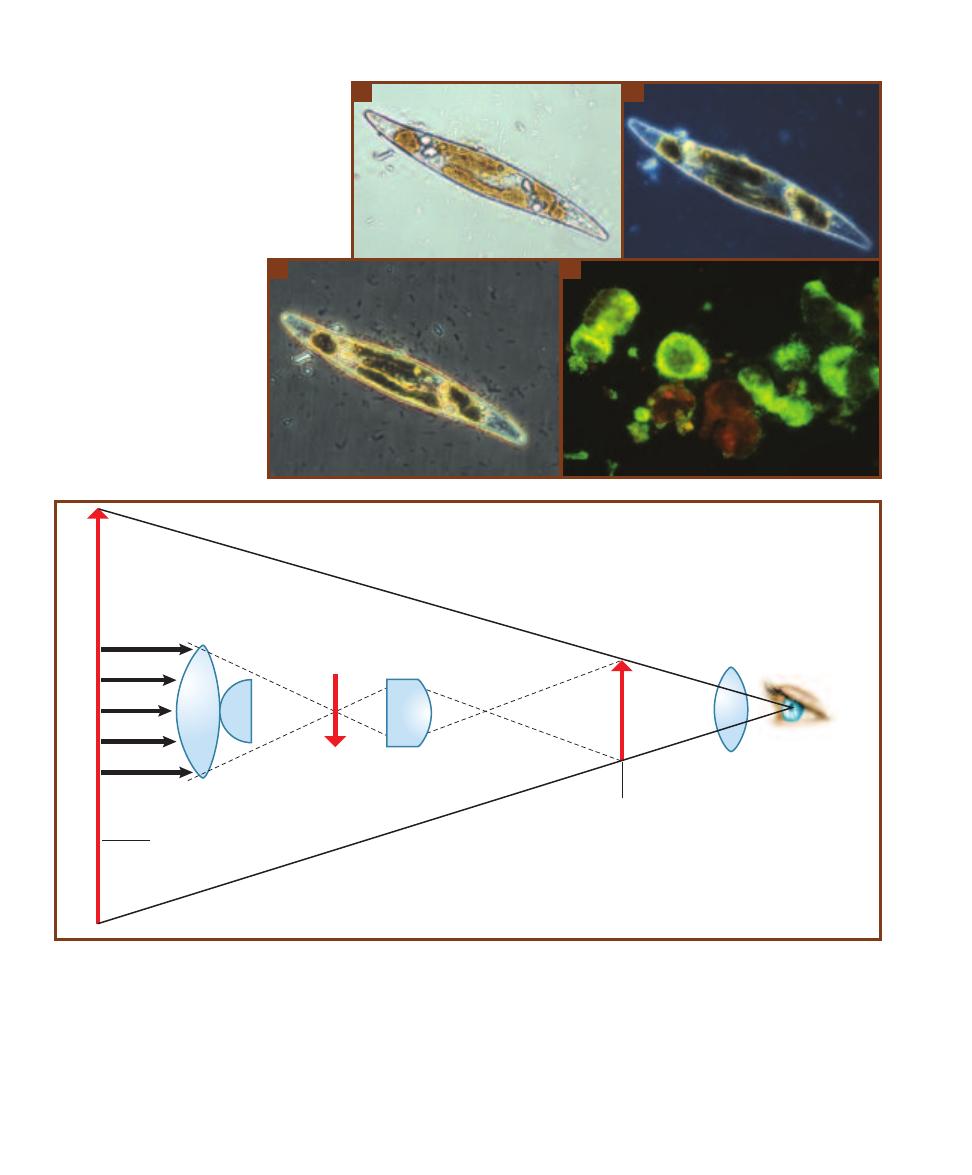
through the objective lens from the specimen produces a
magnified real image. This image is magnified again as it
passes through the ocular lens to produce a virtual image
that appears below or within the microscope. The amount
of magnification produced by each lens is marked on the
lens (Figure 4-4A and B). Total mag nification of the speci-
men can be calculated by using the following formula:
Total Magnification
⳱ Magnification of the Objective Lens ⳯ Magnification of the Ocular Lens
32
䢇
A Photographic Atlas for the Microbiology Laboratory
A
B
4-2
T
YPES OF
L
IGHT
M
ICROSCOPY
A
This is a
bright-field micrograph of an entire diatom (called a
“whole mount”). Because of its thickness, the entire
organism will not be in focus at once. Contin ually
adjusting the fine focus to clearly observe different
levels of the organism will give a sense of its three-
dimensional structure. The bright rods around the
diatom are bacteria.
B
The same diatom viewed
with dark-field microscopy. Notice that dark-field is
especially good at pro viding contrast between the
organism’s edge and its interior
and the background. Notice also
that the bacteria are not visible,
though this would not always be
the case.
C
This phase contrast
image of the same diatom shows
different details of the interior
than what is seen in the other
two micrographs. Also, notice
the bacteria are dark.
D
This is
a fluorescence micrograph of
Mycobacterium kansasii. The apple
green is one of the characteristic
colors of fluorescence microscopy.
C
D
Ocular Lens
Observer's
eye
Real image
(formed by objective lens)
Objective lens
Specimen
Condenser
Virtual image
(formed by ocular lens)
Light
4-3
I
MAGE
P
RODUCTION IN A
C
OMPOUND
L
IGHT
M
ICROSCOPE
Light from the source is focused on the specimen by the condenser lens. It then
enters the objective lens, where it is magnified to produce a real image. The real image is magnified again by the ocular lens to produce a virtual
image that is seen by the eye.
(After Chan, et al., 1986)
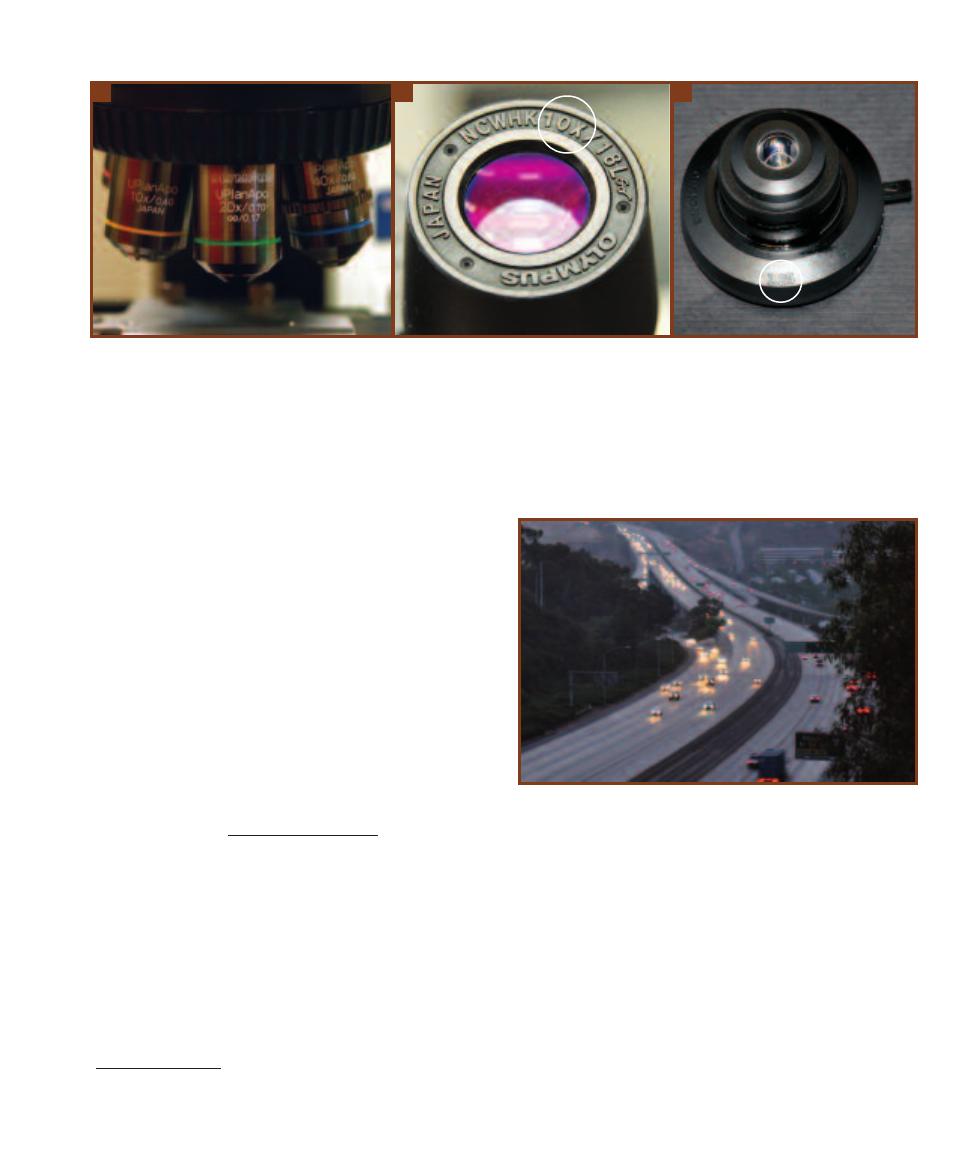
The practical limit to magnification with a light micro-
scope is around 1300X. Although higher magnifications are
possible, image clarity is more difficult to maintain as the
magnification increases. Clarity of an image is called reso -
lution (Figure 4-5). The limit of resolution (or resolving
power) is an actual measurement of how far apart two
points must be in order for the microscope to view them as
being separate. Notice that resolution improves as resolving
power is made smaller.
The best limit of resolution achieved by a light micro-
scope is about 0.2 µm. (That is, at its absolute best, a light
microscope cannot distinguish between two points closer
together than 0.2 µm.) For a specific microscope, the actual
limit of resolution can be calculated with the following
formula:
1
D
⳱
NA
Condenser
Ⳮ NA
Objective
where D is the minimum distance at which two points can
be resolved,
is the wavelength of light used, and NA
condenser
and NA
objective
are the numerical apertures of the condenser
lens and objective lens, respectively. Because numerical
aperture has no units, the units for D are the same as the
units for wavelength, which typically are in nanometers (nm).
Numerical aperture is a measure of a lens’s ability to
“capture” light coming from the specimen and use it to
make the image. As with magnification, it is marked on
the lens (Figures 4-4A and C). Using immersion oil between
the specimen and the objective lens increases its numerical
aperture and in turn, makes its limit of resolution smaller.
(If necessary, oil may also be placed between the condenser
lens and the slide.) The result is better resolution.
The light microscope may be modified to improve its
ability to produce images with contrast without staining,
which often distorts or kills the specimen. In dark-field
microscopy (Figure 4-2B), a special condenser is used so only
the light reflected off of the specimen enters the objective.
SECTION 4
䢇
Microscopy
䢇
33
1
Different equations have been developed to determine approximate
limit of resolution, each made from different assumptions. The one
used here assumes the NA
Objective
≥ NA
Condenser
.
A
B
C
4-4
M
ARKINGS OF
M
AGNIFICATION AND
N
UMERICAL
A
PERTURE ON
M
ICROSCOPE
C
OMPONENTS
A
Three plan apochromatic objective lenses on
the nosepiece of a light microscope. Plan means the lens produces a flat field of view. Apochromatic lenses are made in such a way that chromatic
aberration is reduced to a minimum. From left to right, the lenses magnify 10X, 20X, and 40X, and have numerical apertures of 0.40, 0.70, and 0.85.
The 20X lens has other markings on it. The mechanical tube length is the distance from the nosepiece to the ocular and is usually between 160 to
210 mm. However, this 20X lens has been corrected so the light rays are made parallel, effectively creating an infinitely long mechanical tube length
(
⬁
). This allows insertion of accessories into the light path without decreasing image quality. The thickness of cover glass to be used is also given
(0.17 Ⳳ 0.01 mm).
B
A 10X ocular lens.
C
A condenser (removed from the microscope) with a numerical aperture of 1.25. The lever at the right is used
to open and close the iris diaphragm and adjust the amount of light entering the specimen.
4-5
R
ESOLUTION AND
L
IMIT OF
R
ESOLUTION
The headlights of most
automobiles are around 1.5 m apart. As you look at the cars in the fore-
ground of the photo, it is easy to see both headlights as separate objects.
The automobiles in the distance appear smaller (but really aren’t) as
does the apparent distance between the headlights. When the apparent
distance between automobile headlights reaches about 0.1 mm, they
blur into one because that is the limit of resolution of the human eye.
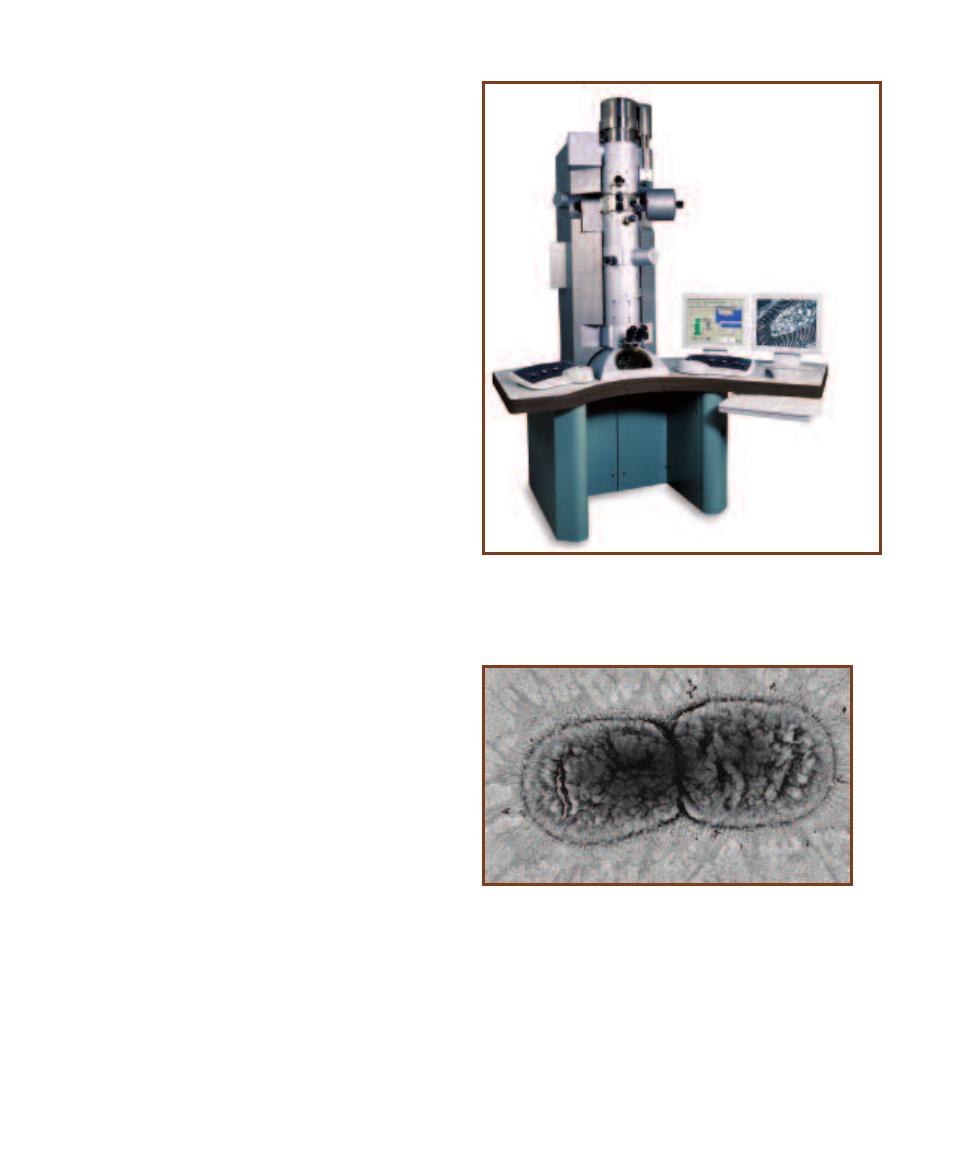
The appearance is of a brightly lit specimen against a dark
background, and often with better resolution than that of
the bright field microscope.
Phase contrast microscopy (Figure 4-2C) uses special
optical components to exploit subtle differences in the
refractive indices of water and cytoplasmic components to
produce contrast. Light waves that are in phase (that is,
their peaks and valleys exactly coincide) reinforce one
another and their total intensity (because of the summed
amplitudes) increases. Light waves that are out of phase by
exactly one-half wavelength cancel each other and result in
no intensity—that is, darkness. Wavelengths that are out of
phase by any amount will produce some degree of cancella-
tion and result in brightness that is less than maximum but
more than darkness. Thus, contrast is provided by differences
in light intensity that result from differences in refractive
indices in parts of the specimen that put light waves more
or less out of phase. As a result, the specimen and its parts
appear as various levels of darks and lights.
Fluorescence microscopy (Figure 4-2D) uses a fluores-
cent dye on the specimen that emits fluorescence when
illuminated with ultraviolet radiation. In some cases, speci-
mens possess naturally fluorescing chemicals and no dye is
needed.
The Electron Microscope
The electron microscope uses an electron beam to create an
image, with electromagnets acting as lenses. The limit of
resolution is improved by a factor of 1000 (theoretically
down to 0.1 nm, but more realistically down to 2 nm) over
the light microscope.
The transmission electron microscope (TEM) (Figure
4-6) produces a two-dimensional image of an ultrathin
section by capturing electrons that have passed through the
specimen. The degree of interaction between the electrons
and the heavy metal stain affects the kinetic energy of the
electrons, which are collected by a fluorescent plate. The
light of varying intensity emitted from the plate is directly
proportional to the electron’s kinetic energy and is used to
produce the image. The TEM is useful for studying a cell’s
interior, its ultrastructure. A sample transmission electron
micrograph is shown in Figure 4-7.
The previous paragraph gave a brief overview of how
the TEM works. However, a key to successful transmission
electron microscopy is excellent sample preparation. Fol-
lowing is an overview of sample preparation. The specimen
is fixed by one of various methods (treatment with formalde-
hyde, glutaraldehyde, or osmium tetroxide) to prevent cell
decomposition, stained with an electron dense material
(lead, uranium, or osmium compounds), dehydrated, and
embedded in a plastic block (Figure 4-8). It is then cut into
thin slices using an ultramicrotome (Figure 4-9) armed with
a glass or diamond blade. The slices are captured on a grid
(Figure 4-10), which is inserted into the TEM so it rests in
the electron beam path. Figure 4-11 shows what the micro-
scopist sees when working.
A scanning electron microscope (SEM) (Figure 4-12) is
used to make a three-dimensional image of the specimen’s
surface. In this technique, a beam of electrons is passed over
34
䢇
A Photographic Atlas for the Microbiology Laboratory
4-6
T
RANSMISSION
E
LECTRON
M
ICROSCOPE
The transmission
electron microscope produces an image using electrons that pass
through the specimen. The image is then viewed on the monitor.
This particular model magnifies from 8X up to 630,000X.
Photograph courtesy of Carl Zeiss NTS GmbH
4-7
T
RANSMISSION
E
LECTRON
M
ICROGRAPH
The TEM pro-
duces images of sectioned specimens. Since light is not used, the
image is not in color. These cells were magnified 12,500X.
Photograph courtesy of Carl Zeiss NTS GmbH
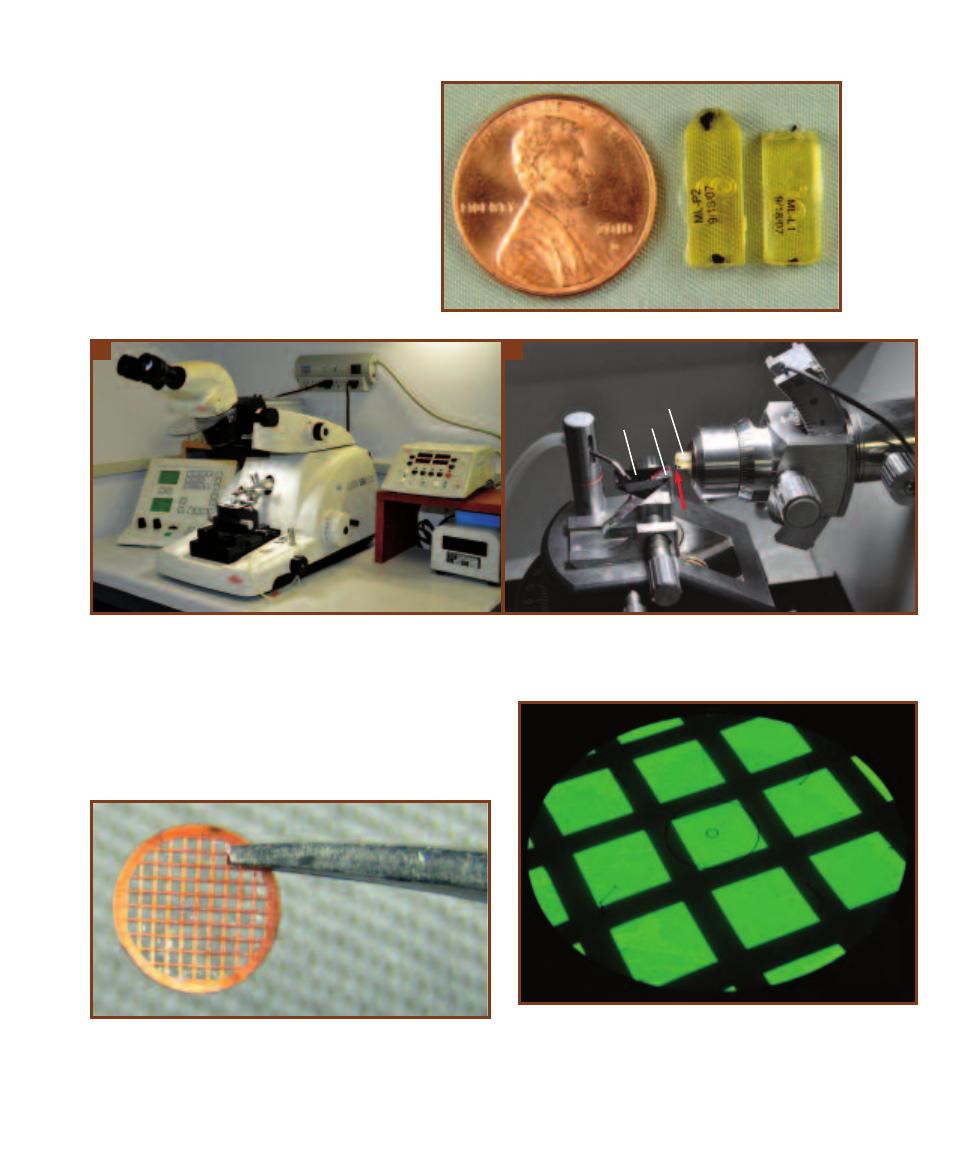
SECTION 4
䢇
Microscopy
䢇
35
4-8
TEM S
PECIMEN
E
MBEDDED IN A
P
LASTIC
B
LOCK
These plastic resin blocks
contain specimens, the black spots within the
blocks. On the right is a trimmed block that
has had excess resin cut away to produce a
minute piece of specimen that extends from
the block. This is the portion of specimen to
be sectioned (Figure 4-9).
4-9
U
LTRAMICROTOME
A
This ultramicrotome is capable of producing specimen slices 100 nm in thickness (and less). The arm holding the
specimen traces an elliptical path as it approaches and is withdrawn from the sample. In each cycle, it is advanced the distance equal to the desired
section thickness, often 100 nm.
B
The specimen block (S), with the tiny, trimmed down specimen (arrow) facing the blade (Bl), is held in the ultra -
microtome chuck. As the specimen moves forward and passes by the glass or diamond blade a thin slice is made, which is caught and floated on
water in the boat (Bt) behind the blade. The specimen holder is with-
drawn, returned to the starting position, and advanced by the desired
thickness and another cut is made. The process is repeated to produce
multiple sections of the same thickness.
A
B
4-10
T
HE
G
RID AND
G
RID
H
OLDER
The thin sections are picked up
by a grid (shown), which acts as the equivalent of a glass slide in light
microscopy. The shiny material between grid bars is a plastic film that
fills in the openings and keeps specimens from dropping through. The
grid is placed in a grid holder that is inserted into the TEM. The grid with
its specimens is thus positioned in the electron beam path.
4-11
T
HE
V
IEWING
S
CREEN
Electron beams do not produce an
image visible to the human eye. In order for the image to be seen, the
microscopist views the specimen on this screen coated with a phos -
phorescent material. The kinetic energy of the electrons hitting the
screen is converted to light, which makes the specimen visible. The
thick, dark lines are the grid bars at very low magnification. The image
is also captured by a digital camera and viewed on a computer monitor.
Bt
Bl
S
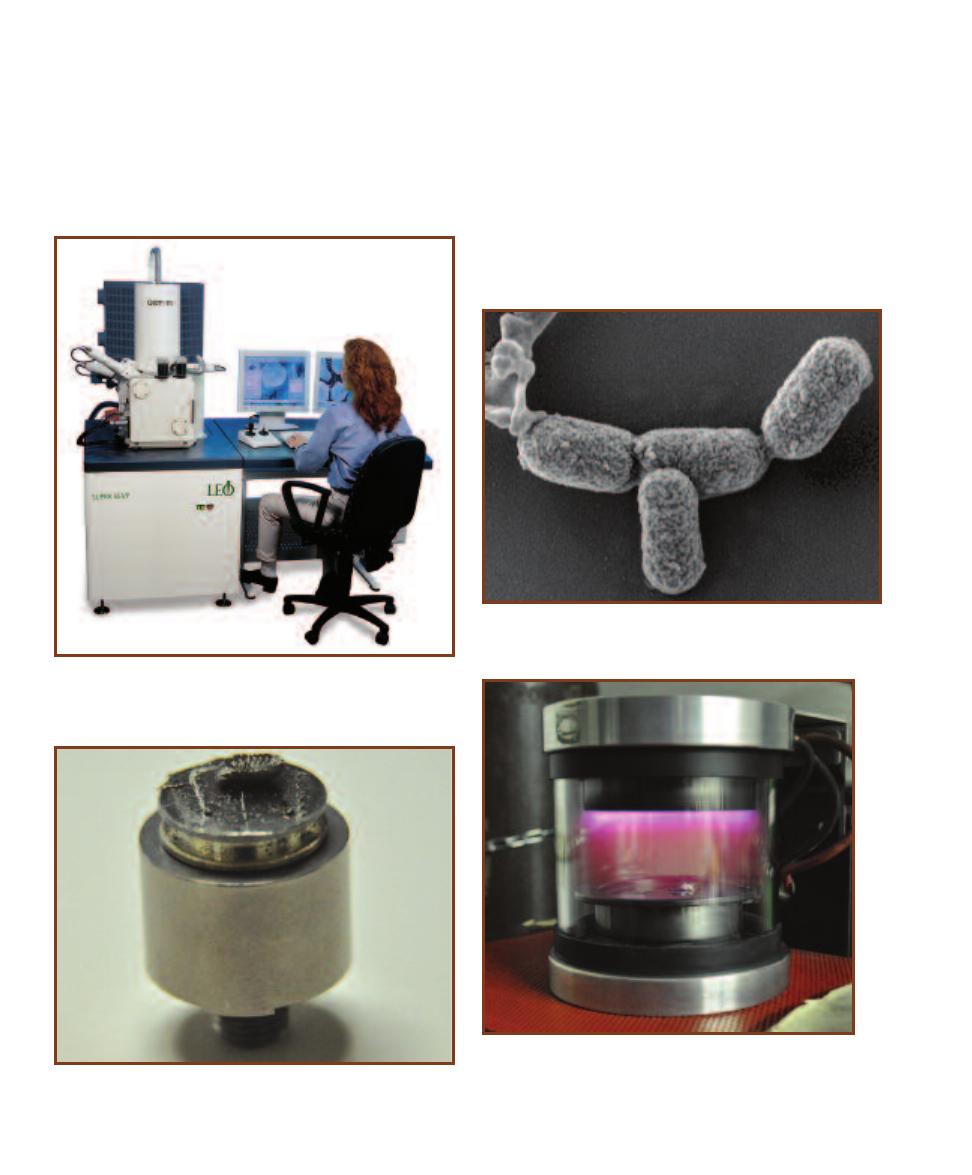
the stained surface of the specimen. Some electrons are
reflected (backscatter electrons), whereas other electrons
(secondary electrons) are emitted from the metallic stain.
These electrons are captured and used to produce the three-
dimensional image. A sample scanning electron micrograph
is shown in Figure 4-13.
As with the TEM, sample preparation involves fixation,
dehydration, and staining (but not sectioning). Once the
sample is fixed and dehydrated, it is mounted on a stub
(Figure 4-14) and coated with the “stain” (usually gold) by
a process known as “sputter coating.” A simple explanation
of this process is as follows. Argon gas is ionized in an
electric field within an evacuated chamber. The positively
charged argon ions bombard a gold foil, which releases gold
atoms that are free to coat the sample. Figure 4-15 shows a
sputter coater.
36
䢇
A Photographic Atlas for the Microbiology Laboratory
4-14
SEM S
PECIMEN
M
OUNTED ON A
S
TUB
This is a gold-coated
pill bug resting on its back upon the platform of the stub. The larger
cylinder is a holder for the stub.
4-12
S
CANNING
E
LECTRON
M
ICROSCOPE
This scanning electron
microscope has the ability to magnify from 12X to 900,000X with a
resolving power as low as 1.0 nm.
Photograph courtesy of Carl Zeiss NTS GmbH
4-13
S
CANNING
E
LECTRON
M
ICROGRAPH
Like the TEM, the image
produced by the SEM has no color, but it is three-dimensional. This
micrograph is of E. coli.
Photograph courtesy of Carl Zeiss NTS GmbH
4-15
S
PUTTER
C
OATER
Stubs with specimens are placed in the
sputter coater chamber, which is then evacuated. Sputtering with
gold occurs when ionized argon gas bombards a gold foil to re-
lease gold atoms. Two specimens are visible within; the purple is
the argon gas.
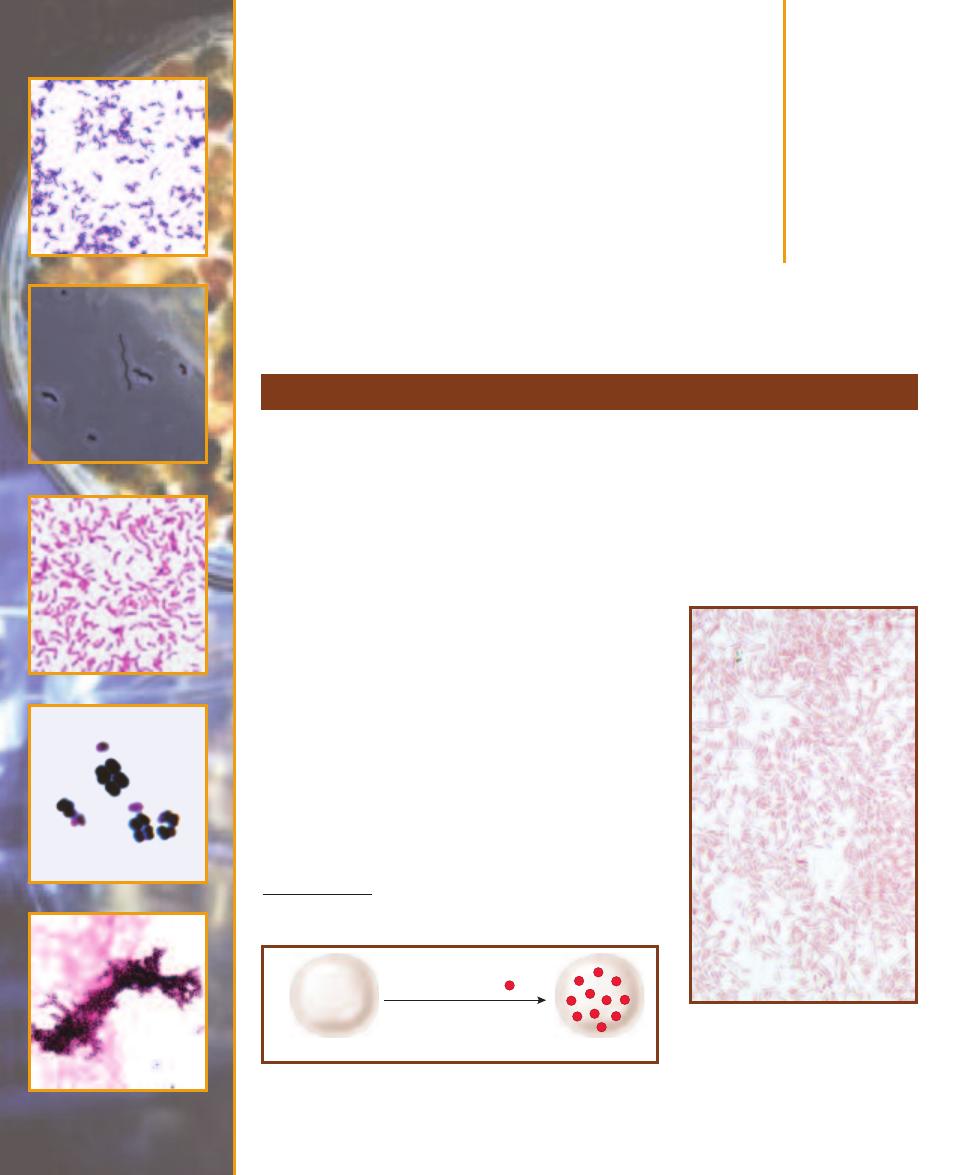
Bacterial Cellular
Morphology
and Simple Stains
䢇
Purpose
In Section 4 you were introduced to two of the three important features of a microscope and
microscopy: magnification and resolution. A third feature is contrast. To be visible, the specimen
must contrast with the background of the microscope field. Because cytoplasm is essentially trans -
parent, viewing cells with the standard light microscope is difficult without stains to provide that
contrast. Once stained, cell morphology, size, and arrangement then may be determined.
䢇
Principle
Stains are solutions consisting of a solvent (usually water or
ethanol) and a colored molecule (often a benzene derivative),
the chromogen. The portion of the chromogen that gives it
its color is the chromophore. A chromogen may have mul -
tiple chromophores, with each intensifying the color. The
auxochrome is the charged portion of a chromo gen and
allows it to stain the cell through ionic or covalent bonds.
Basic stains
1
(where the auxochrome becomes positively
charged as a result of picking up a hydrogen ion or losing
a hydroxide ion) are attracted to the negative charges on
the surface of most bacterial cells. Thus, the cell becomes
colored (Figure 5-1). Common basic stains include methyl-
ene blue, crystal violet, and safranin. Examples of basic
stains may be seen in Figures 5-2 and 5-3, and in A Gallery
of Bacterial Cell Diversity (pages 39–44).
Simple Stains
5
S E C T I O N
37
_
_
_
_
Cell is stained
Negatively charged cell
Apply basic stain
(Positive Chromogen )
+
+
+
+
_
_
_
_
_
_
_
_
_
_
+
+
+
+
+
+
+
+
_
_
+
+
_
_
+
+
_
_
+
+
+
+
_
_
+
+
+
+
_
_
_
_
_
_
_
_
_
_
_
_
_
_
_
_
_
_
_
_
_
_
5-1
C
HEMISTRY OF
B
ASIC
S
TAINS
Basic stains have a positively
charged chromogen (
●
ⴐ
), which forms an ionic bond with the negatively
charged bacterial cell, thus colorizing the cell.
5-2
A S
IMPLE
S
TAIN
U
SING
S
AFRANIN
Safranin is a basic stain. Notice that the
stain is associated with the cells and not
the background. The organism is Klebsiella
mobilis (formerly Enterobacter aerogenes),
grown in culture. Cell dimensions are
0.3–1.0 µm wide by 0.6–6.0 µm long.
1
Notice that the term “basic” means “alkaline,” not “elementary,” although
coincidentally basic stains can be used for simple staining procedures.
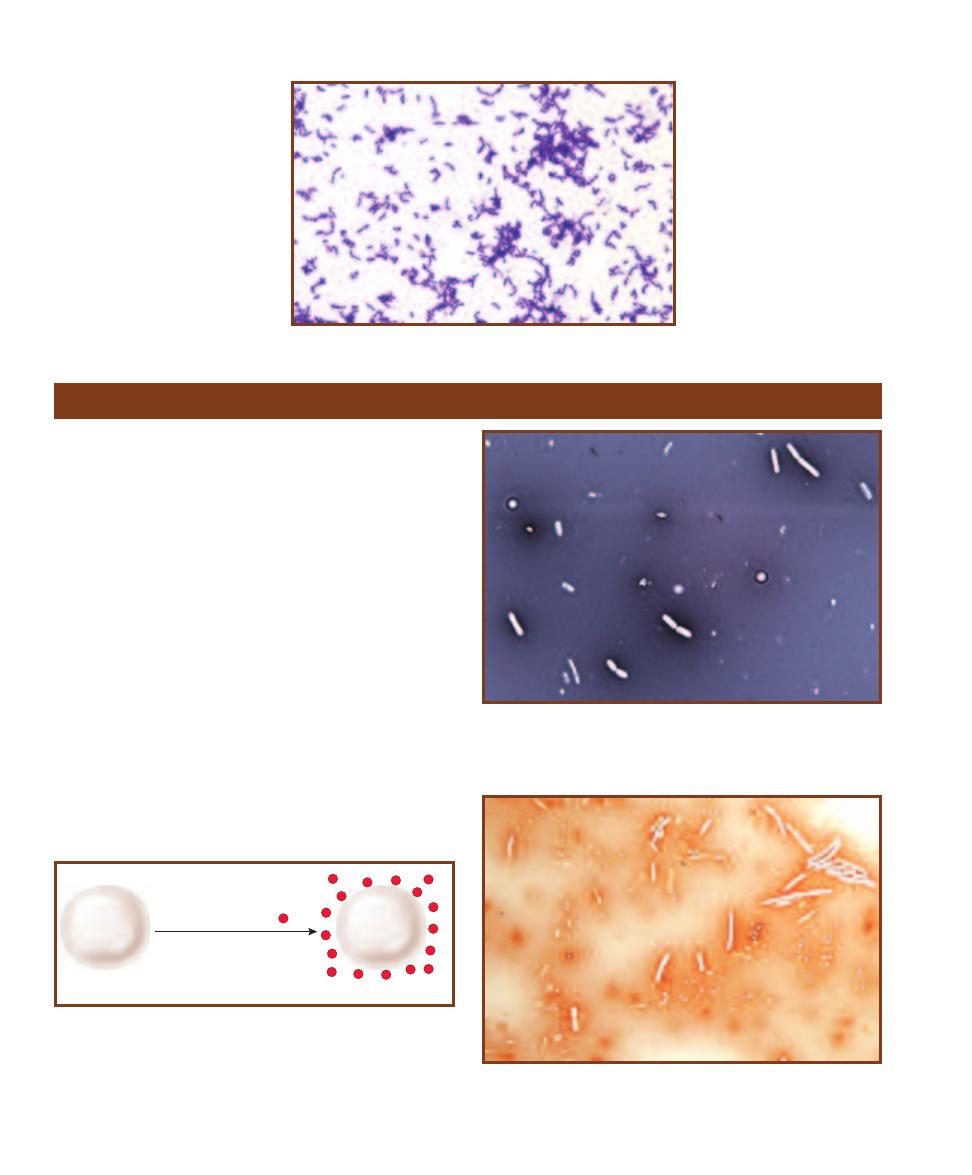
䢇
Purpose
The negative staining technique is used to determine mor-
phology and cellular arrangement in bacteria that are too
delicate to withstand heat-fixing. A primary example is the
spirochete Treponema, which is distorted by the heat-fixing
of other staining techniques. Also, where determining the
accurate size is crucial, a negative stain can be used because
it produces minimal cell shrinkage.
䢇
Principle
The negative staining technique uses a dye solution in which
the chromogen is acidic and carries a negative charge. (An
acidic chromogen gives up a hydrogen ion, which leaves it
with a negative charge.) The negative charge on the bacterial
surface repels the negatively charged chromogen, so the cell
remains unstained against a colored background (Figure 5-4).
Examples of acidic staining solutions used in negative stains
are Nigrosin and Congo red (Figures 5-5 and 5-6).
Basic stains are applied to
bacterial smears that have been
heat-fixed. Heat-fixing kills
most of the bacteria, makes
them adhere to the slide, and
coagulates cytoplasmic proteins
to make them more visible. It
also distorts the cells to some
extent.
38
䢇
A Photographic Atlas for the Microbiology Laboratory
5-3
A S
IMPLE
S
TAIN
U
SING
C
RYSTAL
V
IOLET
This micrograph
shows Propionibacterium acnes
stained with the basic stain crystal
violet. P. acnes is a commensal
living on the skin of most humans.
It has been associated with the skin
condition acne. Cell dimensions
are 0.5–0.8 µm wide by 1–5 µm
long.
Negative Stain
Background is stained
Negatively charged cell
Apply acidic stain
(Negative Chromogen )
_
_
_
_
_
_
_
_
_
_
_
_
_
_
_
_
_
_
_
_
_
_
_
_
_
_
_
_
_
_
_
_
_
_
_
_
_
_
_
_
_
_
_
_
_
_
_
_
_
_
_
_
_
_
_
_
_
_
_
_
_
_
_
_
_
_
_
_
_
_
_
_
5-4
C
HEMISTRY OF
A
CIDIC
S
TAINS
Acidic stains have a negatively
charged chromogen (
●
–
) that is repelled by negatively charged cells.
Thus, the background is colored and the cell remains transparent.
5-5
A N
IGROSIN
N
EGATIVE
S
TAIN
Notice that the Bacillus megaterium
cells are unstained against a dark background. Cell dimensions are
1.2–1.5 µm wide by 2.0–5.0 µm long. The small, irregularly-shaped white
spots are bubbles or other artifacts.
5-6
A N
EGATIVE
S
TAIN WITH
C
ONGO
R
ED
Compare this negative
stain of Bacillus megaterium to Figure 5-5. B. megaterium is a soil
organism. Cell dimensions are 1.2–1.5 µm wide by 2.0–5.0 µm long.
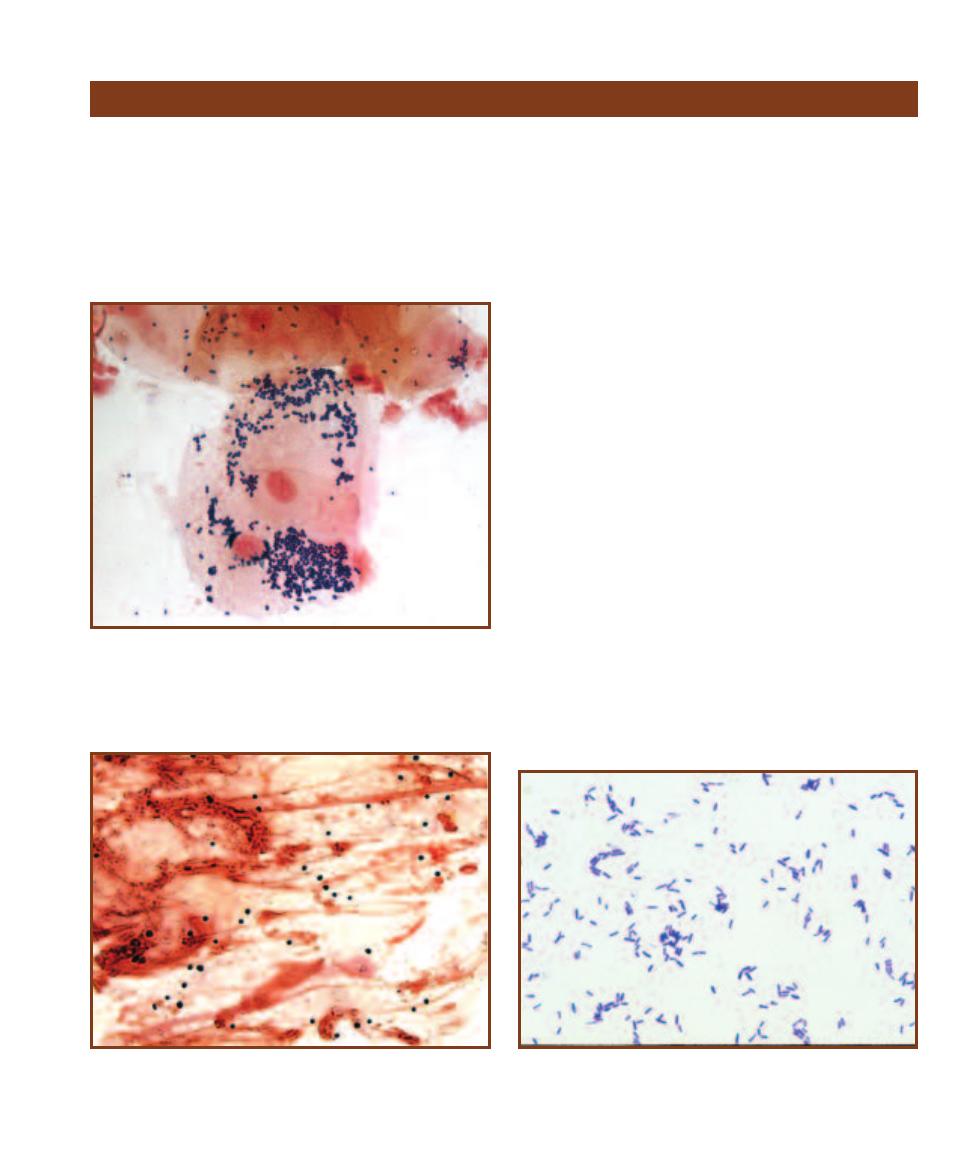
SECTION 5
䢇
Bacterial Cellular Morphology and Simple Stains
䢇
39
A Gallery of Bacterial Cell Diversity
Bacterial cells are much smaller than eukaryotic cells (Figure
5-7) and come in a variety of morphologies (shapes) and
arrangements. Determining cell morphology is an important
first step in identifying a bacterial species. Cells may be
spheres (cocci, singular coccus), rods (bacilli, singular
bacillus), or spirals (spirilla, singular spirillum). Variations
of these shapes include slightly curved rods (vibrios), short
rods (coccobacilli), and flexible spirals (spirochetes). Examples
of cell shapes are shown in Figures 5-8 through 5-17. In
Figure 5-17, Coryne bacterium xerosis illustrates pleomor-
phism, where a variety of cell shapes—slender, ellipsoidal,
or ovoid rods—may be seen in a given sample.
Cell arrangement, determined by the number of planes
in which division occurs and whether the cells separate after
division, is also useful in identifying bacteria. Spirilla rarely
are seen as anything other than single cells, but cocci and
bacilli do form multicellular associations. Because cocci
exhibit the most variety in arrangements, they are used for
illustration in Figure 5-18. If the two daughter cells remain
attached after a coccus divides, a diplococcus is formed. The
same process happens in bacilli that produce diplobacilli.
If the cells continue to divide in the same plane and remain
attached, they exhibit a streptococcus or streptobacillus
arrangement.
If a second division occurs in a plane perpendicular
to the first, a tetrad is formed from a diplococcus. A third
division plane perpendicular to the other two produces
a cube-shaped arrangement of eight cells called a sarcina.
Tetrads and sarcinae are seen only in cocci. If the division
planes of a coccus are irregular, a cluster of cells is produced
to form a staphylococcus. Figures 5-19 through 5-26 illus-
trate common cell arrangements.
Some organisms produce more unique arrangements.
Snapping division in corynebacteria produces either a pali -
sade or angular arrangement of cells (Figures 5-27 and 5-28).
Figure 5-29 illustrates a phenomenon characteristic of viru-
lent strains of Mycobacterium tuberculosis in which they
grow in parallel chains called cords.
Arrangement and morphology are often easier to see
when the organisms are grown in a broth rather than on a
5-7
P
ROKARYOTIC AND
E
UKARYOTIC
C
ELLS
(G
RAM
S
TAIN
)
This is
a direct smear specimen taken from around the base of the teeth below
the gum line. The large, pink cells are human epithelial cells and are
eukaryotic (notice the prominent nuclei). The small, purple cells are
prokaryotic bacteria. Typically, prokaryotic cells range in size from
1–10 µm, whereas eukaryotic cells are in the 10–100 µm range.
5-8
S
INGLE
C
OCCI FROM A
N
ASAL
S
WAB
(G
RAM
S
TAIN
)
This
direct smear of a nasal swab illustrates unidentified cocci (dark circles)
stained with crystal violet. The red background material is mostly
mucus.
5-9
A “T
YPICAL
” B
ACILLUS
(C
RYSTAL
V
IOLET
S
TAIN
)
Notice the
variability in rod length (due to different ages of the cells) in this stain
of the soil organism Bacillus subtilis grown in culture. Cell dimensions
are 0.7 µm wide by 2.0–3.0 µm long.
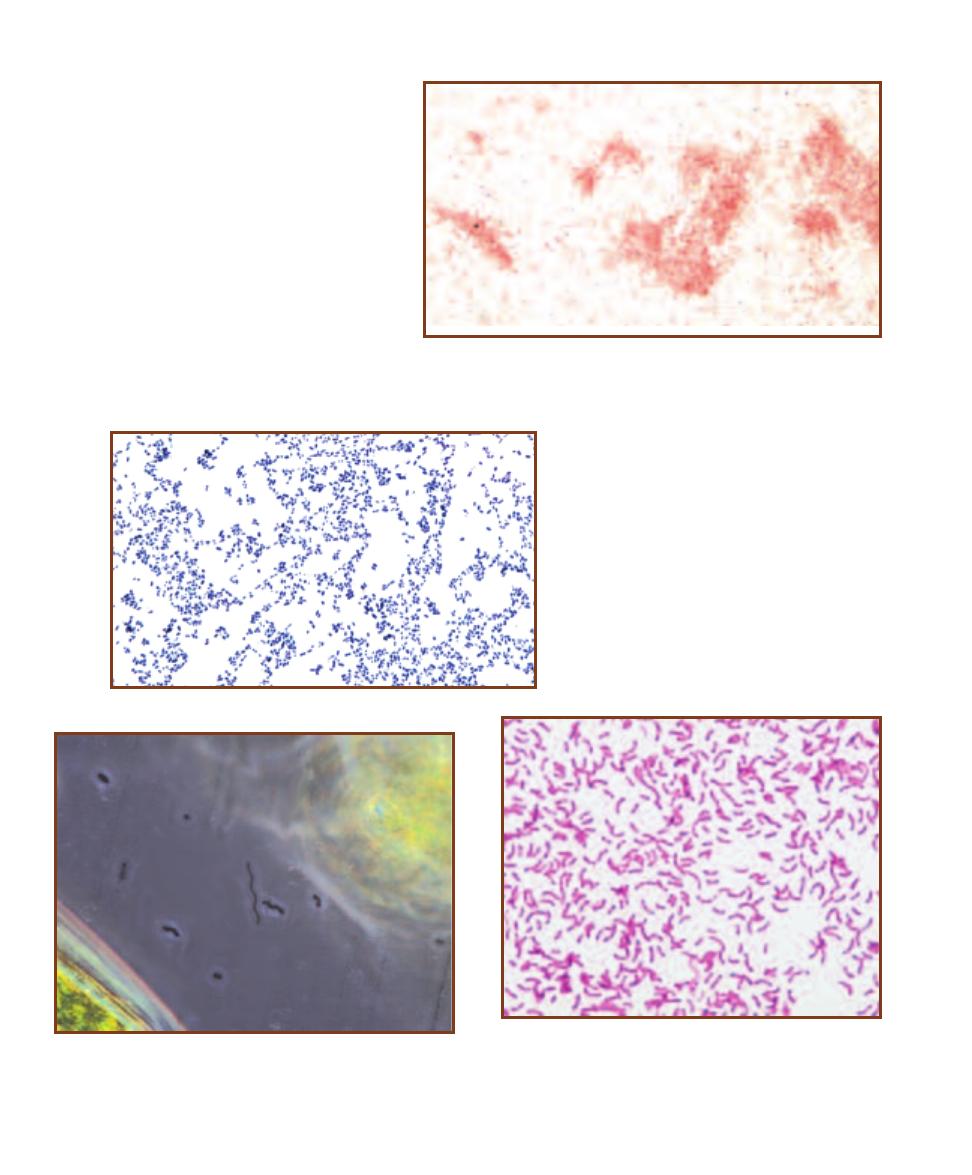
40
䢇
A Photographic Atlas for the Microbiology Laboratory
5-12
T
WO
D
IFFERENT
S
PIRILLA
(P
HASE
C
ONTRAST
W
ET
M
OUNT
)
The two different spirilla are undoubtedly different species based on
their different morphologies: one is long and slender with loose spirals,
the other is shorter and fatter with tighter coils. Cell dimensions are less
than 1 µm wide and up to 35 µm long.
5-11
O
VOID
C
OCCUS
(G
RAM
S
TAIN
)
Lactococcus
lactis is an elongated coccus that a beginning micro -
biologist might confuse with a rod. Notice the slight
elongation of the cells, and also that most cells are
not more than twice as long as they are wide. L. lactis
is found naturally in raw milk and milk products, but
these cells were grown in culture. Cell dimensions are
about 1 µm wide by 1–2 µm long.
5-13
A S
PIRILLUM FROM A
S
OLID
M
EDIUM
(C
ARBOLFUCHSIN
S
TAIN
)
Sometimes the organism’s source affects its mor phology.
Shown is Rhodospirillum rubrum grown on an agar slant and stained
with carbolfuchsin. Notice that the cells are not spiral shaped and
that most are curved rods. Compare their size and shape with Figure
5-14. Cell dimensions are about 1 µm wide by 10 µm long.
5-10
A L
ONG
, T
HIN
B
ACILLUS
(G
RAM
S
TAIN
)
The cells of Aeromonas sobria,
a freshwater organism, are considerably longer than wide. Notice that a cell can be
a bacillus without being in the genus Bacillus. Cell dimensions are about 0.5 µm
wide by 1–3.5 µm long. These cells were grown in culture.
solid medium (Figures 5-13 and 5-14), or are ob-
served from a direct smear. If you have difficulty
identifying cell morphology or arrangement, con-
sider transferring the organism (isolate) to a broth
culture and trying again.
One last bit of advice: don’t expect Nature to
perfectly conform to our categories of morphology
and cell arrangement. These are convenient descrip-
tive categories that will not easily be applied in all
cases. When examining a slide, look for the most
common morphology and most complex arrange-
ment. Do not be afraid to report what you see. For
instance, it’s okay to say, “Cocci in singles, pairs,
and chains.”
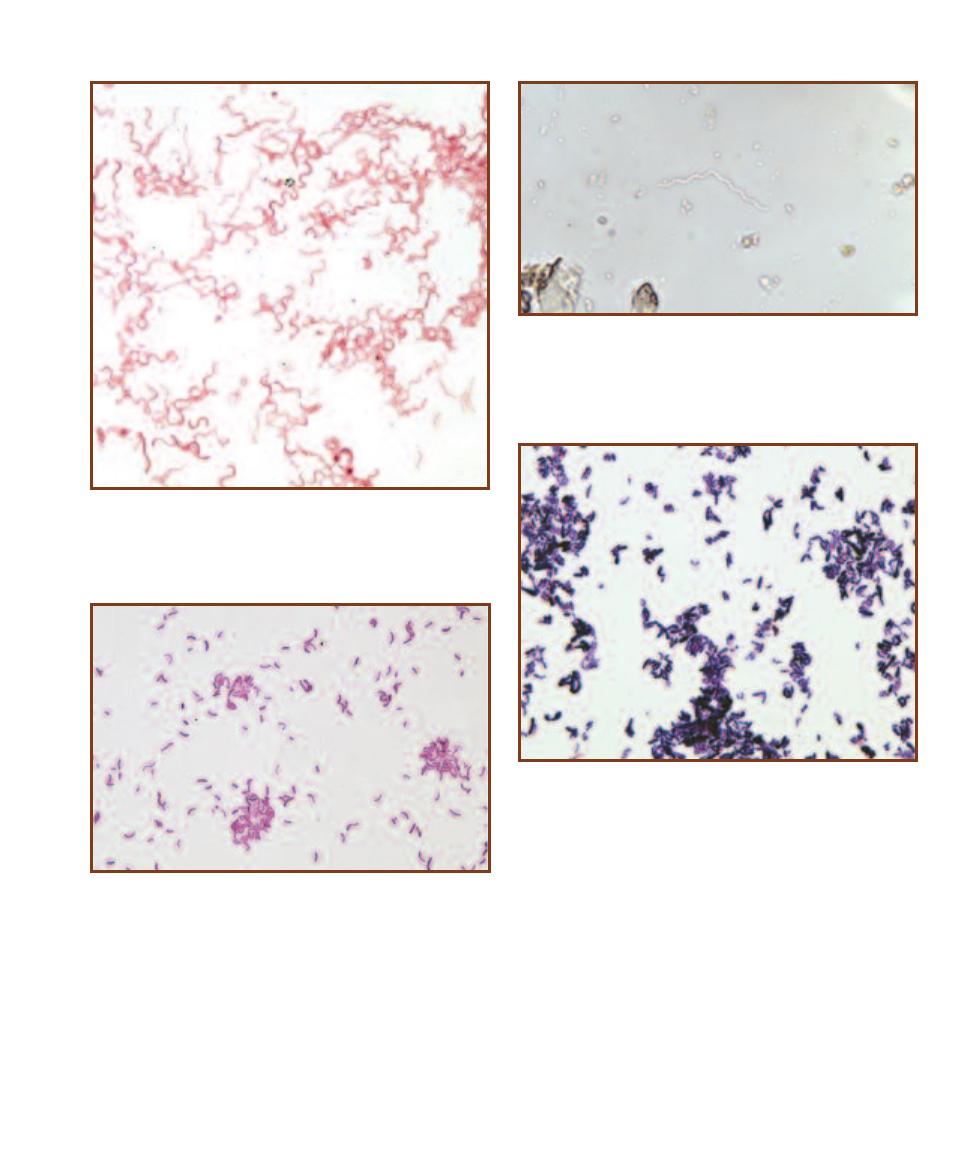
SECTION 5
䢇
Bacterial Cellular Morphology and Simple Stains
䢇
41
5-14
A S
PIRILLUM
G
ROWN IN
B
ROTH
Shown is Rhodospirillum
rubrum, grown in broth and stained with safranin. Compare the size
and shape of these cells with those shown in Figure 5-13.
5-15
A S
PIROCHAETE
Spirochaetes are tightly coiled, flexible rods.
This bright-field micrograph shows a marine species of Spirochaeta.
Notice the bend in the center of the cell. Cell dimensions of the genus
are less than 1 µm wide by 5–500 µm long.
5-16
A V
IBRIO
(G
RAM
S
TAIN
)
Vibrio cholerae is the causative
agent of cholera in humans. Careful examination of the smear will
reveal most rods as curved. These cells are from culture and range
in size from less than 1 µm wide by 1.5–2.5 µm long.
5-17
B
ACTERIAL
P
LEOMORPHISM
(G
RAM
S
TAIN
)
Some organisms
grow in a variety of shapes and are said to be pleomorphic. Notice the
rods of Corynebacterium xerosis range from almost spherical to many
times longer than wide. This organism is normally an inhabitant of skin
and mucous membranes and may be an opportunistic pathogen in com-
promised patients.
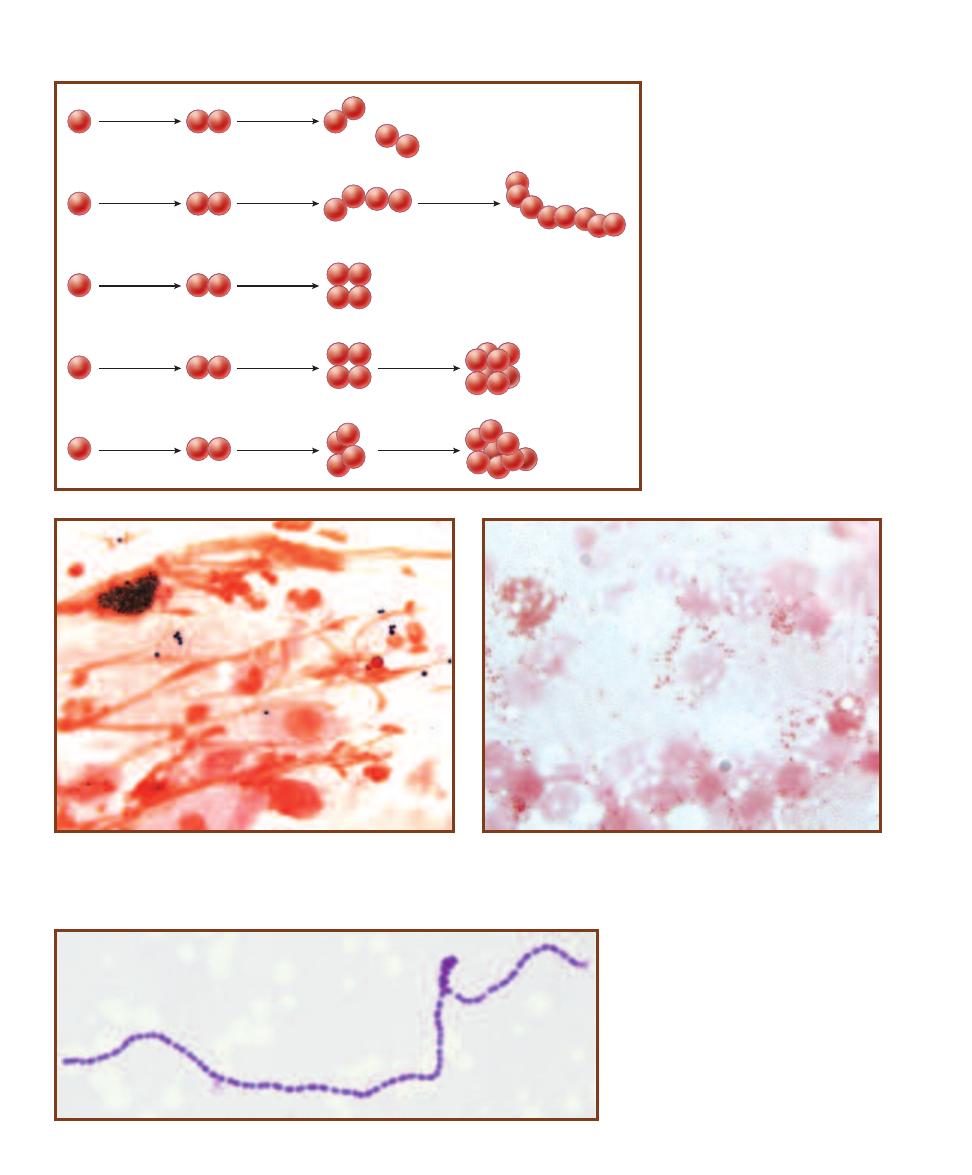
42
䢇
A Photographic Atlas for the Microbiology Laboratory
5-19
D
IPLOCOCCUS
A
RRANGEMENT
(G
RAM
S
TAIN
)
A few uniden-
tified diplococci are visible in this nasal swab. Single cocci may be the
same organism (and haven’t divided yet) or something else. The red
background material is host epithelial cells and mucus.
5-20
A
NOTHER
D
IPLOCOCCUS
A
RRANGEMENT
(G
RAM
S
TAIN
)
Neisseria gonorrhoeae is a diplococcus that causes gonorrhea in humans.
Members of this genus produce diplococci with flattened adjacent sides.
Each cell is less than 1 µm in diameter.
5-21
S
TREPTOCOCCUS
A
RRANGEMENT
(G
RAM
S
TAIN
)
Enterococcus faecium is a strep-
tococcus that inhabits the digestive tract of
mammals. This specimen is from a broth culture
(which enables the cells to form long chains)
and was stained with crystal violet. Notice the
slight elongation of these cells along the axis of
the chain. Cells are up to 2 µm wide by 2.5 µm
long.
Diplococcus
Streptococcus
Staphylococcus
Tetrad
Sarcina
5-18
D
IVISION
P
ATTERNS
A
MONG
C
OCCI
Diplococci have a single division
plane and the cells generally occur in
pairs. Streptococci also have a single
division plane, but the cells re main
attached to form chains of variable
length. If there are two perpendicular
division planes, the cells form tetrads.
Sarcinae have divided in three perpen -
dicular planes to produce a regular
cuboidal arrangement of cells. Staphylo-
cocci have divided in more than three
planes to produce a characteristic grape-
like cluster of cells. (
Note: Rarely will a
sample be composed of just one arrange-
ment. Report what you see, and empha-
size the most complex arrangement.)
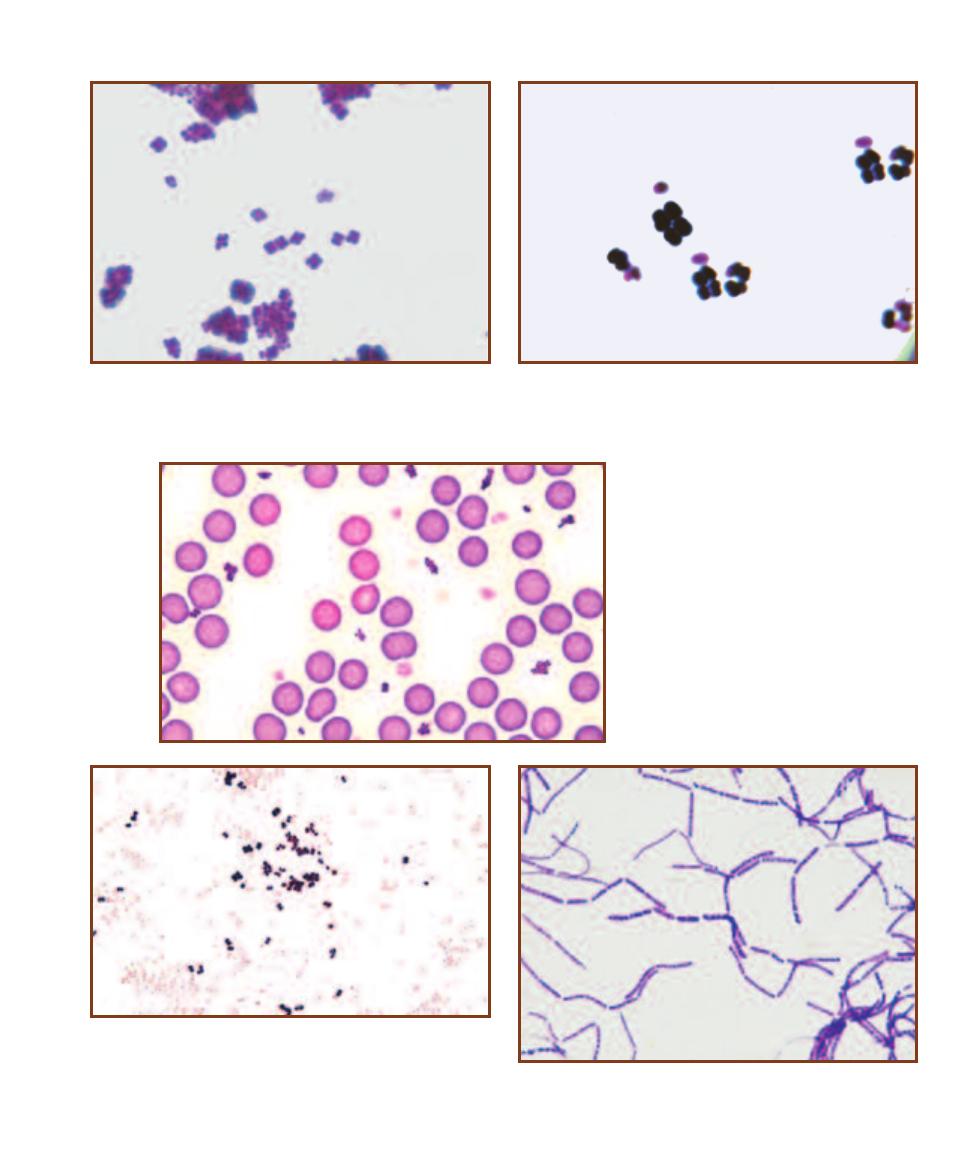
SECTION 5
䢇
Bacterial Cellular Morphology and Simple Stains
䢇
43
5-22
T
ETRAD
A
RRANGEMENT
(G
RAM
S
TAIN
)
Micrococcus roseus
grows in squared packets of cells evident even when they are bunched
together. The normal habitat for Micrococcus species is the skin, but these
were obtained from culture. Each cell is approximately 1µm in diameter.
5-23
A S
ARCINA
(C
RYSTAL
V
IOLET
S
TAIN
)
Sarcina maxima exhibits
the sarcina organization. As usual, not all will exhibit the sarcina
arrangement—a variety of arrangements leading up to the most
complex arrangement are seen. Each cell is 2–3 µm in diameter.
5-24
S
TAPHYLOCOCCUS
A
RRANGEMENT
Staphylo coccus aureus is shown in a blood
smear. Note the staphylococci interspersed
between the erythrocytes. S. aureus is a
common opportunistic pathogen of humans.
Cells are approximately 1µm in diameter.
5-25
T
WO
E
XAMPLES OF
C
OCCI
(G
RAM
S
TAIN
)
Compare Moraxella
catarrhalis (pink stain) and Micrococcus luteus (purple), both grown in
culture. M. catarrhalis is a diplo coccus with flattened adjacent sides. It is
an inhabitant of the human upper respiratory tract, especially the nasal
cavity, and is rarely pathogenic. M. luteus is a larger coccus that grows
in pairs and tetrads, and is found on the skin and other membranes.
5-26
S
TREPTOBACILLUS
A
RRANGEMENT
(C
RYSTAL
V
IOLET
S
TAIN
)
Bacillus megaterium is a streptobacillus. These cells were obtained from
culture and are 1.2–1.5 µm wide by 2–5 µm long.
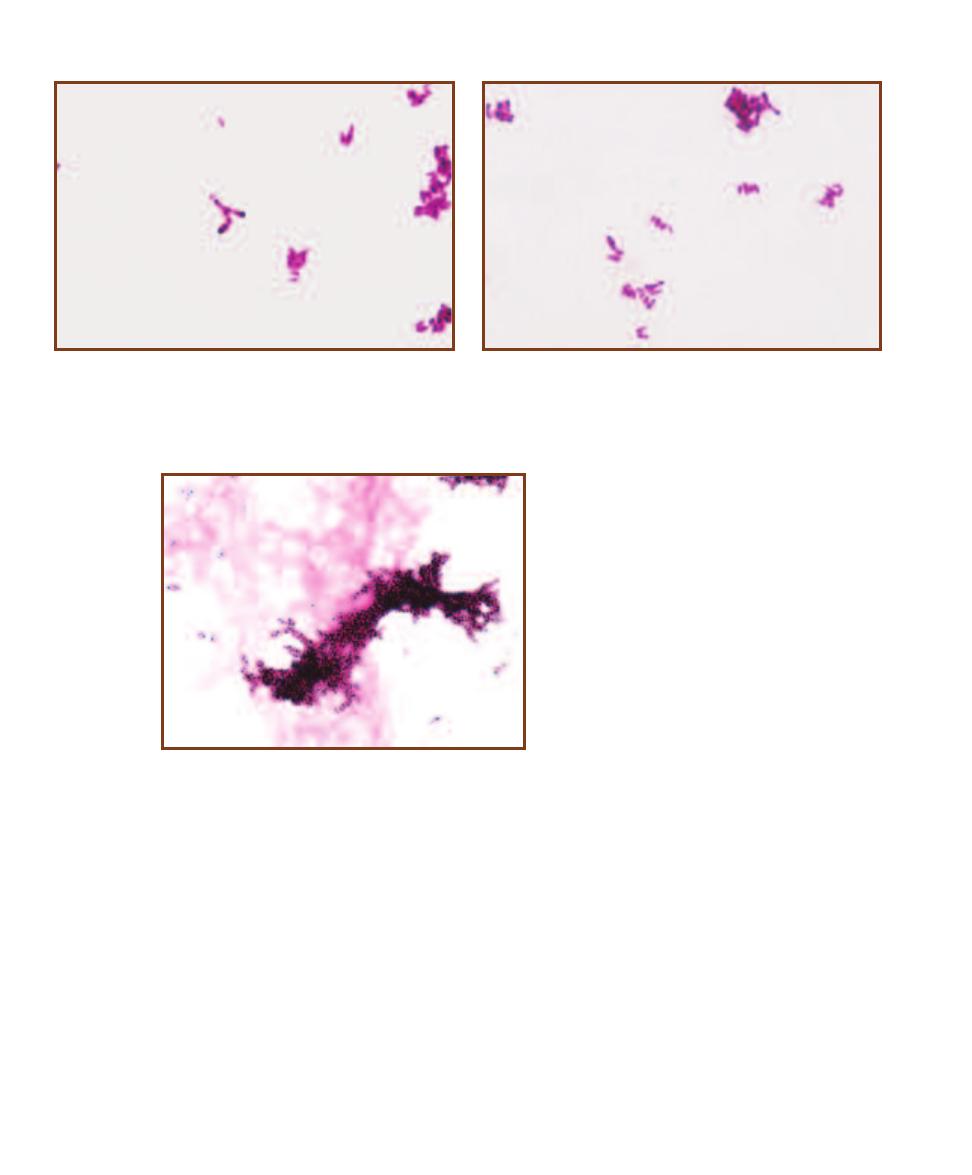
44
䢇
A Photographic Atlas for the Microbiology Laboratory
5-29
C
ORDING OF
M
YCOBACTERIUM
TUBERCULOSIS
(A
CID
-
FAST
S
TAIN
)
M. tuberculosis aggregates in characteristic
cords due to the adhesion of the waxy, acid-
fast cell walls of the organisms. Cells measure
0.2–0.6 µm wide by 1-10 µm long.
5-27
A
NGULAR
A
RRANGEMENT OF
C
ORYNEBACTERIUM
(C
ARBOL
-
FUCHSIN
S
TAIN
)
Corynebacterium diphtheriae exhibits an angular
arrangement of cells produced by snapping division typical of the genus.
Cell dimensions are 0.3–0.8 µm wide by 1.0–8.0 µm long. C. diphtheriae
produces an exotoxin that causes the symptoms of diphtheria.
5-28
P
ALISADE
A
RRANGEMENT OF
C
ORYNEBACTERIUM
(C
ARBOL
-
FUCHSIN
S
TAIN
)
In this micrograph, Corynebacterium diphtheriae illus-
trates its characteristic palisade arrangement of cells. Notice how the
cells are stacked lengthwise and are not in an irregular arrangement,
as in staphylococci.
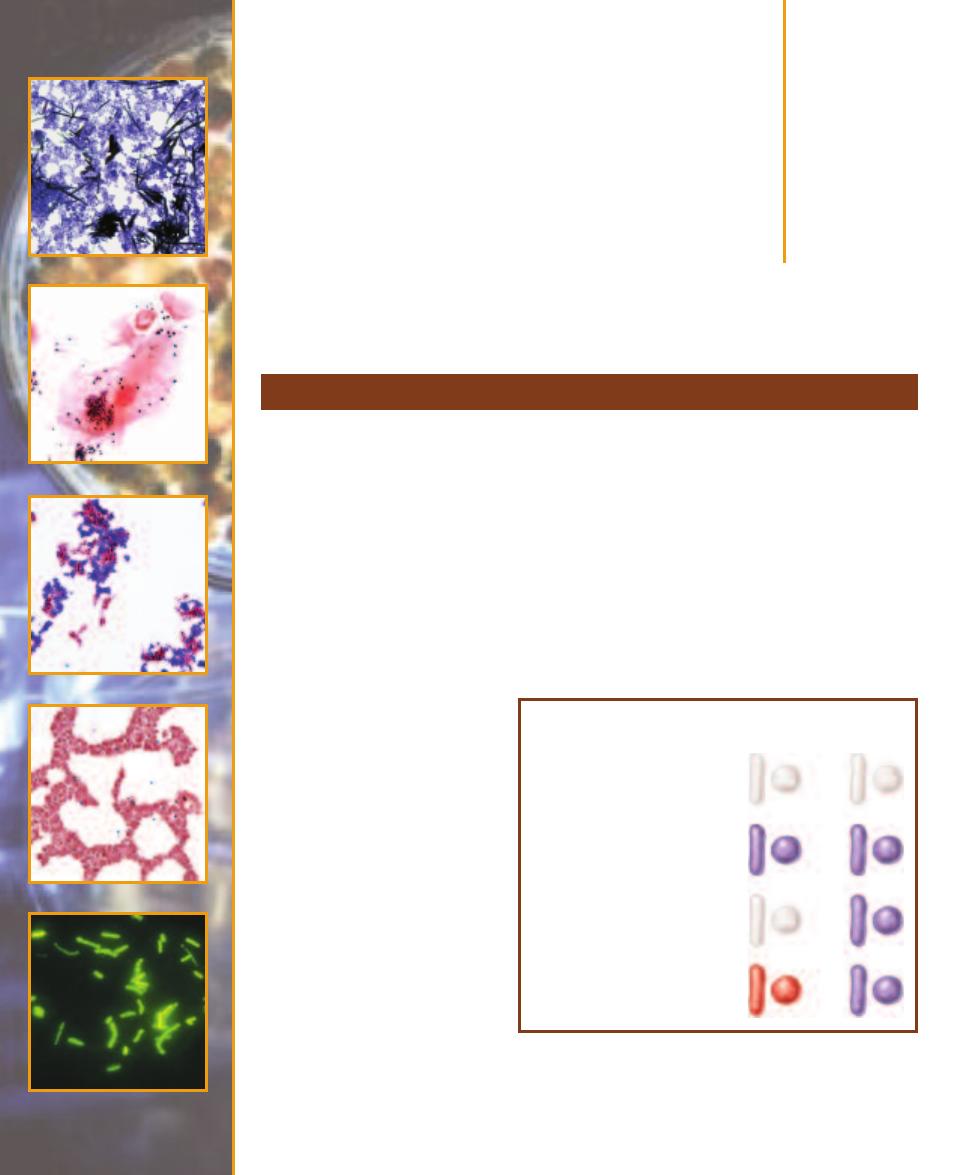
Bacterial Cell
Structures and
Differential Stains
䢇
Purpose
The Gram stain, used to distinguish between Gram-positive and Gram-negative cells, is the most
important and widely used microbiological differential stain. In addition to Gram reaction, this
stain also allows determination of cell morphology, size, and arrangement. It is typically the first
dif ferential test run on a specimen brought into the laboratory for identification. In some cases, a
rapid, presumptive identification of the organism or elimination of a particular organism is possible.
䢇
Principle
The Gram stain is a differential stain in which a decolori zation step occurs between the appli cation
of two basic stains. The Gram stain has many variations, but they all work in basically the same
way (Figure 6-1). The primary stain is crystal violet. Iodine is added as a mordant to enhance
crystal violet staining by forming a crystal violet–iodine complex. Decolorization follows and is the
most critical step in the procedure.
Gram- negative cells are decolorized
by the solution (of variable compo-
sition—generally alcohol or ace-
tone) whereas Gram-positive cells
are not. Gram- negative cells can
thus be colorized by the counter-
stain safranin. Upon successful
completion of a Gram stain, Gram-
positive cells appear purple and
Gram- negative cells appear reddish-
pink (Figure 6-2).
Electron microscopy and other
evidence indicate that the ability to
resist decolorization or not is based
on the different wall constructions
of Gram-positive and Gram- negative
cells. Gram-negative cell walls have
a higher lipid content (because of
the outer membrane) and a thinner
pep tidoglycan layer than Gram-
positive cell walls (Figure 6-3). The
alcohol/acetone in the decolorizer
Gram Stain
6
S E C T I O N
45
Cells are transparent prior to
staining.
Crystal violet stains Gram-positive
and Gram-negative cells. Iodine is
used as a mordant.
Decolorization with alcohol or
acetone removes crystal violet
from Gram-negative cells.
Safranin is used to counterstain
Gram-negative cells.
Gram-
negative
cells
Gram-
positive
cells
6-1
G
RAM
S
TAIN
After application of the primary stain (crystal
violet), decolorization, and counterstaining with safranin, Gram-positive
cells stain violet and Gram-negative cells stain pink/red. Notice that
crystal violet and safranin are both basic stains, and that it is the
decolori zation step that makes the Gram stain differential.
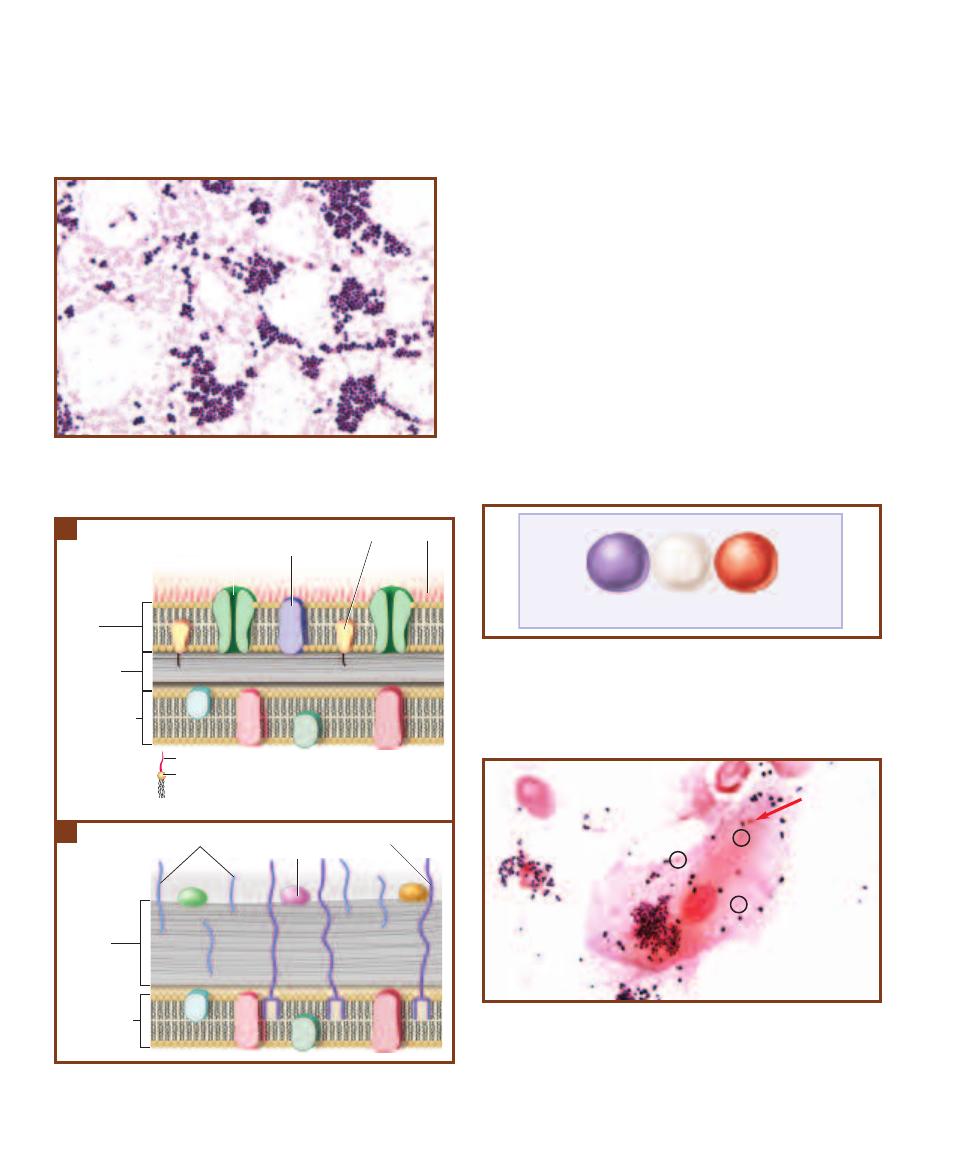
extracts the lipid, making the Gram-negative wall more
porous and in capable of retaining the crystal violet– iodine
complex, thereby decolorizing it. The thicker peptidoglycan
and greater degree of cross-linking (because of teichoic acids)
trap the crystal violet–iodine complex more effectively, mak-
ing the Gram-positive wall less susceptible to decolorization.
Although some organisms give Gram-variable results,
most variable results are a consequence of poor technique.
The decolorization step is the most crucial and most likely
source of Gram stain inconsistency. It is possible to over-
decolorize by leaving the alcohol on too long and get
reddish Gram-positive cells. It also is possible to under-
decolorize and produce purple Gram-negative cells. Neither
of these situations changes the actual Gram reaction for the
organism being stained. Rather, these are false results be-
cause of poor technique.
A second source of poor Gram stains is inconsistency in
preparation of the emulsion. Remember, a good emulsion
dries to a faint haze on the slide.
Until correct results are obtained consistently, it is rec-
ommended that control smears of Gram-positive and Gram-
negative organisms be stained along with the organism in
question (Figure 6-4). As an alternative control, a direct
smear made from the gumline may be Gram-stained (Figure
6-5) with the expectation that both Gram-positive and
46
䢇
A Photographic Atlas for the Microbiology Laboratory
6-2
G
RAM
S
TAIN OF
S
TAPHYLOCOCCUS EPIDERMIDIS
(
ⴐ)
AND
C
ITROBACTER DIVERSUS
(
ⴑ)
S. epidermidis has a staphylococcal
arrangement, whereas C. diversus is a bacillus of varying lengths.
Receptor
protein
Peptidoglycan
Cytoplasmic
membrane
Outer
membrane
Periplasm
Porin
LPS
Lipoprotein
O antigen
Lipid A
LPS
6-3
B
ACTERIAL
C
ELL
W
ALLS
A
The Gram-negative wall is composed
of less peptidoglycan (as little as a single layer) and more lipid (due to
the outer membrane) than the Gram-positive wall
B
.
Cell wall
Surface
protein
Cytoplasmic
membrane
Teichoic acid
Lipoteichoic Acid
Peptidoglycan
B
A
Known
Gram +
Unknown
Known
Gram -
?
6-4
P
OSITIVE
C
ONTROLS TO
C
HECK
Y
OUR
T
ECHNIQUE
Staining
known Gram-positive and Gram-negative organisms on either side of
your unknown organism act as positive controls for your technique. Try
to make the emulsions as close to one another as possible. Spreading
them out across the slide makes it difficult to stain and decolorize them
equally.
6-5
D
IRECT
S
MEAR
P
OSITIVE
C
ONTROL
(G
RAM
S
TAIN
)
A direct
smear made from the gumline may also be used as a Gram stain control.
Expect numerous Gram-positive bacteria (especially cocci) and some
Gram-negative cells, including your own epithelial cells. In this slide,
Gram-positive cocci predominate, but a few Gram- negative cells are
visible, including Gram-negative rods (circled) and a Gram-negative
diplococcus (arrow) on the surface of the epithelial cell.
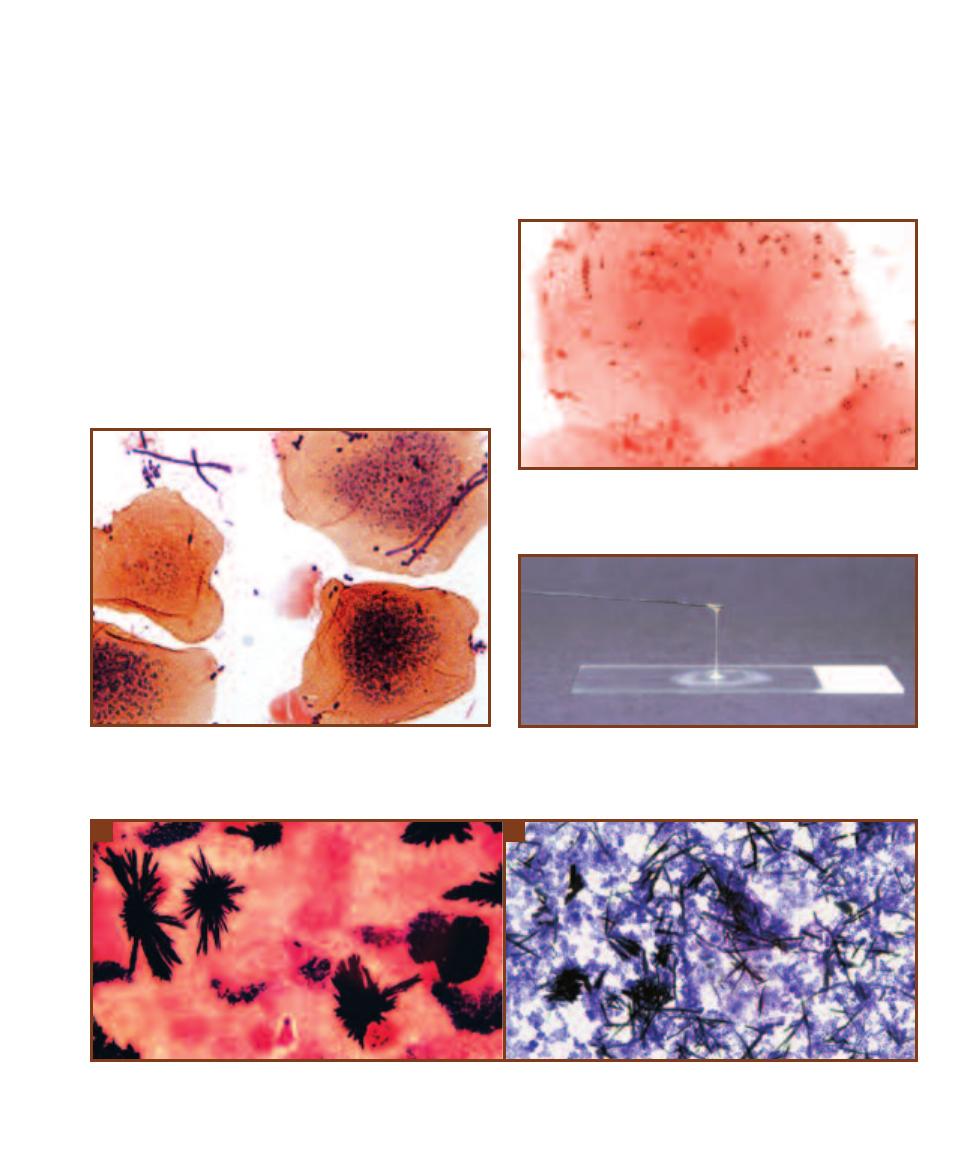
SECTION 6
䢇
Bacterial Cell Structures and Differential Stains
䢇
47
6-8
T
HE
KOH T
EST FOR
G
RAM
R
EACTION
This preparation of
Escherichia coli, a Gram-negative organism, has been emulsified in KOH
for one minute. The solution has become viscous and stringy due to the
release of chromosomal material from the cells.
Gram-negative organisms will be seen. Over-decolorized
and under-decolorized gumline direct smears are shown for
comparison (Figures 6-6 and 6-7). Positive controls also
should be run when using new reagent batches.
Age of the culture also affects Gram stain consistency.
Older Gram-positive cultures may lose their ability to resist
decolorization and give an artifactual Gram-negative result.
The genus Bacillus is notorious for this. Staphylococcus can
also be a culprit. Cultures 24 hours old or less are best for
this procedure.
Potassium hydroxide provides a nonstain test to con-
firm Gram reaction for particularly difficult species. Part
of a colony is emulsified in a drop of KOH for one minute,
then the loop is slowly withdrawn. Release of chromosomal
material by Gram-negative cells makes the suspension
viscous, stringy, and adhesive (Figure 6-8). Gram-positives
are unchanged and the emulsion remains watery.
Interpretation of Gram stains can be complicated by
nonbacterial elements. For instance, stain crystals from an
old or improperly made stain solution can disrupt the field
(Figure 6-9) or stain precipitate may be mistakenly identi-
fied as bacteria (Figure 6-10). In direct smears host cells or
noncellular material may be seen (Figures 6-11 to 6-14).
6-9
C
RYSTAL
V
IOLET
C
RYSTALS
(G
RAM
S
TAIN
)
If the staining solution is old or inadequately filtered, crystal violet crystals may appear. Although
they are pleasing to the eye, they obstruct your view of the specimen. Crystals from two different Gram stains are shown here.
A
This specimen is of a
gum line direct smear;
B
Micrococcus roseus grown in culture.
A
B
6-6
A
N
U
NDER
-
DECOLORIZED
G
RAM
S
TAIN
This is a direct smear
from the gum line. Notice the purple patches of stain on the epithelial
cells. Also notice the variable quality of this stain—the epithelial cell to
the left of center is stained better than the others.
6-7
A
N
O
VER
-
DECOLORIZED
G
RAM
S
TAIN
This also is a direct
smear from the gumline. Notice the virtual absence of any purple cells,
a certain indication of over-decoloration.
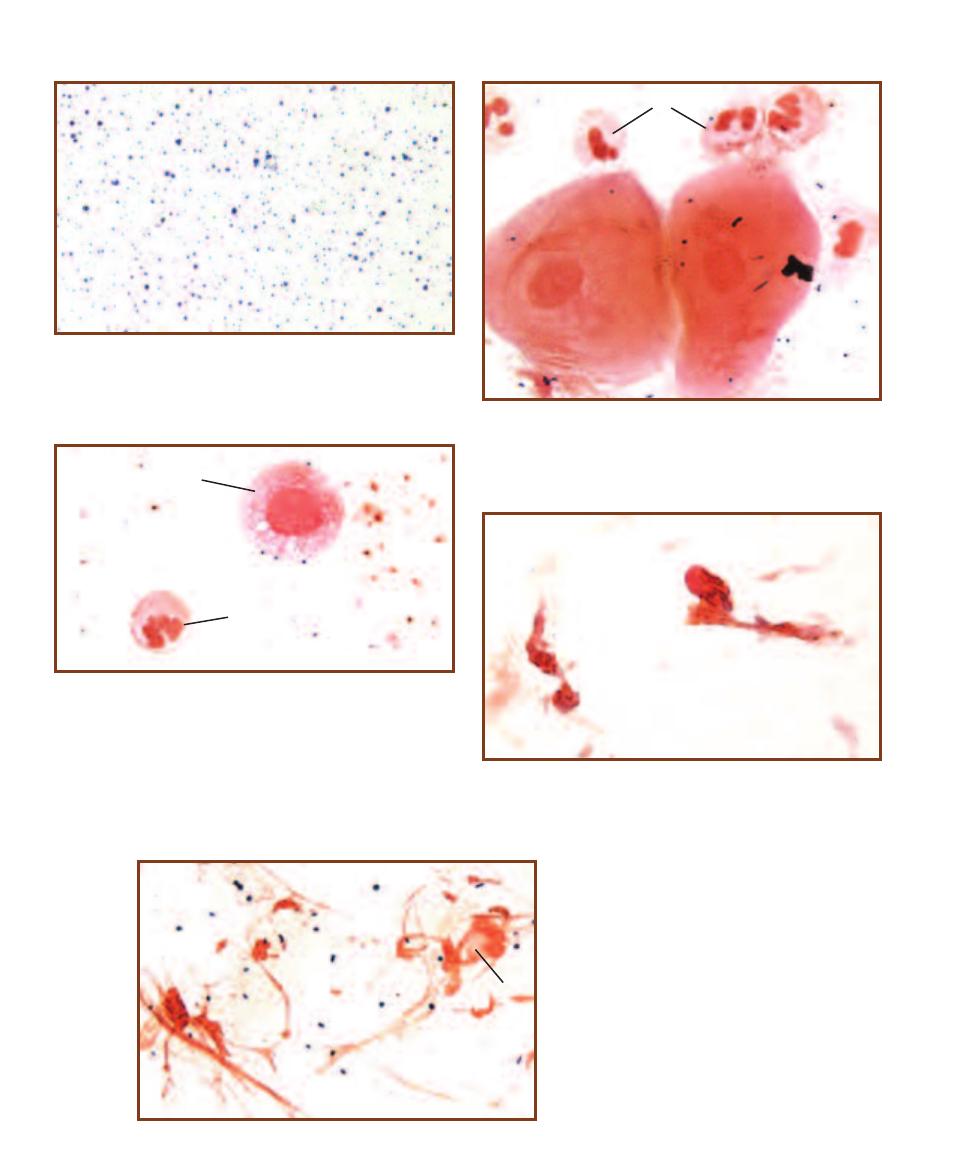
48
䢇
A Photographic Atlas for the Microbiology Laboratory
6-10
S
TAIN
P
RECIPITATE
(G
RAM
S
TAIN
)
If the slide is not rinsed
thoroughly or the stain is allowed to dry on the slide, spots of stain
precipitate may form and may be confused with bacterial cells. Their
variability in size is a clue that they are not bacteria.
6-11
N
EUTROPHILS IN
D
IRECT
S
MEARS
(G
RAM
S
TAIN
)
This gum
line smear illustrates neutrophils (
N), cells typically found in inflamed
tissue. Notice their size relative to the epithelial cells, their lobed nucleus,
and Gram-negative staining reaction. In some preparations, they are
very distorted and only the nuclei make them identifiable (Figure 6-14).
6-14
M
UCUS
(G
RAM
S
TAIN
)
Mucus strands
dominate the field in this Gram-stained nasal
swab. Gram-positive cocci and a deteriorating
neutrophil (N) are also visible.
6-12
M
ACROPHAGE
(G
RAM
S
TAIN
)
In some direct smears, macro -
phages (M) are visible. Compare the size of this macro phage to the sin-
gle neutrophil (N) below it. Notice its spherical nucleus and vacuolated
cytoplasm (containing bacteria in the process of digestion). Also notice
the Gram-positive cocci on its surface, probably caught in the act of
being engulfed.
N
6-13
R
ESPIRATORY
E
PITHELIAL
C
ELLS
(G
RAM
S
TAIN
)
Two distorted
respiratory epithelial cells are seen in this direct smear of a nasal swab.
Their columnar and irregular shape, nucleus, and cilia (what are left)
provide clues to their identity.
N
M
N
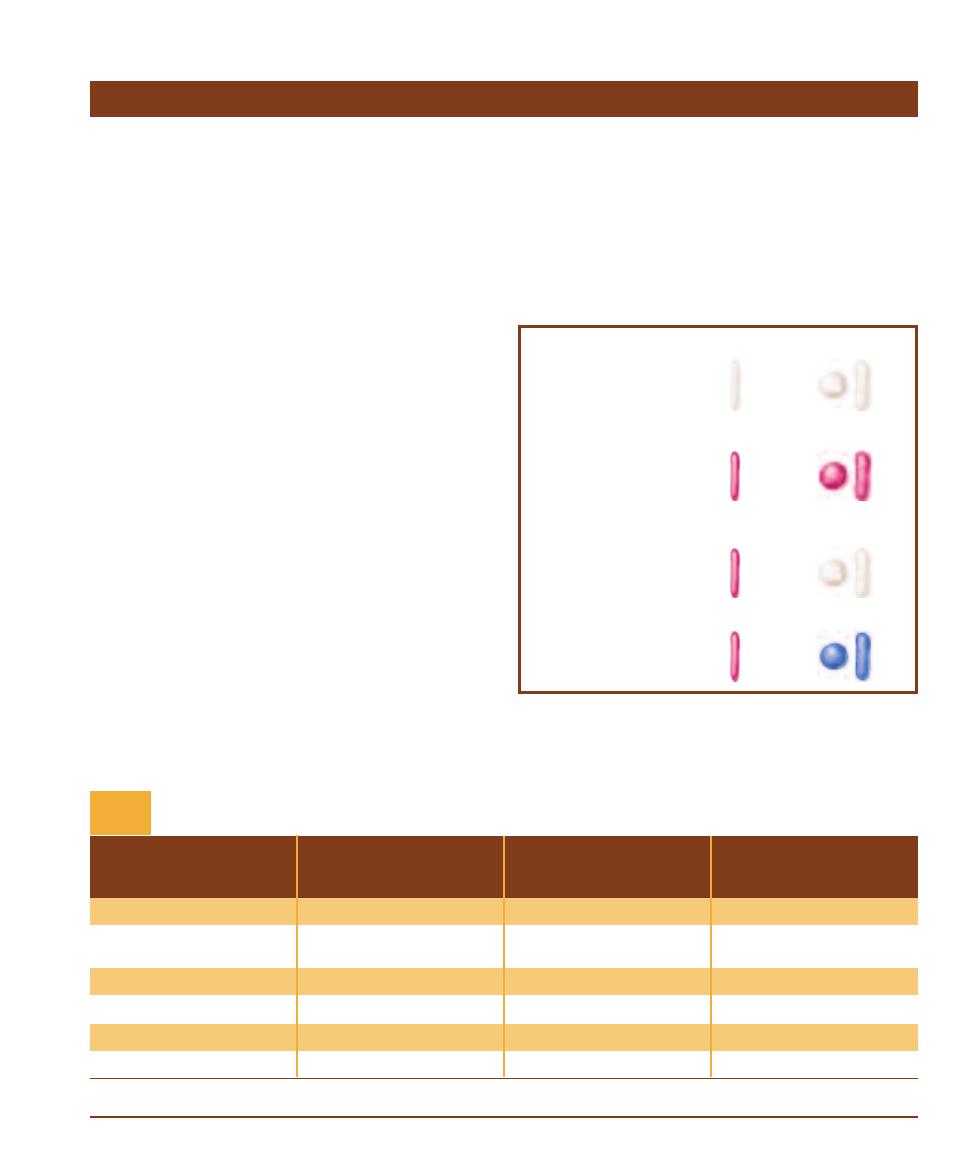
䢇
Purpose
The acid-fast stain is a differential stain used to detect cells
capable of retaining a primary stain when treated with an
acid alcohol. It is an important dif ferential stain used to
identify bacteria in the genus Myco bacterium, some of
which are pathogens (e.g., M. leprae and M. tuberculosis,
causative agents of leprosy and tuber culosis, respectively).
Members of the actinomycete genus Nocardia (N. brasiliensis
and N. asteroides are opportunistic patho gens) are partially
acid-fast. Oocysts of coccidian parasites, such as Crypto -
sporidium and Isospora, are also acid-fast. Because so few
organisms are acid-fast, the acid-fast stain is run only when
infection by an acid-fast organism is suspected.
Acid-fast stains are useful in identification of acid-fast
bacilli (AFB) and rapid, preliminary diagnosis of tuberculosis
(with greater than 90% predictive value from sputum
samples). It also can be performed on patient samples to
track the progress of antibiotic therapy and determine
their degree of contagiousness. A prescribed number of
microscopic fields is examined and the number of AFB is
determined and reported using a standard scoring system
(Table 6-1).
䢇
Principle
The presence of mycolic acids in the cell walls of acid-fast
organisms is the cytological basis for this differential stain.
Mycolic acid is a waxy substance that gives acid-fast cells
a higher affinity for the primary stain and resistance to
decolorization by an acid alcohol solution. A variety of
acid-fast staining procedures are employed, two of which
are the Ziehl-Neelsen (ZN) method and the Kinyoun (K)
method. These differ primarily in that the ZN method uses
heat as part of the staining process, whereas the K method
is a “cold” stain. In both protocols, the bac terial smear may
be prepared in a drop of serum to help the “slippery” acid-
fast cells adhere to the slide. The two methods provide com-
parable results.
The waxy wall of acid-fast cells repels typical aqueous
stains. (As a result, most acid-fast positive organisms are
only weakly Gram-positive.) In the ZN method (Figure 6-15),
SECTION 6
䢇
Bacterial Cell Structures and Differential Stains
䢇
49
Acid-fast Stain
Number of AFB Seen
Number of AFB Seen
Number of AFB Seen
Fuchsin Stain
Fluorochrome Stain
Fluorochrome Stain
1000X Magnification
450X Magnification
250X Magnification
Reported As
0 AFB per Field
0 AFB per Field
0 AFB per Field
No AFB Seen
1–2 AFB per 300 Fields
1–2 AFB per 70 Fields
1–2 AFB per 30 Fields
Doubtful; repeat with
another specimen
1–9 AFB per 100 Fields
2–18 AFB per 50 Fields
1–9 AFB per 10 Fields
1ⴐ
1–9 AFB per 10 Fields
4–36 AFB per 10 Fields
1–9 AFB per Field
2ⴐ
1–9 per Field
4–36 AFB per Field
10–90 AFB per Field
3ⴐ
>9 per Field
>36 AFB per Field
> 90 AFB per Field
4ⴐ
*Modified from Kent, P.T. and G.P. Kubica. 1985. Public Health Mycobacteriology: A Guide for the Level III Laboratory. U.S. Department of Health and Human Services,
Centers for Disease Control, Atlanta, GA.
Acid-fast Smear Reporting Standards*
T A B L E
6-1
Acid-Fast
Acid-Fast Negative
Cells prior to staining
are transparent.
After staining with carbolfuchsin,
cells are reddish-purple. Steam
heat enhances the entry of
carbolfuchsin into cells.
Decolorization with acid
alcohol removes stain from
acid-fast negative cells.
Methylene blue is used to
counterstain acid-fast
negative cells.
6-15
T
HE
Z
IEHL
-N
EELSEN
A
CID
-
FAST
S
TAIN
Acid-fast cells stain
reddish-purple; nonacid-fast cells stain blue or the color of the counter-
stain if a different one is used.
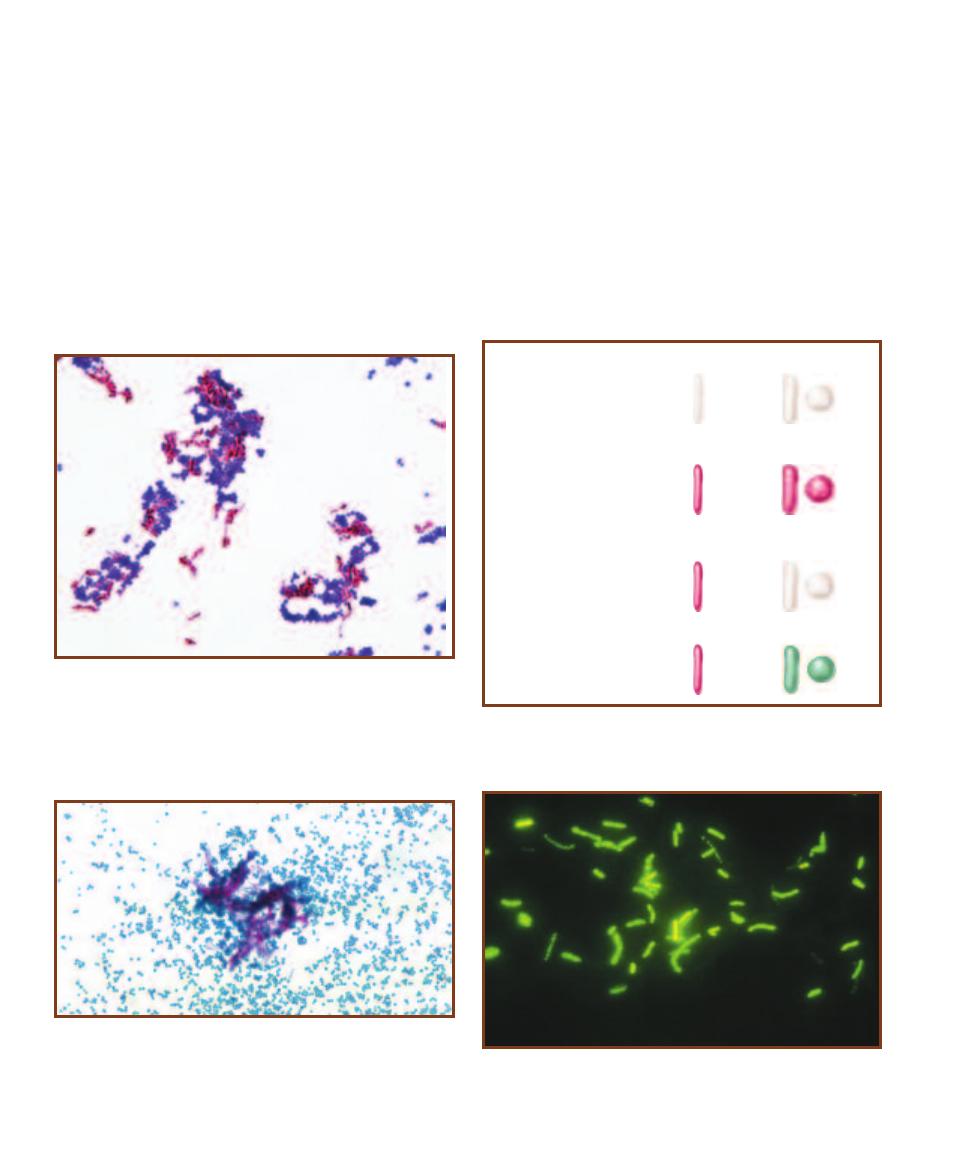
the phenolic compound carbolfuchsin is used as the primary
stain because it is lipid soluble and penetrates the waxy cell
wall. Staining by carbolfuchsin is further enhanced by steam
heating the preparation to melt the wax and allow the stain
to move into the cell. Acid alcohol is used to decolorize
nonacid-fast cells; acid-fast cells resist this decolorization.
A counterstain, such as methylene blue, is then applied.
Acid-fast cells are reddish-purple; nonacid-fast cells are blue
(Figure 6-16).
The Kinyoun method (Figure 6-17) uses a slightly more
lipid soluble and concentrated carbolfuchsin as the primary
stain. These properties allow the stain to penetrate the acid-
fast walls without the use of heat, but make this method
slightly less sensitive than the ZN method. Decolorization
with acid alcohol is followed by a contrasting counterstain,
such as brilliant green (Figure 6-18) or methylene blue.
Fluorescent dyes, such as auramine or rhodamine, are
used in many clinical laboratories and are actually preferable
to traditional carbolfuchsin stains for examination of direct
smears because of their higher sensitivity. The fluoro chrome
combines specifically with mycolic acid. Acid alcohol is used
for decolorization and potassium permanganate is the coun-
terstain. When observed under the microscope with UV
illumination, acid-fast cells are yellow against a dark back-
ground and nonacid-fast cells are not seen (Figure 6-19).
50
䢇
A Photographic Atlas for the Microbiology Laboratory
6-16
A
N
A
CID
-
FAST
S
TAIN
U
SING THE
ZN M
ETHOD
Notice how
most of the Mycobacterium phlei (AFⳭ) cells are in clumps, an unusual
state for most rods. They do this because their waxy cell walls make
them sticky. A few individual cells are visible, however, and they clearly
are rods. The Staphylococcus epidermidis cells (AFⳮ) are also in clumps,
but that is because they grow as grape-like clusters. Each cell’s diameter
is approximately 1 µm. Compare this micrograph with Figure 6-18.
Acid-Fast
Acid-Fast Negative
Cells prior to staining
are transparent.
After staining with
carbolfuchsin, cells
become reddish-
purple.
Decolorization with
acid alcohol removes
stain from acid-fast
negative cells.
Brilliant green is used
to counterstain acid-
fast negative cells.
6-17
T
HE
K
INYOUN
A
CID
-
FAST
S
TAIN
Acid-fast cells stain reddish-
purple; nonacid-fast cells stain green or the color of the counterstain if a
different one is used.
6-18
A
N
A
CID
-
FAST
S
TAIN
U
SING THE
K
INYOUN
M
ETHOD
This is
an acid-fast stain of Mycobacterium smegmatis (Ⳮ) and Staphylococcus
epidermidis (ⳮ) from cultures. Again, notice the clumping of the acid-
fast organisms. It is not uncommon for brilliant green dye to stain more
of a gray color, but it still contrasts with the carbolfuchsin of acid-fast
positive cells. Compare this micrograph with Figure 6-16.
6-19
F
LUOROCHROME
S
TAIN OF
M
YCOBACTERIUM KANSASII
U
SING
A
URAMINE
O D
YE AND
O
BSERVED
U
NDER
U
LTRAVIOLET
L
IGHT
Notice
the characteristic “beaded” appearance and nonuniform staining of these
cells. M. kansasii causes chronic pulmonary disease.
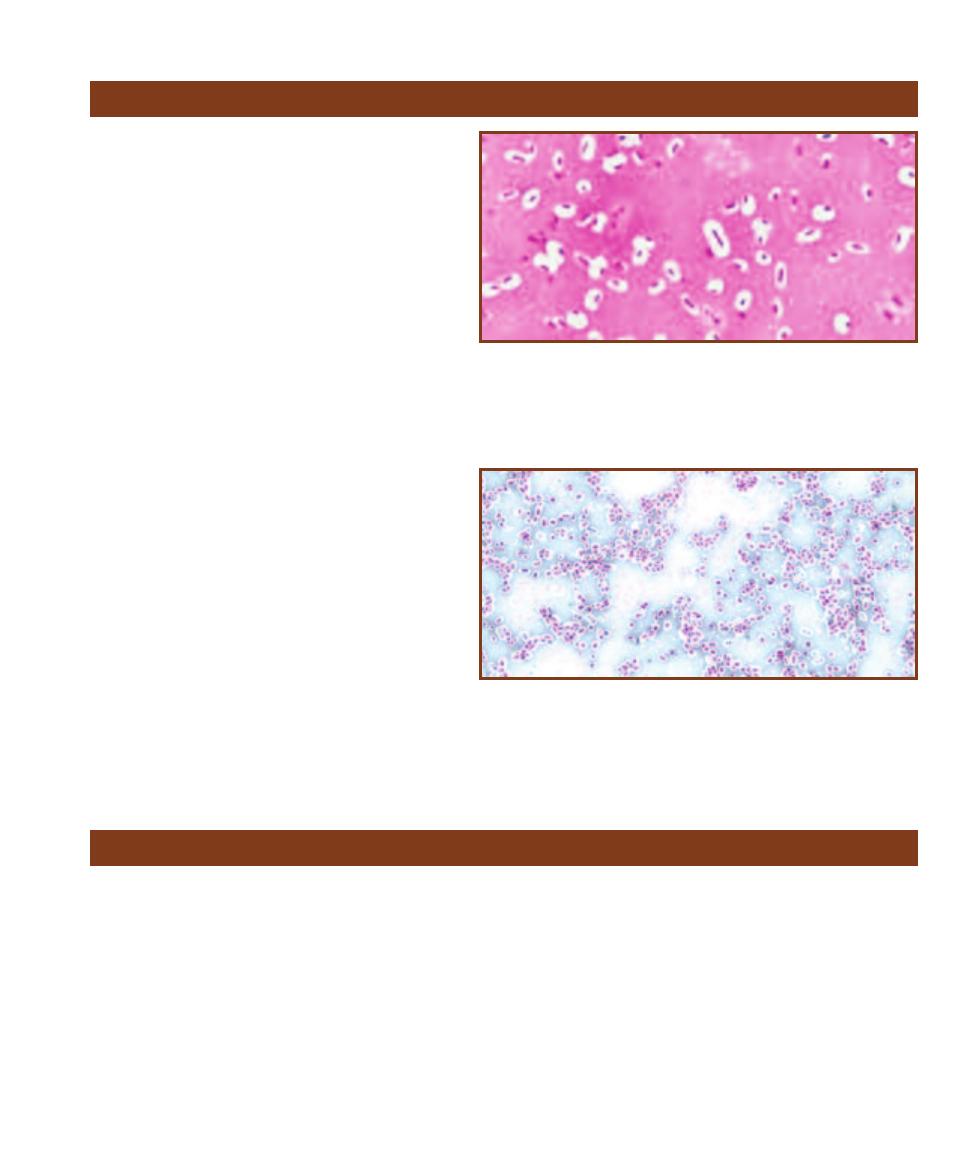
䢇
Purpose
The capsule stain is a differential stain used to detect
cells capable of producing an extracellular capsule.
Capsule production increases virulence in some
microbes (such as the anthrax bacillus Bacillus
anthracis and the pneumococcus Streptococcus
pneumoniae) by making them less vulnerable to
phagocytosis.
䢇
Principle
Capsules are composed of mucoid polysaccharides or
poly peptides that repel most stains. The capsule stain
technique takes advantage of this phenomenon by
staining around the cells. Typically, an acidic stain,
such as Congo red or nigrosin that stains the back-
ground, and a basic stain that colorizes the cell
proper, are used. The capsule remains unstained and
appears as a white halo between the cells and the
colored background (Figures 6-20 and 6-21).
This technique begins by spreading the cells in
a film of an acidic stain and serum. The smear is
allowed to air dry and is not heat-fixed. Heat-fixing
causes shrinkage of the cells, leaving an artifactual
white halo around them that might be interpreted as a
capsule when counterstained. In place of heat-fixing,
cells may be emulsified in a drop of serum to promote
adherence to the glass slide.
SECTION 6
䢇
Bacterial Cell Structures and Differential Stains
䢇
51
Capsule Stain
6-21
A
N
A
LTERNATIVE
C
APSULE
S
TAIN OF
K
LEBSIELLA PNEUMONIAE
In
this capsule stain, Congo red is the acidic stain and Maneval’s is the basic
stain. After staining, the Congo red often looks bluish or gray. K. pneumoniae is
an inhabitant of the intestinal tract of humans and is associated with urinary
and respiratory tract infections, but this specimen was grown on an agar slant.
The cells are approximately 1 µm wide by 2–4 µm long. Compare this micro-
graph to Figure 6-20.
6-20
C
APSULE
S
TAIN OF
K
LEBSIELLA PNEUMONIAE
The acidic stain color -
izes the background while the basic stain colorizes the cell, leaving the capsules
as unstained, and white clearings around the cells. Notice the lack of uniform
capsule size, and even the absence of a capsule in some cells. Compare this
micrograph to Figure 6-21. The difference in cell size between the two photos
is due to enlargement of the micrograph, not to the staining.
Endospore Stain
䢇
Purpose
The spore stain is a differential stain used to detect the
presence and location of spores in bacterial cells. Only a few
genera produce spores. Among them are the genera Bacillus
and Clostridium. Most members of Bacillus are soil, fresh-
water, or marine saprophytes, but a few are pathogens,
such as B. anthracis, the causative agent of anthrax. Most
members of Clostridium are soil or aquatic saprophytes
or inhabitants of human intestines, but four pathogens are
fairly well known: C. tetani, C. botulinum, C. perfringens,
and C. difficile, which produce tetanus, botulism, gas
gangrene, and pseudomembranous colitis, respectively.
䢇
Principle
An endospore is a dormant form of the bacterium that
allows it to survive poor environmental conditions. Spores
are resistant to heat and chemicals because of a tough outer
covering made of the protein keratin. The keratin also resists
staining, so extreme measures must be taken to stain the
spore. In the Schaeffer-Fulton method (Figure 6-22), a
primary stain of malachite green is forced into the spore
by steaming the bacterial emulsion. Alternatively, malachite
green can be left on the slide for 15 minutes or more to stain
the spores. Malachite green is water-soluble and has a low
affinity for cellular material, so vegetative cells and spore
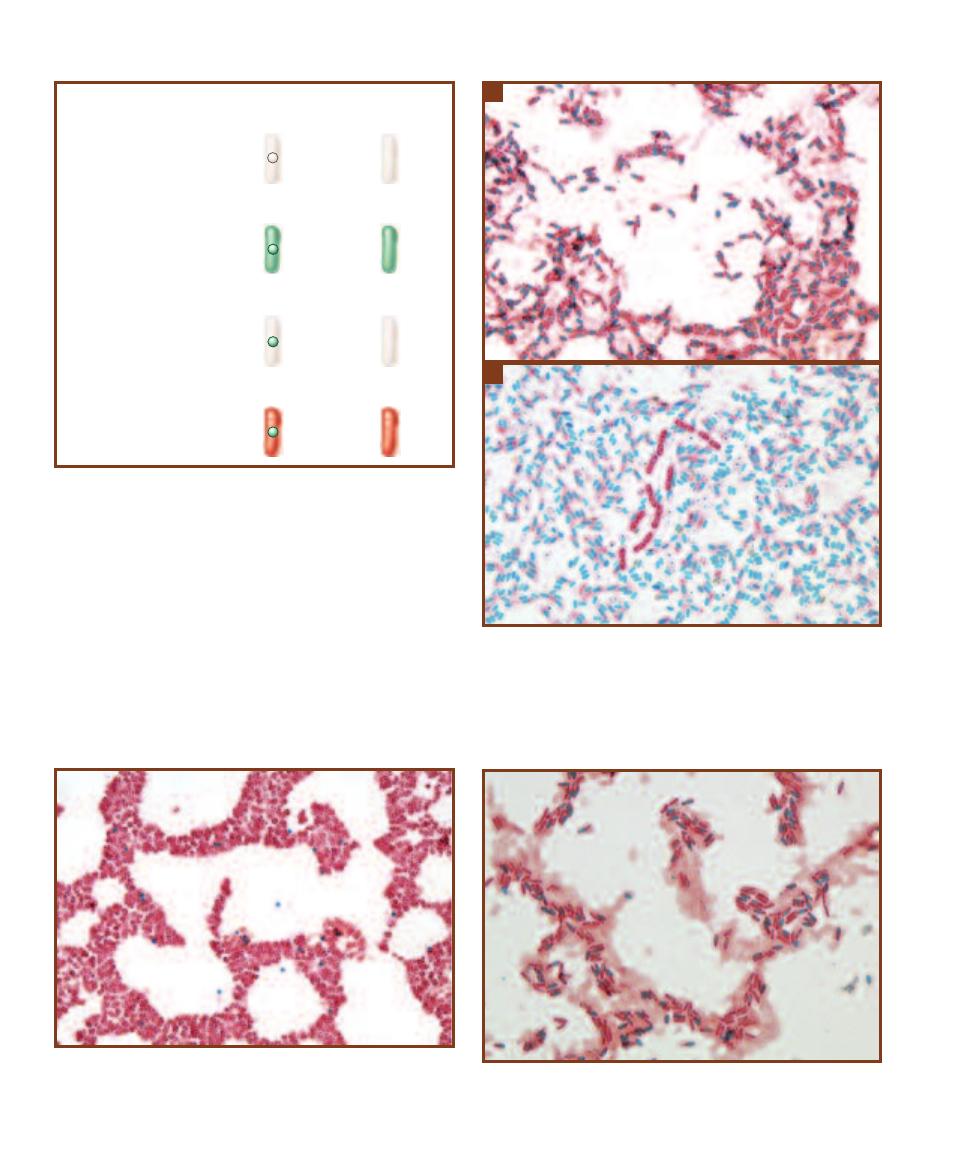
mother cells can be decolorized with water and counter-
stained with safranin (Figures 6-23 and 6-24).
Spores may be located in the middle of the cell (central),
at the end of the cell (terminal), or between the end and
middle of the cell (subterminal). Spores also may be differ-
entiated based on shape—either spherical or elliptical (oval)—
and size relative to the cell (i.e., whether they cause the cell
to look swollen or not). These structural features are shown
in Figures 6-25 through 6-27.
A special stain is not required to visualize endospores.
Figure 6-28 is a phase contrast micrograph of estuarine mud
52
䢇
A Photograph Atlas for the Microbiology Laboratory
Spore
producer
Spore
nonproducer
Cells and spores prior to
staining are transparent.
After staining with
malachite green, cells
and spores are green.
Heat is used to force
the stain into spores,
if present.
Decolorization with
water removes stain
from cells, but not
spores.
Safranin is used to
counterstain cells.
6-22
T
HE
S
CHAEFFER
-F
ULTON
S
PORE
S
TAIN
Upon com pletion,
spores are green, and vegetative and spore mother cells are red.
A
B
6-23
C
ULTURE
A
GE
C
AN
A
FFECT
S
PORULATION
Bacteria capable
of producing spores don’t do so uniformly during their culture’s growth.
Sporulation is done in response to nutrient depletion, and so is charac-
teristic of older cultures. These two Bacillus cultures illustrate different
degrees of sporulation.
A
Most cells in this specimen contain spores;
very few have been released.
B
This specimen consists mostly of released
spores.
6-25
C
ENTRAL
E
LLIPTICAL
E
NDOSPORES
Most of these Bacillus
megaterium spores are centrally positioned, but all are elliptical. The
spore does not distend the mother cell.
6-24
S
POROSARCINA UREAE
S
PORES
Clostridium and Bacillus are
the largest and most commonly encountered endospore forming genera,
but there are at least a half-dozen others. Sporosarcina cells are spherical
or slightly elongated and are approximately 2 µm in diameter.
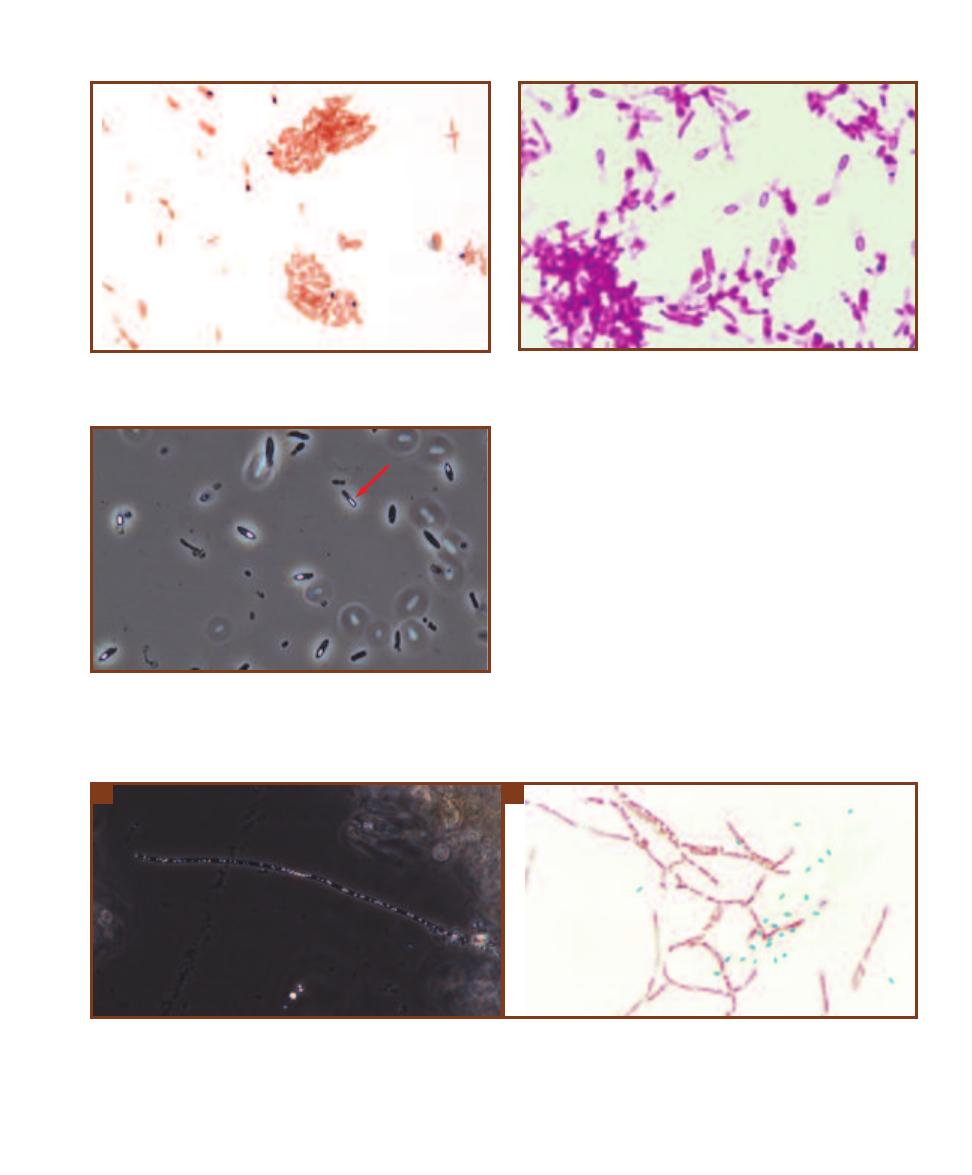
SECTION 6
䢇
Bacterial Cell Structures and Differential Stains
䢇
53
6-26
S
UBTERMINAL
S
PORES
This is a stained preparation of
Clostridium botulinum using an alternative procedure. The black spores
slightly distend the cell.
6-27
E
LLIPTICAL
T
ERMINAL
S
PORES
Clostridium tetani stained by a
different spore stain protocol using carbolfuchsin. Notice how the
spores have caused the ends of the cells to swell.
6-29
T
HE
E
NDOSPORE
S
TAIN
A
LLOWS
D
IFFERENTIATION
B
ETWEEN
T
RUE
E
NDOSPORES AND
C
ELLULAR
I
NCLUSIONS
A
The bright spots in this
filamentous bacterium (possibly Thiothrix) are sulfur granules, but they might be confused with endospores in this phase contrast micrograph. Their
irregular size and the presence of more than one per cell are clues that they are not endospores, but an endospore stain would remove any doubt.
B
This micrograph is an endospore stain of Bacillus cereus grown in culture. The spores are green, but notice all the unstained, white spots inside the
cells! They are lipid granules. Now, imagine looking at this specimen using a simple stain or a Gram stain. Would you be able to identify the spores or
would the lipid granules mislead you?
A
B
in which several spore-forming bacteria are visible. Without
staining, however, one must be careful not to confuse inclu-
sions, such as sulfur (Figure 6-29A) or lipid (Figure 6-29B)
granules, with true endospores. The spore stain will defini-
tively identify true endospores. Corynebacterium species
may also be a source of confusion, because they often have
club-shaped swellings (Figure 6-30).
6-28
S
PORES AS
S
EEN WITH
P
HASE
C
ONTRAST
M
ICROSCOPY
The
white, elliptical spores are easily seen in these unidentified, anaerobic
rods found in an estuarine mud sample. Because they are anaerobic, it
is likely they are one or more species of Clostridium. Note the difference
in morphology between the cell marked with the arrow and the others.
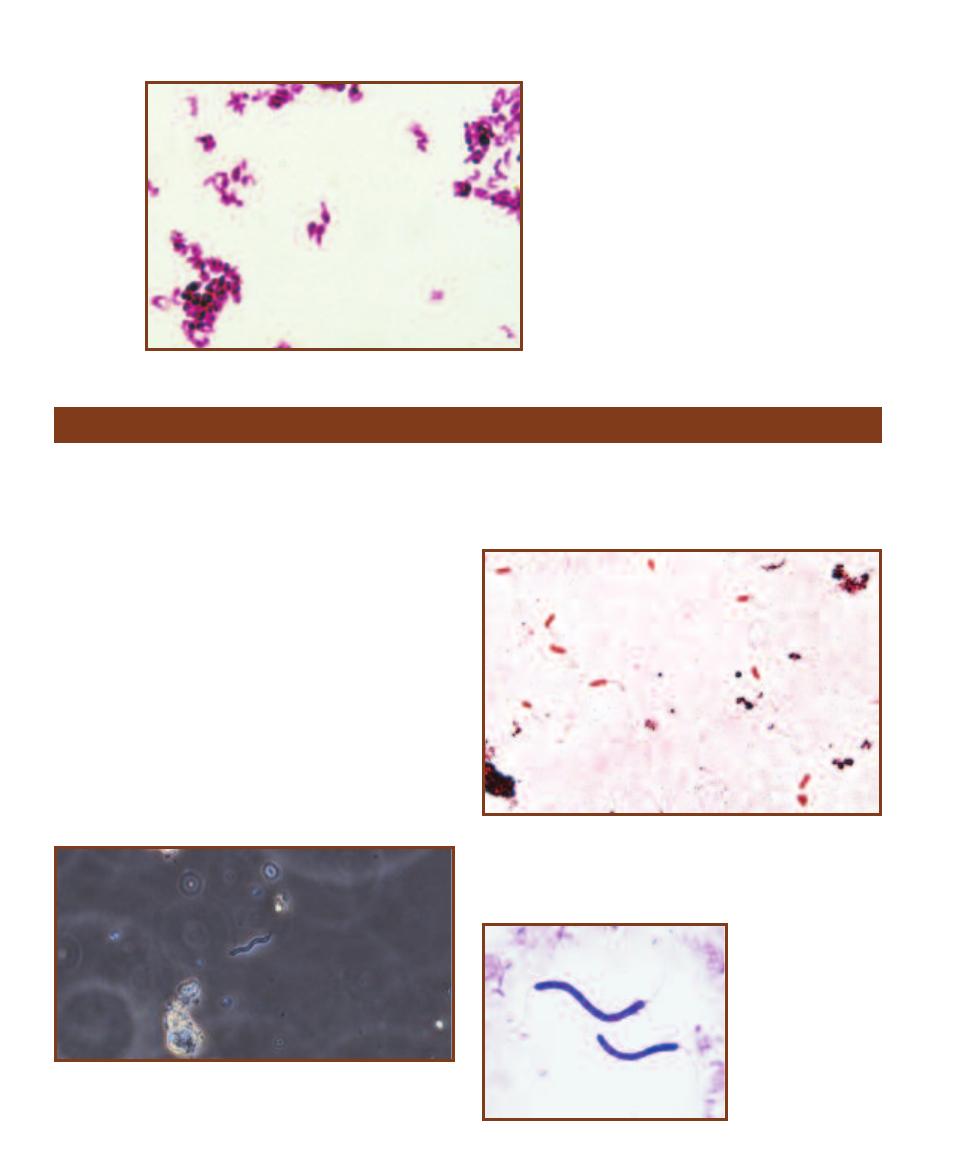
䢇
Purpose
The flagella stain allows direct observation of flagella.
Presence and arrangement of flagella may be useful in
identifying bacterial species.
䢇
Principle
Although phase contrast microscopy permits visualization
of bacterial flagella (Figure 6-31), they are too thin to be
observed with the bright field microscope and ordinary
stains. Various special flagella stains have been developed
that use a mordant to assist in encrusting flagella with stain
to a visible thickness. Most require experience and advanced
techniques, and are typically not performed in beginning
microbiology classes.
The number and arrangement of flagella may be
observed with a flagella stain. A single flagellum is said
to be polar and the cell has a monotrichous arrangement
(Figure 6-32). Other arrangements (shown in Figures 6-33
through 6-35) include amphitrichous, with flagella at both
ends of the cell; lophotrichous, with tufts of flagella at the
end of the cell; and peritrichous, with flagella emerging
from the entire cell surface.
54
䢇
A Photographic Atlas for the Microbiology Laboratory
6-30
C
ORYNEBACTERIA
H
AVE
T
ERMINAL
,
C
LUB
-
SHAPED
S
WELLINGS
In a simple stain,
these might be mis interpreted as spores. This is
a slide of Corynebacterium diphtheriae grown in
culture.
Flagella Stain
6-31
B
ACTERIAL
F
LAGELLA
A
RE
T
HIN
!
The flagella of this aquatic
spirillum are barely visible at each end of the cell in this phase contrast
micrograph.
6-32
P
OLAR
F
LAGELLA
Pseudomonas aeruginosa is often suggested
as a positive control for flagella stains. Notice the single flagellum
emerging from the ends of many (but not all) cells. This is due to the
fragile nature of flagella, which can be broken from the cells during
slide preparation.
6-33
A
MPHITRICHOUS
F
LAGELLA
Spirillum
volutans has a flagellum
at both ends.
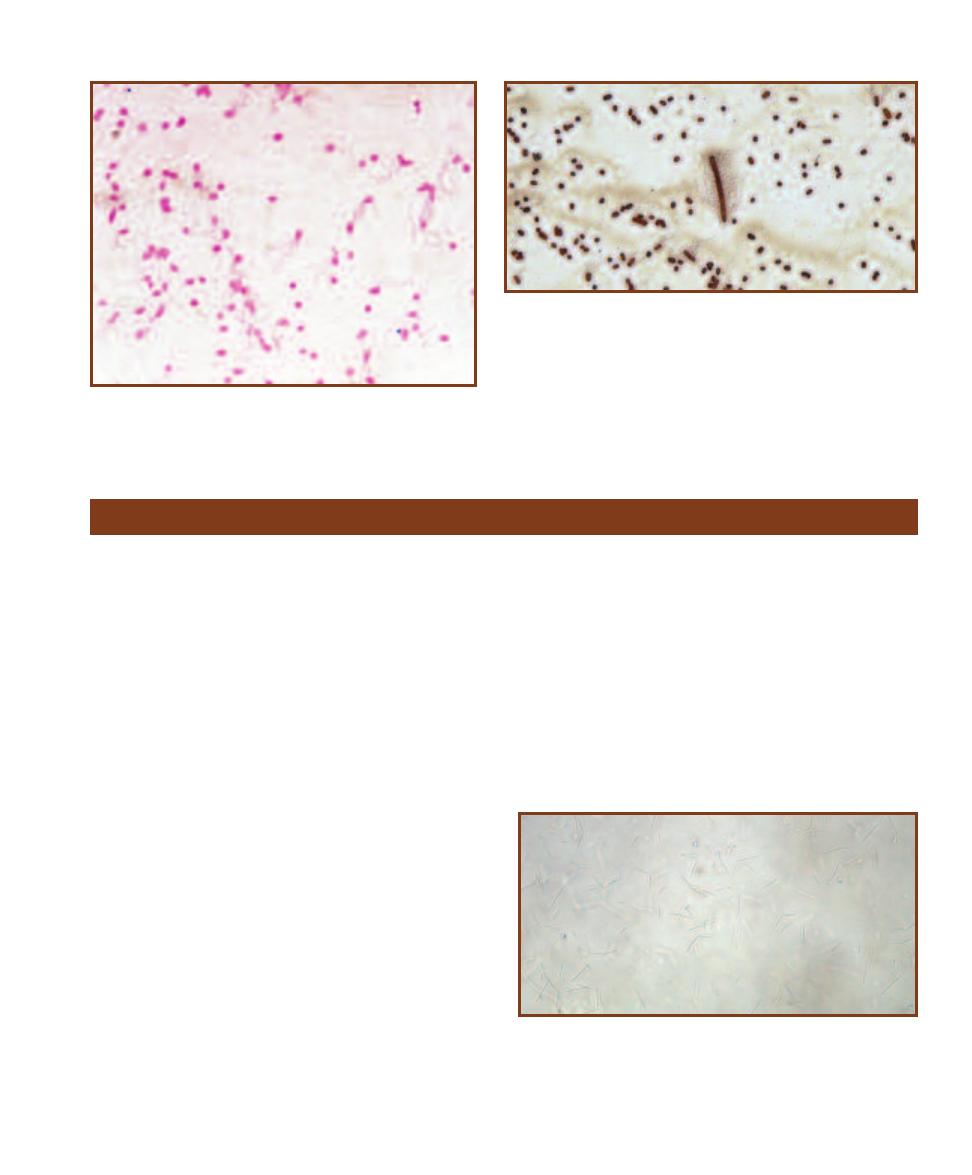
SECTION 6
䢇
Bacterial Cell Structures and Differential Stains
䢇
55
6-34
L
OPHOTRICHOUS
F
LAGELLA
Several flagella emerge from
one end of this Pseudomonas species. Again, not all cells have flagella
because they were too delicate to stay intact during the staining
procedure.
6-35
P
ERITRICHOUS
F
LAGELLA OF
P
ROTEUS VULGARIS
Notice the
flagella emerging from the entire cell surface. P. vulgaris is capable of
swarming motility (Figure 3-22), in which the cells spread across the agar
surface at specific intervals, and then remain in place until the next swarm.
The smaller cells are called “swimmers” and are the form seen when
grown in a liquid medium. When transferred to a solid medium or under
certain environmental conditions, swimmers differentiate into “swarmers.”
A swarmer is seen in the center of this micrograph. Swarmers are larger,
contain multiple nucleoids (the site of DNA), and produce an extracellular
slime or capsule that assists in swarming. After swarming, they break up
into swimmer cells. Swarmers are the more virulent form.
Wet Mount and Hanging Drop Preparations
䢇
Purpose
Most bacterial microscopic preparations result in death of
the microorganisms due to heat-fixing and staining. Simple
wet mounts and the hanging drop technique allow observa-
tion of living cells to determine motility. They also are used
to see natural cell size, arrangement, and shape. All of these
may be useful characteristics in the identification of a microbe.
䢇
Principle
A wet mount preparation is made by placing the specimen
in a drop of water on a microscope slide and covering it
with a cover glass. Because no stain is used and most cells
are transparent, viewing is best done with as little illumina-
tion as possible (Figure 6-36). Motility often can be observed
at low or high dry magnification, but viewing must be done
quickly due to drying of the preparation. As the water
recedes, bacteria will appear to be herded across the field.
This is not motility. You should look for independent darting
motion of the cells.
A hanging drop preparation allows longer observation
of the specimen since it doesn’t dry out as quickly. A thin
ring of petroleum jelly is applied around the well of a de-
pression slide. A drop of water is then placed in the center
of the cover glass and living microbes are transferred into it.
The depression microscope slide is carefully placed over the
cover glass in such a way that the drop is received into the
depression and is undisturbed. The petroleum jelly causes
the cover glass to stick to the slide.
The preparation may then be picked up, inverted so the
cover glass is on top, and placed under the microscope for
examination. As with the wet mount, viewing is best done
with as little illumination as possible. The petroleum jelly
forms an air-tight seal that slows drying of the drop, allow-
ing a long period for observation of cell size, shape, binary
fission, and motility.
If these techniques are done to determine motility, the
observer must be careful to distinguish between true motility
and Brownian motion created by collisions with water
molecules. In the latter, cells will appear to vibrate in place.
With true motility, cells will exhibit independent movement
over greater distances.
6-36
T
HE
W
ET
M
OUNT
Shown is an unstained wet mount prepa-
ration of Aeromonas sobria, a motile Gram-negative rod. Because of the
thickness of the water in the wet mount, cells show up in many different
focal planes and are mostly out of focus. To get the best possible image,
adjust the condenser height and reduce the light intensity with the iris
diaphragm.
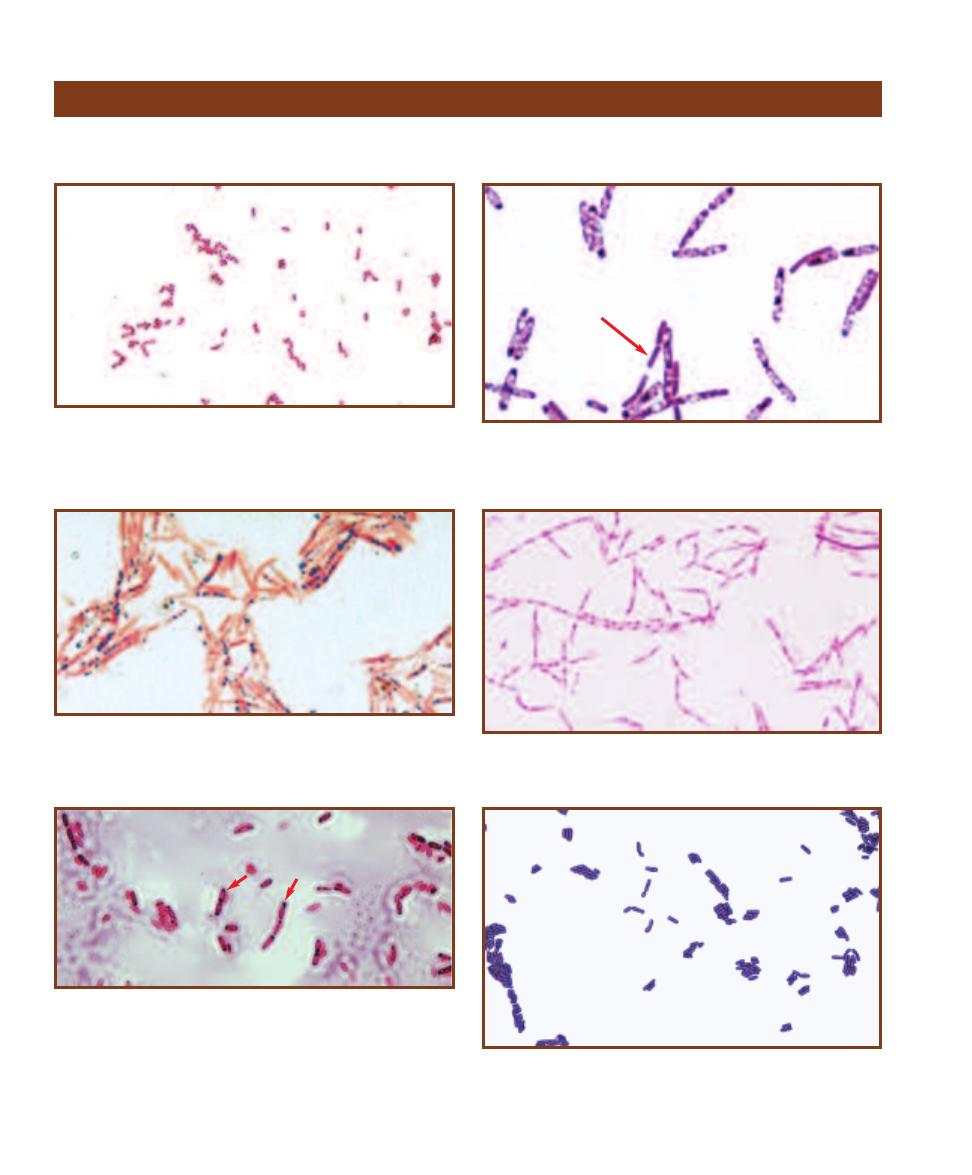
56
䢇
A Photographic Atlas for the Microbiology Laboratory
Miscellaneous Structures
Bacterial cellular structure is simple compared to eukaryotic cells. However, differentiation of cytoplasmic components
is possible to a certain degree. Figures 6-37 through 6-42 illustrate some of these structures.
6-37
B
IPOLAR
S
TAINING
(G
RAM
S
TAIN
)
Some cells in the Entero -
bacteriaceae (Gram-negative rods often found in the large intestine)
exhibit bipolar staining, in which the ends stain more darkly than the
center. These cells are said to be “vacuolated,” but they do not have
true, membrane-bound vacuoles.
6-38
V
ACUOLATED
C
YTOPLASM
(G
RAM
S
TAIN
)
Bacillus cells may
stain uniformly (arrow) or they may have a foamy, vacuolated appear-
ance (most cells in the field). The larger white regions within the cell are
probably developing endospores. This is Bacillus cereus grown in culture.
6-39
O
RGANIC
C
YTOPLASMIC
G
RANULES
(S
UDAN
B
LACK
B S
TAIN
)
Dark staining poly--hydroxybutyrate (PHB) granules serve as a carbon
and energy reserve. This specimen is Bacillus cereus; other organisms
store carbon in the form of starch or glycogen.
6-40
T
HE
N
UCLEOPLASM
Bacillus cereus stained to show the nucleo -
plasm. Remember that what appears to be a nucleus is not. There is no
membrane separating the nucleoid from the cytoplasm.
6-41
P
ARASPORAL
C
RYSTALS
Bacillus thuringiensis produces pro-
teinaceous bodies near its spores called parasporal crystals (the dark
objects indicated by arrows). These crystals kill the larvae of various
insect groups (especially Lepidopterans). After ingestion of the crystal, it
is activated in the larval gut by a protease enzyme. The result is cytolysis
of larval cells and, presumably, a ready nutrient source for the endo spore
when it germinates. These crystals have been commercially marketed as
Bt toxin.
6-42
C
ELL
W
ALL
S
TAIN
This is a micrograph of Bacillus coagulans
showing its cell walls. Notice the wall separating cells that form a chain.
This indicates that they are in the process of dividing or have recently
completed a division.
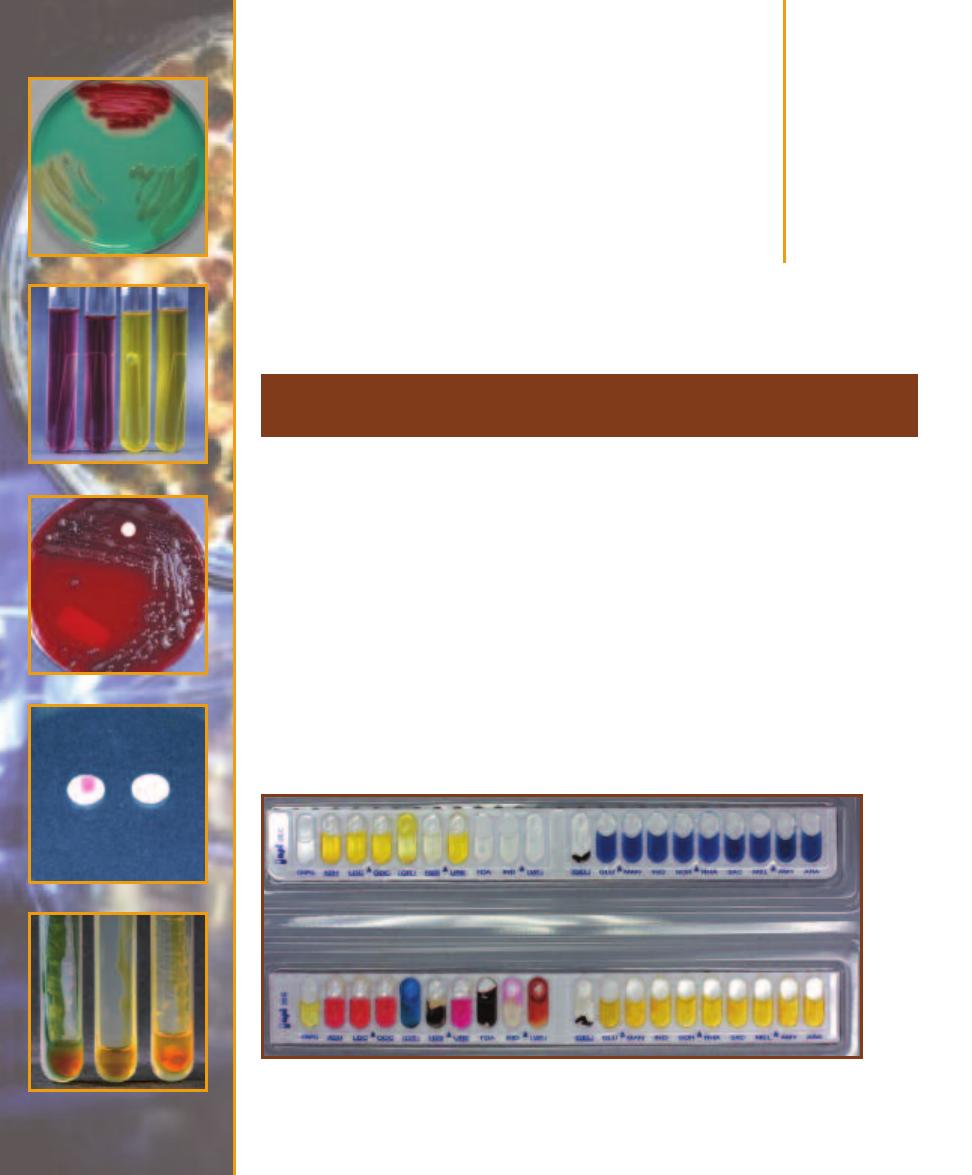
Differential Media
䢇
Purpose
The API 20 E multitest system (available from bioMérieux, Inc.) is used clinically for the rapid
iden tification of Entero bacteriaceae (more than 5,500 strains) and other Gram- negative rods (more
than 2,300 strains).
䢇
Principle
The API 20 E system is a plastic strip of 20 microtubes and cupules, partially filled with different
dehydrated substrates. Bacterial suspension is added to the microtubes, rehydrating the media and
inoculating them at the same time. As with the other biochemical tests in this section, color changes
take place in the tubes either during incubation or after addition of reagents. These color changes
reveal the presence or absence of chemical action and, thus, a positive or negative result (Figure 7-1).
After incubation, spontaneous reactions—those that do not require addition of reagents—are
evaluated first. Then tests that require addition of reagents are performed and evaluated. Finally,
the results are entered on the Result Sheet (Figure 7-2). An oxidase test is performed separately and
constitutes the 21st test.
API 20 E Identification System for Enterobacteriaceae
and Other Gram-negative Rods
7
S E C T I O N
57
7-1
API 20 E T
EST
S
TRIPS
The top strip is uninoculated. The bottom strip (with the exception of GEL) is
positive for all results.
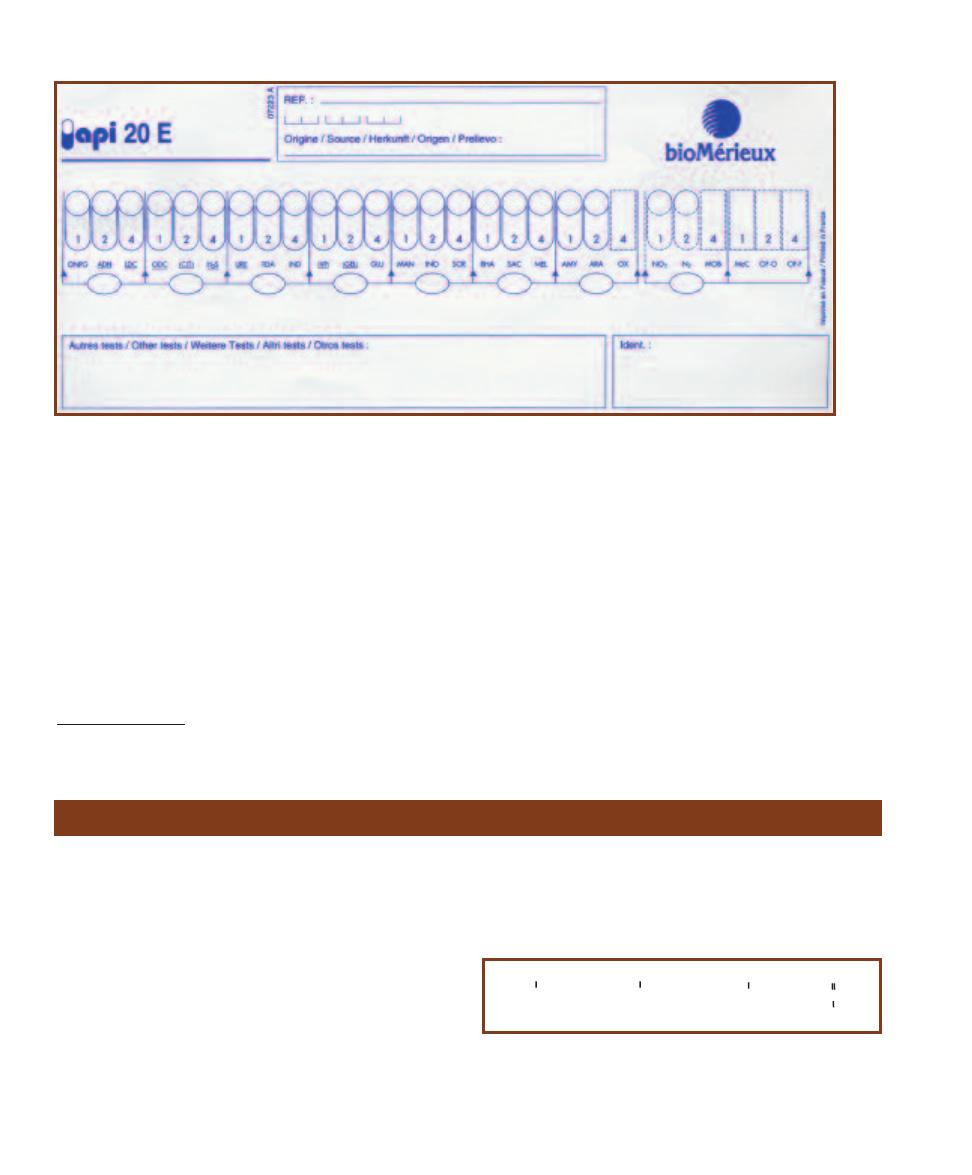
As shown in Figure 7-2, the Result Sheet divides the
tests into groups of three, with the members of a group
having numerical values of 1, 2, or 4, respectively. These
numbers are assigned for positive (Ⳮ) results only. Negative
(ⳮ) results are not counted. The values for positive results
in each group are added together to produce a number from
0 to 7, which is entered in the oval below the three tests.
The totals from each group are combined sequentially to
produce a seven-digit code, which can then be interpreted
on the Analytical Profile Index
*
.
In rare instances, information from the 21 tests (and
the 7-digit code) is not discriminatory enough to identify
an organism. When this occurs, the organism is grown and
examined on MacConkey Agar and supplemental tests are
performed for nitrate reduction, oxidation/reduction of
glucose, and motility. The results are entered separately in
the supplemental spaces on the Result Sheet and used for
final identification.
58
䢇
A Photographic Atlas for the Microbiology Laboratory
7-2
API 20 E R
ESULT
S
HEET
The API 20 E Result Sheet divides the tests into groups of three, assigning each member of a group a
numerical value of 1, 2, or 4. The values for positive results in each group are added together to produce a single-digit number. This number,
when combined with the numbers from other groups, produces a seven-digit code that then is interpreted using the Analytical Profile Index
supplied by the company (visit http://www.BioMérieux-USA.com).
Bacitracin Susceptibility Test
* The index is now available by subscription only through Bio-Mérieux-
USA.com.
䢇
Purpose
The Bacitracin Susceptibility Test is used to differentiate and
presumptively identify
-hemolytic group A streptococci
(Streptococcus pyogenes-susceptible) from other
-hemolytic
streptococci (resistant). It also differentiates the genus
Staphylococcus (resistant) from the susceptible Micrococcus
and Stomatococcus.
䢇
Principle
Antibiotics, as discussed in Section 19, are antimicrobial
substances produced by microorganisms. Bacitracin, pro-
duced by Bacillus licheniformis, is a powerful peptide anti -
biotic that inhibits bacterial cell wall synthesis (Figure 7-3).
Thus, it is effective only on bacteria that have cell walls and
are in the process of growing.
The Bacitracin Test is a simple test performed by placing
a bacitracin-impregnated disk on an agar plate inoculated
to produce a bacterial lawn. The bacitracin diffuses into
CH
3
CH
3
-C=CH-CH
2
-
CH
3
[CH
2
-C=CH-CH
2
]
9
-
CH
3
CH
2
-C=CH-CH
2
-O-P-O-
O
O-
7-3
U
NDECAPRENYL
P
HOSPHATE
Undecaprenyl phosphate is involved
in transport of peptidoglycan subunits across the cell membrane during
cell wall synthesis. Bacitracin interferes with its release from the peptido-
glycan subunit. It is a C
55
molecule derived from eleven isoprene sub-
units plus a phosphate.
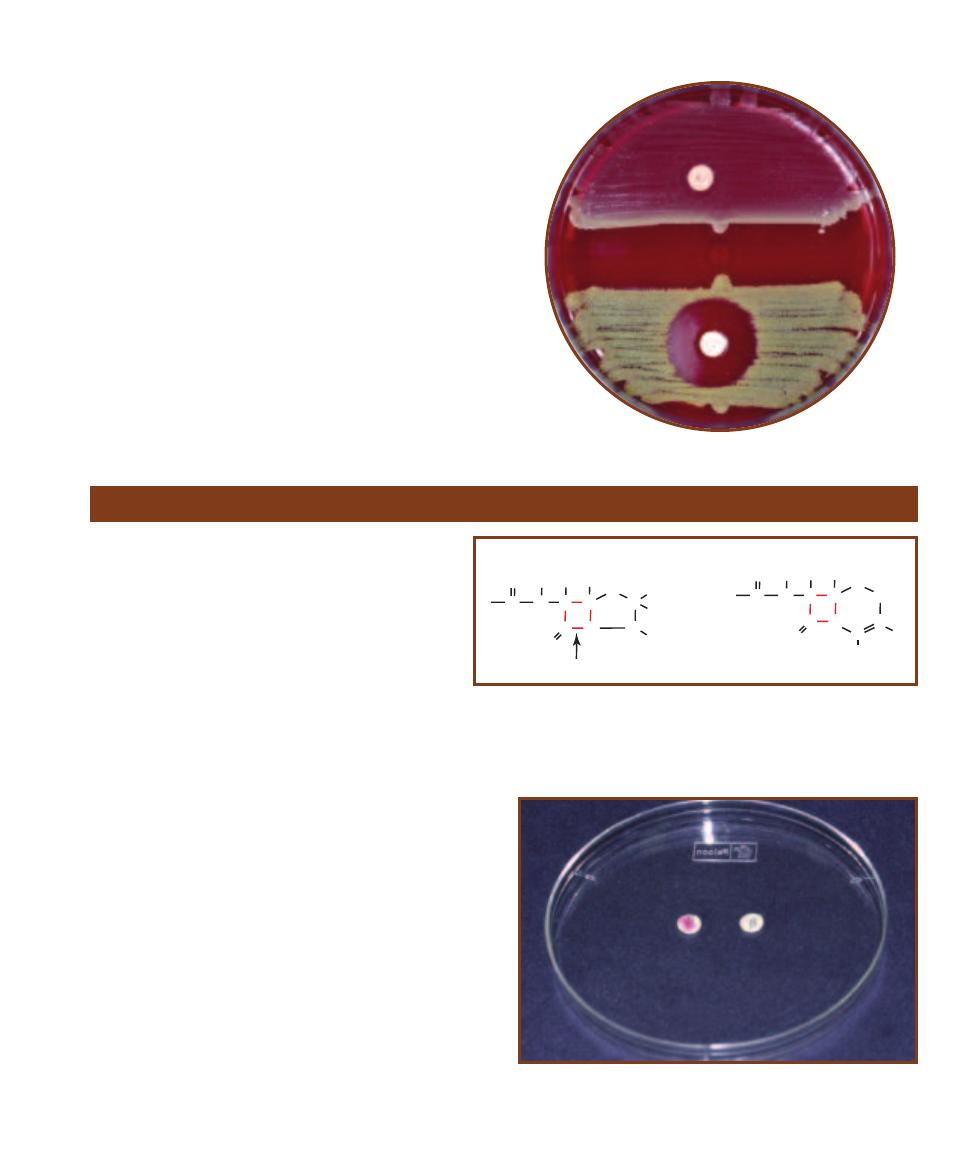
the agar and, where its concentration is sufficient, inhibits
growth of susceptible bacteria. Inhibition of bacterial growth
will appear as a clearing on the agar plate. Any zone of
clearing 10 mm in diameter or greater around the disk is
interpreted as bacitracin susceptibility (Figure 7-4). For
more information on antimicrobial susceptibility, refer to
the Antimicrobial Susceptibility Test, page 223.
SECTION 7
䢇
Differential Media
䢇
59
7-4
B
ACITRACIN
S
USCEPTIBILITY ON A
S
HEEP
B
LOOD
A
GAR
P
LATE
Staphylococcus aureus
(Resistant, R) is above and Micrococcus luteus
(Susceptible, S) is below.
-Lactamase Test
䢇
Purpose
The
-Lactamase Test is used to quickly identify
if patient isolates are resistant to penicillins and
cephalo sporins. It is especially useful in identifying
resistant strains of Neisseria gonorrhoeae, Staphylo-
coccus spp., and members of genus Enterococcus.
䢇
Principle
Penicillins and cephalosporins—called
-lactam an-
tibiotics because of the
-lactam ring in their chemical
structure—kill bacteria by interfering with cell wall
synthesis. The bacterial enzyme transpeptidase catalyzes
cross-linking between peptidoglycan subunits, thus adding
rigidity to the cell wall. By competing for sites on trans -
peptidase,
-lactam antibiotics prevent essential cross-
linking of the peptido glycan. Many bacteria have developed
resistance to these antibiotics by producing enzymes called
- lactamases. -lactamases hydrolyze the -lactam ring,
thus destroying the structure of the antibiotic. Partial
chemical structures of
-lactam antibiotics are shown in
Figure 7-5.
The
-Lactamase Test is one of many tests used to
identify
-lactamase production by measuring resistance to
-lactam antibiotics. In this test, a paper disk containing
nitrocefin is smeared with the test organism. Nitrocefin is a
cephalosporin, susceptible to most
-lactamases, that turns
pink when it is hydrolyzed. Therefore, if the test organism
produces
-lactamase, it will hydrolyze the nitrocefin and
produce a pink spot on the disk (Figure 7-6).
7-6
C
EFINASE
® D
ISKS
A -lactam resistant strain is on the left and a
susceptible strain is on the right.
(Disks available from Becton-Dickinson Microbiology Systems, Sparks, MD)
S
N
COOH
O
N
C
R
CH
3
CH
3
C
C
C
C
H
H
C
H
O
site of
b-lactamase action
Penicillin Core
S
N
COOH
O
N
C
CH
2
C
C
C
H
H
C
H
O
C
R
2
R
1
Cephalosporin Core
7-5
-L
ACTAM
A
NTIBIOTIC
S
TRUCTURE
Although penicillins and cephalo -
sporins have unique structures, their bactericidal effects are similar in that they
both contain a -lactam ring and interfere with peptidoglycan cross-linking.
The arrow indicates the site of -lactamase activity.
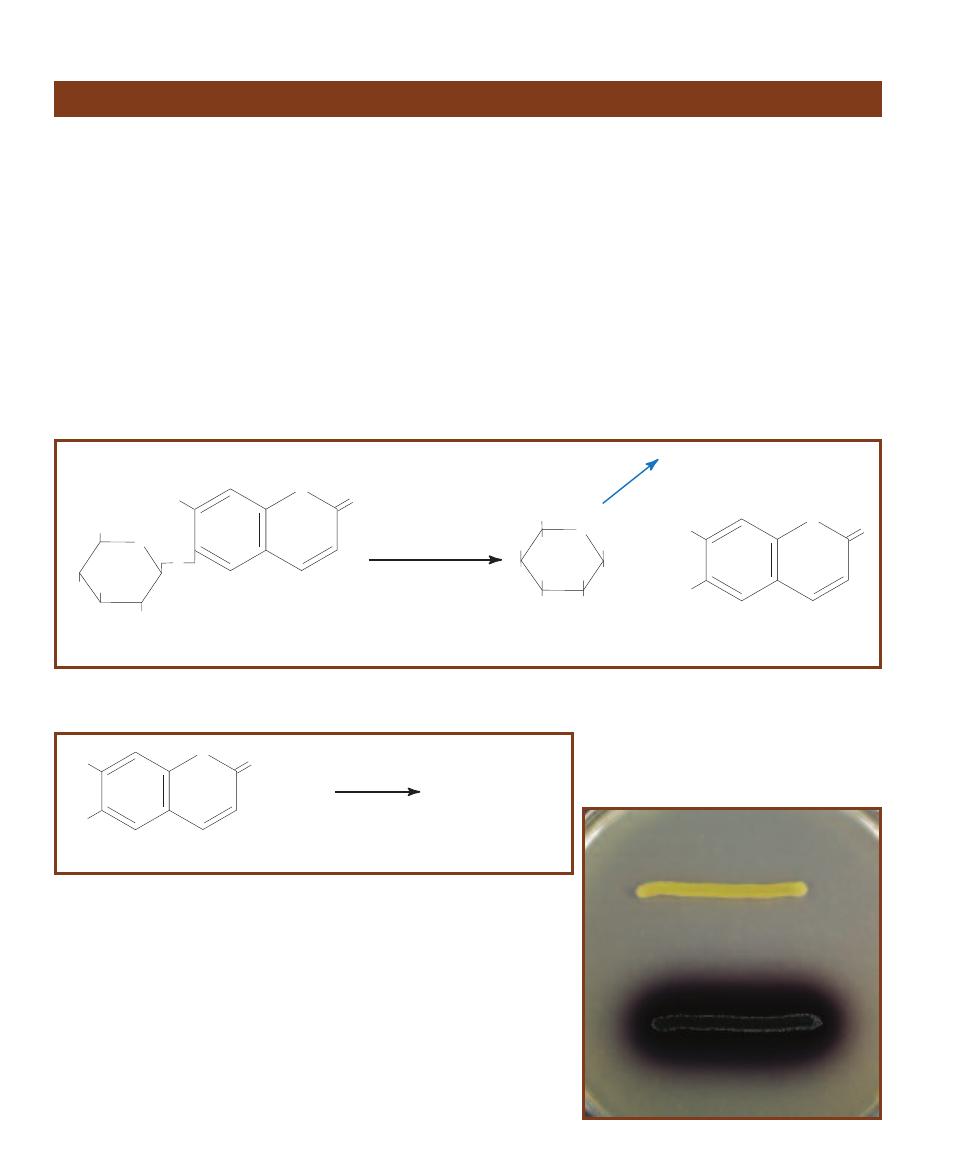
䢇
Purpose
The Bile Esculin Test is most commonly used for presumptive
identification of enterococci and members of the Strepto -
coccus bovis group, all of which are positive.
䢇
Principle
Bile Esculin Agar is an undefined, selective, and differential
medium containing beef extract, digest of gelatin, esculin,
oxgall (bile), and ferric citrate. Esculin, extracted from the
bark of the Horse Chestnut tree, is a glycoside composed
of glucose and esculetin. Beef extract and gelatin provide
nutrients and energy; bile is the selective agent added to
separate the Streptococcus bovis group and enterococci from
other streptococci (see Table 2-3, page 6). Ferric citrate is
added as a source of oxidized iron to indicate a positive test.
Many bacteria can hydrolyze esculin under acidic con -
ditions (Figure 7-7), and many bacteria, especially Gram-
negative enterics, demonstrate tolerance to bile. However,
among the streptococci, typically only enterococci and
members of the Streptococcus bovis group (S. equinus,
S. gallolyticus, S. infantarius, and S. alactolyticus) tolerate
bile and hydrolyze esculin.
In this test, when esculin molecules are split, esculetin
reacts with the Fe
3+
from the ferric citrate and forms a dark
brown precipitate (Figure 7-8). This precipitate darkens the
medium surrounding the growth. An organism that darkens
the medium even slightly is Bile Esculin-positive (Figure 7-9).
An organism that does not darken the medium is negative.
60
䢇
A Photographic Atlas for the Microbiology Laboratory
Bile Esculin Test
CH
2
OH
O
HO
OH
OH
O
HO
O
O
Esculin
Acid
CH
2
OH
O
HO
OH
OH
HO
O
O
+
OH
HO
b
-D-Glucose
Esculetin
Glycolysis
7-7
A
CID
H
YDROLYSIS OF
E
SCULIN
Many organisms have the ability to produce esculetin. However, the group D streptococci and enterococci are
unique in their ability to do this in the presence of bile salts.
HO
O
O
HO
Esculetin
+ Fe
3+
Dark Brown Color
7-8
B
ILE
E
SCULIN
T
EST
I
NDICATOR
R
EACTION
This test involves the reaction
of esculetin, produced during the hydrolysis of esculin, with Fe
3+
. The result is a
dark brown to black color in the medium.
7-9
B
ILE
E
SCULIN
T
EST
R
ESULTS
This
plate was inoculated with Staphylococcus
aureus (top) and Enterococcus faecium
(bottom). The darkening of the medium
around E. faecium indicates a positive
result.
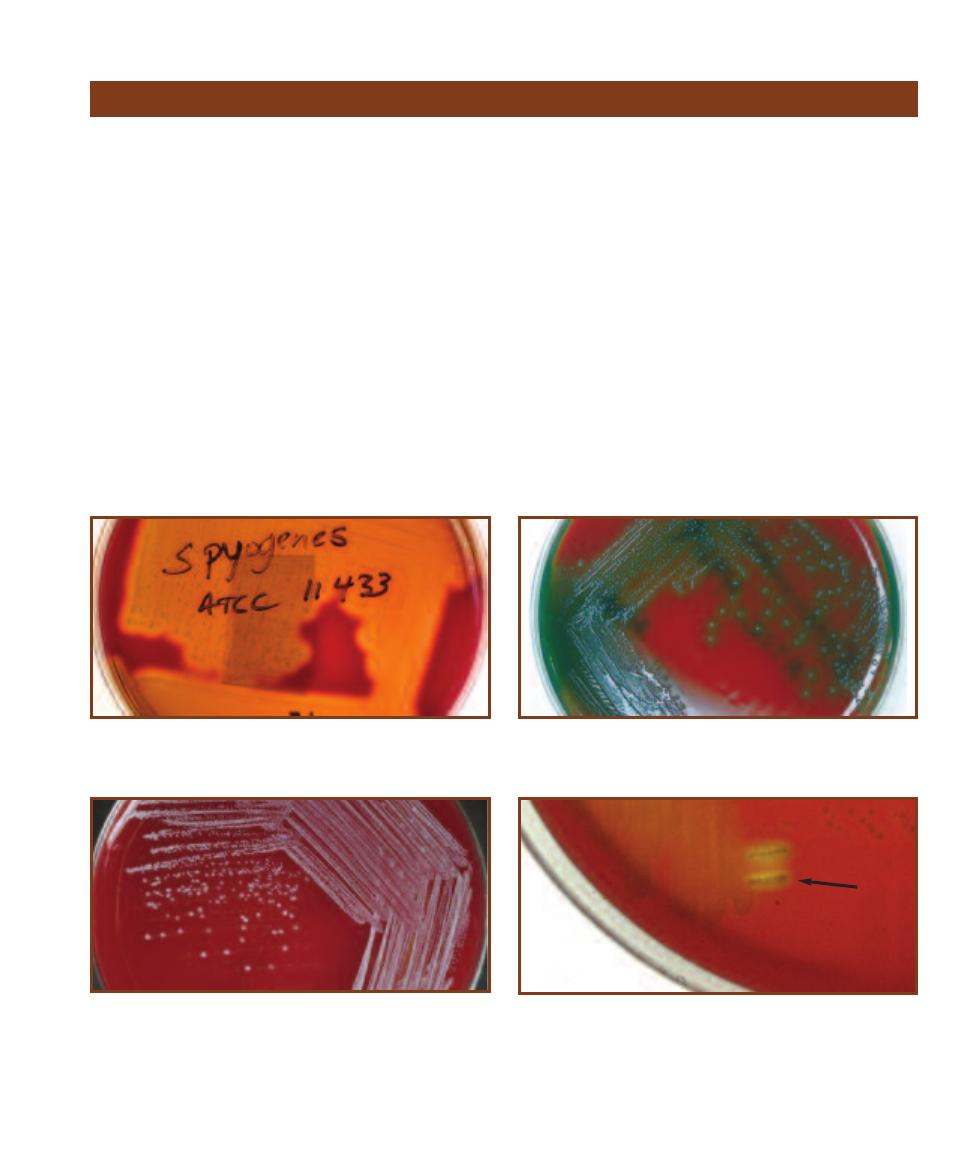
SECTION 7
䢇
Differential Media
䢇
61
䢇
Purpose
Blood agar is used for isolation and cultivation of many
types of fastidious bacteria. It is also used to dif ferentiate
bacteria based on their hemolytic characteristics, especially
within the genera Streptococcus, Enterococcus, and
Aerococcus.
䢇
Principle
Several species of Gram-positive cocci produce exotoxins
called hemolysins, which are able to destroy red blood cells
(RBCs) and hemoglobin. Blood Agar, sometimes called
Sheep Blood Agar because it includes 5% sheep blood in
a Tryptic Soy Agar base, allows differentiation of bacteria
based on their ability to hemolyze RBCs.
The three major types of hemolysis are
-hemolysis,
␣-hemolysis, and ␥-hemolysis. -hemolysis, the complete
destruction of RBCs and hemoglobin, results in a clearing of
the medium around the colonies (Figure 7-10).
␣-hemolysis
is the partial destruction of RBCs and produces a greenish
discoloration of the agar around the colonies (Figure 7-11).
␥-hemolysis is actually nonhemolysis and appears as simple
growth with no change to the medium (Figure 7-12).
Hemolysins produced by streptococci are called strepto -
lysins. They come in two forms—type O and type S. Strep-
tolysin O is oxygen-labile and expresses maxi mal activity
under anaerobic conditions. Strepto lysin S is oxygen- stable
but expresses itself optimally under an aerobic conditions
as well. The easiest method of pro viding an environment
favorable for streptolysins on Blood Agar is what is called
the streak–stab technique. In this procedure, the Blood Agar
plate is streaked for isolation and then stabbed with a loop.
The stabs encourage streptolysin activity because of the re-
duced oxygen concentration of the subsurface environment
(Figure 7-13).
Blood Agar
7-10
-H
EMOLYSIS
Streptococcus pyogenes demonstrates -hemolysis.
The clearing around the growth is a result of complete lysis of red blood
cells. This photograph was taken with transmitted light.
7-11
␣-H
EMOLYSIS
This is a streak plate of Streptococcus pneumoniae
demonstrating ␣-hemolysis. The greenish zone around the colonies
results from incomplete lysis of red blood cells.
7-12
␥-H
EMOLYSIS
This streak plate of Staphylococcus epidermidis
on a Sheep Blood Agar illustrates no hemolysis.
7-13
A
EROBIC VS
. A
NAEROBIC
H
EMOLYSIS
An unidentified throat
culture isolate demonstrates ␣-hemolysis when growing on the surface,
but -hemolysis beneath the surface surrounding the stabs (arrow).
This results from production of an oxygen-labile hemolysin.
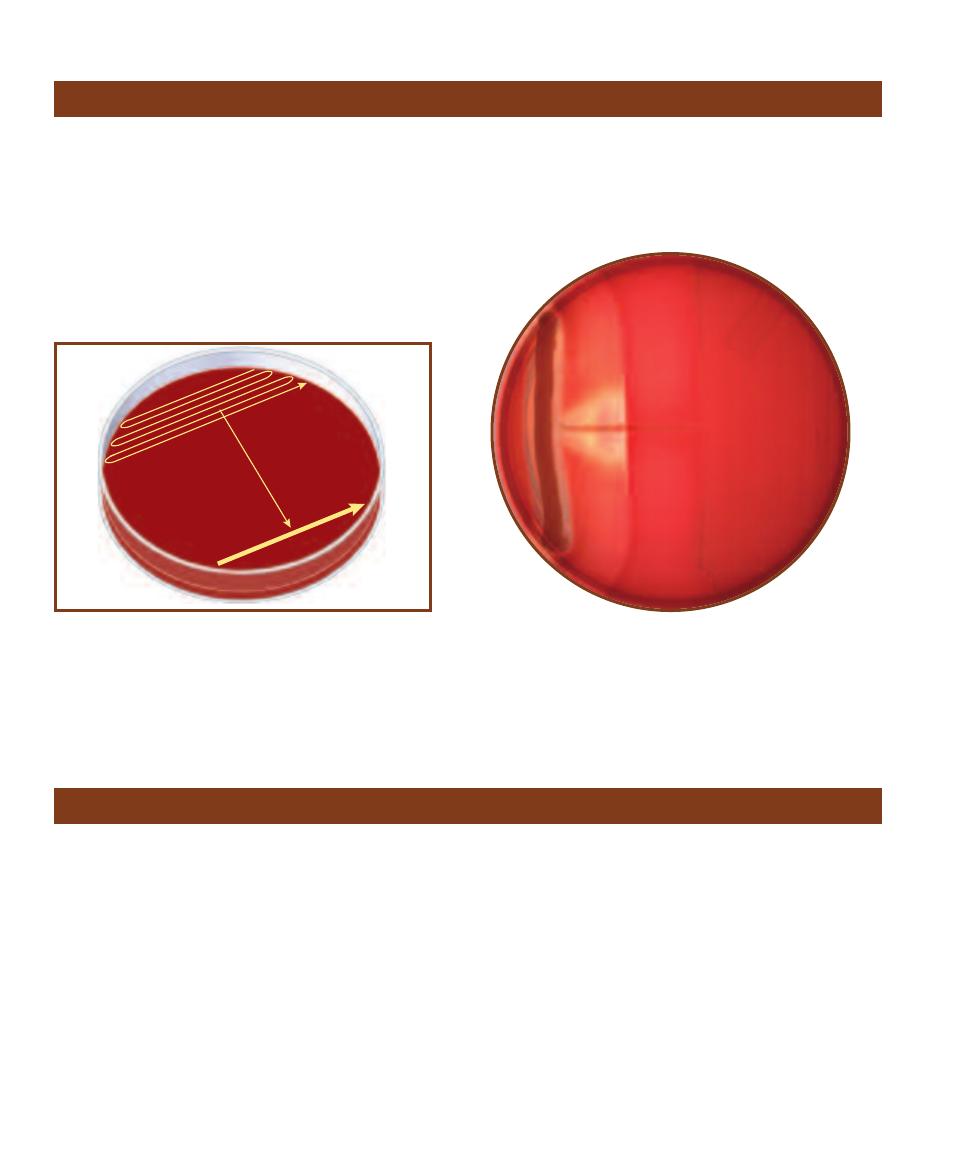
䢇
Purpose
The CAMP test (an acronym of the developers of the test—
Christie, Atkins, and Munch-Peterson) is used to differen -
tiate Group B Streptococcus agalactiae (Ⳮ) from other
Streptococcus species (ⳮ).
䢇
Principle
Group B Streptococcus agalactiae produces the CAMP
factor—a hemolytic protein that acts synergistically with
the
-hemolysin of Staphylococcus aureus subsp. aureus.
When streaked perpendicularly to an S. aureus subsp.
aureus streak on blood agar (Figure 7-14), an arrowhead-
shaped zone of hemolysis forms and is a positive result
(Figure 7-15).
62
䢇
A Photographic Atlas for the Microbiology Laboratory
CAMP Test
7-14
CAMP T
EST
I
NOCULATION
Two inoculations are made.
First Staphylococcus aureus subsp. aureus is streaked along one edge
of a fresh Blood Agar plate (I). Then the isolate (when testing an un-
known organism) is inoculated densely in the other half of the plate
opposite S. aureus (II). Finally, a single streak is made from inside
Streak II toward, but not touching, S. aureus (III).
I
II
III
7-15
P
OSITIVE
CAMP T
EST
R
ESULTS
Note the arrowhead zone
of clearing in the region where the CAMP factor of Streptococcus
agalactiae acts synergistically with the -hemolysin of Staphylococcus
aureus subsp. aureus.
䢇
Purpose
The Casein Hydrolysis Test is used to identify bacteria
capable of hydrolyzing casein with the enzyme casease.
䢇
Principle
Many bacteria require proteins as a source of amino acids
and other components for synthetic processes. Some bacteria
have the ability to produce and secrete enzymes (exoenzymes)
into the environment that catalyze the hydroly sis (break-down)
of large proteins to smaller peptides or individual amino
acids, thus enabling their uptake across the membrane.
Casease is an enzyme some bacteria produce to hydro -
lyze the milk protein casein (Figure 7-16), the molecule that
gives milk its white color. When broken down into smaller
fragments, the ordinarily white casein loses its opacity and
becomes clear.
The presence of casease can be detected easily with the
test medium Milk Agar (Figure 7-17). Milk Agar is an un -
defined medium containing pancreatic digest of casein, yeast
extract, dextrose, and powdered milk. When plated Milk
Agar is inoculated with a casease-positive organism, secreted
casease will diffuse into the medium around the colonies
and create a zone of clearing where the casein has been hy-
drolyzed. Casease-negative organisms do not secrete casease
and, thus, do not produce clear zones around the growth.
Casein Hydrolysis Test
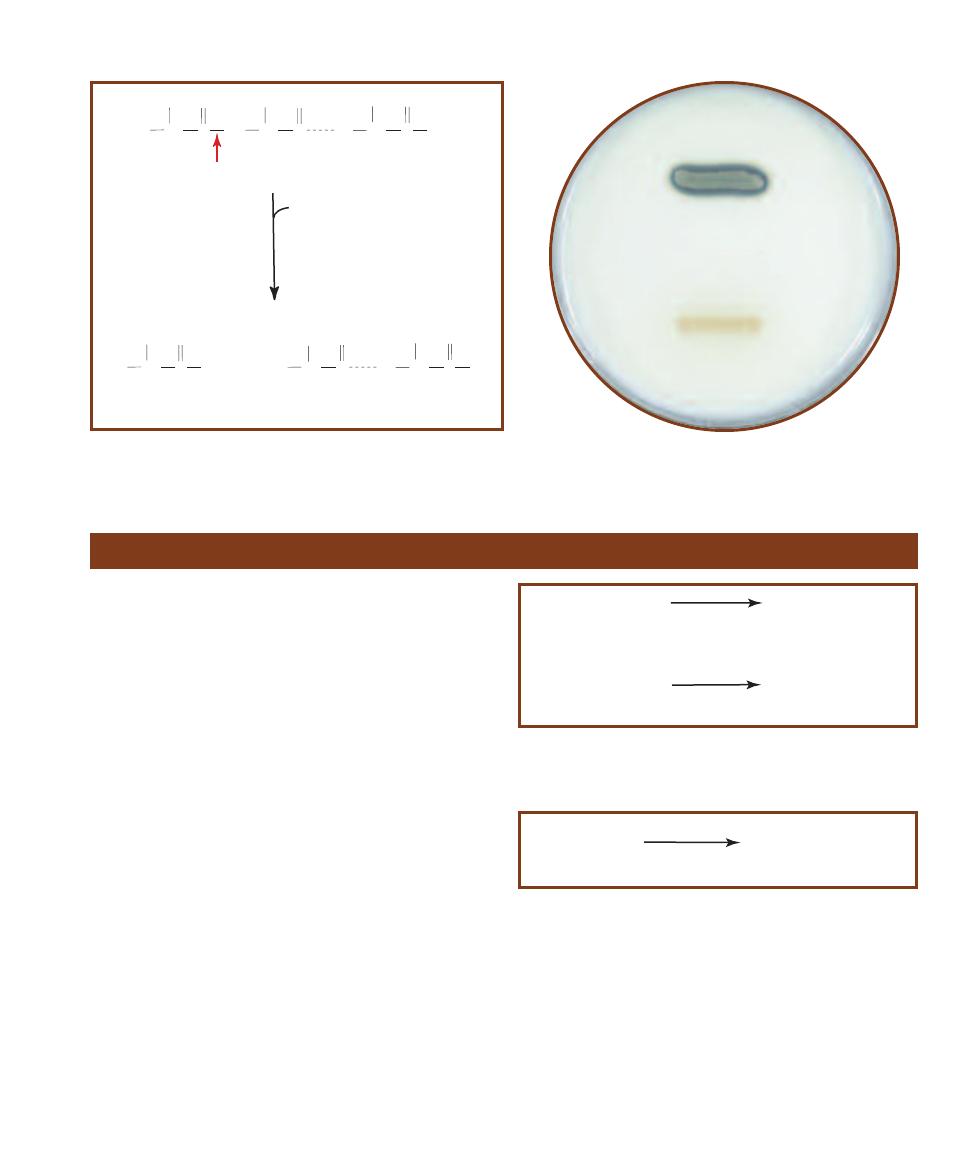
SECTION 7
䢇
Differential Media
䢇
63
7-16
C
ASEIN
H
YDROLYSIS
Hydrolysis of any protein occurs by breaking
peptide bonds (red arrow) between adjacent amino acids to produce short
peptides or individual amino acids.
R
CH
C
O
R
CH
C
O
R
CH
NH
C
O
OH
H
2
N
OH
H
2
N
+
protein (n-1 amino acids)
amino acid
R
CH
C
O
R
CH
NH
C
O
R
CH
NH
C
O
OH
H
2
N
protein (n amino acids)
casease
H
2
O
7-17
C
ASEIN
H
YDROLYSIS
T
EST
R
ESULTS
This Milk Agar plate
was inoculated with Bacillus megaterium (casease-positive) above and
Micrococcus roseus (casease-negative) below.
Catalase Test
䢇
Purpose
The Catalase Test is used to identify organisms that produce
the enzyme catalase. It is most commonly used to differentiate
members of the catalase-positive Micro coccaceae from the
catalase-negative Streptococcaceae. Variations on this test
may also be used in identification of Mycobacterium species.
䢇
Principle
The electron transport chains of aerobic and facultatively
anaerobic bacteria are composed of molecules capable of
accepting and donating electrons as con ditions dictate. As
such, these molecules alternate between the oxidized and
reduced form, passing electrons down the chain to the final
electron acceptor (FEA). Energy lost by electrons in this
sequential transfer is used to perform oxidative phosphory-
lation (i.e., produce ATP from ADP).
One carrier molecule in the ETC called flavoprotein can
bypass the next carrier in the chain and transfer electrons
directly to oxygen (Figure 7-18). This alternate pathway
produces two very potent cellular toxins—hydrogen peroxide
(H
2
O
2
) and superoxide radical (O
2
–
).
Aerobic and facultatively anaerobic bacteria produce
enzymes capable of detoxifying these compounds. Super -
oxide dis mutase catalyzes conversion of superoxide radicals
(the more lethal of the two compounds) to hydrogen perox-
ide (Figure 7-18). Catalase converts hydrogen peroxide into
water and gaseous oxygen (Figure 7-19).
Bacteria that produce catalase can be detected easily
using typical store-grade hydrogen peroxide. When hydro-
gen peroxide is added to a catalase-positive culture, oxygen
gas bubbles form immediately (Figures 7-20 and 7-21). If no
bubbles appear, the organism is catalase-negative. This test
can be performed on a microscope slide or by adding hydro-
gen peroxide directly to the bacterial growth.
FPH
2
+
O
2
FP
+
H
2
O
2
Reduced
Flavoprotein
Oxidized
Flavoprotein
Hydrogen
Peroxide
2H
+
+
2
O
2
-
.
Superoxide
Radical
H
2
O
2
+
O
2
Hydrogen
Peroxide
Superoxide
dismutase
7-18
M
ICROBIAL
P
RODUCTION OF
H
2
O
2
Hydrogen peroxide may
be formed through the transfer of electrons from reduced flavoprotein to
oxygen or from the action of superoxide dismutase.
2H
2
O
2
2H
2
O + O
2
(g)
Catalase
Hydrogen
Peroxide
7-19
C
ATALASE
M
EDIATED
C
ONVERSION OF
H
2
O
2
Catalase is an
enzyme of aerobes, microaerophiles, and facultative anaerobes that
converts hydrogen peroxide to water and oxygen gas.
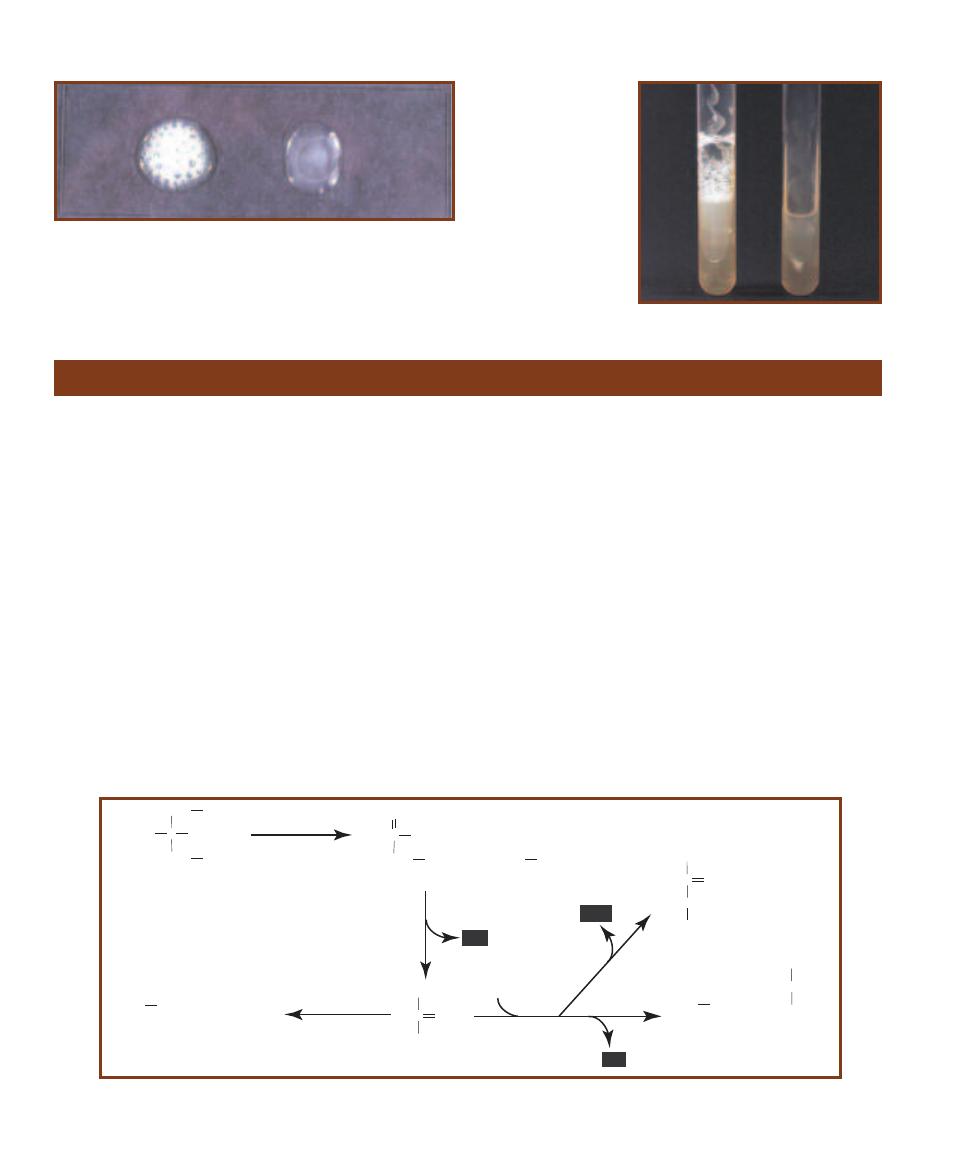
64
䢇
A Photographic Atlas for the Microbiology Laboratory
7-20
C
ATALASE
S
LIDE
T
EST
Shown is the catalase slide test in which
visible bubble production indicates a positive result. Staphylococcus
aureus (Ⳮ) is on the left, Enterococcus faecium (ⳮ) is on the right. It is a
good idea to cover the slide with a Petri dish lid immediately after addi-
tion of peroxide to contain aerosols produced in positive reactions.
7-21
C
ATALASE
T
UBE
T
EST
The catalase test
may also be performed on
an agar slant. Staphylo -
coccus aureus (Ⳮ) is on
the left, Enterococcus
faecium (ⳮ) is on the right.
Citrate Utilization Test
䢇
Purpose
The Citrate Utilization Test is used to determine the ability
of an organism to use citrate as its sole source of carbon.
Citrate utilization is one part of a test series referred to as
the IMViC (Indole, Methyl Red, Voges-Proskauer and
Citrate tests) that distinguishes between members of the
family Enterobacteriaceae and differentiates them from
other Gram-negative rods.
䢇
Principle
In many bacteria, citrate (citric acid) is produced as acetyl
coenzyme A (from the oxidation of pyruvate or the
-oxidation of fatty acids) reacts with oxaloacetate at the
entry to the Krebs cycle. Citrate is then converted through
a complex series of reactions back to oxaloacetate, which
begins the cycle anew. Refer to the Appendix (Figures A-1
and A-4) and Figure 7-51 for more information on the
Krebs cycle and fatty acid metabolism.
In a medium containing citrate as the only available
carbon source, bacteria that possess citrate-permease can
transport the molecules into the cell and enzymatically
convert it to pyruvate. Pyruvate can then be converted to
a variety of products, depending on the pH of the environ-
ment (Figure 7-22).
Simmons Citrate Agar is a defined medium that contains
sodium citrate as the sole carbon source and ammonium
phosphate as the sole nitrogen source. Bromthymol blue
dye, which is green at pH 6.9 and blue at pH 7.6, is added
as an indicator. Bacteria that survive in the medium and
utilize the citrate also convert the ammonium phosphate
to ammonia (NH
3
) and ammonium hydroxide (NH
4
OH),
both of which tend to alkalinize the agar. As the pH goes
up, the medium changes from green to blue (Figure 7-23).
Thus, conversion of the medium to blue is a positive citrate
test result.
Occasionally a citrate-positive organism will grow on a
Simmons Citrate slant without producing a change in color.
C
CH
2
OH
COO-
Citrate
CH
2
COO-
COO-
C
O
COO-
CH
2
COO-
Oxaloacetate
COO-
CH
3
Acetate
C
CH
3
O
COOH
Pyruvate
+
Citrase
Alkaline pH
COO-
CH
3
Acetate
CHOO-
+
Formate
Pyruvate
Acidic pH
COO-
CH
3
Acetate
CHOH
CH
3
COO-
Lactate
C
CH
3
O
HCOH
Acetoin
CH
3
+
CO
2
CO
2
2CO
2
7-22
C
ITRATE
C
HEMISTRY
In the presence of citrate-permease enzyme, citrate enters the cell and is converted to pyruvate. The
pyruvate is then converted to a variety of products depending on the pH of the environment.
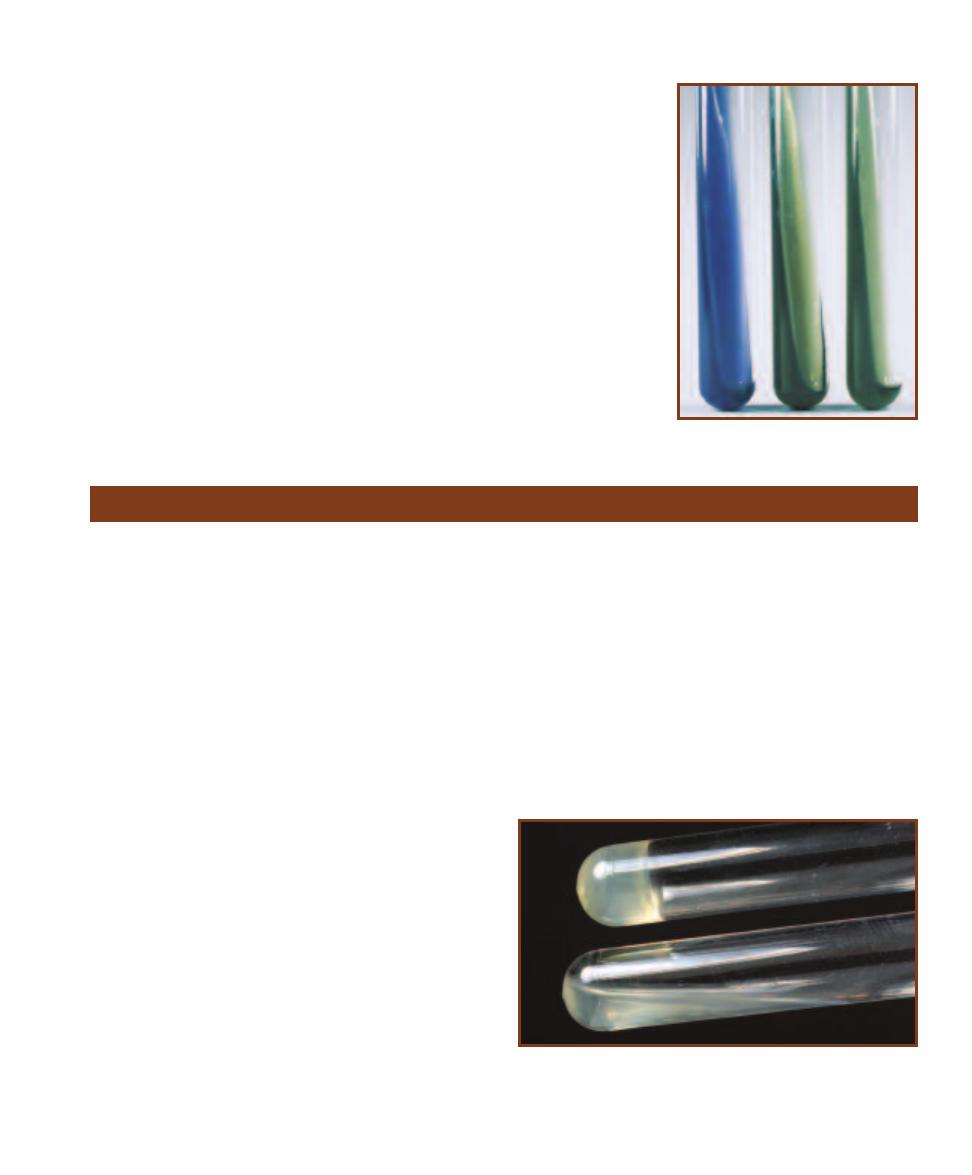
SECTION 7
䢇
Differential Media
䢇
65
In most cases, this is because of incomplete incubation. In
the absence of color change, growth on the slant indicates
that citrate is being utilized and is evi dence of a positive
reaction. To avoid confusion between actual growth and
heavy inoculum, which may appear as growth, citrate slants
typically are inoculated lightly with an inoculating needle
rather than a loop.
7-23
C
ITRATE
T
EST
R
ESULTS
Simmons citrate
agar inoculated Citrobacter
diversus (Ⳮ) on the left,
Bacillus cereus (ⳮ) in the
center, and an uninocu-
lated control on the right.
Coagulase Tests
䢇
Purpose
The Coagulase Test is typically used to differentiate
Staphylococcus aureus from other Gram-positive cocci.
䢇
Principle
Staphylococcus aureus is an opportunistic pathogen that
can be highly resistant to both the normal immune response
and antimicrobial agents. Its resistance is due, in part, to
the production of a coagulase enzyme. Coagulase works
in conjunction with normal plasma com ponents to form
protective fibrin barriers around individual bacterial cells
or groups of cells, shielding them from phagocytosis and
other types of attack.
Coagulase enzymes occur in two forms—bound
coagulase and free coagulase. Bound coagulase, also called
clumping factor, is attached to the bacterial cell wall and
reacts directly with fibrinogen in plasma. The fibrinogen
then precipitates causing the cells to clump together in a
visible mass. Free coagulase is an extracellular enzyme
(released from the cell) that reacts with a plasma component
called coagulase-reacting factor (CRF). The resulting reaction
is similar to the conversion of prothrombin and fibrinogen
in the normal clotting mechanism.
Two forms of the Coagulase Test have been devised
to detect the enzymes: the Tube Test and the Slide Test.
The Tube Test detects the presence of either bound or free
coagulase, while the Slide Test detects only bound coagulase.
Both tests utilize rabbit plasma treated with anticoagulant
to interrupt normal clotting mechanisms.
The Tube Test is performed by adding the test organism
to rabbit plasma in a test tube. Coagulation of the plasma
(including any thickening or formation of fibrin threads)
within 24 hours indicates a positive reaction (Figure 7-24).
The plasma is typically examined for clotting (without
shaking) after about 4 hours because it is possible for
coagulation to take place early and revert to liquid within
24 hours.
In the slide test, bacteria are transferred to a slide con-
taining a small amount of plasma. Agglutination of the
cells on the slide within one to two minutes indicates the
presence of bound coagulase (Figure 7-25). Equivocal or
negative Slide Test results are typically confirmed using the
Tube Test.
7-24
C
OAGULASE
T
UBE
T
EST
Coagulase-negative Staphylococcus
epidermidis below and the more pathogenic coagulase- positive S. aureus
above. Coagulase increases bacterial resistance to phagocytosis and
antibodies by surrounding infecting organisms with a clot.
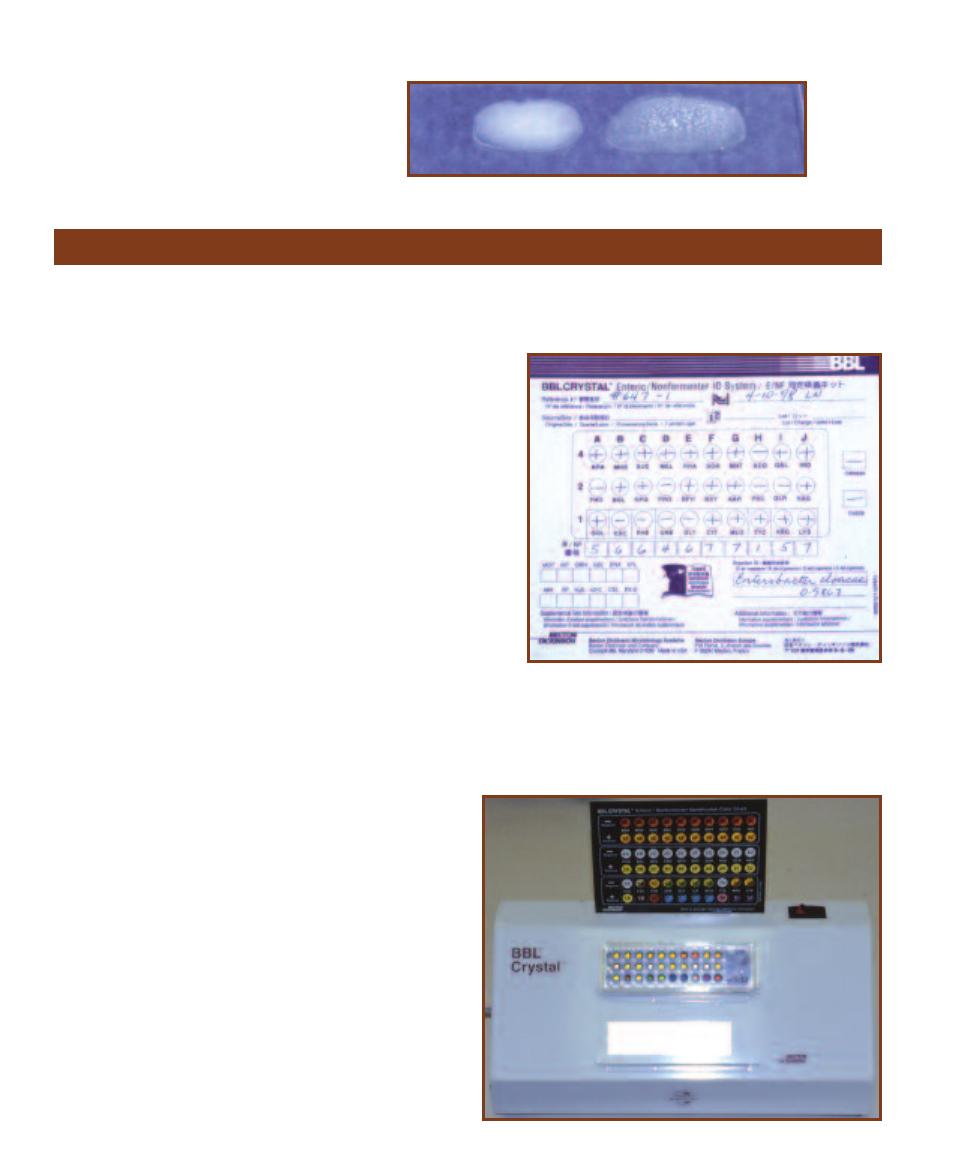
66
䢇
A Photographic Atlas for the Microbiology Laboratory
7-25
C
OAGULASE
S
LIDE
T
EST
Emulsions of
Staphylococcus epidermidis (ⳮ) on the left and
S. aureus (Ⳮ) on the right were prepared in sterile
saline. Agglutination of the coagulase plasma is
indicative of a positive result for bound coagulase.
䢇
Purpose
The BBL CRYSTAL™ E/NF (Becton Dickinson Microbiology
Systems) is a multitest system used to identify aerobic Gram-
negative rods of the family Entero bacteriaceae, as well as other
Gram- negative bacilli re covered from human samples. Identifi -
cation is based on the results of 30 biochemical tests.
䢇
Principle
The BBL CRYSTAL™ E/NF (Figure 7-26) test system panel con-
sists of a base with 30 wells and a lid with 30 plastic tabs, each
with a dehydrated substrate on its tip and which fits into a differ-
ent well when the lid is in place. The organism to be identified is
first suspended in an inoculum fluid, then dispensed into the 30
wells of the base. Placement of the lid onto the base immerses the
plastic tabs in inoculum and reconstitutes the dehydrated sub-
strates. Separate oxidase and indole tests must also be run.
After 18 to 20 hours incubation, the panel may be read using
a light box and comparing the results to a standard color reaction
chart. As can be seen in Figure 7-26, there are three rows of ten
tests each (A through J). Numerical values of 4, 2, or 1 are as-
signed to any positive results for any test in the top, middle, or
bottom rows, respectively, on the score sheet (Figure 7-27). By
adding the values in the ten columns, a 10-digit BBL CRYSTAL™
BBL CRYSTAL™ Identification System—Enteric/Nonfermenter (E/NF)
7-27
T
HE
BBL CRYSTAL™ E/NF S
CORE
S
HEET
Positive
test results are assigned a value of 4, 2, or 1, depending on its
row. Columns are added and a ten digit number is made from
the sums. This number is then matched to a database containing
approximately 100 taxa for identification. The ten-digit number
(5664677157) on this score sheet identifies the organism as
Enterobacter cloacae.
7-26
T
HE
BBL CRYSTAL™ E/NF
The top row tests for carbo hydrate
utilization with acid end products. Positive tests are indicated by a gold or
yellow color and are given a value of 4. The carbohydrates are: ARA=
Arabinose, MNS=Mannose, SUC=Sucrose, MEL=Melibiose, RHA=Rhamnose,
SOR=Sorbitol, MNT=Mannitol, ADO=Adonitol, GAL=Galactose, and INO=
Inositol. The second row consists of tests that detect the ability to hydrolyze
the various substrates with the production of a yellow compound (either p-
nitrophenol or p-nitroaniline). Each positive is assigned a value of 2. The
substrates are: PHO=p-nitrophenyl phosphate, BGL=p-nitrophenyl ␣--
glucoside, NPG=p-nitrophenyl -galactoside, PRO=Proline nitroanilide,
BPH=p-nitrophenyl bis-phosphate, BXY=p-nitrophenyl xyloside, AAR=p-
nitrophenyl ␣-arabinoside, PHC=p-nitrophenyl phos phorylcholine, GLR=p-
nitrophenyl -glucuronide, and NAG=p-nitrophenyl-N-acetyl glucosamide.
The third row consists of various biochemical tests with each positive
result being given a value of 1. The tests are as follows with the positive
result in parentheses: GGL=␥-L-glutamyl p-nitro anilide hydrolysis (yellow),
ESC=Esculin hydrolysis (black), PHE-Phenyl alanine deamination (brown),
URE=Urea hydrolysis (blue), GLY=Glycine degrada tion (blue), CIT=Citrate
utilization (blue), MLO=Malonate utilization (blue), TTC=Tetrazolium reduc-
tion (red), ARG=Arginine catabolism (purple), and LYS=Lysine catabolism
(purple).
profile number is obtained. The profile number is
then matched to a computer data base of approxi-
mately 100 taxa for identification.

SECTION 7
䢇
Differential Media
䢇
67
䢇
Purpose
Decarboxylase media can include any one of several
amino acids and each detects the presence of a differ-
ent decarboxylase enzyme. Typically, these media are
used to differen tiate organisms in the family Enterobac-
teriaceae and to distinguish them from other Gram-
negative rods.
䢇
Principle
Møller’s Decarboxylase Base Medium contains pep-
tone, glucose, the pH indicator bromcresol purple, and
the co enzyme pyridoxal phosphate. Bromcresol purple
is purple at pH 6.8 and above, and yellow below pH
5.2. Base medium can be used with one of a number
of specific amino acid substrates, depending on the
decarboxylase to be identified.
After inoculation, an overlay of mineral oil is used
to seal the medium from external oxygen and promote
fer mentation. Glucose fermentation (all Enterobacteri-
aceae ferment glucose) in the anaerobic medium ini-
tially turns it yellow due to the accumulation of acid
end products. The low pH and presence of the specific
amino acid induces decarboxylase-positive organisms
to produce the enzyme. (That is, the specific decarboxy-
lase gene is “switched on.”)
Decarboxylation of the amino acid results in
accumulation of alkaline end products that turn the
medium purple (refer to Figures 7-28 through 7-31).
If the or ganism is a glucose fermenter but does not
produce the appropriate decarboxylase, the medium
will turn yellow and remain so. If the organism does
Decarboxylation Test
R
CH
H
2
N
COOH
R
CH
2
+ CO
2
H
2
N
Decarboxylase
pyridoxyl phosphate
Amino acid
Amine
7-28
A
MINO
A
CID
D
ECARBOXYLATION
Removal of an amino acid’s
carboxyl group results in the formation of an amine and carbon dioxide.
H
2
N CH
COOH
CH
2
Lysine
CH
2
CH
2
CH
2
NH
2
H
2
N CH
2
CH
2
Cadaverine
CH
2
CH
2
CH
2
NH
2
Lysine decarboxylase
pyridoxyl phosphate
+ CO
2
7-29
L
YSINE
D
ECARBOXYLATION
Decarboxylation of the amino acid ly-
sine produces cadaverine and CO
2
.
H
2
N CH
COOH
NH
2
Ornithine
CH
2
CH
2
CH
2
H
2
N CH
2
NH
2
Putrescine
CH
2
CH
2
CH
2
Ornithine decarboxylase
pyridoxyl phosphate
+ CO
2
7-30
O
RNITHINE
D
ECARBOXYLATION
Decarboxylation of the amino acid
ornithine produces putrescine and CO
2
.
H
2
N CH
COOH
NH
Arginine
CH
2
CH
2
CH
2
HN C NH
2
H
2
N CH
2
NH
Agmatine
CH
2
CH
2
CH
2
HN C NH
2
Arginine decarboxylase
pyridoxyl phosphate
CO
2
H
2
N CH
2
NH
2
Putrescine
CH
2
CH
2
CH
2
C O
H
2
N
H
2
N
Urea
+
Agmatinase
(Enterobacteriaceae)
H
2
O
Urease
(if present)
2NH
3
+ CO
2
H
2
O
7-31
A
RGININE
D
ECARBOXYLATION
Decarboxylation of the amino acid arginine produces the amine agmatine. Members of Entero bacteriaceae
are capable of degrading agmatine into putrescine and urea. Those strains with urease can further break down the urea into ammonia and carbon
dioxide. Thus, the end products of arginine catabolism are carbon dioxide, putrescine, and urea, or carbon dioxide, putrescine, and ammonia.
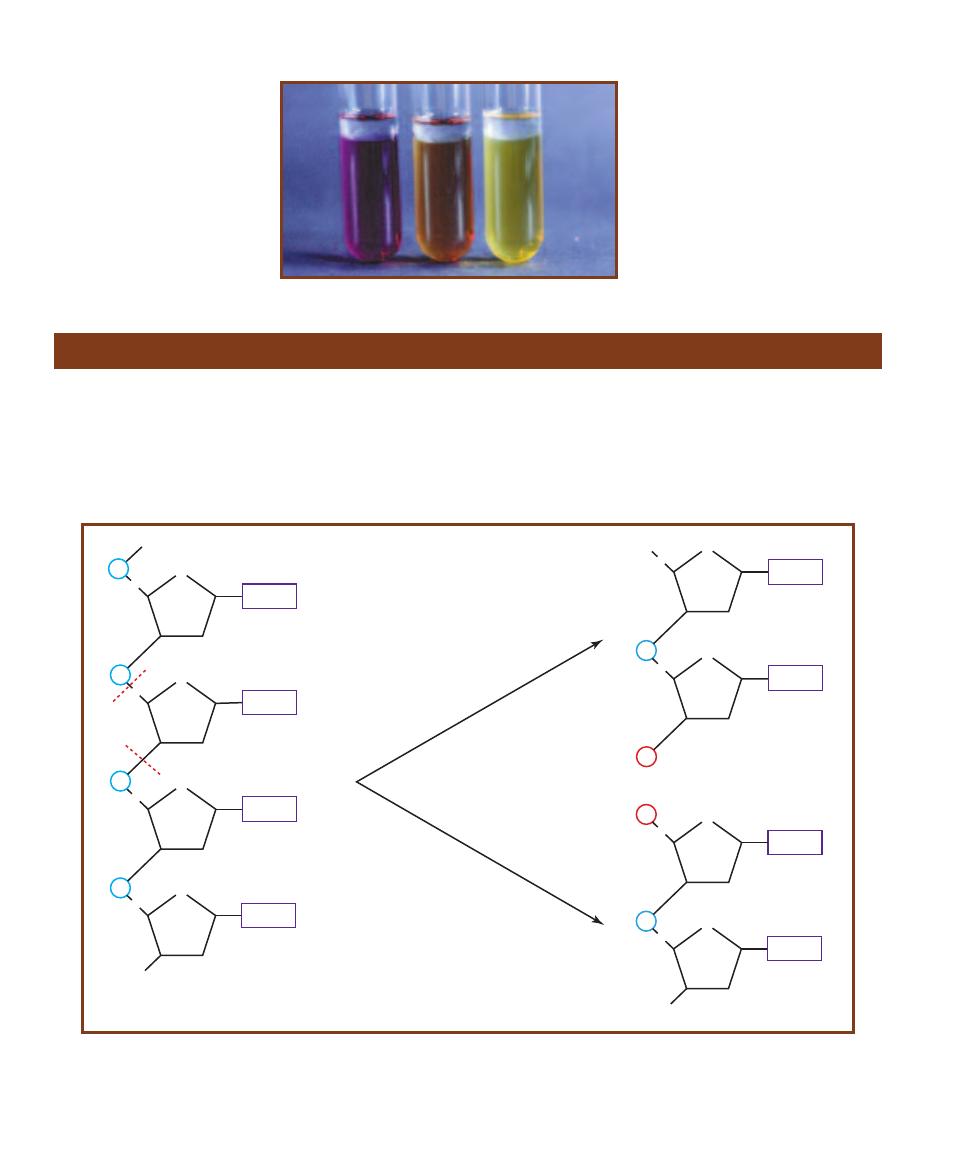
68
䢇
A Photographic Atlas for the Microbiology Laboratory
7-32
D
ECARBOXYLATION
T
EST
R
ESULTS
Lysine decarboxylase test results are shown
here, but the colors are the same for all amino
acids in Møller’s medium. Pseudomonas
aeruginosa (Ⳮ) is on the left and Proteus
vulgaris (ⳮ) is on the right. An uninoculated
control is in the center.
CH
2
CH
2
CH
2
CH
2
OH
CH
2
CH
2
CH
2
CH
2
P
P
P
Nitrogenous
base
Nitrogenous
base
Nitrogenous
base
Nitrogenous
base
O
O
5'
3'
5'
5'
5'
O
3'
O
3'
P
P
Nitrogenous
base
Nitrogenous
base
O
O
5'
3'
P
P
Nitrogenous
base
Nitrogenous
base
5'
5'
O
3'
O
3'
1
S
ta
ph
ylo
co
cc
us
DN
as
e
2
S
err
atia
D
Na
se
1
2
3'
3'
OH
5'
P
Pr
od
uc
es
fr
ag
m
en
ts
lik
e
th
is
Pro
du
ce
s fr
ag
m
en
ts l
ike
th
is
7-33
T
WO
P
ATTERNS OF
DNA H
YDROLYSIS
DNase from Staphylococcus hydrolyzes DNA at the bond between the 5’-carbon and the
phosphate (illustrated by line 1), thereby producing fragments with a free 3’-phosphate (shown in red on the upper fragment). Most frag-
ments are one or two nucleotides long. A dinucleotide is shown here. Serratia DNase cleaves the bond between the phosphate and the
3’-carbon (illustrated by line 2) and produces fragments with free 5’-phosphates (shown in red on the lower fragment). Most fragments
are two to four nucleotides in length. A dinucleotide is shown here.
䢇
Purpose
DNase Test Agar is used to distinguish Serratia species (Ⳮ)
from Enterobacter species, Moraxella catarrhalis (Ⳮ) from
Neisseria species, and Staphylococcus aureus (Ⳮ) from other
Staphylococcus species.
䢇
Principle
An enzyme that catalyzes the hydrolysis of DNA into small
fragments (oligonucleotides) or single nucleotides is called
a deoxyribonuclease or DNase (Figure 7-33). DNase is an
exoenzyme, that is, an enzyme that is secreted by a cell and
DNase Test Agars
not ferment glucose the
medium will exhibit no color
change. Purple color is the
only result that is considered
positive; all others are
negative (Figure 7-32).
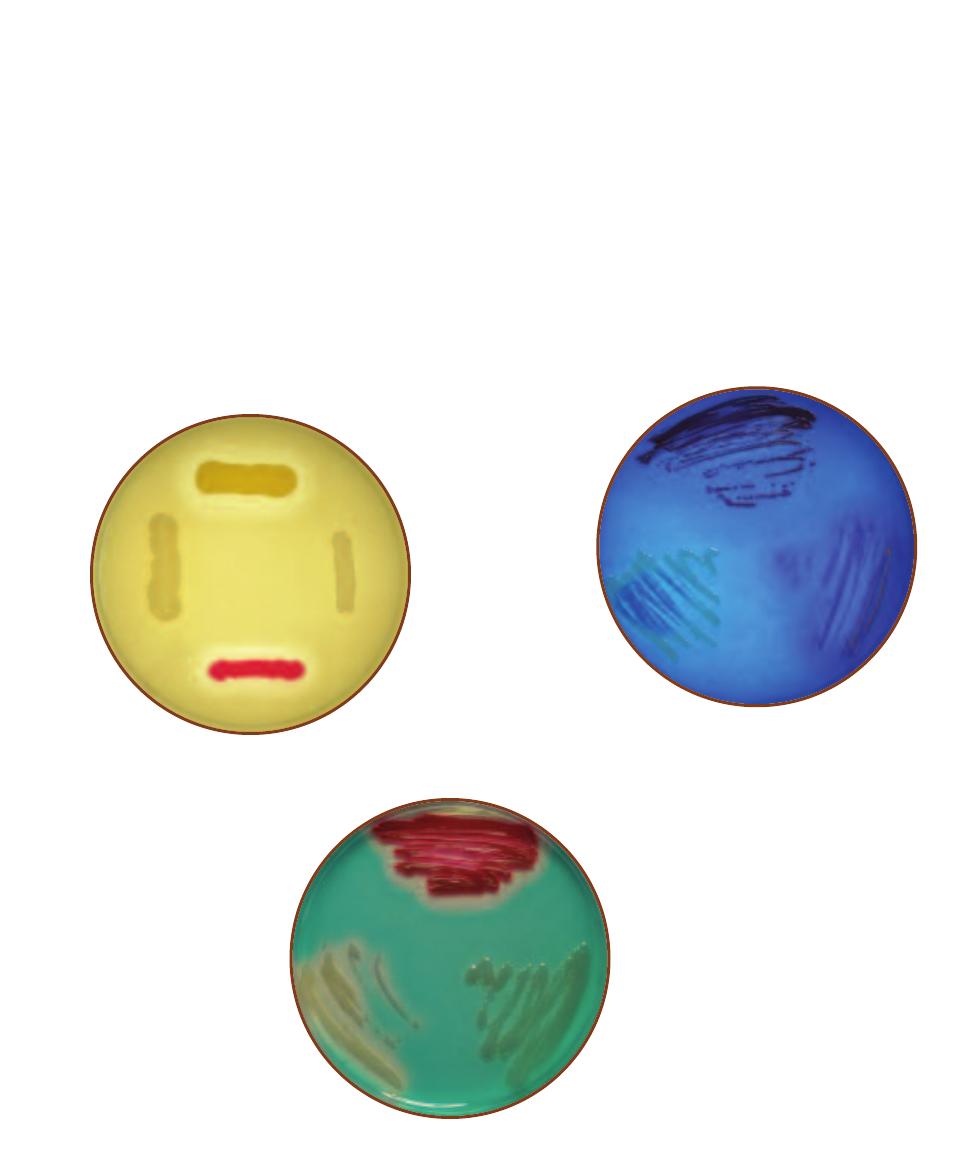
SECTION 7
䢇
Differential Media
䢇
69
acts on the substrate extracellularly. This extracellular diges-
tion allows utilization of a macro molecule too large to be
transported into the cell. Ability to produce this enzyme
can be determined by culturing and observing a suspected
organism on a DNase Test Agar plate. Three versions of the
test are available.
One formulation for DNase Agar consists of peptides
derived from soybean and casein that serve as carbon and
nitrogen sources, sodium chloride for osmotic balance, and
DNA as the substrate. After incubation, 1N HCl is added.
Intact DNA will form a cloudy precipitate with the HCl, but
not with nucleotides. Therefore, clearing around the growth
is an indication of DNase activity (DNA hydrolysis) (Figure
7-34).
A modification of DNase test agar includes toluidine
blue, which forms a blue complex with intact DNA, but
appears pinkish when complexed with nucleotides. DNase
activity is indicated by a pink coloration around the growth
(Figure 7-35). While this medium has the advantage of not
using 1N HCl reagent, toluidine blue may inhibit some
Gram-positive cocci, so it is recommended for use with
Enterobacteriaceae.
An alternate modification of DNase Test Agar contains
methyl green dye. The dye forms a complex with poly -
merized DNA that gives the agar a blue-green color at pH
7.5, but no complex is formed with nucleotides. Bacterial
colonies that secrete DNase produce clearing around the
growth of DNase positive organisms (Figure 7-36). The
advantage to this medium is that adding 1N HCl is not
necessary and it is appropriate for use with both Gram-
positive cocci and Enterobacteriaceae.
7-34
DN
ASE
A
GAR
Clockwise from the top: Staphylo-
coccus aureus (Ⳮ), Staphylococcus epidermidis (ⳮ), Serratia
marcescens (Ⳮ), and Entero bacter aerogenes (ⳮ).
7-35
DN
ASE
A
GAR WITH
T
OLUIDINE
B
LUE
Clockwise
from the top: Serratia marcescens (Ⳮ), Staphylococcus
aureus (Ⳮ), and Enterobacter aerogenes (ⳮ). S. aureus strains
often grow poorly on this medium. For this reason, DNase
plus TB is recommended for use with Enterobacteriaceae.
7-36
DN
ASE
A
GAR WITH
M
ETHYL
G
REEN
Clock-
wise from the top: Serratia marcescens (Ⳮ), Enterobacter
aerogenes (ⳮ), and Staphylococcus aureus (Ⳮ).
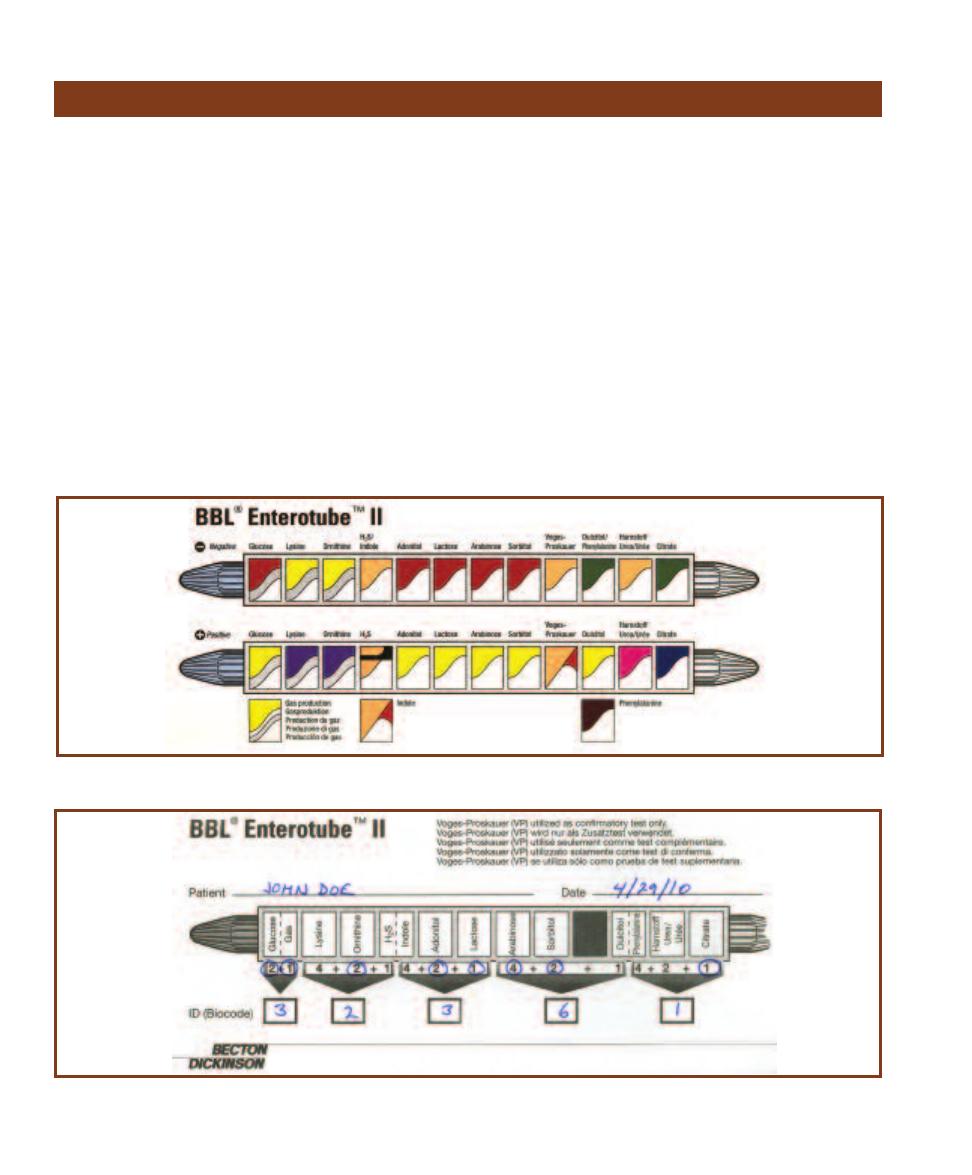
䢇
Purpose
The Enterotube
®
II is a multiple test system used for rapid
identification of bacteria from the family Enterobacteriaceae.
䢇
Principle
The Enterotube
®
II is a multiple test system designed to
identify enteric bacteria based on: glucose, adonitol, lactose,
arabinose, sorbitol and dulcitol fermentation, lysine and
ornithine decarboxylation, sulfur reduction, indole pro -
duction, acetoin production from glucose fermentation,
phenylalanine deamination, urea hydrolysis, and citrate
utilization.
The Enterotube
®
II, as diagramed in Figure 7-37, is a
tube containing 12 individual chambers. Inside the tube,
running lengthwise through its center, is a removable wire.
After the end-caps are aseptically removed, one end of the
wire is touched to an isolated colony on a streak plate and
drawn back through the tube to inoculate the media in each
chamber.
After 18 to 24 hours incubation, the results are inter-
preted, the indole test is performed, and the tube is scored
on an Enterotube
®
II Results Sheet (Figure 7-38). As shown
in the figure, the combination of positives entered on the
score sheet results in a five-digit numeric code. This code
is used for identification in the Enterotube
®
II Computer
Coding and Identification System (CCIS).
The CCIS is a master list of all enterics and their assigned
numeric codes. In most cases the five-digit number applies
to a single organism, but when two or more species share
the same code, a confirmatory VP test is performed to
further differentiate the organisms. Figure 7-39 shows an
Enterotube
®
II before and after inoculation.
70
䢇
A Photographic Atlas for the Microbiology Laboratory
Enterotube
®
II
7-37
E
NTEROTUBE
® II T
EST
R
ESULT
D
IAGRAM
Illustration courtesy of Becton Dickinson and Company
7-38
BBL E
NTERO TUBE
® II R
ESULT
S
HEET
This is the result sheet for the tube in Figure 7-39B. The ID value obtained was 32361, which identifies
the organism as Entero bacter aerogenes.
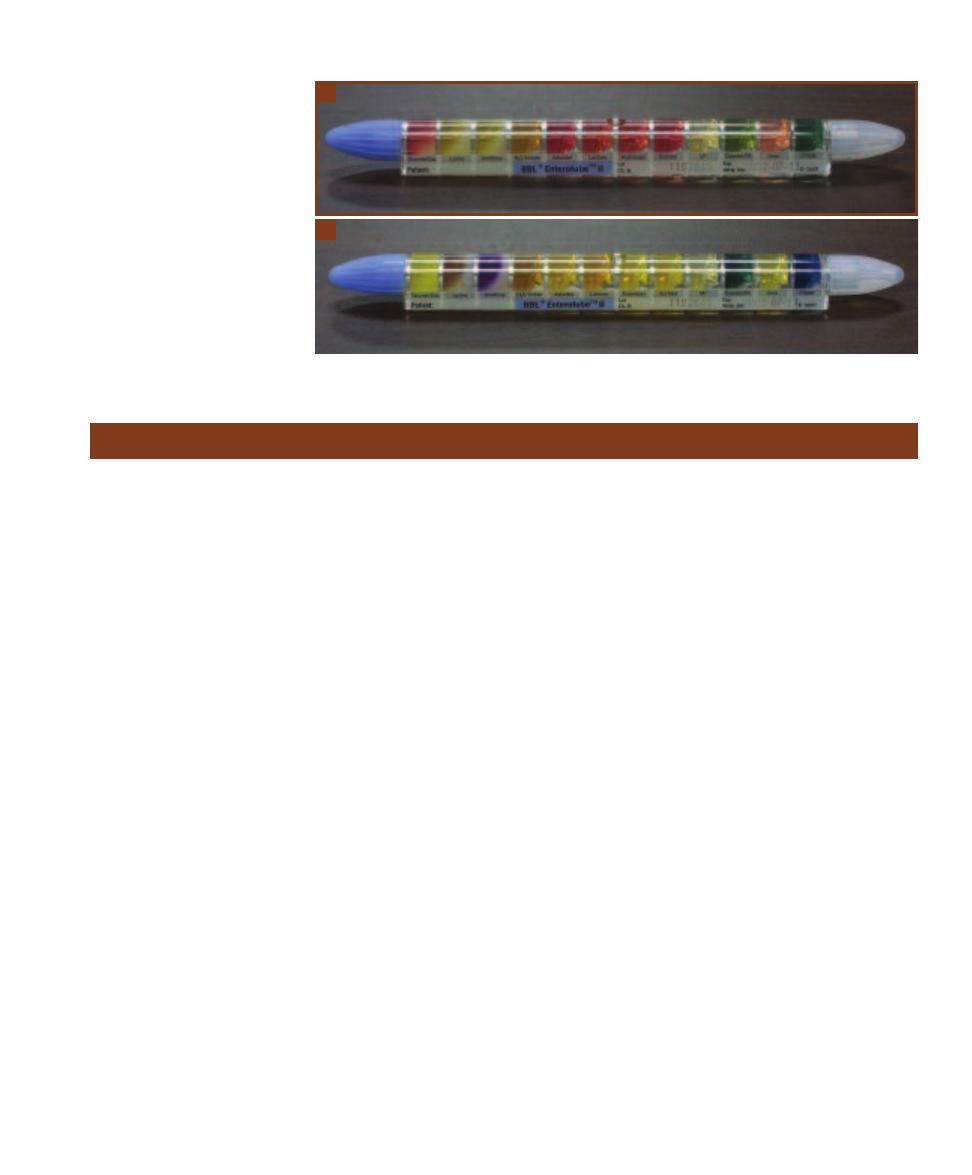
䢇
Purpose
Purple Broth and Phenol Red Broth Fermentation Tests are
used to differentiate members of Entero bacteri aceae and to
distinguish them from other Gram- negative rods.
䢇
Principle
Carbohydrate fermentation is the metabolic process by
which an organic molecule acts as an electron donor and
one or more of its organic products act as the final electron
acceptor. Fermentation of glucose begins with the produc-
tion of pyruvate. Although some organisms use alternative
pathways, most bacteria accomplish this by glycolysis
(Appendix Figure A-1). The end products of pyruvate fer-
mentation include a variety of acids, alcohols, and H
2
or
CO
2
gases. The specific end products depend on the specific
organism and the substrate fermented (Figure 7-40 and the
Appendix Figure A-5).
The principle behind Purple Broth and Phenol Red
Broth is the same. Each medium consists of a basal recipe
to which a single fermentable carbohydrate is added. Both
basal media include peptone and a pH indicator. Purple
Broth includes bromcresol purple as the pH indicator, which
is yellow below pH 6.8 and purple above; PR Broth includes
phenol red, which is yellow below pH 6.8, pink above pH
7.4, and red in between. Any carbohydrate can be used, but
glucose, lactose, and sucrose are common choices. Finally,
an inverted Durham tube is placed in each tube as an
indicator of gas production.
Acid production from fermentation of the carbohydrate
lowers the pH below the neutral range of the indicator and
turns the medium yellow (Figures 7-41 and 7-42). Deamina-
tion of the peptone amino acids produces ammonia (NH
3
),
which raises the pH and turns PR broth pink or, in the case
of Purple Broth, produces no color change. Gas production
is indicated by a bubble or pocket in the Durham tube where
the broth has been displaced.
The ability of these media to detect acid production is
largely dependent upon incubation time and the ability of
the fermenter to produce an excess of acid relative to the
ammonia produced from deamination. If the medium is
examined at 18 hours after inoculation, a pink color (PR
Broth) or purple color (Purple Broth) indicates that the
organism has not fermented the substrate and has likely
deaminated the peptone amino acids. Readings after 18–24
hours may be unreliable. If the tube indicates acid produc-
tion, there is no problem. However, no color change or an
indication of alkalinity may be due to a reversion. A reversion
is what happens in the medium when an organism only
performs deamination due to the consumption of carbo -
hydrate. The subsequent pH shift from acid to alkaline may
mask any evidence of fermentation because once the PR
Broth turns pink or Purple Broth returns to purple, it is
impossible to visually distinguish a reversion from the
reaction of a true nonfermenter.
SECTION 7
䢇
Differential Media
䢇
71
Fermentation Tests (Purple Broth and Phenol Red Broth)
7-39
E
NTEROTUBE
® II T
EST
R
ESULTS
A
Uninoculated tube.
B
Tube inoculated with Entero bacter
aerogenes after 24 hours incubation.
This tube shows atypical negative
results for lysine decarboxylase; after
an additional 24 hours incubation, the
lysine medium turned purple (Ⳮ).
A
B
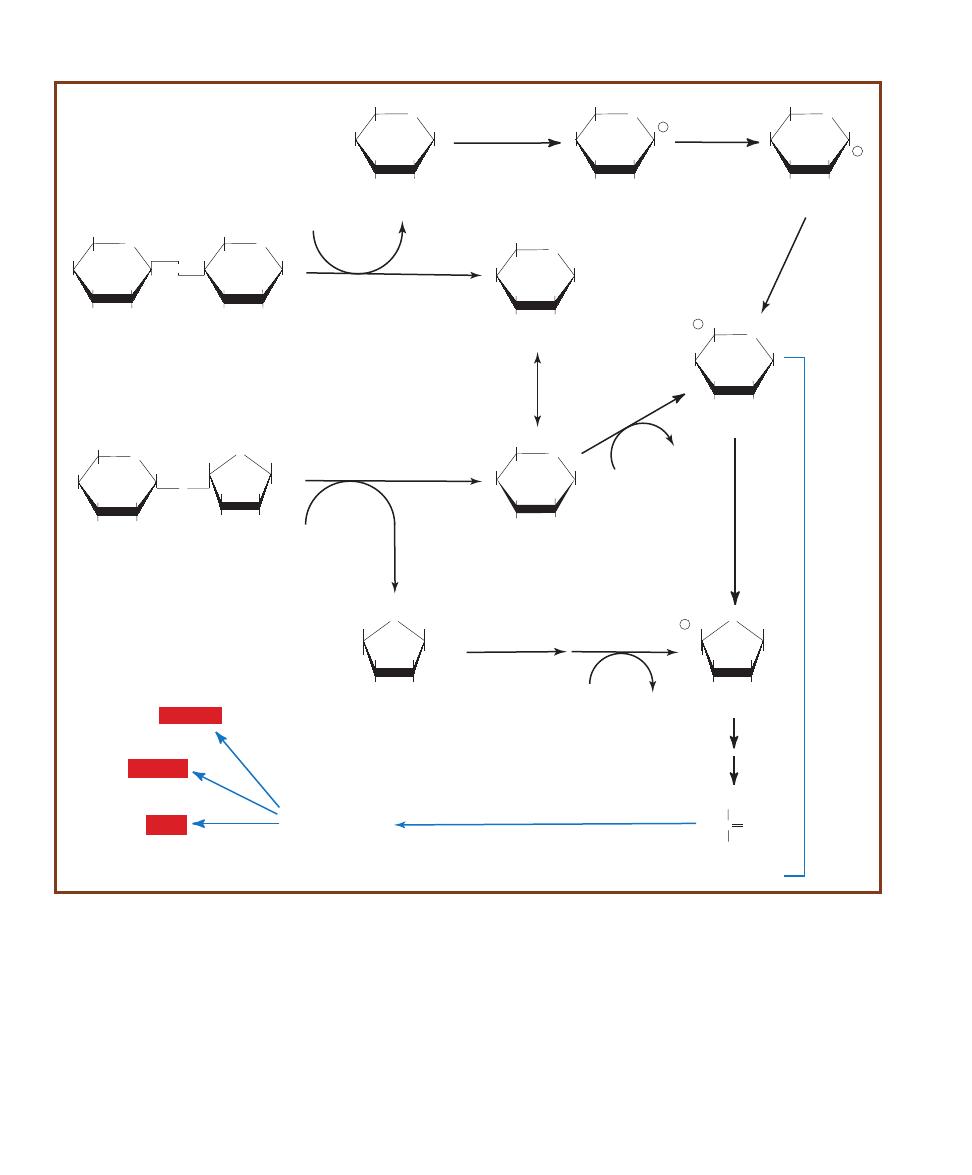
72
䢇
A Photographic Atlas for the Microbiology Laboratory
O
HOCH
2
HO
OH
OH
OH
b
-D-Glucose
O
HOCH
2
HO
OH
OH
OH
b
-D-Galactose
O
HOCH
2
HO
OH
OH
O
HOCH
2
OH
OH
OH
b
-D-Lactose
O
b
-galactosidase
H
2
O
O
HOCH
2
HO
OH
O
HOCH
2
OH
O
OH
CH
2
OH
HO
Sucrose
O
HOCH
2
OH
CH
2
OH
HO
b
-D-Fructose
O
HOCH
2
HO
OH
OH
OH
a
-D-Glucose
Mutarotation
H
2
O
Glycolysis
Sucrase
O
P OCH
2
HO
OH
OH
OH
Glucose-6-P
He
xo
kin
as
e
ATP
ATP
ADP
O
OH
CH
2
OH
HO
Fructose-6-P
Fructokinase
P OCH
2
Phospho-
glucoisomerase
O
HOCH
2
HO
OH
OH
O P
Glucose-1-P
Galactokinase
Phosphoglucomutase
ADP
C
CH3
O
COO
-
Pyruvate
Fermentation
HO
OH
Mutarotation
O
HOCH
2
HO
OH
OH
Galactose-1-P
O P
Epimerase
Mutarotation
Acid
Alcohol
Gas
7-40
F
ERMENTATION OF THE
D
ISACCHARIDES
L
ACTOSE AND
S
UCROSE
Sucrose and lactose fermentation do not follow unique pathways. Rather,
fermentation of each sugar only requires one or two additional enzymes to convert them into monosaccharides capable of entering glycolysis.
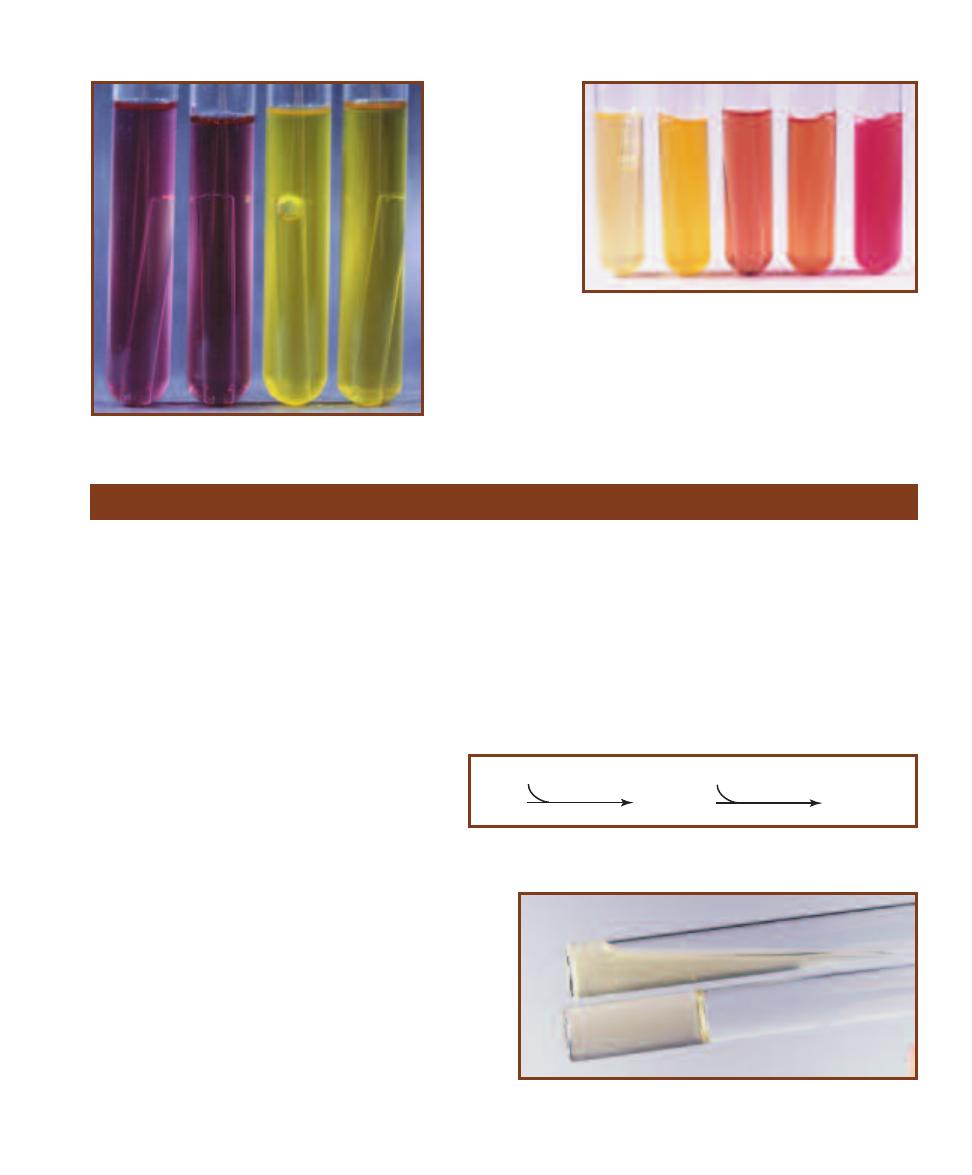
䢇
Purpose
The Gelatin Hydrolysis Test is used to determine the ability
of a microbe to produce gelatinases. Staphylococcus aureus,
which is gelatinase-positive can be differentiated from
S. epidermidis (gelatinase-negative). Serratia and Proteus
species are positive members of Entero bacteriaceae while
most others in the family are negative. Bacillus anthracis,
B. cereus, and several other members of the genus are
gelatinase-positive, as are Clostridium tetani and
C. perfringens.
䢇
Principle
Gelatin is a protein derived from collagen—a com -
ponent of vertebrate connective tissue. Gelatinases
comprise a family of extracellular enzymes produced
and secreted by some microorganisms to hydrolyze
gelatin. Subsequently, the cell can take up individual
amino acids and use them for metabolic purposes. Bacterial
hydrolysis of gelatin occurs in two sequential
reactions, as shown in Figure 7-43.
The presence of gelatinases can be detected using Nutrient
Gelatin, a simple test medium composed of gelatin, peptone,
and beef extract. Nutrient Gelatin differs from most other
solid media in that the solidifying agent (gelatin) is also the
substrate for enzymatic activity. Consequently, when a tube
of Nutrient Gelatin is stab-inoculated with a gelatinase-
positive organism, secreted gelatinase (or gelatinases) will
liquefy the medium. Gelatinase-negative organisms do not
secrete the en zyme and do not liquefy the medium (Figure
7-44 and Figure 7-45). A 7-day incubation period is usually
sufficient to see liquefaction of the medium. However,
gelatinase activity is very slow in some organisms. All tubes
still negative after 7 days should be incubated an additional
7 days.
A slight disadvantage of Nutrient Gelatin is that it melts
at 28°C (82°F). Therefore, inoculated stabs are typically
incubated at 25°C along with an uninoculated control to
verify that any liquefaction is not temperature-related.
SECTION 7
䢇
Differential Media
䢇
73
Gelatin Hydrolysis Test
7-42
PR G
LUCOSE
B
ROTH
R
ESULTS
From left to right
are Escherichia coli (A/G), Staphylococcus aureus (A/–),
uninoculated control, Micrococcus luteus (–/–) and Alcaligenes
faecalis (K).
Gelatin
Gelatinase
H
2
O
Polypeptides
Gelatinase
H
2
O
Amino Acids
7-43
G
ELATIN
H
YDROLYSIS
Gelatin is hydrolyzed by the gelatinase family of
enzymes.
7-44
N
UTRIENT
G
ELATIN
S
TABS
Aeromonas hydrophila (Ⳮ) above
and Micrococcus roseus (ⳮ) below.
7-41
P
URPLE
L
ACTOSE
B
ROTH
R
ESULTS
From left
to right are Proteus
vulgaris (–/–), an
uninoculated con-
trol, Escherichia coli
(A/G), and Staphylo-
coccus aureus (A/–).
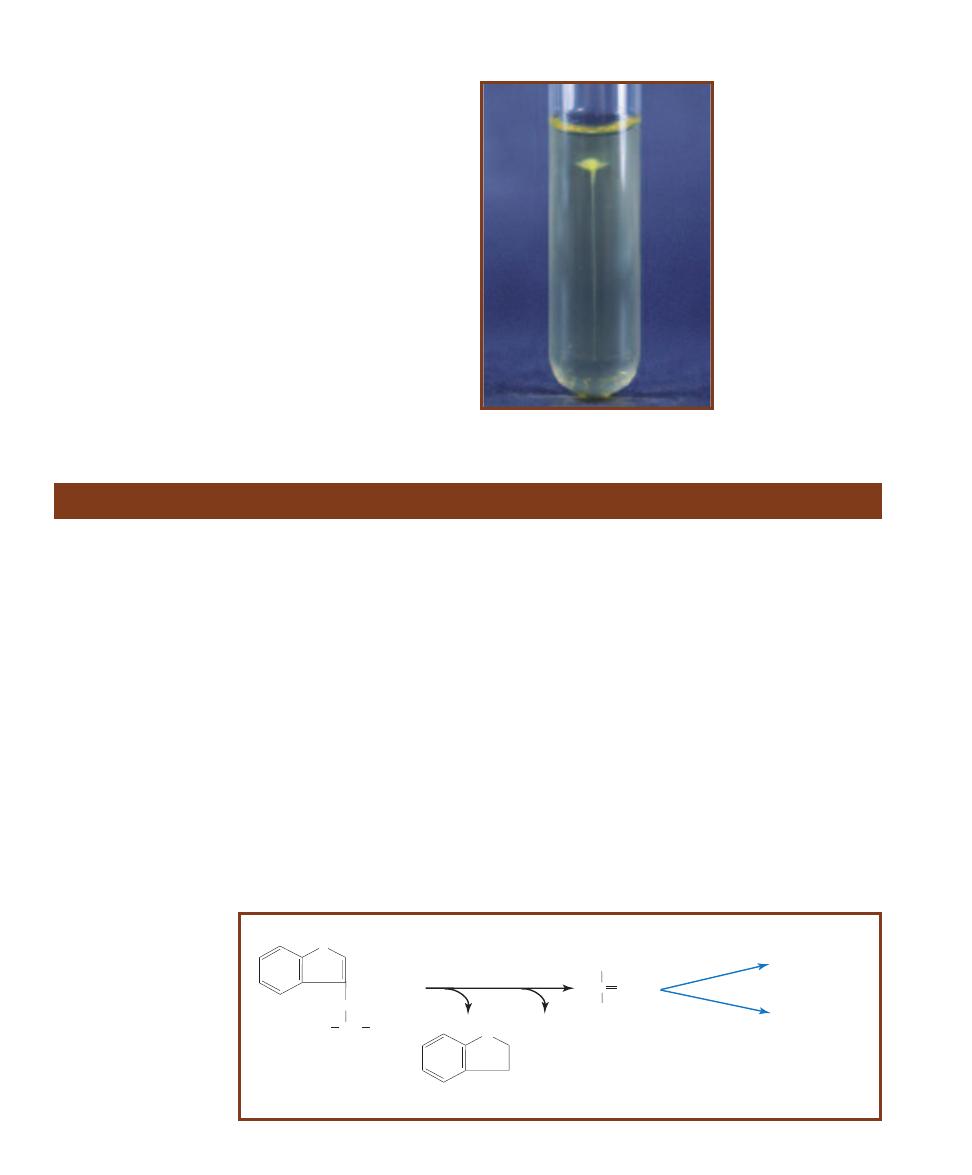
䢇
Purpose
The Indole Test identifies bacteria capable of producing
indole using the enzyme tryptophanase. The Indole Test
is one component of the IMViC battery of tests (Indole,
Methyl Red, Voges-Proskauer, and Citrate) used to differen-
tiate the Enterobacteriaceae.
䢇
Principle
The Indole Test, as it appears in this manual, is performed
using SIM medium. SIM medium also tests for motility and
sulfur reduction (SIM is an acronym for Sugar-Indole-
Motility). It is a semi-solid medium that is formulated with
casein and animal tissue as sources of amino acids, an iron-
containing compound, and sulfur in the form of sodium
thiosulfate.
Indole production in the medium is made possible by
the presence of tryptophan (contained in casein and animal
protein). Bacteria possessing the enzyme tryptophanase can
hydrolyze tryptophan to pyruvate, ammonia (by deamina-
tion), and indole (Figure 7-46).
The hydrolysis of tryptophan in SIM medium can be
detected by the addition of Kovacs’ reagent after a period
of incubation. Kovacs’ reagent contains dimethylamino -
benz aldehyde (DMABA) and HCl dissolved in amyl alcohol.
When a few drops of Kovacs’ reagent are added to the tube,
it forms a liquid layer over the solid medium. DMABA then
reacts with any indole present and produces a quinoidal
compound that turns the reagent layer red (Figures 7-47 and
7-48). The formation of red color in the reagent layer indi-
cates a positive reaction and the presence of tryptophanase.
No red color is indole- negative.
An instantaneous indole test is available and done by
placing bacterial growth on a paper slide impregnated with
5% DMABA (Figure 7-49). A positive result is formation of
pink on the paper slide.
74
䢇
A Photographic Atlas for the Microbiology Laboratory
Indole Test (SIM Medium)
tryptophanase
Tryptophan
C
CH
3
O
COO-
Pyruvate
N
H
CH
CH
2
COOH
+ H
2
O
Indole
NH
3
Fermentation
Respiration
H
N
H
2
N
7-46
T
RYPTOPHAN
C
ATABOLISM IN
I
NDOLE
-
P
OSITIVE
O
RGANISMS
Tryptophanase hydrolyzes
the amino acid tryptophan
to indole, ammonia, and
pyruvate. Subsequently,
pyruvate can be used in
the Krebs Cycle.
7-45
C
RATERIFORM
L
IQUEFACTION
This
form of liquefaction may also be of diagnostic
use because not all gelatinase- positive
microbes liquefy the gelatin completely.
Shown here is Micrococcus luteus liquefying
the gelatin in the shape of a crater.
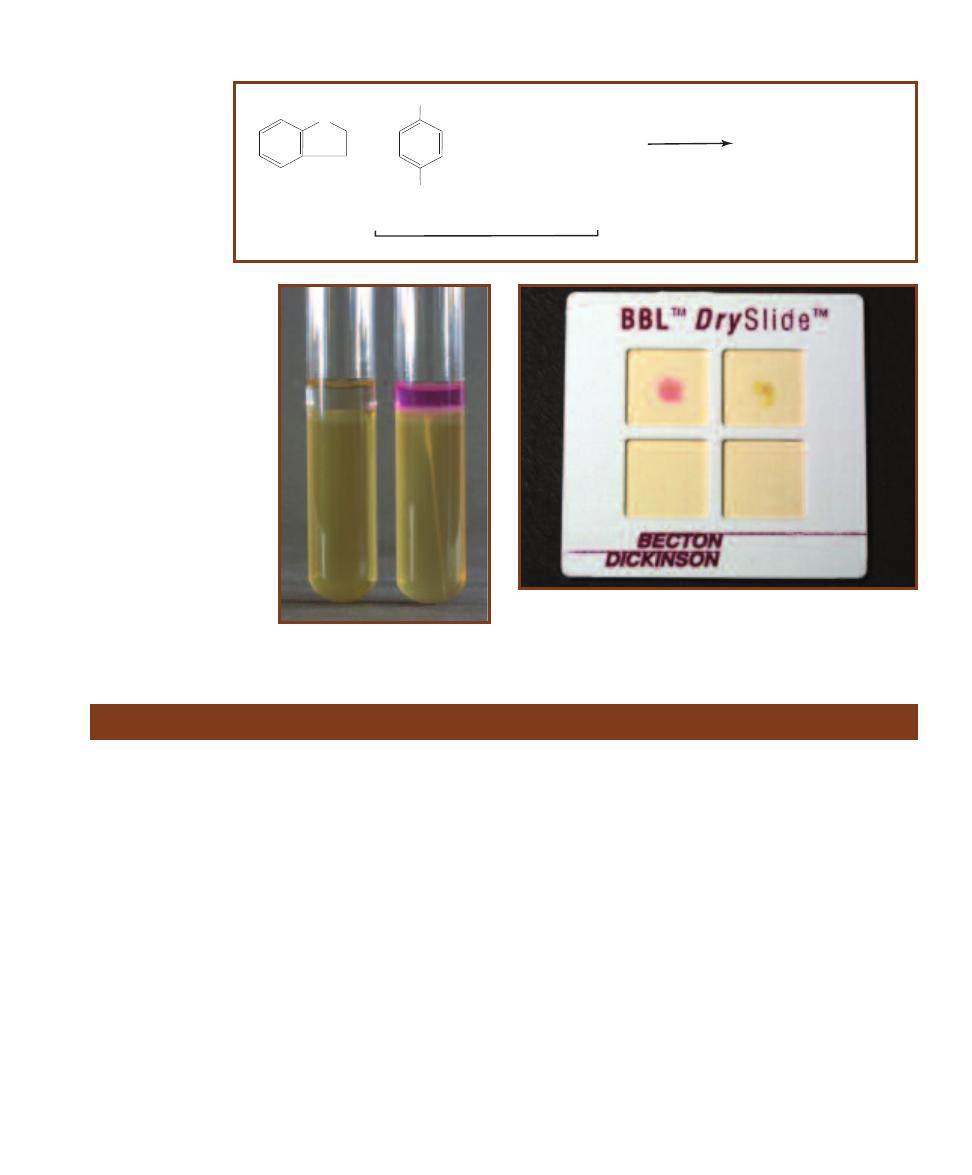
䢇
Purpose
Kligler’s Iron Agar (KIA) is primarily used to differentiate
members of Enterobacteriaceae and to distinguish them
from other Gram- negative bacilli such as Pseudomonas or
Alcaligenes.
䢇
Principle
KIA is a rich medium designed to differentiate bacteria on
the basis of glucose fermentation, lactose fermentation, and
sulfur reduction. In addition to the two carbohydrates, it
includes beef extract, yeast extract, and peptone as carbon
and nitrogen sources, and sodium thiosulfate as an electron
acceptor. Phenol red is the pH indicator and ferrous sulfate
is the hydrogen sulfide indicator.
The medium is prepared as a shallow agar slant with
a deep butt, thereby providing both aerobic and anaerobic
growth environments. It is inoculated by a stab in the agar
butt followed by a fishtail streak of the slant. The incubation
period is 18 to 24 hours for carbohydrate fermentation
and up to 48 hours for hydrogen sulfide reactions. Many
reactions in various combinations are possible (Figure 7-50
and Table 7-1).
When KIA is inoculated with a glucose-only fermenter,
acid products lower the pH and turn the entire medium
yellow within a few hours. Because glucose is in short supply
(0.1%), it will be exhausted within about 12 hours. As the
glucose is used up, the organisms located in the aerobic
region (slant) will begin to break down available amino
acids, producing NH
3
and raising the pH. This process,
which takes 18 to 24 hours to complete, is called a reversion
and only occurs in the slant because of the anaerobic condi-
tions in the butt. Thus, a KIA with a red slant and yellow
butt after a 24-hour incubation period indicates that the
organism ferments glucose but not lactose.
Organisms that are able to ferment glucose and lactose
also turn the medium yellow throughout. However, because
the lactose concentration is ten times higher than that of
SECTION 7
䢇
Differential Media
䢇
75
Kligler’s Iron Agar
+ HCl + Amyl Alcohol
Rosindole dye (cherry red)
p-Dimethylaminobenzaldehyde
+
CHO
N(CH
3
)
2
Kovacs' Reagent
Indole
H
N
2
7-47
I
NDOLE
REACTION WITH
K
OVACS
’ R
EAGENT
Kovacs’ Reagent is
added to the medium
following incubation. If
the organism is indole-
positive, a red color
is produced by this
reaction.
7-48
I
NDOLE
T
EST
R
ESULTS
This is SIM medium inoculated
with Morganella morganii (Ⳮ)
on the right and Enterobacter
aerogenes (ⳮ) on the left.
7-49
R
APID
I
NDOLE
T
EST
BBL™ DrySlide™
(Available from Becton-
Dickinson, Sparks, MD.)
This slide was inoculated with Escherichia coli (Ⳮ)
on the left and Enterobacter aerogenes (ⳮ) on the right.
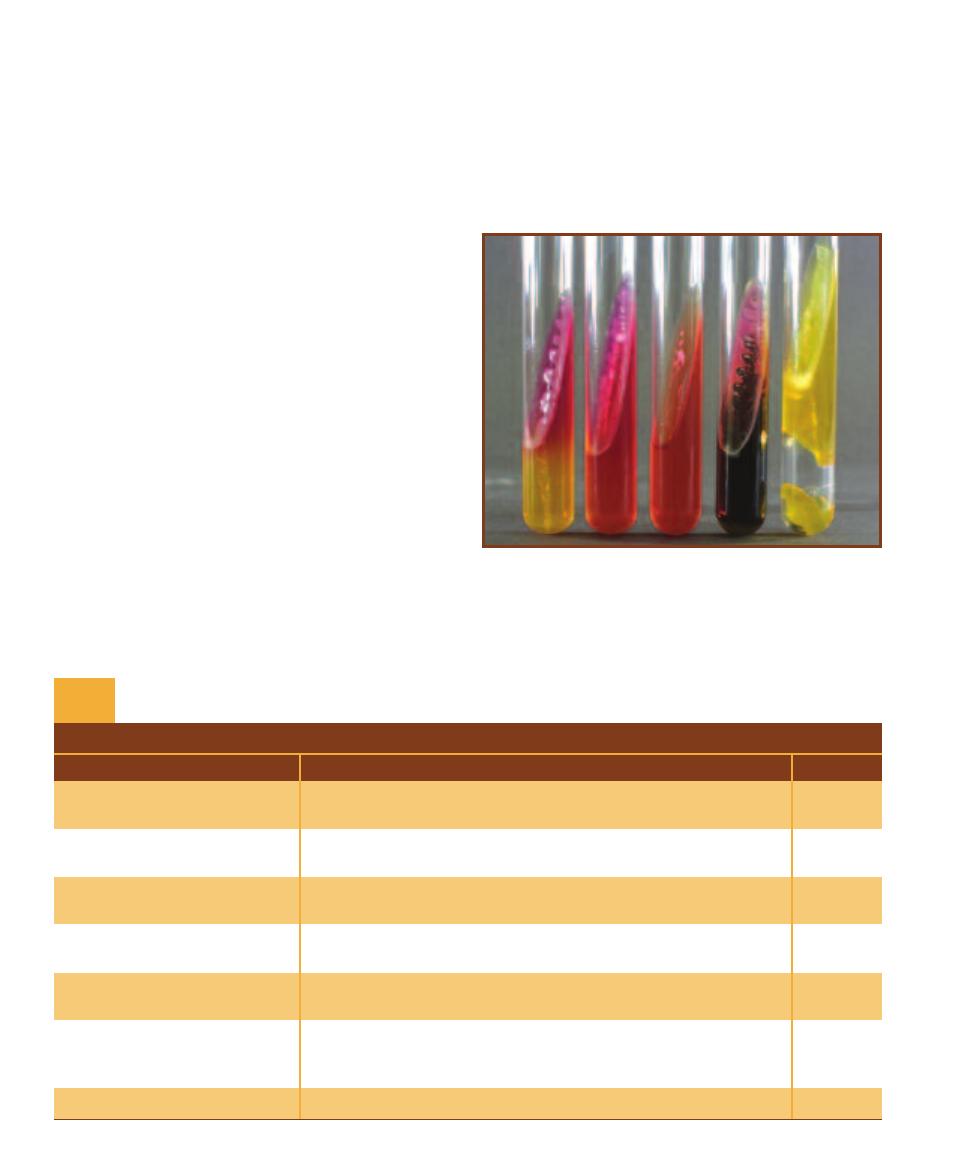
glucose, greater acid production results and both slant and
butt will remain yellow after 24 hours. Therefore, a KIA
with a yellow slant and butt at 24 hours indicates that the
organism ferments glucose and lactose. Gas produced by
carbohydrate fermentation will appear as fissures in the
medium or will lift the agar off the bottom of the tube.
Hydrogen sulfide (H
2
S) may be produced by the reduc-
tion of thiosulfate in the medium or by the breakdown of
cysteine in the peptone (Figures 7-87 and 7-88). Ferrous
sulfate in the medium reacts with the H
2
S to form a black
precipitate (Figure 7-89), usually seen in the butt. Acid
conditions must exist for thiosulfate reduction; therefore,
black precipitate in the medium is an indication of sulfur
reduction and fermentation. If the black precipitate obscures
the color of the butt, the color of the slant determines
which carbohydrates have been fermented (i.e., red slant ⳱
glucose fermentation, yellow slant ⳱ glucose and lactose
fermentation).
An organism that does not ferment either carbohydrate
but utilizes peptone and amino acids will alkalinize the
medium and turn it red. If the organism can use the peptone
aerobically and anaerobically, both the slant and butt will
appear red. An obligate aerobe will turn only the slant red.
Refer to Figure 7-50 for the various results.
Timing is critical in reading KIA results. An early reading
could reveal yellow throughout the medium, leading one to
conclude that the organism is a lactose fermenter when it
simply may not yet have exhausted the glucose. A reading
after the lactose has been depleted could reveal a yellow
butt and red slant leading one to falsely conclude that
the organism is a glucose-only fermenter. Tubes that have
been interpreted for carbohydrate fermentation can be re-
incubated for 24 hours before H
2
S determination. Refer
to Table 7-1 for information on the correct symbols and
method of reporting the various reactions.
76
䢇
A Photographic Atlas for the Microbiology Laboratory
7-50
KIA R
ESULTS
From left to right: Morganella morganii (K/A,
atypically not producing gas), Pseudomonas aeruginosa (K/NC), uninoc-
ulated control, Proteus mirabilis (K/A,H
2
S), and Escherichia coli (A/A,G).
T A B L E O F R E S U L T S
Result
Interpretation
Symbol
Yellow slant/yellow butt
Glucose and lactose fermentation with acid accumulation in slant
A/A
and butt.
Red slant/yellow butt
Glucose fermentation with acid production. Proteins catabolized
K/A
aerobically (in the slant) with alkaline products (reversion).
Red slant/red butt
No fermentation. Peptone catabolized aerobically and anaerobically
K/K
with alkaline products. Not from Enterobacteriaceae.
Red slant/no change in butt
No fermentation. Peptone catabolized aerobically with alkaline
K/NC
products. Not from Enterobacteriaceae.
No change in slant /
Organism is growing slowly or not at all. Not from
NC/NC
no change in butt
Enterobacteriaceae.
Sulfur reduction. (An acid condition, from fermentation of glucose
Black precipitate in the agar
or lactose, exists in the butt even if the yellow color is obscured
H
2
S
by the black precipitate.)
Cracks in or lifting of agar
Gas production.
G
KIA Results and Interpretations
T A B L E
7-1
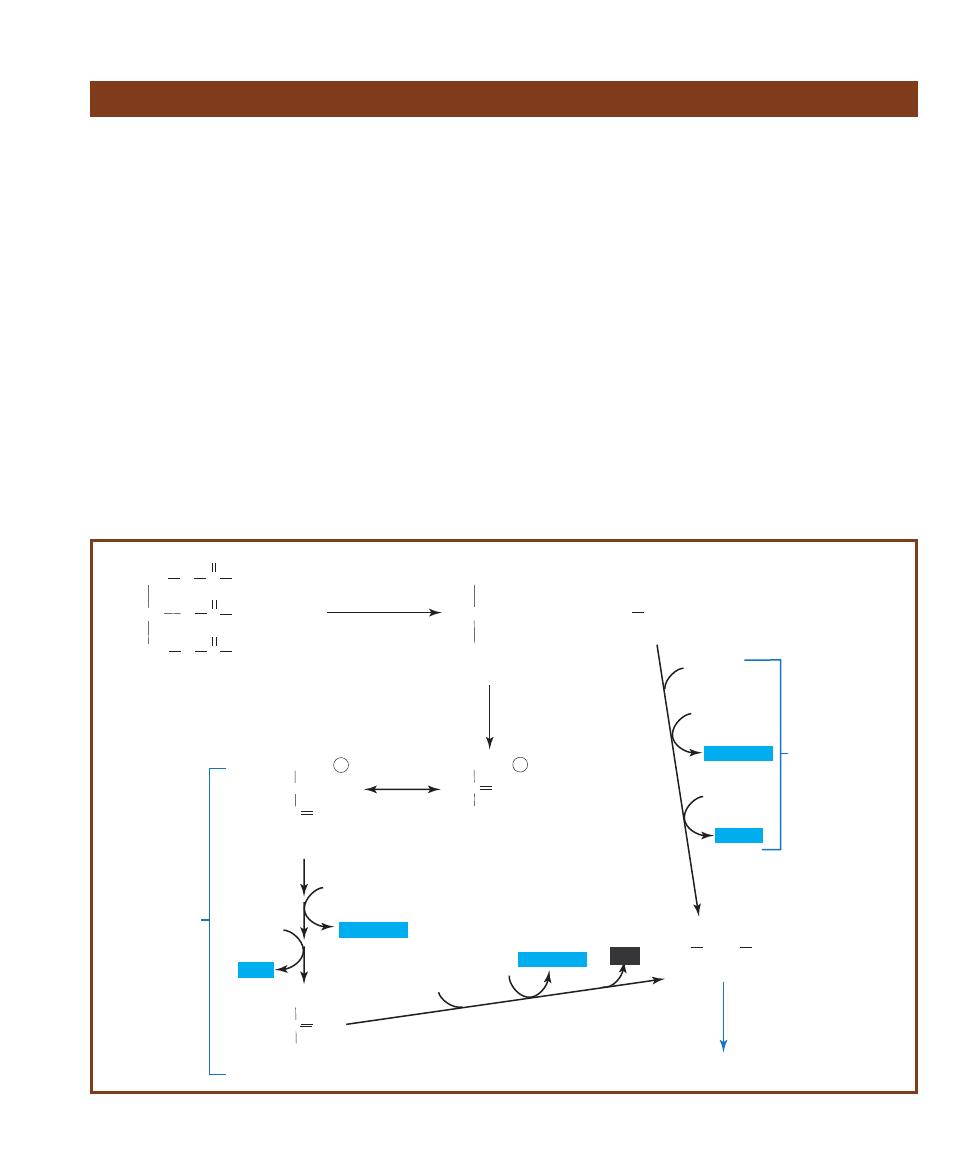
䢇
Purpose
The Lipase Test is used to detect and enumerate lipolytic
bacteria, especially in high-fat dairy products. A variety
of other lipid substrates, including corn oil, olive oil, and
soybean oil, are used to detect differential characteristics
among members of Entero bacteriaceae, Clostridium,
Staphylococcus, and Neisseria. Several fungal species also
demonstrate lipolytic ability.
䢇
Principle
Lipid is the word generally used to describe all types of fats.
The enzymes that hydrolyze fats are called lipases. Bacteria
can be differentiated based on their ability to produce and
secrete lipases. Although a variety of simple fats can be used
for this determination, tributyrin oil is the most common
constituent of lipase-testing media because it is the simplest
triglyceride found in natural fats and oils.
Simple fats are known as triglycerides, or triacyl glyce rols
(Figure 7-51). Triglycerides are composed of glycerol and
three long-chain fatty acids. As is true of many biochemicals,
tributyrin is too large to enter the cell, so some cells have the
ability to secrete a lipase to break it down prior to cellular
uptake. After lipolysis (hydrolysis), the glycerol can be con-
verted to dihydroxy acetone phosphate, an intermediate of
glycolysis (see Appendix Figure A-1). The fatty acids are
catabolized by a process called
-oxidation. Two carbon
fragments from the fatty acid are combined with Coenzyme
A to produce Acetyl-CoA, which then may be used in the
Krebs cycle to produce energy. Each Acetyl-CoA produced
by this process also yields one NADH and one FADH
2
(im-
portant coenzymes in the electron transport chain). Glycerol
and fatty acids may be used alternatively in anabolic pathways.
Tributyrin Agar is prepared as an emulsion that makes
the agar appear opaque. When the plate is inoculated with
a lipase-positive organism, clear zones will appear around
the growth as evidence of lipolytic ac tivity. If no clear zones
appear, the organism is lipase-negative (Figure 7-52).
Spirit Blue Agar is prepared as an emulsion with
tributyrin oil, but also contains spirit blue dye as a color
SECTION 7
䢇
Differential Media
䢇
77
Lipase Test
C
CH
3
O
COO-
Pyruvate
Glyceraldehyde
3-phosphate
HCOH
CH
2
O ~
P
HC
O
C O
CH
2
O ~
P
CH
2
OH
Dihydroxyacetone
phosphate
CH
3
CO~S CoA
CH
O
CH
2
O
C
C
CH
2
O
C
O
O
O
R
1
R
2
R
3
CHOH
CH
2
OH
CH
2
OH
+ 3H
2
O
+ 3R COOH
Triacylglycerol
Lipase
Glycerol
3 Fatty acids
Glycolysis
Acetyl CoA
Krebs Cycle
CoA
FAD
NAD
per b-oxidation
NAD
2ADP
CoA
NAD
2ATP
NADH+H+
NADH+H+
FADH
2
NADH+H+
CO
2
7-51
L
IPID
M
ETABOLISM
Triacylglycerols can be hydrolyzed by lipase into glycerol and three fatty acids. Glycerol can then be converted into
dihydroxyacetone phosphate, an intermediate of glycolysis. The fatty acids can be broken down, two carbons at a time (by -oxidation), to form
Acetyl-CoA, a reactant of the Krebs Cycle.
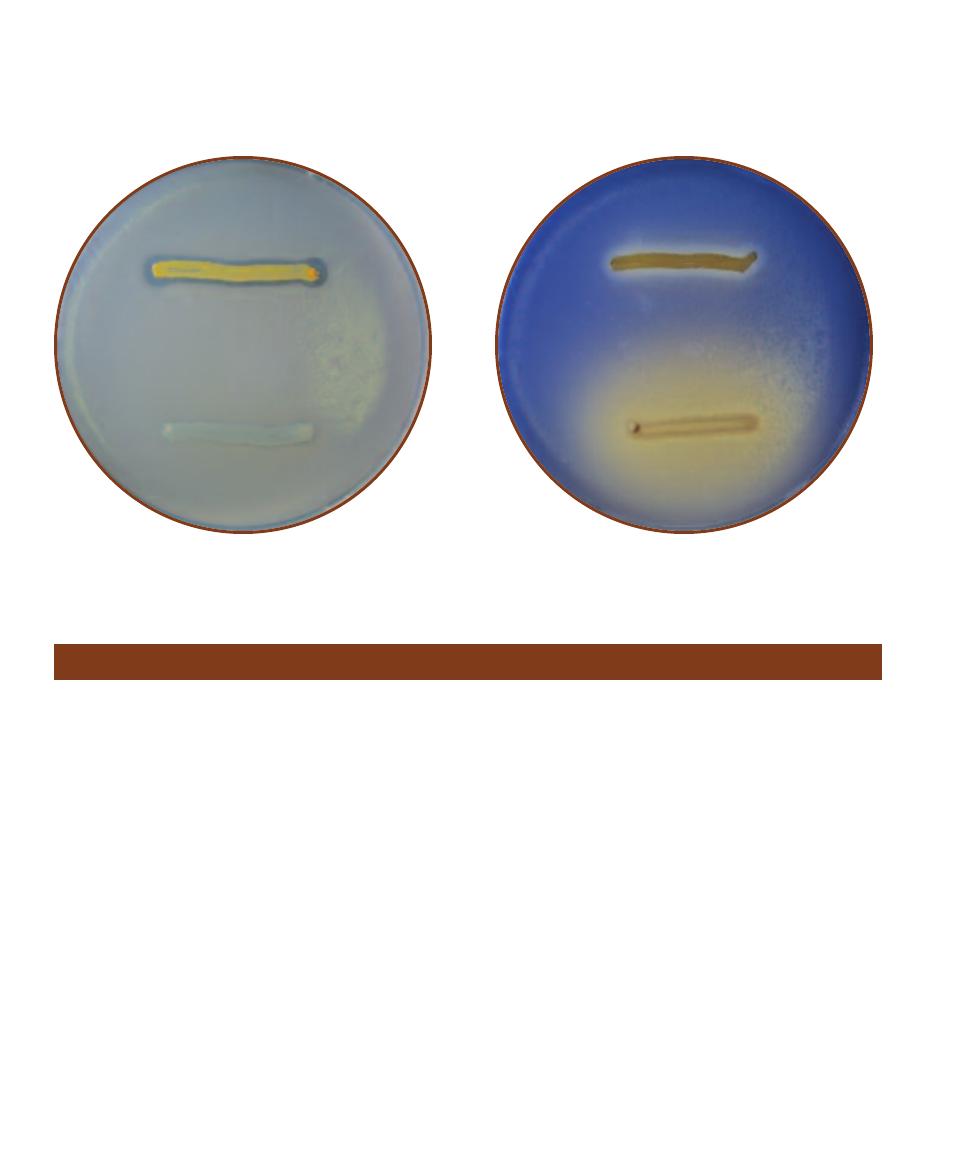
䢇
Purpose
Litmus Milk is used primarily to differentiate members
within the genus Clostridium. It differentiates Entero -
bacteriaceae from other Gram-negative bacilli based on the
ability of enterics to reduce litmus. Litmus Milk also is used
to cultivate and maintain cultures of lactic acid bacteria.
䢇
Principle
Litmus Milk is an undefined medium consisting of skim
milk and the pH indicator azolitmin. Skim milk provides
nutrients for growth, lactose for fermentation, and protein
in the form of casein. Azolitmin (litmus) is pink at pH 4.5
and blue at pH 8.3. Between these extremes it is purple.
Four basic reactions occur in Litmus Milk: lactose
fermentation, reduction of litmus, casein coagulation, and
casein hydrolysis. In combination these reactions yield a
variety of results, each of which can be used to differentiate
bacteria. Several possible combinations are described in
Table 7-2.
Lactose fermentation acidifies the medium and turns
the litmus pink (Figure 7-54, second tube from the right).
This acid reaction typically begins with the splitting of the
disaccharide into the monosaccharides glucose and galactose
by the enzyme
-galactosidase (Figure 7-40). Accumulating
acid may cause the casein to precipitate and form an acid
clot (Figures 7-56 and 7-57). Acid clots solidify the medium
and can appear pink or white with a pink band at the top
(Figure 7-54, tube on far right) depending on the oxidation-
reduction status of litmus. Reduced litmus is white; oxidized
litmus is purple. Acid clots can be dissolved in alkaline
conditions. Fissures or cracks in the clot are evidence of
gas production (Figure 7-54, third tube from right). Heavy
gas production that breaks up the clot is called stormy
fermentation.
In addition to being a pH indicator, litmus is an E
h
(oxidation-reduction) indicator. As mentioned above,
reduced litmus is white. If litmus becomes reduced during
lactose fermentation it will turn the medium white in the
lower portion of the tube where the reduction rate is greatest.
Some bacteria produce proteolytic enzymes (caseases)
such as rennin, pepsin, or chymotrypsin that coagulate
casein and produce a curd (Figure 7-58). A curd differs from
an acid clot in that it will not dissolve in alkaline conditions
78
䢇
A Photographic Atlas for the Microbiology Laboratory
Litmus Milk Medium
7-52
T
RIBUTYRIN
A
GAR
Staphylococcus aureus (lipase- positive)
is above and Proteus mirabilis (lipase-negative) is below.
7-53
S
PIRIT
B
LUE
A
GAR
Staphylococcus aureus (lipase- positive)
is above and Proteus mirabilis (lipase-negative) is below. Clearing, not
lightening of the medium (as with P. mirabilis) is considered a positive
result.
indicator. The oil and dye form a complex that gives the
medium an opaque light blue appearance. Lipase-positive
bacteria growing on the medium hydrolyze the oil and
produce clear halos surrounding the growth. Lightening
of the medium such as that produced around P. mirabilis
is not a positive result (Figure 7-53).
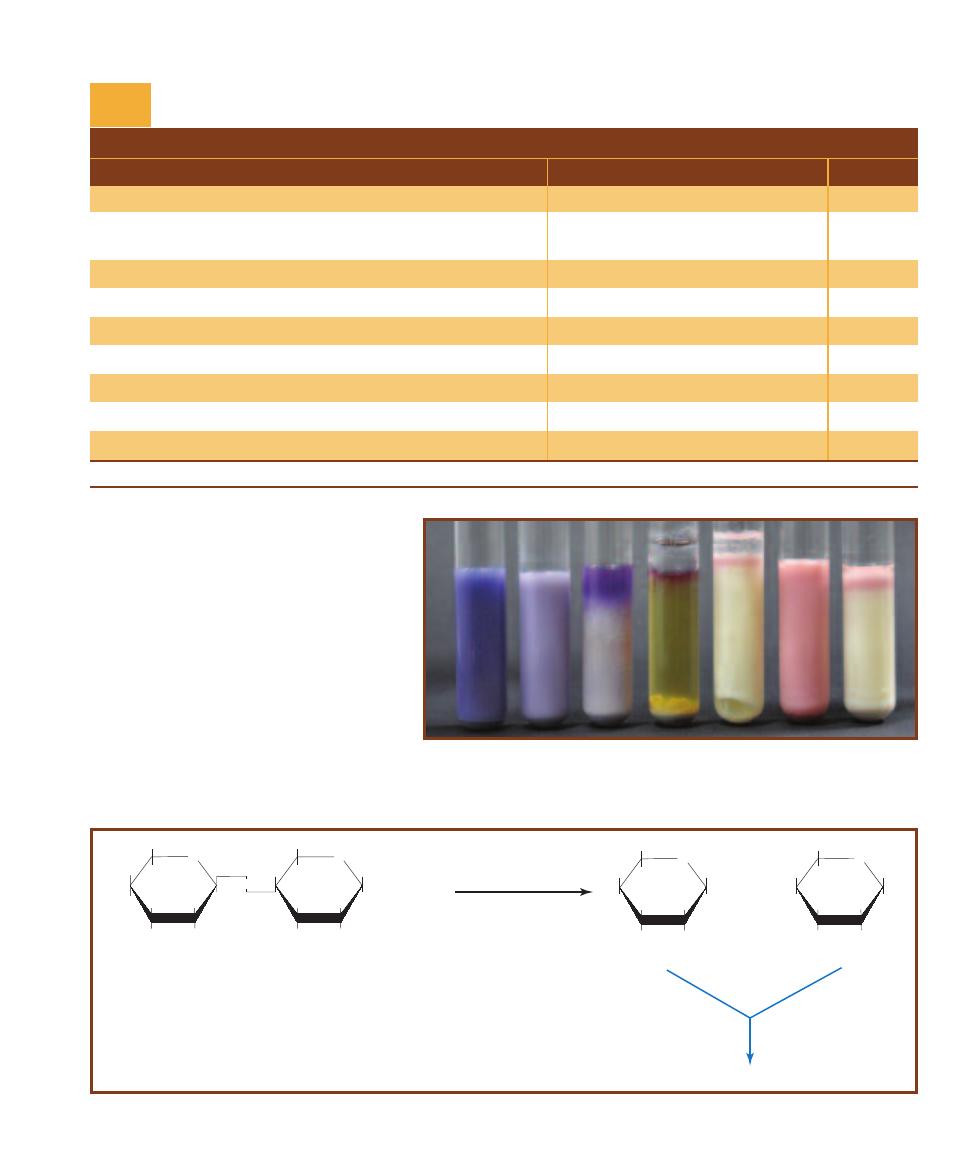
and tends to retract from the sides of the tube
revealing a straw-colored fluid called whey.
Certain caseases can digest both acid clots
and curds. A digestion reaction leaves only a
clear to brownish fluid behind (Figure 7-54,
center tube). Bacteria that are able only to
partially digest the casein typically produce
ammonia (NH
3
) which raises the pH of the
medium and turns the litmus blue. Formation
of a blue or purple ring at the top of the clear
fluid or bluing of the entire medium indicates
an alkaline reaction (Figure 7-54, tube at far
left and third from left).
SECTION 7
䢇
Differential Media
䢇
79
T A B L E O F R E S U L T S
Result
Interpretation
Symbol
Pink color
Acid reaction
A
Pink and solid (white in the lower portion if the litmus is reduced);
Acid clot
AC
clot not movable
Fissures in clot
Gas
G
Clot broken apart
Stormy fermentation
S
White color (lower portion of medium)
Reduction of litmus
R
Semisolid and not pink; clear to gray fluid at top
Curd
C
Clarification of medium; loss of “body”
Digestion of peptone; peptonization
P or D
Blue medium or blue band at top
Alkaline reaction
K
No change
None of the above reactions
NC
*These results may appear together in a variety of combinations.
Litmus Milk Results and Interpretations*
T A B L E
7-2
7-54
R
EACTIONS IN
L
ITMUS
M
ILK
From left to right: Alcaligenes faecalis (K), uninocu-
lated control, Pseudomonas aeruginosa (K), Clos tridium sporogenes (D), Clostridium aceto-
butylicum (AGCR), Escherichia coli (A), and Lactococcus lactis (ACR). The clear fluid on the
surface of the two Clostridium cultures is mineral oil used to make the medium anaerobic.
O
HOCH
2
HO
OH
OH
OH
b-D-Glucose
O
HOCH
2
HO
OH
OH
OH
b-D-Galactose
O
HOCH
2
HO
OH
OH
O
OH
OH
OH
b-D-Lactose
O
b-galactosidase
+
H
2
O
+
HOCH
2
Glycolysis
7-55
L
ACTOSE
H
YDROLYSIS
Lactose hydrolysis requires the enzyme -galactosidase and produces glucose and galactose—two fermentable sugars.
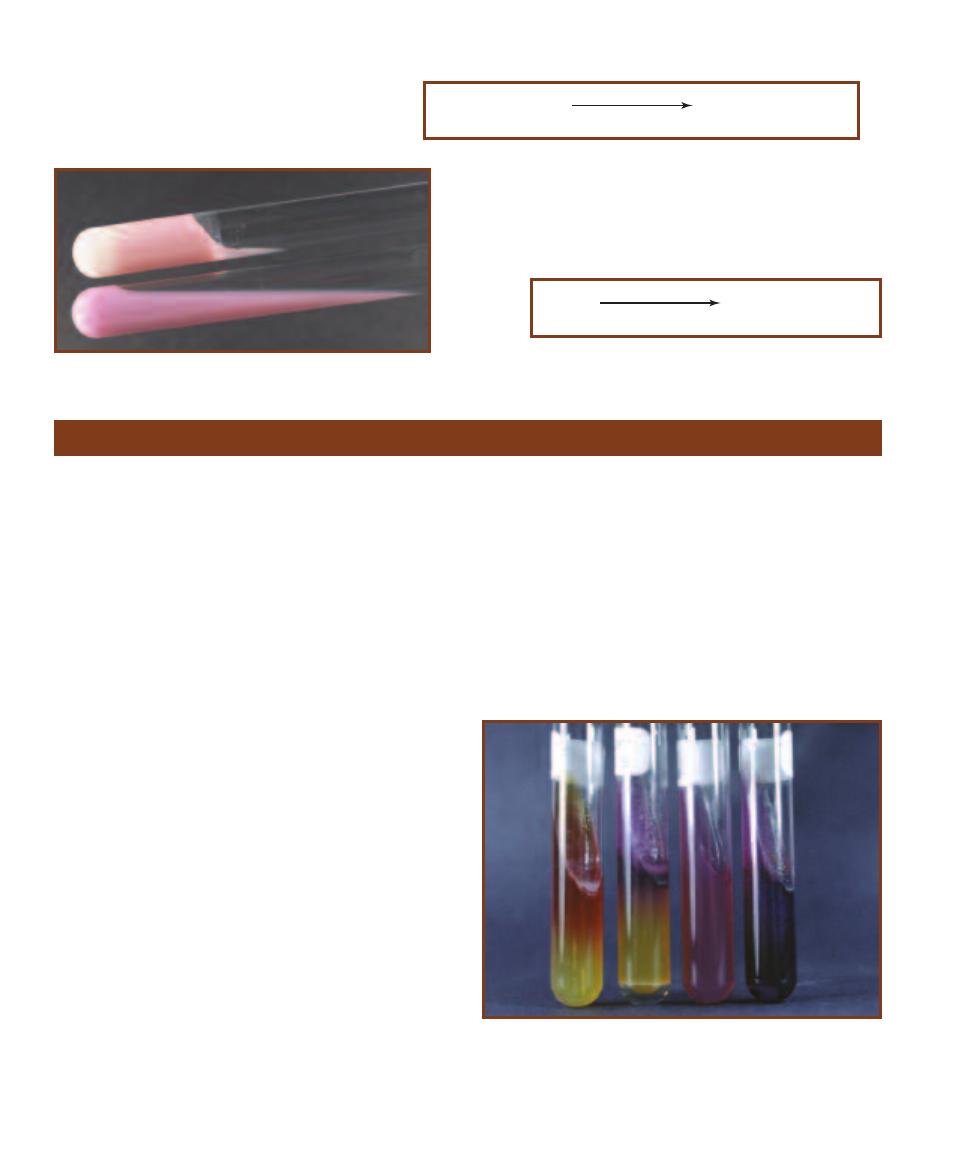
䢇
Purpose
Lysine Iron Agar (LIA) is used to differentiate enterics based
on their ability to decarboxylate or deaminate lysine and
produce hydro gen sulfide (H
2
S). LIA also is used in combi -
na tion with Triple Sugar Iron Agar to identify members of
Salmonella and Shigella.
䢇
Principle
LIA is a combination medium that detects bacterial ability
to decarboxylate or deaminate lysine and to reduce sulfur.
It contains peptone and yeast extract to support growth,
the amino acid lysine for deamination and decarboxylation
reactions, and sodium thiosulfate—a source of reducible
sulfur. A small amount of glucose (0.1%) is included as
a fermentable carbohydrate. Ferric ammonium citrate is
included as a sulfur reduction indicator and bromcresol
purple is the pH indicator. Bromcresol purple is purple at
pH 6.8 and yellow at or below pH 5.2.
LIA is prepared as a slant with a deep butt. This results
in an aerobic zone in the slant and an anaerobic zone in the
butt. After it is inoculated with two stabs of the butt and
a fishtail streak of the slant, the tube is tightly capped and
incubated for 18 to 24 hours.
If the medium has been inoculated with a lysine
decarboxylase-positive organism, acid production from
glucose fermentation will induce production of decarboxy-
lase enzymes. The acidic pH will turn the medium yellow,
but subsequent decarboxylation of the lysine will alkalinize
the agar and return it to purple. Purple color throughout
indicates lysine decarboxylation. Purple color in the slant
with a yellow (acidic) butt indicates no lysine decarboxyla-
tion took place.
If the organism produces lysine deaminase, the resulting
deamination reaction will produce compounds that react
with the ferric ammonium citrate and produce a dark red
color. Deamination reactions require the presence of oxygen.
Therefore, any evidence of deamination will be seen only
in the slant. A red slant with yellow (acidic) butt indicates
lysine deamination.
Hydrogen sulfide (H
2
S) is produced in LIA by the
anaerobic reduction of thiosulfate. Ferric ions in the
medium react with the H
2
S to form a black precipitate
in the butt (Figure 7-89). Refer to Figure 7-59 and Table 7-3
for the various reactions and symbols used to record them.
80
䢇
A Photographic Atlas for the Microbiology Laboratory
Lysine Iron Agar
7-56
A
CID
C
LOT
F
ORMATION
An acid clot is due to casease
cata lyz ing the formation of caseinogen, an insoluble precipitate,
under acidic conditions.
calcium caseinate
(soluble salt of casein)
casease
caseinogen—an acid clot
(insoluble precipitate)
low pH
7-57
A
CID
C
LOT
An acid clot in the top
tube, an uninoculated control below. Note the
reduced litmus (white) at the bottom of the clot.
casein
(soluble)
rennin
paracasein—a soft curd
(insoluble precipitate)
Ca
++
7-58
C
URD
F
ORMATION
Rennin converts casein to para -
casein to form a soft curd.
7-59
LIA R
ESULTS
Lysine Iron Agar tubes illustrating typical re-
sults. From left to right: Proteus mirabilis, (R/A); Citrobacter freundii,
(K/A, H
2
S, [note the small amount of black precipitate near the middle
and the gas production from glucose fermentation at the base]); uninocu-
lated control; and Salmonella typhimurium (K/K [obscured by the black
precipitate], H
2
S).
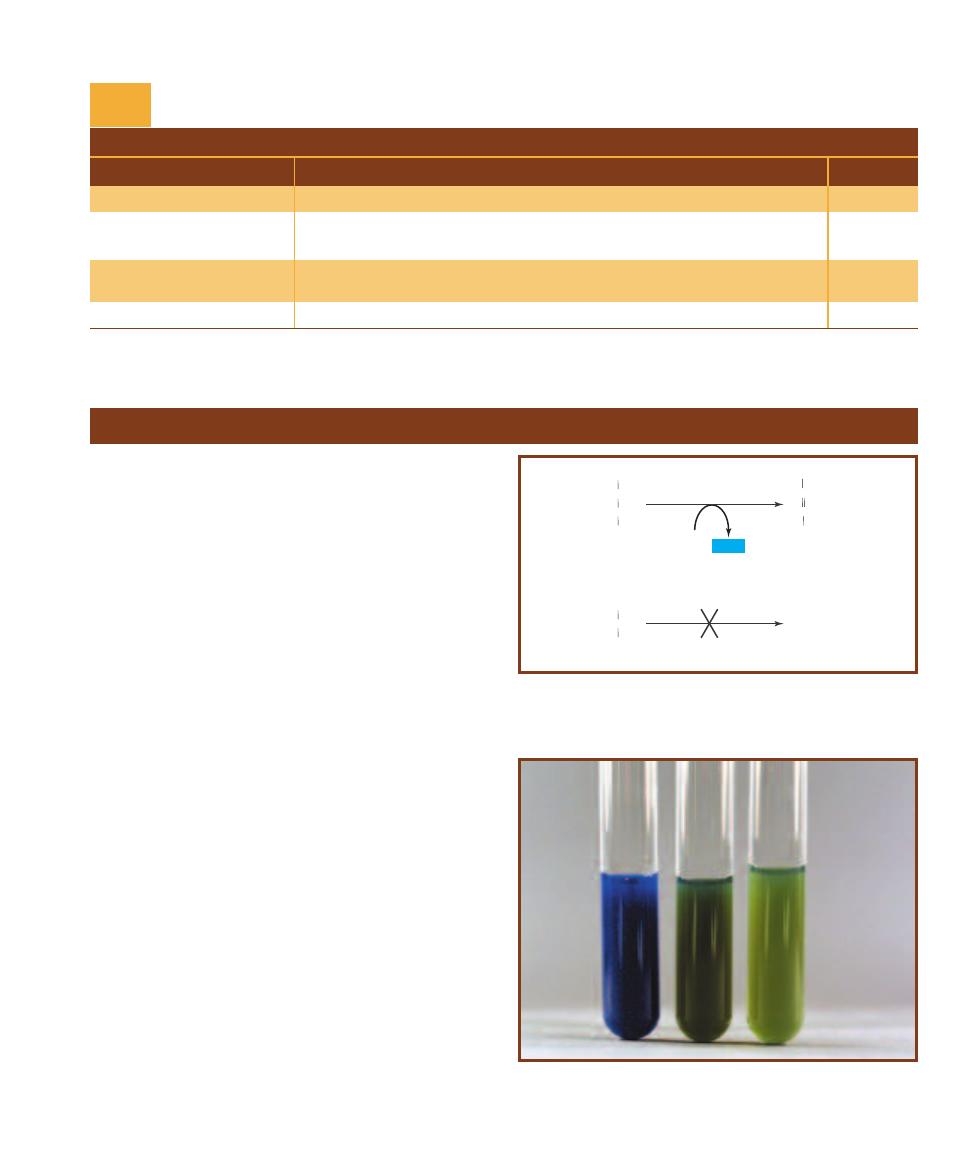
䢇
Purpose
The Malonate Test was originally designed to differentiate
between Escherichia, which will not grow in the medium,
and Enterobacter. Its use as a differential medium has now
broadened to include other members of Enterobacteriaceae.
䢇
Principle
One of the many enzymatic reactions of the Krebs cycle,
as illustrated in the Appendix (Figure A-4), is the oxidation
of succinate to fumarate. In the reaction, which requires the
enzyme succinate dehydrogenase, the co enzyme FAD is re-
duced to FADH
2
. Refer to the upper reaction in Figure 7-60.
Malonate (malonic acid), which can be added to growth
media, is similar enough to succinate to replace it as the
substrate in the reaction (Figure 7-60, lower reaction). This
competitive inhibition of succinate dehydrogenase, in com-
bination with the subsequent buildup of succinate in the
cell, shuts down the Krebs cycle and will kill the or ganism
unless it can ferment or utilize malonate as its sole remain ing
carbon source.
Malonate Broth is the medium used to make this
determination. It contains a high concentration of sodium
malonate, yeast extract, and a very small amount of glucose
to promote growth of organisms that otherwise are slow to
respond. Buffers are added to stabilize the medium at pH
6.7. Bromthymol blue dye, which is green in uninoculated
media, is added to indicate any shift in pH. If an organism
cannot utilize malonate but manages to ferment a small
amount of glucose, it may turn the medium slightly yellow
or produce no color change at all. These are negative re-
sults. If the organism utilizes malonate, it will alkalinize the
medium and change the indicator from green to deep blue
(Figure 7-61). Deep blue is positive.
SECTION 7
䢇
Differential Media
䢇
81
Malonate Test
T A B L E O F R E S U L T S
Result
Interpretation
Symbol
Purple slant/purple butt
Lysine deaminase negative; Lysine decarboxylase positive
K/K
Purple slant/yellow butt
Lysine deaminase negative; Lysine decarboxylase negative; Glucose
K/A
fermentation
Red slant/yellow butt
Lysine deaminase positive; Lysine decarboxylase negative; Glucose
R/A
fermentation
Black precipitate
Sulfur reduction
H
2
S
LIA Results and Interpretations
T A B L E
7-3
FADH2
FAD
Succinate dehydrogenase
Succinate
CH
2
COO
-
CH
2
COO
-
Fumarate
CH
COO
-
HC
COO
-
Succinate dehydrogenase
Malonate
COO
-
CH
2
COO
-
7-60
C
OMPETITIVE
I
NHIBITION OF
S
UCCINATE
The attachment of
malonate to the enzyme succinate dehydrogenase prevents the attach -
ment of succinate and thus, the conversion of succinate to fumarate.
7-61
M
ALONATE
T
EST
R
ESULTS
Malonate broth inoculated with
Enterobacter aerogenes (Ⳮ) on the left and Escherichia coli (ⳮ) in the
center. An uninoculated control is on the right.
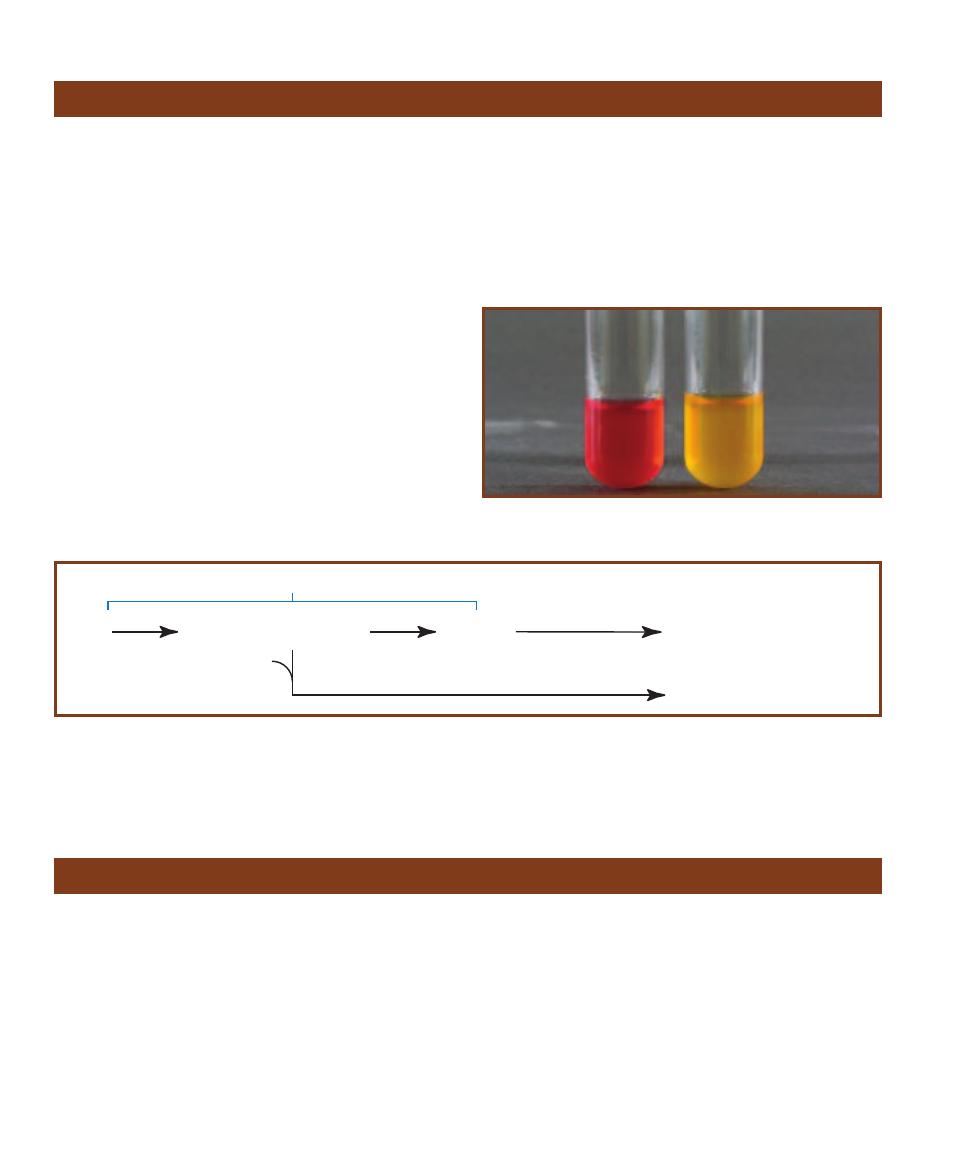
䢇
Purpose
This test is used to detect bacterial motility. Motility is an
important differential characteristic of Enterobacteriaceae
and many other groups.
䢇
Principle
Motility Test Agar is a semisolid medium designed to detect
bacterial motility. Its agar concentration is reduced from the
typical 1.5% to 0.4%—just enough to maintain its form
while allowing movement of motile bacteria. It is inoculated
by stabbing with a straight transfer needle. Motility is
detectable as diffuse growth radiating from the central stab
line (Figure 7-64).
A tetrazolium salt (TTC) is sometimes added to the
medium to make interpretation easier. TTC is used by the
bacteria as an electron acceptor. In its oxidized form, TTC
is colorless and soluble; when reduced it is red and insoluble
(Figure 7-65). A positive result for motility is indicated
when the red (reduced) TTC is seen radiating outward from
the central stab. A negative result shows red only along the
stab line (Figure 7-66).
䢇
Purpose
The Methyl Red Test is a component of the IMViC battery
of tests (Indole, Methyl Red, Voges-Proskauer, and Citrate)
used to differentiate the Entero bacteriaceae. It identifies
bacterial ability to produce stable acid end products by
means of a mixed-acid fermentation of glucose.
䢇
Principle
MR-VP Broth is a combination medium used for both
Methyl Red (MR) and Voges-Proskauer (VP) tests. (Refer
to page 98 for the VP test.) It is a simple solution containing
only peptone, glucose, and a phosphate buffer. The peptone
and glucose provide protein and a fermentable carbohy-
drate, respectively, and the potassium phosphate resists pH
changes in the medium.
The MR test is designed to detect organisms capable of
performing a mixed acid fermentation, which overcomes the
phosphate buffer in the medium and lowers the pH (Figure
7-62). The acids produced by these organisms tend to be
stable, whereas acids produced by other organisms tend to
be unstable and subsequently are converted to more neutral
products.
Mixed acid fermentation is verified by the addition of
methyl red indicator dye following incubation. Methyl red is
red at pH 4.4 and yellow at pH 6.2. Between these two pH
values, it is various shades of orange. Red color is the only
true indication of a positive result. Orange is negative or
inconclusive. Yellow is negative (Figure 7-63).
82
䢇
A Photographic Atlas for the Microbiology Laboratory
Methyl Red Test
Motility Test
Glucose
Lactate (CH
3
CHOH.COO-)
Carbon dioxide (CO
2
)
Hydrogen gas (H
2
)
Ethanol (CH
3
CH
2
OH)
Acetate (CH
3
COO-)
Formate (HCOO-)
Pyruvate
Glycolysis
various enzymes
Succinate (-OOC.CH
2
CH
2
COO-)
Phosphoenolpyruvate (PEP)
CO
2
7-62
M
IXED
A
CID
F
ERMENTATION OF
E.
COLI
E. coli is a representative Methyl Red-positive organism and is recommended as a positive control
for the test. Its mixed acid fermentation produces the end products listed in order of abundance. Most of the formate is converted to H
2
and CO
2
gases. Note: The amount of succinate falls between acetate and formate, but is derived from PEP, not pyruvate. Salmonella and Shigella are also
Methyl Red positive.
7-63
T
HE
M
ETHYL
R
ED
T
EST
Escherichia coli (MR-positive) on the
left and Enterobacter aerogenes (MR-negative) on the right.
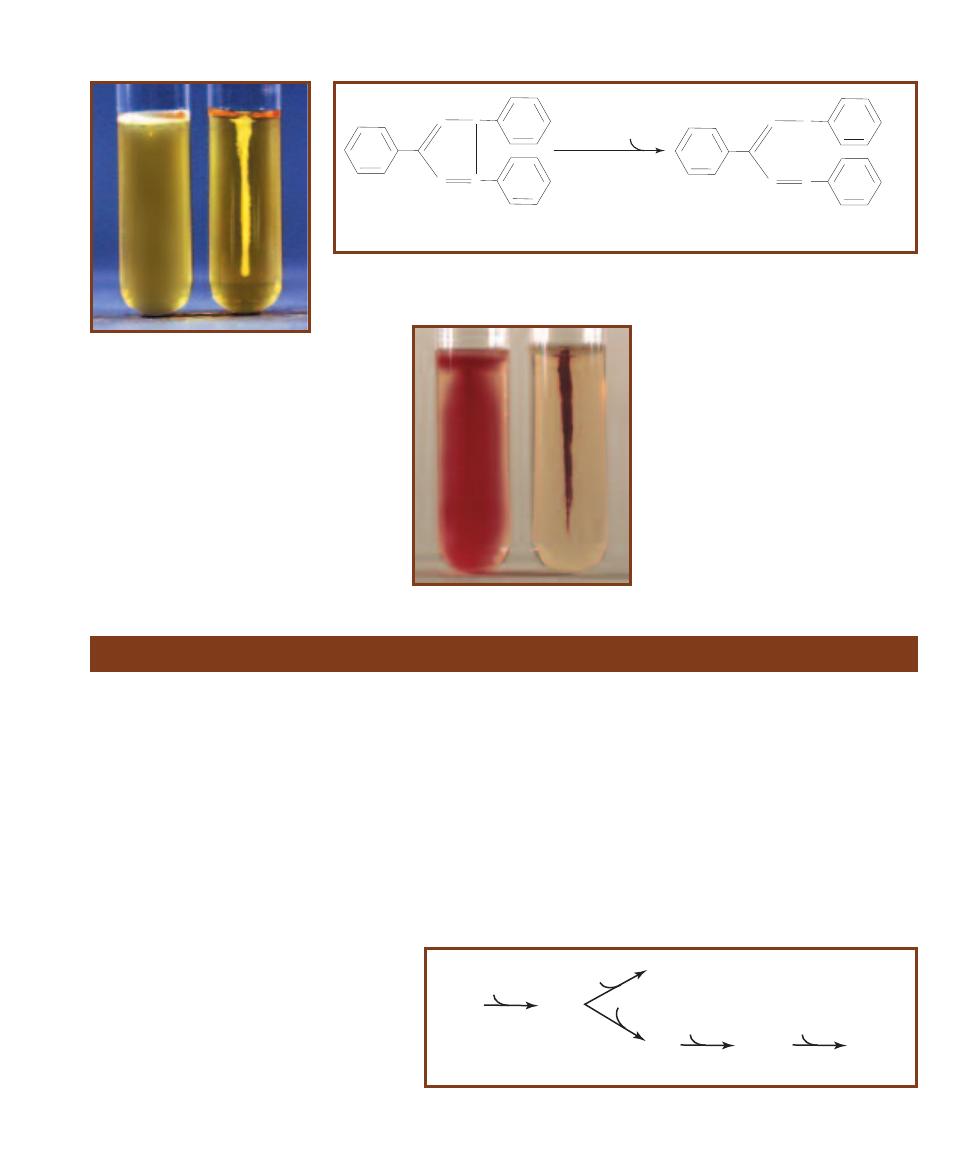
SECTION 7
䢇
Differential Media
䢇
83
N
N
N
N
+
Cl-
2,3,5-Triphenyltetrazolium chloride (TTC)
reductase
2H
+
N
N
N
H
N
+ HCl
Formazan (red color)
7-65
R
EDUCTION OF
TTC
Reduction of 2,3,5-Triphenyltetrazolium chloride by metabolizing bacteria
results in its conversion from colorless and soluble to the red and insoluble compound formazan. The
location of the growing bacteria can be easily determined by the location of the formazan in the medium.
7-66
M
OTILITY
T
EST
R
ESULTS
Motility Test Medium tubes con-
taining TTC inoculated with Entero -
bacter aerogenes (Ⳮ) on the left and
Micrococcus luteus (ⳮ) on the right.
Compare with Figure 7-64.
7-64
M
OTILITY
T
EST IN
SIM
M
EDIUM
W
ITHOUT
TTC
On the left is
Proteus vulgaris (motile); Shigella sonnei
(nonmotile) is on the right. Notice that
motility of P. vulgaris is seen only as
haziness in the medium. Tubes must be
compared to uninoculated controls to
discriminate between faint haziness
and motility. Compare with Figure 7-66.
䢇
Purpose
Virtually all members of Entero bacteriaceae perform a one-
step reduction of nitrate to nitrite. The Nitrate Test differ -
entiates them from Gram-negative rods that either do not
reduce nitrate or reduce it beyond nitrite to N
2
or other
compounds.
䢇
Principle
Anaerobic respiration involves the reduction of (i.e., transfer
of electrons to) an inorganic molecule other than oxygen.
Nitrate reduction is one such example. Many Gram-negative
bacteria (including most Entero bac teriaceae) contain the
enzyme nitrate reductase and perform a single-step reduction
of nitrate to nitrite (NO
3
씮 NO
2
). Other bacteria, in a
multi-step process known as denitrifi cation, are capable of
enzymatically converting nitrate to molecular nitrogen (N
2
).
Some products of nitrate reduction are shown in Figure 7-67.
Nitrate broth is an undefined medium of beef extract,
peptone, and potassium nitrate (KNO
3
). An inverted Durham
tube is placed in each broth to trap a portion of any gas
produced. In contrast to many differential media, no color
indicators are included. The color reactions obtained in
Nitrate Broth take place as a result of reactions between
Nitrate Reduction Test
7-67
P
OSSIBLE
E
ND
P
RODUCTS OF
N
ITRATE
R
EDUC
-
TION
Nitrate reduction is complex. Many different organ-
isms under many different circumstances perform nitrate
reduction with many different outcomes. Members of the
Enterobacteriaceae simply reduce NO
3
to NO
2
. Other bacte-
ria, functionally known as “denitrifiers,” reduce NO
3
all the
way to N
2
via the inter mediates shown, and are important
ecologically in the nitrogen cycle. Both of these are anaero-
bic respiration pathways (also known as “nitrate respira-
tion”). Other organisms are capable of assimilatory nitrate reduction, in which NO
3
is reduced to NH
4
, which can be used in amino acid synthesis. The
oxidation state of nitrogen in each compound is shown in parentheses.
NO
3
NO
2
NH
4
nitrate (+5)
nitrite (+3)
2e
-
ammonium (-3)
NO
nitric
oxide (+2)
6e
-
e
-
N
2
molecular
nitrogen (0)
1/2
N
2
O
nitrous
oxide (+1)
1/2
1e
-
2e
-
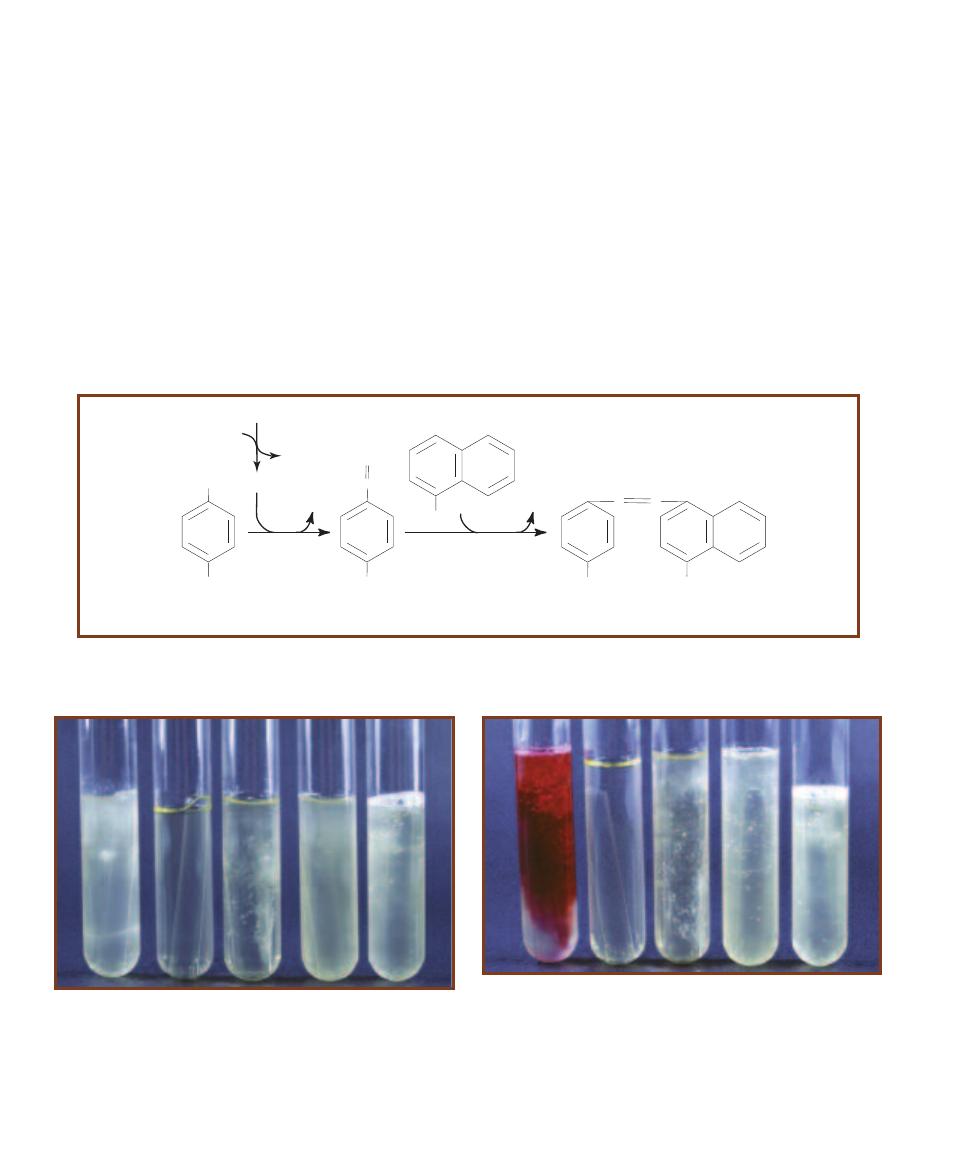
84
䢇
A Photographic Atlas for the Microbiology Laboratory
NH
2
SO
3
H
HNO
2
N
SO
3
H
N
H
2
O
Sulfanilic Acid
Diazotized
Sulfanilic Acid
NH
2
a
-Naphthylamine
NH
2
N
SO
3
H
N
H
2
O
p-Sulfobenzene-azo-a-naphthylamine
NO
2
(From NO
3
reduction)
H
2
O
OH–
(in medium)
7-68
I
NDICATOR
R
EACTION
If nitrate is reduced to nitrite, nitrous acid (HNO
2
) will form in the medium. Nitrous acid then reacts with
sulfanilic acid to form diazotized sulfanilic acid, which reacts with the ␣-naphthylamine to form p-sulfobenzene-azo-␣-naphthyla mine, which
is red. Thus, a red color indicates the presence of nitrite and is considered a positive result for nitrate reduction to nitrite.
7-69
I
NCUBATED
N
ITRATE
B
ROTH
B
EFORE
A
DDITION OF
R
EAGENTS
These tubes have been incubated, but no reagents have been added.
From left to right: Enterobacter aerogenes, an uninoculated control,
Enterococcus faecalis, and two different strains of Pseudomonas aeruginosa.
Note the gas produced by the P. aeruginosa strain on the far right indi-
cating a positive result. (P. aeruginosa is a nonfermenter, therefore, the
gas produced is an indication of denitrification.) The four tubes on the
left must now receive reagents.
7-70
I
NCUBATED
N
ITRATE
B
ROTHS
A
FTER
A
DDITION OF
R
EAGENTS
These are the same tubes as in Figure 7-69 after the addition of sulfa nilic
acid and ␣-naphthalamine to the first four tubes. Red color is a positive
result for reduction of nitrate to nitrite. From left to right: E. aerogenes
is positive; the uninoculated control, E. faecalis, and P. aeruginosa are
inconclusive at this point. No reagents were added to the P. aeruginosa
tube on the far right because it was previously determined to be positive
for denitrification (based on gas production). Zinc must now be added
to the inconclusive tubes.
metabolic products and reagents added after incubation
(Figure 7-68).
Before a broth can be tested for nitrate reductase activity
(nitrate reduction to nitrite), it must be examined for evidence
of denitrification. This is simply a visual inspection for the
presence of gas in the Durham tube (Figure 7-69). If the
Durham tube contains gas and the organism is known not
to be a fermenter (as evidenced by a fermentation test), the
test is complete. De nitrifica tion has taken place. Gas pro-
duced in a nitrate reduction test by an organism capable of
fermenting is not deter mina tive because the source of the
gas is unknown.
If there is no visual evidence of denitrification, sulfanilic
acid and
␣-naphthylamine are added to the medium to test
for nitrate reduction to nitrite. If present, nitrite will form
nitrous acid (HNO
2
) in the aqueous medium. Nitrous acid
reacts with the added reagents to produce a red, water-
soluble compound (Figure 7-70). Therefore, red color
formation after the addition of reagents indicates that the
organism reduced nitrate to nitrite. If no color change takes
place with the addition of reagents, the nitrate either was
not reduced or was reduced to one of the other nitrogenous
compounds shown in Figure 7-67. Because it is impossible
to visually distinguish between these two occurrences, an
additional test is necessary.
In this stage of the test, a small amount of powdered
zinc is added to the broth to catalyze the (nonbiologic)
reduction of any nitrate (which still may be present as
KNO
3
) to nitrite. If nitrate is present at the time zinc is
added, it will be converted immediately to nitrite, and the
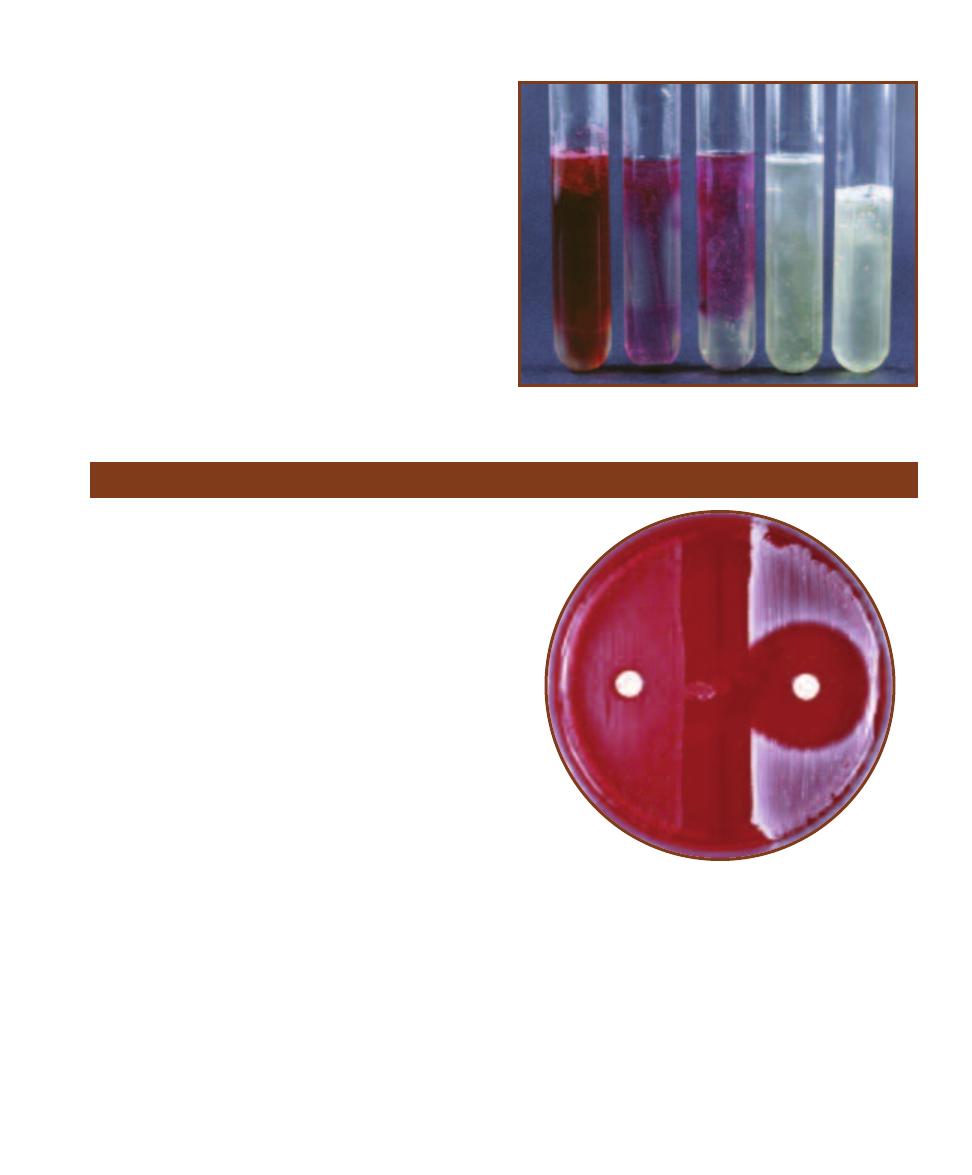
SECTION 7
䢇
Differential Media
䢇
85
7-71
I
NCUBATED
N
ITRATE
B
ROTH
A
FTER
A
DDITION
OF
R
EAGENTS AND
Z
INC
These are the same tubes as in
Figure 7-70 after the addition of zinc to the middle three
tubes. The control tubes and E. faecalis turned red. This is
a negative result because it indicates that nitrate is still
present in the tube. P. aeruginosa did not change color,
which indicates that the nitrate was reduced by the organ-
ism beyond nitrite to some other nitrogenous compound.
This is a positive result.
above- described reaction between nitrous acid and reagents
will follow and turn the medium red. In this instance, the
red color indicates that nitrate was not reduced by the or-
ganism (Figure 7-71). No color change after the addition of
zinc indicates that the organism reduced the nitrate to NH
3
,
NO, N
2
O, or some other nongaseous nitrogenous compound.
䢇
Purpose
The Novobiocin Test is used to differentiate coagulase-
negative staphylococci. Most frequently it is used to pre-
sumptively identify the novobiocin-resistant Staphylococcus
saprophyticus, a common urinary tract pathogen in young
sexually active females.
䢇
Principle
With the exception of Staphylococcus saprophyticus, most
clinically important staphylococci are susceptible to the
antibiotic novobiocin. When agar plates are cultured with a
novobiocin-susceptible organism and a novobiocin impreg-
nated disk is placed on it, a large clearing around the disk
will appear (Figure 7-72). Conversely, organisms resistant
to novobiocin will produce a small zone or no zone at all,
depending on several factors.
The factors affecting zone size are the susceptibility of
the organism to novobiocin, the concentration of the inocu-
lum, the concentration of diffuse antibiotic in the agar, and
the temperature and duration of incubation. The rate and
amount of diffusion of the antibiotic are standardized by
using 5 µg novobiocin disks on 5% Sheep Blood Agar. The
test organism concentration is controlled by diluting to 0.5
McFarland turbidity standard (Figure 19-3) immediately
before inoculation. Incubation takes place at 35°C for 24
hours. An isolate producing a zone of 16 mm or less is
considered novobiocin-resistant (R). A zone greater than
16 mm indicates susceptibility (S).
Novobiocin Susceptibility Test
7-72
N
OVOBIOCIN
D
ISK
T
EST
Staphylococcus saprophyticus
(R) is on the left; Staphylococcus epidermidis (S) is on the right.
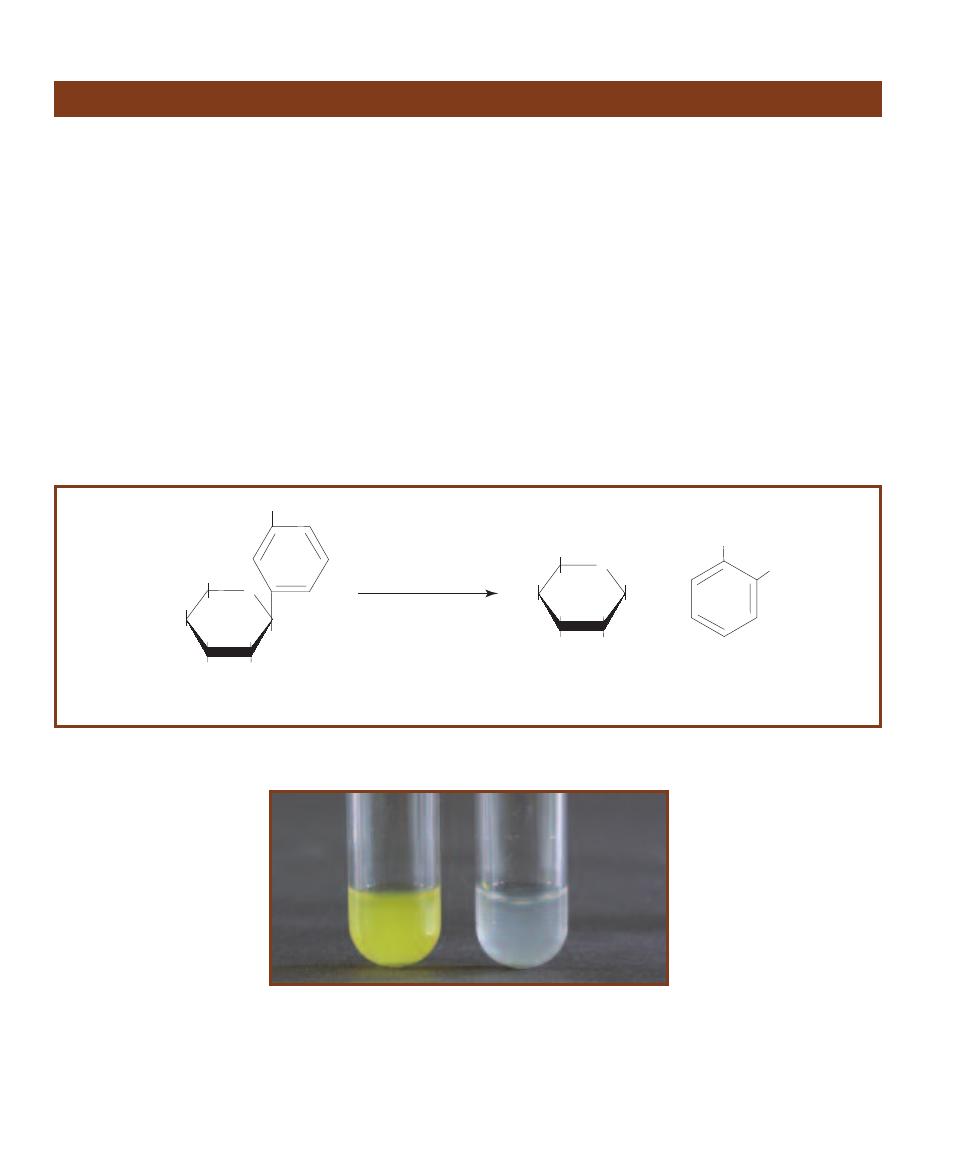
䢇
Purpose
The ONPG Test is used to differen tiate late lactose ferment -
ers from lactose nonfermenters in the family
Enterobacteriaceae.
䢇
Principle
In order for bacteria to ferment lactose, they must possess
two enzymes:
-galactoside permease, a membrane-bound
transport protein, and
-galactosidase, an intracellular
enzyme that hydrolyzes the disaccharide into
-glucose
and
-galactose (Figure 7-55).
Bacteria possessing both enzymes are active
-lactose
fermenters. Bacteria that cannot produce
-galactosidase,
even if their membranes contain
-galactoside permease,
cannot ferment
-lactose. Bacteria that possess -galactosidase
but no
-galactoside permease may mutate and, over a period
of days or weeks, begin to produce the permease. Distin-
guishing these late lactose fermenters from non- fermenters
is made possible by the compound o-nitrophenyl-
-D-
galacto pyranoside (ONPG).
When ONPG is made available to bacteria it freely
enters the cells without the aid of a permease. Because of
its similarity to
-lactose, it then can become the substrate
for any
-galactosidase present. In the reaction that occurs
ONPG is hydrolyzed to
-galactose and o-nitrophenol
(ONP), which is yellow (Figures 7-73 and 7-74).
It should be noted that
-galactosidase is an inducible
enzyme. That is, it is produced in response to the presence
of an appropriate substrate. Therefore, organisms to be
tested with ONPG are typically grown overnight in a lactose-
rich medium to ensure they will be actively producing
-galactosidase, given that capability.
86
䢇
A Photographic Atlas for the Microbiology Laboratory
ONPG Test
7-74
T
HE
ONPG T
EST
Escherichia coli (Ⳮ) is on the left and Proteus
vulgaris (ⳮ) is on the right.
O
CH
2
OH
HO
OH
OH
o-Nitrophenyl-
b-D-galactopyranose
(colorless)
NO
2
O
CH
2
OH
HO
OH
OH
OH
b-Galactose
NO
2
+
OH
b-galactosidase
(high pH)
o-Nitrophenol
(yellow)
7-73
C
ONVERSION OF
ONPG
TO
-G
ALACTOSE AND O
-N
ITROPHENYL BY
-G
ALACTOSIDASE
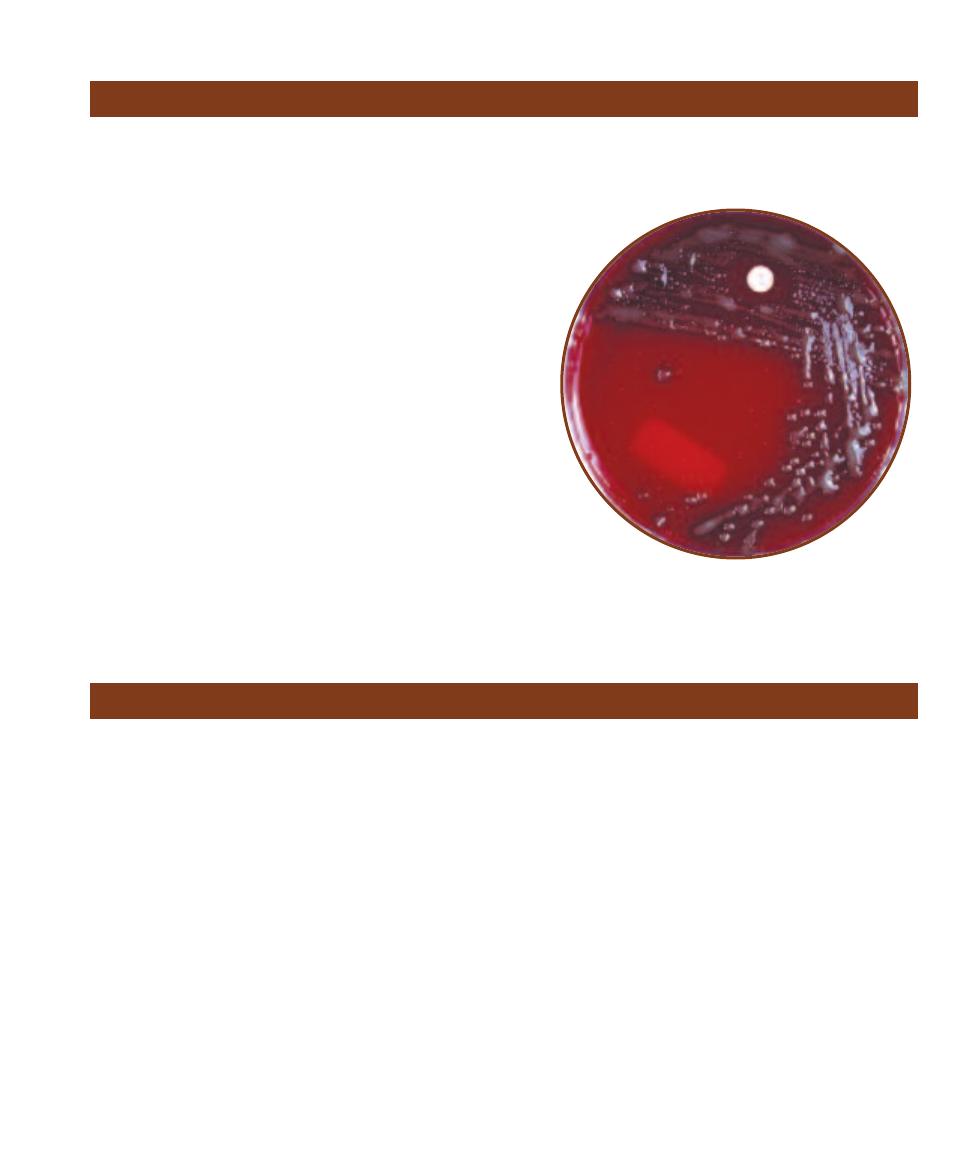
SECTION 7
䢇
Differential Media
䢇
87
䢇
Purpose
The Optochin Test is used to presumptively differentiate
Streptococcus pneumoniae from other
␣-hemolytic
streptococci.
䢇
Principle
Optochin is an antibiotic that interferes with ATPase activity
and ATP production in susceptible bacteria. Streptococcus
pneumoniae is the only streptococcus susceptible to small
concentrations of the antibiotic optochin. Therefore, to
eliminate the few streptococci which show susceptibility to
large concentrations of the antibiotic, the optochin impreg-
nated disks used in this procedure contain a scant 5 µg.
Three or four colonies of the organism to be tested are
transferred and streaked on a Sheep Blood Agar plate in
such a way as to produce confluent growth over approxi-
mately one half of the surface. The optochin impregnated
disk is then placed in the center of the inoculum and the
plate is incubated at 35°C for 24 hours in a candle jar or
5% to 7% CO
2
.
The antibiotic will diffuse through the agar and inhibit
growth of susceptible organisms in the area immediately
surrounding the disk. This creates a clearing in the growth
or zone of inhibition (Figure 7-75). A zone (14 mm in
diameter surrounding a 6 mm disk or 16 mm surrounding a
10 mm disk) is considered presumptively positive identifica-
tion of Streptococcus pneumoniae. Smaller zones indicate
further testing is required.
Optochin Susceptibility Test
7-75
O
PTOCHIN
S
USCEPTIBILITY
T
EST
The zone of inhibition
surrounding the disk indicates susceptibility to optochin and pre-
sumptive identification of Streptococcus pneumoniae.
䢇
Purpose
The Oxidase Test is used to identify bacteria containing the
respiratory enzyme cytochrome c oxidase. Among its many
uses is the presumptive identification of the oxidase-positive
Neisseria. It also can be useful in differentiating the oxidase-
negative Enterobacteriaceae from the oxidase-positive
Pseudomonadaceae.
䢇
Principle
Consider the life of a glucose molecule entering an aerobi-
cally respiring cell. It is first split (oxidized) in glycolysis
where it is converted to two molecules of pyruvate and
reduces two NAD (coenzyme) molecules to NADH ⳭH
Ⳮ
.
Then each of the pyruvate molecules becomes oxidized and
converted to a two-carbon molecule called acetyl–CoA
and one molecule of CO
2
, which reduces another NAD
to NADH. Then the Krebs cycle finishes the oxidation by
producing two more molecules of CO
2
(per acetyl–CoA)
and reduces three more NADs and one FAD to FADH
2
.
As you can see, by this time the cell is becoming quite
full of reduced coenzymes. Therefore, in order to continue
oxidizing glucose, these coenzymes must be converted back
to the oxidized state. This is the job of the electron transport
chain (Figure 7-76).
Many aerobes, microaerophiles, facultative anaerobes,
(and even some anaerobes) have ETCs. The functions of the
ETC are to 1) transport electrons down a chain of molecules
at lower energy levels (with increasingly positive reduction
potentials) to the terminal electron acceptor—½O
2
in the
case of an aerobic ETC and 2) generate a proton motive
force by pumping H
+
out of the cell, thus creating an ionic
imbalance that will drive the production of ATP by way of
membrane ATPases. The protons pumped out of the cell
come from the hydrogen atoms whose electrons are being
transferred down the chain. Because only alternating ETC
molecules are able to carry associated protons along with
their electrons, the positively charged ions are expelled from
the cell. Flavoproteins, iron-sulfur proteins, and cyto chromes
are important ETC molecules unable to donate protons.
Oxidase Test
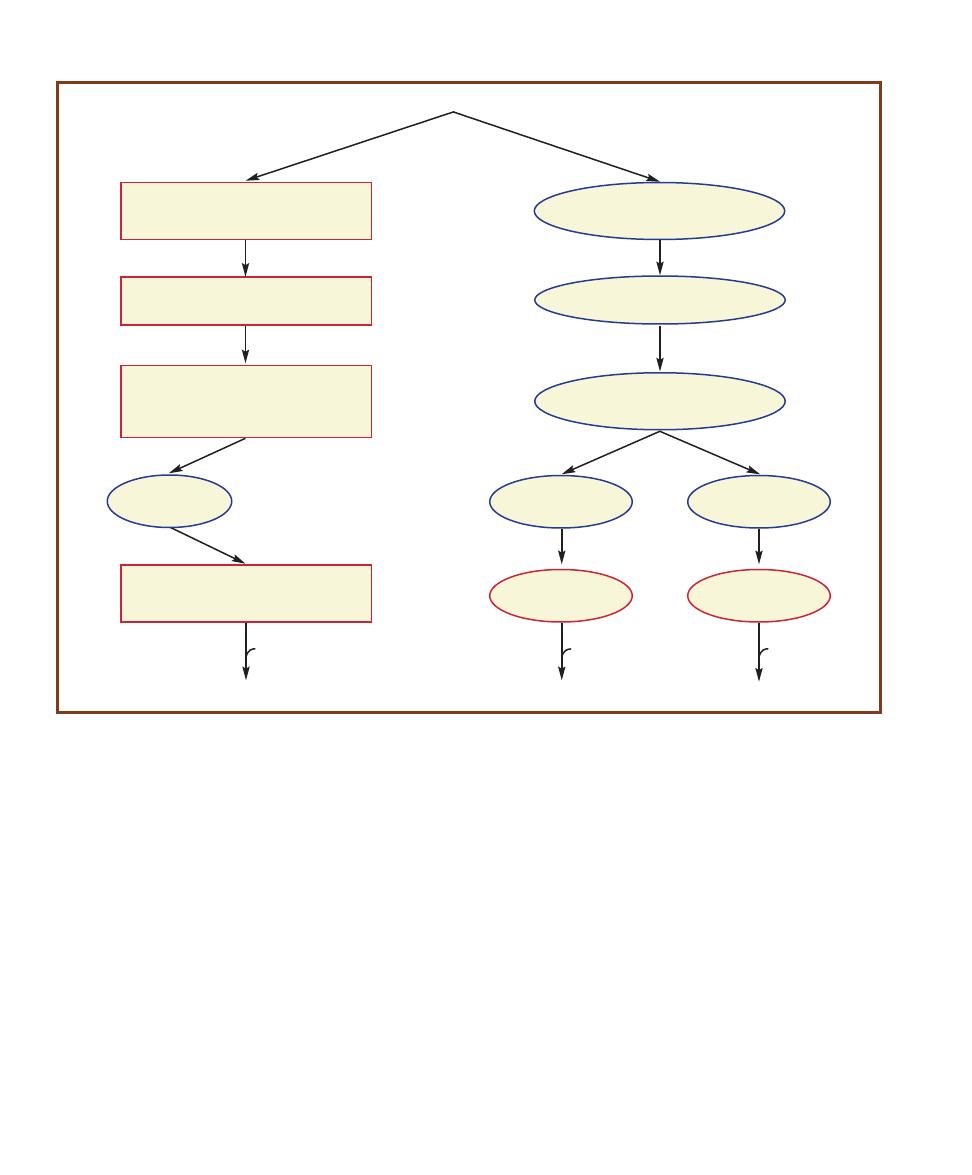
88
䢇
A Photographic Atlas for the Microbiology Laboratory
There are many different types of electron transport
chains, but all share the characteristics listed above. Some
organisms use more than one type of ETC de pending on the
availability of oxygen or other preferred terminal electron
acceptor. Escherichia coli, for example, has two pathways
for respiring aerobically and at least one for respiring an -
aerobically. Many bacteria have ETCs resembling mitochon-
drial ETCs in eukaryotes. These chains contain a series of
four large enzymes broadly named Complexes I, II, III, and
IV, each of which contains several molecules jointly able
to transfer electrons and use the free energy released in the
reactions. The last enzyme in the chain, Complex IV, is
called cyto chrome c oxidase because it makes the final
electron transfer of the chain from cytochrome c, residing
in the periplasm, to oxygen inside the cell.
The Oxidase Test is designed to identify the presence
of cytochrome c oxidase. It is able to do this because
cytochrome c oxidase has the unique ability to not only
oxidize cytochrome c, but to catalyze the reduction of
cytochrome c by a chromogenic reducing agent called
tetramethyl-p-phenylenediamine. Chromogenic reducing
agents are chemicals that develop color as they become
oxidized (Figure 7-77).
In the Oxidase Test, the reducing reagent is added
directly to bacterial growth on solid media (Figure 7-78), or
(more conveniently) a bacterial colony is transferred to paper
7-76
A
EROBIC
E
LECTRON
T
RANSPORT
C
HAINS
(ETC
S
)
There are a variety of different bacterial aerobic electron transport chains. All begin with
flavoproteins that pick up electrons from coenzymes, such as NADH or FADH
2
(represented by AH
2
). Bacteria with chains that resemble the mitochon-
drial ETC in eukaryotes contain cytochrome c oxidase (Complex IV), which transfers electrons from cytochrome c to oxygen. These organisms give a
positive result for the Oxidase Test. Other bacteria, such as members of the Enterobacteriaceae, are capable of aerobic respiration, but have a different
terminal oxidase system and give a negative result for the Oxidase Test. The two paths shown on the right in the diagram are both found in Escherichia
coli. The amount of available O
2
determines which pathway is most active. Enzymatic complexes and oxidases are outlined in red.
Complex I—NADH:quinone oxidoreductase
flavoprotein
iron-sulfur protein
Complex II—Succinate dehydrogenase
quinone
flavoprotein
iron-sulfur protein
ubiquinone
Cytochrome b
562
Cytochrome b
568
Cytochrome o
oxidase
Cytochrome d
oxidase
Complex IV—Cytochrome c oxidase
cytochrome a
cytochrome a
3
AH
2
H
2
O
H
2
O
H
2
O
1
⁄
2
O
2
1
⁄
2
O
2
1
⁄
2
O
2
Complex III—Cytochrome bc
1
iron-sulfur protein
cytochrome b
cytochrome c
i
mitochondrial-like
bacterial ETCs
E. coli ETC
2e
–
2e
–
Cytochrome c
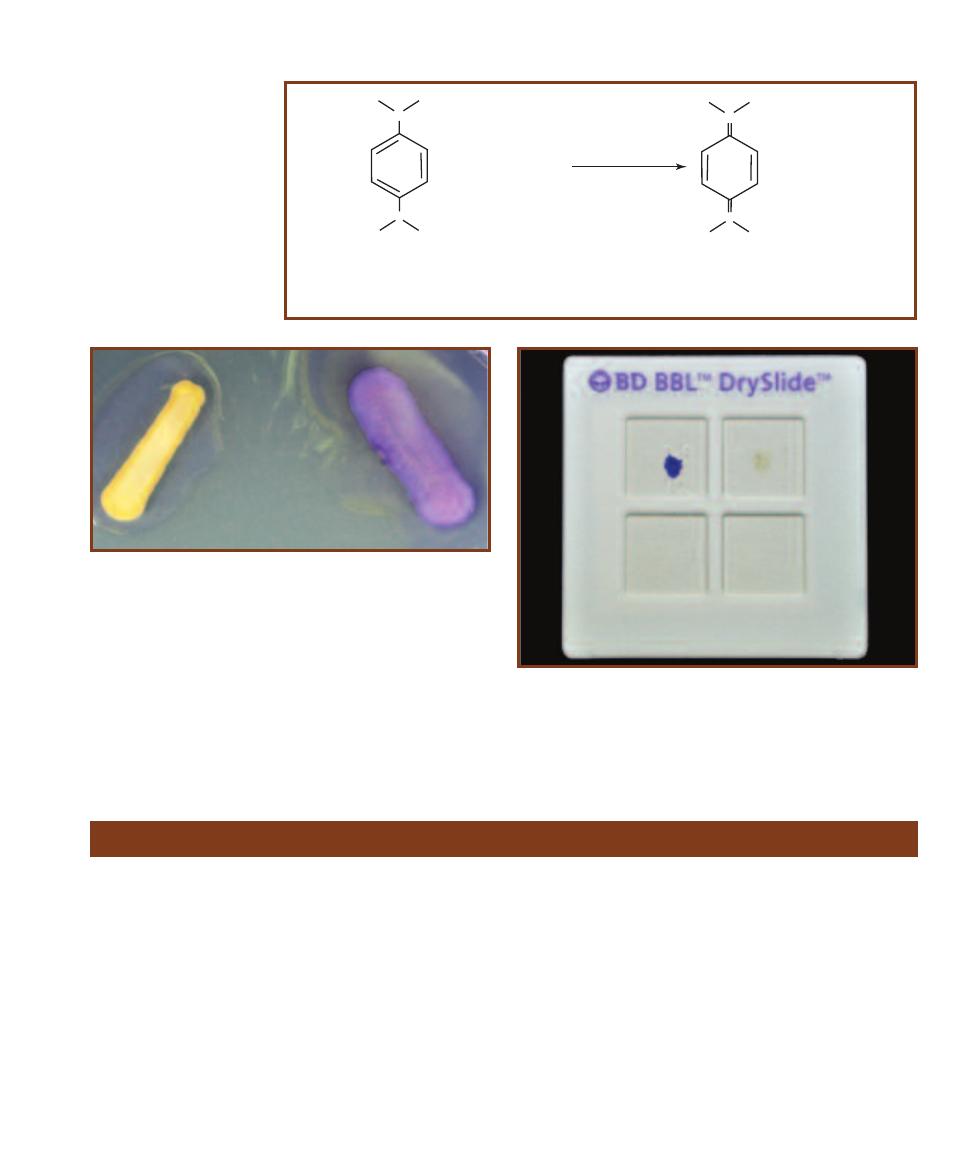
SECTION 7
䢇
Differential Media
䢇
89
7-78
O
XIDASE
T
EST ON
B
ACTERIAL
G
ROWTH
A few drops of
reagent on oxidase-positive bacteria will produce a purple-blue color
immediately. Oxidase-negative organisms will not turn purple. The
bacterium on the left is its natural color, not the color of an oxidase-
negative organism.
7-77
C
HEMISTRY OF THE
O
XIDASE
R
EACTION
The oxidase
enzyme shown is not involved
directly in the indicator reaction
as shown. Rather, it removes
electrons from cytochrome c,
making it available to react with
the phenylenediamine reagent.
+ 2 Cytochrome c
ox
N
N
CH
3
H
3
C
CH
3
H
3
C
+ 2 Cytochrome c
red
N
+
N
+
Tetramethyl-p-phenylenediamine
red
Tetramethyl-p-phenylenediamine
ox
(colorless)
(deep purple/blue)
cytochrome c
oxidase
CH
3
H
3
C
CH
3
H
3
C
7-79
O
XIDASE
S
LIDE
T
EST
Positive results with this test should
appear within 20 seconds. The dark blue is a positive result (left upper
square). No color change is a negative result (right upper square).
(BBL™ DrySlide™ systems available from Becton Dickinson, Sparks, MD.)
saturated with the reagent (Figure 7-79). A dramatic color
change occurs within seconds if the reducing agent becomes
oxidized, thus indicating that cytochrome c oxidase is present.
Lack of color change within the allotted time means that
cytochrome c oxidase is not present and signifies a negative
result.
Oxidation–Fermentation Test
䢇
Purpose
The Oxidation-Fermentation (O–F) Test is used to differen -
tiate bacteria based on their ability to oxidize or ferment
specific sugars. It allows presumptive separation of the
fermentative Entero bacteriaceae from the oxidative Pseudo -
monas and Bordetella, and the nonreactive Alcaligenes and
Moraxella.
䢇
Principle
The O–F Test is designed to differentiate bacteria on the
basis of fermentative or oxidative metabolism of carbohy-
drates. In oxidation pathways a carbohydrate is directly
oxidized to pyruvate and further converted to CO
2
and
energy by way of the Krebs cycle and the electron transport
chain, where an inorganic molecule such as oxygen is
required to act as the final electron acceptor. Fermentation
also converts carbohydrates to pyruvate, but uses it to
produce one or more acids (as well as other compounds).
Consequently, fermenters identified by this test acidify O-F
medium to a greater extent than do oxidizers.
Hugh and Leifson’s O–F medium includes a high sugar-
to-peptone ratio to reduce the possibility that alkaline
products from peptone utilization will neutralize weak acids
produced by oxidation of the carbohydrate. Bromthymol
blue dye, which is yellow at pH 6.0 and green at pH 7.1, is
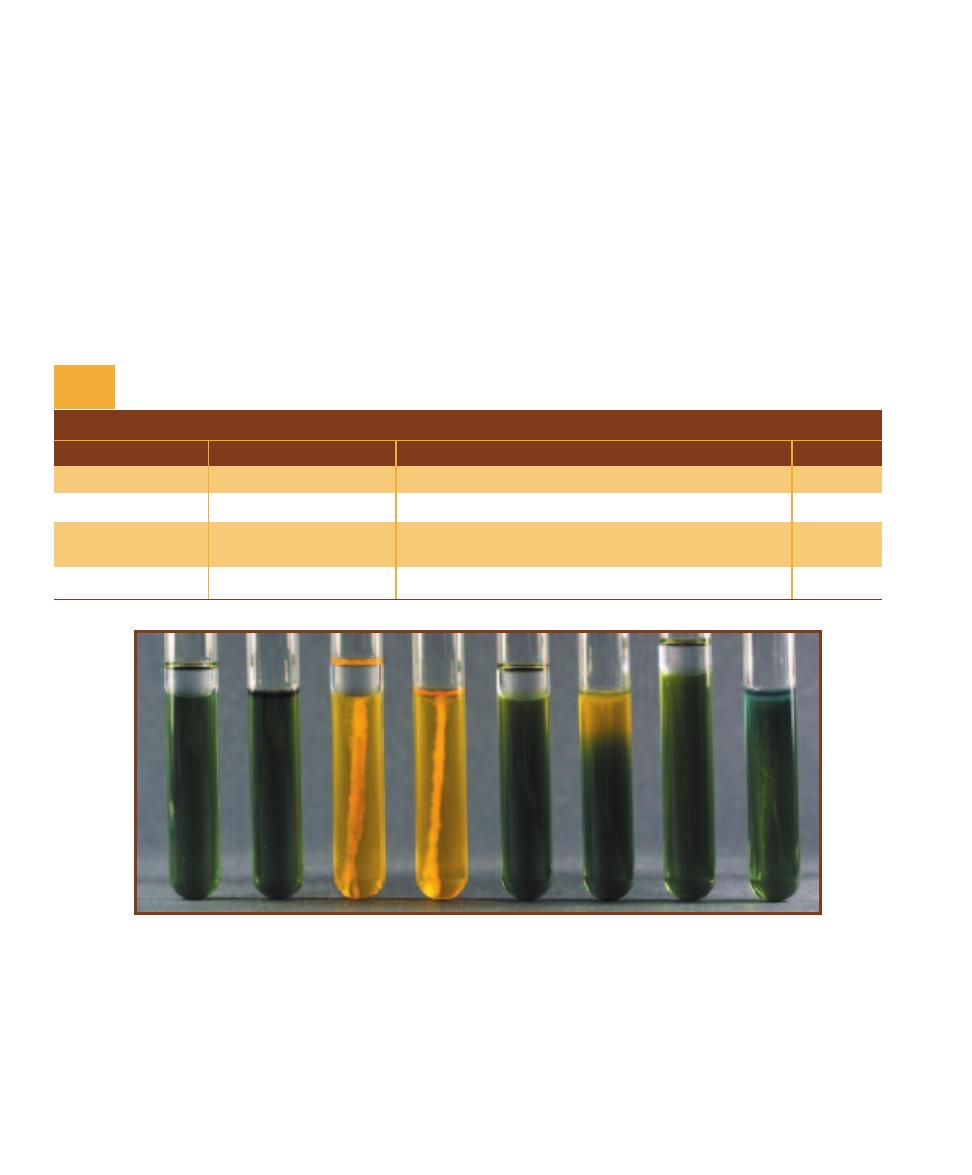
90
䢇
A Photographic Atlas for the Microbiology Laboratory
added as a pH indicator. A low agar concentration makes it
a semi-solid medium that allows determination of motility.
The medium is prepared with glucose, lactose, sucrose,
maltose, mannitol, or xylose and is not slanted. Two tubes
of the specific sugar medium are stab- inoculated several
times with the test organism. After inoculation, one tube is
sealed with a layer of sterile mineral oil to promote anaero-
bic growth and fermen tation. The other tube is left unsealed
to allow aerobic growth and oxidation. (Note: Tubes of O–F
medium are heated in boiling water and then cooled prior
to inoculation. This removes free oxygen from the medium
and ensures an anaerobic environment in all tubes. The
tubes covered with oil will remain anaerobic, whereas the
uncovered medium quickly will become aerobic as oxygen
diffuses back in.)
Organisms able to ferment the carbohydrate or ferment
and oxidize the carbohydrate will turn the sealed and un-
sealed media yellow throughout. Organisms that are able
to oxidize only will turn the unsealed medium yellow (or
partially yellow) and leave the sealed medium green or blue.
Slow or weak fermenters will turn both tubes slightly yellow
at the top. Organisms that are not able to metabolize the
sugar will either produce no color change or turn the medium
blue because of alkaline products from amino acid degrada-
tion. The results are summarized in Table 7-4 and shown in
Figure 7-80.
T A B L E O F R E S U L T S
Sealed
Unsealed
Interpretation
Symbol
Green or blue
Any amount of yellow
Oxidation
O
Yellow throughout
Yellow throughout
Oxidation and fermentation or fermentation only
O–F or F
Slightly yellow
Slightly yellow
Oxidation and slow fermentation or slow fermentation
at the top
at the top
only
O–F or F
Green or blue
Green or blue
No sugar metabolism; organism is nonsaccharolytic
N
O–F Medium Results and Interpretations
T A B L E
7-4
7-80
O
XIDATION
–F
ERMENTATION
T
EST
These pairs of tubes represent three possible results in the Oxidation–Fermentation (O–F) Test. Each pair
contains one tube sealed with an overlay of mineral oil and one unsealed tube. The mineral oil creates an environment unsuitable for oxidation
because it prevents diffusion of oxygen from the air into the medium. The result is that an organism capable of fermentation will turn both tubes
yellow, whereas an organism capable only of oxidizing glucose will turn only the oxygen-containing portion of the unsealed medium yellow. An
organism incapable of utilizing glucose by any means either will not change the color of the medium or will turn it blue-green as a result of alkaline
products from protein degradation. Reading from left to right, the first pair of tubes on the left are uninoculated controls for color comparison. The
second pair of tubes was inoculated with Shigella flexneri, an organism capable of both oxidative and fermentative utilization of glucose (O–F). Unfor -
tunately, this determination cannot be made simply by visual examination, as the results of a fermentative organism (F) look exactly the same as an
organism capable of both oxidation and fermentation (O–F). Therefore, when both tubes are yellow, the organism is assumed to be either (F) or (O–F).
The third pair of tubes was inoculated with Pseudomonas aeruginosa, a glucose nonfermenter. This organism is capable only of oxidation. Note the
yellowing only of the oxygenated portion of the unsealed tube. The fourth pair of tubes (right) was inoculated with Alcaligenes faecalis, an organism
incapable of utilizing glucose. The blue color in the oxygenated portion of the unsealed tube suggests that the organism is both nonsaccharolytic (N)
and a strict aerobe.
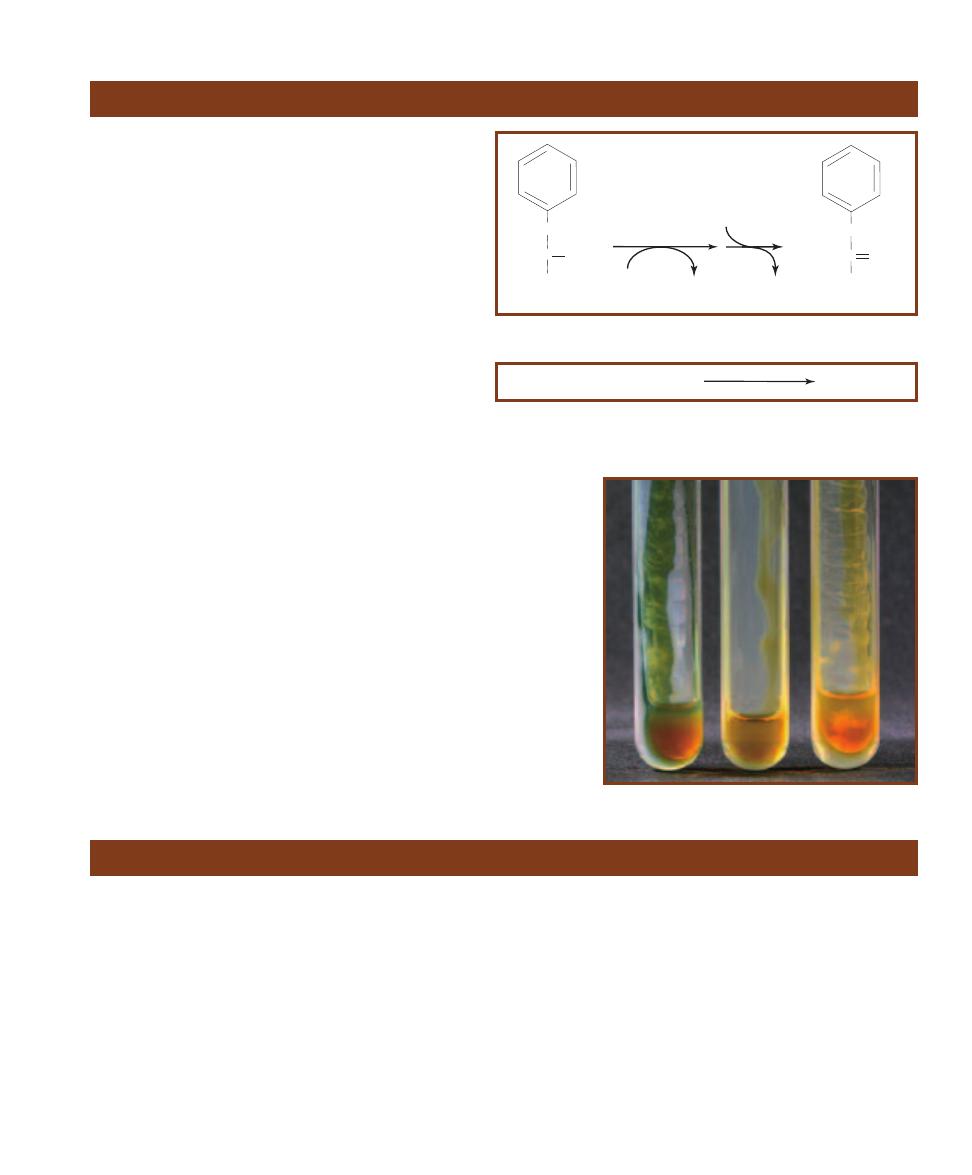
SECTION 7
䢇
Differential Media
䢇
91
䢇
Purpose
The Phenylalanine Deaminase Test is used to differentiate
the genera Morganella, Proteus and Providencia (phenyl -
alanine deaminase-positive) from other members of the
Enterobacteriaceae (phenylalanine deaminase-negative).
䢇
Principle
Organisms that produce phenylalanine deaminase can
be identified by their ability to remove the amine group
(NH
2
) from the amino acid phenylalanine. The reaction,
as shown in Figure 7-81, requires oxygen and produces
ammonia (NH
3
) and phenylpyruvic acid. Deaminase ac-
tivity is evidenced by the presence of phenylpyruvic acid.
Phenylalanine Agar provides a rich source of phenyl -
alanine. A reagent containing ferric chloride (FeCl
3
) is
added to the medium after incubation. The normally
colorless phenylpyruvic acid reacts with the ferric chloride
and turns a dark green color almost immediately (Figure
7-82). Formation of green color indicates the presence of
phenylpyruvic acid and, hence, the presence of phenyl -
alanine deaminase. Yellow is negative (Figure 7-83).
Phenylalanine Deaminase Test
Phenylpyruvic Acid + FeCl
3
Green Color
7-82
I
NDICATOR
R
EACTION
Phenylpyruvic acid produced by positive
organisms reacts with FeCl
3
to produce a green color. The test must be read
immediately because the color may fade.
CH2
HC NH2
COOH
Phenylalanine
phenylalanine
deaminase
Phenylpyruvic acid
NH
3
1/2
O
2
CH2
C O
COOH
H
2
O
H
2
O
7-81
D
EAMINATION OF
P
HENYLALANINE
7-83
P
HENYLALANINE
D
EAMINASE
T
EST
Note the color produced by the stream of ferric
chloride in each tube. Proteus mirabilis (Ⳮ) is on
the left, an uninoculated control is in the middle,
and Escherichia coli (ⳮ) is on the right.
䢇
Purpose
The PYR Test is designed for presumptive identification
of group A streptococci (Streptococcus pyogenes) and
enterococci by determining the presence of the enzyme
L-pyrrolidonyl arylamidase (PYR).
䢇
Principle
Group A streptococci and enterococci produce the enzyme
L-pyrrolidonyl arylamidase. This enzyme hydrolyzes the
amide pyroglutamyl-
-naphthylamide to produce L-
pyrro lidone and
-naphthylamine, both of which are colorless.
-naphthylamine will react with p-dimethylaminocinnamal -
dehyde and form a red precipitate.
PYR may be performed as an 18-hour agar test, a four
hour broth test or, as used in this example, a rapid disk test.
In each case the medium (or disk) contains pyroglutamyl-
-naphthylamide (the PYR substrate) to which is added a
heavy inoculum of the test organism. After the appropriate
incubation or waiting period, a 0.01% p-dimethylamino -
cinnamaldehyde solution is added. Formation of a deep red
color within a few minutes is interpreted as PYR-positive.
Yellow or orange is PYR-negative (Figure 7-84).
PYR Test
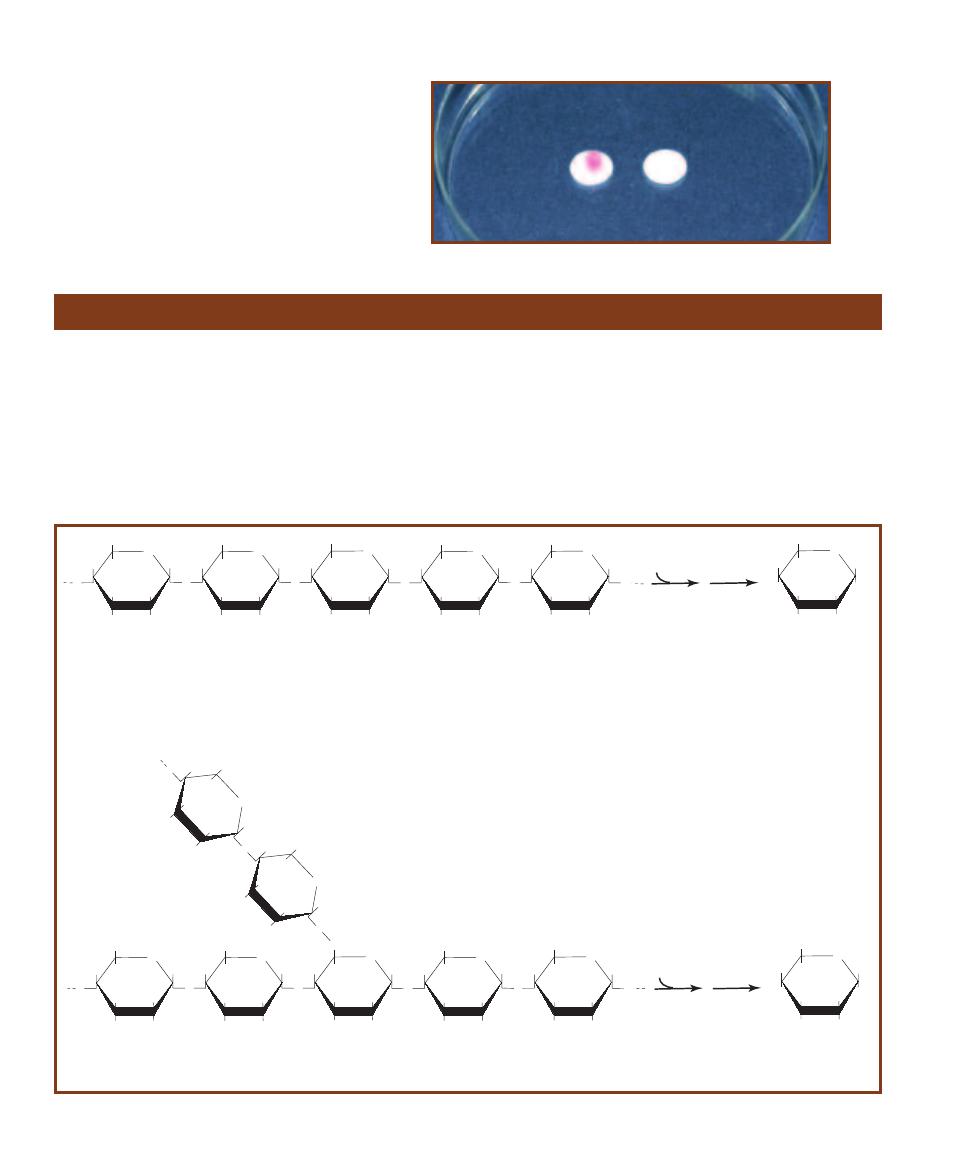
䢇
Purpose
Starch Agar originally was designed for cultivating
Neisseria. It no longer is used for this, but with pH indica-
tors, it is used to isolate and presumptively identify Gard-
ner ella vaginalis. It aids in differentiating species of the
genera Corynebacterium, Clostridium, Bacillus, Bacte -
roides, Fusobacterium, and Enterococcus, most of which
have positive and negative species.
䢇
Principle
Starch is a polysaccharide made up of
␣-D-glucose subunits.
It exists in two forms—linear (amylose) and branched (amy-
lopectin)—usually as a mixture with the branched configura-
tion being predominant. The
␣-D- glucose molecules in both
amylose and amylopectin are bonded by 1,4-
␣- glycosidic
(acetal) linkages (Figure 7-85). The two forms differ in that
amylopectin contains polysaccharide side chains connected
92
䢇
A Photographic Atlas for the Microbiology Laboratory
Starch Hydrolysis
7-84
PYR D
ISK
T
EST
The disk on the left was
inoculated with Streptococcus pyogenes (PYR-positive);
the disk on the right contains Streptococcus agalactiae
(PYR–negative).
O
HOCH
2
O
OH
OH
O
O
HOCH
2
OH
OH
O
O
HOCH
2
OH
OH
O
O
HOCH
2
OH
OH
O
O
HOCH
2
OH
OH
O
OH
O
HOCH
2
O
OH
OH
O
O
HOCH
2
OH
OH
O
O
CH
2
OH
OH
O
O
HOCH
2
OH
OH
O
O
HOCH
2
OH
OH
O
O
H
O
C
H
2
O
O
H
O
H
O
O
H
O
C
H
2
O
H
O
H
O
O
HOCH
2
OH
HO
OH
a
-Amylase
H
2
O
a
-Amylose
[1,4-a-glucosidic (acetal) linkages]
a
-D-Glucose
(many)
Amylopectin
[1,4-a-glucosidic (acetal) linkages and 1,6-a-glucosidic (acetal) branch linkages]
OH
O
HOCH
2
OH
HO
OH
a
-Amylase
H
2
O
a
-D-Glucose
(many)
Oligo-1,6-glucosidase
7-85
S
TARCH
H
YDROLYSIS BY
␣-A
MYLASE AND OLIGO
-1,6-G
LUCOSIDASE
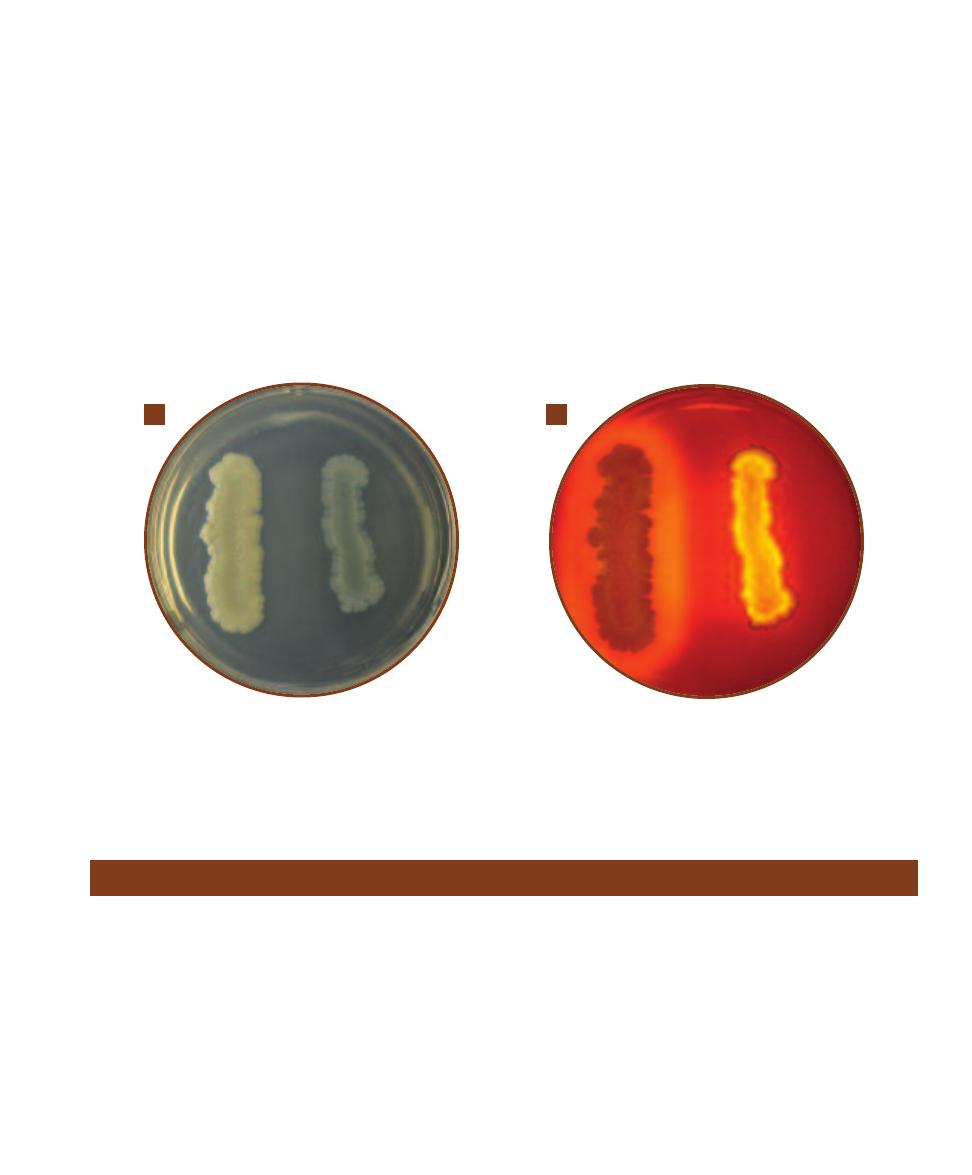
SECTION 7
䢇
Differential Media
䢇
93
7-86
S
TARCH
A
GAR
A
Bacillus subtilis is on the left. Escherichia coli is on the right. Notice the wavy margin of E. coli.
B
After iodine has been
added, the clearing in the medium around B. subtilis demonstrates a positive result for starch hydrolysis. E. coli, with no clearing, is negative. Note
that the wavy margin of E. coli produced a lighter region around the growth that might be misinterpreted as clearing. To prevent reading a false
positive, it is a good idea to establish the margin of growth for each tested organism prior to adding iodine.
A
B
to approximately every 30th glucose in the main chain.
These side chains are identical to the main chain except that
the number 1 carbon of the first glucose in the side chain is
bonded to carbon number 6 of the main chain glucose. The
bond, therefore, is a 1,6-
␣-glycosidic linkage.
Starch is too large to pass through the bacterial cell
membrane. Therefore, to be of metabolic value to the
bacteria it must first be split into smaller fragments or
individual glucose molecules. Organisms that produce and
secrete the extracellular enzymes
␣-amylase and oligo-1,6-
glucosidase are able to hydrolyze starch by breaking the
glycosidic linkages between the sugar subunits. Although
there usually are intermediate steps and additional enzymes
utilized, the overall reaction is the complete hydrolysis of
the polysaccharide to its individual
␣-glucose subunits (Fig-
ure 7-86).
Starch agar is a simple plated medium of beef extract,
soluble starch, and agar. When organisms that produce
␣-amylase and oligo-1,6-glucosidase are cultivated on starch
agar they hydrolyze the starch in the area surrounding their
growth. Because both the starch and its sugar subunits are
soluble and virtually invisible in the medium, the reagent
iodine is used to detect the presence or absence of starch in
the vicinity around the bacterial growth. Iodine reacts with
starch and produces a blue or dark brown color; therefore,
any microbial starch hydrolysis will be revealed as a clear
zone surrounding the growth (Figure 7-86).
Sulfur Reduction (SIM Medium)
䢇
Purpose
The Sulfur Reduction Test is used to differentiate members
of Enterobacteriaceae, especially the sulfur-reducing Sal -
monella, Francisella, and Proteus from the non-reducing
Morganella morganii and Providencia rettgeri.
䢇
Principle
The Sulfur Reduction Test, as it appears in this manual, is
performed using SIM medium. SIM medium also tests for
indole production (page 74) and motility (page 82). It
is a semi-solid medium that is formulated with casein and
animal tissue as sources of amino acids, an iron-containing
compound, and sulfur in the form of sodium thiosulfate.
Sulfur reduction to H
2
S is an anaerobic activity and
can be accomplished by bacteria in two different ways,
depending on the enzymes present.
1. The enzyme cysteine desulfurase catalyzes the putrefac-
tion of the amino acid cysteine to pyruvate (Figure 7-87).
2. The enzyme thiosulfate reductase catalyzes the reduc-
tion of sulfur (in the form of sulfate) at the end of the
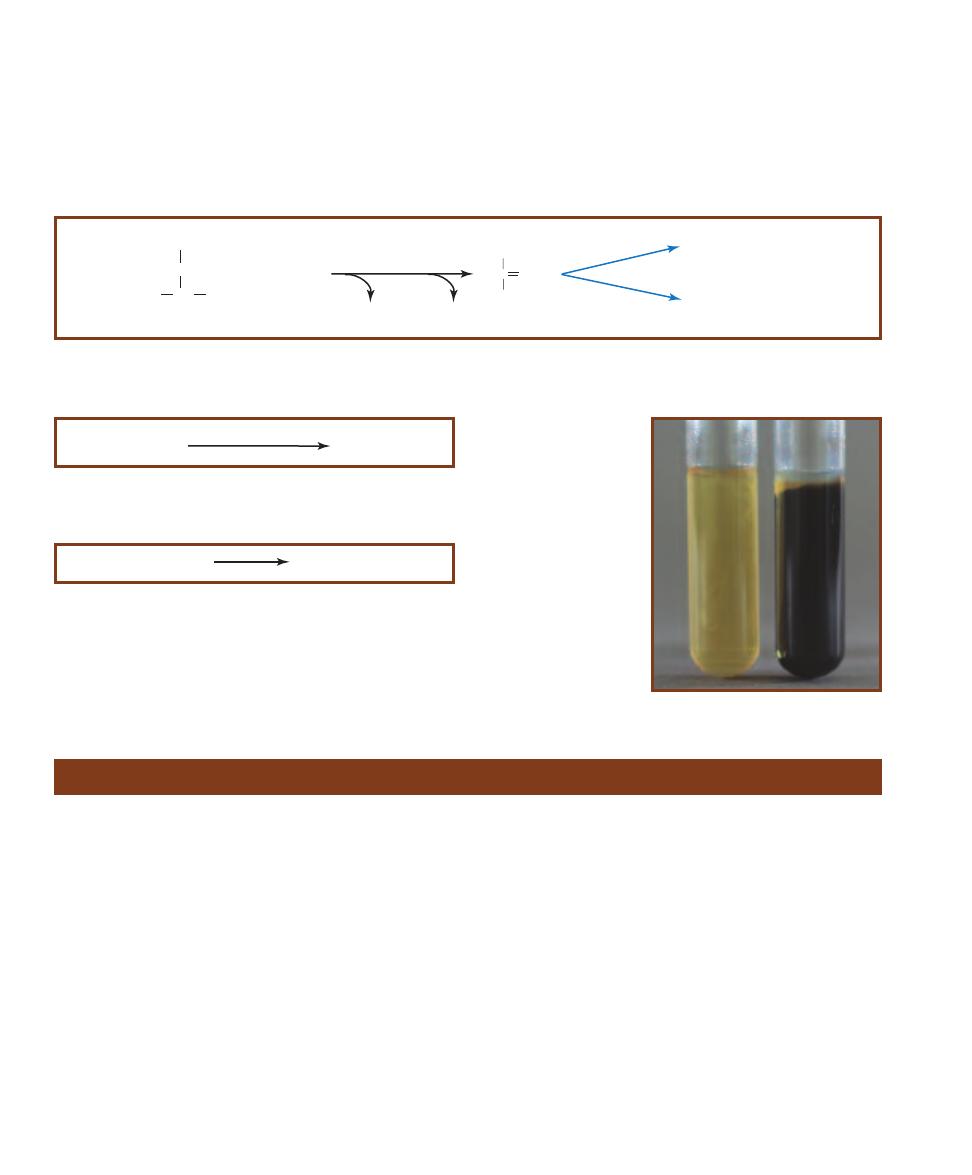
䢇
Purpose
The SXT (Sulfamethoxazole-Trimethoprim) Susceptibility
Test is used to differentiate Groups A and B streptococci
(SXT resistant) from other
-hemolytic streptococci (SXT
susceptible). Used in conjunction with the Bacitracin Suscep-
tibility Test (as in this example) it also differentiates Groups
A and B streptococci from each other.
䢇
Principle
When combined, Sulfamethoxazole and Trimethoprim act
synergistically to disrupt bacterial folic acid metabolism.
SXT disks typically contain 23.75 µg of Sulfamethoxazole
and 1.25 µg of Trimethoprim. When a disk is placed on the
surface of a Sheep Blood Agar plate inoculated to produce
confluent growth, a clearing will appear around the disk if
the organism is susceptible (S) to the antibiotic mixture.
Growth up to the edge of the disk indicates resistance (R).
The combination SXT and Bacitracin Susceptibility Test
(page 58) is performed by placing one of each disk on the
plate at least four centimeters apart (Figure 7-91). Any
clearing around either disk is interpreted as susceptibility.
Table 7-5 summarizes Bacitracin SXT susceptibilities of
various streptococci.
anaerobic respiratory electron transport chain (Figure
7-88).
Both systems produce hydrogen sulfide gas (H
2
S). When
either reaction occurs in SIM medium, the H
2
S produced
combines with iron (ferrous ammonium sulfate in the
medium) to form ferric sulfide (FeS), a black precipitate
(Figure 7-90). Any blackening of the medium is an indica-
tion of sulfur reduction and a positive test. Absence of
blackening in the medium indicates no sulfur reduction
and a negative reaction (Figure 7-90).
94
䢇
A Photographic Atlas for the Microbiology Laboratory
SXT Susceptibility Test
3S
2
O
3
=
+ 4H
+
+ 4e-
Thiosulfate reductase
2SO
3
=
+ 2H
2
S
(g)
7-88
R
EDUCTION OF
T
HIOSULFATE
Anaerobic respiration with thio-
sulfate as the final electron acceptor also produces H
2
S.
7-90
S
ULFUR
R
EDUCTION
IN
SIM M
EDIUM
On the
left is Escherichia coli (H
2
S-
negative); on the right is
Proteus mirabilis (H
2
S-
positive).
H
2
S + FeSO
4
H
2
SO
4
+ FeS
(s)
7-89
I
NDICATOR
R
EACTION
Hydrogen sulfide, a colorless gas, can
be detected when it reacts with ferrous ammonium sulfate in the
medium to produce the black precipitate ferric sulfide.
C
CH
3
O
COO-
Pyruvate
H
2
N CH
COOH
SH
CH
2
Cysteine
+ H
2
O + H
+
Fermentation
Respiration
Cysteine desulfurase
H
2
S
(g)
NH
3
7-87
P
UTREFACTION OF
C
YSTEINE
Putrefaction involving cysteine desulfurase produces H
2
S. The reaction is a mechanism for getting energy out
of the amino acid cysteine.
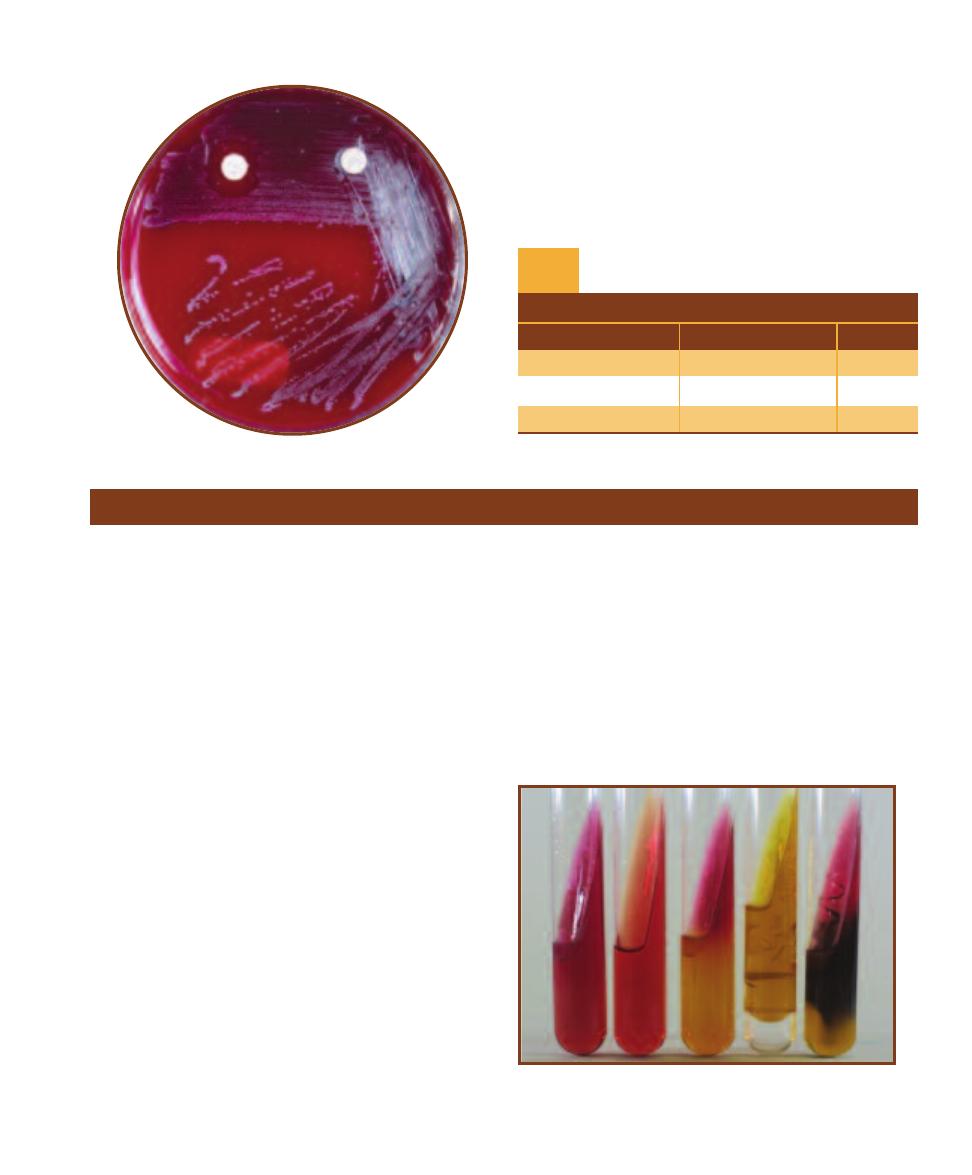
SECTION 7
䢇
Differential Media
䢇
95
7-91
B
ACITRACIN
-SXT T
EST
This is a Bacitracin–
SXT Susceptibility Test on a Sheep Blood Agar plate
containing Streptococcus pyogenes (Group A). Bacitracin
is on the left (S) and SXT (R) is on the right.
T A B L E O F R E S U L T S
Organism
Bacitracin
SXT
Group A
S
R
Group B
R
R
Groups C, F, and G
S or R
S
Reactions of -Hemolytic Streptococci
to Bacitracin and SXT
T A B L E
7-5
䢇
Purpose
Triple Sugar Iron Agar (TSIA) is primarily used to differen -
tiate members of Enterobacteriaceae and to differentiate
them from other Gram-negative rods such as Pseudomonas.
䢇
Principle
TSIA is a rich medium designed to differentiate bacteria on
the basis of glucose fermentation, lactose fermentation, su-
crose fermentation, and sulfur reduction. In addition to the
three carbohydrates, it includes beef extract, yeast extract,
and peptone as carbon and nitrogen sources, and sodium
thiosulfate as a source of reducible sulfur. Phenol red is the
pH indicator and the iron in ferrous sulfate is the hydrogen
sulfide indicator.
The medium is prepared as a shallow agar slant with
a deep butt, thereby providing both aerobic and anaerobic
growth environments. It is inoculated by a stab in the agar
butt followed by a fishtail streak of the slant. The incuba-
tion period is 18 to 24 hours for carbohydrate fermentation
and up to 48 hours for hydrogen sulfide reactions. Many
reactions in various combinations are possible (Figure 7-92
and Table 7-6).
When TSIA is inoculated with a glucose-only fermenter,
acid products lower the pH and turn the entire medium
yellow within a few hours. Because glucose is in short
supply (0.1%), it will be exhausted within about 12 hours.
As the glucose is used up, the organisms located in the aero-
bic region (slant) will begin to break down available amino
acids, producing NH
3
and raising the pH. This process,
which takes 18 to 24 hours to complete, is called a reversion
and only occurs in the slant because of the anaerobic condi-
tions in the butt. Thus, a TSIA with a red slant and yellow
butt after a 24-hour incubation period indicates that the
organism ferments glucose but not lactose.
Organisms that are able to ferment glucose and lactose
and/or sucrose also turn the medium yellow throughout.
However, because the lactose and sucrose concentrations
are ten times higher than that of glucose, greater acid pro-
duction results and both slant and butt will remain yellow
after 24 hours. Therefore, a TSIA with a yellow slant and
butt at 24 hours indicates that the organism ferments glucose
Triple Sugar Iron Agar
7-92
TSI A
GAR
S
LANTS
From left to right: Pseudomonas aeruginosa
(K/NC), uninoculated control, Morganella morganii (K/A, atypically not
producing gas), Escherichia coli, (A/A, G) and Proteus mirabilis (K/A, H
2
S).

96
䢇
A Photographic Atlas for the Microbiology Laboratory
T A B L E O F R E S U L T S
Result
Interpretation
Symbol
Yellow slant/yellow butt
Glucose and lactose and/or sucrose fermentation with acid
A/A
accumulation in slant and butt.
Red slant/yellow butt
Glucose fermentation with acid production. Proteins catabolized
K/A
aerobically (in the slant) with alkaline products (reversion).
Red slant/red butt
No fermentation. Peptone catabolized aerobically and anaerobically
K/K
with alkaline products. Not from Enterobacteriaceae.
Red slant/no change in butt
No fermentation. Peptone catabolized aerobically with alkaline products.
K/NC
Not from Enterobacteriaceae.
No change in slant /
Organism is growing slowly or not at all. Not from Enterobacteriaceae.
NC/NC
no change in butt
Sulfur reduction. (An acid condition, from fermentation of glucose
Black precipitate in the agar
or lactose and/or sucrose, exists in the butt even if the yellow color
H
2
S
is obscured by the black precipitate.)
Cracks in or lifting of agar
Gas production.
G
TSI Test Results and Interpretations
T A B L E
7-6
and one or both of the other sugars. Gas produced by carbo-
hydrate fermentation will appear as fissures in the medium
or will lift the agar off the bottom of the tube.
Hydrogen sulfide (H
2
S) may be produced by the reduc-
tion of thiosulfate in the medium or by the breakdown of
cysteine in the peptone. Ferrous sulfate in the medium reacts
with the H
2
S to form a black precipitate, usually seen in the
butt. Acid conditions must exist for thiosulfate reduction;
therefore, black precipitate in the medium is an indication
of sulfur reduction and fermentation. If the black precipitate
obscures the color of the butt, the color of the slant deter-
mines which carbohydrates have been fermented (i.e., red
slant = glucose fermentation, yellow slant = glucose and
lactose and/or sucrose fermentation).
An organism that does not ferment any of the carbo hy -
drates but utilizes peptone and amino acids will alkalinize the
medium and turn it red. If the organism can use the peptone
aerobically and anaerobically, both the slant and butt will
appear red. An obligate aerobe will turn only the slant red.
Timing is critical in reading TSIA results. An early read-
ing could reveal yellow throughout the medium, leading
one to conclude that the organism is a lactose or sucrose
fermenter when it simply may not yet have exhausted the
glucose. A reading after the lactose and sucrose have been
depleted could reveal a yellow butt and red slant leading
one to falsely conclude the organism is a glucose-only fer-
menter. Tubes that have been interpreted for carbohydrate
fermentation and are negative for sulfur reduction can be
re-incubated for 24 hours before H
2
S determination. Refer
to Table 7-6 for information on the correct symbols and
method of reporting the various reactions.
Urease Tests
䢇
Purpose
The Urease Test is used to differentiate organisms based on
their ability to hydrolyze urea with the enzyme urease. Urinary
tract pathogens from the genus Proteus may be distinguished
from other enteric bacteria by their rapid urease activity.
䢇
Principle
Urea is a product of decarboxylation of certain amino acids.
It can be hydrolyzed to ammonia and carbon dioxide by
bacteria containing the enzyme urease. Many enteric bacteria
(and a few others) possess the ability to metabolize urea, but
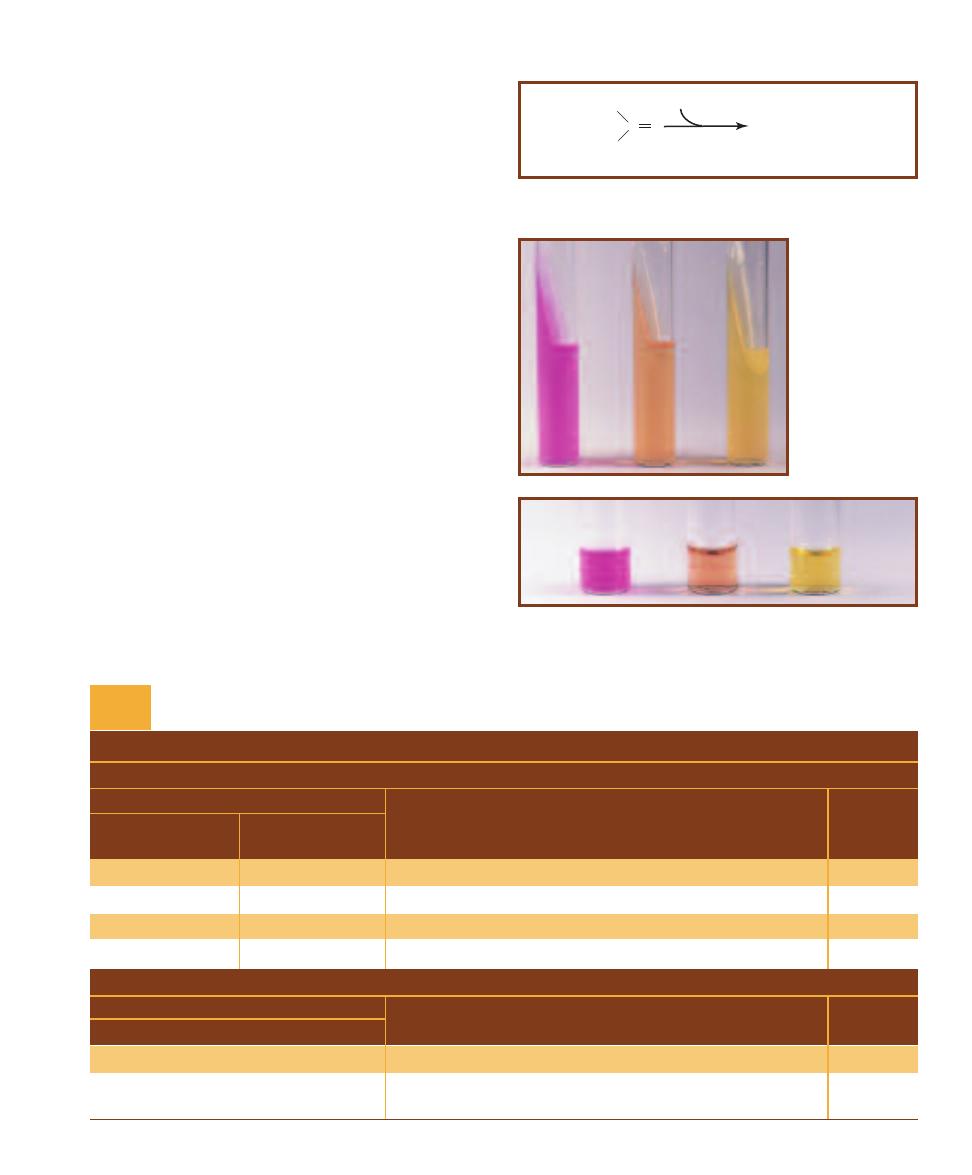
SECTION 7
䢇
Differential Media
䢇
97
only members of Proteus, Morgan ella, and Providencia are
considered rapid urease-positive organisms.
Urea Agar was formulated to differentiate rapid urease-
positive organisms from slower urease-positive and urease-
negative bacteria. It contains urea, peptone, potassium
phosphate, glucose, phenol red, and agar Peptone and
glucose provide essential nutrients for a broad range of
bacteria. Potassium phosphate is a mild buffer used to resist
alkalini zation of the medium from peptone metabolism.
Phenol red, which is yellow or orange below pH 8.4 and
red or pink above, is included as an indicator.
Urea hydrolysis (Figure 7-93) to ammonia by urease-
positive organisms will overcome the buffer in the medium
and change it from orange to pink. The agar must be
examined daily during incubation. Rapid urease-positive
organisms will turn the entire slant pink within 24 hours.
Weak positives may take several days (Table 7-7). Urease-
negative organisms either produce no color change in the
medium or turn it yellow from acid products (Figure 7-94).
Urea Broth differs from urea agar in two important
ways. First, its only nutrient source is a trace (0.0001%) of
yeast extract. Second, it contains buffers strong enough to
inhibit alkalinization of the medium by all but the rapid
urease-positive organisms mentioned above. Other organ-
isms, even some that would ordinarily be able to metabolize
urea, cannot survive the severe nutrient limitations or
overcome the stronger buffers in urea broth. Pink color
in the medium in less than 24 hours indicates a rapid
urease- positive organism. Orange or yellow is negative
(Figure 7-95).
C O
H
2
N
H
2
N
Urea
H
2
O
Urease
2NH
3
+ CO
2
7-93
U
REA
H
YDROLYSIS
Urea hydrolysis produces ammonia, which
raises the pH in the medium and turns the pH indicator pink.
T A B L E O F R E S U L T S
AGAR
Result
24 Hours
24 Hours
to 6 Days
Interpretation
Symbol
All pink
Rapid urea hydrolysis; strong urease production
ⴐ
Partially pink
Slow urea hydrolysis; weak urease production
wⴐ
Orange or yellow
Partially pink
Slow urea hydrolysis; weak urease production
wⴐ
Orange or yellow
Orange or yellow
No urea hydrolysis; urease is absent
ⴑ
BROTH
Result
24 Hours
Interpretation
Symbol
Pink
Rapid urea hydrolysis; strong urease production
ⴐ
Orange or yellow
No urea hydrolysis; organism does not produce urease or
ⴑ
cannot live in broth
Urease Test Results and Interpretations
T A B L E
7-7
7-94
U
REASE
A
GAR
T
EST
R
ESULTS
Urease agar tubes
after a 24 hour incu-
bation. Morganella
morganii (urease-
positive), a rapid
urea splitter, is on the
left and Hafnia alvei
(urease-negative)
is on the right. An
uninoculated control
is in the center.
7-95
U
REASE
B
ROTH
T
EST
R
ESULTS
Urease broth tubes with
Morganella morganii (urease-positive) on the left and Hafnia alvei
(urease-negative) on the right. An uninoculated control is in the center.
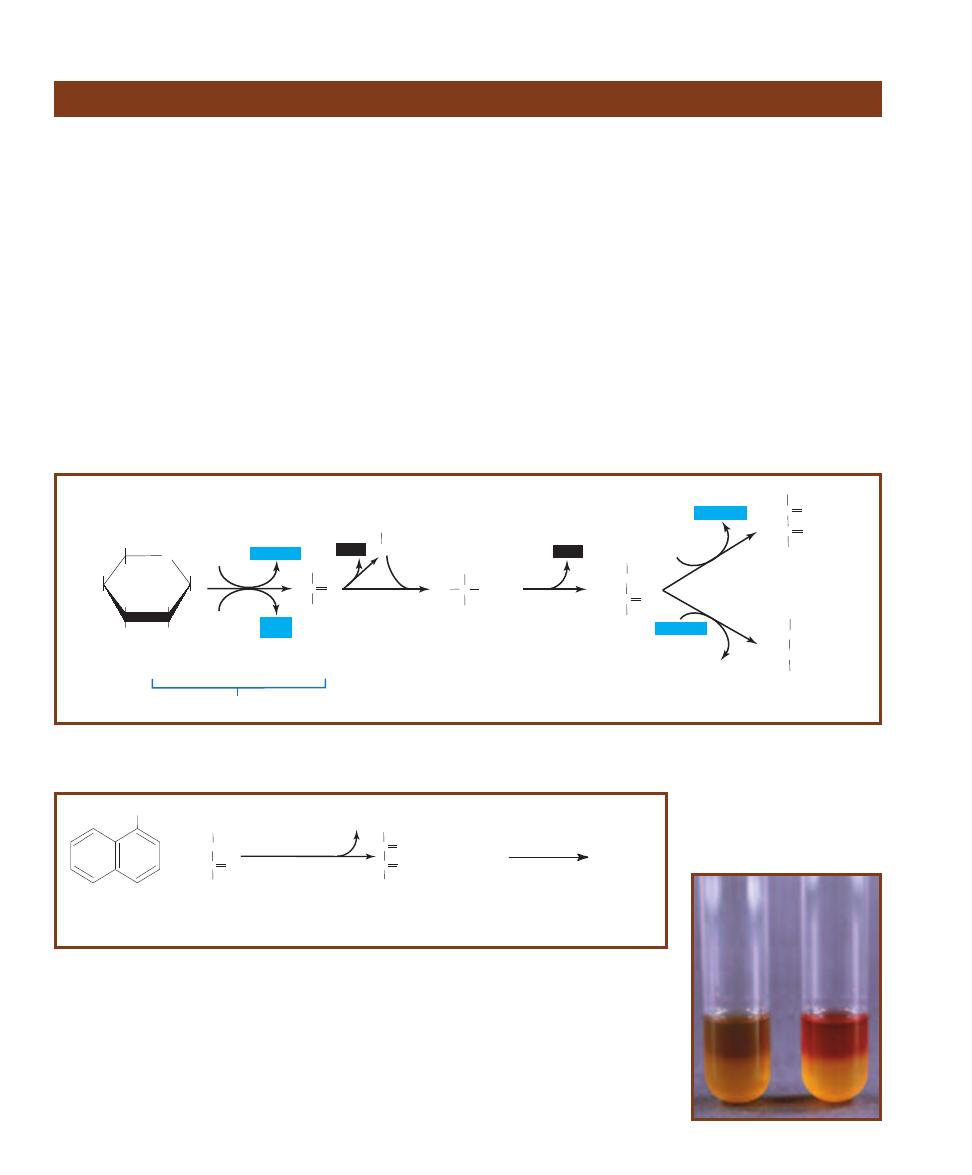
98
䢇
A Photographic Atlas for the Microbiology Laboratory
䢇
Purpose
The Voges-Proskauer Test (VP) is a component of the IMViC
battery of tests (Indole, Methyl Red, Voges-Proskauer, and
Citrate) used to distinguish between members of the Family
Entero bacteriaceae and differentiate them from other
Gram-negative rods. It identifies organisms able to produce
acetoin from the degra dation of glucose during a 2,3-bu-
tanediol fermentation.
䢇
Principle
MR-VP Broth is the combination medium used for both
Methyl Red (MR) and Voges-Proskauer (VP) tests. (Refer to
page 82 for the MR test.) It is a simple solution containing
only peptone, glucose, and a phosphate buffer. The peptone
and glucose provide protein and a fermentable carbohydrate,
and the potassium phosphate resists pH changes in the
medium.
The Voges-Proskauer test was designed for organisms
that are able to ferment glucose, but quickly convert their
acid products to acetoin and 2,3-butanediol (Figure 7-96
and Figure 7-97). Adding VP reagents to the medium after
incubation oxidizes the acetoin (if present) to diacetyl,
which in turn reacts with guanidine nuclei from peptone
to produce a red color (Figure 7-98). A positive VP result,
therefore, is red. No color change (or development of copper
color) after the addition of reagents is negative. The copper
color is a result of interactions between the reagents and
should not be confused with the true red color of a positive
result (Figure 7-98). Use of positive and negative controls
for comparison is usually recommended.
Voges-Proskauer Test
Glycolysis
O
HOCH
2
HO
OH
OH
OH
a
-D-Glucose
C
CH
3
O
COO-
Pyruvate
C
CH
3
O
CH
3
HOCH
Acetoin
CH
3
CHO
Acetaldehyde
HO C COCH
3
a
-Acetolactate
CH
3
CH
3
HOCH
HOCH
2,3-Butanediol
C
CH
3
O
CH
3
Diacetyl
C
O
2 NAD+
2 NAD+
2NAD+
2ADP
COO-
CH
3
CO
2
2NADH+H+
2NADH+H+
2NADH+H+
2ATP
(net)
CO
2
7-96
2,3-B
UTANEDIOL
F
ERMENTATION
Acetoin is an intermediate in this fermentation. Reduction of acetoin by NADH leads to the end product
2,3-butanediol. Oxidation of acetoin produces diacetyl, as in the indicator reaction for the VP test.
OH
+
C
CH
3
O
CH
3
HOCH
Acetoin
a-Naphthol
(VP Reagent A)
KOH
(VP Reagent B)
O
2
C
CH
3
O
CH
3
Diacetyl
C
O
2H
2
O
Guanidine
(in peptone)
Red color
+
7-97
I
NDICATOR
R
EACTION OF
V
OGES
-P
ROSKAUER
T
EST
(VP)
Reagents A and B are added to VP broth
after 48 hours of incubation. These reagents react with acetoin and oxidize it to diacetyl, which in turn reacts
with guanidine (from the peptone in the medium) to produce a red color.
7-98
T
HE
V
OGES
-P
ROSKAUER
T
EST
Escherichia coli (VP- negative)
is on the left and Enterobacter aerogenes (VP-positive) is on the right.
The copper color at the top of the VP- negative tube is due to the
reaction of KOH and ␣-naphthol and should not be confused with
a positive result. Layering of the red color in positive tubes may or
may not occur and is irrelevant to interpretation.
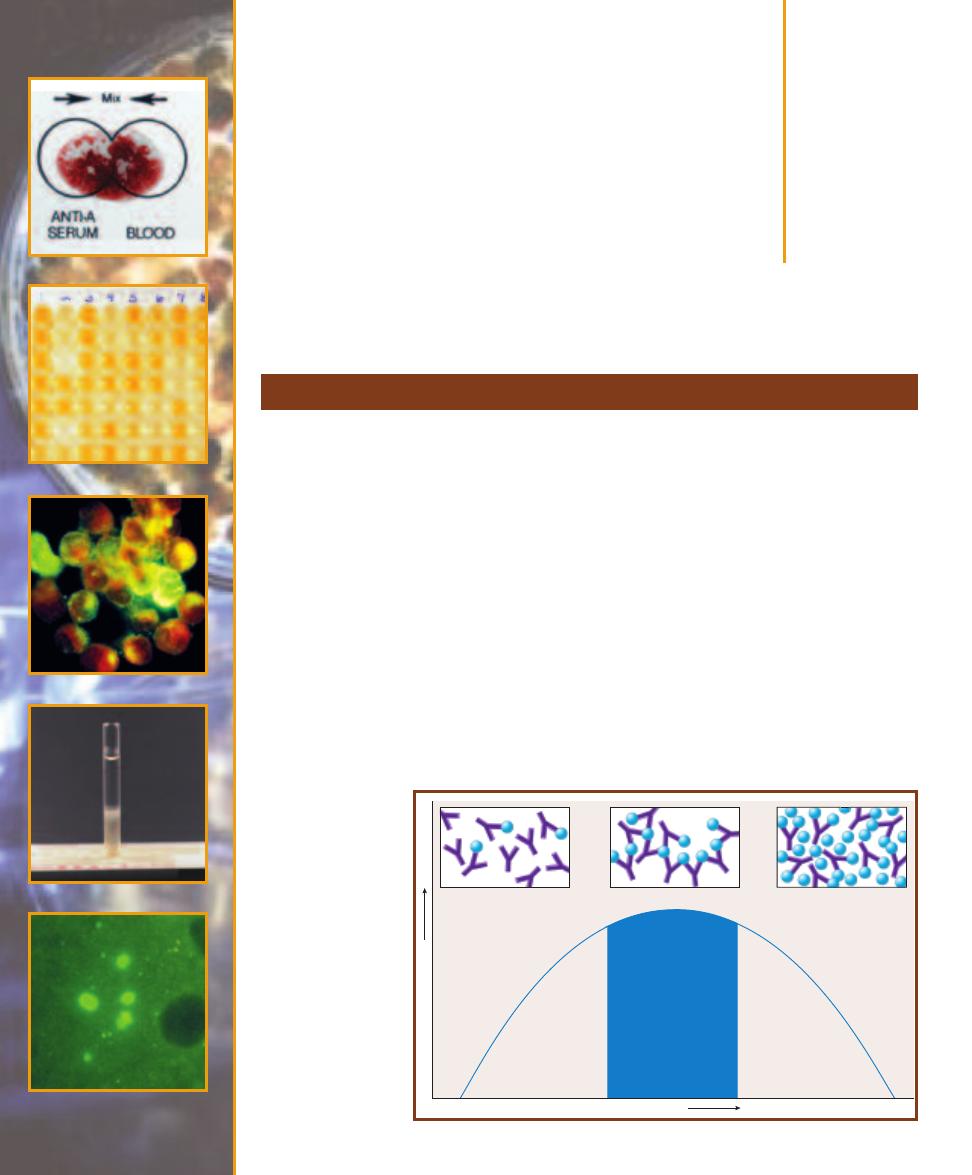
Serology
䢇
Purpose
Precipitation reactions can be used to detect either the presence of antigen or antibody in a sample.
They have mostly been replaced by more sensitive serological techniques for diagnosis, but are still
useful to simply demonstrate sero logical reactions. Double-gel immunodiffusion is used to check
samples for identical, related, or unrelated antigens.
䢇
Principle
Soluble antigens may combine with homologous antibodies to produce a visible precipitate. Precipi-
tate formation thus serves as evidence of antigen-antibody reaction and is considered a positive result.
Precipitation is produced because each antibody has (at least) two antigen binding sites and
many antigens have multiple epitopes (sites for antibody binding). This results in the formation of a
complex lattice of antibodies and antigens and produces the visible precipitate—a positive result. As
shown in Figure 8-1, if either antibody or antigen is found in too high a concentration relative to
the other, no visible precipitate will be formed even though both are present. Optimum proportions
of antibody and antigen are necessary for precipitate formation and occur in the zone of equivalence.
Several styles of precipitation tests are used. The precipitin ring test is performed in a small test
tube or capillary tube. Antiserum (containing antibodies homologous to the antigen being sought)
Precipitation Reactions
8
S E C T I O N
99
Concentration of Antigen
Excess Antibody
Optimum Proportions
Excess Antigen
Optimum Proportions
(Produces visible precipitate)
Excess Antibody
(No visible precipitate)
Excess Antigen
(No visible precipitate)
A
m
o
u
n
t
o
f
P
re
c
ip
it
a
te
Ag
Ag
A
A
A
A
Ag
Ag
Ag
Ag
Ag
Ag
g
g
g
g
g
g
g
g
g
g
Ag
A
A
A
A
Ag
Ag
g
g
g
g
g
g
g
Ag
Ag
Ag
Ag
Ag
Ag
Ag
Ag
Ag
Ag
Ag
Ag
Ag
Ag
Ag
Ag
Ag
Ag
Ag
Ag
Ag
Ag
Ag
Ag
Ag
Ag
Ag
Ag
Ag
Ag
Ag
Ag
Ag
Ag
Ag
Ag
Ag
Ag
Ag
Ag
Ag
Ag
Ag
8-1
P
RECIPITATION
R
EACTIONS
Precipitation
occurs between soluble
antigens and homologous
antibodies where they are
found in optimal propor-
tions to produce a cross-
linked lattice. Excess
antigen or excess anti-
body prevent substantial
cross-linking, so no lattice
is formed and no visible
precipitate is seen—even
though both antigen and
antibody are present.
In this graph, antibody
concentration is kept
constant as antigen
concentration is adjusted
to demonstrate this
phenomenon.
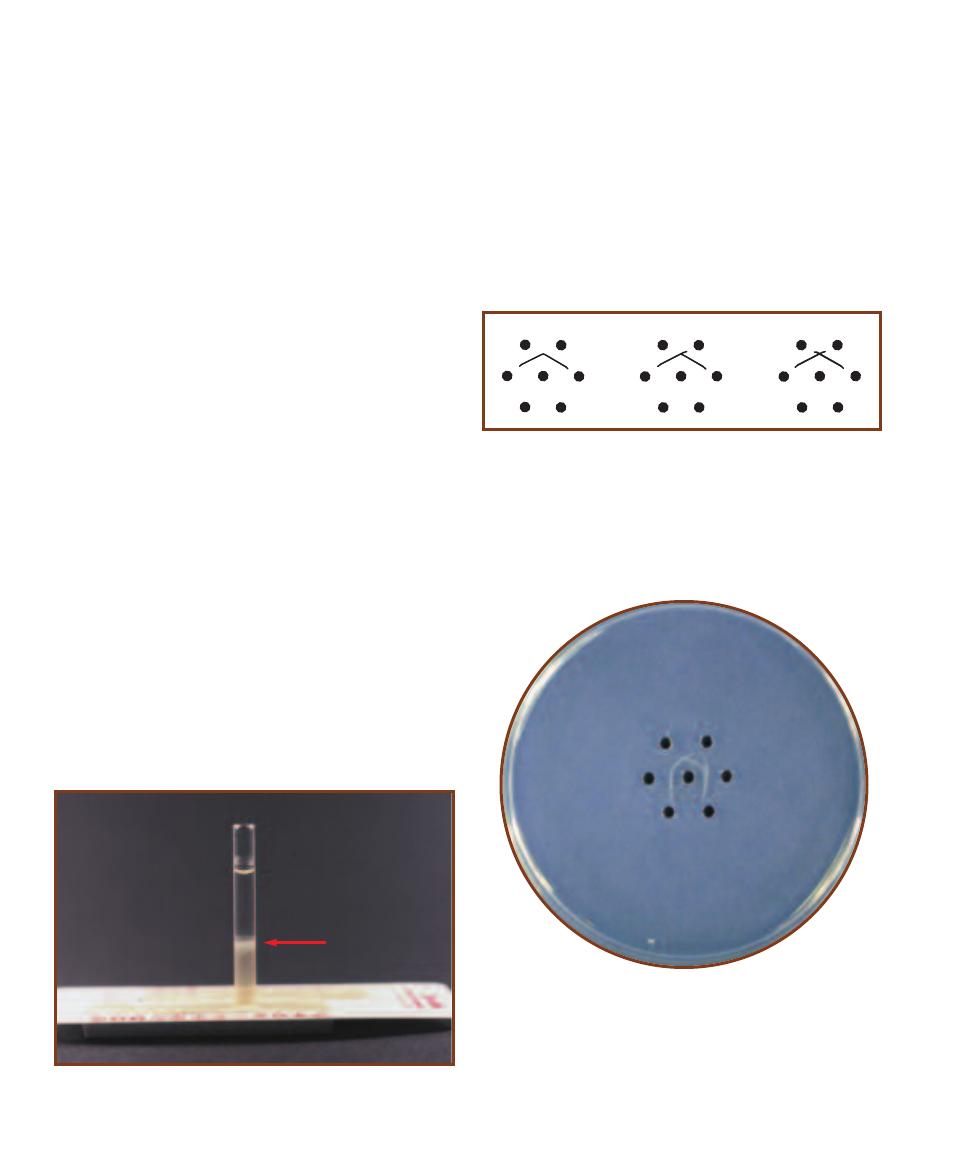
is placed in the bottom of the tube. The sample with the
suspected antigen is layered on the surface of the antiserum
in such a way that the two solutions have a sharp interface.
As the two fluids diffuse into each other, precipitation occurs
where optimum proportions of antibody and antigen are
found (Figure 8-2). This test may also be run to test for
antibody in a sample.
In its simplest form, gel immunodiffusion involves two
wells formed in a saline agar plate. In one well is the anti-
serum; in the other is a sample of unknown antigen compo-
sition. The two diffuse out of their respective wells toward
each other. If the sample has an antigen that will react with
the antibody, then a precipitation line will form at the re-
gion of optimal proportions as their diffusion paths pass. If
no precipitation line forms, the test is considered negative.
That is, the sample has no antigen that will react with the
antibodies. This procedure may also be used to identify the
presence of antibody in a sample if a known antigen is used.
The diffusion path out of the well is not linear. Rather, it
is radial in all directions. In a more complex form of immuno -
diffusion test, several wells are placed around a center well
(Figure 8-3). Antiserum (which rarely contains only one
kind of antibody) is placed in the center well. Samples of
known or unknown antigen composition are put in the
surrounding wells. Because diffusion out of the center well
is radial, precipitation lines may form between the center
well and any or all of the surrounding wells, depending on
their antigen composition. The precipitation line pattern
between neighboring wells is indicative of antigen related-
ness in those wells (Figure 8-3). A single, smooth, curved
precipitation line indicates the two antigens in neighboring
wells are identical (identity). Two spurs indicate unrelated
antigens (nonidentity) because two completely separate
precipitation lines formed. A line with one spur indicates
the antigens are related, but not identical (partial identity),
because two lines formed (Figure 8-4).
Antigens are molecules with a complex three-
dimensional shape, like a protein or polysaccharide.
Different parts of the antigen, called epitopes or antigenic
determinants, can stimulate antibody production and, in
turn, react specifically with those antibodies. So, a line of
identity indicates the epitope(s) being tested are the same.
Lines indicating partial identity actually demonstrate that
some, but not all, epitopes being tested are the same.
100
䢇
A Photographic Atlas for the Microbiology Laboratory
8-2
A P
OSITIVE
P
RECIPITIN
R
ING
T
EST
A sample of antigen has
been layered over an antiserum. The white precipitation ring (arrow)
formed at the site of optimal proportions of antibodies and antigens.
8-3
P
RECIPITATION
P
ATTERNS
This diagram shows three possible
precipitation patterns formed between the antibody in the center well
and antigens in wells #1 and #2. The pattern on the left demonstrates
identity be tween the antigens. This indicates that the antigens are
identical (at least for the epitopes being tested). The pattern in the
middle demonstrates partial identity, which means that the antigens
are related but not identical (they share some epitopes). The pattern
on the right shows nonidentity; the antigens are not related.
1
2
1
2
1
2
2
3
4
5
6
1
8-4
D
OUBLE
-
GEL
I
MMUNODIFFUSION
Antibodies are in the center
well and antigens are in the outer wells. Precipitation lines without
spurs formed between the central well and wells 1 and 2. They illustrate
identity of the antigens in wells 1 and 2. The antigens in wells 2 and 3
illustrate nonidentity, as evidenced by the two spurs at their intersection.
The lines formed between the central well and wells 3 and 4 illustrate
partial identity. There is a shared epitope, but well 4 has an additional
epitope absent in well 3, as evidenced by the single spur. No reaction
occurred between the antibodies and antigens in wells 5 and 6.
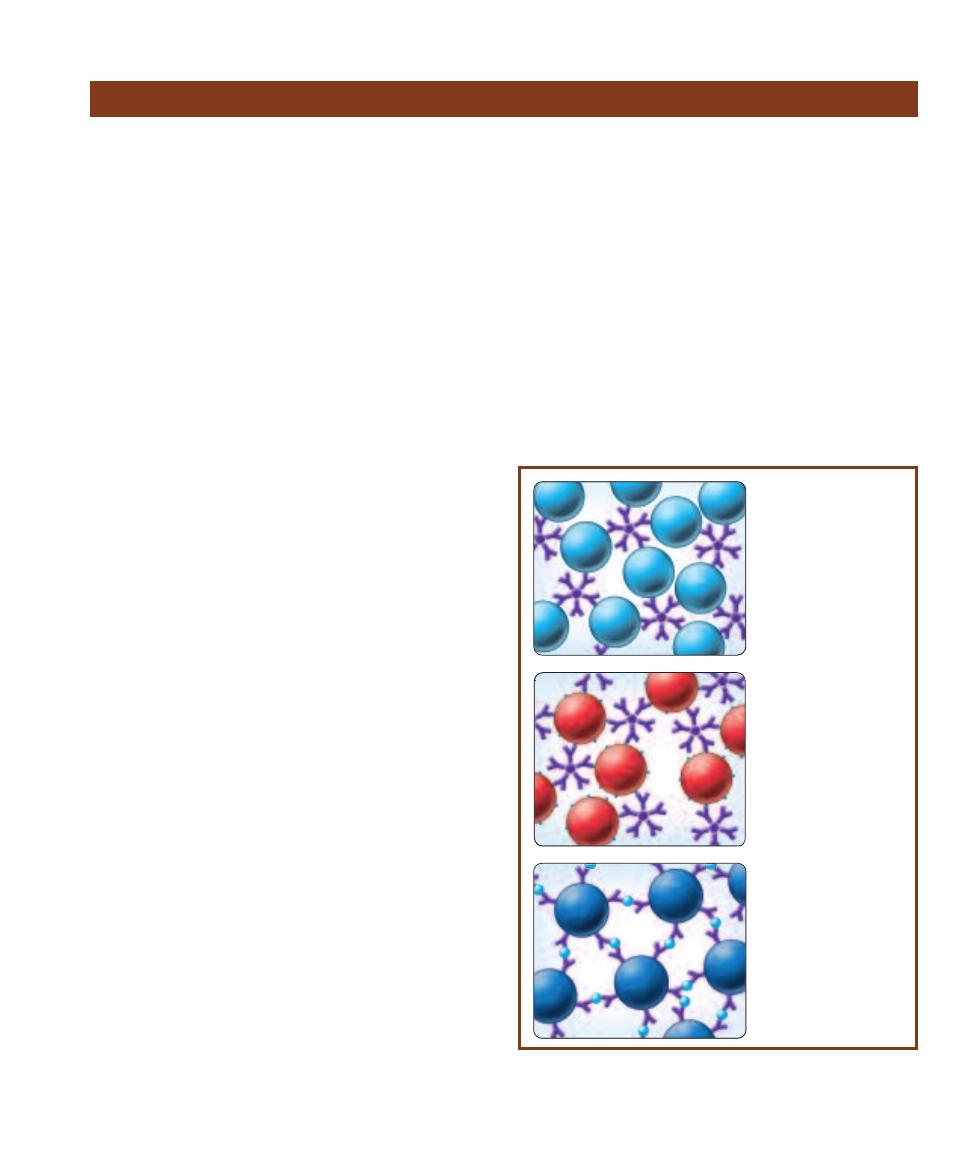
䢇
Purpose
Agglutination reactions may be used to detect either the
presence of antigen or antibody in a sample. Direct aggluti-
nation reactions are used to diagnose some diseases, deter-
mine if a patient has been exposed to a par ticular pathogen,
and are involved in blood typing. Indirect agglutination is
used in some pregnancy tests as well as in disease diagnosis.
䢇
Principle
Particulate antigens (such as whole cells) may combine
with homologous antibodies to form visible clumps called
agglutinates. Agglutination thus serves as evidence of
antigen– antibody reaction and is considered a positive
result. Agglutination reactions are highly sensitive and may
be used to detect either the presence of antigen or antibody
in a sample.
There are many variations of agglutination tests (Figure
8-5). Direct agglutination relies on the combination of
antibodies and naturally particulate antigens. Indirect
agglutination relies on artificially constructed systems in
which agglutination will occur. These involve coating
particles (such as red blood cells—RBCs—or latex micro -
spheres) with either antibody or antigen, depending on what
is being sought in the sample. Addition of the homologous
antigen or antibody will then result in clumping of the
artificially constructed particles.
Slide agglutination (Figure 8-6) is an example of a direct
agglutination test. Samples of antigen and antiserum are
mixed on a microscope slide and allowed to react. Visible
agglutinates indicate a positive result.
Hemagglutination is a general term applied to any
agglutination test in which clumping of red blood cells
indicates a positive reaction. Blood tests as well as a number
of indirect diagnostic serological tests are hemagglutinations.
The most common form of blood typing detects the
presence of A and/or B antigens on the surface of RBCs.
A person’s ABO blood type is genetically determined. An
individual with type A blood has RBCs with the A antigen
and produces anti-B antibodies. Conversely, an individual
with type B blood has RBCs with the B antigen and produces
anti-A antibodies. People with type AB blood have both A
and B antigens on their RBCs and lack anti-A and anti-B
antibodies. Type O individuals lack A and B antigens but
produce both anti-A and anti-B antibodies.
ABO blood type is ascertained by adding a patient’s
blood to anti-A and anti-B antiserum and observing any
signs of agglutination (Figure 8-7). Agglutination with
anti-A antiserum indicates the presence of the A antigen
and type A blood. Agglutination with anti-B antiserum
indicates the presence of the B antigen and type B blood.
If both agglutinate, the individual has type AB blood; lack
of agglutination occurs in individuals with type O blood.
A similar test is used to determine the presence or ab-
sence of the Rh factor (antigen). If clumping of the patient’s
blood occurs when mixed with anti-Rh antiserum (also
known as anti-D), the patient is Rh positive (Figure 8-8).
Indirect hemagglutination may be used to detect the
presence of either antigens or antibodies in a sample. In
the example shown in Figure 8-9, sheep RBCs coated
with Treponema pallidum (the causative agent of syphilis)
antigen represent the particulate antigen. When added to
antiserum containing anti-Treponema pallidum antibodies,
agglutination occurs.
Another application of indirect agglutination is the
Rapid Plasma Reagin Test (RPR). It is used for syphilis
diagnosis (Figure 8-10).
SECTION 8
䢇
Serology
䢇
101
Agglutination Reactions
8-5
D
IRECT AND
I
NDIRECT
A
GGLUTINATION
T
ESTS
Direct agglutina-
tions involve naturally particulate antigens. Indirect agglutination relies
on attaching either the antigen or antibody to a particle, such as a latex
bead or red blood cell.
A
A
A
A
A
A
Ag
Ag
Ag
g
Ag
g
Ag
g
g
g
Ag
g
g
A
A
g
g
A
Ag
Ag
g
g
A
A
Ag
g
g
A
A
A
A
g
g
g
g
g
g
g
g
g
g
g
g
g
g
g
g
g
g
g
g
g
g
g
g
g
g
Ag
A
A
A
A
A
A
Ag
Ag
Ag
g
g
g
g
g
A
g
g
g
Ag
A
A
A
A
Ag
Ag
Ag
Ag
g
A
g
Ag
A
g
Ag
A
g
Ag
A
A
g
Ag
A
g
g
A
A
g
g
g
g
g
g
g
g
Ag
A
A
A
A
A
A
Ag
Ag
Ag
g
g
g
g
g
g
g
A
Ag
Ag
Ag
Ag
Ag
Ag
Ag
Ag
Ag
Ag
Ag
Ag
Direct agglutination
occurs with naturally
particulate antigens.
Either antigen or
antibody may be
detected in a sample
using this style of
agglutination test.
Detection of antibody in
a sample can be done by
indirect agglutination. A
test solution is prepared
by artificially attaching
homologous antigen (light
blue dots) to a particle
such as red blood cells or
latex beads (red spheres)
and mixing with the sample
suspected of containing
the antibody (purple).
Another style of
indirect agglutination
detects antigen (light
blue) in a sample.
Antibodies (purple)
are artificially
attached to particles
(dark blue), which are
then mixed with the
sample suspected of
containing the antigen.
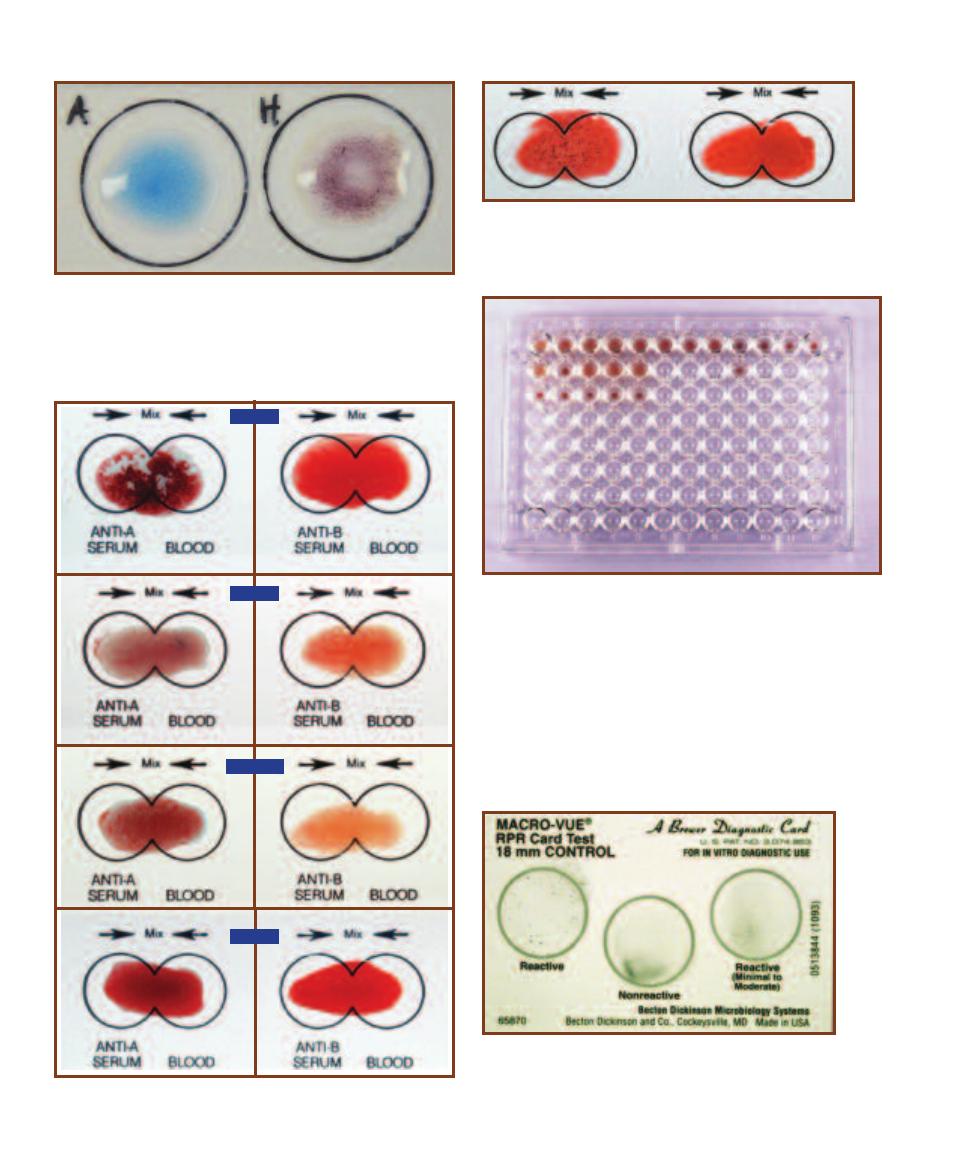
102
䢇
A Photographic Atlas for the Microbiology Laboratory
8-6
S
LIDE
A
GGLUTINATION
Agglutination of Salmonella H antigen
with anti-H antiserum is shown on the right. Anti-H antiserum mixed
with Salmonella O antigen is shown on the left. Serological variation of
H (flagellar) and O (somatic lipopolysaccharide) antigens is an impor-
tant diagnostic feature of Salmonella serovars.
8-8
R
H
B
LOOD
G
ROUPS
Rh blood type is determined by agglu-
tination with anti-Rh (anti-D) antibody. Rh-positive blood is on the
left, Rh-negative is on the right.
8-7
ABO B
LOOD
G
ROUPS
Blood typing relies on agglutination of
RBCs by Anti-A and/or Anti-B antisera. The blood types are as shown.
TYPE AB
TYPE B
TYPE O
TYPE A
8-10
T
HE
RPR T
EST FOR
S
YPHILIS
The Rapid Plasma
Reagin (RPR) test for syphilis relies on antigen-coated particles
agglutinating reagin (an antibody-like substance) present in an
infected individual’s plasma. Shown here is a control card that
must be run with every set of tests.
8-9
I
NDIRECT
H
EMAGGLUTINATION
T
EST FOR
S
YPHILIS
Coating
RBCs with Treponema pallidum antigens is the basis for this hemaggluti-
nation test. Because the antigens do not naturally cause agglutination,
this test is an example of an indirect agglutination. The top row consists
of serially diluted standards to act as positive (reactive) controls. A
positive result is evidenced by a smooth mat of cells in the well (as in
well A1). A negative result is a button of cells (as in well A12). Patient
samples are in rows B and C. Patients B1, B3, B4, and B5 test positive
for syphilis antibodies; patient B2 is negative. Samples in row C corre-
spond to samples in row B and are negative (nonreactive) controls.
In each case, the patient’s serum is mixed with unsensitized RBCs to
assure that agglutination (in Row B) is actually due to reaction with
Treponema antibodies and not the RBCs themselves.

䢇
Purpose
An ELISA Test may be used to detect the presence and
amount of either antigen or antibody in a sample. The
indirect ELISA is used to screen patients for the presence of
HIV antibodies, rubella virus antibodies, and others. The
direct ELISA may be used to detect hormones (such as
human chorionic gonadotropin [HCG] in some pregnancy
tests and luteinizing hormone [LH] in ovulation tests),
drugs, and viral and bacterial antigens.
䢇
Principle
As with other serological tests, ELISAs can be used to detect
antigen in a sample or antibody in a sample (Figure 8-11).
All rely on a second antibody with an attached (conjugated)
enzyme as an indicator of antigen– antibody reaction. It will
be helpful to follow Figure 8-11 as you read the descriptions
of different ELISAs in the following paragraphs.
The direct ELISA detects the presence of antigen in a
sample. A microtiter well is first coated with homologous
antibody specific to the antigen being sought. This is fol-
lowed by coating the well with a blocking agent to prevent
nonspecific binding of the following components to the
well. The sample being assayed is added to the well. If the
antigen is present, it will react with the antibody coating
the well; if none is present, no reaction occurs. In this form
of ELISA, the enzyme-linked (conjugate) antibody is also
specific for the antigen being sought. When added to the
well, it binds to the antigen, if present. After allowing time
for the enzyme-linked antibody to react with the antigen,
the well is washed to remove any unbound enzyme-linked
antibody (which would produce a false positive when the
substrate is added). Upon addition of substrate, a color
change is evidence of the enzymatic conversion of substrate
to its product, which indicates presence of the antigen.
The indirect ELISA detects the presence of antibody in a
sample. In this style of test, the microtiter well is lined with
antigen specific to the antibody being sought and a blocking
agent. The sample being assayed is added to the well and, if
the antibody is present, it will react with the antigen coating
the well; if none is present, no reaction occurs. In this case,
the enzyme-linked antibody is an antihuman immunoglobin
antibody—its antigen is actually an antibody! When added
to the well, it binds to the antibody in the sample, if present.
As with the direct ELISA, unbound enzyme-linked antibody
must be washed away to prevent a false positive result.
Enzyme substrate is added and a color change indicates a
positive test.
Figures 8-12 and 8-13 illustrate a quantitative form of
indirect ELISA, i.e., it is used to determine both the presence
of antibody in a sample and the amount. Figure 8-14 illus-
trates a different version of the ELISA technique—a home
pregnancy test—which screens for the presence of human
chorionic gonadotropin found in pregnant women.
SECTION 8
䢇
Serology
䢇
103
Enzyme-Linked Immunosorbent Assay (ELISA)
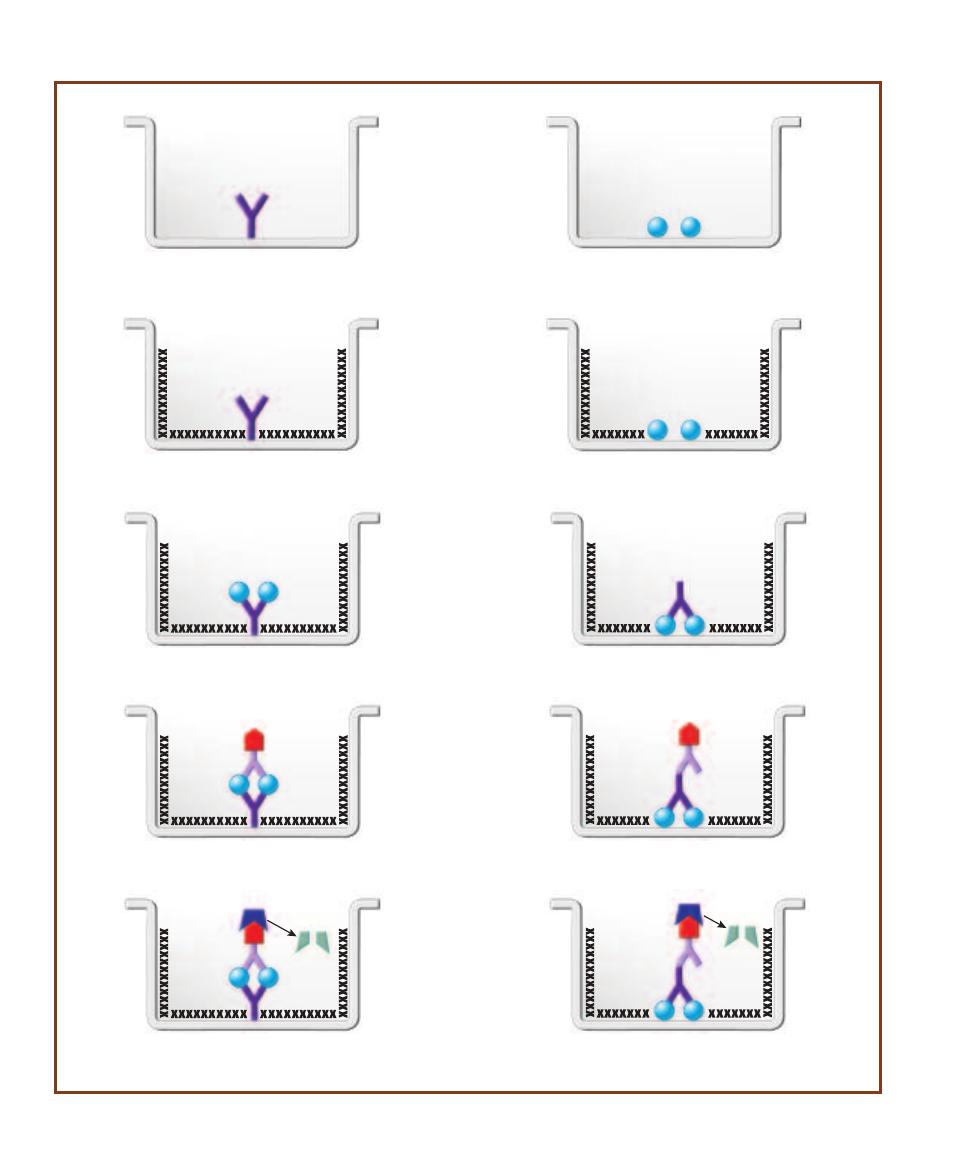
104
䢇
A Photographic Atlas for the Microbiology Laboratory
S
P P
Ag
Ag
E
Ag
Ag
Ag
Ag
E
Ag
Ag
Ag
Ag
E
S
P P
Ag
Ag
E
Ag
Ag
Ag
Ag
Step 1. The direct ELISA detects the presence of antigen in a sample.
Antibody (antiserum) specific for the antigen is coated (adsorbed) onto
the wall of a microtiter well.
Step 1. The indirect ELISA detects the presence of antibody in a
sample. The antigen specific for that antibody is coated
(adsorbed) onto the wall of a microtiter well.
Step 3. The sample is added. If the antigen is present, it will bind to
the antibody coating the well.
Step 3. The sample is added. If the antibody is present, it will bind
to the antigen coating the well.
Step 4. A second antibody with an attached enzyme specific for
the same antigen is added. Unbound enzyme-linked antibody is
washed away.
Step 4. An antihuman immunoglobin antibody with an attached
enzyme is added. Unbound enzyme-linked antibody is washed
away.
Step 5. Substrate for the enzyme is added. Conversion of substrate
to product is evidenced by a color change. A color change means the
sample has the antigen; no color change is a negative result.
Step 5. Substrate for the enzyme is added. Conversion of substrate
to product is evidenced by a color change. A color change means
the sample has the antibody; no color change is a negative result.
Step 2. A blocking agent, such as gelatin or albumin, is added to
coat the well’s surface to prevent its interacting nonspecifically with
any test reagents.
Step 2. A blocking agent, such as gelatin or albumin, is added to
coat the well’s surface to prevent its interacting nonspecifically with
any test reagents.
Direct ELISA method
Indirect ELISA method
8-11
D
IRECT AND
I
NDIRECT
ELISA
S
A direct ELISA is used to identify antigen in a sample. An indirect ELISA identifies antibody in a sample.
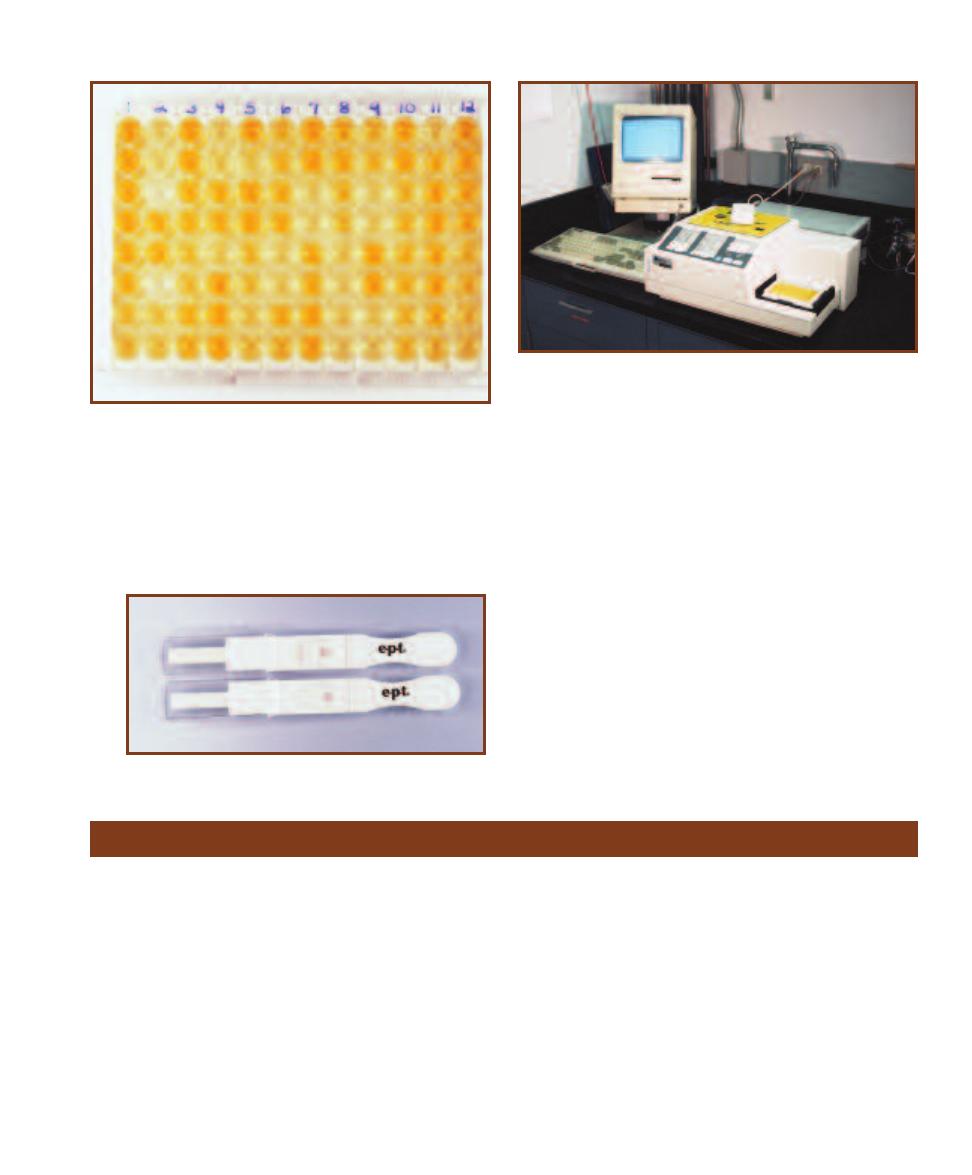
SECTION 8
䢇
Serology
䢇
105
8-12
A Q
UANTITATIVE
I
NDIRECT
ELISA
FOR
HIV A
NTIBODIES
In
this ELISA, a dark yellow color indicates a negative reaction. The lighter
the color, the higher the antibody titer. Color is read by a photometer,
which is much more sensitive than the human eye (Figure 8-13) and re-
sults are fed into a computer. A variety of controls are also used. Serially
diluted antibody samples of known concentration are in column 1, rows
A through H and column 2, rows A through C. Absorbance values from
these are used to develop a standard curve correlating antibody titer with
absorbance. Patient samples are in the other wells. Each patient’s anti-
body titer can then be determined by comparison with the standard curve.
8-13
M
ICROTITER
P
LATE
R
EADER
This is the set-up for the ELISA
illustrated in Figure 8-12. The photometer (plate reader) is in the fore-
ground and the microtiter plate is visible on the photometer at the lower
right. The plate is drawn into the photometer and absorbances in the
wells are read and transmitted to the computer (visible in the background).
8-14
M
EMBRANE
ELISA
Fixing of antibodies to a membrane
(rather than a microtiter dish well) and other advances have made
ELISAs easier to perform and available to home consumers. Shown
is a home pregnancy test. Human chorionic gonadotropin (HCG) is an
antigen present only in pregnant women. A sample of urine is applied
to the wick on the left of the test system. Two pink lines indicate a
reaction of HCG with antibodies in the test system. A single line indi-
cates absence of HCG in the urine (but is used as a positive control)
and is interpreted as a negative result.
A
B
C
D
E
F
G
H
Fluorescent Antibody (FA) Technique
䢇
Purpose
Like most serological tests, the fluorescent antibody (FA)
technique can be used to identify the presence of either
antigen or antibody in a sample. Direct tests (DFA) identify
the presence of antigens; indirect tests (IFA) detect the pres-
ence of antibody in a sample. FAs are useful in diagnosing
many viral infections as well as certain parasitic diseases.
䢇
Principle
Fluorescent antibodies are labeled with fluorescein isothio-
cyanate (FITC) dye, which fluoresces when illuminated
with UV light. In a DFA (Figure 8-15), a sample containing
the suspected antigen is fixed to a microscope slide. The
fluorescent antibody is added and allowed to react with the
antigen. After rinsing to remove unbound antibody, the slide
is viewed with a fluorescent microscope with a UV light
source. If the suspected antigen is present, the labeled anti-
bodies will have bound to it and will emit an apple green
color (Figure 8-16).
IFAs (Figure 8-15) are used to detect antibodies in a
sample. In this form of the test, the specific antigen is fixed
to a microscope slide. Dilutions of the patient’s sample are
added to several slides and given time to react with the anti-
gen. The FITC-labeled antibody is an anti-gamma globulin
antibody, so if there is patient antibody bound to antigen
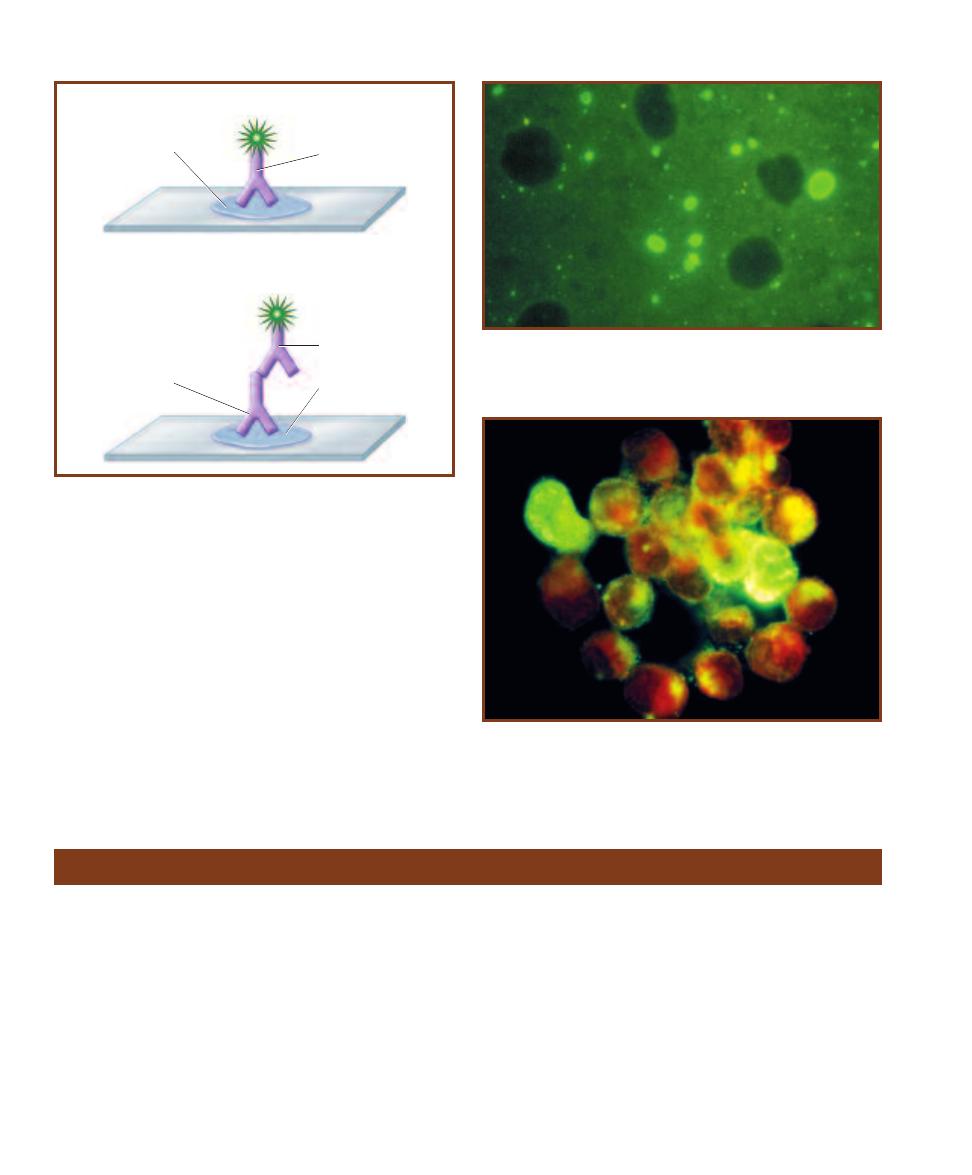
on the slide, the fluorescent antibody will bind to it. After
rinsing to remove any unbound fluorescent antibodies, the
slide is viewed under a fluorescent microscope with a UV
light source. If the suspected antibody is present, the labeled
antibodies will fluoresce and appear apple green (Figures
8-17 and 10-6).
106
䢇
A Photographic Atlas for the Microbiology Laboratory
Sample with
suspected
antigen
FITC-labeled
antibody
Sample with
suspected
antibody
FITC-labeled
antibody
Indirect FA
Direct FA
Homologous
antigen
8-15
D
IRECT AND
I
NDIRECT
F
LUORESCENT
A
NTIBODY
T
ECHNIQUES
The DFA and IFA are used to identify antigens and antibodies in a
sample, respectively.
8-16
A F
LUORESCENT
M
ICROGRAPH OF A
P
OSITIVE
DFA
FOR
R
ABIES
V
IRUS
The fluorescent green color is due to anti-rabies virus
antibodies labeled with FITC dye bound to the virus in the specimen.
8-17
A P
OSITIVE
IFA
FOR
I
NFLUENZA
B V
IRUS
Infected cells
fluoresce an apple green color. Uninfected cells appear reddish due
to a second stain (Evans blue) in the preparation.
Western Blot Technique
䢇
Purpose
Western blots are used to identify proteins in a sample.
(Similar techniques called the Southern blot and Northern
blot are used for identifying DNA and RNA in samples,
respectively.) This technique has applications in research,
especially with viruses, but its main clinical use is to identify
HIV antibodies in a patient’s serum or plasma. Because it is
more expensive and requires greater skill than other sero -
logical tests, it is only used to confirm the results from
samples that are repeatedly positive for HIV antibodies
in preliminary ELISA screening.
䢇
Principle
This test is used to check for specific antibodies in a sample,
so known antigens (proteins) are used. The procedure begins
with polyacrylamide gel electrophoresis (see Electrophoresis
on page 110) of the proteins to separate them by size and
charge. Then the bands of protein are transferred to a nitro-
cellulose membrane by the blotting technique. Simply, the gel
is sandwiched together with the membrane between layers
of absorbent material. The proteins are moved into the
membrane and remain fixed in the same position as the
original bands (but are not visible). The nitrocellulose is

then cut into strips, which are ready for use. (The manu -
facturer does the electrophoresis and blotting steps if a
commercial kit is used.)
A tray with troughs is used to hold the strips so that
several tests may be run simultaneously. After careful
preparation, each sample (suspected of containing antibody)
is applied to a strip and allowed to react for the prescribed
time (usually 12 or 24 hours). This incubation allows any
antibody in the sample to bind to the known antigens in the
strip. After rinsing to remove unbound antibody, the strips
are exposed to an anti-immunoglobin antibody, which is
labeled with an enzyme or a fluorescent chemical. The
strips are rinsed again to remove any unbound labeled
antibody.
Visualization of the bands depends on the type of
labeled antibody. If an enzyme is used, then substrate is
added. If a fluorescent chemical is used, then the strip is
observed under UV light. Comparing band patterns on each
strip to positive and negative controls allows determination
of whether the sample contains the relevant antibodies.
Figures 8-18 and 8-19 show Western blot strips used in
HIV screening. The HIV antigens on the strip are shown
in Figure 8-20.
SECTION 8
䢇
Serology
䢇
107
8-18
HIV W
ESTERN
B
LOT
Shown is a sample lab sheet
with the blotted nitro cellulose
strips attached. This Western
blot was used to detect anti-
HIV antibodies in several pa-
tients’ serum (identified only
by a code number which we
blacked out). Strips 1 and 2 are
high positive and low positive
controls, respectively. Strip 3 is
a negative control. To be con-
sidered positive, the patient’s
strip must react equal to or
greater than the low positive
control. Of the strips shown,
samples 4 and 6 were inter-
preted as positive (P), and
samples 5, 7, and 8 were
negative (N). The test may also
produce indeterminate results
(I). Unfortunately, the criteria
for interpreting a positive differ
slightly between different
agencies, but all involve the
presence of two or more bands
(usually p24, gp41, and/or
gp120/160).
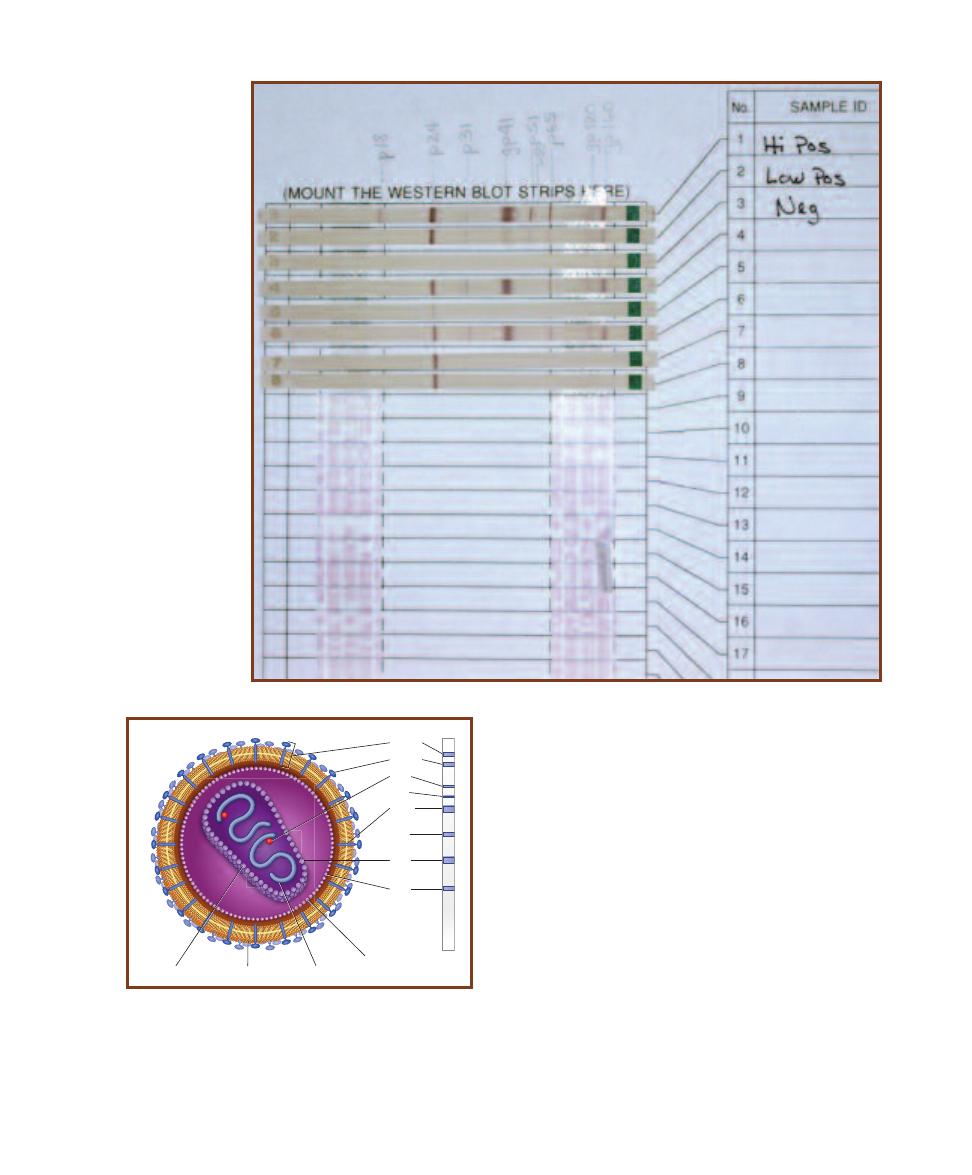
108
䢇
A Photographic Atlas for the Microbiology Laboratory
8-19
D
ETAIL OF
HIV
W
ESTERN
B
LOT
S
TRIPS
These
are the same strips as in Figure
8-18 to show the banding pattern
more clearly. Above the strips
are handwritten codes identify-
ing each HIV protein blotted. The
“p” and “gp” in each refers to
protein and glycoprotein, re -
spectively. The numbers are
the molecular weight of each
protein. Notice that the smaller
proteins are at the left. During
electrophoresis, smaller proteins
migrate faster than bigger ones.
Based on that, these proteins
migrated from right to left.
gp160
gp120
p65
p51
gp41
p31
p24
p18
Matrix
protein
Capsid
Envelope
RNA
8-20
S
CHEMATIC
D
IAGRAM OF
HIV
HIV is an enveloped
retrovirus with virus-specific glyco proteins extending from it
as spikes. The spikes are used for attachment to cells with the
CD4 protein (such as Helper-T cells). There are also matrix
and capsid proteins. Inside the capsid are two copies of its
RNA with each attached to a reverse transcriptase enzyme.
To the right is a drawing of a Western blot strip with each
band labeled to indicate the HIV antigen to which it corre-
sponds. The location of each band protein in the virus is also
shown.
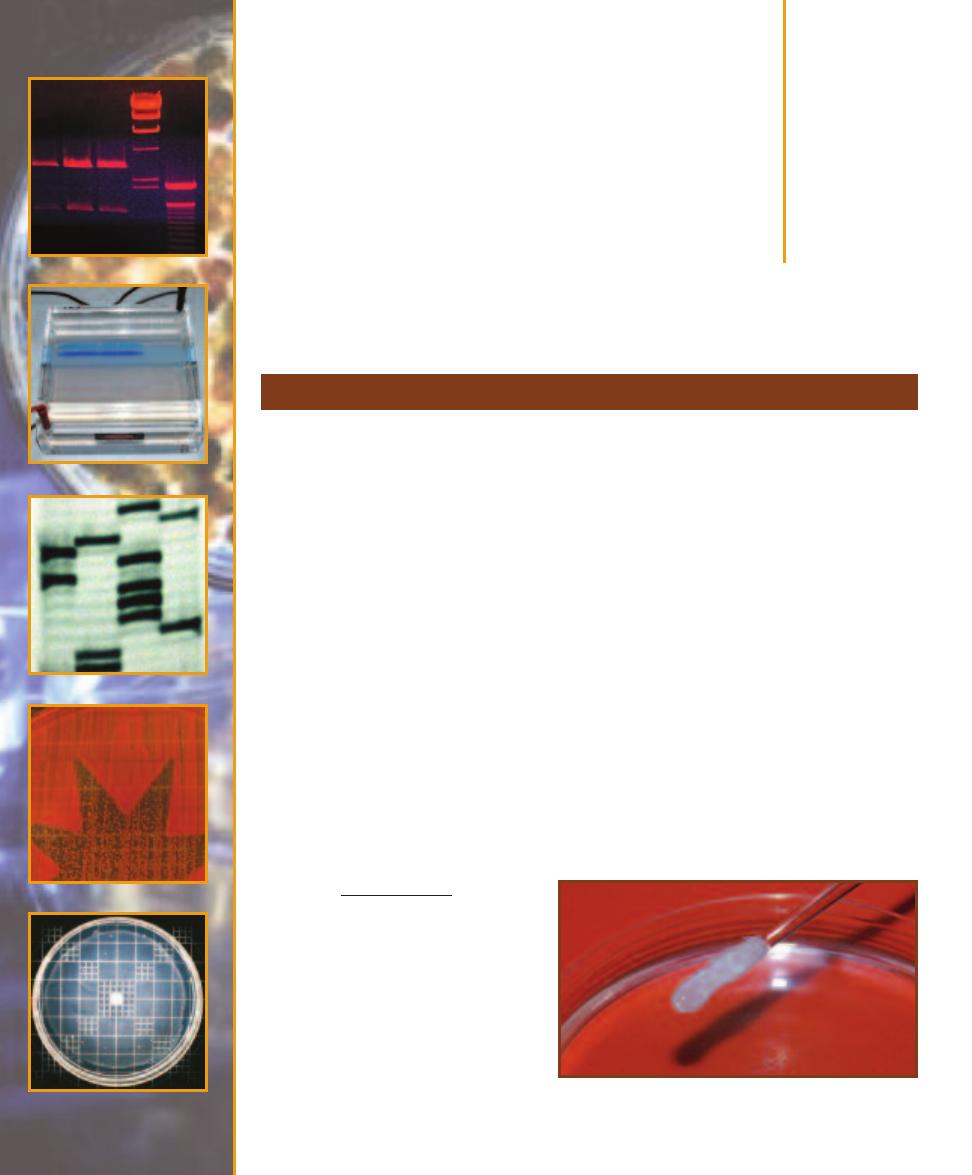
Molecular
Techniques
䢇
Purpose
DNA extraction is a starting point for many lab procedures, including DNA sequencing and
cloning.
䢇
Principle
DNA extraction from cells is surprisingly easy and occurs in three basic stages:
1
First, a detergent (e.g., Sodium Dodecyl Sulfate—SDS) is used to lyse cells and release cellular
contents, including DNA.
2
This is followed by a heating step (at approximately 65–70°C) that denatures protein (including
DNases that would destroy the extracted DNA) and other cell com ponents. Temperatures
higher than 80°C will denature DNA, and this is undesirable. A protease may also be added to
remove proteins (other techniques for purification may also be used).
3
Finally, the water-soluble DNA is precipitated in cold alcohol as a whitish, stringy mass (Figure
9-1).
After extraction, an ultraviolet spectrophotometer (Figure 9-2) can be used to estimate DNA
concentration in the sample by measuring absorbance at 260 nm, the optimum wavelength for ab-
sorption by DNA. An absorbance of A
260nm
of 1 corresponds to 50 µg/mL of double-stranded DNA
(dsDNA). Reading absorbance at 280 nm and calculating the following ratio can determine purity
of the sample:
Absorbance
260nm
Absorbance
280nm
If the sample is reasonably pure nu-
cleic acid, then the ratio will be about
1.8 (between 1.65 and 1.85). Because
protein absorbs maximally at 280 nm, a
ratio of less than 1.6 is likely due to pro-
tein contamination. If purity is crucial,
then the DNA extraction is repeated. If
the ratio is greater than 2.0, the sample
is diluted and read again.
DNA Extraction
9
S E C T I O N
109
9-1
E
UKARYOTIC
DNA
This onion DNA has been extracted
and spooled onto a glass rod.
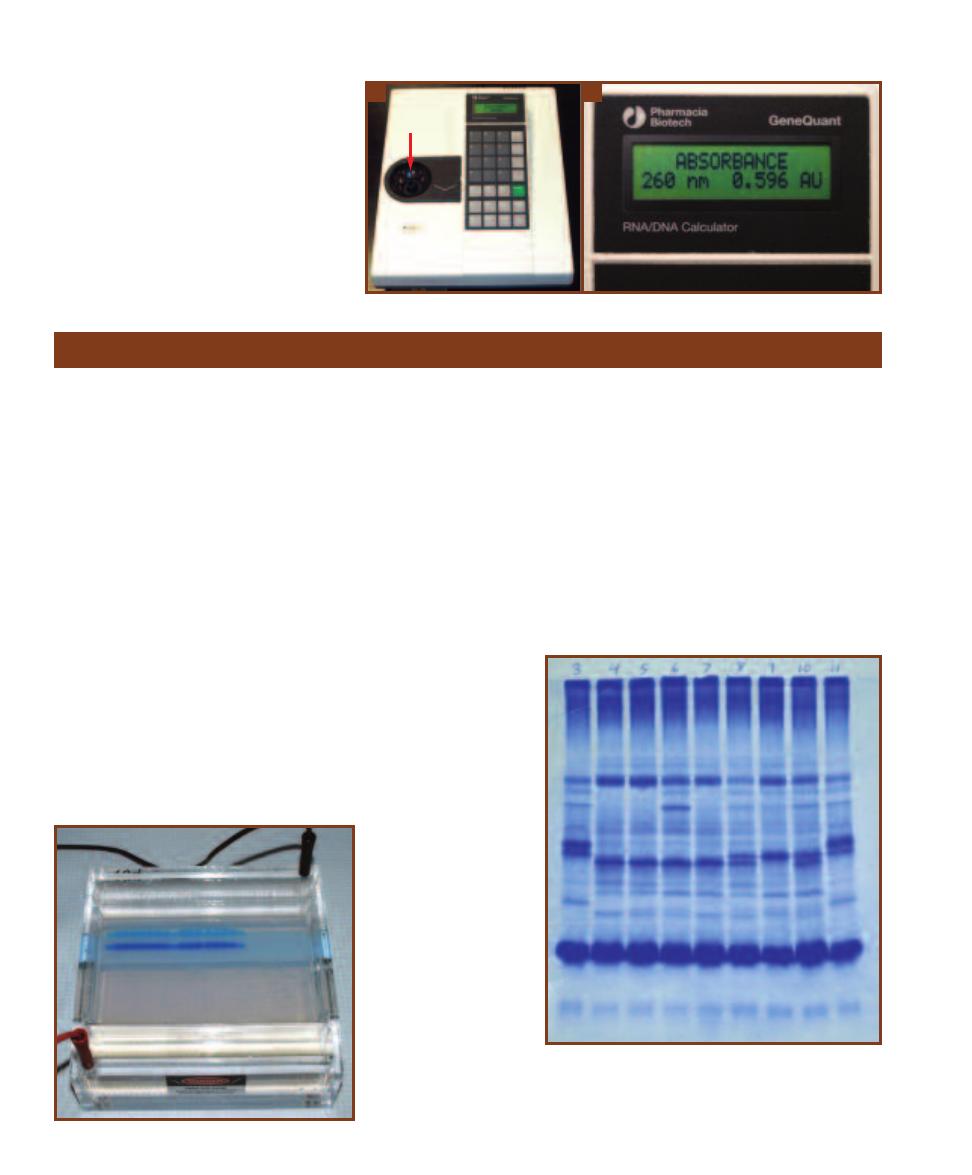
110
䢇
A Photographic Atlas for the Microbiology Laboratory
A
B
䢇
Purpose
Electrophoresis is a technique in which molecules are sepa-
rated by size and electrical charge in a gel. Once separated,
the gel can be used in a number of ways. Protein or nucleic
acid patterns can be compared for taxonomic or identifica-
tion purposes. Separated molecules can be removed from
the gel and used in biochemical studies. Other techniques,
such as DNA fingerprinting and Southern, Western, and
Northern blotting, begin with electrophoresis.
䢇
Principle
Electrophoresis gels are typically prepared from agarose or
polyacrylamide, depending on the molecules to be separated.
Agarose is used for large DNA molecules and polyacryla mide
is used for small DNA molecules and proteins. In preparation
for the procedure the gel is cast as a thin slab containing
tiny wells at one end and placed in a buffered solution to
maintain proper electrolyte balance (Figure 9-3). Precast gels
are also available. Samples to be examined (either nucleic
acid or protein) are loaded into the different wells and elec-
trodes are attached to create an electrical field in the gel.
Under the influence of the electrical field molecules in
the samples migrate through the gel. Because of their nega-
tive charges, both proteins and DNA migrate toward the
positive pole. The molecules travel different distances due
to differences in size and electrical charge. At the end of the
run, the gel is stained to show the location of the separated
molecules as bands in each lane. Coomassie blue is com-
monly used for protein (Figure 9-4), whereas ethidium
bromide, a fluorescent dye, can be used for nucleic acids
(Figure 9-5). If the nucleic acid has been radioactively
labeled, the gel can be placed on X-ray film. Radioactivity
from the bands exposes the film, as in Figure 9-6, to produce
an autoradiograph.
Electrophoresis
9-3
E
LECTROPHORESIS
G
EL
A
PPARATUS
This
agarose gel is being used to
separate DNA fragments.
The fragments are running
toward the bottom of the
photo. The blue dye is at
the front and lets the oper-
ator know when to stop
running the gel.
9-4
P
OLYACRYLAMIDE
G
EL
E
LECTROPHORESIS
(PAGE)
OF
P
ROTEIN
This polyacrylamide gel of serum proteins from
several lemur species illustrates staining with Coomassie
blue. Migration was from top to bottom.
9-2
U
LTRAVIOLET
S
PECTRO PHOTOMETER
A
A UV
spectro photometer can be used to determine DNA
concentration. A quartz cuvette is shown in the
sample port (
arrow).
B
This specimen has an A
260nm
of 0.596 absorbance units. Since an A
260nm
of 1.0 is
equal to 50 µg/mL of dsDNA, this specimen has a
concentration of 29.8 µg/mL. Absorb ance also can
be used to determine purity of the sample. A rela-
tively pure DNA sample will have an A
260nm
/A
280nm
value of 1.8.
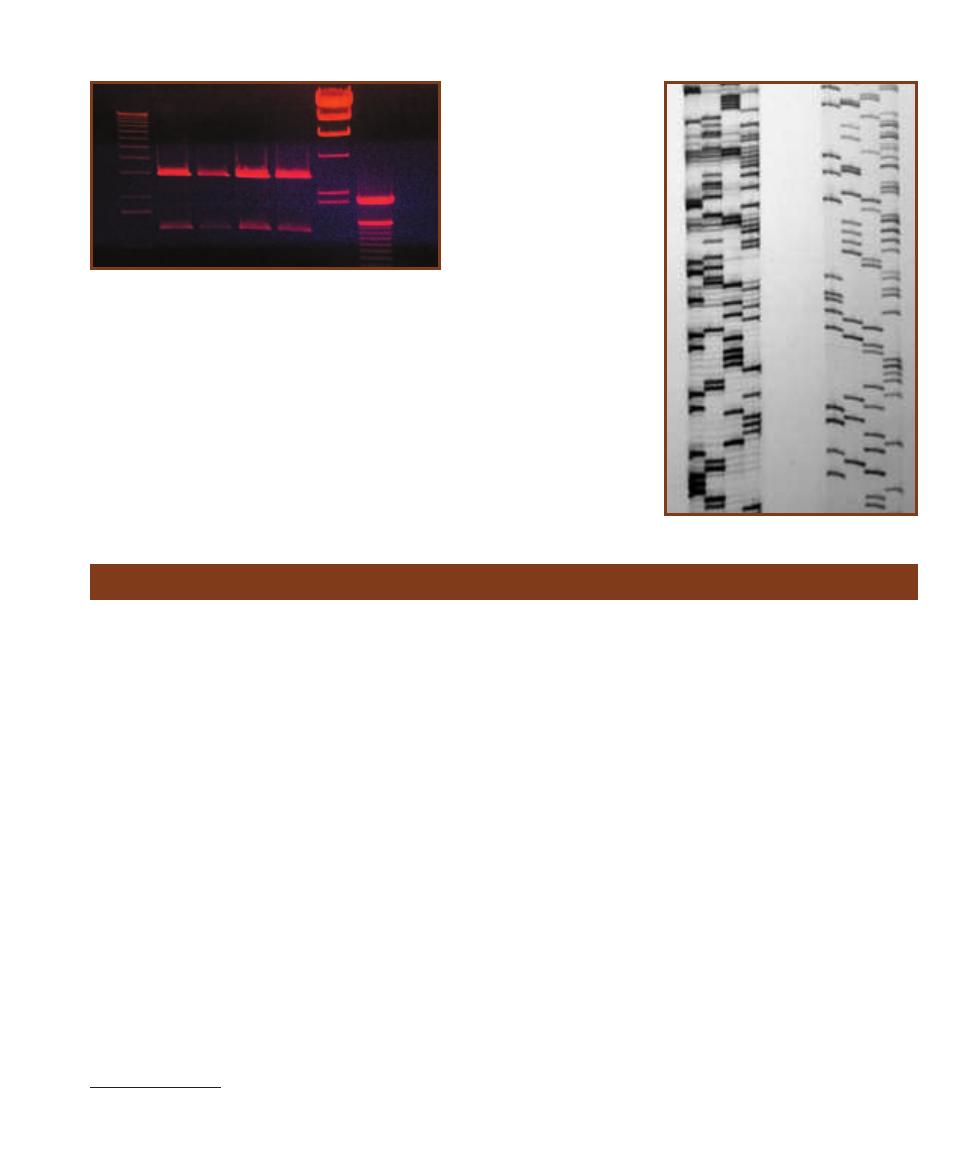
SECTION 9
䢇
Molecular Techniques
䢇
111
9-5
E
THIDIUM
B
ROMIDE
S
TAIN OF A
G
EL
This agarose gel
was used to separate DNA fragments and to determine their
sizes. The first, sixth, and seventh lanes are DNA fragment
samples of known sizes. The first lane forms a 1 Kilobase (Kb)
“ladder” in which the slowest fragment is 12,216 bp (base pairs)
in length and the fastest visible fragment is 1,636 bp. (Other
smaller fragments are too faint to be seen in this gel.) In Lane
6, the fragments range in size from 23,130 bp to 2,027 bp. In
Lane 7, the range is 2,072 bp to 100 bp. The distance migrated
by the fragments of known size is then compared to those in
the specimen samples found in lanes two through four to esti-
mate their size.
1
2
3
4
5
6
7
9-6
A
UTO RADIOGRAPH OF
DNA
IN AN
A
GAROSE
G
EL
This shows a portion of an
autoradio graph produced
from a gel used in DNA
sequencing. The radio actively
labeled DNA fragments were
separated by size under the
influence of an electrical field.
Migration of the samples was
from top to bottom. The bands
were visualized by placing
the gel on X-ray film and
allowing the radioactivity to
expose it. The smaller, faster
molecules are at the bottom
of the autoradiograph.
Polymerase Chain Reaction
䢇
Purpose
The polymerase chain reaction (PCR)
1
is a relatively simple
and convenient method of amplifying (copying) even as little
as one molecule of DNA. Once multiple copies of the DNA
are made, they can be used in various ways ranging from
research, diagnostics, and forensics.
䢇
Principle
The polymerase chain reaction (PCR) is a technique con-
ceived by the 1993 Chemistry Nobel Laureate Kary Mullis.
This process is designed to make multiple copies of (amplify)
a desired gene or other short DNA fragment. In the process,
the double-stranded DNA sequence to be amplified (the
template) is separated with heat and then replicated using
free nucleotides, two commercially prepared primers, and
a polymerase. The primers (short nucleic acid molecules)
are selected to be complementary to positions on opposite
strands of the DNA molecule. The points at which they attach
flank the area to be replicated. DNA Polymerase is then able
to attach the free nucleotides to complementary bases on the
template and make the desired copy (Figure 9-7).
The PCR process involves 20 to 40 cycles of three
different activities: denaturation (DNA strand separation),
annealing (of primers), and extension (DNA replication). In
denaturation, the temperature of the reaction tube is raised
to 92–96°C for one to a few minutes to separate the DNA
strands. Following this, the temperature is lowered to
45–65°C, which allows the primers to anneal to their com-
plementary sequences on opposite template strands. For the
extension phase, the tem perature is raised to 72°C, for a
few seconds to a few minutes, to allow the polymerase to
synthesize DNA complementary to the template (elongate
primer). This process is performed automatically by a
thermo cycler programmed by the lab worker (Figure 9-8).
This completes the first cycle of amplification. The
process then repeats itself, but this time there are four tem-
plate strands to replicate and the result is eight strands of
DNA (four dsDNA molecules). By continuing the process
and using the products of one cycle as templates for the next
cycle, the number of DNA target strands doubles each cycle
and can be amplified a million-fold, all in a few hours. (For
20 cycles, each strand will be replicated 2
20
⳱
1,048,576
times!) As mentioned above, two primers are used in the
reaction, but they must be added to the PCR reaction
mixture in great excess to flood the mixture and promote
primer-DNA annealing and to discourage DNA-DNA re-
annealing. Other essential com ponents of the mixture include
sufficient quan tities of free deoxyribonucleotides (dATP,
dCTP, dTTP, and dGTP) needed for extension, buffers to
1
PCR was conceived by Kary Mullis in 1983 and resulted in his being awarded
the 1993 Nobel Prize in Chemistry.
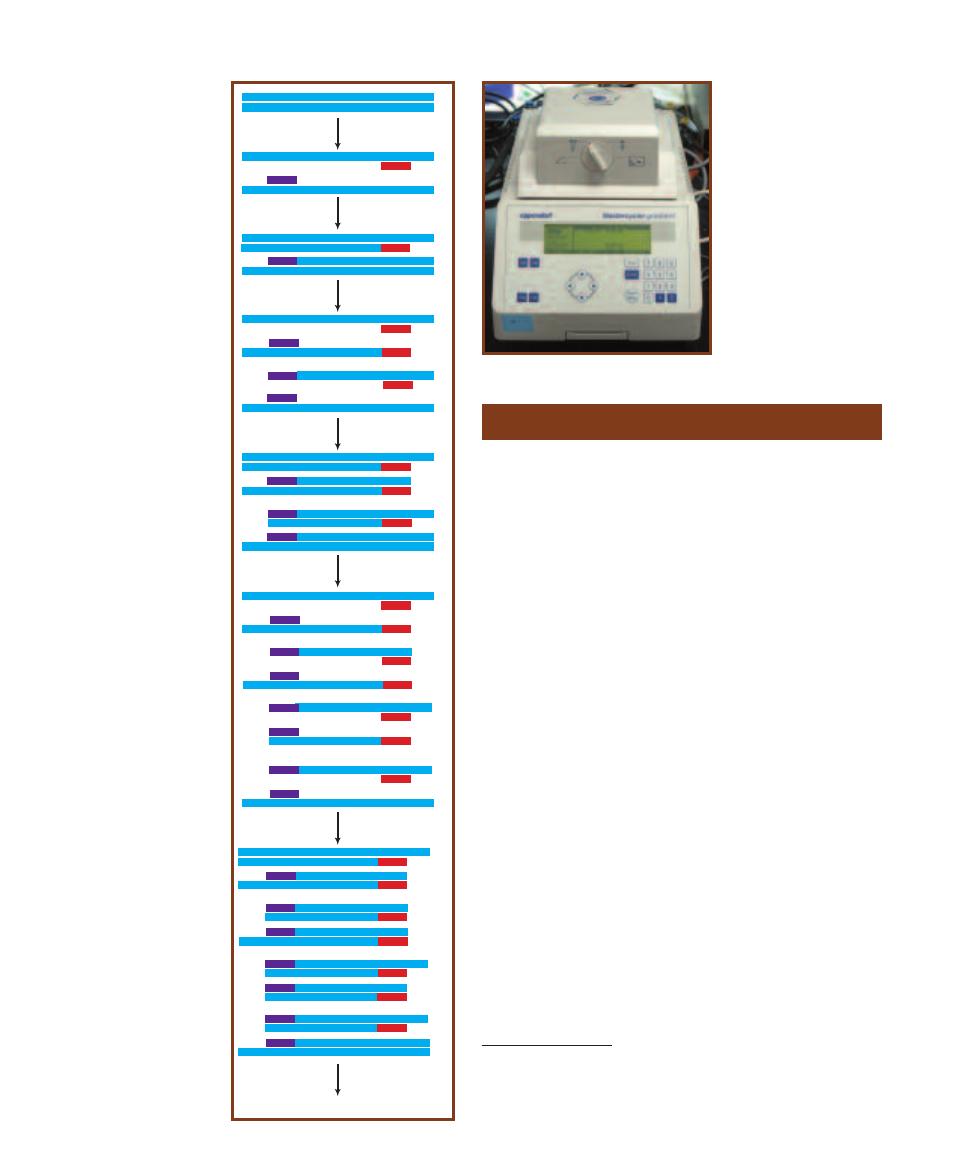
maintain the appropriate
pH, mag nesium required
by the polymerase, and
other salts to create the
proper osmotic balance.
Because of the high tem -
peratures required for
the de naturation phase,
the thermotolerant
TaqDNA polymer ase,
isolated from the
thermophile Thermus
aquaticus (page 124),
is used to catalyze the
extension.
112
䢇
A Photographic Atlas for the Microbiology Laboratory
Denature DNA
Anneal Primers
Denature DNA
Anneal Primers
1
1
1
2
1
2
1
2
2
1
1
3
1
2
3
2
3
3
1
3
1
2
3
2
3
1
3
4
1
3
4
2
4
4
3
4
3
4
4
3
2
4
1
4
1
3
4
2
4
4
3
4
3
2
4
4
3
1
4
Denature DNA
Anneal Primers
Continue Cycles
Elongate Primers
Elongate Primers
Elongate Primers
9-7
S
CHEMATIC
D
IAGRAM
OF
PCR
Each PCR cycle
doubles the amount of DNA
in the sample. The numbers on
the strands give generations
of DNA. In this example, three
replication cycles are shown,
in which 2 original strands
are amplified to a total of 16
strands.
DNA Sequencing
䢇
Purpose
The key to unlocking the secrets of DNA function lies in
determining its nucleotide sequence. Structural genes can be
examined for normal sequence and mutations can be identi-
fied. Comparing DNA sequences has uncovered information
about what defines certain nonstructural segments of DNA,
such as promoters, operators, and introns. It is also useful
in comparing relatedness between organisms by comparing
similarity of homologous genes.
䢇
Principle
In vivo DNA synthesis requires a template strand, a primer,
DNA polymerase, and a pool of all four deoxyribonucleo -
tide triphosphates
2
(dATP, dCTP, dTTP, and dGTP) (Figure
9-9A). The primer binds to the template, then DNA poly-
merase adds nucleotides to the 3⬘ hydroxyl of the primer
(and each subsequent nucleotide as the chain grows) in the
order determined by base pairing with the template strand.
The new bond is between the 5⬘ phosphate of the next nu-
cleotide and the 3⬘ hydroxyl of the replicated strand.
Frederick Sanger’s dideoxy method of DNA sequencing
involves in vitro synthesis of DNA strands complementary
to the DNA template being sequenced. Multiple copies of
the template, plus all four dNTPs, and radioactively or
fluorescently labeled primers are added to four tubes. Then,
each tube receives one ddNTP (Figure 9-9B); that is, one
tube gets ddATP, another ddTTP, etc. In vitro replication is
then allowed to occur in all four tubes (Figure 9-10). Since a
ddNTP lacks the 3⬘ hydroxyl of a “normal” dNTP, the next
9-8
A T
HERMOCYCLER
Temperatures and durations
of each phase can be pro-
grammed into the thermo -
cycler to automate PCR.
2
Deoxyribonucleotides are incorporated into the growing DNA chain by re-
moval of the two phosphates to produce the nucleotide structure as it is found
in the DNA chain; that is, the sugar, phosphate, and nitrogenous base. (Removal
of the two phosphates provides the energy required for DNA synthesis.) . The
symbol dNTP is used to designate any of the four deoxyribonucleotides.
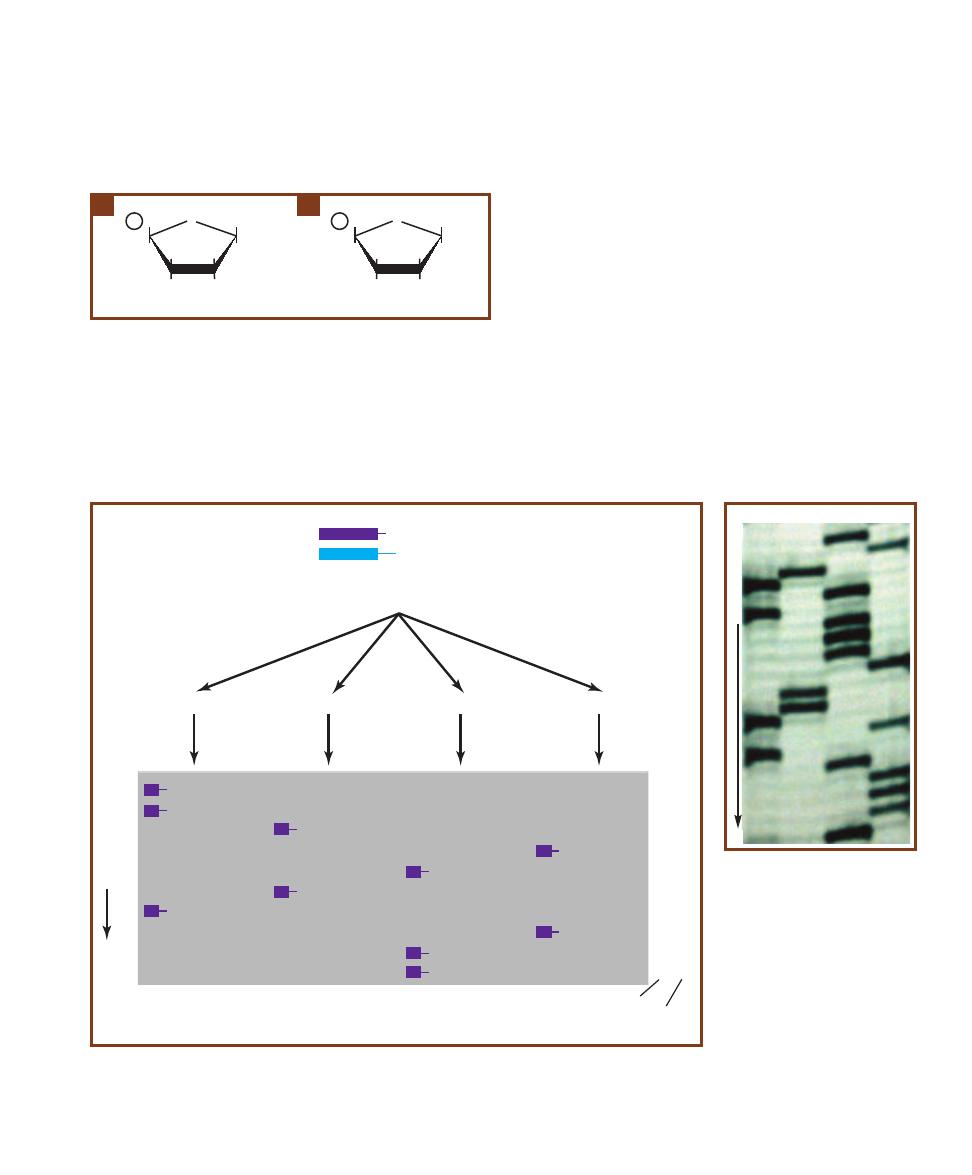
nucleotide in the sequence cannot be added and elongation
of the DNA strand stops. If the proper ratio of the normal
dNTP to ddNTP is used (about 10:1), then replicated
DNA strands of all lengths ending with that ddNTP will
be produced in each tube. Electrophoresis of these fragments
separates them by size, with the smallest traveling the farthest.
The sequence is then read directly from the auto radiogram
(see Electrophoresis, page 110) beginning with the smallest
fragment (which consists of the primer at the 5⬘ end plus the
first ddNTP) up through the slowest fragment (consisting of
the 5⬘ primer plus the entire length of the DNA strand being
synthesized) (Figure 9-11). Note that the sequence given by
this method is actually complementary to the DNA template.
This method has now been automated. Instead of label-
ing the primer, each of the four ddNTPs is labeled with a
fluorescent molecule that produces a different color. In this
method, all four ddNTPs can be mixed into one tube, since
the fragments will be labeled with a different color depend-
ing on their terminating ddNTP. Electrophoresis is done in a
tube through which a laser beam is passed. As each fragment
migrates past the laser beam during electrophoresis, it emits
the color appropriate to its ddNTP. The color is recorded
and the nucleotide sequence is determined from the color
sequence.
SECTION 9
䢇
Molecular Techniques
䢇
113
H
1'
O
P -CH
3
H
Nitrogenous
Base
H
OH
H
H
3'
2'
4'
5'
Deoxyribonucleotide
H
1'
O
P -CH
3
H
Nitrogenous
Base
H
H
H
H
3'
2'
4'
5'
Dideoxyribonucleotide
9-9
N
UCLEOTIDE
S
TRUCTURE
A
A deoxyribonucleotide as it is found
in DNA consists of deoxyribose sugar, a phosphate, and one of four ni-
trogenous bases: thymine, adenine, cytosine, and guanine. Nucleotides
are identified by the base they possess (dA, dC, dG, and dT). As added
to the reaction mixture, this nucleotide would have three phosphates
rather than just one.
B
A dideoxyribonucleotide differs only in the absence
of a hydroxyl group at the 3’ carbon. Since it is the 3’-OH that is used to
connect adjacent nucleotides, incorporation of a dideoxyribonucleotide
acts as a “cap” and prevents further elongation of the nucleotide chain.
A
B
5'
3'
Primer
Template
OH
GGATCGACTT
+
dATP, dGTP, dCTP, dTTP
ddCTP
ddTTP
ddGTP
10
9
8
7
6
5
4
3
2
1
5'
A
A
G
T
C
G
A
T
C
C
3'
ddATP
CCTAGCTG
ddA
CCT
ddA
CCTAGCTGA
ddA
CCTA
ddG
CCTAGCT
ddG
ddC
C
ddC
CCTAG
ddC
CC
ddT
CCTAGC
ddT
3'
T
T
C
A
G
C
T
A
G
G
5'
Electrophoresis
and
Autoradiography
in vitro
Replication of
the Template
with ddNTP
Nucleotide sequence determined from gel
Number of
nucleotides
in fragment
Nucleotide sequence of template strand
(compare with template at top)
M
IG
R
A
T
IO
N
9-10
T
HE
S
ANGER
D
IDEOXY
M
ETHOD OF
DNA S
EQUENCING
The Sanger method produces DNA frag-
ments of all possible lengths due to chain termination by ddNTPs in their respective tubes. After electrophoresis
of all samples, the band pattern is read to determine the DNA sequence complementary to that of the original
DNA strand.
9-11
A
UTORADIO GRAPH
The
smaller, faster fragments are at the
bottom of this autoradio graph. The
four lanes allow determination of
nucleo tide sequence, with the
lanes containing (from left to right)
fragments ending in ddA, ddG, ddC,
and ddT nucleotides. The actual gel
is much larger than this, but the
nucleotide sequence in the region
shown is: 5’CTGACACCCTGGAT-
ACTTTC3’, which corresponds to
3’GACTGTGGGACCTATGAAAG3’
in the template strand.
5’
3’
M
IG
R
A
T
IO
N
A
G
C
T
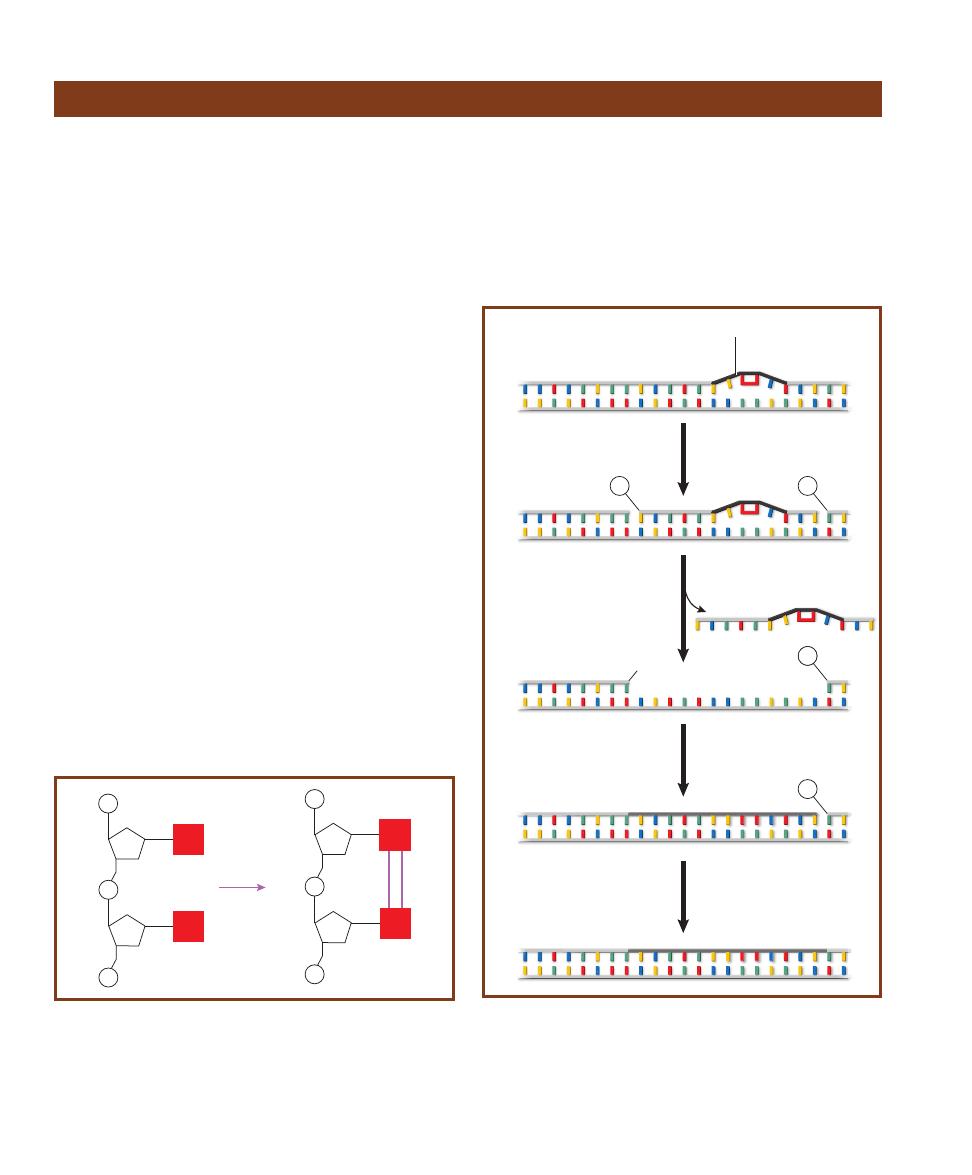
114
䢇
A Photographic Atlas for the Microbiology Laboratory
Ultraviolet Radiation Damage and Repair
䢇
Purpose
Because ultraviolet radiation has a lethal effect on bacterial
cells, it can be used as a sterilizing agent. However, its use
is limited because it penetrates materials such as glass and
plastic poorly. In addition, bacterial cells have mechanisms
to repair UV damage.
䢇
Principle
Ultraviolet radiation is part of the electromagnetic spectrum,
but with shorter, higher energy wavelengths than visible
light. Prolonged exposure can be lethal to cells because when
DNA absorbs UV radiation at 254 nm, the energy is used
to form new covalent bonds between adjacent pyrimidines:
cytosine-cytosine, cytosine-thymine, or thymine-thymine.
Collectively, these are known as pyrimidine dimers, with
thymine dimers being the most common. These dimers dis-
tort the DNA molecule and interfere with DNA replication
and transcription (Figure 9-12).
Many bacteria have mechanisms to repair such DNA
damage. Escherichia coli performs light repair or photo -
reactivation, in which the repair enzyme, DNA photolyase,
is activated by visible light (340–400 nm) and simply mono -
merizes the dimer by reversing the original reaction. A second
E. coli repair mechanism, excision repair or dark repair,
involves a number of enzymes (Figure 9-13). The thymine
dimer distorts the sugar-phosphate backbone of the strand.
This is detected by an endonuclease (UvrABC) that breaks
two bonds—one eight nucleotides in the 5⬘ direction from
the dimer, the other four nucleotides in the 3⬘ direction.
A helicase (UvrD) removes the 13-nucleotide fragment
(including the dimer), leaving single stranded DNA. DNA
polymerase I inserts the appropriate complementary nucleo -
tides in a 5⬘ to 3⬘ direction to make the molecule double
stranded again. Finally, DNA ligase closes the gap between
the last nucleotide of the new segment and the first nucleo -
tide of the old DNA, and the repair is complete. Both mech-
anisms are capable of repairing a small amount of damage,
P
P
P
S
T
T
UV
S
P
P
P
S
T
T
S
9-12
A T
HYMINE
D
IMER IN
O
NE
S
TRAND OF
DNA
Thymine
dimers form when DNA absorbs UV radiation with a wavelength of
254 nm. The energy is used to form two new covalent bonds between
the thymines, resulting in distortion of the DNA strand. The enzyme
DNA photolyase can break this bond to return the DNA to its normal
shape and function. If it doesn’t, and excision repair fails, the distortion
interferes with DNA replication and transcription.
3’
5’
5’
3’
3’
5’
5’
3’
DNA lesion
E. coli
Endonuclease
(UvrABC)
DNA helicase
(UvrD)
13 nucleotide segment
DNA polymerase I
DNA ligase
3’
5’
5’
3’
P
P
1.
2.
3.
4.
3’
5’
5’
3’
P
P
3’
5’
5’
3’
OH
9-13
E
XCISION OR
D
ARK
R
EPAIR IN
E.
COLI
In the repair process,
four enzymes are used: (1) An endonuclease (UvrABC) to break two
covalent bonds in the sugar-phosphate backbone of the damaged
strand, (2) a helicase (UvrD) to remove the nucleotides in the damaged
segment, (3) DNA polymerase I to synthesize a new strand, and (4) DNA
ligase to form a covalent bond between the new and the original
strands.

but long and/or intense exposures to UV produce more
damage than the cell can repair, thus making UV radiation
lethal.
Figure 9-14 shows a sample plate inoculated with Serratia
marcescens and exposed to UV radiation for 30 seconds.
During exposure, this Petri dish lid was removed and a piece
of posterboard with a star cut out of it was placed over the
dish.
SECTION 9
䢇
Molecular Techniques
䢇
115
Ames Test
䢇
Purpose
Many substances that are mutagenic to bacteria are also
carcinogenic to higher animals. The Ames Test is a rapid,
inexpensive means of using specific bacteria to evaluate the
mutagenic properties of potential carcinogens. There are
many variations on the basic Ames Test that are used in
specific applications.
䢇
Principle
Bacteria that are able to enzymatically synthesize a particular
necessary biochemical (such as an amino acid) are called
prototrophs for that biochemical. If the bacterial strain can
make the amino acid histidine, for instance, it is classified as
a histidine prototroph. Bacteria that must be supplied with
that biochemical (e.g., histidine) are called (histidine) auxo -
trophs. Auxotrophs are typically created from prototrophs
when a mutation occurs in the gene coding for an enzyme
used in the pathway of the biochemical’s synthesis.
The Ames Test employs mutant strains of Salmonella
typhimurium that have lost their ability to synthesize histidine.
One strain of histidine auxotrophs possesses a frame shift
mutation. That is, they are missing one or have an extra
nucleotide in the DNA sequence that would otherwise code
for an enzyme necessary for histidine production. Other
strains are substitution mutants, in which one nucleo tide
in the histidine gene has been replaced, resulting in a faulty
gene product.
The Ames Test determines the ability of chemical agents
to cause a reversal—a back mutation—of these auxotrophs
to the original prototrophic state. In this test histidine
auxo trophs are spread onto minimal agar plates that con-
tain all nutrients for growth, but only a trace of histidine.
Complete agar differs from minimal agar only in that it
contains histidine.
When a filter paper disk saturated with a suspected
mutagen is placed in the middle of an inoculated minimal
agar plate, the substance will diffuse outward into the
medium. If it is mutagenic, it will cause back mutation in
some cells (converting them to histidine prototrophs) that
freely grow into full-size colonies. (Note: histidine is initially
included in the medium to allow the auxotrophs to grow
for several generations and expose them to the effects of the
mutagen. The unmutated auxo trophs typically exhibit faint
growth, but do not develop into full-size colonies due to the
rapid exhaustion of the histidine.)
Several variations of the Ames test are possible. This
example uses two minimal agar plates and two complete agar
plates (Figures 9-15 through 9-18). The complete medium
contains all of the nutrients necessary for Salmonella growth.
Each plate is inoculated with Salmonella histidine auxo -
trophs. One minimal agar plate and one complete agar plate
each receive a filter paper disk saturated with the test sub-
stance. The second minimal agar plate and complete agar
plate each receive a filter paper disk saturated with Dimethyl
Sulfoxide, DMSO (a substance known to be nonmutagenic).
The minimal agar plate containing the test substance
determines mutagenicity of the test substance. Only proto -
trophs will grow on minimal agar, so recovery of any colonies
on the minimal agar inoculated with auxotrophs is indicative
of back mutation. Depending on the strain used, the type
of back mutation (either frameshift or base substitution) can
9-14
S
AMPLE
P
LATE
This nutrient agar plate was inoculated
with Serratia marcescens. With the plate’s lid off, the plate was
covered with a posterboard mask with a star cut in it, and then
exposed to UV radiation for 30 seconds. Incubation was for 24
hours in the dark at 25°C. Notice the different amounts of growth
in the protected and unprotected areas of the plate. Colonies
inside the pattern have undergone DNA repair, but most cells in
that exposed region were killed. Regions of confluent growth
were protected from irradiation by the mask.
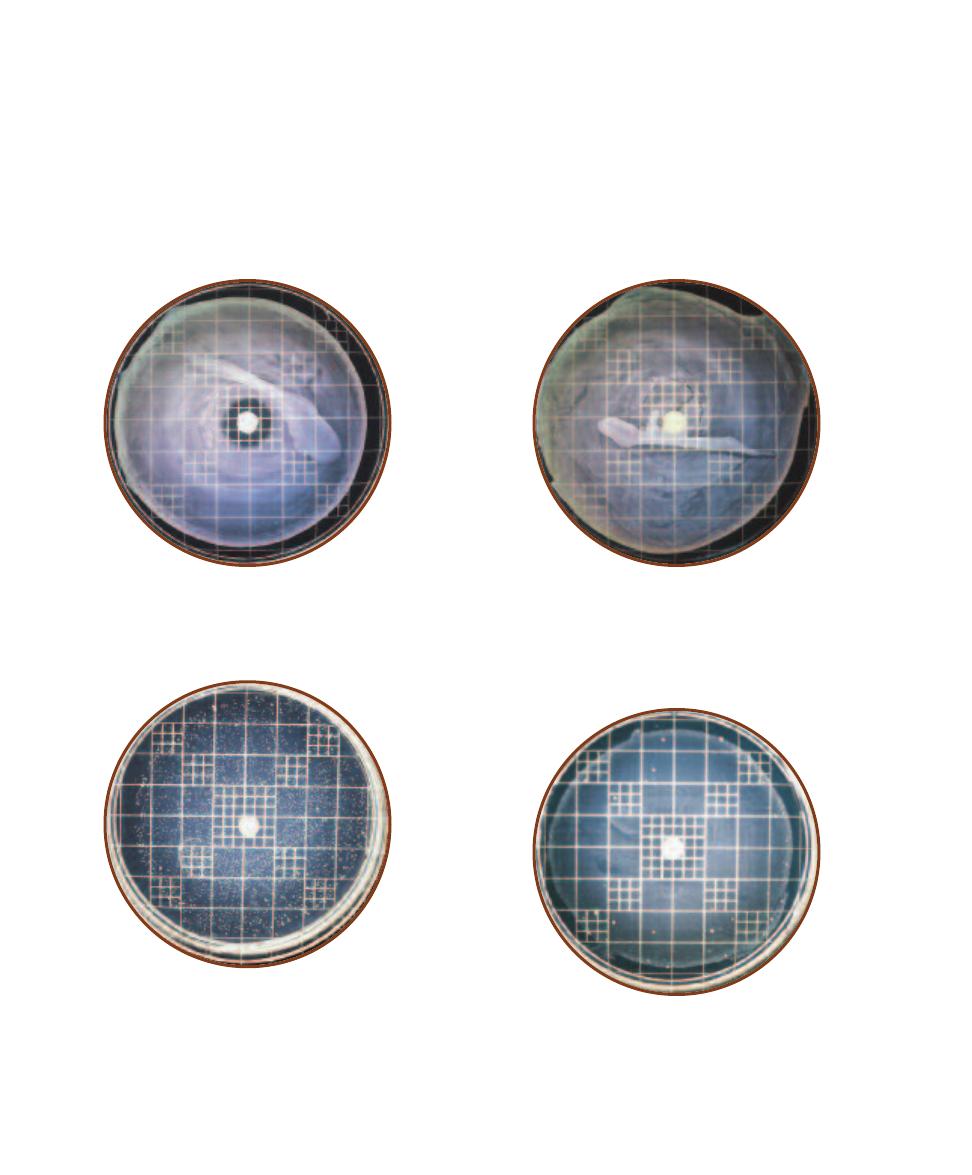
also be determined. The minimal agar plate with DMSO
serves as a control for the minimal agar/test substance plate
by measuring the spontaneous back mutations (natural
mutations that occur without the presence of a mutagen). In
order for the test substance to be considered mutagenic, it
must produce more back mutations than found on the con-
trol plate.
The purpose of the complete agar plate containing the
test substance is a control to evaluate toxicity of the test
substance. Creation of a zone of inhibition around the disk
indicates toxicity. The more toxic the substance is, the larger
the zone will be. If the substance is toxic, there may be no
indication of mutagenicity because the cells are killed before
they can back mutate. Finally, the complete agar plate con-
taining DMSO serves as a control for comparison to the
growth and zone of inhibition on the complete agar/test
substance plate.
116
䢇
A Photographic Atlas for the Microbiology Laboratory
9-15
T
ESTING FOR
T
OXICITY
Shown is a Salmonella histidine
auxotroph grown on complete agar (containing histidine) and ex-
posed to the test substance. The zone of inhibition around the paper
disk indicates toxicity of the substance.
9-16
T
OXICITY
C
ONTROL
The same Salmonella histidine aux-
otroph is grown on complete agar (containing histidine) and exposed
to an inert substance (DMSO). This plate serves as a control for com-
parison of zone size with the plate in Figure 9-15. The absence of a
zone around the disk indicates that neither the paper disk nor the
DMSO is toxic or inhibitory and that the zone in Figure 9-15 is due to
the test substance.
9-17
T
ESTING FOR
M
UTAGENICITY
In this example, the same
Salmonella histidine auxotroph is grown on histidine minimal agar
and exposed to a suspected mutagen introduced onto the plate by
the paper disk. A zone of inhibition is visible on this plate, but is not
as well defined as on complete agar because the growth is not as
dense. The number of colonies suggests that back mutations have
occurred. However, it is not known at this time whether or not they
are due to the effects of the test substance or to spontaneous muta-
tion, so comparison must be made with the plate in Figure 9-18.
9-18
C
ONTROL FOR
S
PONTANEOUS
M
UTATIONS
The same
Salmonella histidine auxotroph is grown on histidine minimal agar
and exposed to a known nonmutagen (DMSO). This plate is a control
to demonstrate spontaneous mutation for comparison with the plate
containing test substance shown in Figure 9-17. The faint background
growth is due to the small amount of histidine in the medium necessary
to promote initial growth.
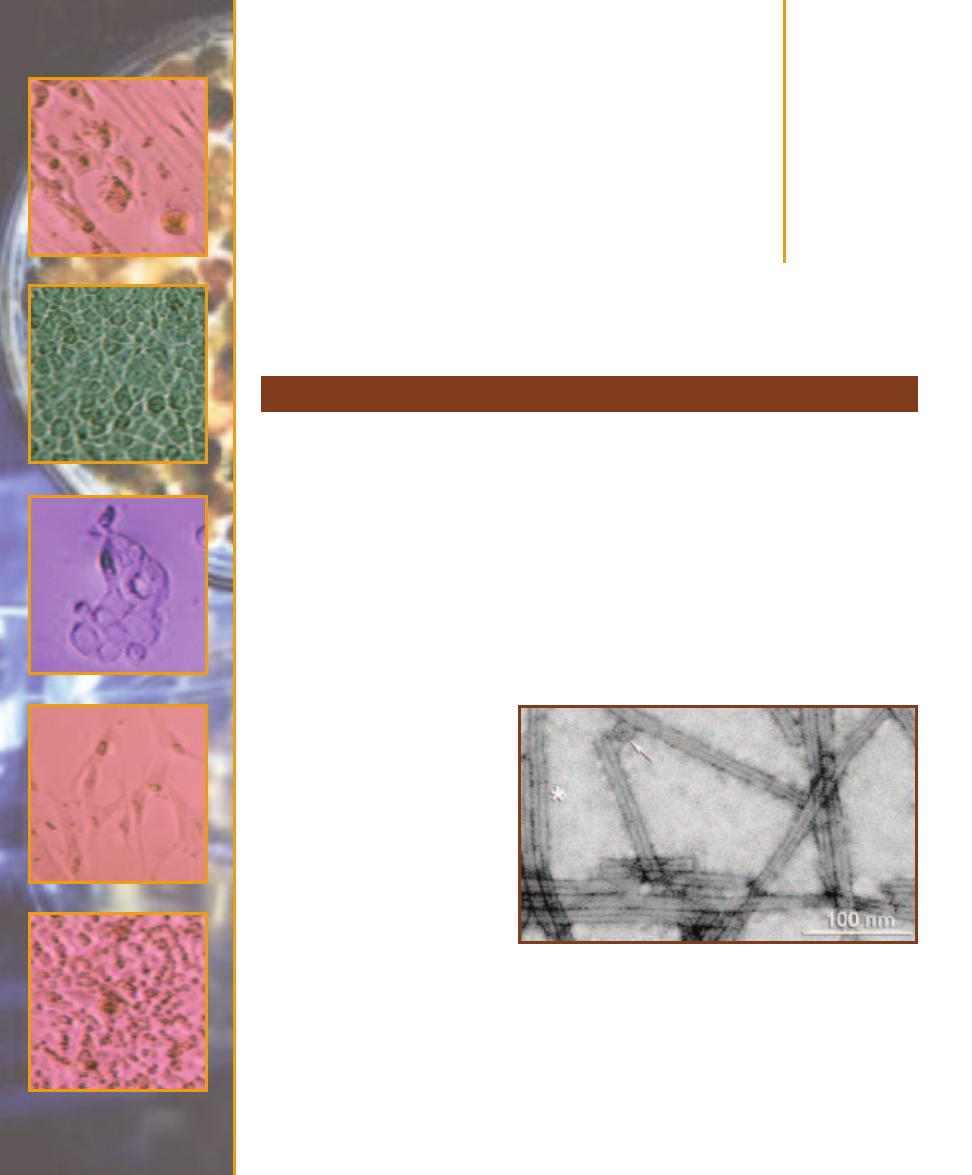
Viruses
In the opinion of most biologists viruses are not living. This is based primarily on the absence of
two major character istics associated with living things: viruses are not cellular and they have no
metabolism. On the other hand, they do exhibit heredity and are made of biochemicals. Proteins
form the structures and receptors of the virus particle (not cell!), and DNA or RNA (all cellular
organisms use DNA) is the hereditary material. And, whereas cells always possess both DNA and
RNA (for protein synthesis), viruses have only one or the other and use it as the genome. They are
also very small, usually much smaller than bacteria. They are capable of making more of themselves
(replication), but require a cellular host to do the work. As such, they are obligate intracellular
parasites. And, unlike cells that remain intact when they reproduce, viruses disassemble during
replication, then the progeny reassemble prior to release from the host—hence “viral replication”
rather than “viral reproduction.”
A virus particle consists minimally of a protein capsid surrounding its genome. The capsid is
one of two basic geometric shapes and is composed of protein subunits called capsomeres. Some
viruses have an icosahedral capsid with 20 triangular faces in which capsomeres combine to form
the faces. Others have a rod shape,
in which the capsomeres form a
helix and the genome is threaded
in the helical grooves (Figure 10-1).
Many viruses that infect bacteria,
called bacteriophages or simply
phages, have a complex structure
with a protein tail (Figures 10-2
and 10-3). It is not uncommon for
the virus to possess enzymes, but
they don’t have many. Most en-
zymes that are required for replica-
tion are encoded in the genome and
are made once inside the host cell.
Others (typically viruses that infect
animals) have an outer envelope
composed of membrane obtained
from the host cell upon release.
Viral replication involves the
same basic stages, regardless of the
host. These are: attachment to the
host, pene tration into the host,
Introduction to Viruses
10
S E C T I O N
117
10-1
T
OBACCO
M
OSAIC
V
IRUS
TMV is the causative agent of
tobacco mosaic disease. The virions are rod shaped and are composed
of 2130 capsomeres arranged around a central canal (the dark line in
each virion). Striations of the helix are faintly visible at the asterisk (*).
These virions are approximately 400 nm long and 15 nm in diameter.
Assembly of the TMV capsid involves addition of disk-like subassem-
blies consisting of two layers of 17 capsomeres each. These assume a
“lock washer” shape when associated with the ⳭssRNA genome and
integrate into the growing capsid. A disk (or at least a cross section) of
a virion is indicated by the arrow.
Photograph by the author
taken at the San Diego State University Electron Microscope Facility
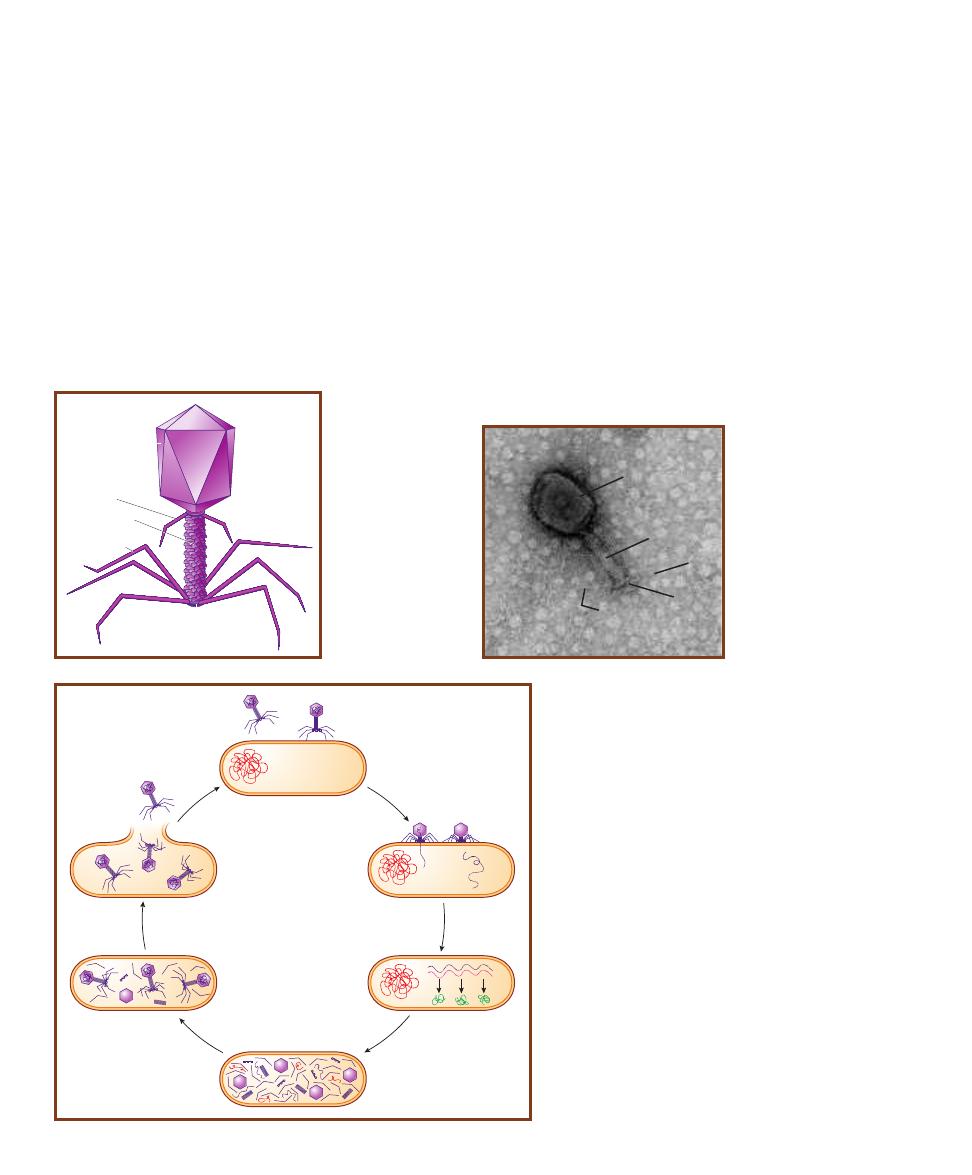
uncoating of the genome, genome replication and synthesis
of viral proteins, assembly of progeny, and release. Figure
10-4 illustrates the replicative cycle of bacteriophage T4.
The viral genome is either DNA or RNA. Further, some
DNA viruses have double-stranded DNA (dsDNA), whereas
others have single-stranded DNA (ssDNA), which does not
exist in cells. RNA viruses can also have ssRNA or dsRNA.
David Baltimore devised a viral taxonomy based on viral
genome and the steps necessary to get information from the
genome to messenger RNA. By convention, mRNA is con-
sidered to be “+” sense. A strand of DNA or RNA comple -
mentary to it is considered “–” sense. There are six categories.
1
ⴐ
ssRNA viruses. The genome acts as messenger RNA.
A ⳮssRNA molecule is synthesized from the ⳭssRNA
and acts as the template for genome replication and
mRNA synthesis. Ex amples are poliovirus, hepatitis A
and C viruses, and West Nile virus.
2
ⴑ
ssRNA viruses. These viruses synthesize ⳭssRNA from
the genome that acts as mRNA and as a template for
genome replication. Examples include rabies virus, Ebola
virus, measles virus, mumps virus, and influenza A virus.
3
dsRNA viruses. The negative strand is used to produce
Ⳮ
ssRNA that acts as mRNA. Both strands are used as
templates for genome replication. Examples include ro-
tavirus (gastroenteritis) and reovirus (mild respiratory
and digestive symptoms).
4
dsDNA viruses. These viruses make mRNA and replicate
their genomes just as cells do. Examples include herpes
simplex viruses, variola virus (small pox), and human
papillomaviruses (cervical cancer and genital warts).
118
䢇
A Photographic Atlas for the Microbiology Laboratory
Capsid
Collar
Contractile
sheath
Tail fiber
Base plate
10-2
D
IAGRAM OF
T4 C
OLIPHAGE
Bac-
teriophages frequently
have a complex struc-
ture that includes the
capsid containing the
genome and a tail
with many parts. T4
has an icosahedral
capsid.
10-4
T4 P
HAGE
L
YTIC
C
YCLE
Shown is a simplified dia-
gram of the T4 coliphage’s replicative cycle. In
A
, an infective
T4 phage (left) is approaching its host, Escherichia coli. On the
right, the same phage is shown attached by its tail fibers to
specific receptors on E. coli. This is the attachment phase.
The E. coli chromosome is the red tangled line at the left of
the cell. On the left of
B
, T4 is in the process of injecting its
DNA (purple line) into E.coli. This is the penetration phase.
On the right, the entire phage genome is in the host. Removal
of viral genome from its capsid is uncoating. In
C
, phage
DNA is in the process of being transcribed into mRNA (red
line), which is then translated into phage proteins (squiggly
green lines). This is the synthesis phase and is performed by
E. coli under the direction of the phage DNA. Simultaneously,
phage DNA is being replicated, but this is not shown. Synthesis
leads to assembly of the phage progeny, shown in
D
and
E
,
where the capsid subunits come together to form the capsid
and into which the genome is inserted. The tail with all its
detailed parts also comes together and attaches to the capsid.
Note that host DNA has been degraded, but remains as short,
red lines. (This is important because occasionally E. coli DNA
is put into a viral capsid and is transferred to a new E. coli
host, providing it with new genes in a process called general -
ized transduction). In
F
, the fully assembled phages are
released as the cell bursts. At 37°C, this entire cycle can take
as little as 25 minutes and release a few hundred phage prog-
eny, each of which can repeat the process!
A
B
C
D
E
F
10-3
T4 C
OLIPHAGE
This is a negative stain of
one T4 phage particle.
Shown are the capsid (C),
tail (T), base plate (B), and
tail fibers (TF). The length
of this phage from base
plate to tip of capsid is
approximately 180 nm
(0.18 µm).
Photo by author taken at the
San Diego State University
Electron Microscope Facility
TF
C
T
TF
B
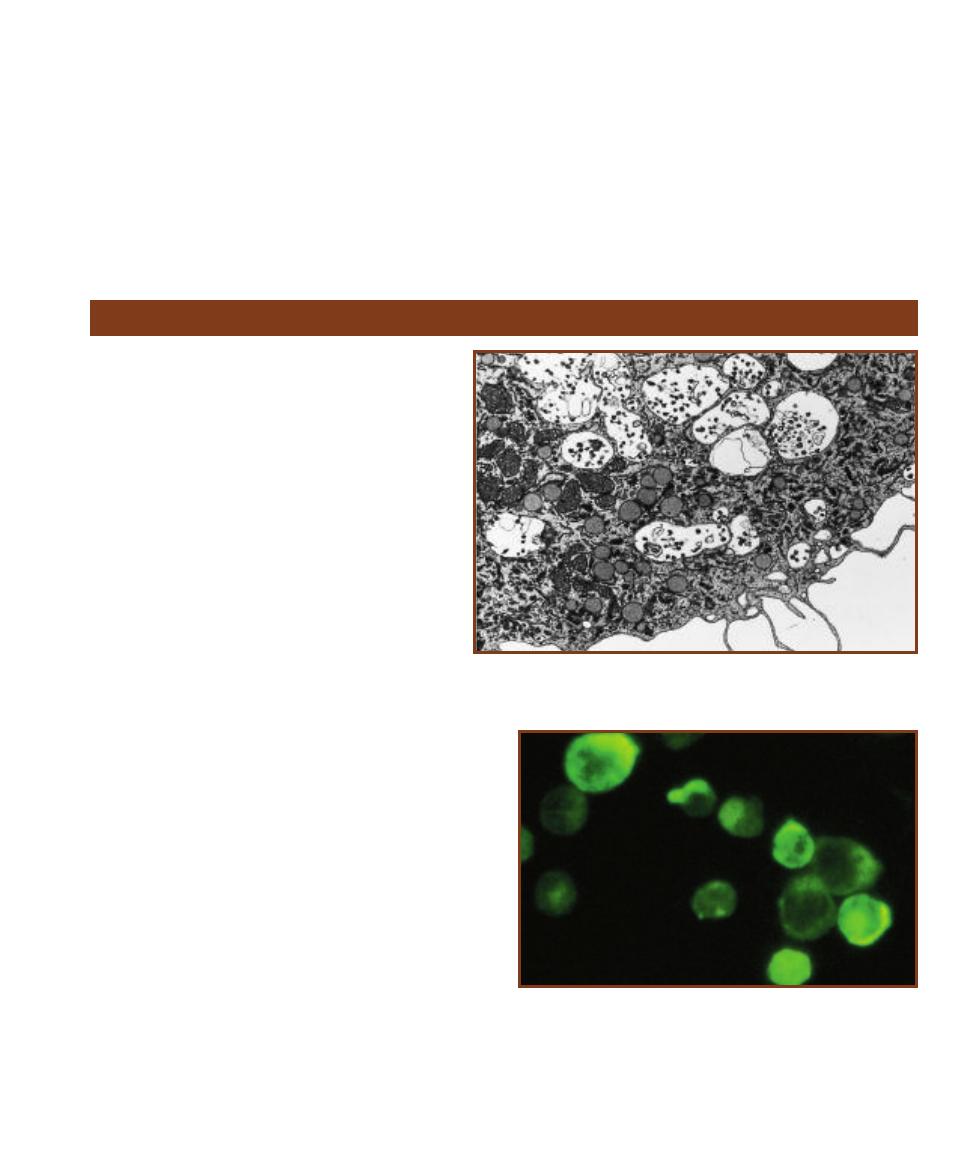
SECTION 10
䢇
Viruses
䢇
119
Human Immunodeficiency Virus (HIV)
HIV is the causative agent of AIDS (Acquired Im-
mune Deficiency Syndrome). At first, only a single
type of HIV was known, but in 1985, a second HIV
was isolated. The two forms are now referred to as
HIV-1 and HIV-2, respectively.
HIV-1 and HIV-2 (Figures 8-20, 10-5 and 10-6)
are retro viruses (Retroviridae) and have the ability to
perform reverse transcription; that is, they make DNA
from an RNA template, a very unusual mechanism
that characterizes the group. (In all other biological
systems, RNA is made from a DNA template during
transcription.) The enzyme reverse transcrip tase cata -
lyzes this process. Morphologically, a phospholipid
envelope derived from the host cell membrane encloses
the spherical capsid. Within it is a protein core sur -
rounding two single stranded RNA molecules, each
of which is associated with a molecule of reverse
transcriptase. The HIV genome consists of only 9
genes. Glyco protein spikes emerging from the envelope
are involved in attachment to the host cell.
HIV infects cells with CD4 membrane receptors, nor-
mally used for antigen recognition, but used by HIV for
attachment. A subpopulation of T cells, the T
4
helper cells,
are most commonly infected and die as a result. Other cells,
such as dendritic cells (a type of antigen presenting cell),
macrophages, and monocytes may also be infected. After
infection, the reverse transcriptase catalyzes the production
of viral DNA (provirus), which integrates into the host
chromosome and is the template for production of viral
RNA and proteins. After assembly, new virions emerge
from the host cell by budding and infect other cells. Latent
infection in which no new virus is made is also a possible
outcome of infection.
T
4
helper cells are essential to the normal operation of
the immune system because they promote development of
immune cells in both humoral and cell-mediated responses.
Depletion of T
4
cells cripples the immune system and the
patient becomes susceptible to infections by organisms not
typically pathogenic to humans. Thus, AIDS is not a single
10-5
E
LECTRON
M
ICROGRAPH OF A
M
ACROPHAGE FROM AN
HIV I
NFECTED
P
ERSON
Vacuoles contain viral particles.
Photo courtesy of Dr. Rachel Schrier and Dr. Clayton Wiley
5
ssDNA viruses. These viruses must first replicate their
genome to dsDNA, which is then used for transcription to
mRNA. Normal DNA replication provides more ssDNA
for the progeny genome. In most instances, only one
“sense” of the ssDNA is packaged into the viral progeny,
but there are exceptions where the progeny end up with
one or the other. An example is human parvo virus
B19 (which causes Fifth disease—a rash, seen mostly
in children).
6
ⴐ
ssRNA retroviruses. Retroviruses are capable of using
an RNA template to make dsDNA, which is then in -
corporated into the host genome and becomes latent.
When active, transcription produces ⳭssRNA, which
can be used as mRNA or genome for the progeny.
Examples include Human Immunodeficiency Viruses
(HIV—causes AIDS) and Human T-lymphotrophic
Viruses (HTLV—causes T-cell leukemia).
10-6
A
N
I
NDIRECT
F
LUORESCENT
A
NTIBODY
(IFA) T
EST
P
OSITIVE
FOR
HIV
The test system consists of HIV-infected cells attached to
the glass slide. When patient serum or plasma is added, any anti-HIV
antibodies bind to the infected cells. Subsequent addition of fluorescent
anti-human immunoglobin antibodies results in binding to patient anti-
HIV antibodies, if present. After washing away unbound fluorescent
antibodies, the slide is observed under a UV microscope. A bright apple
green color is a positive result.
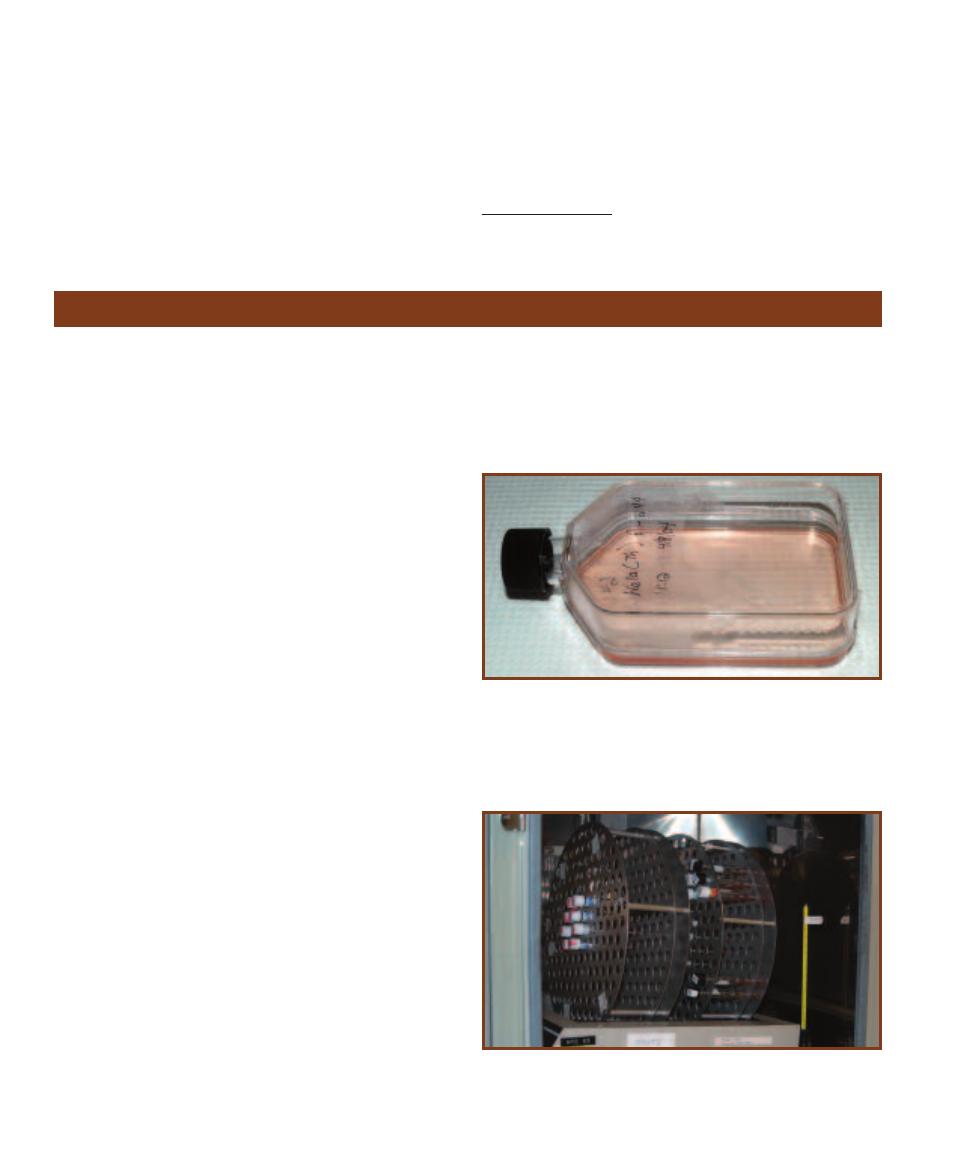
disease, but rather a syndrome of diseases characteristic of
patients with HIV infection.
HIV is transmitted via body fluids such as blood, breast
milk, semen, and vaginal secretions. Infection can occur as a
result of sexual intercourse with or blood transfusion from
an infected individual. Infection may also occur across the
placenta during pregnancy or via contaminated needles used
for injection of intravenous drugs. An infected mother also
may transmit it to a newborn during delivery or nursing.
Casual social contact does not appear to be a route of
infection.
According to United Nations 2008 Health Statistics
1
,
33.4 million people globally are living with HIV infection.
Most are in Subsaharan Africa.
1
http://www.unaids.org/en/KnowledgeCentre/HIVData/mapping_progress.asp
120
䢇
A Photographic Atlas for the Microbiology Laboratory
Viral Cytopathic Effects in Cell Culture
䢇
Purpose
This procedure is used for in vitro identification of viruses.
Presumptive identification of a virus in a specimen can be
made by determining the host cell(s) in which it replicates,
how quickly it causes damage, and the type of cytopathic
effect (damage) it produces. Confirmation may be made
using a specific serological test.
䢇
Principle
Supplied with the appropriate nutrients and environment,
viable virus host cells can be grown in a tube or flat bottle.
This is a cell culture (Figure 10-7). Incubation is done in
such a way that growth occurs only on one side. The cells
divide and produce a characteristic monolayer on the con-
tainer’s inside surface.
Different media are used for cell culture at different
stages. These are: growth medium and maintenance
medium. Growth medium is used to begin a cell culture.
When the cell layer is confluent or nearly so, the growth
medium is replaced with maintenance medium. Both media
are supplemented with amino acids, vitamins, and calf
serum. To ensure that the serum is free of viral antibodies
and certain infectious agents, only fetal, neonatal, or
agammaglobulinemic calf serum is used. Antibiotics are
also included to inhibit bacterial growth. The accumulation
of carbon dioxide and the associated acidification of the
medium is counteracted by a buffer. A pH indicator (such as
phenol red) is used to monitor the effectiveness of the buffer.
A sample suspected of containing virus is introduced
into the cell culture. Cultures are grown in an incubator and
the tubes may be placed in a mechanical roller to keep the
medium aerated (Figure 10-8). As they replicate in the cell
culture, viruses inflict damage upon the host cells called a
cytopathic effect (CPE), which can be viewed under an
inverted microscope (Figure 10-9). Depending on the virus
and the host cell, CPEs will be evident after as little as 4
days to as much as four weeks. Most of the time, they start
as small spots (foci) in the cell layer, then spread outwards.
Common damage to the cells includes rounding (either
small or large), a change in texture (either granular or
hyaline—glassy), or formation of a syncytium (fusion of
infected cells). Figures 10-10, 10-14, and 10-16 illustrate
three cell types used in cell culture. Figures 10-11 through
10-13, Figure 10-15, and Figures 10-17 through 10-19
illustrate various CPEs in these three host cells.
10-7
C
ELL
C
ULTURE
Viruses cannot be grown in bacteriological
media (such as Nutrient Agar) because they require living host cells.
So, the first challenge in propagating viruses is to grow their hosts in a
tube or flat bottle to produce a cell culture. Shown is a culture of HeLa
cells. HeLa is an established (continuous) cell line; that is, it has lasted
more than 70 passages and continues to maintain its sensitivity to viral
infection.
10-8
R
OLLER
D
RUM
Cultivation of some viruses (e.g., respiratory
viruses) requires aeration in order to more closely mimic their natural
conditions. Incubation of the culture in a roller drum keeps the medium
aerated. In this laboratory, all cell cultures are aerated.
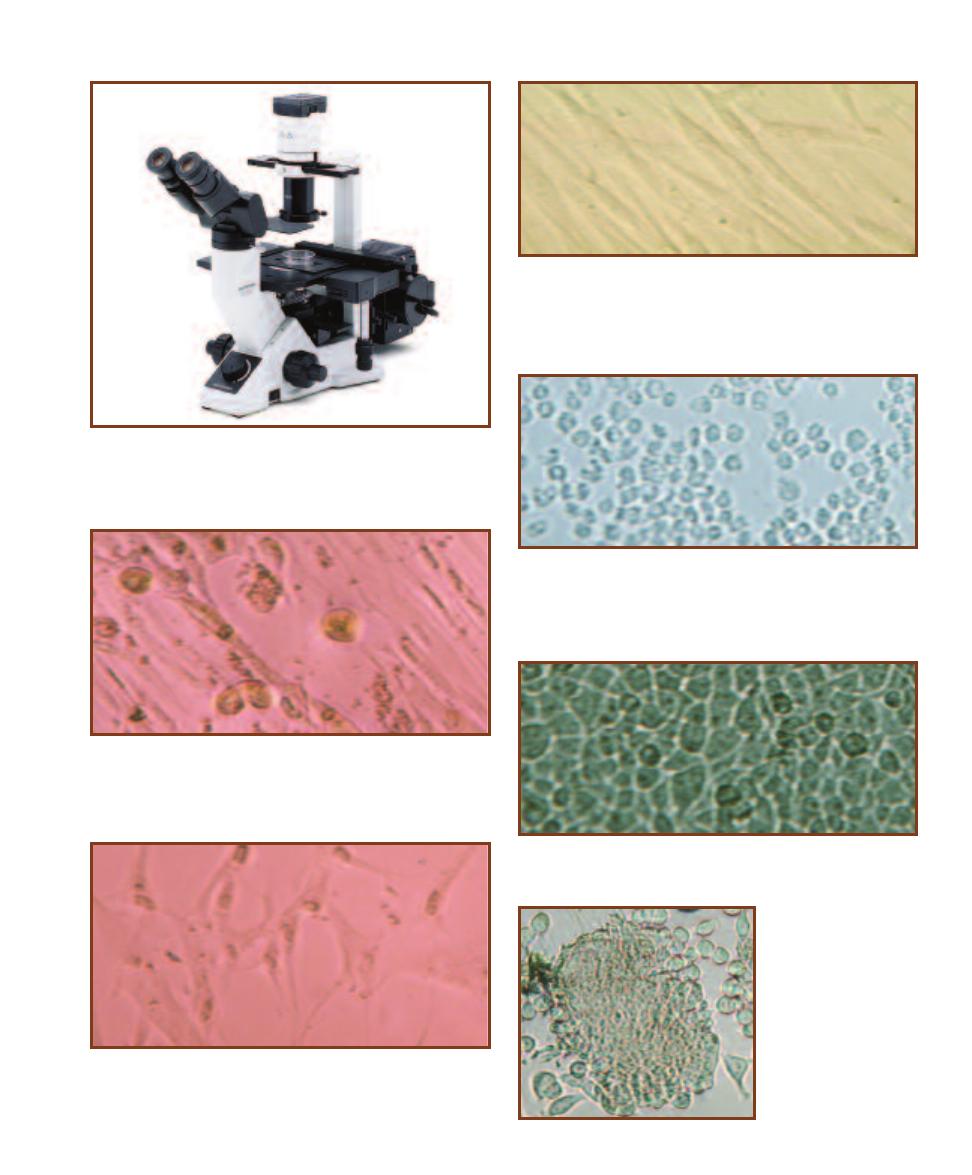
SECTION 10
䢇
Viruses
䢇
121
10-9
I
NVERTED
M
ICROSCOPE
Culture tubes and bottles are more
easily viewed with an inverted microscope because the objective lenses
are below the stage. This allows viewing of the cell monolayer without
looking through the thickness of the flask or tube.
Photo courtesy of Olympus America Inc.
10-10
N
ORMAL
MRC-5
Normal MRC-5 is a cell line of human
diploid fibroblasts. A cell line has a limited number (about 50) of
passages (transfers) before it is no longer useful. MRC-5 is used for
isolation of herpes simplex viruses (HSV), varicella-zoster viruses (VZV),
cytomegaloviruses (CMV), adenoviruses, entero viruses, respiratory
syncytial viruses (RSV), and rhinoviruses.
10-11
C
YTOMEGALOVIRUS
(CMV) CPE
IN A
C
ELL
C
ULTURE OF
MRC-5
CMV grows best in human fibroblasts, such as MRC-5. The
infected fibroblasts form a row and are rounded and hyaline (glassy).
CMV belongs to the Herpesviridae and, though common, its infections
are usually asymptomatic.
10-12
E
NTEROVIRUS
CPE
IN A
C
ELL
C
ULTURE OF
MRC-5
Entero -
virus infected cells become small (pycnotic) and round. Most entero virus
infections are asymptomatic, but can result in acute diseases such as
nonspecific febrile illness, aseptic meningitis, and polio myelitis. Entero -
viruses belong to the family Picornaviridae (pico-RNA-viridae—literally
“small RNA viruses”).
10-13
V
ARICELLA
-
ZOSTER
V
IRUS
(VZV) CPE
IN A
C
ELL
C
ULTURE
OF
MRC-5
Enlarged cells with odd shapes characterize the VZV CPE.
Varicella-zoster belongs to the Herpesviridae and is responsible for pro-
ducing chickenpox (varicella) and shingles (zoster).
10-14
N
ORMAL
H
E
L
A
C
ELLS IN
C
ULTURE
HeLa is an established
cell line used for isolation of poxviruses, respiratory syncytial viruses
(RSV), rhinoviruses, and enteroviruses.
10-15
R
ESPIRATORY
S
YNCYTIAL
V
IRUS
(RSV)
CPE
RSV in HeLa cell cul-
ture produces characteristic
syncytia of fused cells. RSV
is responsible for lower
respiratory tract infections,
especially in infants.
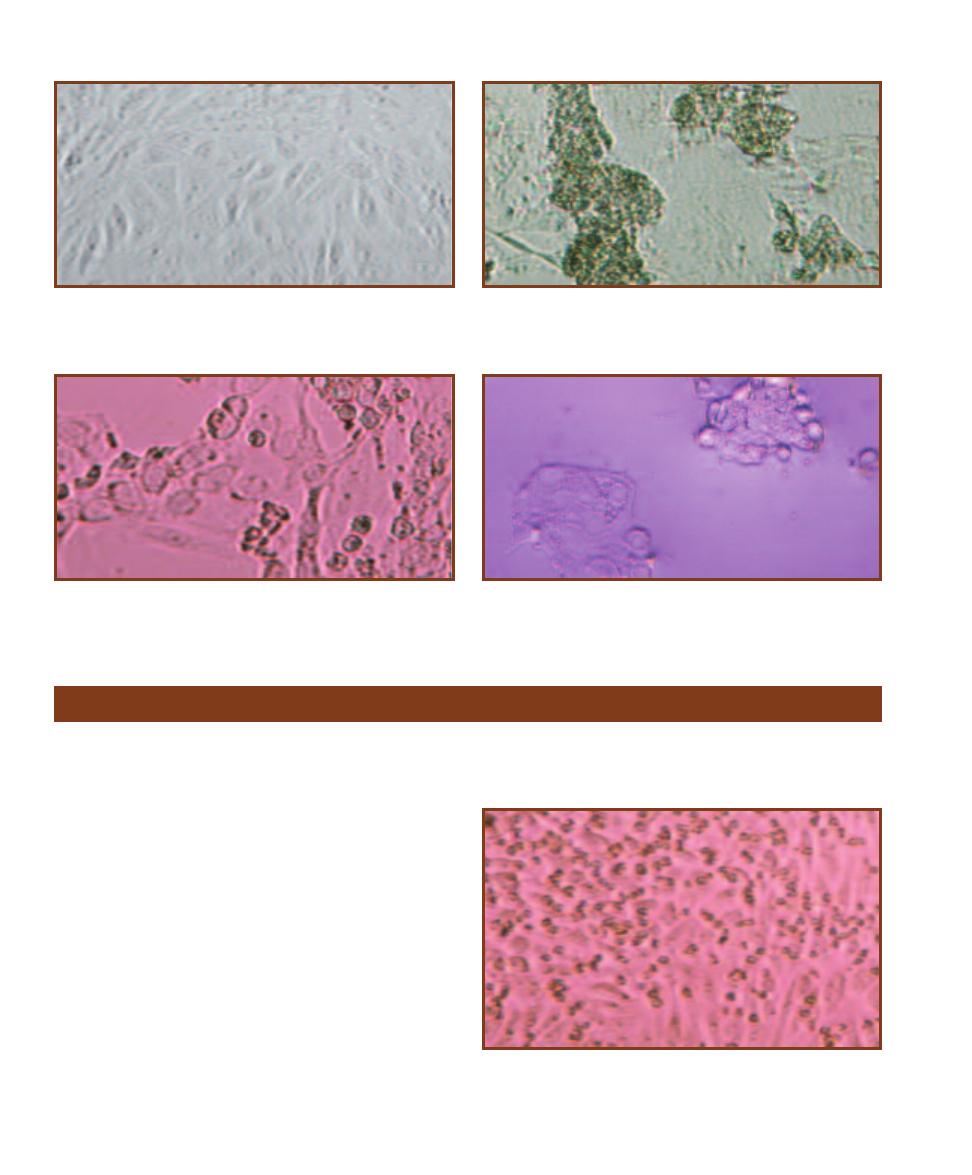
122
䢇
A Photographic Atlas for the Microbiology Laboratory
10-16
N
ORMAL
A
FRICAN
G
REEN
M
ONKEY
K
IDNEY
(AGMK)
C
ELL
C
ULTURE
This cell line is used for isolation of herpes simplex
virus, varicella-zoster virus (VZV), mumps virus, and rubella virus,
among others.
10-17
M
EASLES
V
IRUS
CPE
IN
AGMK C
ELL
C
ULTURE
Syncytia
formation is the typical CPE for measles virus. Measles virus produces
rubeola (also known as seven day measles). It is a –ssRNA virus and
belongs to the family Paramyxoviridae.
10-19
A
DENOVIRUS
CPE
IN
AGMK
The typical CPE consists of
rounded cells clustered like grapes. Adenoviruses cause a variety of
upper and lower respiratory diseases, gastro enteritis, meningitis, and
encephalitis, among others.
10-18
I
NFLUENZA
A V
IRUS
CPE
IN
AGMK C
ELL
C
ULTURE
Cell
degeneration and syncytia formation characterize the CPEs of influenza
viruses. Influenza is an acute respiratory disease that may reach epidemic
and pandemic proportions.
䢇
Purpose
Hemadsorption is used for presumptive identification of in-
fluenza, parainfluenza, and sometimes mumps virus, because
these viruses do not produce much cytopathic effect (CPE) in
cell culture. Confirmation is accomplished by serological tests.
䢇
Principle
Infection with influenza, parainfluenza, or mumps virus
results in viral glycoproteins being present in the infected
cell’s membrane. When these viruses emerge from the host,
they carry the glycoproteins in their envelope (which is
actually host cell membrane) and use them for attachment
to and penetration of a new host. They also have the ability
to adsorb (attach) to guinea pig RBCs. This property is
exploited in the hemadsorption test.
Because influenza, parainfluenza, and mumps viruses
often produce little or no CPE in cell culture, a hemadsorp-
tion test may be run. After incubation of the cell culture
inoculated with the patient’s sample, guinea pig RBCs are
added to the medium. If the virus is present, the infected
cells will have viral glycoproteins in their membranes, and
the RBCs will adsorb to them (Figure 10-20).
Hemadsorption in Cell Culture
10-20
H
EMADSORPTION
T
EST
Shown is hemadsorption of guinea
pig RBCs by human diploid fibrobast cells infected with parainfluenza
virus. Notice that the RBCs (darker spots) are always associated with the
fibroblast cells and are not in the spaces between cells.

Domain Bacteria
As you read these descriptions, refer to Figure 1-2 for an evolutionary perspective. By convention,
most names of orders end with “-ales” and those of families end with “-aceae.”
Aquificales is the only order
in the phylum. Its genera are
thought to reside on a very
early branch of the Bacterial
phylogenetic “tree.” All are
chemolitho autotrophic hyper -
thermophiles. Aquifex (Figure
11-1) is able to grow at 95°C!
Members of this phylum are
autotrophs because they can
perform the reverse Krebs
cycle, in which CO
2
is added
to the Krebs intermediates
(carbon fixation) rather than
being removed. Electron
donors include H
2
, S
0
, or
S
2
O
3
2–
; O
2
and NO
3
–
are elec-
tron acceptors. Metabolic
products from sulfur are
sulfuric acid and H
2
S; NO
3
–
produces NO
2
–
and N
2
.
Phylum Aquificae
11
S E C T I O N
123
11-1
A
QUIFEX
H
ABITAT IN
O
CTOPUS
S
PRING
R
UNOFF
C
HANNEL
Aquifex
forms pink streamers in the hot runoff channels (about 90°C!) of sulfur hot
springs.
Photograph by Bob Lindstrom courtesy of the National Park Service
Phylum Thermotogae
Species of the order Thermotogales are Gram-negative rods with a distinctive outer sheath
(“toga”), which loosely encloses the cell at both ends (Figure 11-2). All are anaerobic heterotrophs
that produce acetate, CO
2
, and H
2
(among other compounds) from glucose fermentation, and all
reduce sulfur to H
2
S. They are at least moderately thermophilic, but some are hyperthermophilic.
This order, like Aquificales, appears to be an ancient branch within the Domain Bacteria.
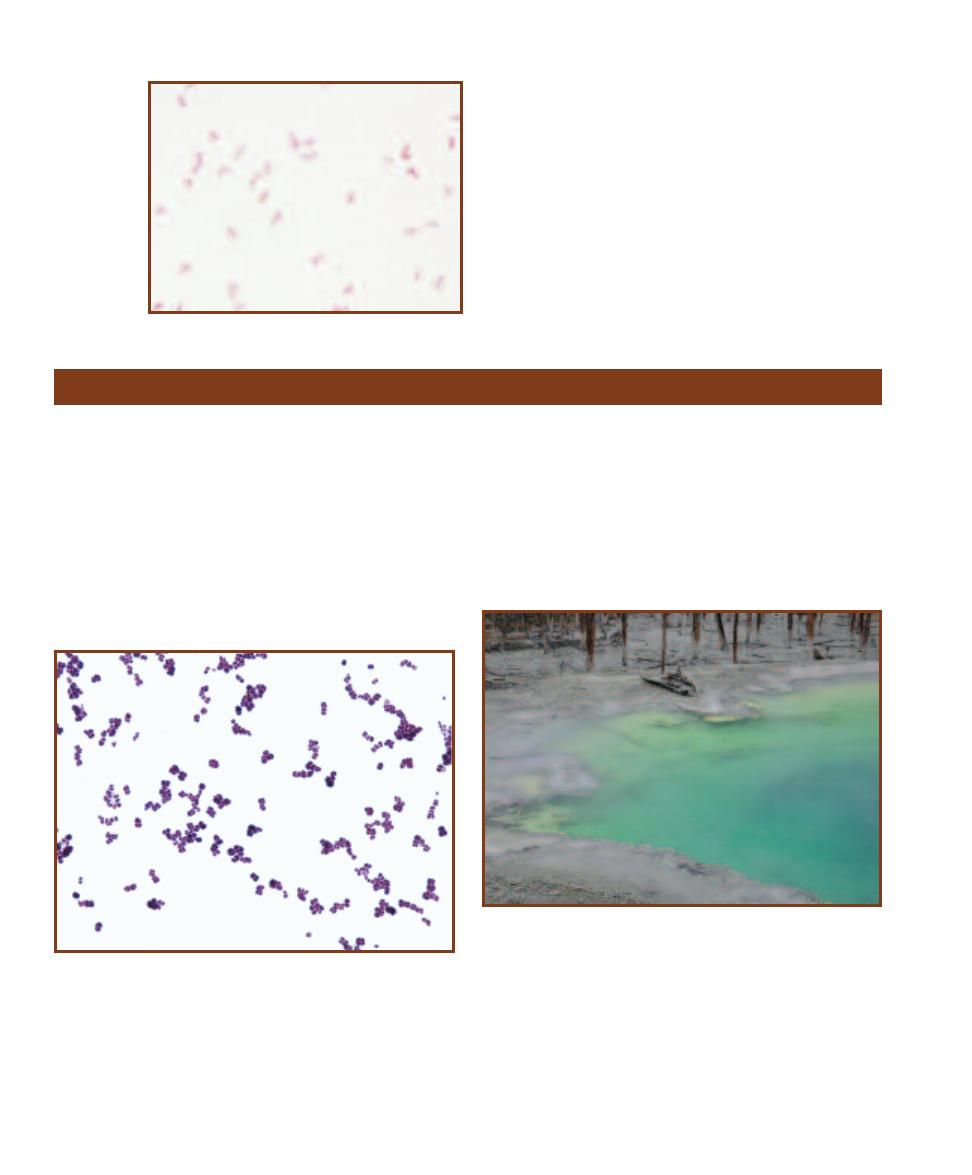
Deinococcus species (Figure 11-3) form either spherical or
slightly elongated cells. Though they stain Gram-positive,
their wall has a thin peptidoglycan layer and an outer
membrane (as in Gram-negative cells). They are nonmotile,
aerobic chemoheterotrophs, and may be mesophilic or
thermophilic. Their genome consists of two different circular
chromosomes in multiple copies (four copies each when the
cells are not growing). They are noteworthy for their resist-
ance to ionizing radiation due to an as-yet not understood
DNA repair mechanism. They are able to withstand radia tion
doses many times that which is lethal to humans.
Thermus (Figure 11-4) is a genus of straight Gram-
negative rods of variable length. They are aerobic respirers
and are thermophilic (optimum temperature of about 70°C),
preferring neutral and slightly alkaline hydrothermal regions.
Thermus aquaticus is famous for its DNA Polymerase (Taq1),
the enzyme that polymerizes DNA during synthesis. It is
stable at high temperatures and is therefore useful in the
polymerase chain reaction (PCR) technique of cloning DNA
in vitro (page 111).
124
䢇
A Photographic Atlas for the Microbiology Laboratory
11-2
T
HERMOTOGA MARITIMA
T. maritima was first
isolated in a geothermal marine region in Italy. It grows
over a temperature range of 55–90° C. Its genome has
been sequenced and surprisingly, approximately one-
quarter of its genes were obtained by lateral gene transfer
with Archaean species. Cells are 0.6 µm wide by 1.5–11.0
µm long. Note the light, oval regions at the ends of cells.
These are the “togas.”
Phylum “Deinococcus-Thermus”
11-3
D
EINOCOCCUS
Deinococcus typically grows in pairs and tetrads
(though sometimes as rods). Individual cells are up to 3.5 µm in diameter.
This specimen was grown in culture and Gram stained.
11-4
T
HERMUS AQUATICUS
H
ABITAT IN
C
ISTERN
S
PRING
, Y
ELLOW
-
STONE
N
ATIONAL
P
ARK
This hot spring reaches temperatures of 90°C.
In its runoff channel (which cools as it becomes more removed from
the spring), T. aquaticus thrives. It was in this and other Yellowstone hot
springs that Dr. Thomas Brock and Dr. Hudson Freeze first discovered
T. aquaticus in 1969.

Members of this phylum are filamentous rods with glid-
ing motility. They can perform anoxygenic photosynthesis
using bacteriochlorophyll a and other pigments, but don’t
use reduced sulfur as an electron source. They are prima-
rily photoheterotrophic when growing anaerobically and
chemoheterotrophic when growing aerobically. Most are
thermophilic. Chloro flexus is the type genus (Figure 11-5).
Cells are 0.5–1.0 µm wide and 2–6 µm long.
SECTION 11
䢇
Domain Bacteria
䢇
125
Phylum Chloroflexi
11-5
C
HLOROFLEXUS
H
ABITAT IN
W
HIRLIGIG
G
EYSER
R
UNOFF
, Y
ELLOW
-
STONE
N
ATIONAL
P
ARK
Chloroflexus is the most studied member of the
Chloro flexi. It stains Gram-negative, but lacks an outer membrane and, in
fact, has a wall structure more consistent with Gram-positive cells. Chloro -
flexus can be found forming orange microbial mats in the runoff of low
sulfur hot springs, often in association with cyano bacteria. Their preferred
temperature is between 50 and 60°C. (The green algae at the left of the
channel grow between 38 and 56°C, dramatically illustrating the varied
habitats of Yellowstone’s geological features and the variety of thermophilic
organisms that reside in them.)
Phylum Spirochaetes
Spirochaetes are free living, symbiotic, or parasitic chemo-
heterotrophs. They are Gram-negative, flexible, tightly
coiled rods. The cell wall, cell membrane, and cytoplasm
constitute the protoplasmic cylinder, which is surrounded
by the outer membrane or outer sheath. Between two and
100 periplasmic flagella are wound along the spiral cell in
the space between the sheath and the protoplasmic cylinder.
One end of each flagellum is anchored to a pole of the
protoplasmic cylinder, with an equal number attached at
each end. The flagella can propel the cell forward, cause it
to rotate on its axis, or flex. Aerobic, facultatively anaerobic,
and anaerobic species are represented. Important genera in-
clude Spirochaeta (Figure 5-15), Borrelia (Figure 12-11),
Treponema (Figure 12-68), and Leptospira.
Phylum Cyanobacteria
Cyanobacteria are easily seen without staining because of
their combination of photosynthetic pigments, which confer
on them a bluish-green color. In fact, they were formerly
known as “blue-green algae.” All are capable of oxygenic
photosynthesis (oxygen is a waste product) and all are
Gram-negative, though their peptidoglycan is thicker than
most other Gram-negatives. When they are single-celled,
they are about the size of bacteria. But when they are found
in chains, called trichomes, they are easily visible at high dry
magnification. Some trichomes have an extracellular sheath.
Trichomes often have specialized cells, including heterocysts,
which are nitrogen-fixing cells, and akinetes, which are
resistant spores. Many trichomes are capable of gliding
motility. Figures 11-6 to 11-13 illustrate some common
forms and cyanobacterial variability. All micrographs are
unstained wet mount preparations.
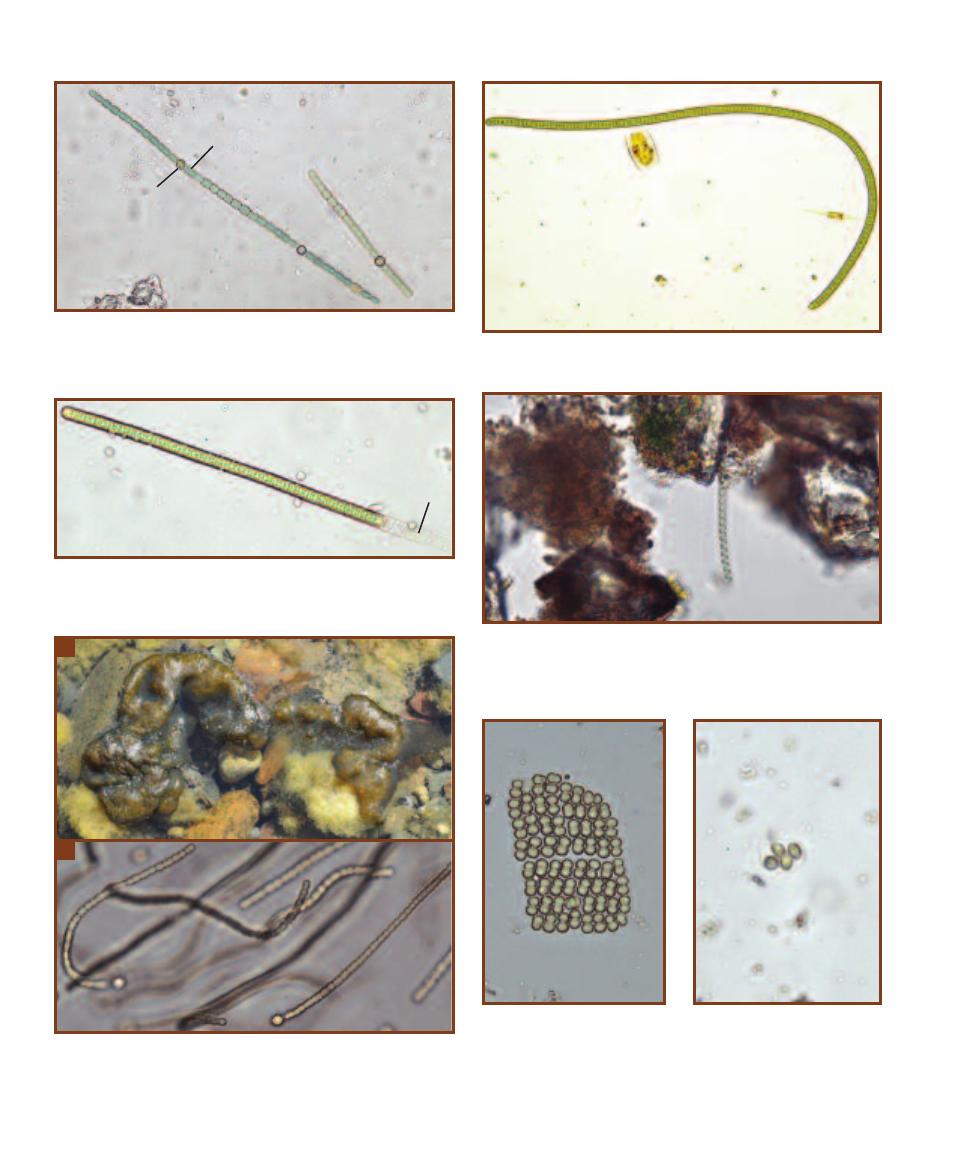
126
䢇
A Photographic Atlas for the Microbiology Laboratory
11-6
A
NABAENA
The trichomes of this gliding cyanobacterium
may possess thick-walled spores called
akinetes (A) and specialized,
nitrogen-fixing cells called
heterocysts (H). Trichomes are of variable
lengths but are approximately 20 µm in width.
11-8
L
YNGBYA
Lyngbya trichomes have a sheath (S) that distinguish
them from Oscillatoria (Figure 11-7). The trichomes are approximately
20 µm in width.
11-9
S
PIRULINA
Spirulina is perhaps the most distinctive cyanobac-
terium because of its helical shape. The width of the helix varies, but
can obtain sizes up to 12 µm. This genus is sold in health food stores as
a dietary supplement.
11-10
N
OSTOC
A
This genus is easily identified macroscopically
because of its globular colonies and thick, rubbery mucilage.
B
Tri-
chomes are composed of spherical cells and form a tangled mass within
the colony. Note the terminal spherical heterocysts. Trichomes are about
5 µm in width.
11-11
M
ERISMOPEDIA
Cell
division in two perpendicular
directions produces the planar
arrangement characteristic of
this genus. The cells are enclosed
in a mucilaginous sheath and are
approximately 1–2 µm in diameter.
11-12
G
LOEOCAPSA
This
cyanobacterium is distinctive
because of its one, two, or four
spherical cells held together
within a layered sheath. Cells
are 3–10 µm in diameter.
11-7
O
SCILLATORIA
Trichomes are formed from disc-shaped cells
that are approximately 10 µm in width. Watch for gliding motility.
A
B
A
H
S
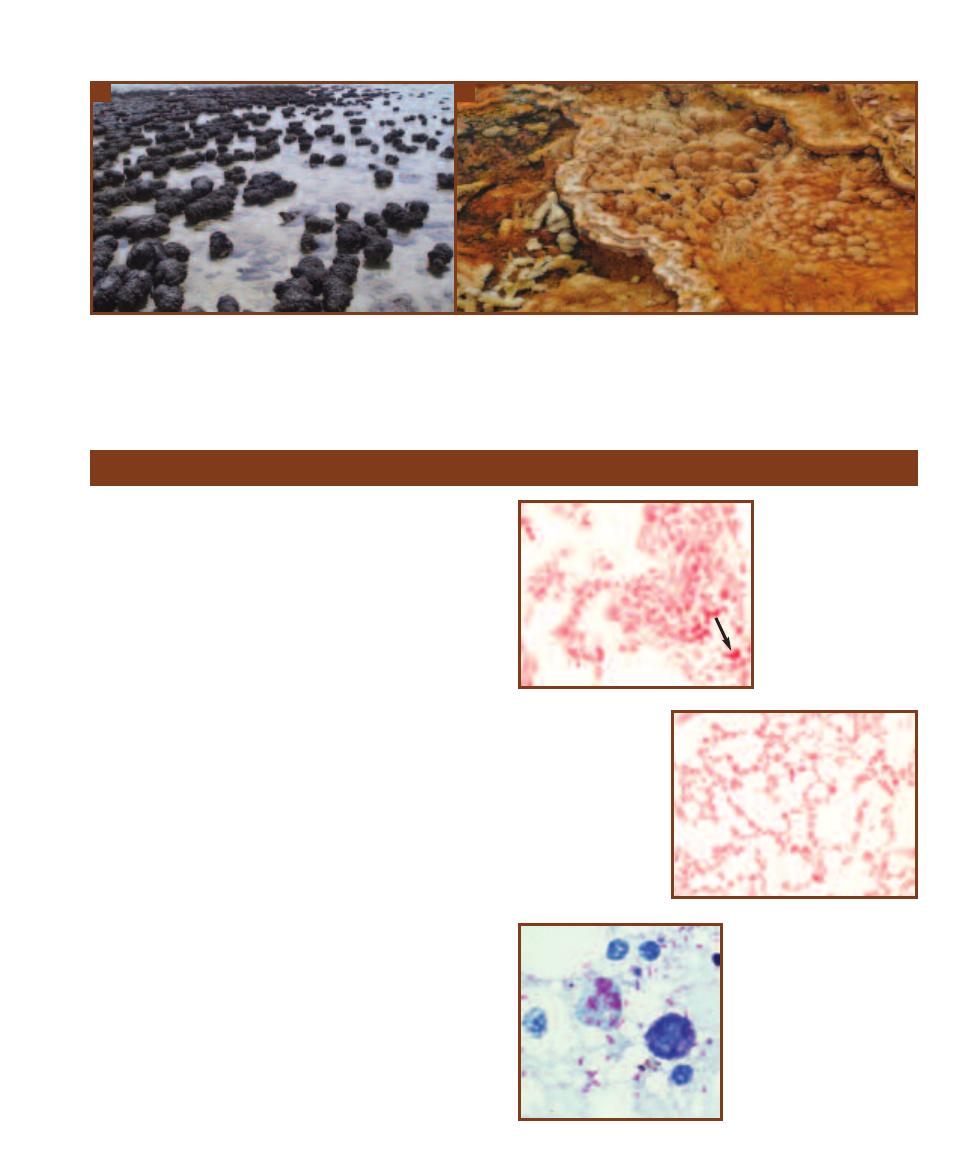
SECTION 11
䢇
Domain Bacteria
䢇
127
11-13
S
TROMATOLITES
Stromatolites are made of layers of cyano bacteria, sediments, and minerals stacked upon one another. Fossil stromato-
lites have been dated to 3.5 billion years before the present.
A
These marine stromatolites are found at Shark Bay, Western Australia. They are in the
1 meter height range.
B
Hyperthermophilic stromatolites form in some runoff channels draining geo thermal springs in Yellowstone National Park.
These were found growing in the Mammoth Springs area and are only a few centimeters in height.
Photograph A courtesy of Ian and Todd Molloy, Crikey Adventure Tours
Phylum Proteobacteria
The largest and most diverse Bacterial phylum is the Proteo -
bacteria. All are Gram-negative and show relationship based
on 16s RNA comparison. Beyond that, they exhibit the
gamut of aerotolerance, energy metabolism, and cell mor-
phology categories. They also comprise the most commonly
cultivated Gram-negative organisms of medical, industrial
and general importance. The phylum is split into five classes:
Alphaproteobacteria, Betaproteobacteria, Gammaproteo -
bacteria, Deltaproteobacteria, and Epsilonproteobacteria.
In the following, most groups are treated by order, but some
physiological abilities span several classes and it is easier to
cover these as a functional group rather than taxonomically.
Alphaproteobacteria
Rhodospirillales
Rhodospirilla ceae (type genus: Rhodospirillum) and
Acetobacteraceae (type genus: Acetobacter) are the two
families of this order.
䢇
Rhodospirillum is a photoheterotroph and is covered in
the purple nonsulfur bacteria (page 129).
䢇
Acetobacter (Figure 11-14) and Gluconobacter (Figure
11-15) are two genera of “acetic acid bacteria.” They
are obligate aerobic respirers that oxidize ethanol to
acetic acid. The former then oxidizes acetate to CO
2
and H
2
O, whereas the latter does not.
Rickettsiales
Members of this order are obligate intracellular parasites
that include a vertebrate and an arthropod host in their life
11-14
A
CETOBACTER
Acetobacter species are
capable of oxidizing ethanol
to acetic acid (acetate) dur-
ing aerobic respiration. It
further oxidizes the acetic
acid to CO
2
and H
2
O. In
older cultures, involution
forms can be observed.
Some of these irregularly
shaped cells are visible in
this micrograph (arrow).
11-15
G
LUCONO
-
BACTER
Like Acetobacter,
Gluconobacter is capable
of oxidizing ethanol, but it
can’t complete the oxida-
tion to CO
2
and H
2
O.
11-16
R
ICKETTSIA RICKETTSII
This is a Giemenez stain of yolk
sac infected with Rickettsia rick-
ettsii. They must be grown in
tissue culture because they are
obligate intracellular parasites.
The cells range in size from 0.2
by 0.5 µm to 0.3 by 2.0 µm.
Photo by Billie Ruth Bird (CDC), courtesy
of the Public Health Image Library
A
B
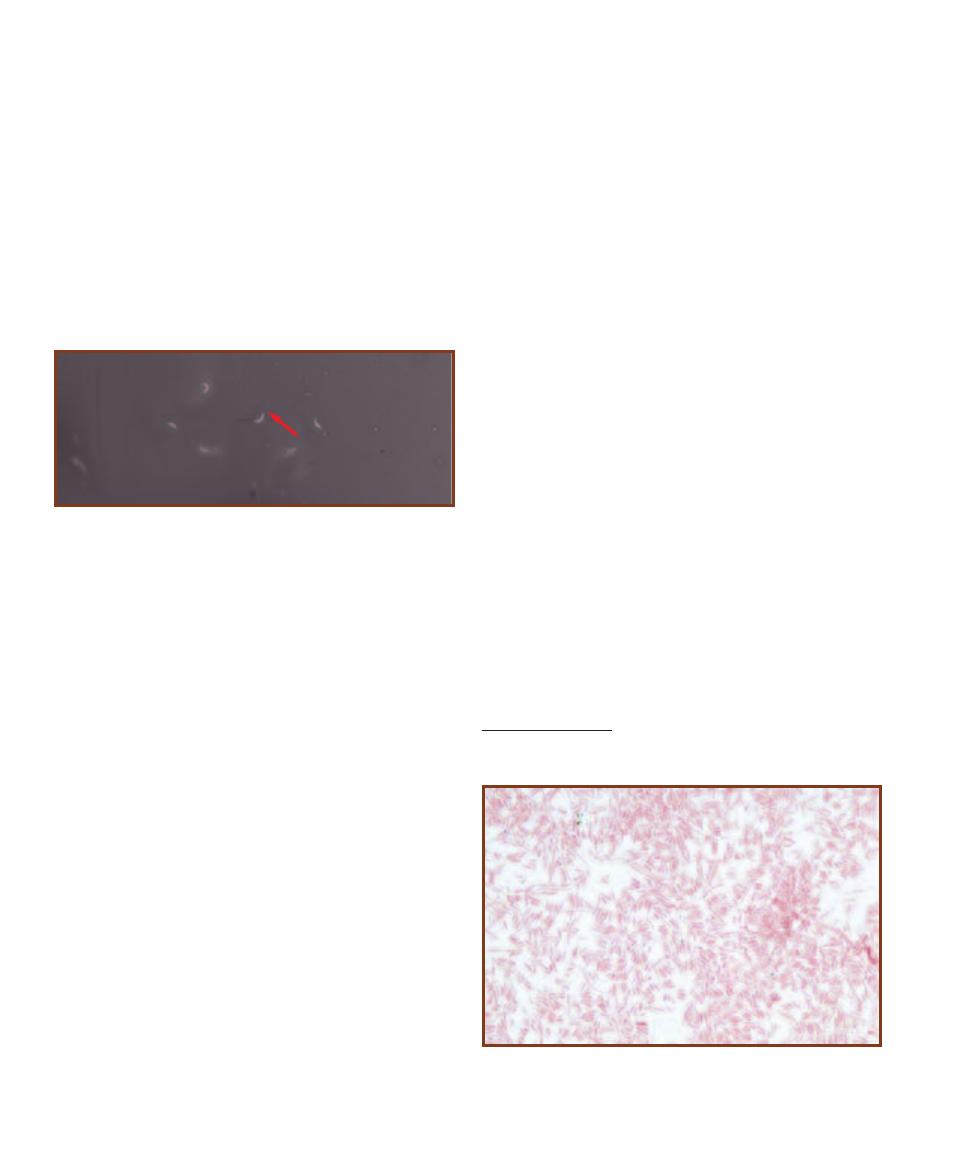
128
䢇
A Photographic Atlas for the Microbiology Laboratory
cycles. Many are pathogenic. Important genera are Rickettsia
(Figure 11-16) and Ehrlichia.
Caulobacterales
Caulobacter (Figure 11-17) is the type genus. Cells are vibri-
oid or elongated with tapered ends. An adhesive stalk, made
from the cell wall and cytoplasmic membrane, emerges from
one end. During division, the cell produces a daughter cell
from the unattached end, which develops a flagellum and
swims away after the cells separate. It eventually loses the
flagellum, develops a stalk, and attaches to a surface. They
are strict aerobic respirers found in freshwater, sewage, and
bottled water!
Betaproteobacteria
Neisseriales
Members of this order are typically single cocci or diplococci
with adjacent sides flattened, though some are rods and
spirals. They are Gram-negative (though may resist decol-
ori zation), chemoorganotrophic, oxidase positive, non-
motile, and aerobic or facultatively anaerobic. Representative
genera include Neisseria (Figure 12-42), Aquaspirillum, and
Chromobacterium (Figures 3-25 and 3-26).
Epsilonproteobacteria
Campylobacterales
The species of this order are Gram-negative, chemo organo -
trophic, microaerophiles. Cell morphologies range from
curved rods to S-shaped or helical rods. Most are motile and
exhibit a corkscrew motion. Carbohydrates are not used as
an energy source. Campylobacter (Figures 12-14 and 12-15)
is the type genus and includes two pathogenic species:
C. jejuni and C. fetus. The former causes gastroenteritis
and abortion; the latter causes abortion in cattle and sheep.
Gammaproteobacteria
Pseudomonadales
The Pseudomonads are the “type” group for the Proteo bac-
teria, meaning they are the ones against which the others
are compared for similarity. Pseudomonads are respiratory
aerobic chemoorganotrophs and are either nonmotile or
motile by polar or peritrichous flagella. Important genera
are Pseudomonas (Figures 12-49 and 12-50) and Azoto -
bacter (which is covered as a nitrogen-fixer on page 233
and is shown in Figure 19-29).
“Vibrionales”
1
Vibrios are straight to curved rods that are motile by polar
flagella. All are facultative anaerobes, capable of aerobic
respiration and fermentation. Most are found in aquatic
habitats and some are bioluminescent (Figure 19-21). Impor-
tant genera are Vibrio with more than 40 species, and Pho-
tobacterium. Some Vibrio species are pathogenic (e.g., V.
cholerae—Figures 12-69 and 12-70).
“Enterobacteriales”
This order comprises 42 genera. Their cells are straight
rods, 0.3–1.0 µm wide by 1.0–6.0 µm long, and are motile by
peritrichous flagella or nonmotile. They are chemoorgano -
trophs, capable of both aerobic respiration and fermentation,
in which acid is produced from glucose. Most reduce NO
3
–
to NO
2
–
(page 83), are oxidase negative (page 87), and cata-
lase positive (page 63). They also share a unique antigen
(enterobacterial common antigen). Although the name
“Enterobacteriales” literally means, “gut bacteria,” their
habitats also include soil, water, and plant material. Impor-
tant genera include Enterobacter, Citrobacter (page 139),
Erwinia, Escherichia (page 144), Klebsiella (Figure 11-18),
Proteus (page 153), Salmonella (pages 155 and 156),
Shigella (page 156), and Yersinia (page 163).
11-17
C
AULOBACTER
This micrograph is a negative stain of
Caulobacter grown in pure culture. The cells are vibrioid; the stalk
is faintly visible on some cells (arrow).
11-18
K
LEBSIELLA MOBILIS
(
NÉE
E
NTEROBACTER AEROGENES
)
DNA-DNA hybridization studies show that Enterobacter aerogenes is
more closely related to Klebsiella than to Enterobacter cloacae. As a
result, E. aerogenes is now considered to be Klebsiella mobilis.
1
Order names within quotation marks indicate that the order has no formal
taxonomic standing.
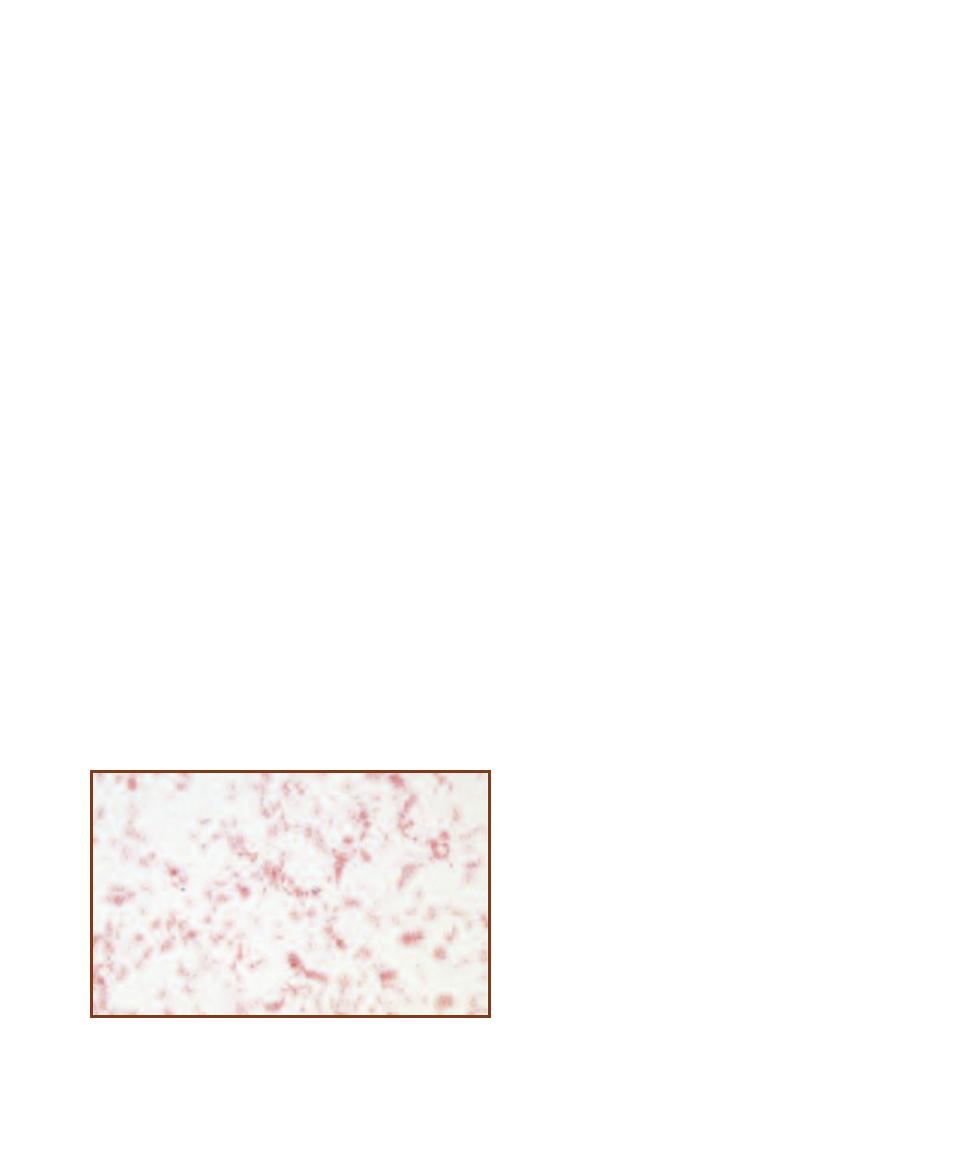
SECTION 11
䢇
Domain Bacteria
䢇
129
Nitrogen-Fixing Bacteria
Nitrogen-fixing bacteria are able to convert N
2
to ammonia.
Some nitrogen-fixing bacteria (e.g., Rhizobium, an Alpha -
proteobacterium) are symbionts of certain legumes and form
nodules in their roots (Figures 19-26 though 19-28). Other
nitrogen-fixing bacteria, such as Azotobacter (in the Pseudo -
monadales) are free-living in the soil (Figure 19-29). Most
aquatic nitrogen fixation is performed by cyanobac teria,
such as Anabaena (Figure 19-30)
Nitrifying Bacteria
Nitrification is the process of making nitrate (NO
3
–
). Nitri-
fying bacteria are autotrophs and chemolithotrophs. Some
nitrifiers use ammonium ion as an electron and energy source
when it is oxidized to nitrite (NO
2
–
); others then use the
nitrite as an electron and energy source and oxidize it to
nitrate. Organisms such as Nitrosomonas perform the
ammonia oxidation. Ammonia-oxidizing bacteria are found
in the Betaproteobacteria and Gammaproteobacteria. Ni-
trite-oxidizing organisms, such as Nitrobacter, continue the
oxidation of nitrite to nitrate. Nitrite-oxidizers are found in
the Alphaproteobacteria, Gammaproteobacteria, and Delta -
proteobacteria (though the latter group is still in question).
Nitrosomonas (Figure 11-19) is a Betaproteobacterium
that performs ammonia oxidation. Its cells range from
spherical to rod-shaped, and may be seen as singles or short
chains. The electron microscope reveals internal flattened
membranous vesicles at the periphery of the cytoplasm that
are involved in ATP production from ammonia oxidation.
Some species can oxidize urea, producing CO
2
for auto -
trophic growth and NH
3
for ATP production—highly efficient!
Nitrosomonas is most frequently isolated from aquatic
habitats rich in ammonia, and occasionally from soil.
Nitrobacter (Figure 11-19) is an Alphaproteobacterium
that oxidizes NO
2
–
to NO
3
–
. Its cells are rods of various
shapes (pleomorphic) that measure 0.5–0.9 µm wide by
1.0–2.0 µm long. The electron microscope reveals intracyto-
plasmic membranes organized at one pole of the cell and
specialized regions for carbon-fixation called carboxysomes.
Reproduction occurs via binary fission or budding. Nitrobac-
ter species are capable of aerobic and anaerobic respiration.
Purple Nonsulfur Bacteria
Rhodospirillum (Alphaproteobacteria) is a freshwater
photoheterotroph, but can live chemoorganotrophically in
the dark and photoautotrophically with H
2
and sulfide as
electron donors. Cells are curved rods to spirals (Figures
3-37 and 5-14) with internal photosynthetic membranes and
bacteriochlorophyll a. Polar flagella provide motility.
Purple Sulfur Bacteria
The unifying feature of the purple sulfur bacteria is their
ability to use H
2
S as the electron donor for CO
2
reduction
in photosynthesis. The S
0
resulting from H
2
S oxidation is
either stored as intracellular or extracellular granules. Because
oxygen is not a product, these photoautotrophs are said to
perform anoxygenic photosynthesis (as opposed to the oxy-
genic photosynthesis of cyanobacteria). The photosynthetic
pigments bacteriochlorophyll a and carotenoids are embedded
in the membranes of vesicles formed from infoldings of the
cytoplasmic membrane. Purple sulfur bacteria are found in
freshwater and marine mud and sediments illuminated by
sunlight but lacking oxygen. All known species belong to
the Gammaproteobacteria. The genera Chromatium and
Allochromatium (Figure 19-33) belong to this group.
Green Sulfur Bacteria
(Phylum Chlorobi)
The green sulfur bacteria constitute another group of
anoxy genic phototrophs and also use H
2
S as the electron
donor. In addition to bacteriochlorophyll a, they possess
a distinctive set of other bacteriochlorophylls, which are
enclosed in membranous structures called chlorosomes that
are located just to the interior of the cytoplasmic membrane.
Another distinctive feature of these bacteria is that the
chlorosome “membrane” does not have the usual phospho-
lipid bilayer construction. Carbon fixation occurs by the
reverse Krebs cycle. While found in similar habitats as the
purple sulfur bacteria (i.e., aquatic, anoxic, H
2
S-rich mud),
they are able to grow at deeper levels because the chloro-
somes are extremely efficient at capturing the limited light.
Chlorobium is the type genus of the phylum. A Winogradsky
column with green sulfur bacterial growth is shown in
Figure 11-20.
11-19
N
ITROSOMONAS
Nitrosomonas is a genus of Gram-negative
nitrifying bacteria found in seawater, brackish water, and freshwater, as
well as soils. The cells are straight rods 0.7–1.5 µm wide by 1.5–2.4 µm
long. They are aerobic chemoautotrophs that obtain energy by oxidizing
ammonia to nitrite. This specimen was obtained from soil grown on an
enrichment medium containing ammonia as the only nitrogen source.

130
䢇
A Photographic Atlas for the Microbiology Laboratory
Members of this phylum are diverse and generally have a
low GⳭC% (<50%). Most are Gram-positive, many of
these with teichoic acids, but some genera are Gram-negative.
Cell morphology ranges from cocci to rods of various shapes.
Some produce endospores. The phylum includes aerobes,
facultative anaerobes, and obligate anaerobes. Most are
chemoorganotrophic mesophiles and neutrophiles.
Bacillales
Bacillaceae is the largest family (of the more than ten)
within the order Bacillales, and Bacillus is by far the largest
genus within the family. Species of Bacillus are rod-shaped
and generally stain Gram-positive, at least when young.
They form endospores (Figure 6-23) and are either aerobic
or facultatively anaerobic. Most are soil organisms, though
B. anthracis is a pathogen of cattle and humans (page 134).
B. mycoides (Figure 3-9c) produces very distinctive colonies.
Listeriaceae
Listeriaceae comprises two genera, Listeria and Brocho -
thrix, with the former being the larger of the two. Listeria
(Figure 12-35) rods are short with blunt ends. They are
aerobic or facultatively anaerobic, motile, but do not form
endo spores. L. monocytogenes is the causative agent of
listeriosis.
Staphylococcaceae
Staphylococcus (Figures 5-24 and 12-57) is the largest
genus of the four in Staphylococcaceae. They form charac-
teristic grapelike clusters of spherical cells. No endospores
are formed and they are usually catalase positive (page 63)
and oxidase negative (page 87). Metabollically, they can fer-
ment and aerobically respire, making them facultative
anaerobes. S. aureus (page 157) and S. epidermidis (page
158) are normal inhabitants of the human body, but both
are opportunistic pathogens.
Lactobacillales
This order comprises six families, of which only three will
be addressed: Lactobacillaceae, Streptococcaceae, and
Enterococcaceae.
The type genus of the Lactobacillaceae is Lactobacillus
(Figure 11-21), whose cells range from long, slender rods to
coccobacilli. They are Gram-positive, do not produce endo -
spores, and are nutritionally fastidious. Lacking a cyto chrome
system, their metabolism is strictly fermentative with lactate
being the primary end product. (Some species are homofer-
mentative, meaning lactate is the sole end product of fermen-
tation; others are heterofermentative and produce multiple
end products.) They are found in the oral cavity, intestines,
and vagina of mammals and are not considered to be patho-
genic to healthy individuals. Some species are useful in
making dairy products (e.g., cheese and yogurt) whereas
others are active in food spoilage.
The family Streptococcaceae is composed of species
whose cells are spherical to ovoid and usually occur in pairs
or chains. They are catalase negative (page 63) and produce
lactic acid as the end product of fermentation. Often, ele-
vated CO
2
in the environment is required for growth. He-
molytic reaction on blood agar (page 61) and serological
testing for cell wall carbohydrates (for placement into one
of the Lancefield groups—first established by Rebecca
Phylum Firmicutes
Sulfur Oxidizing Bacteria
This Bacterial group is composed of chemolithotrophic
organisms that get their energy by oxidizing reduced sulfur
compounds, such as H
2
S and S
0
. They are also autotrophic.
Examples include the genera Beggiatoa (Figures 19-32 and
19-34) and Thiothrix (both Gammaproteobacteria). They
are distinctive because they form long filaments, move by
gliding, and store sulfur granules in their cytoplasm. More
information about sulfur oxidizing Bacteria can be found
on pages 235 and 236.
Desulfovibrionales
(Deltaproteobacteria)
Desulfovibrio is the type genus of the order. Its cells are
curved (sometimes straight) motile rods. Metabolism is
primarily respiratory, with sulfate as the final electron
acceptor of the ETS being reduced to sulfide. Figure 19-35
shows a community of sulfur reducing bacteria recovered
from anoxic mud.
11-20
G
REEN
S
ULFUR
B
ACTERIA
An accumulation
of green sulfur bacteria is
visible on the left side of this
Winogradsky column.
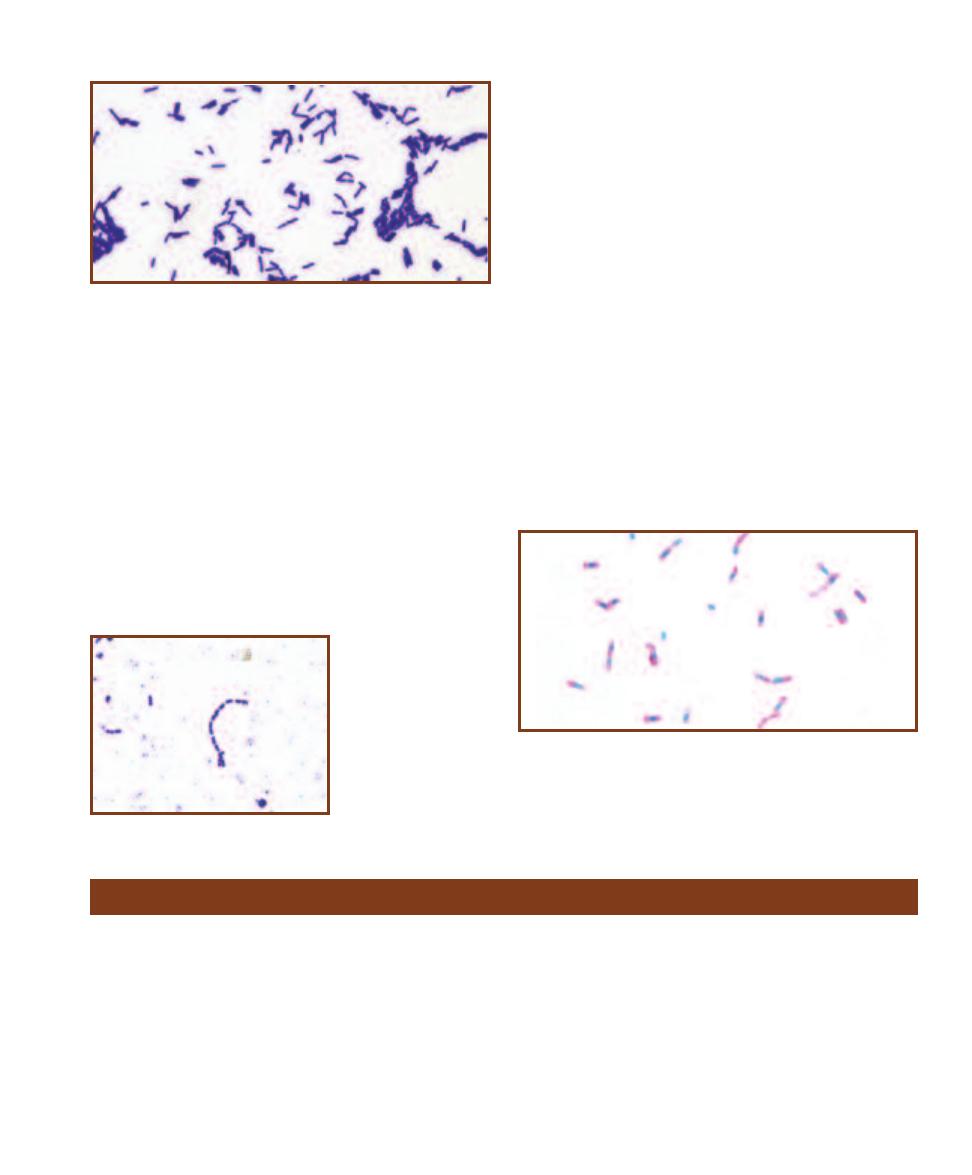
SECTION 11
䢇
Domain Bacteria
䢇
131
Phylum Actinobacteria
Actinobacteria is a large and diverse phylum with a single
order (Actinomycetales). Cells are typically Gram-positive
rods with a high GⳭC%. Most are aerobes. They are found
in soil and plant material, though there are some pathogens.
Six families will be covered: Corynebacteriaceae, Mycobac-
teriaceae, Micrococcaceae, Nocardiaceae, Propionibacteri-
aceae, and Streptomycetaceae.
Cells of the family Corynebacteriaceae are irregularly-
shaped rods that form “V” shapes as a result of “snapping
division,” where the adjoining wall between cells incompletely
separates (Figure 5-27). They are sometimes club-shaped
(Figure 6-30). Metabolism is fermentative with acid, but no
gas, being the end product. They are facultative anaerobes
and are catalase positive (page 63). Corynebacterium species
are found on mammalian mucous membranes. C. diphtheriae
is a human pathogen (page 143).
A defining characteristic of the Mycobacteriaceae is that
they are acid-fast at some point in their life cycle (page 49
and Figures 6-16 and 6-18) due to an abundance of waxy
mycolic acid in their walls. They stain weakly Gram-positive
Lancefield in 1933) remain important characteristics in iden-
tifying Streptococcus species. S. pneumoniae (page 160) and
S. pyogenes (page 161) are important human pathogens, but
the majority of species are commensals of mucous membranes
of warm-blooded animals. Lactococcus, once included in the
genus Streptococcus because of morphological and metabolic
similarities, was formed because there are many biochemical
differences, including the Lancefield Group N antigen.
The family Enterococcaceae comprises four genera, but
the type genus (and largest genus) is Enterococcus (Figure
11-22). Members of this genus are ovoid Gram-positive
cocci usually arranged in pairs or short chains. Most perform
homofermentative metabolism with lactic acid being the
primary end product. Catalase (page 63) is not produced.
Most are resistant to 40% bile and hydrolyze esculin (page
60). At one time they were classified as Lancefield Group D
Streptococcus, but more recently identified Enterococcus
species do not demonstrate this antigen. Of the 30Ⳮ species,
two are common human commensals (and opportunistic
pathogens): E. faecalis and E. faecium.
Clostridiales
This order is large and diverse. We will focus on the type
genus, Clostridium (Figure 11-23), which itself has 168
species! As a rule, clostridia are Gram-positive, obligately
anerobic, endospore-forming rods. They lack an electron
transport chain and are thus fermentative. The fermentable
substrate is often either carbohydrate(s) or amino acids, and
the end products represent a wide range of organic com-
pounds. Most are found in anaerobic regions of soil and
mammalian digestive tracts. Five pathogenic species are
covered beginning on page 140.
11-23
C
LOSTRIDIUM
Members of this genus are anaerobic, Gram-
positive, endospore-forming rods. The spores often distend the cell,
making the region look swollen. This is not the case in this micrograph
of C. sporogenes grown in culture. See Figure 12-22 for a micrograph of
C. tetani and its terminal spores causing a swelling of the cell.
11-21
L
ACTOBACILLUS PLANTARUM
Lactobacillus cells are Gram-
positive, nonsporing rods of varying sizes (L. plantarum is among the
largest, reaching lengths up to 8 µm). Metabolism is fermentative, with
lactate comprising the majority of end products.
11-22
E
NTEROCOCCUS
FAECIUM
Short chains of
ovoid cocci are typical of
the genus Enterococcus.
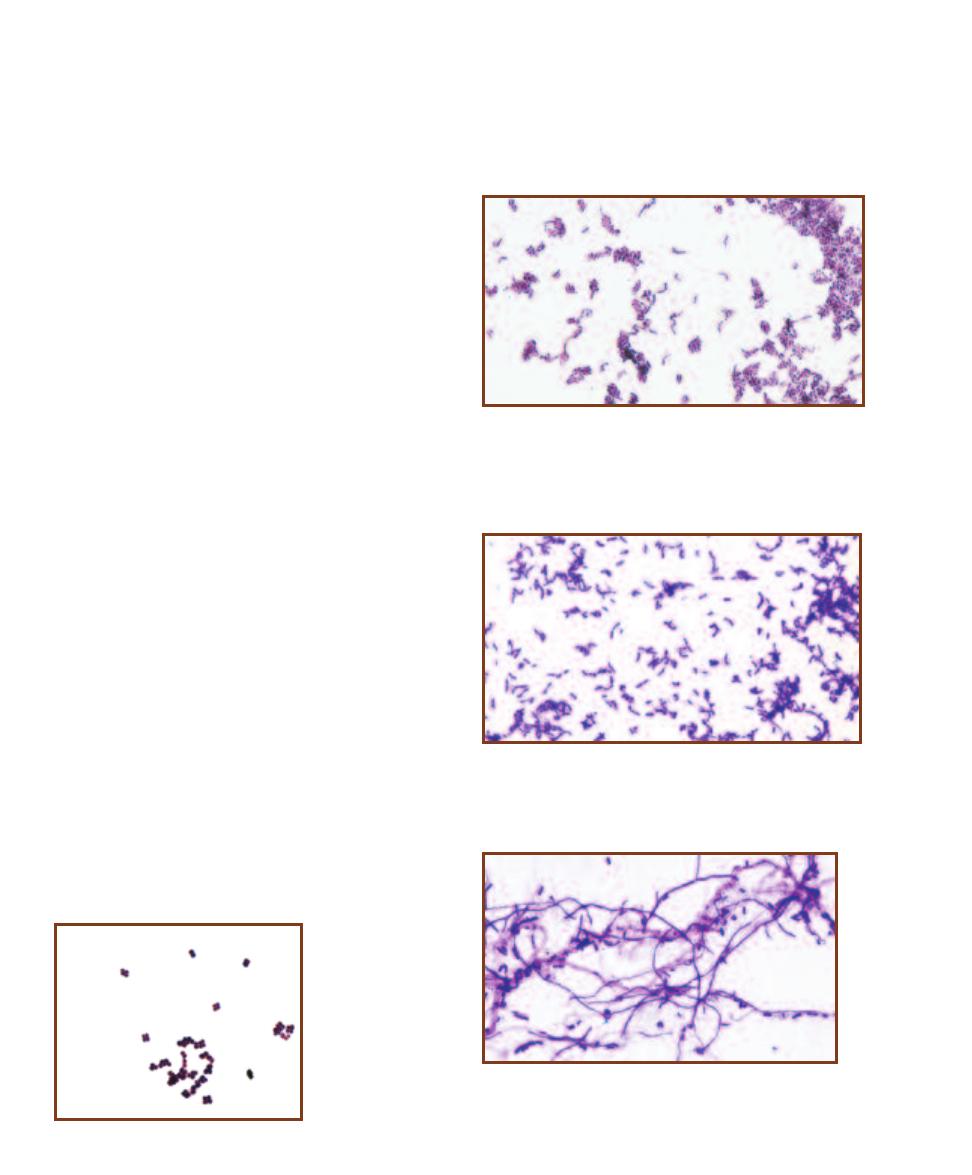
because of the mycolic acid. Mycobacterium species are
nutritionally nonfastidious, though M. leprae cannot be
cultivated in standard bacteriological media because it is an
intracellular parasite. Differentiation between Mycobacterium
species relies, in part, on whether the isolate is a “slow
grower” or a “fast grower,” and whether it produces a
carotenoid pigment in the light (“photochromogenic”), in
the light or dark (“scotochromogenic”) or not at all. Two
important pathogens are M. leprae (Figure 12-37) and
M. tuberculosis (Figure 12-38).
Micrococcus (Figure 11-24) is the type genus for the
family Micrococcaceae. Its cells are cocci, ranging in diam e-
ter from 0.5–2 µm, and are often arranged into tetrads or
irregular clusters. They are aerobic, respiratory chemo-
heterotrophs and are usually (weakly) oxidase and catalase
positive (pages 87 and 63, respectively). They are found
on human skin and in the soil. Arthrobacter is also in this
family (Figure 11-25). Its cells are rods during exponential
growth, but fragment to form cocci in stationary phase.
Propionibacterium is the type genus of the family Pro -
pionibacteriaceae. Cells are Gram-positive, pleomorphic
rods that are often arranged in “V” or “Y” configurations.
Metabolism is fermentative, with large amounts of propionic
acid as the end product. They are aerotolerant to varying
degrees. Propionibacterium is found in dairy products and is
the primary fermenter in Swiss cheese production. They also
inhabit human skin. P. acnes (Figure 11-26) is an example.
Species of Nocardiaceae produce branched filaments
(hyphae) that cover and penetrate the growth surface. Aerial
hyphae are also produced. Nocardia species are aerobic,
weakly Gram-positive or Gram-variable, and partially acid-
fast. Nocardia asteroides (Figures 12-44 through 12-46) is a
human pathogen.
Superficially, members of the family Streptomycetaceae
have much in common with fungi, but they aren’t considered
fungi because they are prokaryotic. However, due to these
similarities (and for historical reasons), fungal terminology
is applied to them. Streptomycetes produce branching hyphae
that intertwine to form a mycelium. As the mycelium ages,
aerial hyphae emerge and produce reproductive spores at
their tips. The type genus, Streptomyces (Figure 11-27),
comprises 500Ⳮ species. They are Gram-positive obligate
aerobes with the ability to metabolize diverse carbon com-
pound from their environment, which is frequently the soil.
Many produce geosmin, a chemical responsible for the
“earthy” fragrance of soil. The majority of Streptomyces
species also produce antibiotics.
132
䢇
A Photographic Atlas for the Microbiology Laboratory
11-26
P
ROPIONIBACTERIUM
This micrograph is of Propionibac-
terium acnes grown in culture. P. acnes is a commensal that lives in
sebaceous glands (associated with hair follicles) and gets its energy
from digesting the oily secretion. If the pore becomes blocked and
ruptures, an infection can occur and produce a pimple.
11-27
S
TREPTOMYCES
This is a micrograph of Streptomyces
griseus grown in culture. Note the branched hyphae and spores.
The spores are approximately 1 µm in length.
11-25
A
RTHROBACTER
Cells in the preparation made from
Arthrobacter grown in culture demonstrate the angular arrangement
from which their name is derived (“arthro” means “joint”). The slide
was made during exponential growth of the culture, as evidenced by
most cells being rod-shaped. As a culture enters stationary phase, the
rods fragment and form coccid cells.
11-24
M
ICROCOCCUS
Members of the genus
Micrococcus frequently
form tetrads. These cells
were grown in culture.
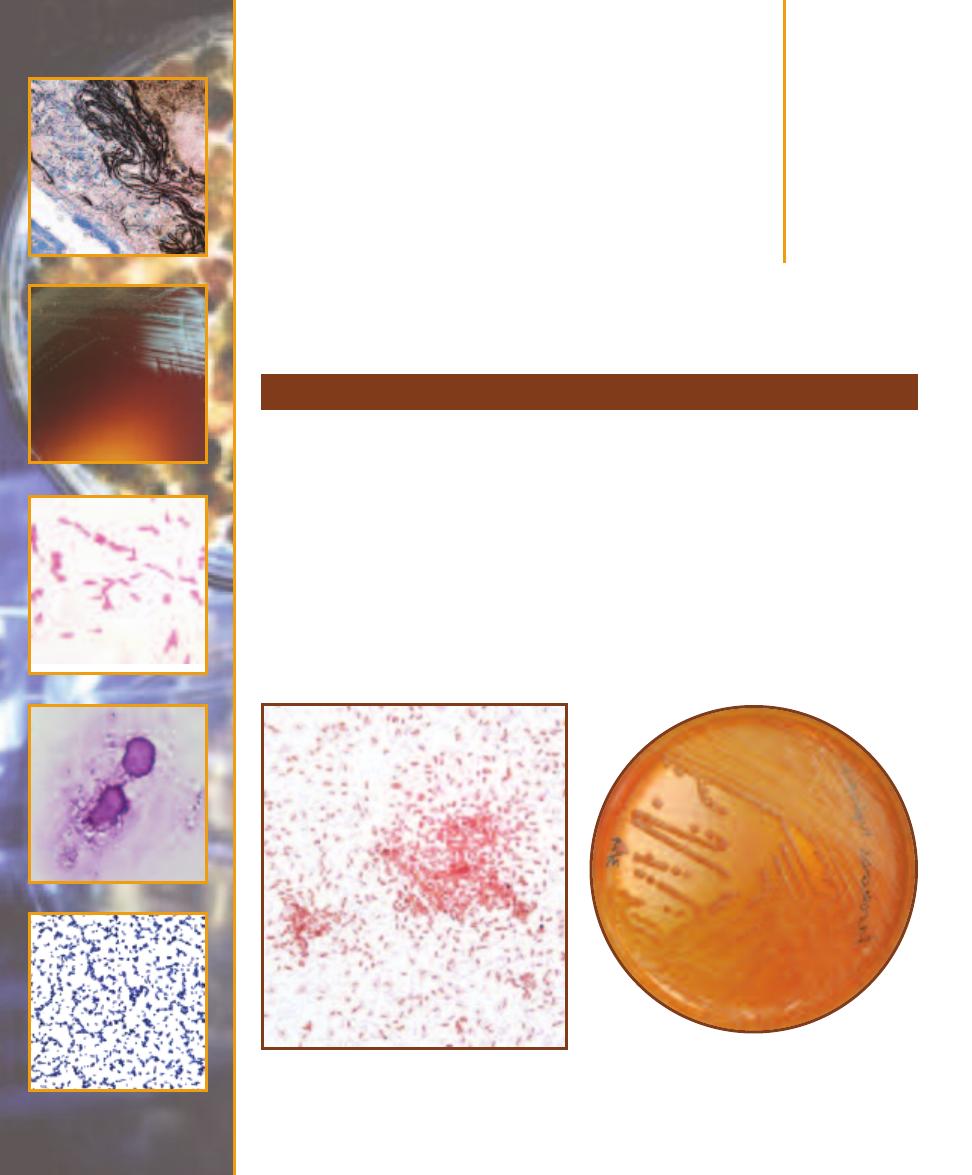
Bacterial Pathogens
Aeromonas hydrophila (Class Gammaproteobacteria) is a leech gut symbiont found in aquatic habi-
tats worldwide. It causes infections by colonizing leech bite wounds, open trauma wounds, or by
being ingested as a food or water contaminant. When ingested, it adheres to the intestinal mucous
membrane and produces an enterotoxin that causes acute watery diarrhea. When introduced
through a superficial wound, the organism may be contained locally or spread throughout sur-
rounding tissue in a condition called cellulitis. Rarely, when intro duced through an open wound
(especially deep penetrating wounds) it can produce a gas gangrene-like infection called A. hy-
drophila myo necrosis. Both cellu litis and A. hydrophila myonecrosis can quickly lead to bacteremia
and systemic toxicity. Mortality rates are high among leukemia, lymphoma, and otherwise immuno-
suppressed patients following sepsis.
Differential Characteristics
A. hydrophila is a motile, facultatively anaerobic Gram- negative rod (Figures 12-1 and 12-2). It
ferments sucrose and mannitol, is positive for ONPG, indole, lysine decarboxylase, and esculin
Aeromonas hydrophila
12
S E C T I O N
133
12-1
G
RAM
S
TAIN OF AN
A
EROMONAS HYDRO
-
PHILA
S
TOCK
C
ULTURE
Cells can range in size from
1 µm or less wide and 1.0–3.5 µm long with rounded
ends.
12-2
A
EROMONAS HYDROPHILA ON
M
AC
C
ONKEY
A
GAR
MacConkey Agar is typically used to identify coli -
forms—Gram- negative organisms that discolor the medium
and produce pink colonies. A. hydrophila can be distin-
guished by its lack of color.
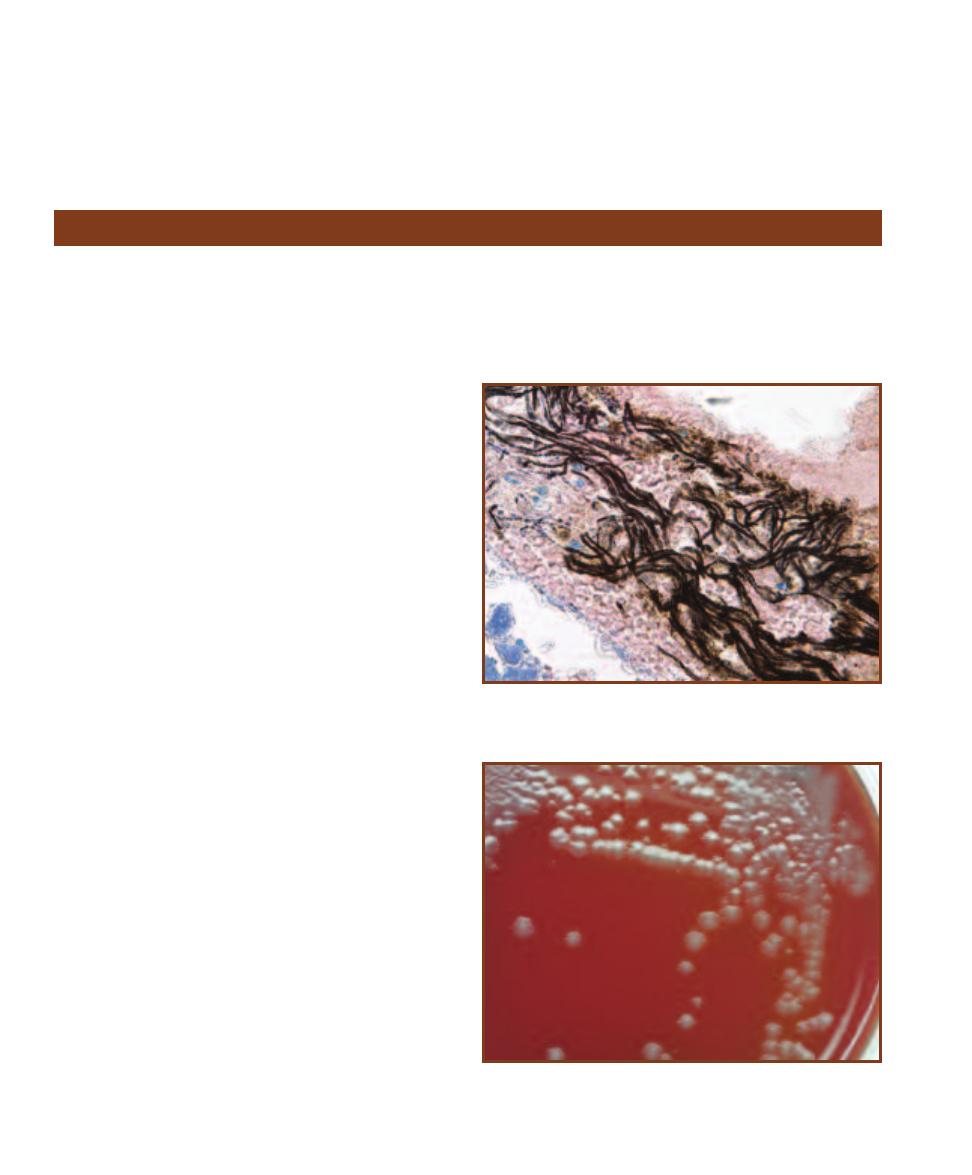
hydrolysis, and negative for ornithine decarboxylase.
Diagnostic procedures include Gram stain, aerobic and
anaerobic blood culture, stool culture, and wound culture.
A positive oxidase result helps differentiate it from enterics.
Treatment
Administration of third generation cephalosporins, fluoro-
quinolones, sulfamethoxazole, or trimethoprim.
134
䢇
A Photographic Atlas for the Microbiology Laboratory
Bacillus anthracis
Since the September 11, 2001 terrorist attack on the World
Trade Center and the subsequent discovery of Bacillus
anthracis spores in mail and other locations, this organism
has received a great deal of attention. While that attention
is important and necessary, “weaponized” bacteria or other
microbes are not within the scope of this manual. When an
organism is grown and processed as a biological weapon its
effect on the population is dependent on innumerable vari-
ables such as strain, its current form and concentration, and
all circumstances surrounding its distribution. Under such
conditions the organism’s virulence is, at the very least,
unpredictable. Therefore, we discuss understood and
observable characteristics of “wild-type” organisms and
avoid speculating on the potential of man-made versions.
Bacillus anthracis (Phylum Firmicutes) causes anthrax
in animals (mostly herbivores) and, more rarely, in humans.
The intestinal tract of asymptomatic large animals is its
principal habitat; however, B. anthracis spores have been
known to remain viable in the soil for years. Three types of
anthrax occur in humans: cutaneous anthrax, inhalation
anthrax (“woolsorter’s disease”), and gastro intestinal
anthrax. The cutaneous and inhalation forms are most
frequently the result of contact with spores carried in wool
or goat hair; gastrointestinal disease usually results from the
consumption of contaminated meat.
Two virulence factors account for the organism’s patho-
genicity: 1) a capsule which enables it to survive phagocyto-
sis and disseminate via the bloodstream, and 2) secretion of
three exotoxins—edema toxin, lethal toxin, and protective
antigen. Protective antigen forms pores in the target cell’s
membrane, which allows entry of the other toxins. Edema
toxin is responsible for the necrotic lesions (eschars) sur-
rounded by large areas of swelling characteristic of cutaneous
anthrax. Lethal toxin is a protease that interferes with cyto -
kine production, neutrophil chemotaxis, and macrophage
survival—all of which compromise the immune system and
allow rapid multiplication of the pathogen. This is followed
by entry into the blood, producing bacteremia, shock, and
meningitis. [Note: Two plasmids—pOX1 and pOX2 are
responsible for toxin and capsule production respectively. In
addition, a product of pOX1 helps regulate capsule produc-
tion by pOX2. Yet, surprisingly, organisms missing pOX1
are nearly as virulent as unaltered organisms, which suggests
the possible presence of other undiscovered virulence factors.]
Differential Characteristics
B. anthracis is a facultatively anaerobic, nonmotile, encap-
sulated, endospore-forming, Gram-positive rod (Figures
12-3 and 12-4). It will not grow on phenylethyl alcohol
blood agar, is catalase-positive, and gelatinase-negative.
12-3
G
RAM
S
TAIN OF
B
ACILLUS ANTHRACIS IN A
M
OUSE
L
IVER
B
LOOD
V
ESSEL
Cells resemble Bacillus cereus and are approximately
1 µm wide by 3.0–5.0 µm long.
12-4
B
ACILLUS ANTHRACIS ON
S
HEEP
B
LOOD
A
GAR
B. anthracis
typically produces large, gray, rough-textured colonies on Sheep Blood
Agar. It is nonhemolytic.
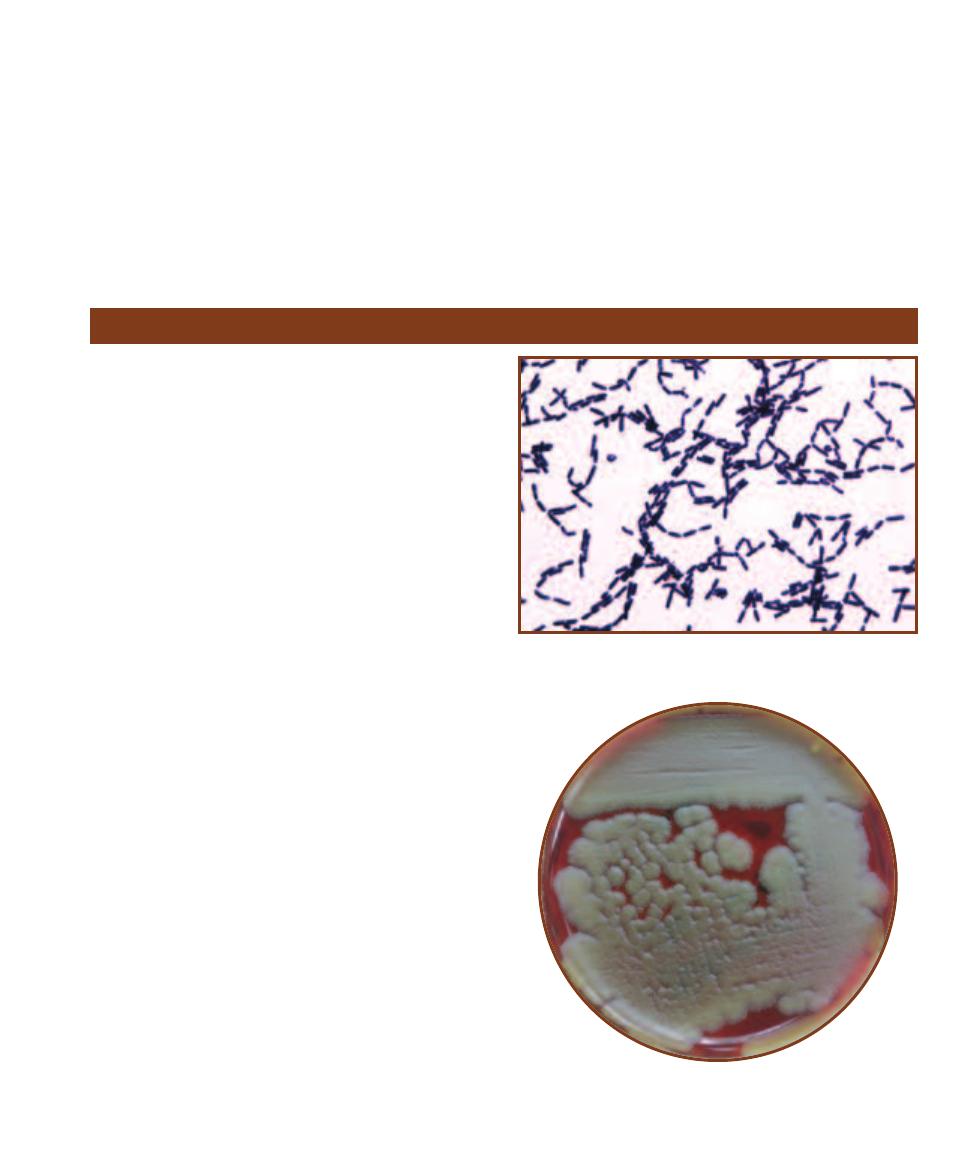
Diagnostic procedures include Gram stain, endospore stain,
and aerobic culture.
Treatment
Penicillin is the traditional treatment for anthrax, although
B. anthracis has demonstrated susceptibility to a broad
variety of antibiotics. Recently however, the strains of
B. anthracis isolated from victims of the bioterrorist attacks
of 2001, although susceptible to penicillin and ampicillin,
demonstrated in vitro resistance to several previously effec-
tive antibiotics. Even more significantly, the organisms were
found to contain constitutive and inducible
-lactamases,
which could lead to penicillin resistance. (See
-lactamase
Test on page 59.) As a result, the CDC has advised against
the use of penicillin or ampicillin. Today the recommended
treatment is a sixty-day regimen of doxycycline or cipro -
floxacin (intravenous in severe cases) combined with a
second antibiotic.
SECTION 12
䢇
Bacterial Pathogens
䢇
135
Bacillus cereus
Bacillus cereus (Phylum Firmicutes) is the second of two
principal pathogens in the Bacillus genus (see B. anthracis,
page 134). It is responsible for two types of food poisoning
and severe ocular infections. The mechanism of ocular
infection is not well understood, but may be caused by
interaction of three toxins—necrotic toxin (heat-labile
enterotoxin), cereolysin (a powerful hemolysin), and phos-
pholipase C (a lecithinase). This rapidly destructive form
of infection is common among intravenous drug users,
immunosuppressed patients, and farmworkers following
eye trauma. Food poisoning from B. cereus presents in two
forms—emetic form and diarrheal form. The emetic form is
caused by heat-stable enterotoxin, appears one to six hours
after exposure, and typically lasts less than 24 hours. It
most frequently appears in cooked rice that has not been
properly refrigerated. The spores that survive the initial
cooking germinate and multiply rapidly, releasing toxin that
is not destroyed by further cooking. The diarrheal form,
caused by heat-labile enterotoxin, appears approximately
nine hours after exposure, and typically lasts 24 to 36 hours.
Foods that cause the diarrheal form are meat, vegetables,
and sauces.
Differential Characteristics
B. cereus is a motile, facultatively anaerobic, endospore-
forming, Gram-positive rod (Figures 12-5 and 12-6). It pro-
duces acid from glucose, maltose, and salicin fermentation,
and is lecithinase- and gelatinase-positive. Diagnostic proce-
dures include Gram stain and aerobic culture.
Treatment
Gastrointestinal disorders are not typically treated with
antibiotics. B. cereus is often resistant to
-lactam drugs
such as penicillin and cephalosporin. The recommended
treatment for ocular and other infections is vancomycin
by itself or in combination with an aminoglycoside such
as gentamicin, neomycin, or streptomycin.
12-5
G
RAM
S
TAIN OF A
B
ACILLUS CEREUS
S
TOCK
C
ULTURE
Rods
are approximately 1 µm wide by 3–5 µm long.
12-6
B
ACILLUS CEREUS ON
S
HEEP
B
LOOD
A
GAR
Note the raised,
dull, gray colony morphology compared to B. anthracis colonies in
Figure 12-4.
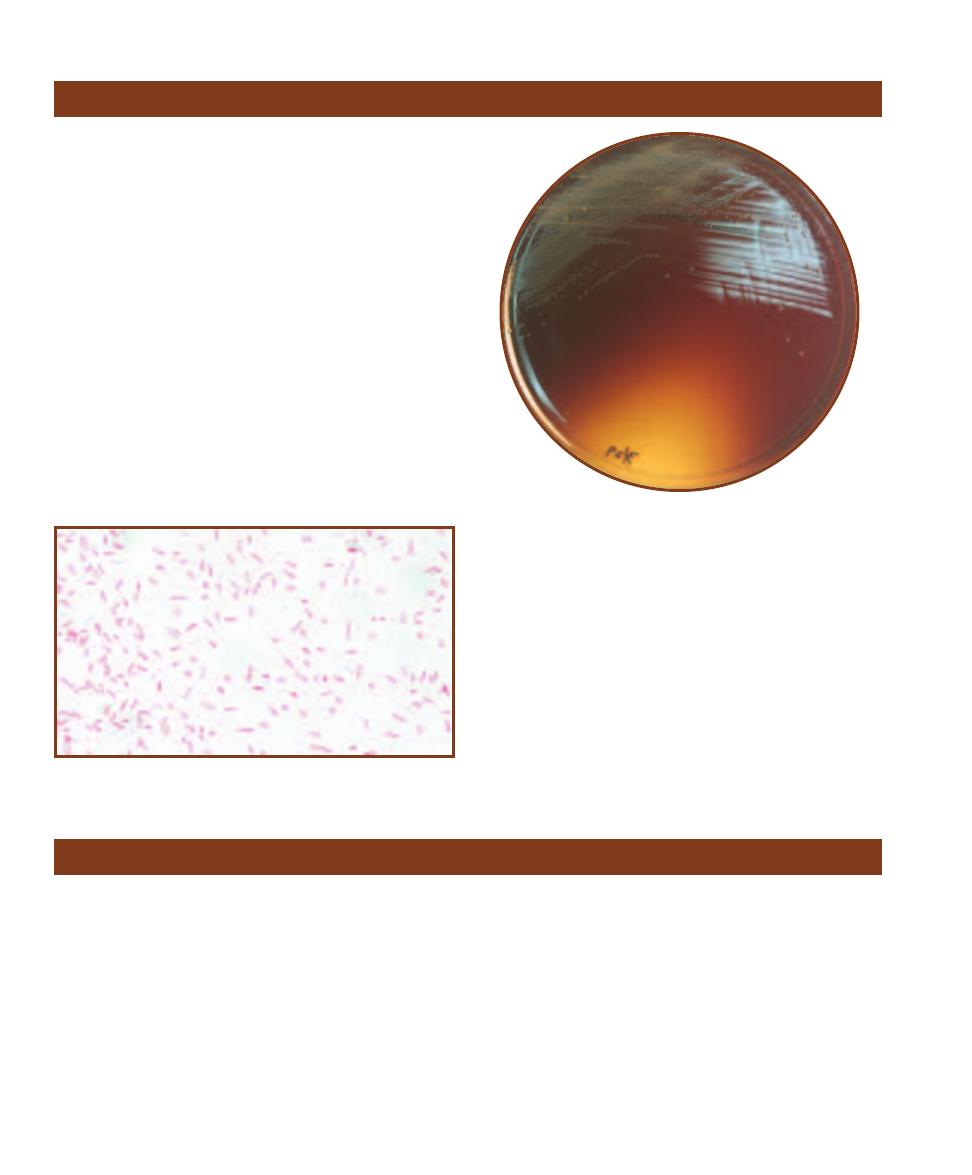
Several Bacteroides species (Phylum Bacteroidetes) reside in
the human gastrointestinal tract and, to a lesser extent, in
the female genital tract. Normal stool contains 10
11
cells per
gram, 1000 times greater than the facultative anaerobes!
Bacteroides fragilis is responsible for the majority of intra-
abdominal infections and is recovered from most other
human infections. It causes intra-abdominal abscesses (peri-
tonitis) and rarely lung abscesses. Intra-abdominal abscesses
usually result after spillage of intestinal contents into the
abdominal cavity from a ruptured appendix or a penetrating
wound. Lung abscesses are usually a consequence of aspira-
tion pneumonia and typically consist of a mixture of patho -
gens (polymicrobic) sometimes including B. fragilis and oral
streptococci.
Differential Characteristics
B. fragilis is a pleomorphic, encapsulated, nonmotile, an -
aerobic, Gram-negative rod (Figures 12-7 and 12-8). It varies
in size from 1.5 to 6
m long. It does not ferment arabinose,
melezitose, or salicin, but grows well in the presence of 20%
bile, is indole-negative, and catalase-positive (unusual for an
anaerobe). Diagnostic procedures include Gram stain and
anaerobic culture.
Treatment
Administration of metronidazole, clindamycin, ampicillin
with sulbactam (a
-lactamase inhibitor), carbapenems,
cefotetan, cefoxitin, piperacillin with tazo bactam sodium,
or ticarcillin with clavulanate potassium.
136
䢇
A Photographic Atlas for the Microbiology Laboratory
Bacteroides fragilis
12-7
G
RAM
S
TAIN OF A
B
ACTEROIDES FRAGILIS
S
TOCK
C
ULTURE
Note the variable lengths (typically between 1.5 and 6 µm).
12-8
B
ACTEROIDES FRAGILIS GROWING ON
B
ACTEROIDES
B
ILE
E
SCULIN
A
GAR
Note the darkening of the medium due to the re-
action of esculin breakdown products with ferric ammonium citrate.
For more information on Bile Esculin Agar, refer to Section 7.
Bordetella pertussis
Bordetella pertussis (Class Betaproteobacteria) is the cause of
the disease known as pertussis or “whooping cough,” char-
acterized by violent coughing, vomiting, and gasping for
breath. It can infect anyone with no immunity or diminished
immunity, but is most severe and communi cable among
infants less than one year of age. Humans are the exclusive
host of this organism, and asymptomatic or unrecognized
symptomatic adults are the likely reservoirs. This highly
communicable organism infects greater than 90% of un -
immunized people exposed. The bacteria enter the mouth
or nasopharynx as aerosols then attach themselves to the
respiratory cilia. Although the active disease caused by
B. pertussis appears to be a super ficial infection, it secretes
an array of virulence factors that destroy the underlying
epithelial tissue and act to impair the body’s natural defenses.
Differential Characteristics
B. pertussis is a small, nonmotile, obligately aerobic, Gram-
negative coccobacillus (Figures 12-9 and 12-10). It is
oxidase-positive, urease-negative, and nitrate-negative.
Diagnostic procedures include polymerase chain reaction
(PCR—page 111), direct fluorescent antibody (DFA—page
105), nasopharyngeal culture, and enzyme-linked immuno -
sorbent assay (ELISA—page 103).
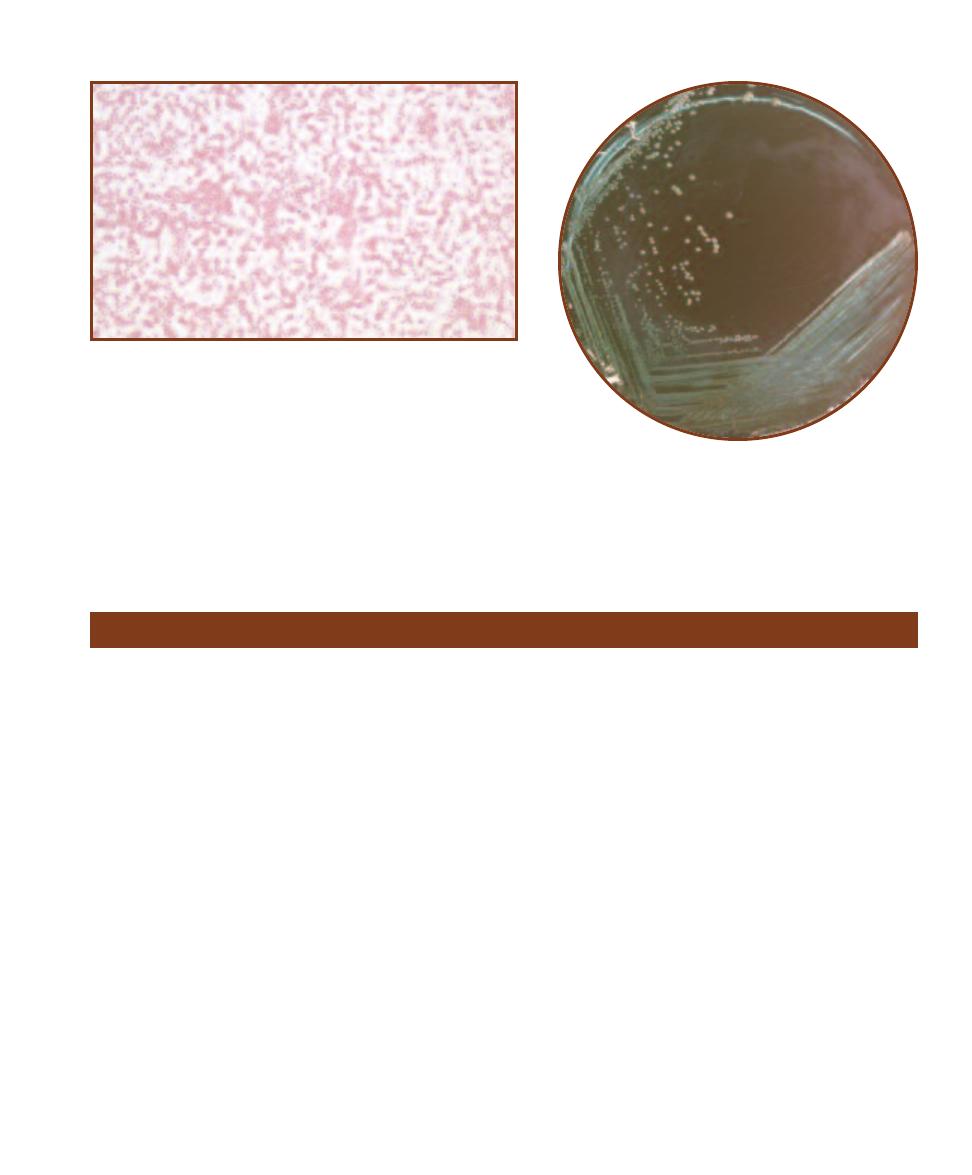
Treatment
Antibiotic treatment is primarily erythromycin, but also
azithromycin, clarithro mycin, tetracycline, sulfamethoxazole
with trimethoprim, and chloramphenicol. But, the best treat-
ment is immunization with 5 doses of pertussis vaccine—one at
2, 4, and 6 months of age, again at 15–18 months, and a final
dose prior to entering school.
SECTION 12
䢇
Bacterial Pathogens
䢇
137
12-9
G
RAM
S
TAIN OF A
B
ORDETELLA PERTUSSIS
S
TOCK
C
ULTURE
These
minute coccobacilli are usually arranged singly or in pairs and exhibit bipolar
staining. They can range in size from 0.2–0.5 µm wide by 0.5–1.0 µm in length.
12-10
B
ORDETELLA PERTUSSIS
G
ROWING ON
R
EGAN
-L
OWE
A
GAR
Regan-Lowe Agar is a selective medium designed to
isolate B. pertussis and B. parapertussis from clinical specimens.
Borrelia burgdorferi
Borrelia burgdorferi (Phylum Spirochaetes) causes Lyme
borreliosis, more commonly called Lyme disease because the
first reported case occurred in 1977 in Lyme, Connecticut.
B. burgdorferi was isolated in 1982 and thought to be the
sole infective agent in the disease. Subsequent studies, how-
ever, have implicated at least 9 other Borrelia species.
Lyme disease is transmitted by two tick species from
genus Ixodes—I. dammini and I. pacificus. It is estimated
that from 30% to 75% of I. dammini carry the organism,
which suggests why Lyme disease is the most common
vector-borne illness in the United States. Disease carrying
ticks reside most commonly in coastal wooded areas
inhabited by white-footed mice and white-tailed deer. Nine
states (California, Connecticut, Rhode Island, New Jersey,
Pennsylvania, Minnesota, Wisconsin, Massachusetts, and
New York) have reported 90% of all cases in the country.
Lyme borreliosis is characterized by three distinct stages:
Stage 1. Localized, but expanding (erythema migrans), skin
lesion accompanied by headache, fatigue, and malaise;
Stage 2. Weeks to months later, the inflammation and pain
become generalized with the possible development of
meningoencephalitis or myo carditis; Stage 3. After months
or even years of latency the infection becomes chronic,
producing severe headaches, muscle and joint pain, and
secondary skin lesions.
Differential Characteristics
Borrelia burgdorferi is a motile, microaerophilic, Gram-
negative, spirochete (Figure 12-11). The B. burgdorferi
population in infected sites is low, so lab cultures are rarely
positive. In their place, serological tests are used. An indirect
enzyme-linked immunosorbent assay (ELISA—page 103),
detects patient Igm and IgG targeting the spirochaete. A
Western blot test (page 106) has higher specificity and is
used to confirm positive ELISA tests. False negative ELISAs
may result from a late rise in IgG just under half the patients
and from the effect of anti biotic treatment.
Treatment
Administration of amoxicillin, deoxycycline, or cefuroxime.
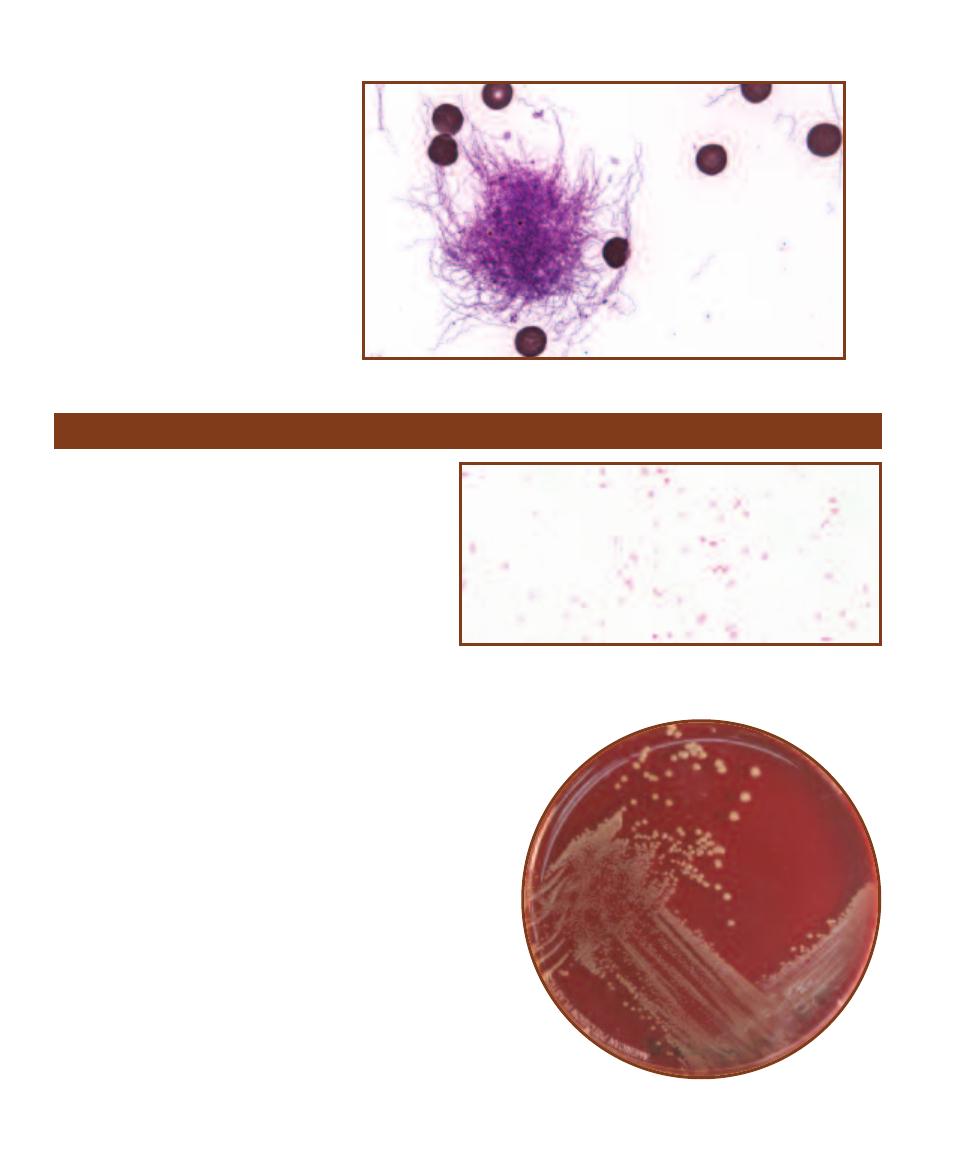
138
䢇
A Photographic Atlas for the Microbiology Laboratory
12-11
G
IEMSA
S
TAIN OF
B
ORRELIA
BURGDORFERI IN
B
LOOD
Although this
organism is Gram-negative, it is best observed
using Giemsa Stain. Note the red blood cells.
Brucella melitensis
Brucella melitensis (Class Alphaproteobacteria), the most
viru lent species of the genus Brucella, is a small, non-
motile, aerobic, Gram-negative coccobacillus. Although
most brucellae cause brucellosis (sometimes called
undulant fever), B. melitensis is responsible for the most
severe symptoms. Each of the infective agents of bru -
cellosis has a domestic animal reservoir: B. melitensis
(goats and sheep), B. abortus (cattle), B. suis (swine), and
B. canis (dogs). Each organism has a different carrier, but
all infect humans in three principal ways: ingestion, direct
contact through abraded skin, or inhalation. The most
common form in the United States is from ingestion of
contaminated unpasteurized milk or other dairy products.
B. melitensis resists the body’s defense system because it
is an intracellular parasite—it actually lives and multiplies
inside macrophages. It travels throughout the body by way of
the circulatory system, multiplying inside of and destroying host
phagocytic cells, thus releasing more bacteria to continue the
cycle. The result is granuloma formation and tissue destruction
in the lymph nodes, bone marrow, kidneys, liver, and spleen.
Differential Characteristics
Brucella species can be preliminarily identified by cell and
colony morphology, and growth characteristics in special
Brucella media containing blood and antibiotics (Figures 12-12
and 12-13). Diagnostic procedures include Brucella blood cul-
ture, anaerobic culture, and Gram stain. A serum agglutination
test (SAT—page 101) using B. melitensis-specific serum is used
to confirm identification, as is an indirect ELISA (page 103).
Treatment
Administration of doxycycline in combination with rifampin or
sulfamethoxazole and trimethoprim used in combination with
rifampin.
12-12
G
RAM
S
TAIN OF A
B
RUCELLA MELITENSIS
S
TOCK
C
ULTURE
Cells
are coccobacilli 0.5 µm wide by 0.6–1.7 µm long. Usually arranged singly,
these poorly staining cells were counterstained for 5 minutes to darken the
cells for photographic purposes.
12-13
B
RUCELLA MELITENSIS
G
ROWING ON
S
HEEP
B
LOOD
A
GAR
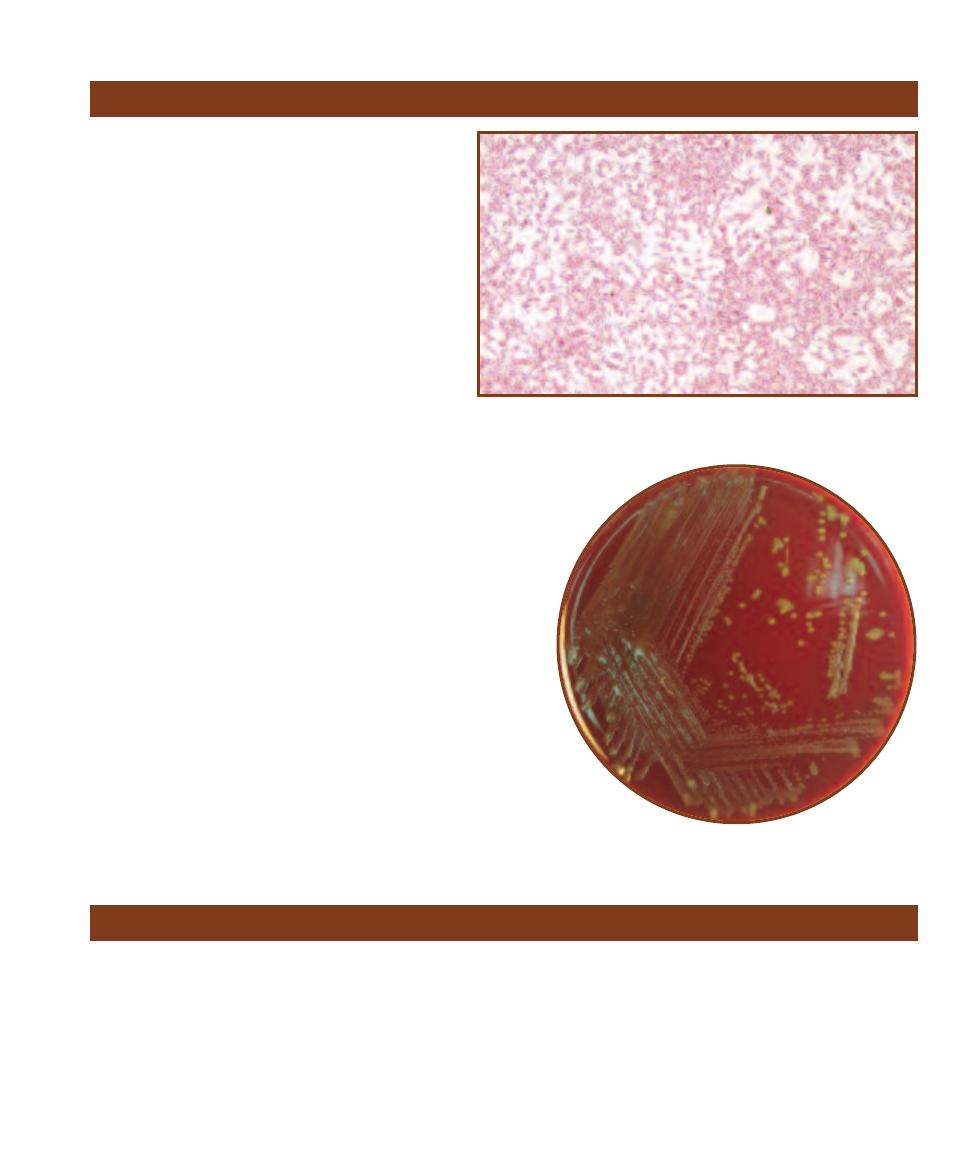
Campylobacter jejuni
(Class Epsilonproteobacteria) is
a common, worldwide human pathogen usually found
in chickens, but also isolated from house pets, domes-
tic animals, and waterfowl. It is estimated to cause
more than 2 million cases of gastroenteritis each year
in the United States. To put this number in perspective,
C. jejuni-caused gastroenteritis is more common than
that caused by Salmonella and Shigella combined!
Transmission of the disease is usually by ingestion
of raw milk, undercooked poultry or meat, or contam-
inated water. Once inside the small intestine the organ-
ism cork screws into the mucous layer, multiplies, and
secretes a cholera-like enterotoxin that causes watery
diarrhea. In most cases the infection is self-limiting and
the diarrhea ends after a few days. Some strains, how-
ever, may secrete a cytotoxin that destroys local cells
and causes bloody diarrhea. Dissemination by the
bloodstream may result in salmonellosis-like enteritis and
extraintestinal infection. In recent years, this organism has been
implicated in a variety of infections including septic arthritis,
meningitis, procto colitis, spontaneous abortion, and Guillain-
Barré syndrome, a degenerative nerve disorder.
Differential Characteristics
C. jejuni is a motile, microaerophilic, capnophilic (requires 5%
to 10% CO
2
), nonsporing, Gram-negative helical or curved rod.
Cells sometimes appear as “S” or “gull wing” shapes (Figure
12-14). It reduces nitrate to nitrite and hydrolyzes hippurate.
Diagnostic procedures include aerobic and anaerobic blood
culture, and stool culture (Figure 12-15).
Treatment
The infection typically resolves on its own, but the anti biotics
azithromycin, ciprofloxacin, erythromycin, doxycycline, or
fluoroquinolones may be used.
SECTION 12
䢇
Bacterial Pathogens
䢇
139
12-14
G
RAM
S
TAIN OF A
C
AMPYLOBACTER JEJUNI
S
TOCK
C
ULTURE
Note
the characteristic “S” and “gull wing” shapes of the paired organisms.
12-15
C
AMPYLOBACTER JEJUNI ON
S
HEEP
B
LOOD
A
GAR
Campylobacter jejuni
Citrobacter spp.
Species in the genus Citrobacter (Class Gammaproteobacteria)
live almost exclusively in the human lower intestine. Unlike
other members of the family Enterobacteriaceae, many of
whom live freely outside a human host, presence of Citro -
bacter in the environ ment almost certainly suggests fecal
contamination. Citrobacter species are potent opportunistic
pathogens. They rarely cause disease in healthy people, but
are significant agents of respiratory and urinary nosocomial
infections, hospital-acquired bacteremia, and neonatal
meningitis. Virulence factors include an enterotoxin and
lipopolysaccharide outer membrane believed to mediate
the “sepsis syndrome,” including fever, leucopenia, and
“disseminated intravascular coagulation.” Sepsis involving
Citrobacter spp. is usually polymicrobic whereas urinary
infections and pneumonia tend to be monomicrobic, yielding
pure cultures upon examination.
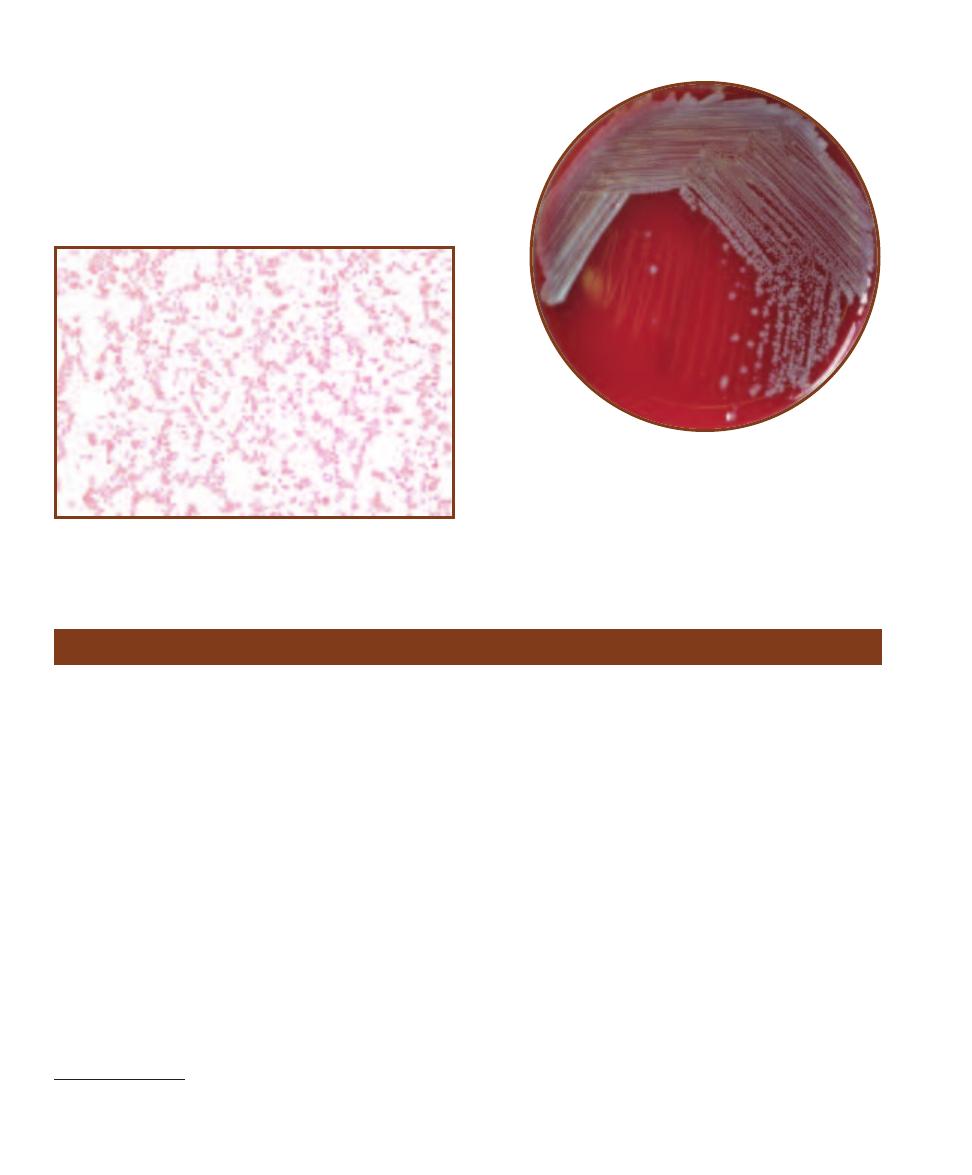
Differential Characteristics
Citrobacter spp. are motile, facultatively anaerobic Gram-
negative rods (Figures 12-16 and 12-17). They ferment glu-
cose and utilize citrate (often as the sole carbon source), are
methyl red and catalase positive, and are Voges-Proskauer,
oxidase, and lysine decarboxylase negative. Diagnostic
procedures include Gram stain and aerobic culture.
Treatment
Third generation cephalosporins, penicillins, imipenem
with cilastatin, meropenem, or fluoroquinolones may be
administered.
140
䢇
A Photographic Atlas for the Microbiology Laboratory
12-16
G
RAM
S
TAIN OF A
C
ITROBACTER KOSERI
S
TOCK
C
ULTURE
These straight rods usually appear singly and are about 1 µm wide by
2.4 µm long.
12-17
C
ITROBACTER KOSERI ON
S
HEEP
B
LOOD
A
GAR
Clostridium botulinum
Clostridium botulinum (Phylum Firmicutes) is a spore
forming anaerobe typically found in soil. Further, the spores
are widely distributed in the environment. There are seven
known strains—A, B, C, D, E, F, and G—each of which
produces an antigenically distinct toxin. Neurotoxins A, B,
E (and sometimes F)
1
cause botulism in humans. There are
three types of botulism known to occur in humans—food-
borne, infant, and wound. Although the word “botulism”
has become almost synonymous with the food-borne illness,
infant botulism actually occurs more frequently in the
United States. Food-borne botulism most frequently occurs
from ingesting insufficiently heated home-canned foods.
Spores that remain viable in the undercooked food germi-
nate and the resulting bacterial population flourishes in the
anaerobic, nutrient-rich environment. Within a few hours to
two days after ingestion the toxin travels, by way of the
bloodstream, to cholinergic synapses where it irreversibly
blocks release of acetylcholine. The result is “flaccid paraly-
sis” (extreme weakness), usually beginning with cranial
nerves (controlling facial muscles) and descending to the
pharynx, neck, arms, and respiratory muscles, frequently
resulting in respiratory failure and death. In infant botulism
and wound botulism, bacterial colonization of the body
occurs and then toxin is released. Once released, the toxin
is absorbed into the bloodstream with progression and
presentation of the disease similar to food-borne illness
except that constipation is almost always an early sign of
infant botulism. Fortunately, with proper treatment, infant
botulism mortality is below 3%. It should be noted that
food-borne botulism is easily preventable. Botulinum toxins
(but not spores) are heat- labile and destroyed when boiled
for at least 20 minutes.
Differential Characteristics
C. botulinum is a motile, anaerobic, endospore-forming,
Gram-positive rod (Figure 12-18). Its spores are oval, sub-
terminal, and distend the cell. Diagnostic pro cedures include
toxin neutralization test in mice, isolation from feces (infant
botulism), with cerebrospinal fluid analysis gas-liquid chro-
matography recommended for final identification.
1
Type C produces bird disease, and type D infects other mammals.
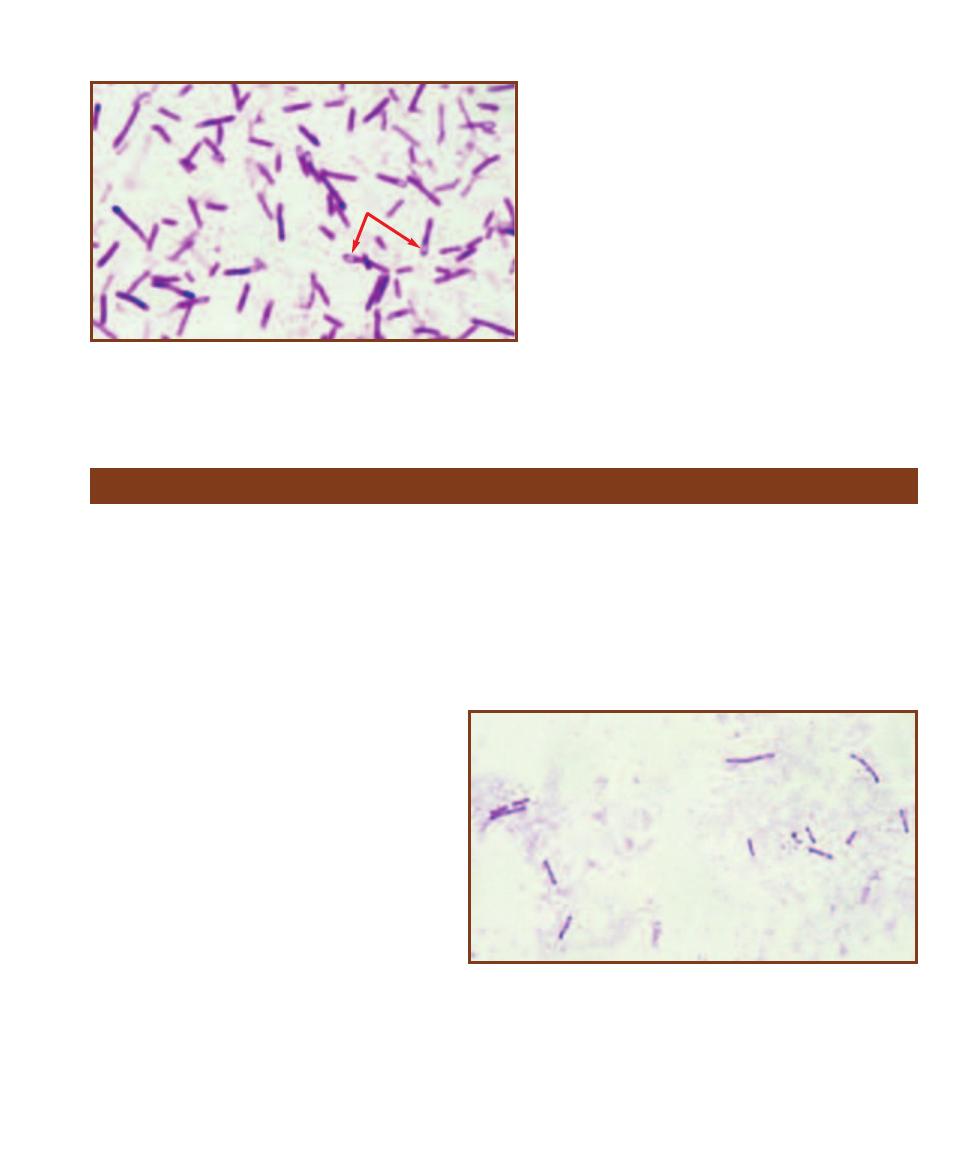
Treatment
Botulinum Toxoid, Pentavalent Vaccine is an “investi-
gational use” drug available as prophylaxis for people
working with A, B, C, D, or E cultures. Trivalent anti-
toxin (A, B, E) must be administered quickly to patients
suspected of botulism intoxication.
SECTION 12
䢇
Bacterial Pathogens
䢇
141
12-18
G
RAM
S
TAIN OF A
C
LOSTRIDIUM BOTULINUM
S
TOCK
C
ULTURE
Note the unstained oval subterminal endospores, which distend the cells
(arrows). Cell sizes are highly variable between strains, ranging from about
0.5–2.0 µm wide by 3–20Ⳮ µm long!
Clostridium difficile
Clostridium difficile (Phylum Firmicutes) is a common
pathogen found in water, soil, a variety of animal intestines,
and the intestinal tracts of more than half of healthy human
infants under one year of age. It is a strict anaerobe and can
be killed by even brief exposure to oxygen. It produces
highly resilient spores that are resistant to antibiotics and
disinfectants and are virtually impossible to eliminate from
the environment. It has been isolated from health-care
workers, asymptomatic hospital patients, hospital bedding,
sinks, toilet seats, and endoscopy equipment.
Many strains of the organism exist—some that
produce toxins and other avirulent forms that do not.
Most strains produce two toxins—A (an enterotoxin)
and B (a cytopathic toxin). In humans, when the nor-
mal intestinal flora have been suppressed by antibi-
otic therapy, previously dormant intestinal C. difficile
will proliferate, releasing toxins that may cause in-
flammation and necrosis of local cells. Nearly 90%
of all C. difficile-caused diarrhea occurs in hospitals
in one of the following forms: antibiotic-associated
diarrhea (AAD), pseudomembranous colitis (PMC),
or the more severe, antibiotic-associated colitis (AAC).
Ampicillin, clindamycin, and fluoroquinolones are
the major offenders. Rarely, C. difficile causes a
severe form of “sepsis syndrome” that may require
a variety of medical interventions including surgery.
Differential Characteristics
C. difficile is a motile, anaerobic, endospore- forming, Gram-
positive rod (Figure 12-19). Diagnostic procedures include
Clostridium difficile toxin assay, Clostridium difficile selec-
tive agar, and fecal leukocyte stain.
Treatment
Administration of medronidazole and vancoymcin.
12-19
G
RAM
S
TAIN OF A
C
LOSTRIDIUM DIFFICILE
S
TOCK
C
ULTURE
Although
not easily seen in this micrograph, this organism does produce oval subterminal
endospores. Cells can range in size from 0.5–1.9 µm wide by 3.0–17 µm long.
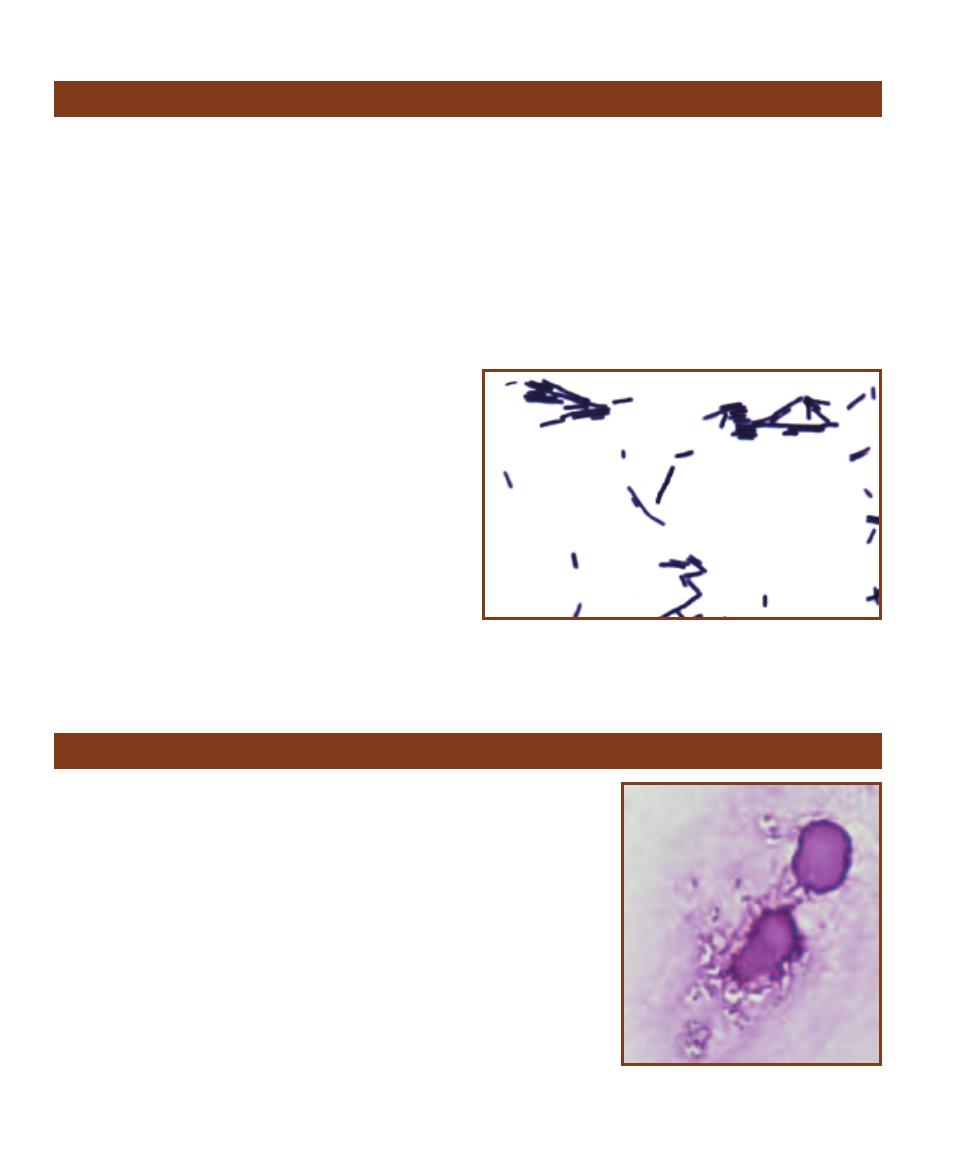
Clostridium septicum (Phylum Firmicutes) causes a severe necrotic infection of the
appendix and intestine. Infections are frequently accompanied by bacteremia and
metastatic necrosis in other regions of the body. Although a high percentage of
adults carry it asymptomatically in their appendices, its habitat has not been fully
established. Entry to the bloodstream is believed to occur from this area. Although
not completely understood, C. septicum is frequently associated with certain types
of cancer. Patients with C. septicum bacteremia are also likely to be suffering from
another underlying disease such as leukemia, lymphoma, or carcinoma of the large
intestine. Because of this, mortality among patients with C. septicum bacteremia is
greater than 65%.
Differential Characteristics
C. septicum is a motile, anaerobic, endospore-forming, Gram-positive rod (Figure
12-21). Diagnostic procedures include Gram stain and growth and hemolysis
patterns on CDC Anaerobe Blood Agar or Phenylethyl Alcohol Blood Agar.
Treatment
Administration of
-lactam drugs such as penicillin and cephalosporins.
142
䢇
A Photographic Atlas for the Microbiology Laboratory
Clostridium perfringens
Clostridium perfringens
(Phylum Firmicutes) is a very com-
mon spore-forming soil organism typically found living
commensally in the gastro intestinal tract of humans and
other mammals. The species has been divided into five types
(A–E) based on the types of (or combinations of) toxins they
produce. Type A produces alpha toxin, the lecithinase that
causes the severe tissue damage associated with myonecrosis
(gas gangrene) and fasciitis. It is also responsible for a type
of gynecologic infection and anaerobic cellulitis. Gas gan-
grene, common in World War I because of the widespread
soil contamination of battlefield wounds, is usually associ-
ated with traumatic wounds and crushing injuries, but also
sometimes occurs after colon resections and septic abortions.
The result is typically increased vascular permeability, hypo -
tension, and shock. Death may occur within two days of
onset of symptoms. Types B and C produce beta toxin that
causes pigbel. Pigbel is a severe form of enteritis seen in
New Guinea following feasts where large amounts of sweet
potato and contaminated pork are eaten. Sweet potatoes
contain protease inhibitors that prevent beta toxin degrada-
tion. The result is intense abdominal pain and bloody diarrhea
sometimes accompanied by intestinal per foration. Types A,
C, and D produce enterotoxin associated with the milder
form of food poisoning. This heat-labile toxin is commonly
found in contaminated meat or poultry and their products,
such as gravies or stews. In much the same way as in Bacillus
cereus food poisoning (page 135), C. perfringens spores
that survive the heat during cooking germinate and produce
enterotoxin when the con ditions become favorable.
Differential Characteristics
Clostridium perfringens is a nonmotile, anaerobic, endospore-
forming, Gram-positive rod (Figure 12-20). Although spores
are produced by this organism, they are rarely seen in
stained preparations. Diagnostic procedures include Gram
stain, skin and muscle biopsy using direct or indirect fluo-
rescent antibody (page 105), and anaerobic culture.
Treatment
Penicillin G, metronidazole, carbapenems or clindamycin
may be used, but prompt administration of antitoxin is vital.
12-20
G
RAM
S
TAIN OF
C
LOSTRIDIUM PERFRINGENS
Note the blunt
ends of the cells and the absence of visible endospores because these
cells were grown in culture. Cells can range in size from 0.6–2.4 µm
wide by 1.3–19.0 µm long.
Clostridium septicum
12-21
C
LOSTRIDIUM SEPTICUM IN A
H
UMAN
B
LOOD
S
MEAR
Cells can range in
size from 0.6–1.9 µm wide by 1.9–35 µm long.
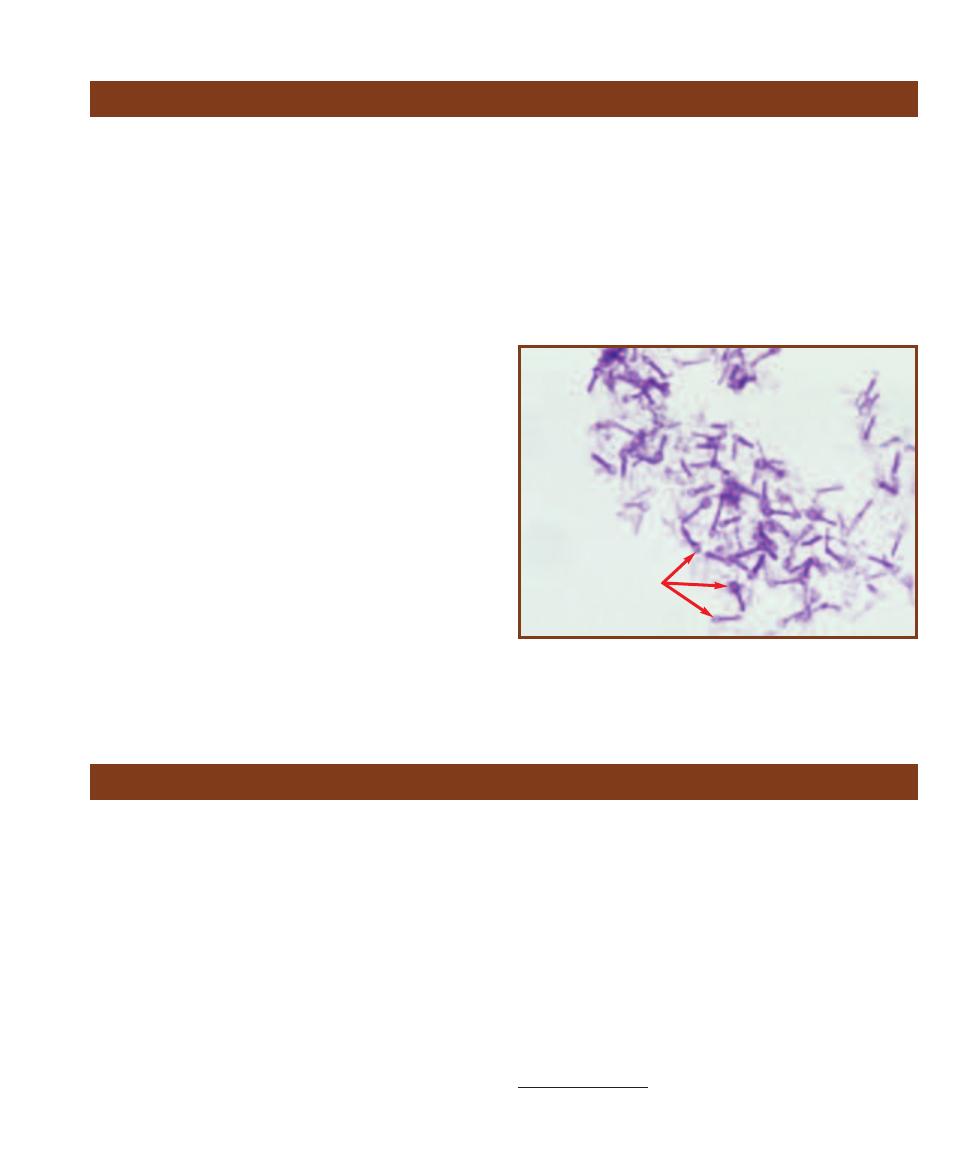
Corynebacterium diphtheriae (Phylum Actinobacteria) is
the toxigenic agent of diphtheria and cutaneous diphtheria.
Although it can live for months in the environment, C.
diphtheriae is transmitted most often from person to person
in aerosol droplets. Once a leading cause of death in children,
it is now a rare disease in the United States due to routine
vaccinations with diphtheria toxoid. However, it still exists
in some eastern European countries as well as develop ing
countries. In recent years diphtheria has shifted from a pri-
marily childhood disease to one affecting all ages including
disproportionately high num bers of unimmunized poor
people and intravenous drug users.
Diphtheria is characterized by two distinct syndromes:
local respiratory infection and systemic poisoning from
absorption of the cytotoxin produced at the local site. In
the former, C. diphtheriae produces a thick membrane
composed of bacteria, fibrin, immune cells, and dead cells,
which obstructs the upper respiratory airway. In the latter,
cell-killing toxin is dispersed throughout the body, frequently
resulting in myocarditis and congestive heart failure. Cutane -
ous diphtheria is a result of bacterial entry through an open
wound causing a local infection with similar systemic effects
as the inhalation disease.
The exotoxin (tox) gene is introduced into C. diphtheriae
by a lysogenic phage.
2
The toxin itself has three functional
parts: a binding portion that attaches to heparin receptors
on host nerve and heart cells, a translocation portion that
moves the bound toxin to the inside of the cell, and an
enzymatic portion that inactivates an essential component
of protein synthesis.
SECTION 12
䢇
Bacterial Pathogens
䢇
143
Clostridium tetani
(Phylum Firmicutes) is an endospore-
forming organism common in the soil and in a variety of
animal intestinal tracts, including humans. It is the causative
agent of tetanus, more commonly called “lockjaw” because
of the difficulty chewing and swallowing characteristic of
the disease’s onset. In spite of the organism’s ubiquity and
the continued prevalence of disease in developing countries,
tetanus has nearly been eradicated in the United States by
tetanus toxoid vaccine. Tetanus is considered a strictly
toxigenic disease because the local infection at the site of
colonization is typically mild while the effect of released
toxin is devastating. Typical transmission of disease is by
entry of spores to a traumatic or puncture wound where
they germinate, grow, and release the neurotoxin, tetano -
spasmin. Tetanospasmin is absorbed and transmitted by
motor neurons to the central nervous system where it per-
manently binds to neurons and blocks the release of the
inhibitory neuro transmitter
␥-aminobutyric acid. The result
is a descending severe muscle spasm that begins with facial
muscles, neck muscles, and eventually chest muscles, which
results in respiratory failure.
Note the comparison between the closely related C.
tetani and C. botulinum. Botulinum toxin travels by way
of the bloodstream to peripheral nerve synapses where
it blocks release of acetylcholine, resulting in inability to
contract muscles (flaccid paralysis); tetanospasmin travels
within the nerve cells to central nervous system synapses
where it blocks release of inhibitory
␥-aminobutyric acid,
resulting in the uninhibited or spastic contractions of
tetanus.
Differential Characteristics
C. tetani is a motile, strictly-anaerobic, endospore-forming,
Gram-positive rod (Figure 12-22). Diagnostic tests are typi-
cally not done. Patient immunization history is of greatest
concern in suspected cases.
Treatment
Tetanus immune globulin used in conjunction with
metronidazole or penicillin G.
Clostridium tetani
12-22
G
RAM
S
TAIN OF A
C
LOSTRIDIUM TETANI
S
TOCK
C
ULTURE
Note the round, terminal endospores (arrows). Occasionally the spores
are oval or subterminal. Cells can range in size from 0.5–1.7 µm wide by
2.1–18.1 µm long.
Corynebacterium diphtheriae
2
A lysogenic phage inserts its DNA genome into the host DNA and becomes
part of its genome.
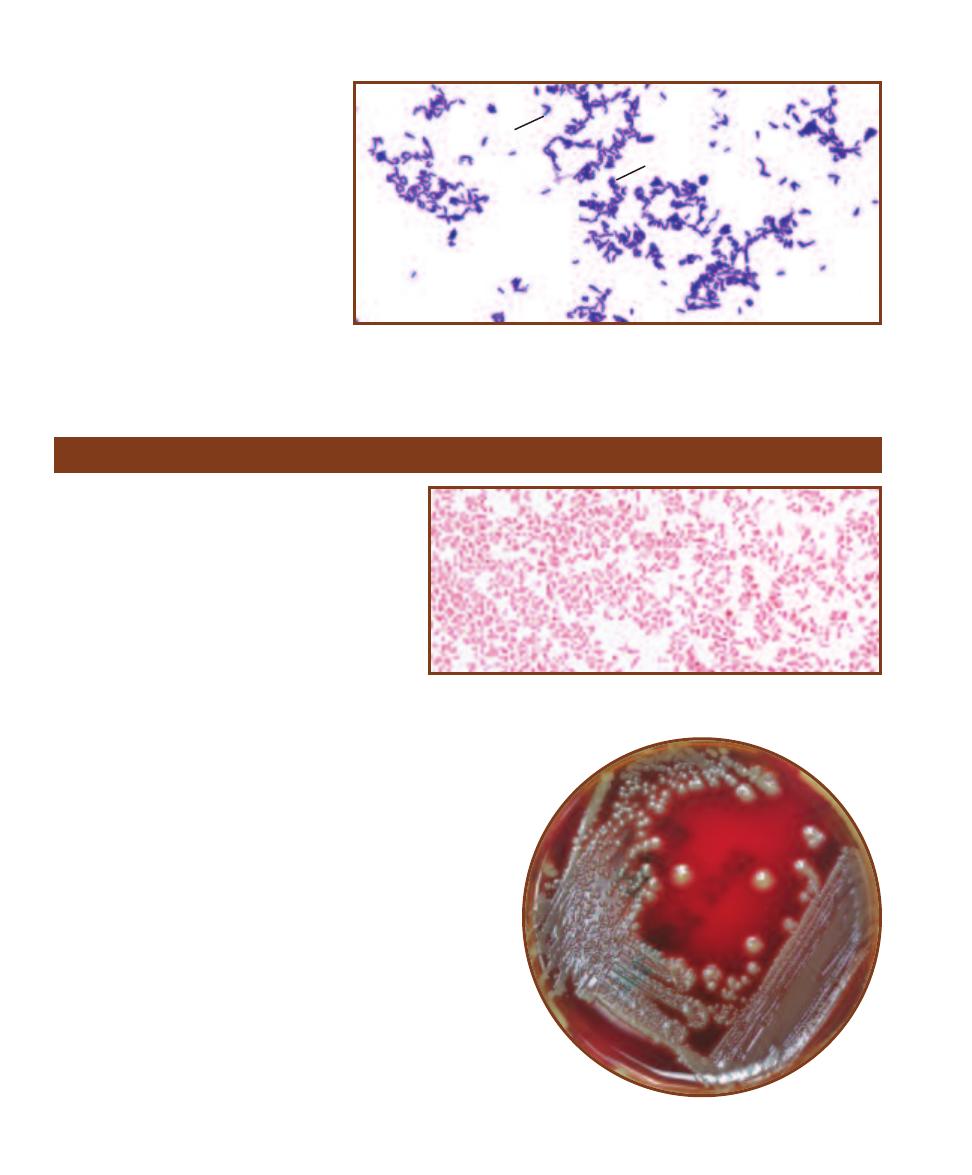
Differential Characteristics
C. diphtheriae is a nonmotile, nonsporing,
Gram-positive rod (Figure 12-23). It pro-
duces acid from glucose and maltose
fermentation, and no acid from sucrose.
It is negative for urease, pyrazinamidase,
and alkaline phosphatase. Diag nostic tests
include throat culture.
Treatment
Penicillin G Procaine or erythromycin
may be used.
144
䢇
A Photographic Atlas for the Microbiology Laboratory
12-23
G
RAM
S
TAIN OF A
C
ORYNEBACTERIUM DIPHTHERIAE
S
TOCK
C
ULTURE
Note the
club-shaped cells. C. diphtheriae frequently arranges itself in “V-shaped” pairs (
V) or palisades
(P). Cells can range in size from 1 µm or less wide by 1.0–8.0 µm long.
Escherichia coli
Escherichia coli (Class Gammaproteobacteria) is a
member of the large family Entero bacteriaceae, the
“Enterics.” It inhabits the intestinal tract of humans
and many other animals. Generally each type of ani-
mal host harbors a different strain of the organism.
The strains most important to humans are those that
inhabit us and those that live in the intestines of cattle.
Human E. coli is an opportunistic pathogen and
in the right place at the right time may cause any-
thing from mild stomach upset to diarrhea, urinary
tract infections, sepsis, and meningitis. Strains of
E. coli carried in cattle and contaminated beef are
differentiated and named according to their virulence
properties. These are: enteropathogenic E. coli (EPEC)
that causes diarrhea in infants, enterotoxigenic E. coli (ETEC)
that is responsible for infant diarrhea and traveler’s diarrhea,
enterohemorrhagic E. coli (EHEC) that is associated with
hemorrhagic colitis and hemolytic uremic syndromes, entero -
invasive E. coli (EIEC) that produces a shigellosis-like disease,
and entero aggregative E. coli (EAEC) that causes acute and
chronic diarrhea. These strains are seen primarily in developing
countries, but EHEC O157:H7 has been responsible for out-
breaks of hemorrhagic colitis in the United States. Disease is
almost always caused by ingestion of contaminated meat;
however, person to person trans mission has been reported.
Differential Characteristics
All members of Enterobacteriaceae are oxidase-negative,
Gram-negative, facultatively anaerobic rods that produce acid
from glucose fermentation (Figures 12-24 and 12-25). Several
commercial multiple test systems are available for the differen -
tiation and identification of the individual species including
12-24
G
RAM
S
TAIN OF AN
E
SCHERICHIA COLI
S
TOCK
C
ULTURE
The straight
rods are usually arranged singly or in pairs. Cell sizes range from 1–1.5 µm wide
to 2–6 µm long.
12-25
E
SCHERICHIA COLI ON
S
HEEP
B
LOOD
A
GAR
V
P
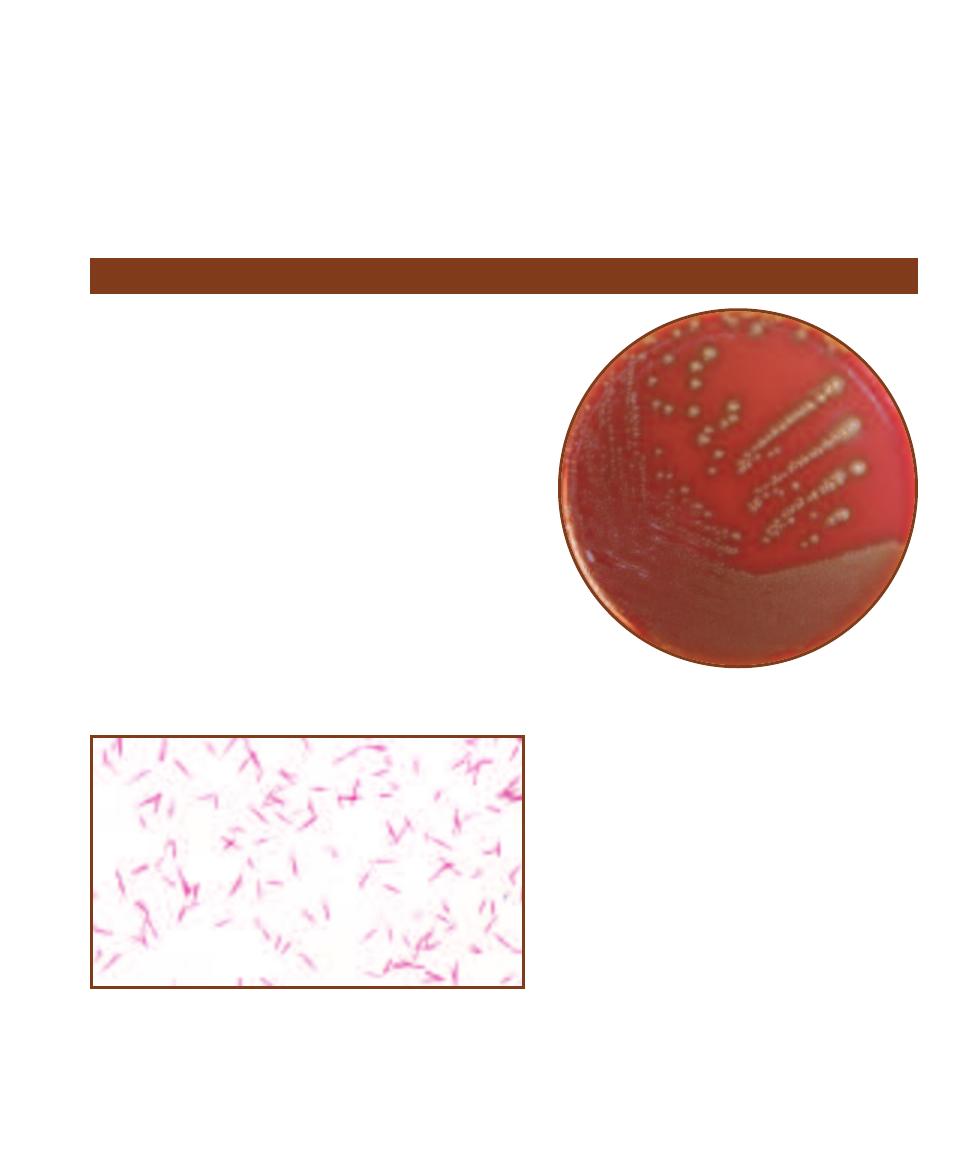
Enterotube
®
II (page 70), API 20 E
®
(page 57), and BBL
Crystal
®
(page 66). Diagnostic tests for identification of
individual strains include Shiga toxin test (some strains of
E. coli produce Shiga toxin or Shiga-like toxin very similar
to that produced by Shigella spp.), and O157 and H7 serum
agglutination tests (SAT—page 101).
Treatment
Cephalosporins, ampicillin, sulfamethoxazole are sometimes
administered although there is evidence that EHEC disease
is actually complicated by antibiotic use. Diarrhea is typi-
cally a self-limiting disease; therefore, fluid and electro lyte
replacement therapy is the standard treatment.
SECTION 12
䢇
Bacterial Pathogens
䢇
145
Fusobacterium spp.
Fusobacterium species (Phylum Fusobacteria) are commonly
encountered opportunistic pathogens normally found in the
human mouth, as well as the urinary, gastrointestinal, and
upper respiratory tracts. They are involved (usually in a
mixture of organisms) in most dental infections and are very
common agents in upper respiratory infections, including
chronic sinusitis, aspiration pneumonia, lung abscesses, and
brain abscesses. Fusobacterium has been shown to cause
severe systemic in fections in cancer patients following chemo -
therapy. The virulence of fusobacteria is largely due to
endotoxins that evoke a vigorous immune reaction that can
lead to toxic shock with widespread systemic collapse. Two
species are of primary interest, F. nucleatum (Figure 12-26),
which is involved in producing periodontal disease, and F.
necro phorum (Figure 12-27), which can produce meningitis
and thrombosis of the external jugular and cerebral veins.
Differential Characteristics
Fusobacterium nucleatum is a nonmotile, anaerobic, non-
sporing, spindle-shaped, Gram-negative rod. It is indole-
positive, does not grow on bile agar and does not ferment
mannitol, lactose, or rhamnose. It is negative for
esculin hydrolysis, catalase, lecithinase, lipase, starch
hydrolysis, milk proteolysis, DNase, and gelatinase.
Butyrate is the major metabolic end product, which
distinguishes it from most Bacteroides species.
Treatment
Some Fusobacterium species produce
-lactamase;
therefore the use of penicillin is typically avoided or
combined with
-lactamase inhibitors. Also useful are
cefoxitin and imipenem.
12-27
F
USOBACTERIUM NECROPHORUM
G
ROWING ON
C
HOCOLATE
A
GAR
Note the flat, grayish-brown colonies.
12-26
G
RAM
S
TAIN OF A
F
USOBACTERIUM NUCLEATUM
S
TOCK
C
ULTURE
Note the long, thin spindle-shaped cells, ranging in length from 5–10 µm.
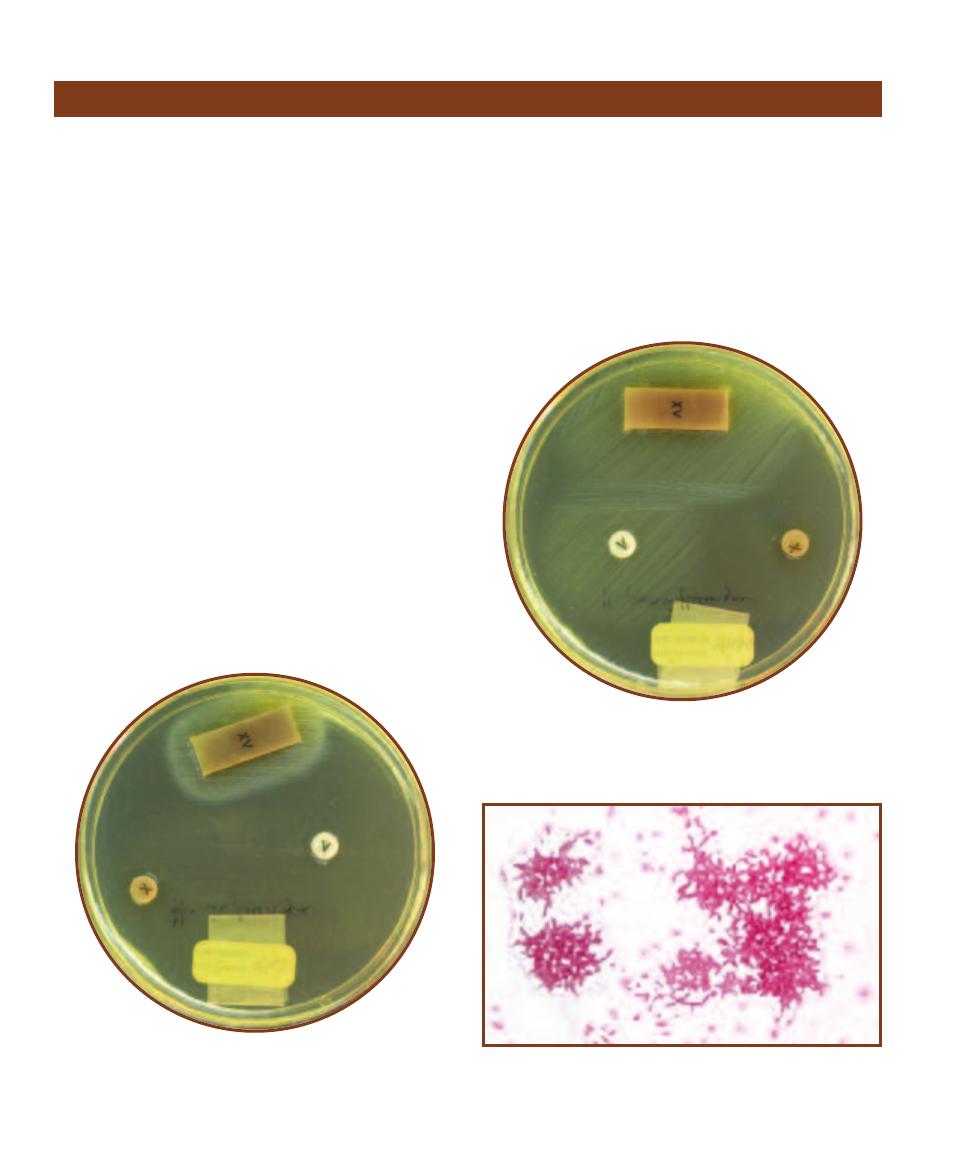
Commensal strains of avirulent Haemophilus influenzae
(Class Gammaproteobacteria) can be found in the naso -
pharynx of virtually everyone over the age of 3 months.
Virulent strains also inhabit the upper respiratory tract but
to a much lesser degree. Typically transmitted from person
to person by aerosol droplets, it is an obligate human micro -
organism. It was given the name “Haemo philus” (blood
loving) because it requires specific blood factors (V and X)
to live (Figures 12-28 and 12-29). Of the six known capsu-
lar types (a–f), type b is the most pathogenic. The nonpatho-
genic forms are nonencapsulated and rarely cause disease.
Haemophilus influenzae b was once the most common
cause of bacterial meningitis in children; however, its
epidemiologic impact has dramatically changed since the
development and widespread use of vaccine in the 1990s.
Still, it is the most common cause of bacterial meningitis in
unvaccinated children, with as many as 700,000 deaths
each year worldwide. Encap sulated forms of H. influenzae
also cause epiglottitis, cellulitis, otitis, pneumonia, septi -
cemia, and endocarditis.
Differential Characteristics
Haemophilus influenzae is a small, nonmotile, facultatively
anaerobic, pleomorphic, Gram-negative rod (Figure 12-30).
Taxonomically the species is divided into six serogroups (a–f)
and/or eight biotypes (I–VIII). Serogroups are differ entiated
based on capsule formation and biotypes are dif fer entiated
based on a battery of three tests—indole, urease, and orni -
thine decarboxylase. Each biotype demonstrates a unique
combination of positive and negative results.
Treatment
Administration of third generation cephalosporins, chloram-
phenicol or fluoroquinolones for severe infection; though
ampicillin may be used, up to 25% of H. influenzae b strains
produce a
-lactamase (page 59).
146
䢇
A Photographic Atlas for the Microbiology Laboratory
Haemophilus influenzae
12-30
G
RAM
S
TAIN OF A
H
AEMOPHILUS INFLUENZAE
S
TOCK
C
ULTURE
Note the various shapes and sizes of the cells (pleomorphism).
Cells can range in size from about 0.5 µm wide by 0.5–3.0 µm long.
H. influenzae b is also encapsulated.
12-28
H
AEMOPHILUS INFLUENZAE
D
EMONSTRATING
C
HAR
-
ACTER ISTIC
R
EQUIREMENT OF
B
OTH
X
AND
V B
LOOD
F
ACTORS
Note the growth surrounding the strip containing both factors
and absence of growth around the discs containing only X or V
factor. X factor is hemin, V factor is NAD.
12-29
H
AEMOPHILUS PARAINFLUENZAE
D
EMONSTRATING
C
HARACTERISTIC
G
ROWTH IN THE
X–V T
EST
H. parainfluenzae
requires only V factor to survive. Note the growth surrounding
both the V disc and X-V strip.
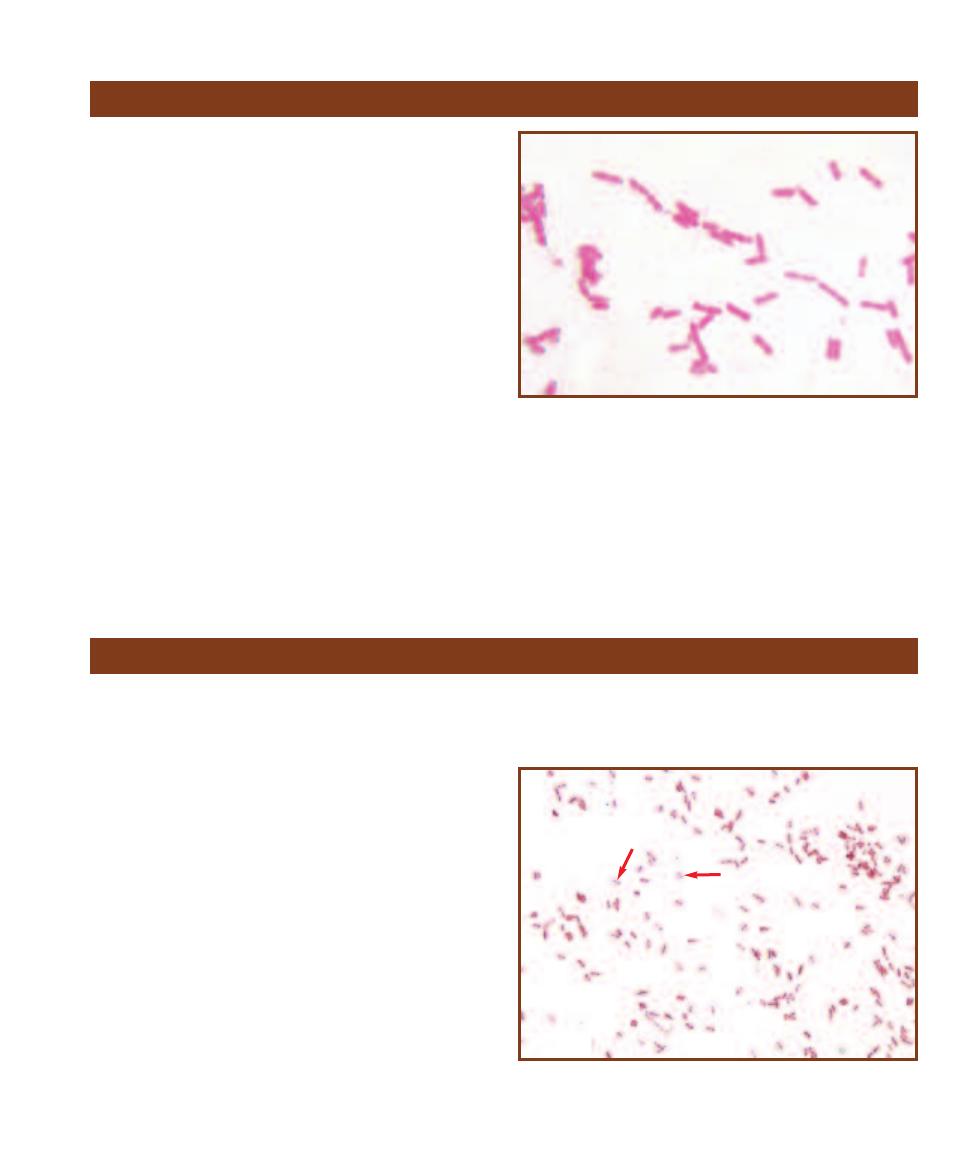
Helicobacter pylori
(Class Gammaproteobacteria) is
associated with gastric ulcers, duodenal ulcers, nonulcer
dyspepsia, and gastric carcinoma. H. pylori does not enter
cells, but resides solely in the deepest parts of the mucous
layer lining the gastric mucosa and epithelial cell surface. It
causes inflammation by 1) blocking gastric acid production
with inhibitory proteins, and 2) neutralizing acid with am-
monia produced from urea hydrolysis. It avoids phagocytosis
by producing superoxide dismutase and catalase. The host
immune response to factors produced by H. pylori is re-
sponsible in part for the severity of the symptoms. The
typical immune reaction includes secretion of interleukin-8,
hypersecretion of gastric acid, and programmed epithelial
cell death. Transmission is person-to-person.
Differential Characteristics
Helicobacter pylori is a motile, curved, spiral, or straight,
slightly plump, Gram-negative rod (Figure 12-31). It is
vigorously urease-positive, catalase-positive, and oxidase-
positive. Diagnostic procedures include culture, direct
antigen test, urease test, gastric biopsy, serology, and urea
breath test.
Treatment
Administration of amoxicillin, tetracycline, metronidazole,
or bismuth subsalicylate.
SECTION 12
䢇
Bacterial Pathogens
䢇
147
Helicobacter pylori
12-31
G
RAM
S
TAIN OF A
H
ELICOBACTER PYLORI
S
TOCK
C
ULTURE
Young cultures of H. pylori grown in vitro frequently stain Gram- positive.
These cells are uncharacteristically straight. Most are curved or spiral-
shaped. Cells range in size from 0.5 µm wide by 2.5–5 µm long.
Klebsiella pneumoniae (Class Gammaproteobacteria) is
found in soil, water, grain, fruits, vegetables, and the intes-
tinal tracts of a variety of animals including humans. It is
harbored in the nasopharynx and oropharynx of humans
and is frequently transmitted as aerosol droplets from person
to person. K. pneumoniae is a very common nosocomial
pathogen, but also causes community-acquired primary
lobar pneumonia—a severe (frequently fatal) necrotizing
infection. Nosocomial infections commonly caused by
K. pneumoniae are pneumonia, urinary tract infections,
bronchitis, surgical wound infections, biliary tract infections,
and hospital associated bacteremia. The organism owes its
virulence to endotoxin production and its ability to form
a protective polysaccharide capsule. Over the last several
years, plasmid-mediated antibiotic resistance in the species
(in response to widespread antibiotic use) has complicated
treatment efforts and necessitated antimicrobial susceptibility
testing on specific isolates.
Differential Characteristics
K. pneumoniae is a nonmotile, encapsulated, facultatively
anaerobic, Gram-negative rod (Figures 6-20, 12-32 and
12-33). K. pneumoniae is negative for indole, arginine and
orni thine decarboxylase, and positive for lysine decarboxylase.
Klebsiella pneumoniae
12-32
G
RAM
S
TAIN OF A
K
LEBSIELLA PNEUMONIAE
S
TOCK
C
ULTURE
Cells range in size from 0.3–1.0 µm wide by 0.6–6.0 µm long.
Note the bipolar staining (arrows).
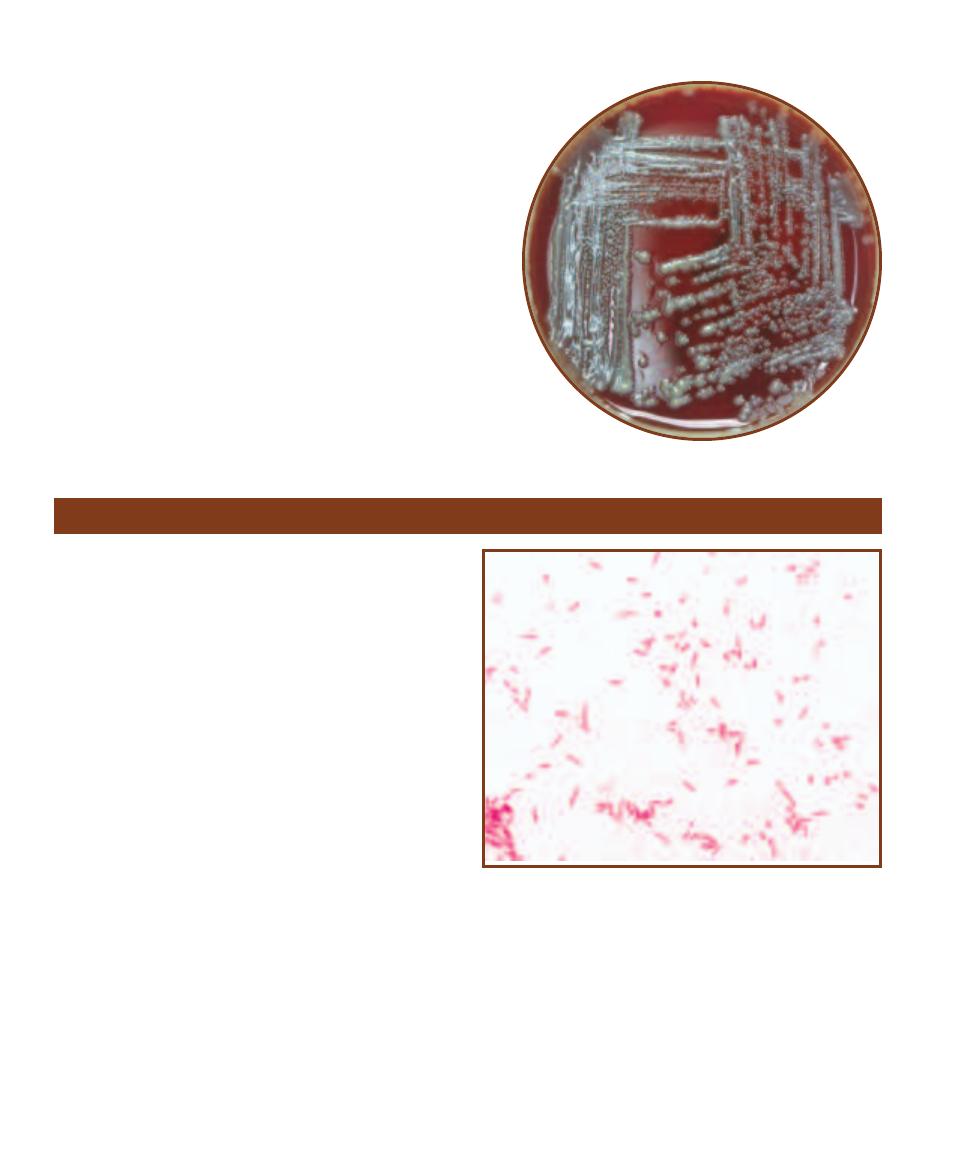
Treatment
As mentioned above, plasmid-mediated antibiotic resistance
has necessitated the use of antimicrobial susceptibility test-
ing of individual isolates before selecting the most effective
final treatment. Agents traditionally used are 1st, 2nd, and
3rd generation cephalosporins. Also used are penicillins,
imipenem with cilastatin, aztreonam, fluoroquinolones, and
meropenem.
148
䢇
A Photographic Atlas for the Microbiology Laboratory
12-33
K
LEBSIELLA
PNEUMONIAE ON
S
HEEP
B
LOOD
A
GAR
Note the
mucoid appearance due
to large polysaccharide
capsules.
Legionella pneumophila (Class Gammaproteobacteria) is a
comparatively “new” organism, having only been discovered
following the outbreak of Legionnaires’ disease in 1976. In
the hotels and hospitals where outbreaks have occurred, the
organism has been isolated from fresh water sources and
various plumbing fixtures. Although recently discovered, L.
pneumo phila has been found in abundance in aquatic habi-
tats worldwide, including chlorinated hot tubs. Interestingly,
the organism survives in such harsh conditions because it is
able to parasitize amoebae living in the water. L. pneumo -
phila is not passed directly from person to person but is in-
haled as aerosols from environmental sources. Legion ellosis
is the general heading used to include all of the diseases
caused by this organism (i.e., Legionnaires’ disease—
a pneumonia-like disease, Pontiac fever—a milder, short
term flu-like illness, and a variety of other systemic infec-
tions). Although capable of surviving extracellularly, it is
classified as an intracellular pathogen because of its ability
to survive and multiply inside phagosomes of pulmonary
macrophages. The multiplying bacteria eventually kill the
macrophages, spread, and repeat the process. The number
of Legionella associated infections reported in the United
States annually is 1,500 to 1,800. The CDC estimates that
10,000 to 20,000 cases go unreported each year.
Differential Characteristics
L. pneumophila is a motile, nonsporing, aerobic, Gram-
negative rod (Figure 12-34). Diagnostic procedures include
culture, Legionella antigen urine test, DNA probe, and
polymerase chain reaction (PCR—page 111).
Treatment
Administration of azithromycin individually or combined
with rifampin, erythromycin individually or combined with
rifampin, clarithromycin, ciprofloxacin, or levofloxacin.
Legionella pneumophila
12-34
G
RAM
S
TAIN OF A
L
EGIONELLA PNEUMOPHILA
S
TOCK
C
ULTURE
Cells can range in size from less than 1 µm wide by 2–20 µm
long or more.
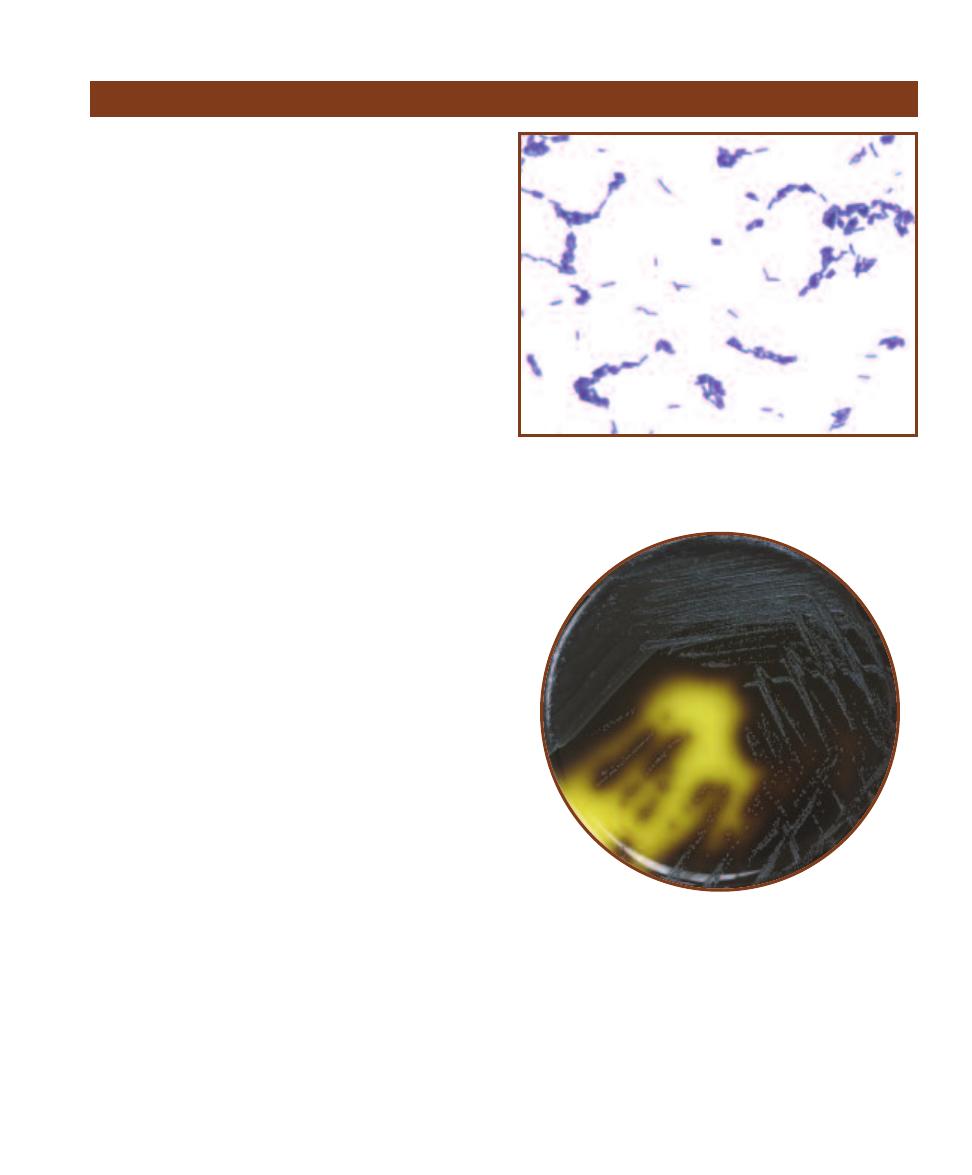
SECTION 12
䢇
Bacterial Pathogens
䢇
149
Listeria monocytogenes
(Phylum Firmicutes) is a very com-
mon soil saprophyte and vegetable matter decomposer, but
it can also be found in red meat, poultry, fish, and the intes-
tinal tract of many animals including humans. It is also a
common contaminant of raw milk and cheeses. The organ-
ism gains entry to the body as a food-borne contaminant or
through openings in the skin. After attaching to host epithe-
lial cells, it induces phagocytosis. Once in the phagolyso-
some, it produces an enzyme that lyses the phagolysosome
and releases the cells to the cytoplasm. The protein ActA
on the cells’ surface induces host cell actin to push them to
the surface, where they enter protrusions called filopods.
Filopods are subsequently phagocytized by adjacent epithe-
lial cells and macrophages, and the process repeats in these
new cells. This spreading mechanism protects Listeria from
defenses such as complement and antibodies. L. monocyto-
genes primarily affects pregnant women and their fetuses,
immunocompromised individuals, and the elderly, but has
recently been associated with gastroenteritis in healthy
adults. Listeriosis is the general heading used to include all
diseases caused by the organism. In adults and elderly,
meningitis is the most common form of listeriosis. In neo -
nates, the disease takes one of two forms—early-onset and
late-onset. Early-onset disease is acquired in utero, while
late-onset infections occur at or soon after birth. Granulo-
matosis infantiseptica is the early-onset disease and is fre-
quently fatal. Neonatal meningoencephalitis is the late-onset
form. Bacteremia is the most common form of disease for
immunocompromised individuals.
Differential Characteristics
L. monocytogenes is a small, motile,
-hemolytic, non-
sporing, Gram-positive rod (Figure 12-35). It is catalase-
positive, ferments glucose, trehalose and salicin, and
hydro lyzes esculin (Figure 12-36). Diagnostic tests include
Gram stain, cerebrospinal fluid (CSF) culture or analysis,
aerobic and anaerobic blood culture, and lumbar puncture.
Treatment
Administration of ampicillin individually or combined with
gentamicin, penicillin G individually or combined with
gentamicin.
Listeria monocytogenes
12-35
G
RAM
S
TAIN OF A
L
ISTERIA MONOCYTOGENES
S
TOCK
C
ULTURE
This organism typically appears as single cells, diplobacilli,
chains, or clusters of parallel cells with blunt ends, all of which are visible
in this micrograph. Sizes range from 0.5 µm wide to 1–2 µm long.
12-36
L
ISTERIA MONOCYTOGENES ON
O
XFORD
M
EDIUM
Note the
darkening of the medium due to esculin hydrolysis. See Bile Esculin
Agar on page 60.
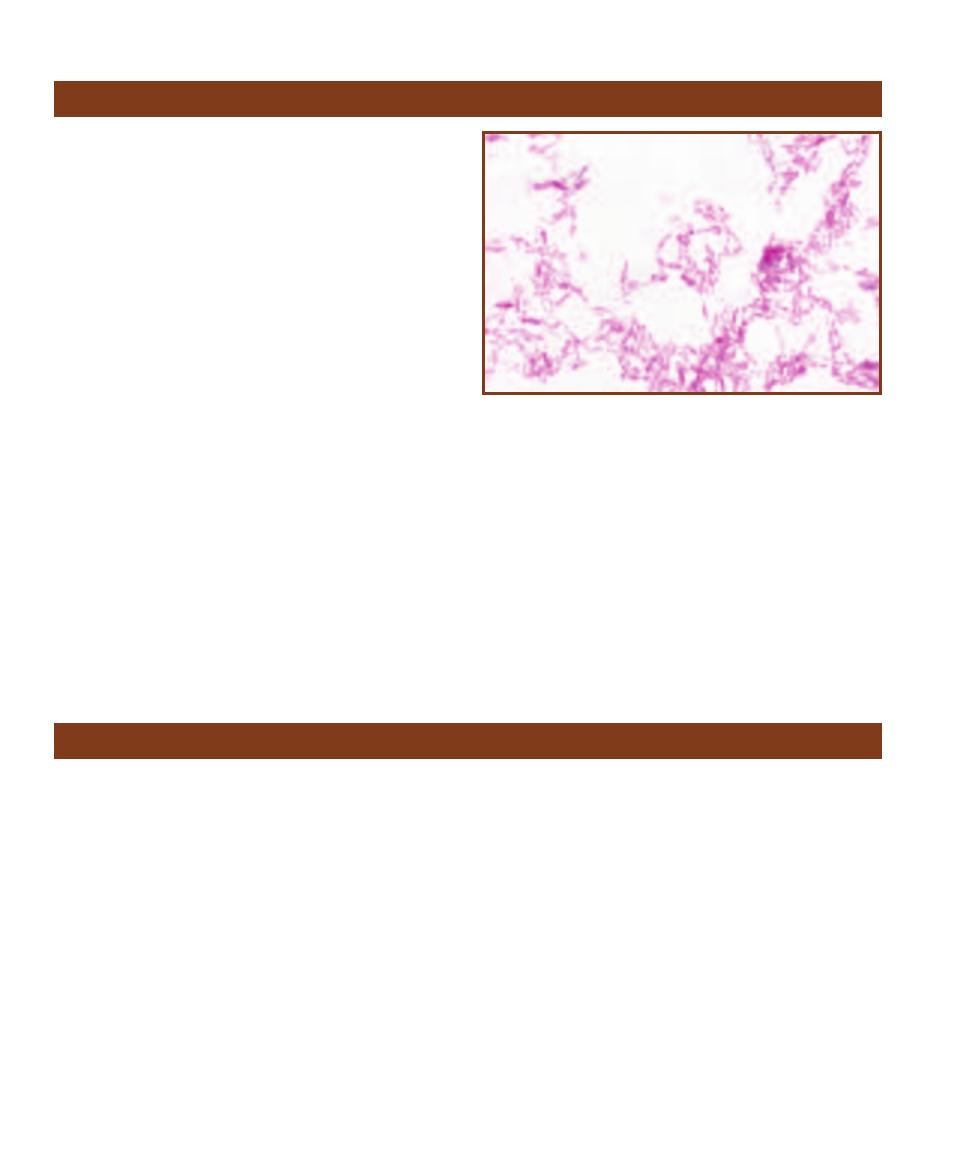
Mycobacterium leprae
(Phylum Actinobacteria) is the causa -
tive agent of leprosy—now rare in the United States, but still
a serious problem in Asia and Africa. Although it can be
cultivated in a few laboratory animals, it is believed to occur
naturally only in humans and in the nine-banded armadillo
of Texas and Louisiana. Like Legionella and Listeria, M.
leprae is an intracellular parasite. Once ingested by a macro -
phage it survives by chemically suppressing the cell’s defen-
sive activity. Two distinctive forms of leprosy are known to
occur— lepromatous leprosy and tuberculoid leprosy. In lep-
romatous leprosy, the more contagious form of disease, host
immune response is suppressed, followed by rapid prolifera-
tion of the organism, severe disfigurement, and loss of nerve
function. In tuberculoid leprosy, a vigorous host immune
response results in the formation of granulomas on the face,
trunk, and extremities. Several intermediate forms of the
disease also exist. The mode of transmission is not well un-
derstood, however, a victim with the lepromatous form can
shed billions of bacterial cells from the nose in a single day.
Differential Characteristics
M. leprae is a nonmotile, anaerobic, acid-fast, nonsporing,
weakly Gram-positive rod (Figure 12-37). M. leprae is
uncultivable in vitro, therefore, standard biochemical tests
are not useful in identifying it. Clinical diagnoses are based
on characteristics of the disease, Gram and acid-fast stain-
ing, and biopsies from skin lesions or nasal secretions. A
skin test using lepromin, an antigen extraction from
lepromatous lesions is also available.
Treatment
The World Health Organization recommends multidrug
therapy (MDT), which includes the drugs dapsone, rifam -
picin, and clofazimine. This approach has seen great success
and the drugs are provided free of charge to leprosy patients
worldwide.
150
䢇
A Photographic Atlas for the Microbiology Laboratory
Mycobacterium leprae
12-37
A
CID
-
FAST
S
TAIN OF A
M
YCOBACTERIUM LEPRAE
S
TOCK
C
ULTURE
These rods can be straight or curved and are typically found
in clusters.
Mycobacterium tuberculosis
Mycobacterium tuberculosis (Phylum Actinobacteria) is
the pathogen responsible for tuberculosis. Humans are its
principal host and reservoir, although it has been isolated
from other primates. It can be passed directly from person-
to-person or inhaled as droplet nuclei (bacteria carried on
airborne particles). Two mani festations of the disease exist:
primary tuberculosis and secondary tuberculosis. Primary
tuberculosis, the condition produced upon initial exposure
to the bacillus, is for most healthy individuals no more than
a mild flu-like illness. In this initial stage, the bacteria enter
the alveoli and are ingested by resident macro phages. They
multiply intra cellularly and spread to other areas of the
lung, killing the macrophages in the process. Eventually, the
host immune response kills most of the bacteria, but some
remain alive inside small granulomas called tubercles. In
otherwise healthy individuals, these tubercles usually remain
intact for a lifetime, holding the bacteria in check. However,
in immunocompromised individuals, the organism soon
gets into the bloodstream and disseminates throughout the
body. Secondary tuberculosis is the condition that occurs as
the aging immune system weakens or is compromised by
other factors. This condition, characterized by progressive,
necrotic lung inflammation, is the form of tuberculosis
most people associate with the disease.
Differential Characteristics
M. tuberculosis is a nonmotile, acid-fast, nonsporing,
weakly Gram-positive rod (Figures 12-38 and 12-39).
Diagnostic procedures include acid-fast stain, tuberculin
skin test, lumbar puncture, sputum, biopsy or body fluid
culture, and polymerase chain reaction (PCR—page 111).
Treatment
Administration of isoniazid and rifampin individually or
combined, pyrazinamide, ethambutol, or streptomycin.
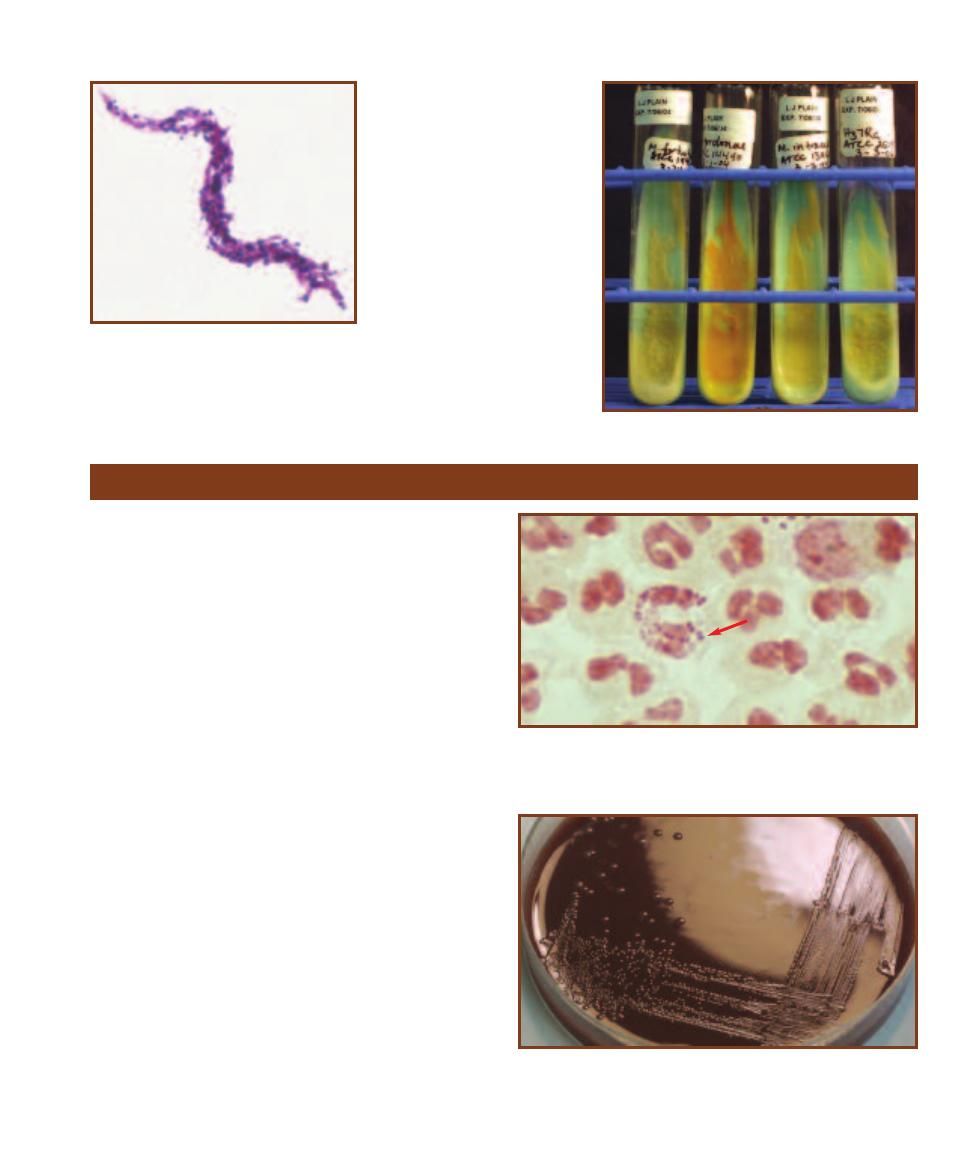
Neisseria gonorrhoeae (Class Betaproteobacteria) causes
the exclusively human sexually transmitted disease (STD),
gonorrhea. It attaches to urethral or vaginal columnar
epithelial cells by Type IV pili and other surface proteins.
The composition of these surface antigens is controlled
genetically and can therefore change. Because of this, the
organism is able to evade host antibodies that might other-
wise attack it. Most infections caused by N. gonorrhoeae
are confined to the lower reproductive area. However, if
allowed to reach the bloodstream, certain strains of this
organism that contain a surface antigen similar to that of
red blood cells can evade host serum antibodies. When this
occurs, disseminated gonococcal infection (DGI) is the
result, frequently including dermatitis-arthritis-tenosynovitis
syndrome and occasionally, endocarditis or meningitis.
Other infections of this organism include endometritis,
epididymitis, pelvic inflammatory disease (PID), proctitis,
pharyngitis, conjunctivitis, peritonitis, and perihepatitis.
Differential Characteristics
N. gonorrhoeae is an aerobic, Gram-negative diplococcus
that sometimes demonstrates “twitching motility.” It
produces acid only from glucose in the carbohydrate
acidification test. Diagnostic procedures include Gram stain,
nucleic acid probe, and genital culture (Figures 12-40 and
12-41).
Treatment
Resistance to penicillin G and tetracyclines has led to using
ceftriaxone and azithro mycin combined with doxycycline.
SECTION 12
䢇
Bacterial Pathogens
䢇
151
12-38
A
CID
-
FAST
S
TAIN
OF A
M
YCOBACTERIUM
TUBERCULOSIS
S
TOCK
C
ULTURE
Note the charac-
teristic cord-like orientation.
Individual cells are approxi-
mately 0.4 µm wide by 3 µm
long.
12-39
A C
OLLECTION OF
M
YCOBACTERIUM
C
ULTURES ON
L
OWENSTEIN
-J
ENSEN
A
GAR
From left to right, M. fortuitum, M.
gordonae, M. intracellulus, and a
strain of M. tuberculosis (H37Ra).
Note the friable (crumbly) growth
texture of the M. fortuitum and
M. tuberculosis cultures.
Neisseria gonorrhoeae
12-41
N
EISSERIA GONORRHOEAE ON
C
HOCOLATE
A
GAR
A
FTER
48 H
OURS
I
NCUBATION
N. gonorrhoeae typically forms smaller
colonies than other members of the genus. Compare colony size with
N. meningitidis in Figure 12-43.
12-40
G
RAM
S
TAIN OF
N
EISSERIA GONORRHOEAE
I
NSIDE
T
WO
P
OLYMORPHONUCLEAR
L
EUKOCYTES
Cells are typically seen as diplo-
cocci with adjacent sides flattened (arrow). Individual cells range in size
from 0.6–1.9 µm in diameter.
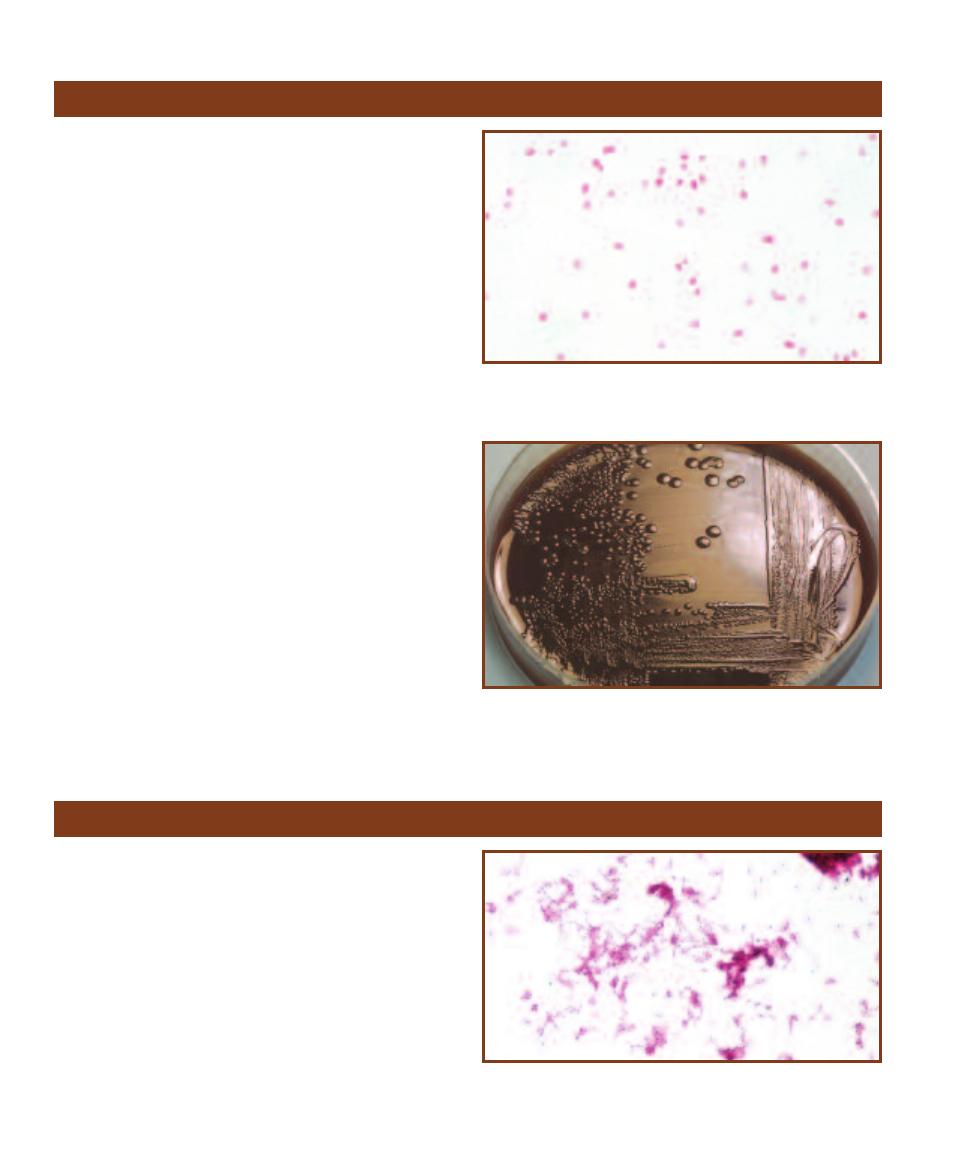
Neisseria meningitidis
(Class Betaproteobacteria) is one of
two human pathogens in the genus. It resides on mucous
membranes of the nasopharynx, oropharynx, and the
anogenital region. It does not remain viable for long outside
the human body and must be transferred sexually or by
direct contact with infected respiratory secretions. It causes
meningococcemia and the accom panying meningococcal
meningitis, a devastating disease pri marily of children and
young adults. The organism’s virulence can be attributed to
at least four factors: surface pili which help it attach to host
mucous membranes, a heavy capsule which helps it survive
and multiply inside phagocytes, a hemolysin which facilitates
the destruction of red blood cells (RBCs), and in some strains,
surface components similar to those of RBCs that fail to
stimulate a serum antibody response. In most healthy indi-
viduals the organism produces a localized infection or no
symptoms at all, but in the absence of an early antibody
response, may result in fulminant sepsis and meningitis.
Differential Characteristics
N. meningitidis (Figures 12-42 and 12-43) is an aerobic,
Gram-negative diplococcus that sometimes demonstrates
“twitching motility.” It produces acid from glucose and
maltose in the carbohydrate acidification test. Diagnostic
tests include cerebrospinal fluid (CSF) culture and latex
agglutination test, Gram stain, and skin biopsy.
Treatment
Administration of penicillin G, 3rd generation cephalosporins,
or chloramphenicol.
152
䢇
A Photographic Atlas for the Microbiology Laboratory
12-42
G
RAM
S
TAIN OF A
N
EISSERIA MENINGITIDIS
S
TOCK
C
ULTURE
Meningococci are usually seen as diplococci with adjacent sides flat-
tened. Cells are about 1 µm in diameter.
12-43
N
EISSERIA MENINGITIDIS ON
C
HOCOLATE
A
GAR
A
FTER
48 H
OURS
I
NCUBATION
Compare colony size with N. gonorrhoeae in
Figure 12-41.
Neisseria meningitidis
Nocardia asteroides
Nocardia asteroides (Phylum Actinobacteria) was once
believed to be a fungus because of its ability to produce
branching vegetative hyphae (Figures 12-44 through 12-46).
However, its mycelia fragment into rod and coccus-like
elements that contain no membrane-bound organelles.
N. asteroides is found principally on vegetation and in
the soil. It is the infective agent of nocardiosis. Although
it occasionally affects healthy individuals, it is primarily an
opportunistic pathogen of immunosuppressed patients fol-
lowing organ transplant or people whose immune systems
have other wise been compromised by AIDS, lymphoma,
or cortico steroids. In the majority of cases, transmission
is by inhalation of aerosol droplets leading to pulmonary
nocardiosis (chronic pneumonia). Dissemination of the
12-44
A
CID
-
FAST
S
TAIN OF A
N
OCARDIA ASTEROIDES
S
TOCK
C
ULTURE
Because Nocardia species are weakly acid-fast, decolorization
is done with a lower concentration of acid-alcohol.
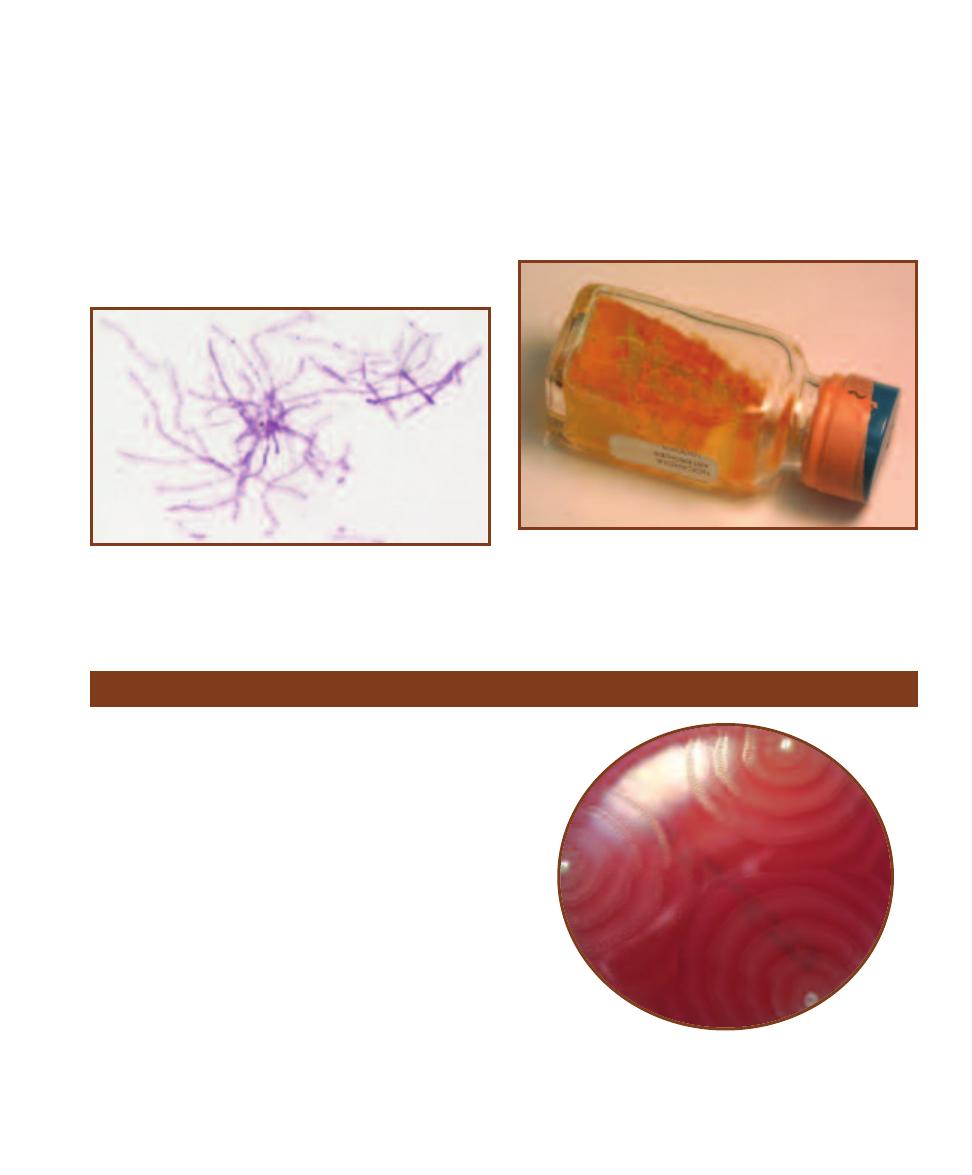
organism by the bloodstream typically leads to central
nervous system nocardiosis (brain abscesses) and infection
of virtually all organ systems. Other infections caused by N.
asteroides include cellulitis with lymphocutaneous nodules,
mycetoma (usually in the tropics), and keratitis.
Differential Characteristics
Norcardia asteroides is anaerobic, nonmotile, Gram-positive
to Gram- variable, partially acid-fast rod. It is lysozyme-
resistant and urease-positive. It reduces nitrate, does not
hydrolyze casein, tyrosine, xanthine, hypoxanthine, gelatin,
or starch, and does not produce acid from lactose, xylose,
or arabinose. Diagnostic procedures include acid-fast stain
and culture of the infected site.
Treatment
Trimethoprim-sulfamethoxazole is the treatment of choice.
SECTION 12
䢇
Bacterial Pathogens
䢇
153
12-45
G
RAM
S
TAIN OF AN
O
LD
C
ULTURE OF
N
OCARDIA
ASTEROIDES
S
TOCK
C
ULTURE
The Gram reaction is weak due to
mycolic acid in the cell walls. Note the beaded appearance of the
branched filaments.
12-46
N
OCARDIA ASTEROIDES ON
S
ABOURAUD
D
EXTROSE
A
GAR
Note the fungus-like appearance due to aerial elements of the orange-
pigmented mycelium.
Proteus mirabilis
Proteus mirabilis (Class Betaproteobacteria) is a normal inhabi -
tant of the human intestinal tract and that of a variety of other
animals. It is also common in soil and polluted water. P. mirabilis,
like all Proteus species, has the ability to periodically migrate on
the surface of plated agar media. This cycle of alternating migra-
tion and consolidation is due to a characteristic called “swarming
motility” and produces a series of visible concentric rings (Figure
12-47). P. mirabilis is a common nosocomial pathogen isolated
from septic wounds and urinary tract infections. Transmission is
by direct contact with a carrier or other contaminated source. It
is of particular importance as a urinary tract pathogen because
of its ability to produce urease (page 96). Urease splits urea, thus
creating an alkaline environment and promoting the formation of
kidney stones. Proteus septicemia is a potential complication of
urinary tract infections and can be fatal in weakened individuals.
Differential Characteristics
P. mirabilis is a straight, facultatively anaerobic, highly motile
(swarming) Gram- negative rod (Figure 12-48). It is negative for
indole, esculin hydro lysis, and lactose and salicin fermentation. It
12-47
T
HREE
C
OLONIES OF
P
ROTEUS MIRABILIS ON
S
HEEP
B
LOOD
A
GAR
Note the characteristic swarming growth pattern.
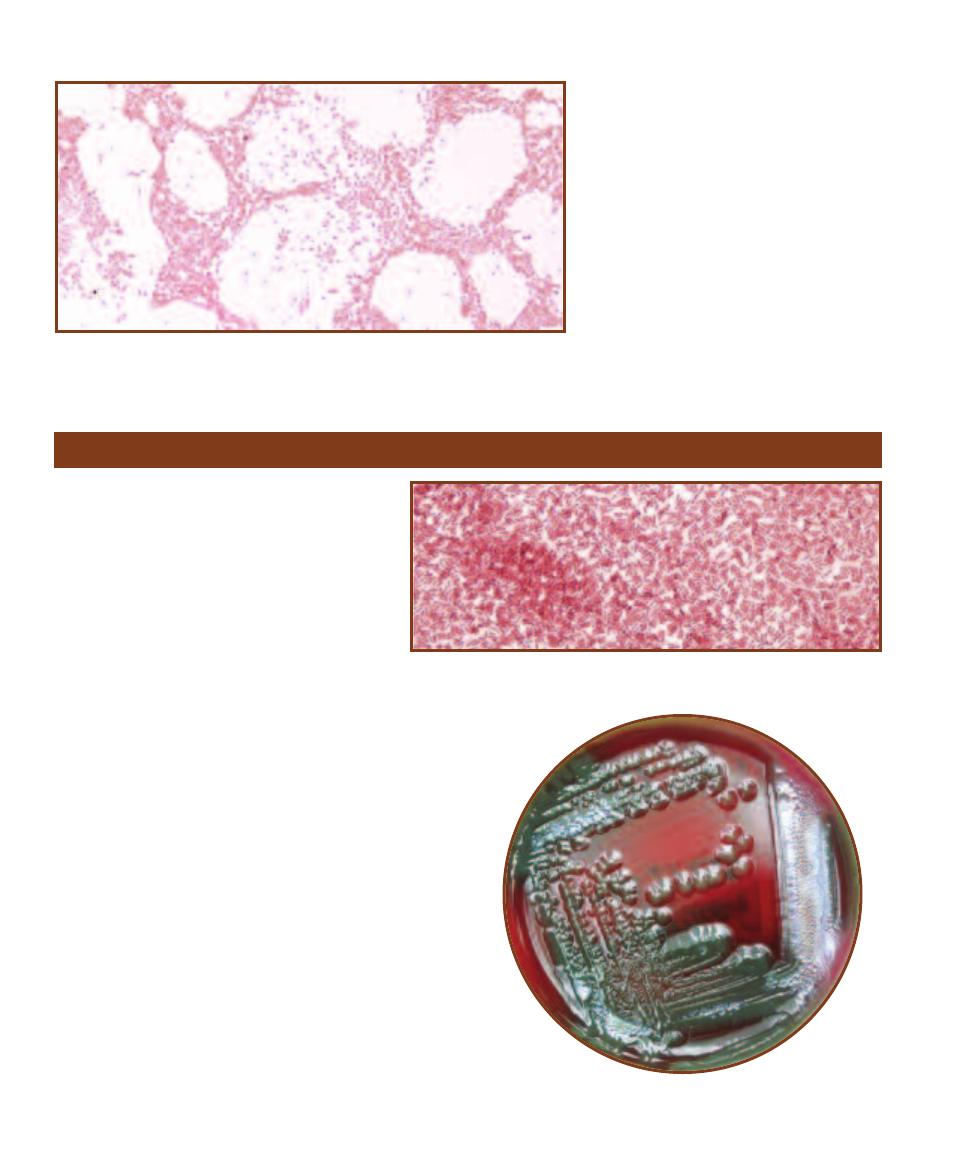
is positive for lipase and ornithine decar-
boxylase, and strongly positive for urease.
Diagnostic procedures include Gram stain
and culture of infected site.
Treatment
Administration of 1st, 2nd, or 3rd generation
cephalosporins, carbapenems, fluoroquino -
lones, or extended spectrum penicillins.
154
䢇
A Photographic Atlas for the Microbiology Laboratory
12-48
G
RAM
S
TAIN OF A
P
ROTEUS MIRABILIS
S
TOCK
C
ULTURE
Straight rods range in
size from 0.4–0.8 µm wide by 1.0–3.0 µm long.
Pseudomonas aeruginosa
Pseudomonas aeruginosa (Class Gammaproteo -
bacteria) is an opportunistic pathogen ubiquitous
in soil, water, and living or decaying plant material.
It has also been isolated from hospital sinks and
tubs, dialysis equipment, contact lens solution,
aerators, irrigation fluids, hot tubs, ointments,
insoles of shoes, and even in soaps and cleaning
solutions. It is the most significant opportunistic
pathogen of its genus and is an especially trouble-
some nosocomial agent because of its ability to
survive eradication attempts. In addition, symp-
toms of Pseudomonas infections are problematic
because they are virtually indis tin guishable from those
caused by Enterobacteriaceae, which tend to produce fewer
fatalities. Transmission can be by ingestion, inhalation, or
through openings in the skin. P. aeruginosa employs surface
pili to attach to host cells and secretes an array of tissue-
damaging enzymes. While healthy individuals are less fre-
quently affected by the organism, immunosuppressed patients
are susceptible to a variety of serious infections. Among the
nosocomial infections caused by this organism are pneu -
monia, wound sepsis, bacteremia, and urinary tract infec-
tions. Other infections include: corneal ulcers, swimmer’s
ear, folliculitis (from contaminated swimming pools or hot
tubs), and osteomyelitis of the calcaneus in children due to
puncture wounds through the shoe.
Differential Characteristics
P. aeruginosa is an aerobic, motile, straight or slightly
curved, Gram-negative rod that produces a green diffusible
pigment when grown on solid media (Figures 12-49, 12-50,
and 3-29). It does not ferment carbohydrates. It utilizes
12-49
G
RAM
S
TAIN OF A
P
SEUDOMONAS AERUGINOSA
S
TOCK
C
ULTURE
Cells
are approximately 1 µm or less wide by 2–5 µm long.
12-50
P
SEUDOMONAS AERUGINOSA ON
S
HEEP
B
LOOD
A
GAR
Note the greenish pigment, especially in the regions of heaviest growth.
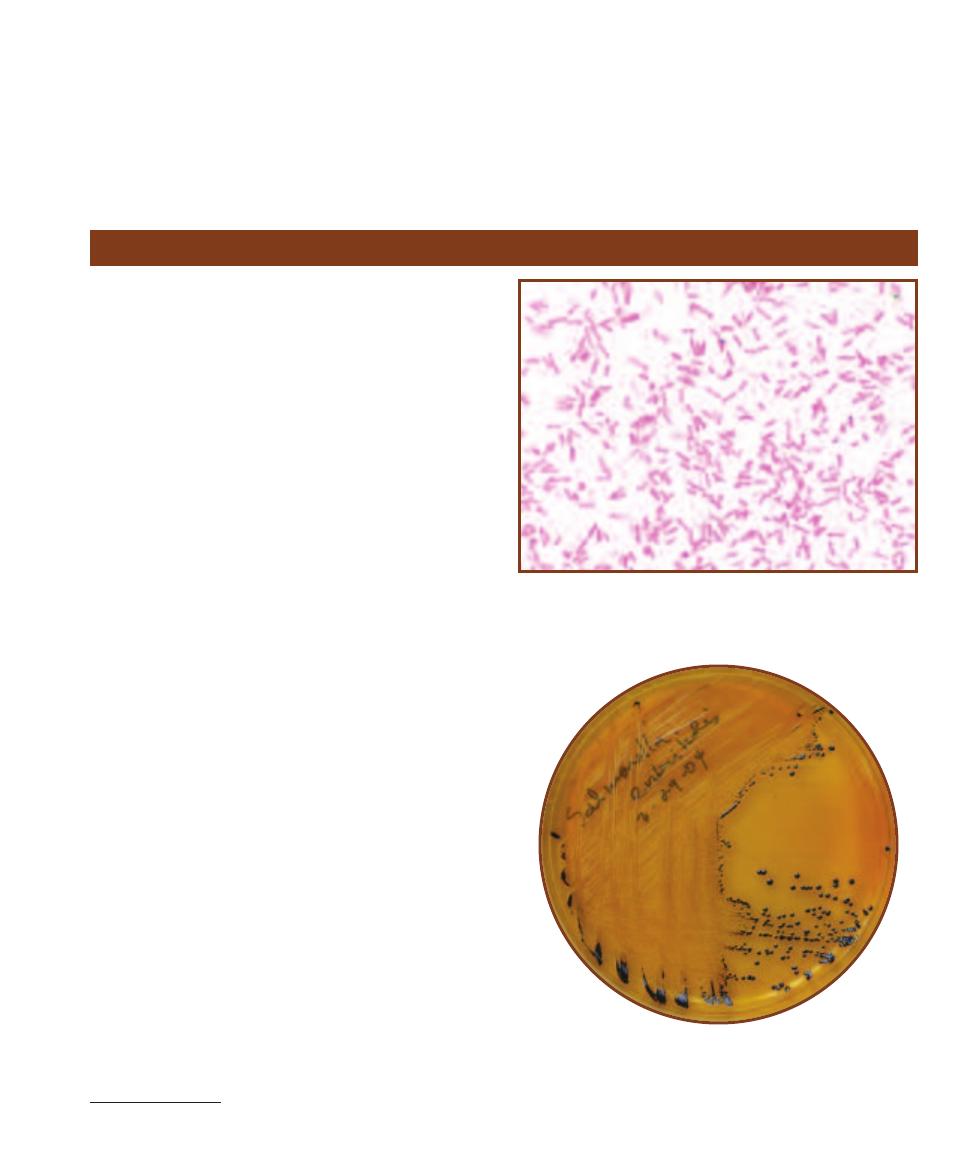
glucose oxidatively and does not utilize lactose or esculin.
It reduces nitrate, is positive for oxidase and arginine
decarboxylase, and negative for ONPG, urease, and lysine
decarboxylase. Diagnostic procedures include Gram stain
and appropriate-site culture.
Treatment
Administration of ceftazidime individually or combined
with aminoglycosides, extended spectrum penicillins,
cefepime, fluoroquino lones, or ciprofloxacin.
SECTION 12
䢇
Bacterial Pathogens
䢇
155
Salmonella enteritidis
Salmonella Enteritidis (Class Gammaproteobacteria)
3
typically resides in the gastrointestinal tract of humans and
many other animals, including poultry, rodents, and wild
birds. It is one of approximately 2,200 nontyphoidal Salmo-
nella serotypes, all of which cause gastroenteritis in humans.
The mechanisms described here for S. Enteritidis apply to
those serotypes as well. Entry into the body is by ingestion
of food or water contaminated with feces. Salmonella spp.
are susceptible to acidic conditions and thus require a large
number of organisms (>10
6
) to infect a human with normal
stomach acidity. Thus, the organism tends to favor hosts
with low gastric acidity. Once through the hostile environ-
ment of the stomach, they are taken up by intestinal epi the-
lial cells and are released into the underlying connective
tissue where they begin to multiply. The mechanism by
which diarrhea is induced is not fully understood, however,
evidence suggests that it is due to the production of a cholera-
like or Shiga-like toxin. Salmonella Enteritidis is not well
suited for intracellular conditions, therefore, except in cases
where the host immune system has been compromised,
gastrointestinal infections are generally short-lived. Lacking
an appropriate host immune response, however, dissemina-
tion of the organism may occur, resulting in widespread
systemic infection.
Differential Characteristics
Salmonella Enteritidis is a straight, motile, facultatively
anaerobic, nonsporing, Gram-negative rod (Figures 12-51
and 12-52). Diagnostic pro cedures include aerobic and
anaerobic blood culture, bone marrow culture, and stool
culture. It is methyl red and citrate positive, and negative
for indole, VP, and lactose fermentation. Because the vast
number of strains differ primarily in antigenic structure,
serogrouping by a reference laboratory is necessary for final
identification.
Treatment
In most cases of diarrheal disease, antibiotics are not neces-
sary. However, in disseminated Salmonella infections, third
generation cephalosporins, ampicillin, or sulfamethoxazole
with trimethoprim are used.
12-51
G
RAM
S
TAIN OF A
S
ALMONELLA
E
NTERITIDIS
S
TOCK
C
ULTURE
The cells are straight rods ranging in size from 0.7–1.5 µm
wide by 2.0–5.0 µm long.
12-52
S
ALMONELLA
E
NTERITIDIS ON
S
ALMONELLA
-S
HIGELLA
(SS)
A
GAR
Compare to Salmonella typhi (Figure 12-54) and Shigella flexneri
(Figure 12-56). Note the black colonies due to reaction of H
2
S (from
sulfur reduction) and ferric citrate in the medium. Also see page 16 for
more information about SS Agar.
3
Abbreviated from Salmonella enterica serovar Enteritidis.
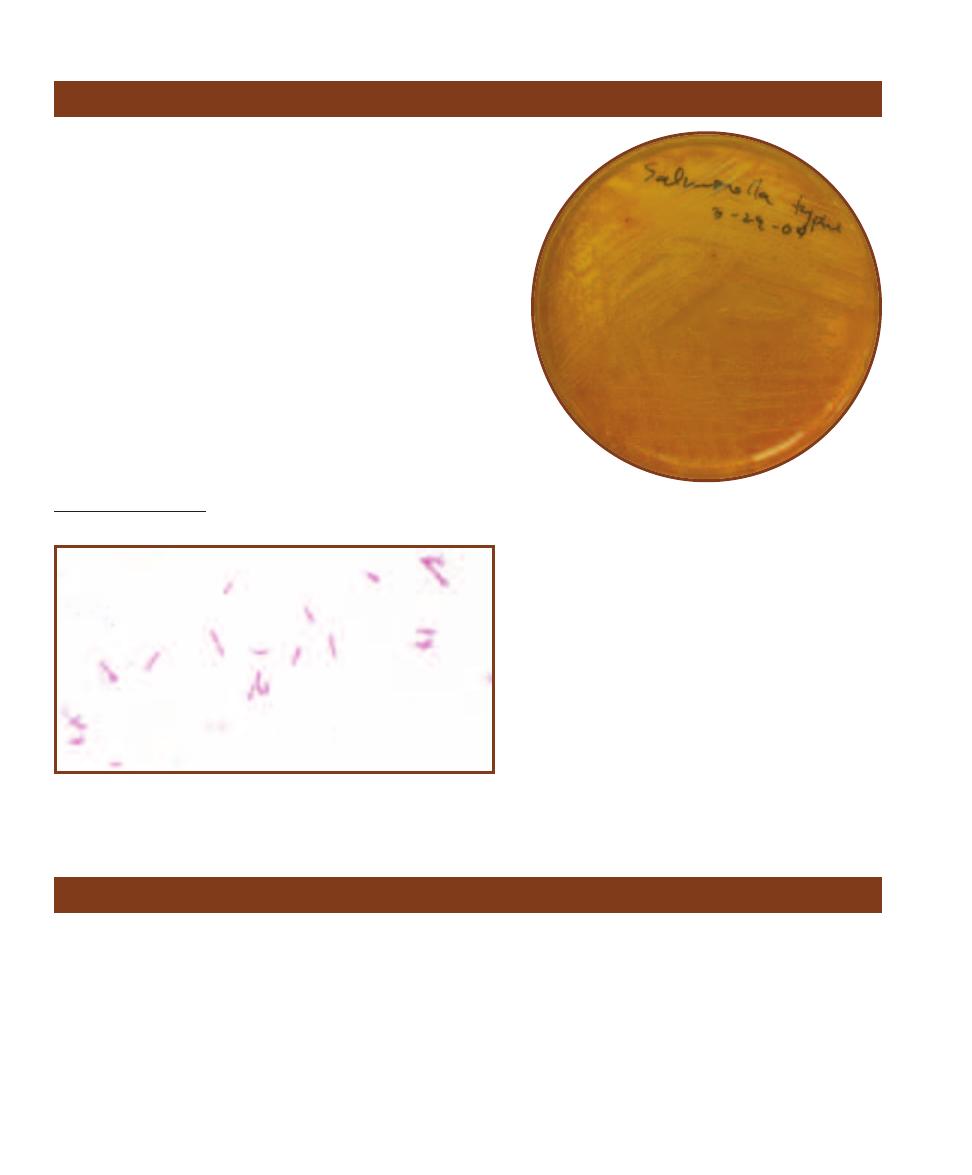
156
䢇
A Photographic Atlas for the Microbiology Laboratory
Salmonella typhi
Salmonella typhi
(Class Gammaproteobacteria)
4
is the causative
agent of typhoid fever in humans. The organism is typically trans-
mitted by fecally contaminated food or water. As described in Sal-
monella Enteritidis on the previous page, S. typhi initially attacks
epithelial cells of the small intestine, is ushered into the under -
lying connective tissue and regional lymph nodes, and begins to
multiply. It then enters the bloodstream where it produces acute
bacteremia and subsequently infects the liver, spleen, bone
marrow, and eventually the kidneys and gallbladder. This phase,
accompanied by high fever and sometimes diarrhea, is long lasting
and continuous (up to 8 weeks in untreated cases). In a small
percentage of patients (“carriers”), the organism is harbored
asymptomatically in the gallbladder and sloughed in the feces
for up to a year or more.
Differential Characteristics
S. typhi is a straight, motile, encapsulated, facul tatively anaerobic,
nonsporing, Gram-negative rod (Figures 12-53 and 12-54). Diag-
nostic procedures include aerobic and anaerobic blood culture,
12-53
G
RAM
S
TAIN OF A
S
ALMONELLA TYPHI
S
TOCK
C
ULTURE
The cells
are straight rods ranging in size from 0.7–1.5 µm wide by 2.0–5.0 µm long.
12-54
S
ALMONELLA TYPHI ON
S
ALMONELLA
-S
HIGELLA
A
GAR
Compare to Salmonella Enteritidis (Figure 12-52) and
Shigella flexneri (Figure 12-56). Note the absence of black in the
colonies due to weak (or lack of) sulfur reduction to H
2
S.
bone marrow culture, and stool culture. S. typhi is
MR positive and indole, VP, and citrate negative,
and does not ferment lactose. Because the vast num-
ber of strains differ primarily in antigenic structure,
serogrouping by a reference laboratory is necessary
for final identification.
Treatment
Administration of third generation cephalosporins,
ampicillin, sulfamethoxazole with trimethoprim,
chloramphenicol, or ciprofloxacin
Shigella dysenteriae
Shigella dysenteriae (Class Gammaproteobacteria) is one of
four Shigella species (S. dysenteriae [Figure 12-55], S. flexneri
[Figure 12-56], S. boydii, and S. sonnei), all of which are
responsible for bacillary dysentery (shigellosis) in humans
and a few other primates. S. dysenteriae is endemic in Africa,
Asia, and Latin America; S. flexneri and S. sonnei are found
primarily in developed areas including the United States;
and S. boydii is mostly restricted to India. The majority of
cases occur in children under 10 years of age. Transmission
is by direct person-to-person contact or ingestion of food or
water contaminated by human feces. It is highly communi-
cable and virulent; it can cause illness with as few as 200
organisms, but more typically with 10
3
organisms. Although
all species of Shigella cause the disease, S. dysen teriae alone
produces the cell-killing Shiga exotoxin and is, therefore, re-
sponsible for the most severe symptoms. Unlike Salmonella,
Shigella spp
.
are resistant to the stomach’s acidic environ-
ment which accounts, in part, for the low infectious dose.
Once in the intestine, they induce phagocytosis by host
epithelial cells where they multiply and then spread in a
4
Abbreviated from Salmonella enterica subspecies Enterica serovar Typhi.
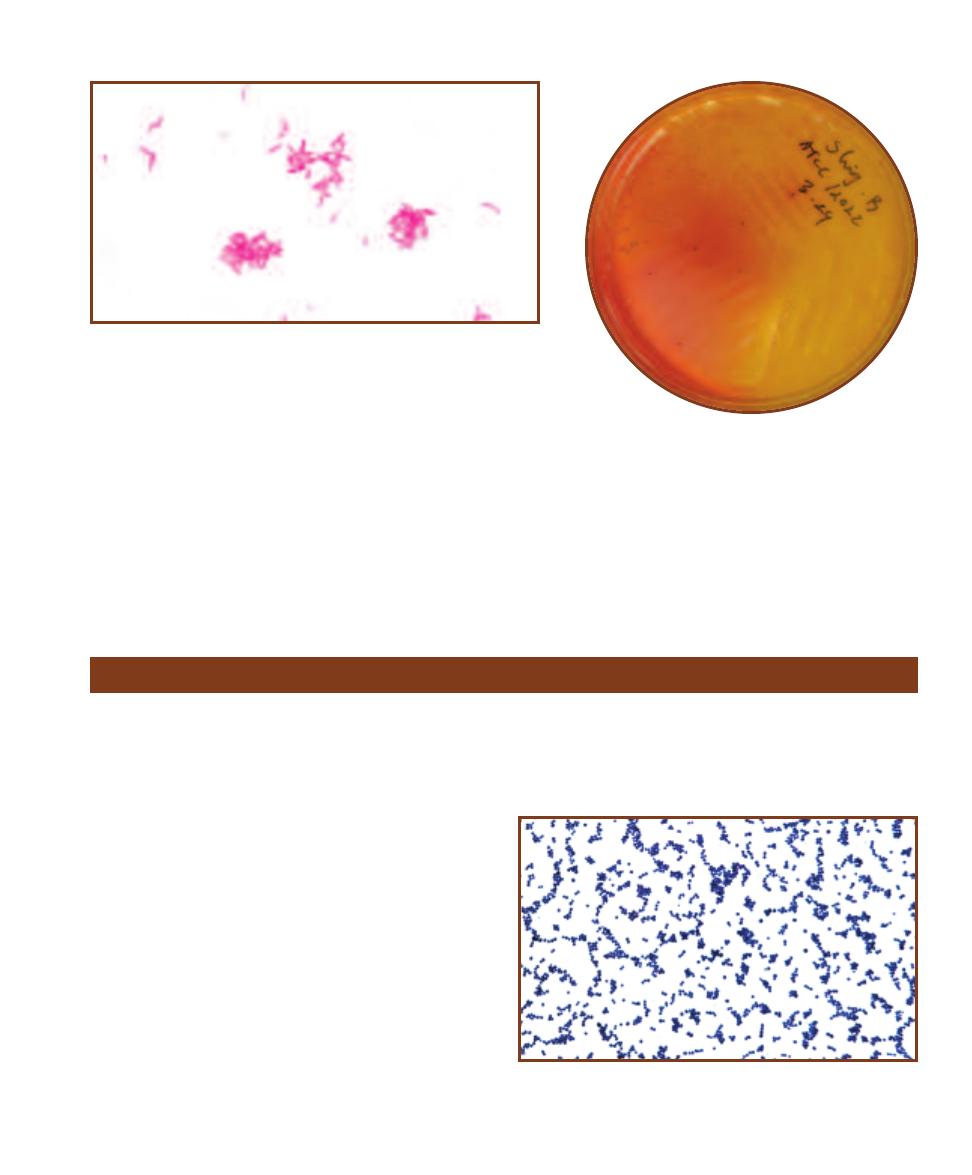
process that kills the cells and forms mucosal ulcerations. This
process combined with an acute immune response is responsible
for the purulent bloody diarrhea characteristic of the disease.
Differential Characteristics
S. dysenteriae is a straight, nonmotile, facultatively anaerobic, Gram-
negative rod. It does not ferment lactose, mannitol, raffinose,
sucrose, or xylose and is negative for ONPG and ornithine decar-
boxylase. Diagnostic procedures include fecal leukocyte stain and
stool culture.
SECTION 12
䢇
Bacterial Pathogens
䢇
157
12-55
G
RAM
S
TAIN OF A
S
HIGELLA DYSENTERIAE
S
TOCK
C
ULTURE
The
cells are straight rods ranging in size from 0.7–1.0 µm wide by 1.0–3.0 µm long.
12-56
S
HIGELLA FLEXNERI ON
S
ALMONELLA
-S
HIGELLA
(SS) A
GAR
Compare to Salmonella Enteritidis (Figure 12-52)
and Salmonella typhi (Figure 12-54). Note the colorless
colonies due to inability to ferment lactose or reduce sulfur—
both included in the medium.
Treatment
Administration of ampicillin, sulfamethoxazole
with trimethoprim, or ciprofloxacin.
Staphylococcus aureus
Staphylococcus aureus (Phylum Firmicutes) is a normal
human inhabitant, most commonly found in the nose, but
also known to inhabit the skin and vagina. It is a common
nosocomial pathogen that causes toxic shock syndrome,
food poisoning, scalded skin syndrome, and abscesses
virtually anywhere in the body. Factors that increase its
virulence include: antiphagocytic proteins, lipase production
(which aids entry through the skin), coagulase (which en-
hances the formation of abscesses), enterotoxins (which
induce vomiting and diarrhea), and exotoxins (which destroy
polymorphonuclear leukocytes, aid necrosis, and produce
fever, chills, shock, and rash). S. aureus is transmitted by
direct human-to-human contact, aerosols, or environmental
factors. It is a robust organism that resists cleaning solutions
and antimicrobial agents, and can survive for weeks in the
environment.
Differential Characteristics
S. aureus is a nonmotile, facultatively anaerobic,
-hemolytic,
Gram-positive coccus (Figures 12-57 and 12-58). S. aureus
is positive for the slide coagulase test (bound coagulase),
the tube coagulase test (free coagulase), and DNAse. It can
grow in media containing up to 10% NaCl. Diagnostic
procedures include Gram stain, appro priate-site aerobic
culture, and teichoic acid antibody test.
12-57
G
RAM
S
TAIN OF A
S
TAPHYLOCOCCUS AUREUS
S
TOCK
C
ULTURE
Note the characteristic grape-like clusters. Cells are approxi-
mately 0.5–1.0 in diameter.
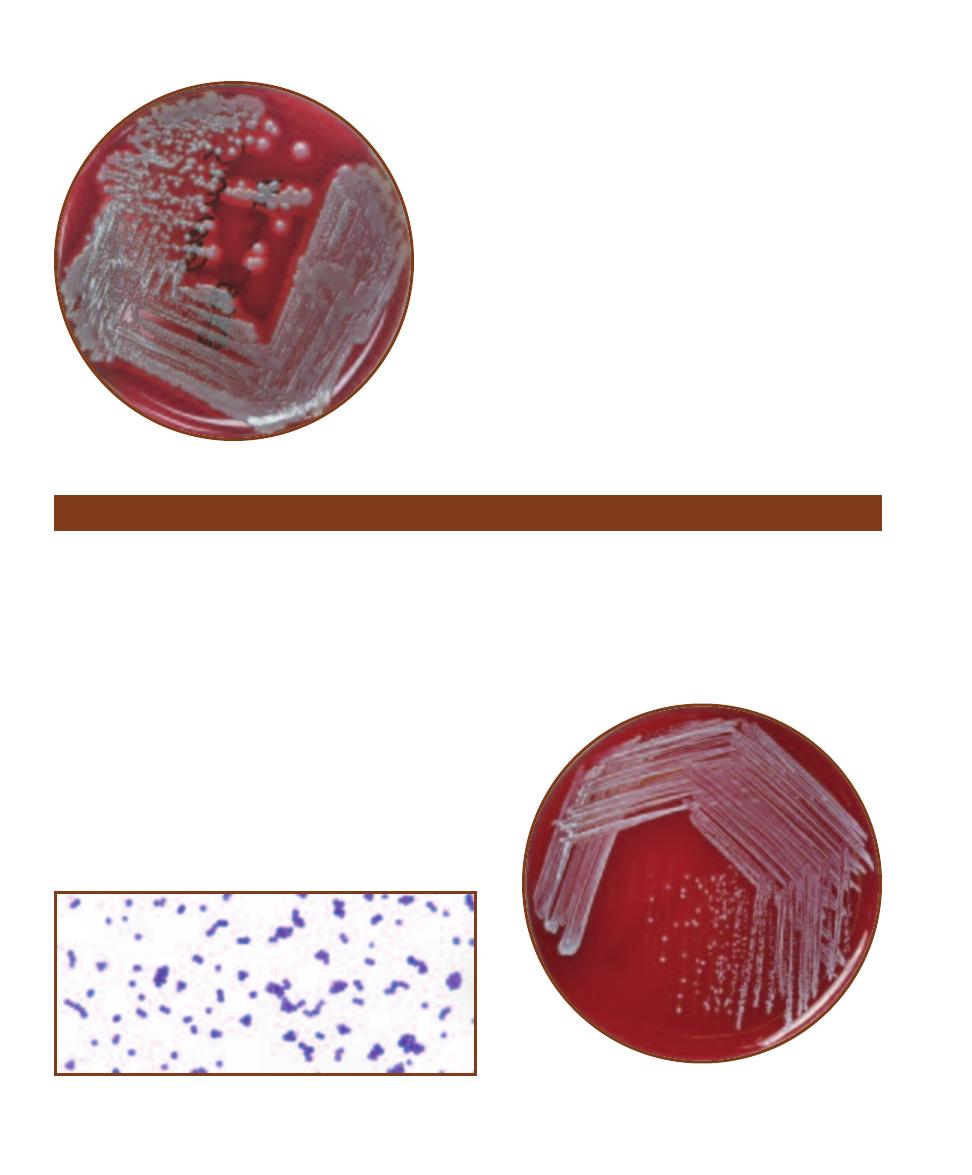
Treatment
Possible effective antibiotics are too numerous to mention here.
Since S. aureus has shown a remarkable ability to resist most
antibiotics (e.g., Methicillin-resistant Staphylococcus aureus—
MRSA), susceptibility testing (page 223) is recommended for
each isolate.
158
䢇
A Photographic Atlas for the Microbiology Laboratory
12-58
S
TAPHYLOCOCCUS AUREUS ON
S
HEEP
B
LOOD
A
GAR
Note the -hemolysis. Note also the absence of yellow color in the
colonies, typical of S. aureus growth on Nutrient Agar. Compare
with S. epidermidis colonies in Figure 12-60.
Staphylococcus epidermidis
Staphylococcus epidermidis (Phylum Firmicutes) is a normal
inhabitant of human skin that has become a significant oppor -
tu nistic nosocomial pathogen. It is the most common coagulase-
negative Staphy lococcus encountered clinically. Most strains
produce a slime layer that may enable them to attach to certain
hospital apparati used in invasive procedures, thereby gaining
entry to the body. Infections originating at the site of prosthetic
implantation are frequently caused by S. epidermidis. Due to
multiple antibiotic resistance and the generally weakened con -
dition of a convalescing patient, disseminated S. epidermidis
infection can be quite severe and is frequently fatal.
Differential Characteristics
S. epidermidis is a nonmotile, facultatively anaerobic, non-
hemolytic, Gram-positive coccus (Figures 12-59 and 12-60).
It ferments maltose but does not ferment sucrose, xylose, or
trehalose. It is positive for alkaline phosphatase production and
12-60
S
TAPHYLOCOCCUS EPIDERMIDIS ON
S
HEEP
B
LOOD
A
GAR
Note the small white colonies and absence of hemolysis.
Compare with S. aureus colonies in Figure 12-58.
negative for coagulase and DNase. Diagnostic procedures
include Gram stain and appropriate-site aerobic culture.
Treatment
Like S. aureus, S. epidermidis has demonstrated an
ability to resist certain antibiotics. Susceptibility testing
(page 223) is recommended for individual isolates.
12-59
G
RAM
S
TAIN OF A
S
TAPHYLOCOCCUS EPIDERMIDIS
S
TOCK
C
ULTURE
Cells are approximately 0.8–1.0 µm in diameter.
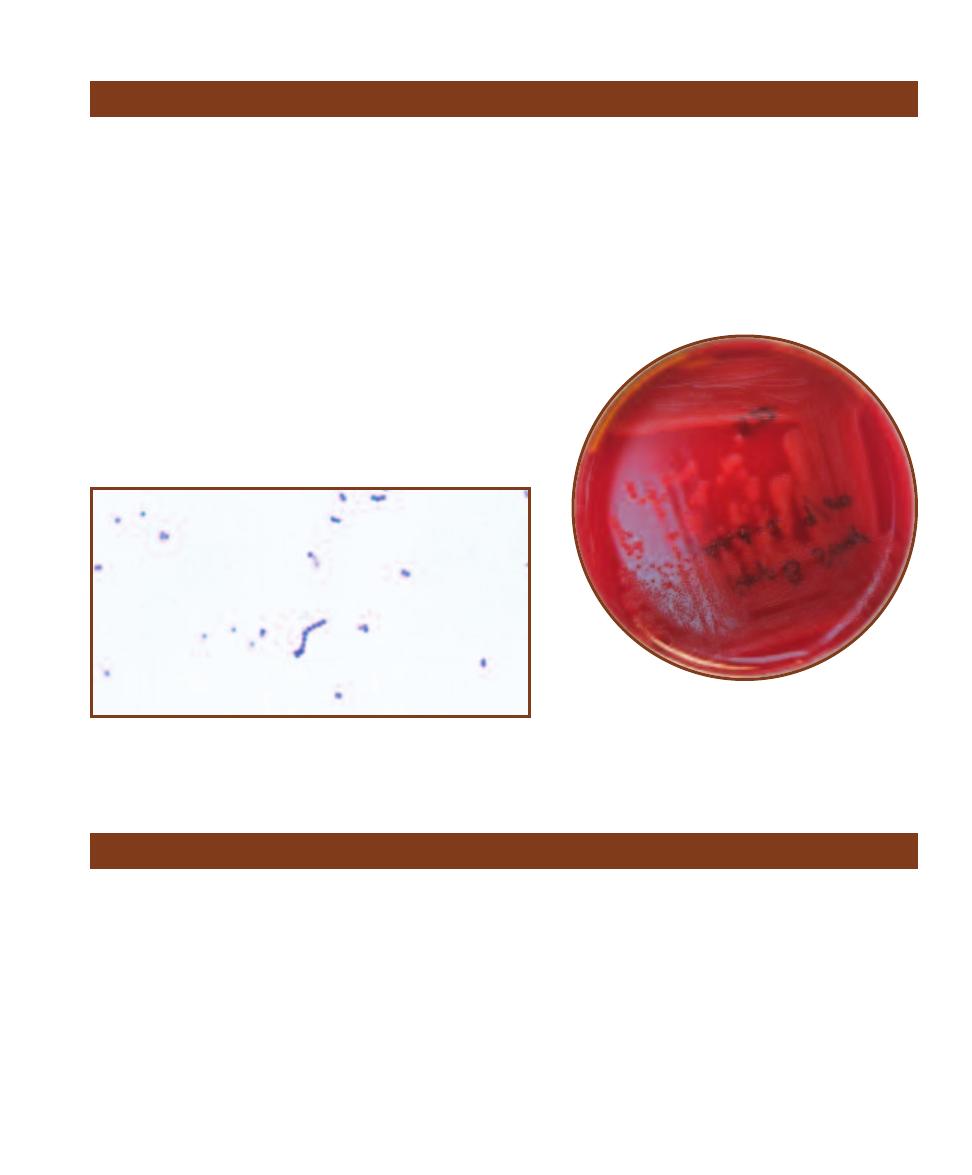
SECTION 12
䢇
Bacterial Pathogens
䢇
159
Streptococcus agalactiae
Known also as group B streptococci, strains of Strepto coccus
agalactiae (Phylum Firmicutes) are the major cause of neonatal
meningitis in the United States. The reservoir for this organism is
believed to be the intestinal tracts of humans and animals, but it
is often found in the vagina of pregnant women. The organism
is typically acquired by the infant in utero through a damaged
membrane, from the birth canal during childbirth, or from contact
with contaminants after birth. Its virulence is attributable to a
polysaccharide capsule which allows it to survive phagocytosis,
multiply, and eventually spread by way of the bloodstream. Dis-
seminated disease also causes pneumonia and septic shock, espe-
cially in the elderly and immunocompromised populations.
Differential Characteristics
S. agalactiae is a
-hemolytic or nonhemolytic, nonmotile, encap-
sulated, facultatively anaerobic, Gram- positive coccus (Figures
12-61 and 12-62). It is positive for the CAMP test and sodium
12-61
G
RAM
S
TAIN OF A
S
TREPTOCOCCUS AGALACTIAE
(G
ROUP
B
S
TREPTOCOCCI
) S
TOCK
C
ULTURE
Spherical or ovoid cells 0.6–1.2 µm in
diameter are usually seen as pairs or in chains.
12-62
S
TREPTOCOCCUS AGALACTIAE
(G
ROUP
B S
TREP
-
TOCOCCI
)
ON
S
HEEP
B
LOOD
A
GAR
Note the -hemolysis
(some strains are nonhemolytic).
hippurae hydrolysis, negative for Voges-Proskauer
and PYR, and is bacitracin and SXT-resistant. Diag-
nostic procedures include appropriate-site aerobic
culture and group B Streptococcus antigen test.
Treatment
Administration of penicillin G, amoxicillin, ampi-
cillin, 1st generation cephalosporins, erythromycin,
or vancomycin.
Streptococcus mutans
Streptococcus mutans (Phylum Firmicutes) is one member
of the streptococcal group known as the “mutans” group.
The mutans group is one of five groups in the “viridans
group,” which also includes the “anginosus group,” “bovis
group,” “mitis group,” and “salivarius group.” All viridans
streptococci are either
␣-hemolytic or nonhemolytic, Gram-
positive cocci typically found in the mouth, upper respira-
tory tract, and urogenital tract of humans.
Members of the mutans group are the most common
cause of subacute endocarditis in patients with existing
heart valve problems or prosthetic heart valves. They are
also responsible for bacteremia following dental or urogenital
invasive procedures, and in immunosuppressed patients un-
dergoing chemotherapy and bone marrow transplantation.
Clinically, the most common encounter with oral strepto-
cocci is in the dentist’s chair. Several of these organisms are
capable of hydrolyzing sucrose and forming dental plaque,
which in turn provides the anaerobic environment ideal for
fermentation. Acid produced by this fermentation and that
of certain Lactobacilli erodes the tooth enamel and is re-
sponsible for the formation of dental caries (see Snyder Test
on page 237).
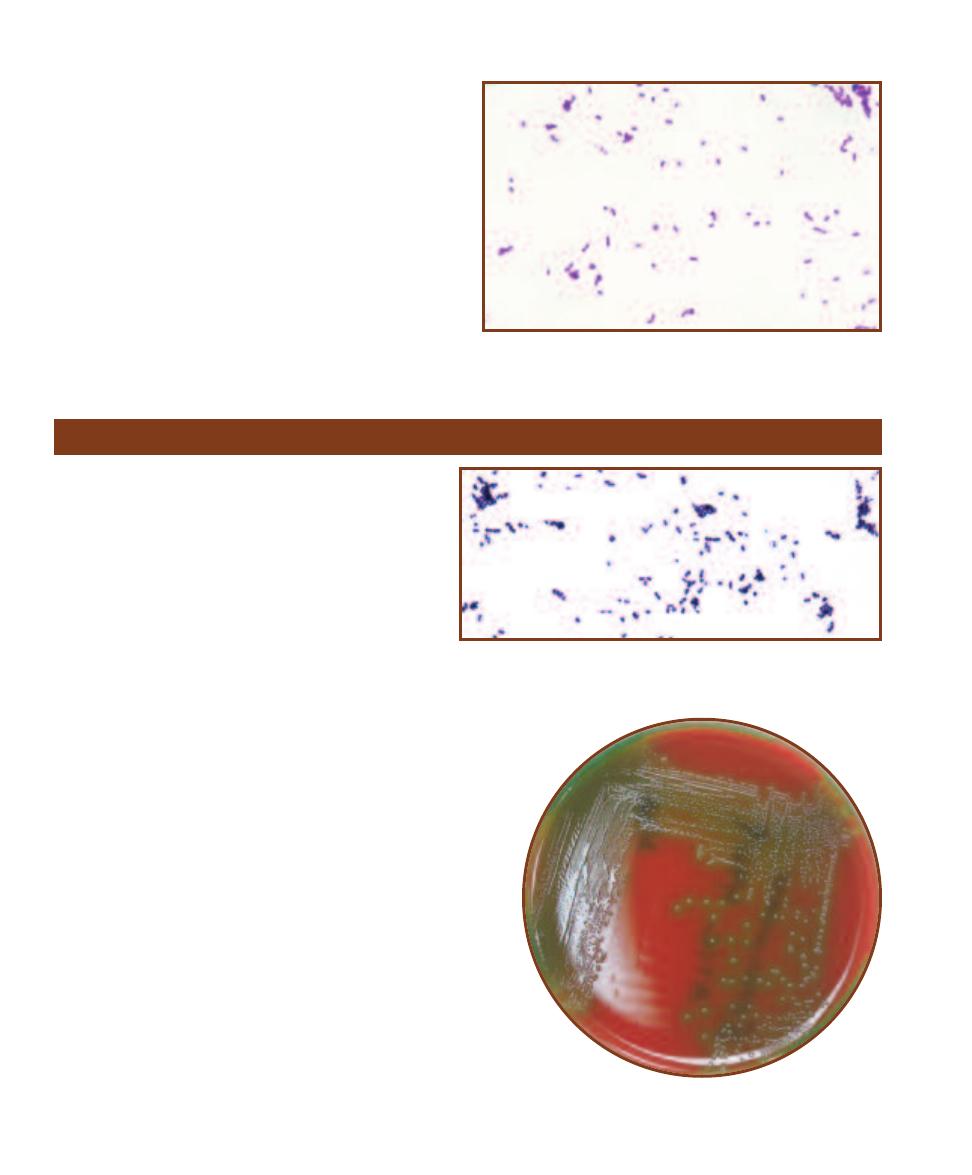
Differential Characteristics
S. mutans is an
␣-hemolytic or nonhemolytic, nonmotile,
facultatively anaerobic, Gram-positive coccus (Figure 12-63)
and is resistant to optochin (page 87). Species identification
is usually not clinically necessary for the
␣-hemolytic and
nonhemolytic streptococci. The various groups can be
differentiated from other groups based on their reactions in
six biochemical tests: arginine hydrolysis, esculin hydrolysis,
urease, Voges-Proskauer, and acid production from mannitol
and sorbitol fermentation. Diagnostic procedures include
Gram stain and appropriate-site aerobic culture.
Treatment
Administration of penicillin G, vancomycin, or 1st generation
cephalosporins.
160
䢇
A Photographic Atlas for the Microbiology Laboratory
12-63
G
RAM
S
TAIN OF A
S
TREPTOCOCCUS MUTANS
S
TOCK
C
ULTURE
Ovoid cells usually appear in short chains and range in
diameter from 0.5–0.75 µm.
Streptococcus pneumoniae
Streptococcus pneumoniae (Phylum Firmicutes) is esti-
mated to be carried asymptomatically by up to 75% of
the human population. Children and adults with children
are the principal carriers. It is a significant cause of
community-acquired bacterial pneumonia and meningitis
in adults. The organism typically colonizes the nasopharynx
where it either is eliminated from the body, spreads to
the lungs and develops into pneumonia, or is harbored
asymptomatically for up to several months. Transmission
is usually by direct contact with a carrier or contaminated
aerosols. At least 80 different serotypes of S. pneumoniae
exist and are defined antigenically by their capsules,
which are their primary virulence factor. Some serotypes
are more virulent than others due to their ability to avoid
phagocytosis by host cells and the degree to which they stimulate
antibody production. In the lungs the organism stimulates a vigor-
ous immune response marked by copious fluid production. In the
majority of infections, the invading organisms are cleared with no
long term effects. However, if complicated by bacteremia, menin-
gitis and other secondary infections are the likely result.
Differential Characteristics
S. pneumoniae is an
␣-hemolytic, nonmotile, encapsulated, facul-
tatively anaerobic, Gram-positive coccus (Figures 12-64 and
12-65). It is negative for arginine hydroly sis, esculin hydrolysis,
and acid production from mannitol and sorbitol. It is also urease
and Voges-Proskauer negative and susceptible to optochin. Diag-
nostic procedures include Gram stain, appropriate-site aerobic
culture, and rapid Streptococcus antigen test.
Treatment
As with the staphylococci, drug resistance is an issue with Strepto-
coccus and requires isolate susceptibility testing (page 223).
12-64
G
RAM
S
TAIN OF A
S
TREPTOCOCCUS PNEUMONIAE
S
TOCK
C
UL
-
TURE
Specimens from sputum samples are typically seen as singles or in
pairs and the cells are often elongated (lancet-shaped). They range in diam-
eter from 0.5–1.25 µm.
12-65
S
TREPTOCOCCUS PNEUMONIAE ON
S
HEEP
B
LOOD
A
GAR
Note the greenish color characteristic of ␣-hemolysis.
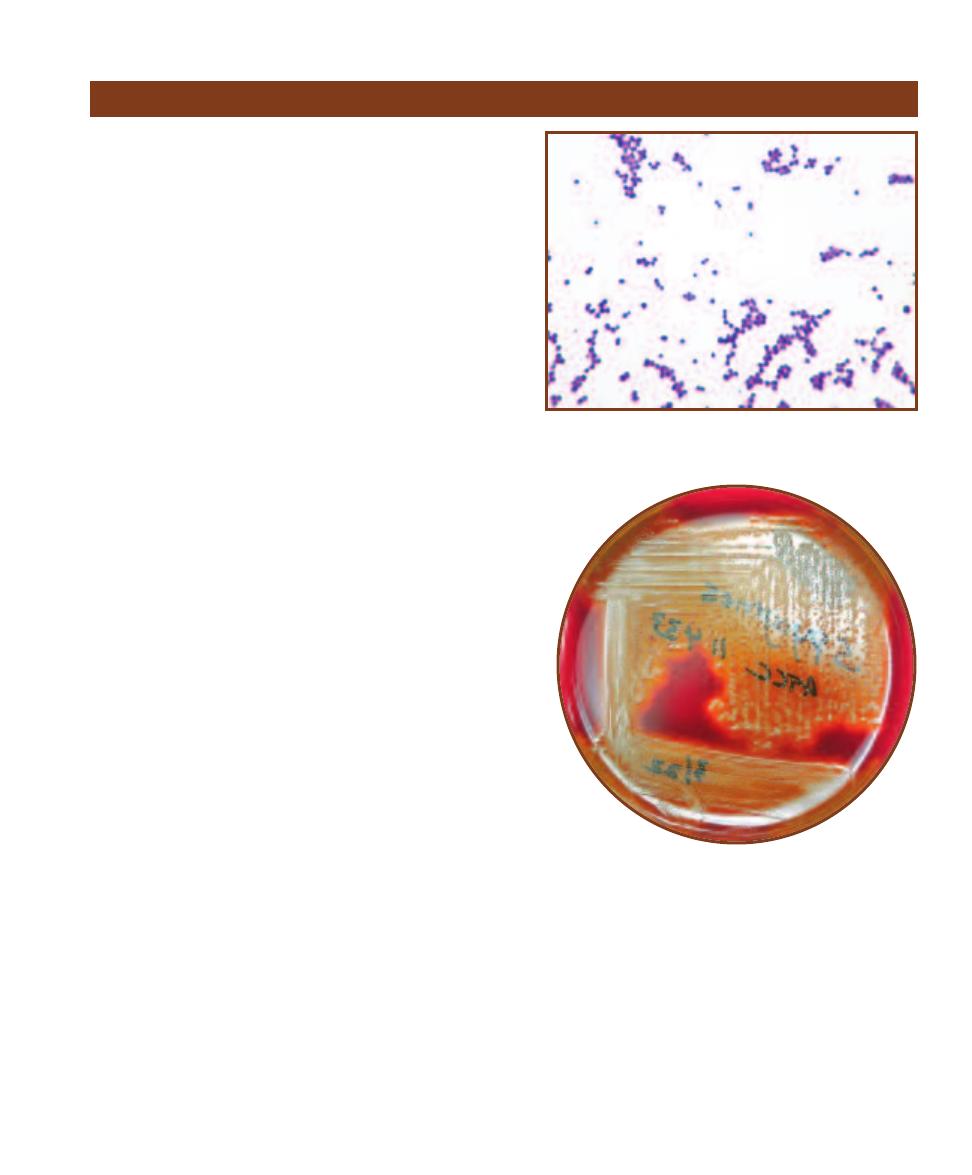
SECTION 12
䢇
Bacterial Pathogens
䢇
161
Streptococcus pyogenes
Streptococcus pyogenes
(Phylum Firmicutes), the principal
member of the group A streptococci (
-hemolytic streptococci),
is responsible for a variety of severe infections. It is responsible
for strepto coccal pharyngitis (“strep throat”), impetigo, middle
ear infections, mastoiditis, and an array of infections resulting
from hematogenic dissemination of the organism, including
glomerulonephritis and acute rheumatic fever (ARF). The human
nose, throat, and skin are reservoirs for S. pyogenes. It is trans-
mitted by direct person-to-person contact or by contaminated
aerosols. A variety of virulence factors allow it to attach to epi -
thelial cells and also help it avoid phago cytosis. Once attached
to the host cells, it releases several toxins that elicit a vigorous
inflammatory response, resulting in severe local inflammation
sometimes accompanied by tissue necrosis. Once thought to be
waning after the discovery of antibiotics, group A streptococci
have made a comeback over the last 20Ⳮ years. Since outbreaks
of ARF in 1985 there have been reports of other infections
including postpartum endomyometritis (puerpural fever),
necrotizing fasciitis (“flesh eating”), and toxic shock-like
syndrome (TSLS), which is very similar to staphylococcal
toxic shock syndrome.
Differential Characteristics
S. pyogenes is a
-hemolytic, nonmotile, encapsulated, faculta -
tively anaerobic, Gram-positive coccus (Figures 12-66 and 12-67).
It ferments lactose, salicin, and trehalose but not inulin, mannitol,
raffinose, fibose, or sorbitol. It hydrolyzes arginine and PYR,
but not hippurate. Alkaline phosphatase is produced, but acetoin
and
␣-galactosidase are not. It is susceptible to bacitracin. Diag-
nostic procedures include throat culture for
-hemolysis (large
zones, approximately 1 cm), Gram stain, appropriate-site aerobic
culture, serum antideoxyribonuclease-B titer, serum antistrepto -
lysin-O titer, group A streptococcus antigen test, and strepto -
zyme test.
Treatment
Administration of penicillin G, erythromycin, vancomycin, or
1st generation cephalosporins.
12-66
G
RAM
S
TAIN OF A
S
TREPTOCOCCUS
PYOGENES
S
TOCK
C
ULTURE
Specimens isolated from patients are usually seen in
pairs and short chains.
12-67
S
TREPTOCOCCUS PYOGENES ON
S
HEEP
B
LOOD
A
GAR
Note the extensive -hemolysis.
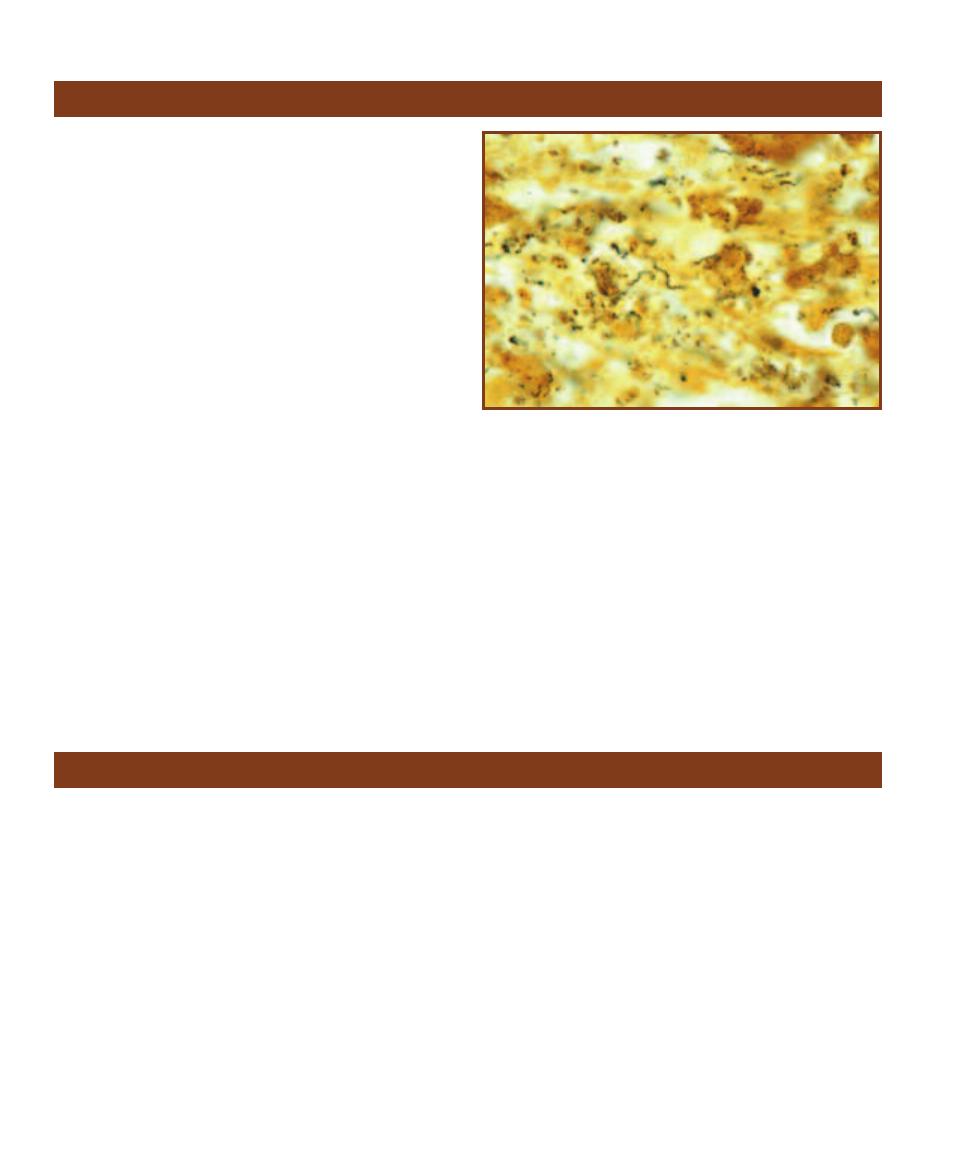
Treponema pallidum
(Phylum Spirochaetes) is an exclusively
human pathogen and the infective agent of syphilis. It is
primarily a sexually transmitted disease (STD), however,
intravenous drug use has broadened the epidemic. Although
easily treated with penicillin, the number of congenital
syphilis cases (where the organism crosses the placenta and
infects the fetus) has also increased dramatically. The organ-
ism enters the body through mucous membranes, abrasions,
or fissures in the epithelia. Some of the organisms attach to
host epithelial cells and multiply, while others are carried to
lymph nodes where they enter the bloodstream and dissemi-
nate throughout the body. The disease develops in three
distinct stages: primary, secondary, and tertiary syphilis. Pri-
mary syphilis lasts about two to six weeks and is character-
ized by the formation of a local lesion called a “chancre.”
Hematogenic dissemination to all body regions (including
the CNS) takes place in this stage. An asymptomatic period
lasting up to six months follows. Secondary syphilis is char-
acterized by formation of lesions in the liver, lymph nodes,
muscles, and skin. A latent (asymptomatic) period follows
the secondary phase and lasts anywhere from five years
to several decades. Tertiary syphilis, the final stage of the
disease, is characterized by the destruction of neural and
cardiovascular tissue and the formation of tumors through-
out the body.
Differential Characteristics
T. pallidum is a motile, microaerophilic, Gram- negative
corkscrew-shaped rod (Figure 12-68). Initially, darkfield
microscopic examination of the patient’s sample is useful.
Following that, serological tests, such as immunofluorescence
and rapid plasma reagin tests (Figure 8-10), have proven to
be effective methods of determining the presence of T. palli -
dum. Biochemical tests are not done because the organism
does not grow well outside the host.
Treatment
Administration of penicillin G benzathine, penicillin G
procaine, or doxycycline.
162
䢇
A Photographic Atlas for the Microbiology Laboratory
Treponema pallidum
Vibrio cholerae
12-68
S
ILVER
S
TAIN OF
T
REPONEMA PALLIDUM
(
CENTER
)
IN
A
NIMAL
T
ISSUE
This spirochete demonstrates “corkscrew motility” by
means of periplasmic flagella. Cells range in size from 0.2 µm wide by
5–15 µm long.
Vibrio cholerae (Class Gammaproteobacteria) strains are
typed according to their cell wall composition (O antigen).
Although there are 139 serotypes of this species, only two
(the O1 serogroup) have been responsible for the seven
cholera pandemics since 1817 including the current one.
The strains have been somewhat arbitrarily divided into the
O1 V. cholerae and the non-O1 V. cholerae to distinguish
the cholera-causing organisms from the rest. In 1992, how-
ever, a new strain appeared in Madras, India and quickly
spread throughout India, Bangladesh, and Southeast Asia.
This new strain, called serogroup O139, is believed by some
to be the etiologic agent of the eighth cholera pandemic.
Although immunity to O1 strains does not confer immunity
to O139, the diseases caused are indistinguishable. The
organism enters the body by the fecal-oral route, frequently
by way of undercooked contaminated seafood. A large
inoculum (10
10
cells in water) is required to infect healthy
individuals because sufficient numbers of bacteria must
survive the stomach’s acidity and reach the small intestine to
cause disease. The infectious dose is considerably smaller if
ingested with food. Once in the small intestine, the organism
attaches to the mucosal layer and secretes cholera toxin.
The toxin begins a cascade of reactions that ultimately alter
electrolyte levels and stimulate a vigorous outpouring of
fluids into the intestinal lumen. The result is the characteristic
“watery” or “secretory diarrhea,” which is frequently fatal
within a few hours. Because the infection is self-limiting,
fluid and electrolyte replacement is standard treatment.
Differential characteristics
V. cholerae is a motile, facultatively anaerobic, salt-tolerant,
Gram-negative straight or curved rod (Figures 12-69 and
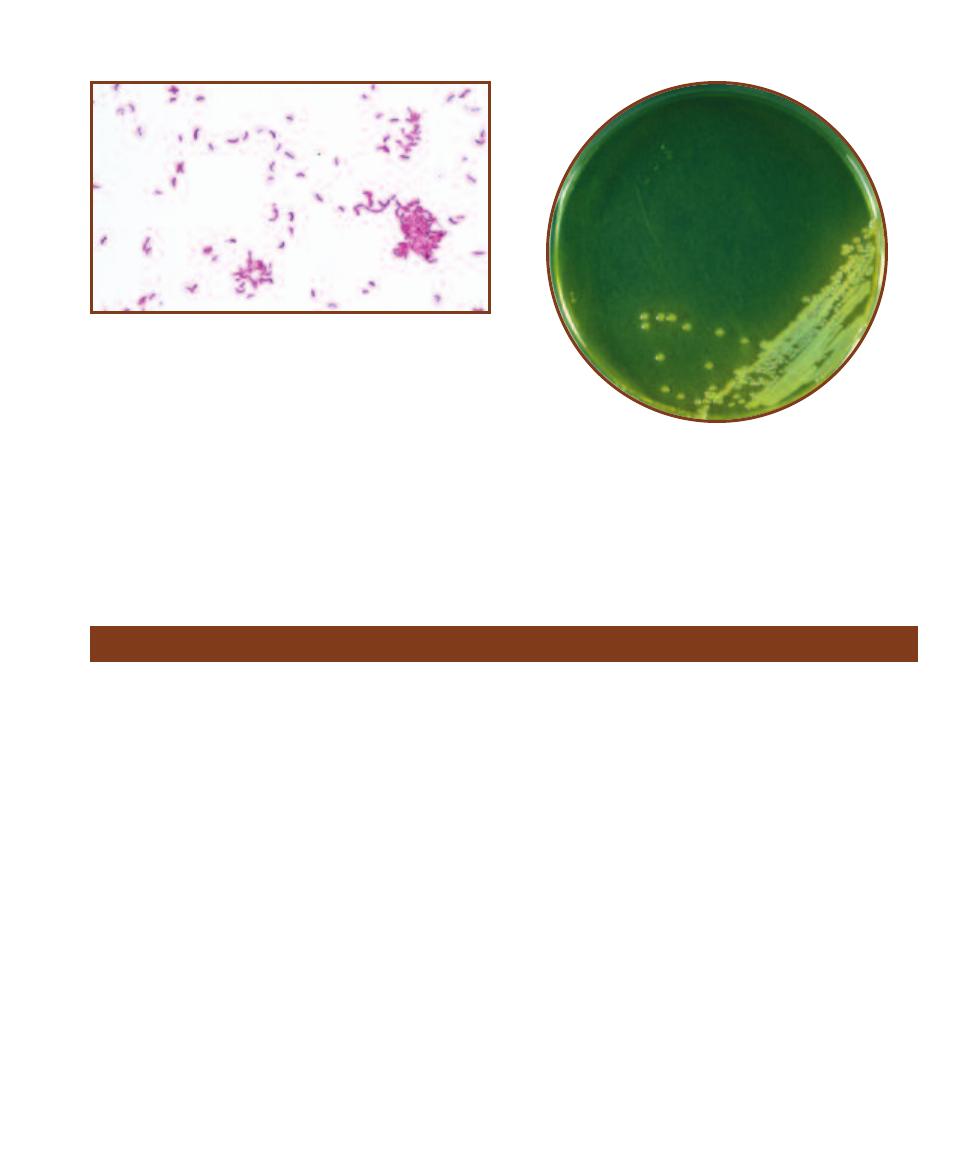
12-70). Diagnostic procedures include fecal leukocyte stain,
dark field or phase contrast microscopic examination of
fecal material, and stool culture. It can be further identified
using various ELISA (page 103) techniques to identify
cholera toxin.
Treatment
Administration of sulfamethoxazole with trimethoprim,
tetracycline, or doxycycline.
SECTION 12
䢇
Bacterial Pathogens
䢇
163
12-69
G
RAM
S
TAIN OF A
V
IBRIO CHOLERAE
S
TOCK
C
ULTURE
Note the slight curvature of the rods. Rods range in length from 2–4 µm.
12-70
V
IBRIO CHOLERAE ON
T
HIOSULFATE
C
ITRATE
B
ILE
S
ALTS
S
UCROSE
(TCBS) A
GAR
TCBS Agar is a selective medium used for
isolation of V. cholerae and V. parahaemolyticus from clinical and
environmental specimens. Refer to Section 2 for more information on
TCBS Agar.
Yersinia pestis
Yersinia pestis (Class Gammaproteobacteria) has been
responsible for dozens of plague epidemics and pandemics
over the last several hundred years, one of which took the
lives of 25 million Europeans in the fourteenth century.
Existing on every continent except Australia, its habitat is
any of a variety of small animals, including rats, ground
squirrels, rabbits, mice, and prairie dogs. In urban outbreaks,
rats are the principal carriers. Y. pestis produces several
antiphagocytic factors that enable it to survive and multiply
both intracellularly and extracellularly. It also produces exo-
toxins and endo toxins which are believed to be responsible
for acute in flammation and necrosis. The organism is most
commonly transmitted by fleas, but can be inhaled as droplet
nuclei, resulting in pneumonic plague (with a nearly 100%
mor tality). Fleas ingest the organism when feeding on in-
fected animal blood and pass it to another animal during a
subsequent blood meal. Y. pestis produces a coagulase that
clots the blood inside the flea’s stomach. When the flea
attempts to feed again, it regurgitates the coagulated material
and contaminated blood back into the bite wound. If the
bacteria are deposited directly into the bloodstream by the
flea (usually in children), septicemic plague is the likely
outcome. The most common form of the disease is bubonic
plague, characterized by severe inflammation and hemor-
rhagic necrosis of the inguinal or axillary lymph nodes
called “bubos.” This is an extremely serious disease with a
very high mortality rate (approaching 50%) when untreated.
Differential Characteristics
Y. pestis is a nonmotile, facultatively anaerobic, Gram-
negative rod or coccobacillus (Figures 12-71 and 12-72).
It forms an envelope (not a capsule) when grown at 37°C.
Y. pestis is negative for indole production and ornithine
decarboxylase. It does not ferment sucrose, rhamnose, or
cellobiose. Diagnostic pro cedures include aerobic and
anaerobic blood culture and appropriate-site aerobic culture.
Treatment
Administration of streptomycin, gentamicin, tetracycline,
doxycyline, or chloramphenicol.
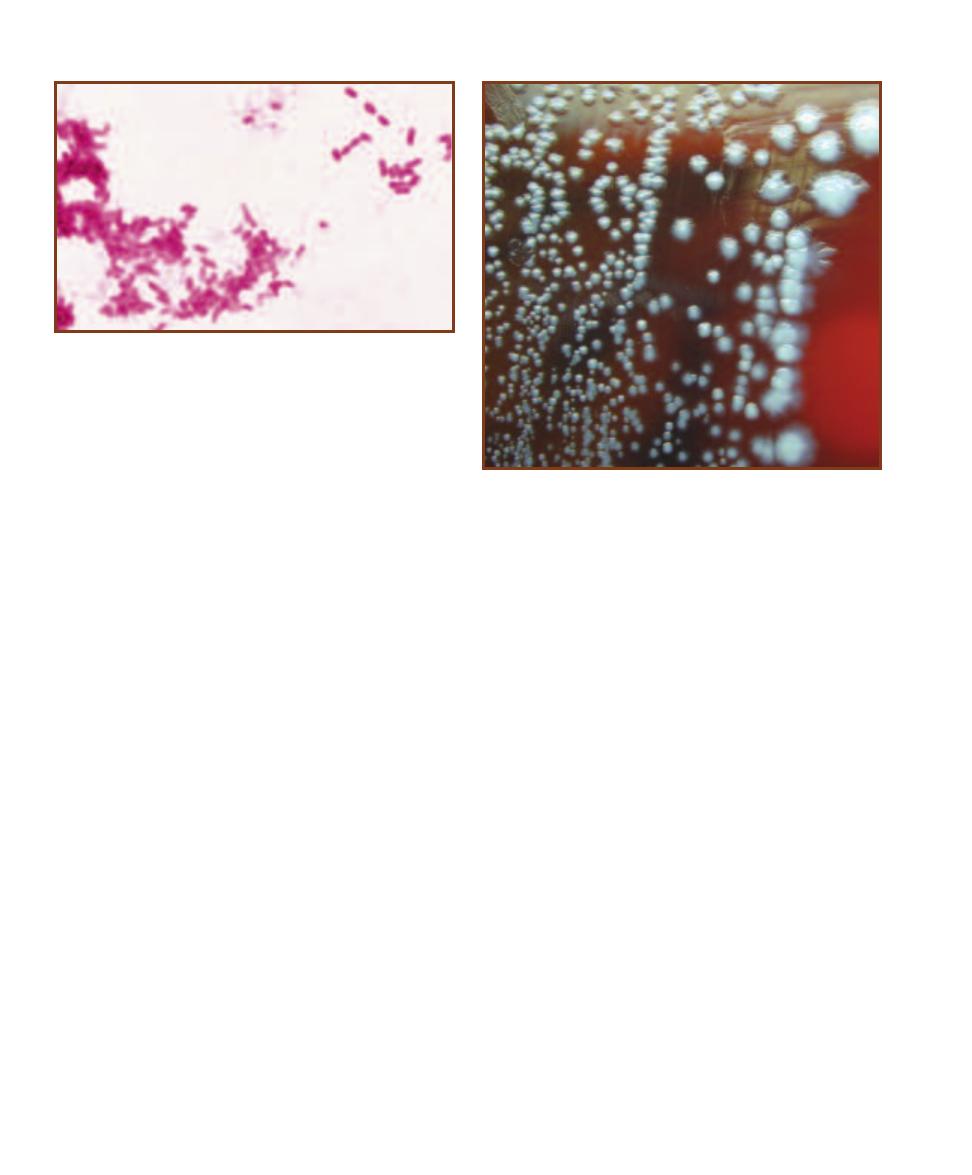
164
䢇
A Photographic Atlas for the Microbiology Laboratory
12-72
Y
ERSINIA PESTIS ON
S
HEEP
B
LOOD
A
GAR
Note the charac-
teristic “fried egg” appearance.
Photo by Larry Stauffer, Oregon State Public Health Laboratory.
(Courtesy of CDC Public Health Image Library)
12-71
G
RAM
S
TAIN OF A
Y
ERSINIA PESTIS
S
TOCK
C
ULTURE
This
organism is typically seen as straight rods or coccobacilli ranging in size
from 0.5–0.8 µm wide by 1–3 µm long.

Domain Archaea
At one time, Archaeans were classified in the Kingdom Monera along with Bacteria. Molecular
evidence, however, has led to the realization that Archaeans and Bacteria have very little in common
beyond being small prokaryotes—hence, their removal from Monera and placement into different
domains.
1
Refer to Table 1-1, page 2 for a com parison of the three domains.
One physiological characteristic of Archaea is that frequently they are extremophiles. That is,
they live in environments that are very hot, very acidic, or very salty. At the present, two phyla are
recognized: Crenarchaeota and Euryarchaeota.
1
Consider the implications: Placing Archaea and Bacteria into different domains means they have less in common with each other
than earthworms, amoebas, sunflowers, mushrooms, humans, and all Eukaryans do!
Crenarchaeota
13
S E C T I O N
165
Members of Crenarchaeota
are morphologically diverse
(including unusual disk-shaped
cells!), Gram-negative, acido -
philic, obligate thermophiles.
They are metabolically diverse
with chemolitho trophic (a
majority metabolize sulfur) and
chemoheterotrophic species.
Aerotolerance groups include
aerobes, facultative anaerobes,
and obligate anaerobes. In spite
of this metabolic diversity
within the phylum, nucleo tide
comparisons indicate that this
is a natural, therefore valid,
grouping. Figure 13-1 shows
the habitat of Sulfo lobus, a
species in one of the three or-
ders in the phylum.
13-1
S
ULFOLOBUS IN
S
ULFUR
C
AULDRON
, Y
ELLOWSTONE
N
ATIONAL
P
ARK
This geologic feature of Yellowstone National Park produces copious
amounts of H
2
S gas. Sulfolobus uses the H
2
S as an energy source and oxidizes
it to sulfuric acid (H
2
SO
4
), lowering the pH of its environ ment to 2 or less. The
high acidity breaks down rock and soil to produce the muddy conditions seen
in the photo. The steam you see rising from the cauldron is due to its high tem-
perature. Sulfolobus species grow between 65°C and 85°C. Although Sulfolobus
is primarily a chemolithoautotroph, it also can grow heterotrophically.
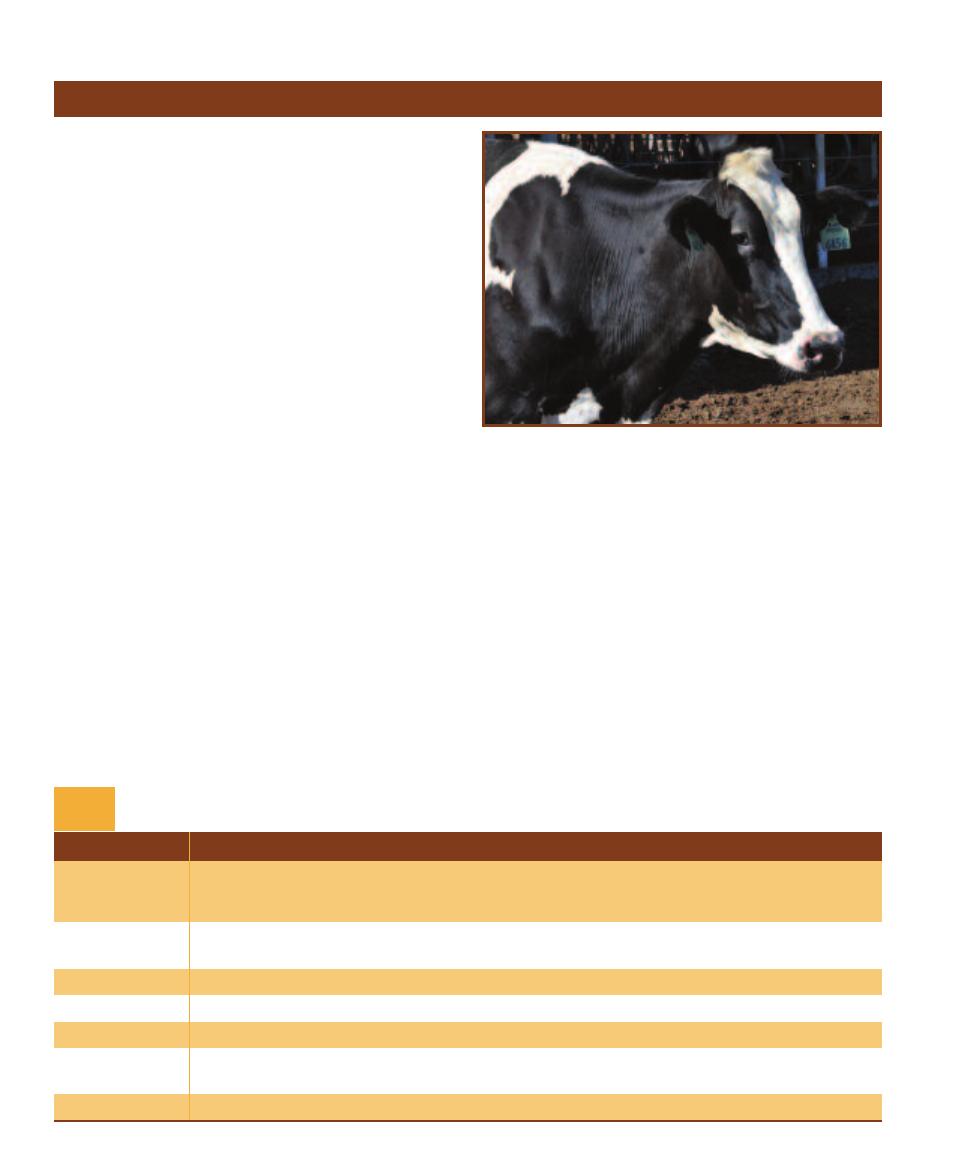
Seven classes comprise Euryarchaeota. These are character-
ized in Table 13-1. Our emphasis will be on the methano gens
and halophiles.
Methanogens obtain energy from the oxidation of H
2
gas, formate (CHCOO
–
), or a few other simple organic
compounds. The electrons and hydrogens from the oxida-
tion are used to reduce CO
2
to methane (CH
4
). The ability
to make methane is the basis for their name: methanogens.
They are found in anaerobic mud of freshwater environ-
ments (where they produce “swamp gas”), sludge digesters,
and in the rumen of cattle (Figure 13-2).
Halobacterium is a genus of extreme halophiles. Repre-
sentatives include aerobes and facultative anaerobes, motile
and nonmotile forms, and cell morphologies of rods, cocci,
flat triangles and discs, and sheets of flat squares (Figure
13-3)! While some can survive and grow at a salinity of
1.5M NaCl, most require salt in the 3.5–4.5M range. They
are able to survive at such high environmental osmotic
pressures because they concentrate KCl intracellularly to
achieve osmotic balance. While enzymes of nonhalophiles are
denatured by high intracellular salinity, those of halophiles
are actually more stable at higher osmotic pressures and are
denatured at lower ones. The same is true of their ribosomes.
Pigments play a major role in Halobacterium survival
(Figure 13-4). Metabolism is chemoheterotrophic (aerobic
respiration), but in the absence of oxygen some species can
become phototrophic because of the membrane-bound
pigment, bacteriorhodopsin. Absorption of light by this
pigment generates a proton gradient—the pigment acts as
light receptor and proton pump—and the resulting proton
motive force is used to phosphorylate ADP to ATP. It is
unclear if these organisms can live photoautotrophically, but
they certainly are capable of photoheterotrophic growth.
Halorhodopsin, a second membrane-bound pigment, is
used by probably all halophilic cells to pump chloride ions
inward (to increase KCl, as mentioned previously). Other
pigments are involved in phototactic responses. Some
species produce gas vacuoles that assist in floatation. Figure
13-5 shows a culture of Halobacterium with gas vacuoles.
These are also visible in Figure 13-3.
166
䢇
A Photographic Atlas for the Microbiology Laboratory
Euryarchaeota
Class
Characteristics
Methanobacteria
Gram-positive with pseudomurein wall; obligate anaerobes that oxidize H
2
, using CO
2
as the electron
acceptor to form CH
4
; do not catabolize carbohydrates, protein, or most other organic compounds
(exceptions are methanol, secondary alcohols, formate, and CO).
Methanococci
Obligate anaerobes with proteinaceous cell wall; most oxidize H
2
, formate, or alcohols with
concurrent reduction of CO
2
to CH
4
.
Halobacteria
Extreme halophiles.
Thermoplasmata
Aerobic (or facultative), thermoacidophilic heterotrophs.
Thermococci
Obligately anaerobic, hyperthermophilic heterotrophs; reduce S
0
to H
2
S in anaerobic respiration.
Archaeoglobi
Obligately anaerobic, hyperthermophilic heterotrophs; S
0
inhibits growth; sulfate, sulfite, thiosulfate,
and nitrate are used as final electron acceptors in anaerobic respiration.
Methanopyri
Chemoautotrophic by forming CH
4
from H
2
and CO
2
; won’t grow below 85°C.
Brief Characterizations of the Seven Classes of Euryarchaeota
T A B L E
13-1
13-2
M
ETHANOGENS IN
C
OW
R
UMENS
Methanogens are found in
the anaerobic digestive tracts of ruminants, such as cows. According to
the EPA, the gut flora of ruminants is responsible for the production of
80 million metric tons of methane (a greenhouse gas) globally! This cow
is a resident of the Van Ommering Dairy Farm in Lakeside, CA. The Van
Ommering farm uses methane produced by its herd to generate electric-
ity that supplies the farm’s energy needs, thereby reducing greenhouse
emissions and providing them with their own energy source—a win-win
situation!
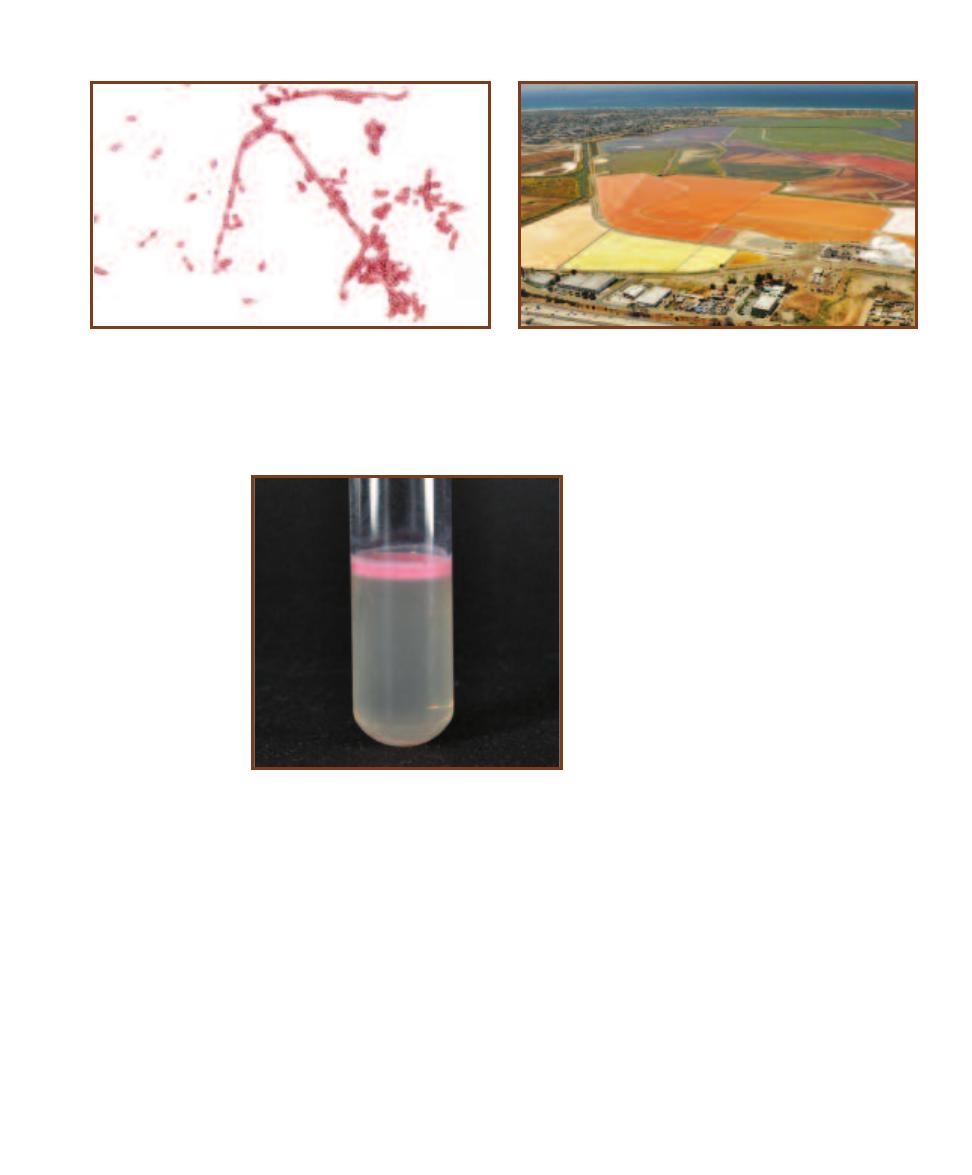
SECTION 13
䢇
Domain Archaea
䢇
167
13-3
H
ALOBACTERIUM
G
ROWN IN
C
ULTURE
Cells are pleomorphic
rods that vary in different media and temperatures. Note the gas vacuoles
in the cells.
13-4
A S
ALTERN IN
S
AN
D
IEGO
B
AY
Salterns are low pools of
saltwater used in the harvesting of salt. As water evaporates, the salt-
water becomes saltier and saltier, until only salt remains. This can then
be purified and sold. The colors in the pools are the result of differently
pigmented communities of halophilic microorganisms that are associated
with different salinities as the pools dry out.
13-5
H
ALOBACTERIUM
C
ULTURE
The pink layer at the top is where
Halobacterium is growing. Due to
their gas vacuoles, cells float to the
surface.

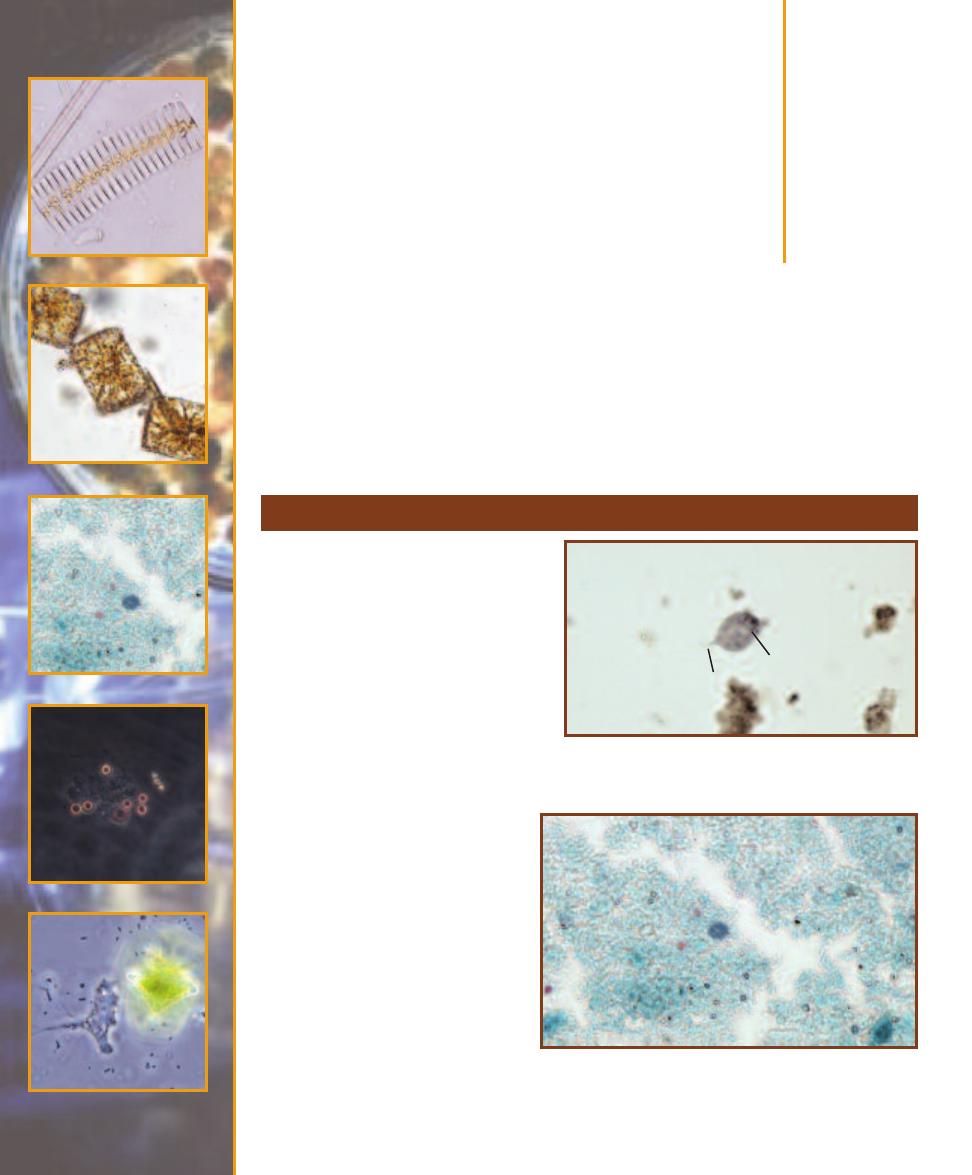
Domain Eukarya:
Simple Eukaryotes
Simple, microbial eukaryotes are found in five major groupings: Excavata, Chromalveolata,
Rhizaria, Archaeplastida, and Unikonta. Archaeplastida also includes true plants and Unikonta
includes animals. Plants and animals will not be covered, as they don’t fit within the traditional
boundaries of microbiology.
Group Excavata
14
S E C T I O N
169
This group obtains its name from the
presence in many members of a feeding
groove excavated from one side of the
cell. Among the major groups of Excavata
are parabasalids (Figure 14-1), diplomon-
ads (Figure 14-2), kinetoplastids (Figure
14-3), and euglenids (Figure 14-4).
䢇
One uniting feature of parabasalids
is the presence of a parabasal body
associated with the Golgi complex.
Parabasalids also possess hydrogeno-
somes, organelles that perhaps have
evolved multiple times, but some are
thought to be degenerated mito-
chondria. These organ elles earn
their name from their ability to
make ATP anaerobically with H
2
as a waste product. Other para -
basalid features include flagella, a
longitudinal aggregation of micro-
tubules called an axostyle, and an
undulating membrane. For more
information about Trichomonas
as a pathogen, see page 194.
䢇
Diplomonads are unicellular
flagellates with two, large nuclei
(visible in this specimen). At one
time diplomonads were thought
to lack mitochondria, but more
14-1
T
RICHOMONAS HOMINIS
,
A
P
ARABASALID
Note the
prominent posterior axostyle (A). A couple of flagella (F) are
faintly visible at the anterior of the cell.
14-2
T
HE
D
IPLOMONAD
G
IARDIA LAMBLIA
S
HOWN IN A
F
ECAL
S
MEAR
(T
RICHROME
S
TAIN
)
This is a Giardia cyst, as evidenced by
the three visible (there are actually four) nuclei. The trophozoite
stage has the two nuclei typical of diplomonads.
A
F
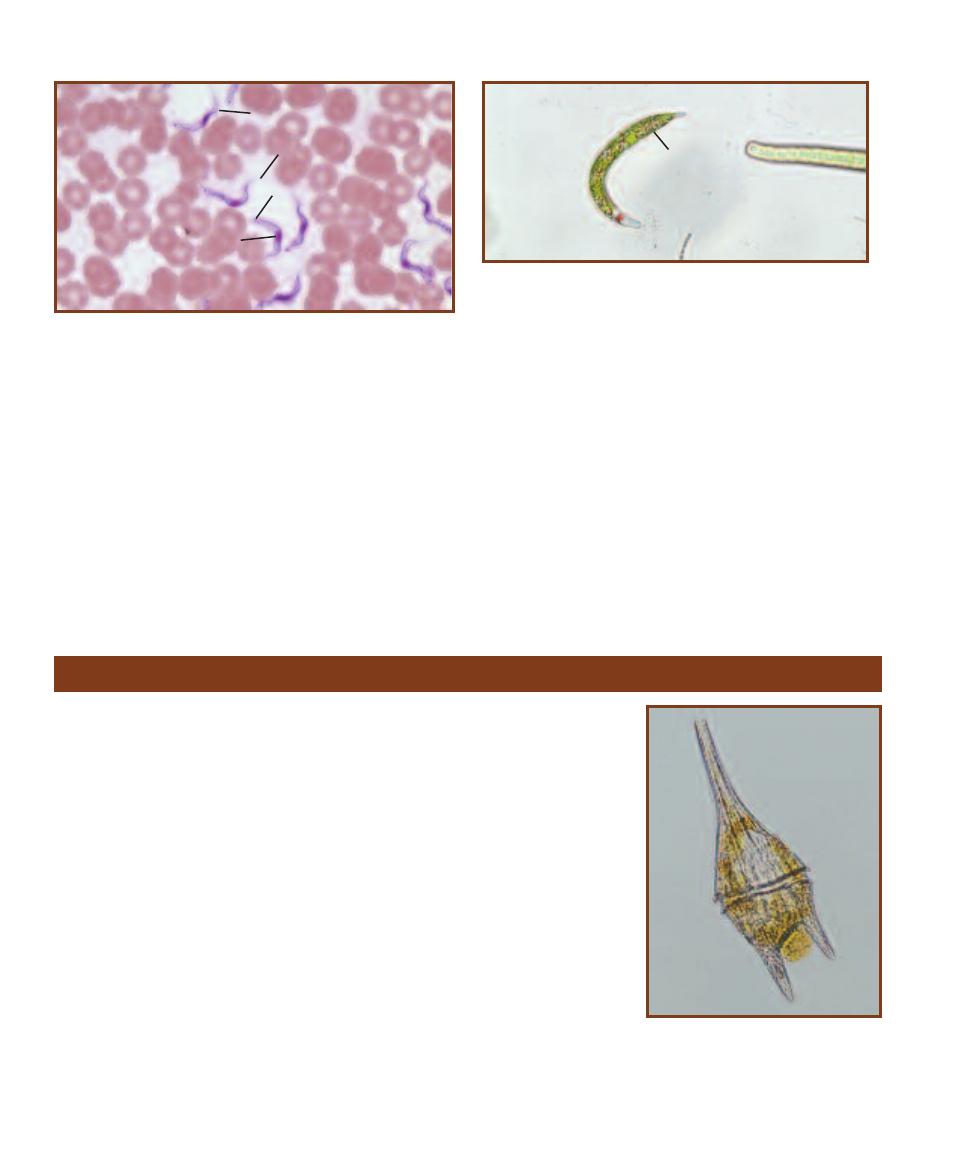
recent evidence shows they have degenerated into
mitosomes that lack the electron transport chain and
are thus nonfunctional in generating ATP for the cell.
Instead, diplomonads use cytoplasmic biochemical
pathways, such as glycolysis. For more information
on Giardia as a pathogen, see page 193.
䢇
The presence of a DNA mass within their single mito-
chondrion, called a kinetoplast, is a unifying feature of
kinetoplastids. As with euglenids, they have a distinctive
crystalline rod within their flagella. Many are free living,
but Trypanosoma is a parasite that causes sleeping sick-
ness in humans. For more information on Trypanosoma
as a pathogen, see pages 195 and 196.
䢇
Euglenids (Figure 14-4) are green, photosynthetic protists
when light is available, but they are capable of hetero -
trophy when light is not (making them mixo trophic).
One or two flagella are present and emerge from an
invagination of the anterior (forward) cytoplasmic
mem brane. Flagella possess a crystalline rod similar
to those of kinetoplastids. A red photo receptor called
an eyespot at the cell’s anterior is another distinctive
feature.
170
䢇
A Photographic Atlas for the Microbiology Laboratory
14-3
T
HE
K
INETOPLASTID
T
RYPANOSOMA IN A
B
LOOD
S
MEAR
Note the following features: nucleus (N), undulating membrane (U),
kinetoplast (
K), and flagellum (F).
14-4
E
UGLENA
Euglena is a large genus of mixotrophic flagellates.
Most species have chloroplasts (C), which are discoid in this specimen.
A red “eyespot” is located in the colorless anterior of the cell. The single
flagellum also emerges from the anterior.
Group Chromalveolata
The chromalveolates may or may not be a monophyletic group (that is, descended
from a single, common ancestor with chromalveolate traits); the jury is still out on
that question. However, there is evidence to suggest that early in their evolution they
underwent secondary endosymbiosis by engulfing a red alga. Many extant (living)
species of chromalveolates have functional plastids that clearly re semble red algae,
whereas others possess reduced plastids that also resemble red algae. Some have
no plastids, but have red algal plastid DNA in their genome. Still others show no
evidence of a red algal connection. A mystery is there for the solving if you choose
to engage it! The major groups of chromalveolates are the alveolates, stramenopiles
(Heterokontophyta), and haptophytes.
䢇
The alveolates possess cytoplasmic membranous sacs (alveoli) near the cytoplasmic
membrane. It has been speculated that the alveoli are somehow involved in main-
taining osmotic balance, but their function is not known for certain. There are
three main groups of alveolates: dinoflagellates, apicomplexans, and ciliates.
Dinoflagellates (Figure 14-5) are typically unicellular and autotrophic. Most
have two flagella: one protruding from the cell and the other positioned in a
groove encircling the cell. Most dinoflagellates are mixotrophic, though strictly
autotrophic and heterotrophic species are known.
Apicomplexans, such as Plasmodium (Figure 14-6), are animal parasites, but
retain a remnant of a plastid. Life cycles are complex, usually involving more than
one host. The name “apicomplexa” derives from a complex of organelles at the
14-5
T
HE
D
INOFLAGELLATE
C
ERATIUM
Ceratium is easily identified by the “horns”
protruding from the cell wall. Note the
groove at the cell’s center that encases
the circular flagellum. This specimen is a
marine species.
C
U
F
K
N
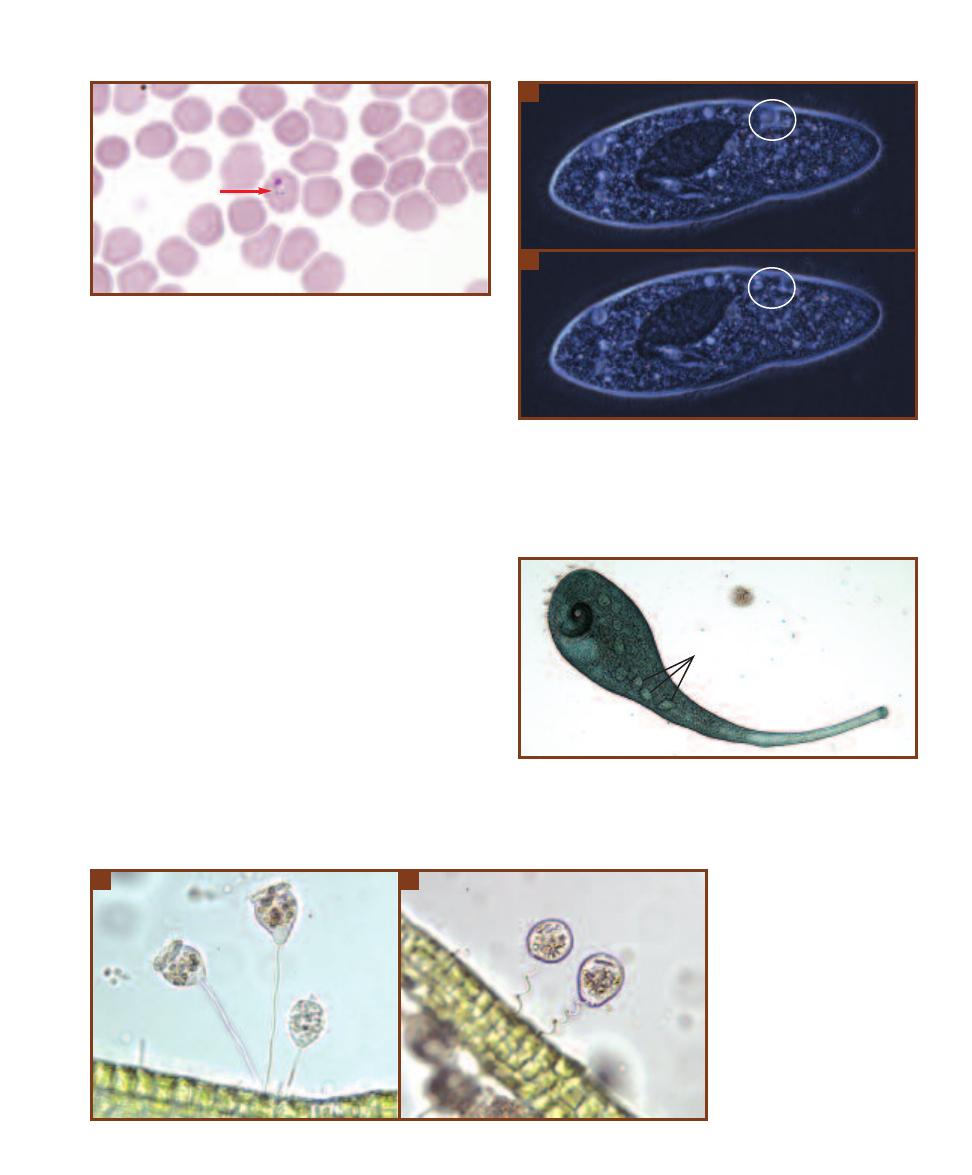
cell’s apex, which are used in penetrating host cells. For
more information about Plasmodium, see pages 197–199.
Ciliates are characterized by their possession of
numerous cilia over the cell’s entire surface or localized
in specific regions. They are heterotrophs and use the
cilia for feeding as well as locomotion. There are both
marine and freshwater species (Figures 14-7 through
14-9).
䢇
Stramenopiles (Heterokontophyta) are soil, marine, and
freshwater autotrophs and heterotrophs. They are char-
acterized by having a flagellum with “hairs” made of a
basal attachment, a hollow shaft, and glycoprotein fila -
ments split into three parts at the ends. A second smooth
flagellum is often present. There are four groups of
stramenopiles: oomycetes or water molds (Figures 14-10
and 14-11), which are colorless and heterotrophic, dia -
toms (Figures 14-12 through 14-19), the golden algae,
and the brown algae, all of which are photosynthetic.
These latter two groups are not covered here.
Many water molds (oomycetes) produce filaments
of multinucleate cells, a feature similar to fungi. But,
molecular evidence shows that they are not closely
SECTION 14
䢇
Domain Eukarya: Simple Eukaryotes
䢇
171
14-6
P
LASMODIUM
,
AN
A
PICOMPLEXAN
, S
HOWN IN A
B
LOOD
S
MEAR
A Plasmodium trophozoite (arrow) has infected this red blood
cell. Over the course of a Plasmodium infection, the parasite assumes
many forms. This is the ring stage. A second ring stage is visible in the
upper left of the field.
14-7
T
HE
C
ILIATE
P
ARAMECIUM
A
Notice in this phase contrast
micrograph the prominent cilia covering the entire cell surface and the
oral groove (which is barely visible at the bottom of the cell). Also notice
the round, light area indicated by the circle. This is a contractile vacuole
that constantly pumps water out of the cell to keep it from bursting.
B
Notice that the contractile vacuole has disappeared in this photomicro-
graph taken seconds after the one in
A
.
14-8
T
HE
C
ILIATE
S
TENTOR
Its trumpet shape, size (up to 2 mm),
and beaded macronucleus (M) make Stentor an easy ciliate to identify. It
is covered with cilia, some of which surround its “mouth” (the white
spot inside the dark coiled region at the left). This species is naturally
green; this is not a stained specimen.
14-9
T
HE
C
ILIATE
V
ORTICELLA
A
Vorticella is a genus of stalked,
inverted bell-shaped ciliates. A
crown of cilia surround the oral
groove and are involved in feeding.
B
Vorticella is capable of retraction
when the stalk coils. If you find a
Vorticella, spend some time watch-
ing it until it recoils. It’s worth the
wait (which shouldn’t be more
than a minute).
A
B
A
B
M
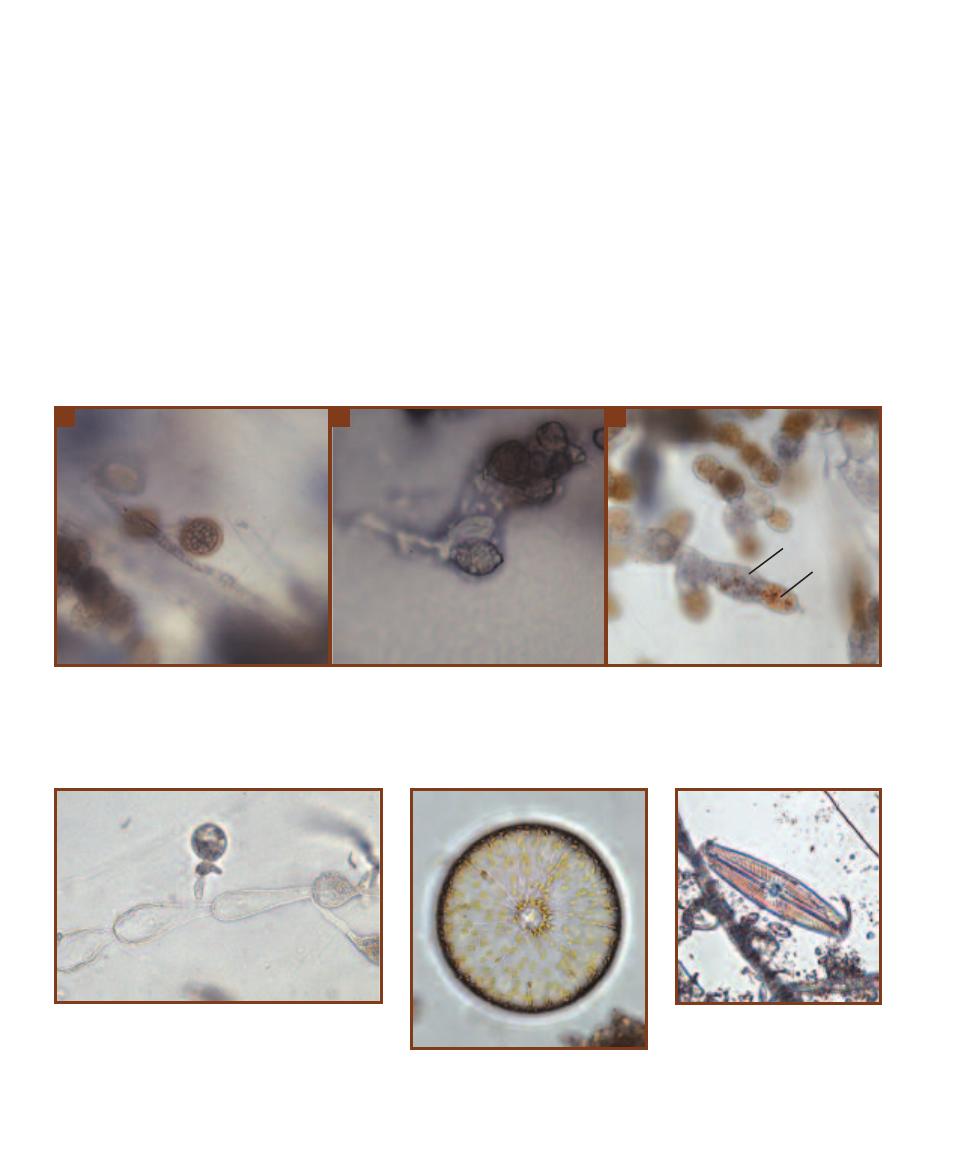
related to the fungi. They have lost their plastids and are
now primarily saprophytes (decomposers) or parasites.
The water mold Genera Allomyces and Saprolegna are
shown in Figures 14-10 and 14-11.
Diatoms, or bacillariophytes, are photosynthetic
unicellular eukaryotes (Figures 14-12 to 14-19). Notice
the distinctive golden brown color from the pigment
fucoxanthin located in the chromoplasts, which may be
of variable shape. Oil droplets are also frequently visible.
Cell shapes are either round (centric) or bilaterally sym-
metrical and elongated (pennate). The cell wall is made
of silica embedded in an organic matrix and consists of
two halves, with one half overlapping the other in the
same way the lid of a Petri dish overlaps its base. The
combination of both halves is called a frustule. (Often,
diatoms can be identified from the frustules of deceased
cells.) Some pennate diatoms are motile and have a
central, longitudinal line called a raphe.
䢇
Haptophytes are unicellular algae with two smooth
flagella. They are distinguished by the presence of a
haptonema extending from the cytoplasm between the
two flagella. It is composed of layers of membranes
surrounding seven microtubules, so is fundamentally
different in structure from flagella, which have the 9Ⳮ2
arrangement of microtubules within (9 pairs surround-
ing two single microtubules). The haptonema is a feeding
structure that gathers food particles and delivers them
to a food vacuole at the posterior of the cell. Many
haptophytes have calcified scales called coccoliths.
Figure 14-20 shows the haptophyte Coccolithophora.
172
䢇
A Photographic Atlas for the Microbiology Laboratory
14-10
A
LLOMYCES
,
A
R
EPRESENTATIVE
W
ATER
M
OLD
G
ROWN IN
C
ULTURE
Allomyces is a soil saprophyte (decomposer). It exhibits alternation
of generations, with a diploid filamentous phase (sporophyte) that produces meiospores by meiosis, which develop into a filamentous haploid phase
(gametophyte) that produces male and female gametes by mitosis. In addition, the sporophyte is also capable of producing diploid meiospores that
develop into another sporophyte.
A
Shown is a thick-walled meiosporangium.
B
This is a mitosporangium. The exit pore for the mitospores is at the
right.
C
Gametophyte branches with male and female gametangia. In Allomyces, male gametangia (么) are golden in color, whereas female gametangia
(乆) are colorless.
14-11
W
ET
M
OUNT OF
S
APROLEGNIA
Saprolegnia
is another water mold. A diploid filament is shown, with
the globular oogonium and the diploid, irregularly shaped
antheridium. When an antheridium contacts an oogonium,
meiosis occurs in both to produce eggs and haploid male
nuclei. The male nuclei migrate into the oogonium where
fertilization occurs. Saprolegna is a fish parasite.
14-12
A
RACHNOIDISCUS
,
A
C
ENTRIC
D
IATOM
Note the radial symmetry, the
golden chromoplasts, and the minute pores
in the frustule. This is a marine species.
A
B
C
14-13
N
AVICULA
,
A
P
ENNATE
D
IATOM
All of the many species of
Navicula are shaped like a cigar or a
boat. Cells are identifiable by promi-
nent transverse lines converging on
the central open space. A longitudinal
line is also present.
乆
么
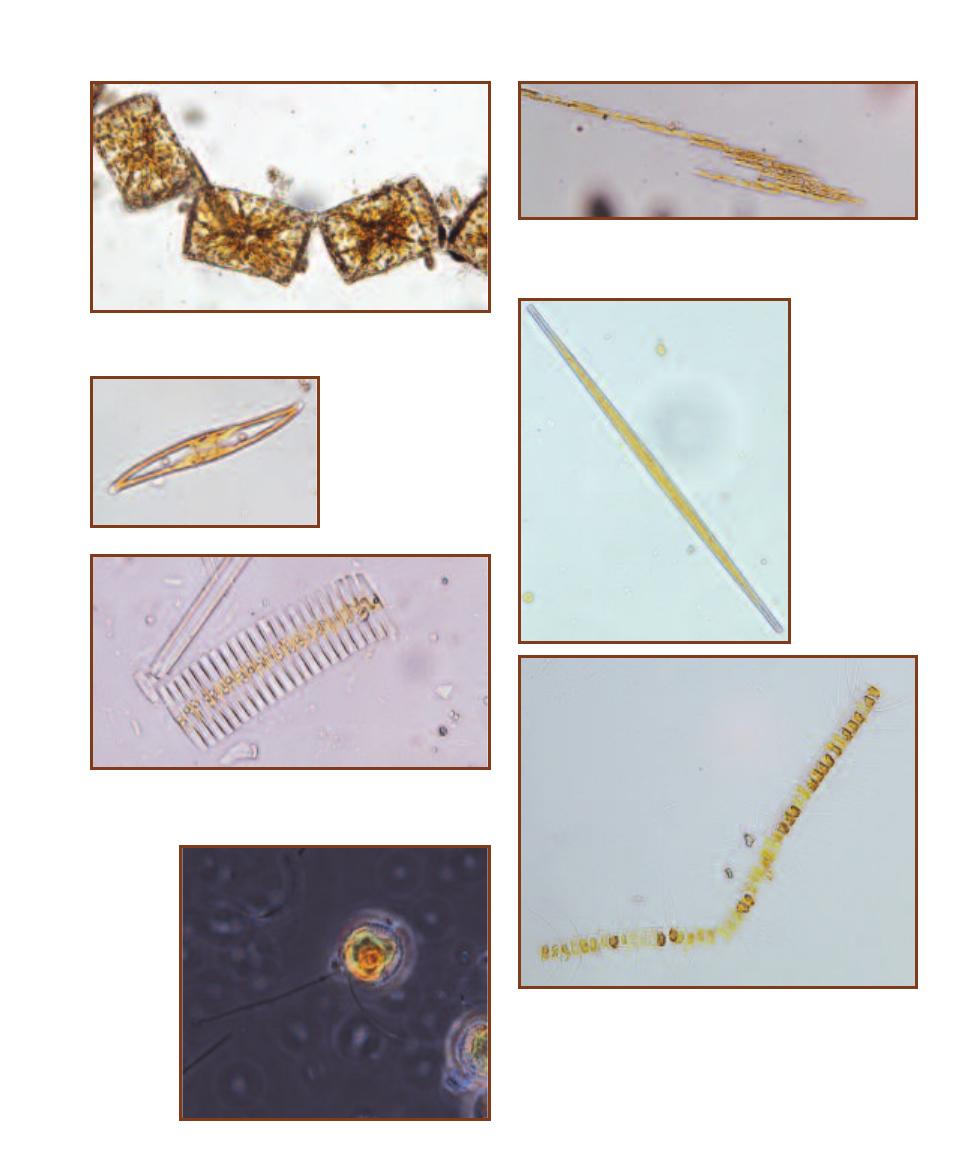
SECTION 14
䢇
Domain Eukarya: Simple Eukaryotes
䢇
173
14-14
T
ABELLARIA
This distinctive diatom forms zigzag colonies.
Note the golden brown chloroplasts.
14-15
B
ACILLARIA
Members of this genus glide with individual
cells sliding over one another. In this colony, the top cells are in the
process of gliding to the right over the lower cells.
14-16
G
YROSIGMA
All
species of this genus have
sigmoid shaped cells. Note
the golden brown chloro-
plasts at the edge and two
prominent oil droplets.
14-17
S
YNEDRA
These diatoms are
distinctive because
of their long, needle-
shaped cells. They
occur singly or
sometimes in groups
of cells attached at
their ends, radiating
outward like spokes
of a wheel.
14-18
F
RAGILLARIA
These rectangular cells form ribbons with
cells attached side-by-side. Note the golden brown chloroplast and oil
droplets.
14-19
C
HAETOCEROS
This large, marine genus of beautiful diatoms
is cosmopolitan in distribution.
14-20
A H
APTOPHYTE
(C
OCCOLITHOPHORA
) G
ROWN
IN
C
ULTURE
Note the two discoid golden chloroplasts, the
two smooth flagella, and the scales on the cell’s surface.
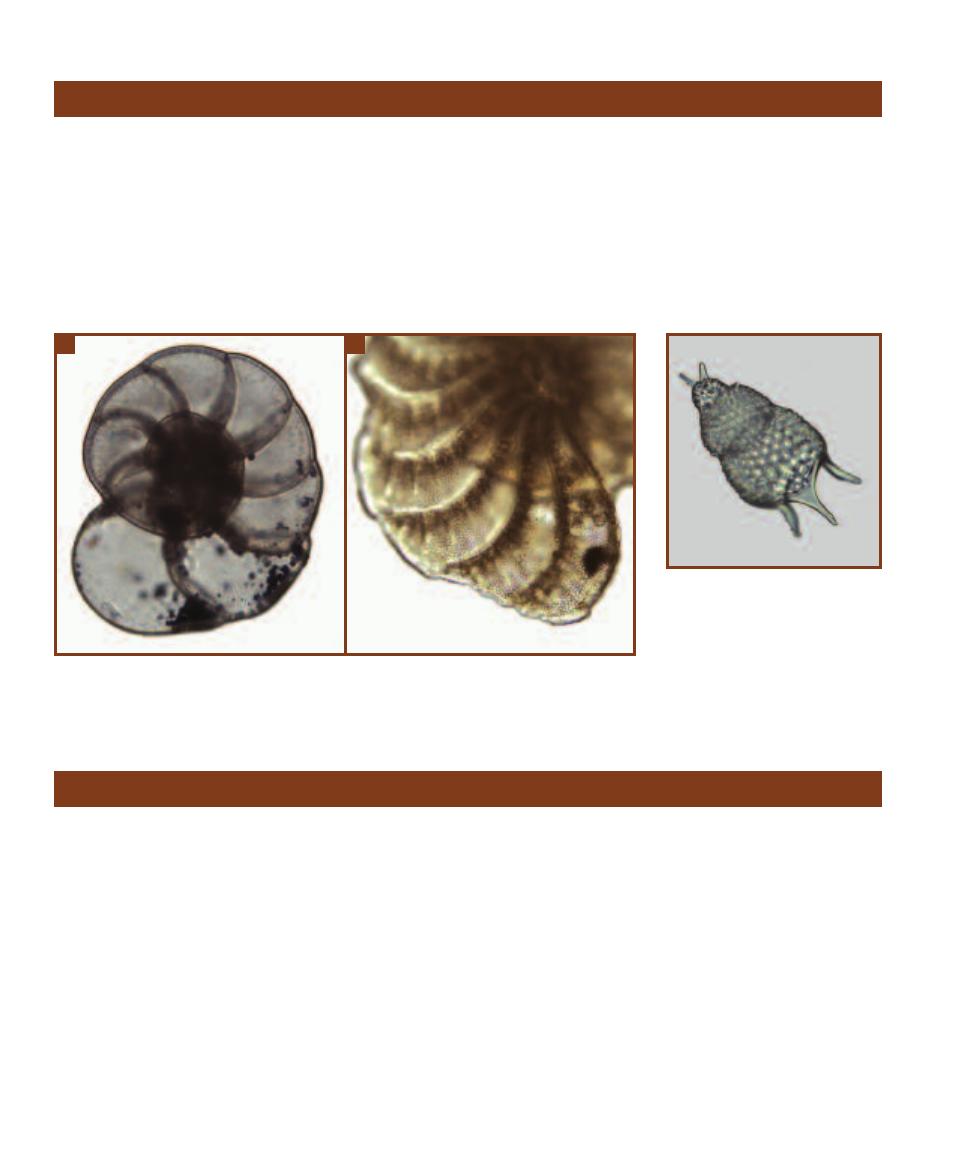
Rhizarians are amoeboid unicells. Unlike the amoebas
described below, whose pseudopods (cellular extensions
used in moving and feeding) are blunt or lobate, rhizarians
have long, thin pseudopods (“false feet”). Most rhizarians
are covered with an inorganic shell called a test. There are
two main rhizarian groups: foraminferans (Figure 14-21)
and radiolarians (Figure 14-22).
䢇
Foraminiferans have threadlike pseudopods
extending from their multichambered, calcium
carbonate test. All foraminifera are marine and mostly
occur in coastal waters. Though heterotrophy is the
rule, some forams host endosymbiotic algae and are
thus able to live autotrophically.
䢇
Radiolarians are marine heterotrophs with silica cell
walls. Their tests are radially symmetrical with spines.
174
䢇
A Photographic Atlas for the Microbiology Laboratory
Group Rhizaria
14-21
A F
ORAMINIFERAN
T
EST
Shown is a test from one species of the common genus Elphidium.
A
The entire Elphidium test.
B
A detail of the same test showing pores through which pseudopodia extend
in life.
14-22
A R
ADIOLARIAN
T
EST
This is the radially symmetrical test of
an unidentified radiolarian. Radiolarian
cell walls are made of silica.
Group Archaeplastida
There is strong evidence that the Archaeplastida are
descended from an ancestral protist that engulfed a
cyanobacterial endosymbiont, which eventually evolved
into the chloroplasts of red algae (Rhodophyta), green
algae (Chlorophyta), and land plants.
䢇
Red algae are mostly marine and have complex life
cycles. They possess the photosynthetic pigments
chlorophylls a and d, as well as the accessory pigment
phycoerythrin. All red algae lack flagella. Most rhodo -
phytes are macroalgae and are not in the domain of
microbiology, but Porphyridium (Figure 14-23) is
among the few exceptions.
䢇
Green algae (Chlorophyta) grow as single cells, colonies,
and branched or unbranched filaments (Figures 14-24
to 14-31). All possess chlorophyll a and b in chloroplasts
of various shapes, which are responsible for their green
color. Many also exhibit pyrenoids in the chloroplasts
where photosynthetic products are stored. If present,
flagella are paired and of equal length. Cell walls typi-
cally are made of cellulose. The majority of chlorophytes
live in freshwater, but there are marine and terrestrial
species as well.
䢇
Charophyceans (Figures 14-32 to 14-34) comprise a
second, diverse group of Chlorophyta. Their distinc-
tions are complex and often not visible to the casual
light microscopist. Because of shared characters in fla-
gellar structure, cellulose synthesis, mitosis, and certain
enzymes, it is thought charophyceans and green plants
are derived from a common ancestor.
A
B
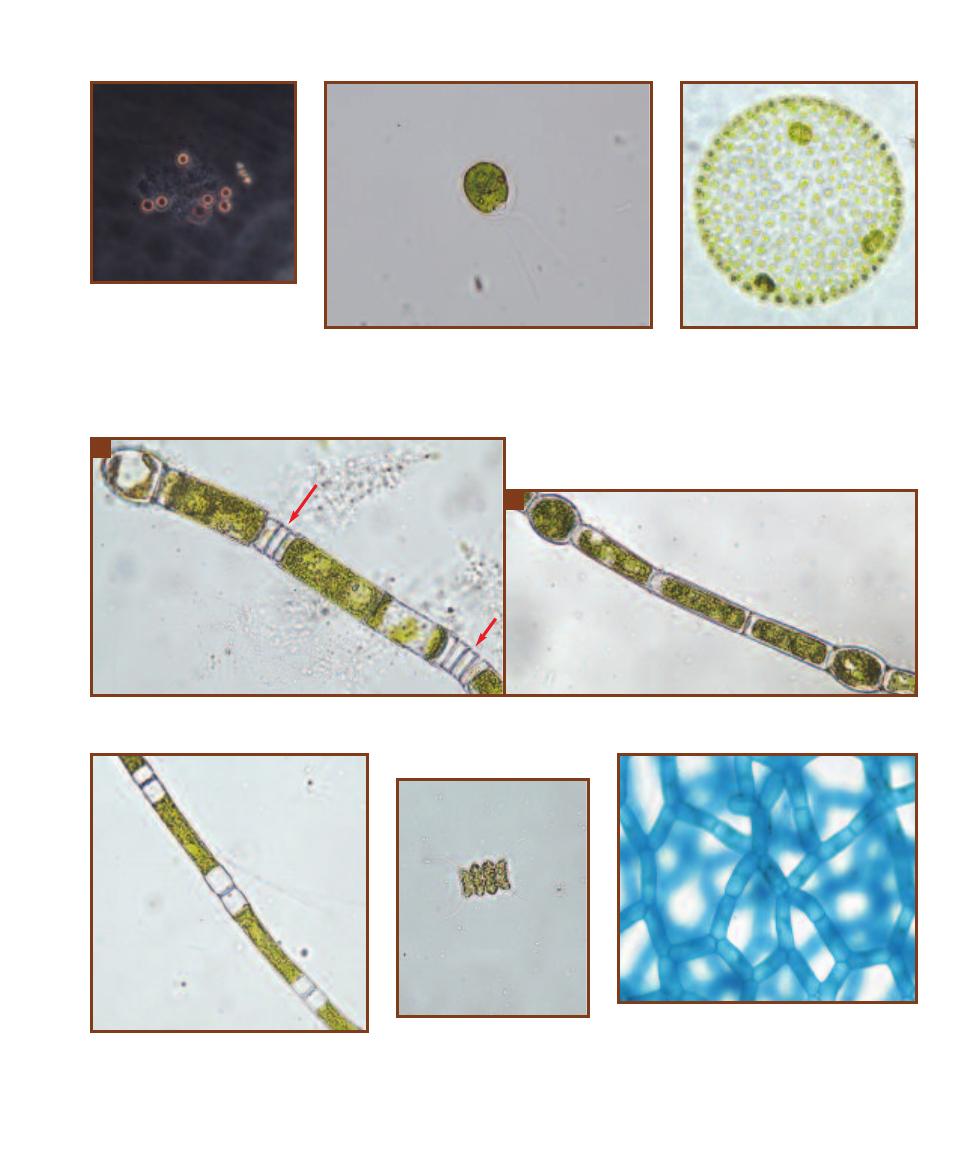
SECTION 14
䢇
Domain Eukarya: Simple Eukaryotes
䢇
175
14-23
P
ORPHYRIDIUM
(P
HASE
C
ONTRAST
, W
ET
M
OUNT
)
Cells of
the unicellular red alga Porphyridium
measure approximately 5 µm in
diameter. They are motile and exhibit
positive
phototaxis by secreting
mucilage behind themselves that
propels them toward the light.
14-24
C
HLAMYDOMONAS
This unicellular green alga
has two flagella and a single, cup-shaped chloroplast. A
red-orange stigma is found within the chloroplast and is
involved in phototaxis. Cells are approximately 30 µm long
and 20 µm wide.
14-25
V
OLVOX
This is a colonial
green alga made of cells similar in shape to
Chlamydomonas. Daughter colonies form
asexually from special cells in the parent
colony. Release of each daughter colony
involves its eversion as it exits through
an enzymatically-produced pore. Mature
colonies can reach a size visible to the
naked eye.
14-26
O
EDOGONIUM
A
Oedogonium is a large chlorophyte genus composed of unbranched filaments. Division of cells within the filament results
in its elongation and produces distinctive division scars (arrows).
B
The cylindrical cells of this filament are interrupted by two oogonia (eggs).
14-27
U
LOTHRIX
Ulothrix is another un-
branched, filamentous chlorophyte. Its chloro-
plasts are found near the cell wall and form either
a complete or incomplete ring around the cyto-
plasm. Prominent pyrenoids are usually present.
14-28
S
CENEDESMUS
This
common chlorophyte consists of 4
or 8 cells joined along their edges.
Cells range from 30–40 µm across.
14-29
H
YDRODICTYON
The cells of this green
alga form open connections with 4 (sometimes more)
of its neighbors to produce a complex network of
multinucleate cells. This explains its common name:
the “water net.” Cells may reach 1cm in length and
each contains a single chloroplast with numerous
pyrenoids. This specimen is from a culture.
A
B
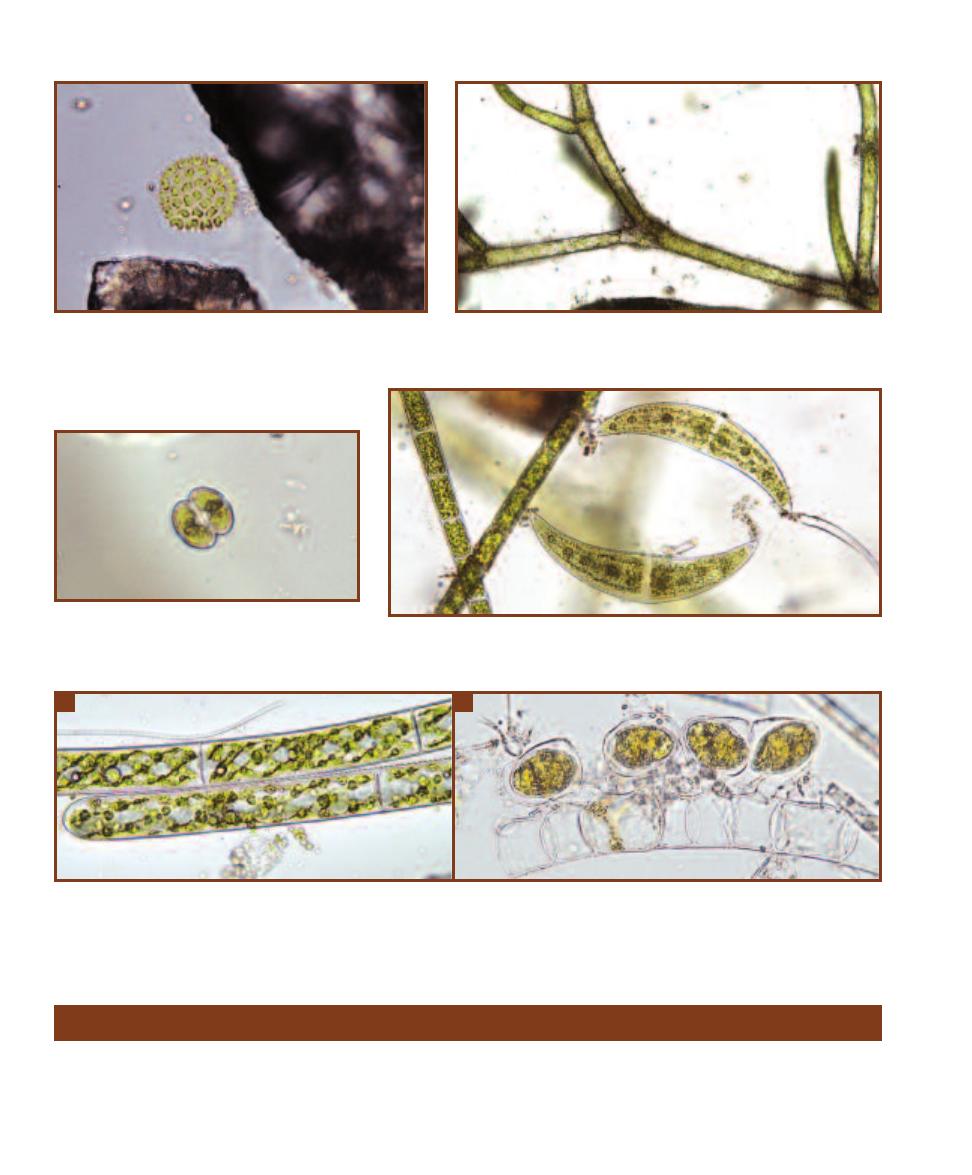
Unikonta, comprising amoebozoans, fungi, and animals, is
the last major eukaryotic group. Lichens are also covered in
this section because of their relationship with fungi.
Amoebozoans
Amoebozoans are characterized by producing lobe-shaped
pseudopodia (as compared to the thread-like pseudopodia
176
䢇
A Photographic Atlas for the Microbiology Laboratory
14-30
P
EDIASTRUM
The colonies of Pediastrum are angular
and star-like, and the surface cells often contain bristles that are
thought to be used for buoyancy. The cell number and arrangement
are constant for each species. Each cell has the potential
to produce a colony of the same number and arrange-
ment of cells as the parent colony!
14-31
C
LADOPHORA
Cladophora is a branched chlorophyte with elon-
gated cells. The single chloroplast has numerous pyrenoids and may look
like a network of unconnected pieces.
14-32
C
OSMARIUM
Cosmarium is a desmid,
which are characterized by paired “semicells.” In this
species of Cosmarium (one of over 1000!) two chloro-
plasts—one at each end—are present in each cell.
14-33
C
LOSTERIUM
Seen here are two Closterium individuals. Closterium is another
desmid composed of two cells, but lacks the distinct constriction typical of most desmids.
Vacuoles are present at the outer ends of the cells.
14-34
S
PIROGYRA
A
Spirogyra is a well-known filamentous charophyte because of its distinctive spiral chloroplast. Note the numerous pyrenoids.
The nucleus is located in the center of the cell and is obscured by the chloroplast.
B
Sexual reproduction occurs as two parallel filaments form conju-
gation tubes, through which one cell (a gamete) moves to join a cell (gamete) of the other filament, resulting in a zygote. This type of conjugation has
happened in four cells in this micrograph. Each zygote undergoes meiosis and each resulting cell is capable of developing into a new filament.
Group Unikonta
A
B
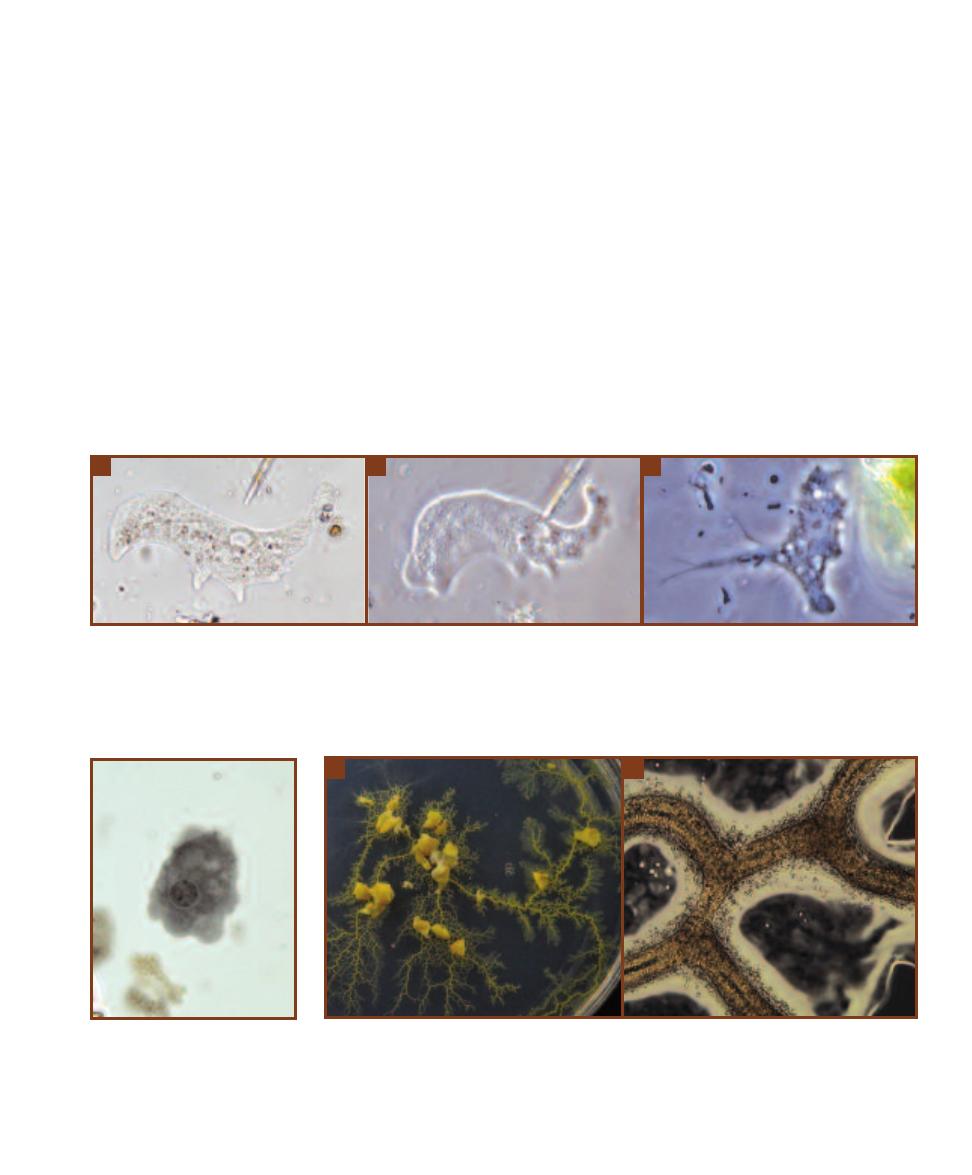
SECTION 14
䢇
Domain Eukarya: Simple Eukaryotes
䢇
177
14-35
A
MOEBA
Cells with flowing cytoplasm and a constantly changing shape are likely to be amoebas. They move and capture prey by
extending pseudopods outward.
A
This bright field micrograph clearly illustrates the difference between the cytoplasm at the periphery of the cell
(ectoplasm) with that in the interior (endoplasm). The nucleus is visible as are numerous food vacuoles (the golden spots—probably an indication of
this individual’s food preferences!)
B
This is the same amoeba viewed with phase contrast only one or two seconds after the previous micrograph
(notice that the shape is basically the same and the diatom at the top has moved only a short distance). Phase contrast produces a different texture to
the image. Compare the ectoplasm, endoplasm, and nucleus with the bright field image.
C
This is a totally different amoeba, interesting for its ornate
pseudopods.
14-36
E
NTAMOEBA IN A
F
ECAL
S
MEAR
(I
RON
H
EMATOXYLIN
S
TAIN
)
Note the lobed pseudopods and the
condensed chromatin in the center
(the karyosome) and the periphery of
the nucleus.
14-37
P
HYSARIUM
,
A
P
LASMODIAL
S
LIME
M
OLD
A
Shown is a Physarium plasmodium growing on a
water agar plate. The nutrients are supplied by oat flakes (the lumps in the photo) and the plasmodium has
spread over the agar surface “in search” of more food. Physarium is a typical plasmodial slime mold in that
it is brightly colored.
B
This is the same plasmodium viewed under low power. When the photograph was
snapped, the central portion of each plasmodial strand was streaming to the left (meaning back toward the
older portions).
A
B
C
of foraminiferans and radiolarians). Pseudopods perform
the dual function of feeding and locomotion. Amoebozoans
include gymnamoebas, entamoebas, and slime molds.
Gymnamoebas include the “classical” amoebas (Figure
14-35). Most are predatory heterotrophs, and there are
marine, freshwater, and soil representatives. The cytoplasm
is differentiated into a central portion (endoplasm) and the
portion just beneath the cytoplasmic membrane (ectoplasm).
Microfilaments in the ectoplasm produce cytoplasmic
streaming, which is responsible for pseudopod formation.
Entamoebas are parasitic heterotrophs (Figure 14-36).
They live in the guts of vertebrates and invertebrates. Impor-
tant identification features are the presence and location of
condensed peripheral and central chromatin. The latter is
called the karyosome. For more information on Entamoeba
as a pathogen, see pages 200–201.
Slime molds are divided into cellular slime molds and
plasmodial slime molds. At some point in the life cycle, all
slime molds produce sporangia that liberate reproductive
spores. This feature at one time was thought to indicate
relationship with fungi, but this has not been borne out by
molecular evidence. The vegetative stage of a plasmodial
slime mold is usually a brightly colored plasmodium (Figure
14-37) that engages in feeding by phagocytosis as the pseudo -
podia push their way through soil and decaying organic
material. The unique feature of the plasmodium is that it is
a single, giant cell easily visible to the naked eye (reaching
sizes of several centimeters). Within the plasmodium are
multiple diploid nuclei. Nutrients and oxygen are distributed
by cytoplasmic streaming. When nutrients become limiting
or the plasmodium begins to dry out, haploid spores are
produced. When conditions become favorable again, spores
germinate to produce flagellated swarm cells or amoeboid
cells which act as gametes in fertilization to reestablish the
diploid state. The zygote then undergoes mitosis without
cytokinesis to produce a new plasmodium.
A
B
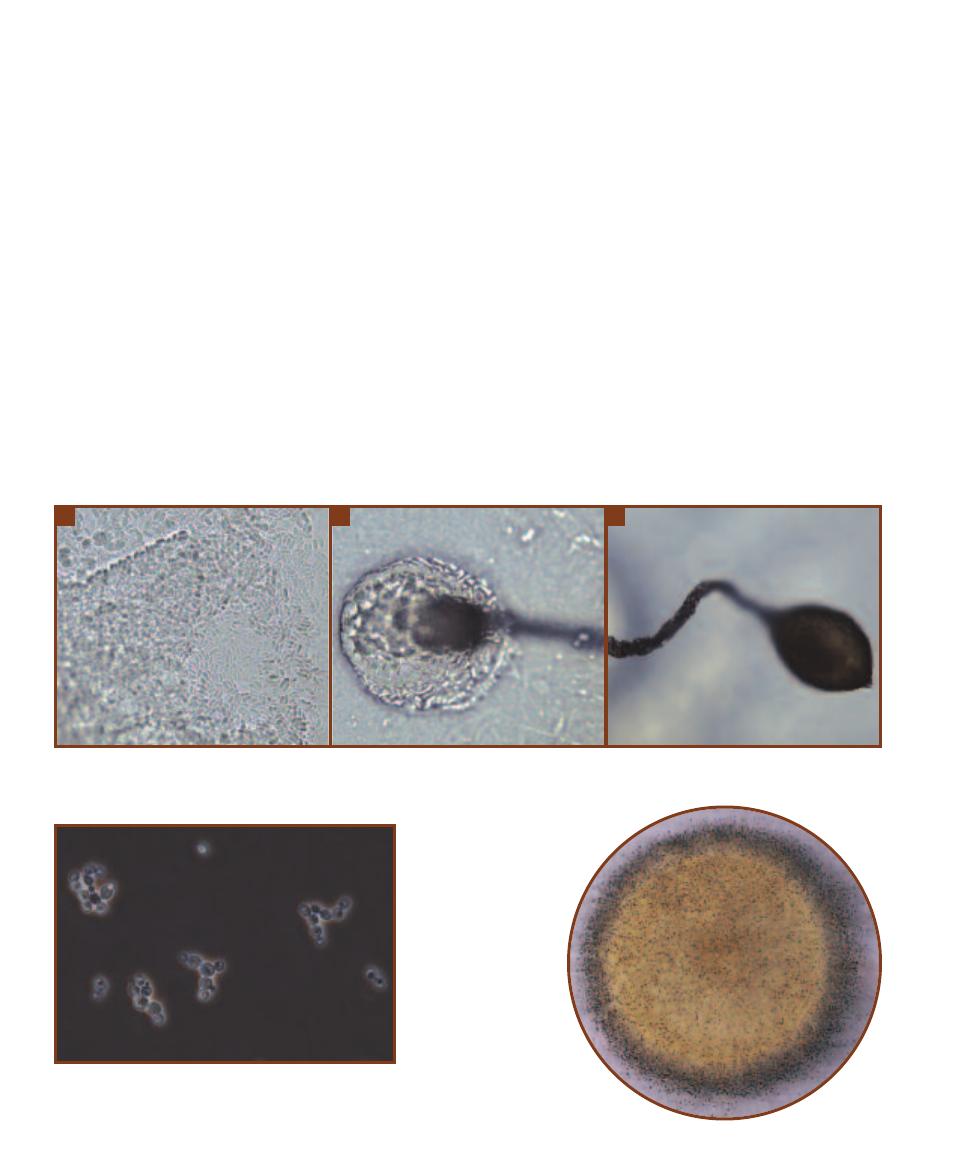
Cellular slime molds (Figure 14-38) exist as haploid,
single-celled feeding amoebas. When food becomes limiting,
the individual amoebas begin to aggregate and form a motile,
multicellular slug. When migration is complete, the slug
becomes vertically oriented to form a stalked fruiting body.
Cells of the stalk produce cellulose to support the head,
which is formed by cells from the rear of the slug that migrate
upward. Head cells differentiate into asexual spores that
will germinate into amoebas once conditions are favorable
again. A sexual cycle occurs when two amoebas fuse to
make a diploid zygote, which then begins to consume other
amoebas and then encysts within a cellulose wall. Prior to
germination, the diploid nucleus undergoes meiosis to pro-
duce haploid nuclei, which are distributed to new amoebas
that enter the asexual cycle.
Fungi
Fungi are nonmotile eukaryotes. Their cell wall is usually
made of the polysaccharide chitin, not cellulose as in plants.
Unlike animals (that ingest then digest their food), fungi are
absorptive heterotrophs. That is, they secrete exoenzymes
into the environment, then absorb the digested nutrients.
Most are saprophytes that decompose dead organic matter,
but some are parasites of plants, animals, or humans
(Section 15).
Fungi are informally divided into unicellular yeasts
(Figure 14-39) and filamentous molds (Figure 14-40) based
on their overall appearance. Dimorphic fungi have both
mold and yeast life cycle stages. Filamentous fungi that pro-
duce fleshy reproductive structures—mushrooms, puffballs,
and shelf fungi—are referred to as macrofungi (Figure 14-41),
even though the majority of the fungus is filamentous and
hidden underground or within decaying matter.
Individual fungal filaments are called hyphae; collectively
they form a mycelium. The hyphae are darkly pigmented in
dematiaceous fungi and unpigmented in hyaline or monili -
aceous fungi (Figure 14-42). Hyphae may be septate, in
which there are walls separating adjacent cells, or nonseptate
if walls are absent (Figure 14-43).
Fungal life cycles are usually complex, involving both
sexual and asexual forms of reproduction. Gametes are
178
䢇
A Photographic Atlas for the Microbiology Laboratory
14-38
D
ICTYOSTELIUM
,
A
C
ELLULAR
S
LIME
M
OLD
A
Shown is a portion of an aggregating Dictyostelium slug. Notice the regular shape of the
cells, which is very unlike the irregular shapes of the amoebas when acting as individuals. The blurry part in the lower left is the base of a growing
stalk.
B
This is the head of an immature fruiting body.
C
A mature fruiting body of Dictyostelium.
14-39
Y
EAST
This is a wet mount of the brewer’s yeast,
Saccharomyces cerevisiae, viewed with a phase contrast micro-
scope. Notice the small buds forming on some cells.
14-40
M
OLD
Molds grow as fuzzy
colonies. Their spores are
abundant in the environment
and frequently show up as
contaminants on agar plates.
B
A
C
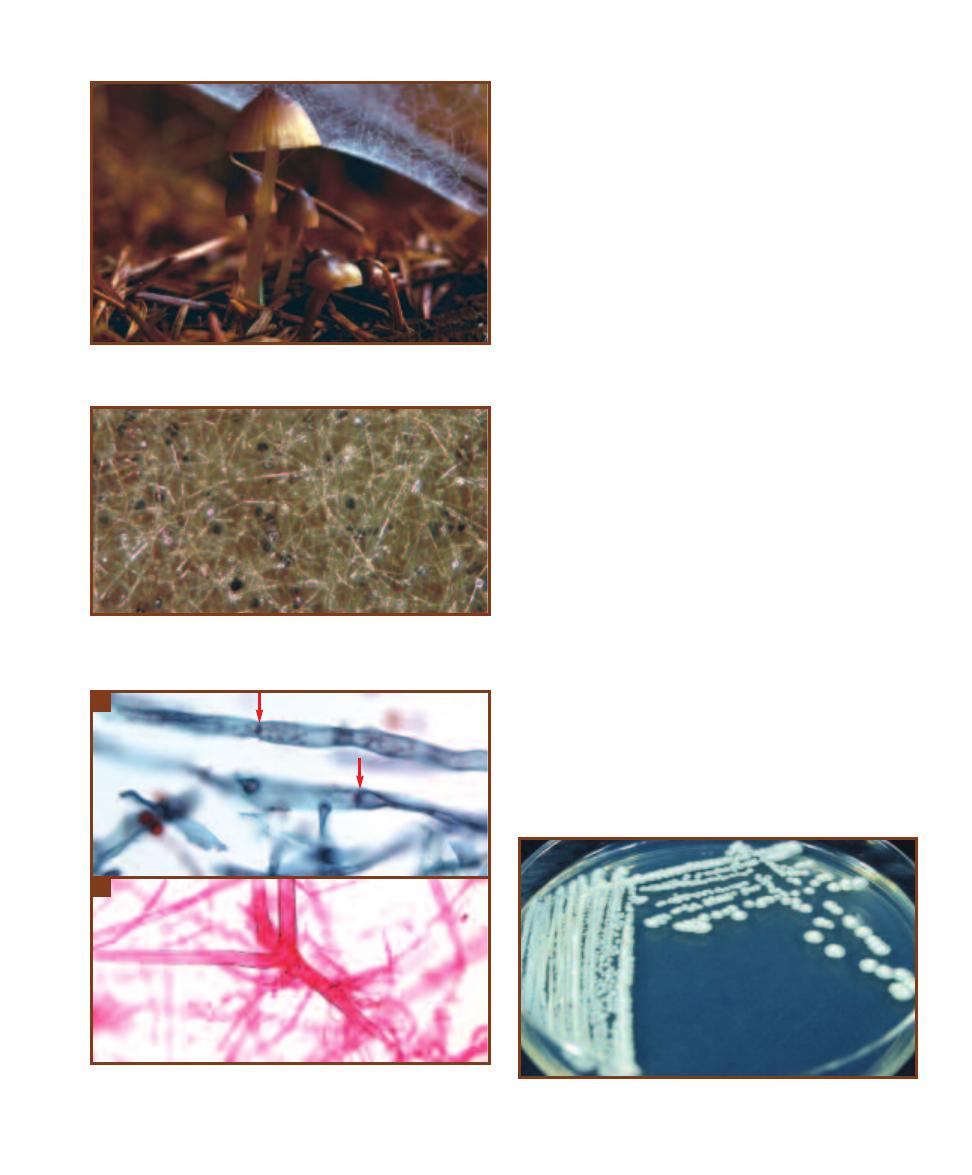
produced by gametangia and spores are produced by a
variety of sporangia. Typically, the only diploid cell in the
fungal life cycle is the zygote, which undergoes meiosis to
produce haploid spores characteristic of the fungal group
(see the following paragraph). Various asexual spores may
also be produced during the life cycle of many fungi. If they
form at the ends of hyphae, they are called conidia. Other
asexual spores are blastospores, which are produced by
budding, and arthrospores, which are produced when a
hypha breaks. Chlamydospores (chlamydoconidia) are
formed at the end of some hyphae and are a resting stage.
Formal taxonomic categories are based primarily on the
pattern of sexual spore production and presence of cross
walls in the hyphae. Members of the Class Zygomycetes are
terrestrial, have nonseptate hyphae, and produce nonmotile
sporangiospores and zygospores. Members of the Class
Ascomycetes produce a sac (an ascus) in which the zygote
undergoes meiosis to produce haploid ascospores. Asco -
mycete hyphae are septate. Members of the Class Basidio -
mycetes have septate hyphae and produce a basidium during
sexual reproduction that undergoes meiosis to produce four
basidiospores attached to its surface.
Saccharomyces cerevisiae is an ascomycete used in pro-
duction of bread, wine, and beer, but is not an important
human pathogen. It does not form a mycelium, but rather
produces a colony similar to bacteria (Figure 14-44). The
vegetative cells (blastoconidia) are generally oval to round in
shape and asexual reproduction occurs by budding (Figure
14-45). Short pseudohyphae are sometimes produced when
the budding cells fail to separate. Meiosis produces one to
four ascospores within the vegetative cell, which acts as the
ascus (Figure 14-46). Ascospores may fuse to form another
generation of diploid vegetative cells or they may be released
to produce a population of haploid cells that are indistin-
guishable from diploid cells. Haploid cells of opposite mating
types may also combine to create a diploid cell.
Microscopic examination, and biochemical and anti -
biotic sensitivity tests are used in identification. Asci stain
SECTION 14
䢇
Domain Eukarya: Simple Eukaryotes
䢇
179
14-41
M
ACROFUNGUS
This mushroom is the fruiting body from a
mycelium that is busily engaged in decomposing the redwood log below.
14-42
H
YALINE
H
YPHAE
This tangled mass of hyphae belongs to
the bread mold, Rhizopus. They are hyaline because they lack pigment.
The black spots are sporangia.
14-43
S
EPTATE AND
N
ONSEPTATE
H
YPHAE
A
The hyphae of Asper -
gillus are septate. Note the crosswalls (arrows) dividing cells.
B
Rhizopus
provides an example of nonseptate hyphae.
A
B
14-44
S
ACCHAROMYCES CEREVISIAE
C
OLONIES
Note the appearance
is similar to a typical bacterial colony, not fuzzy like mold colonies.
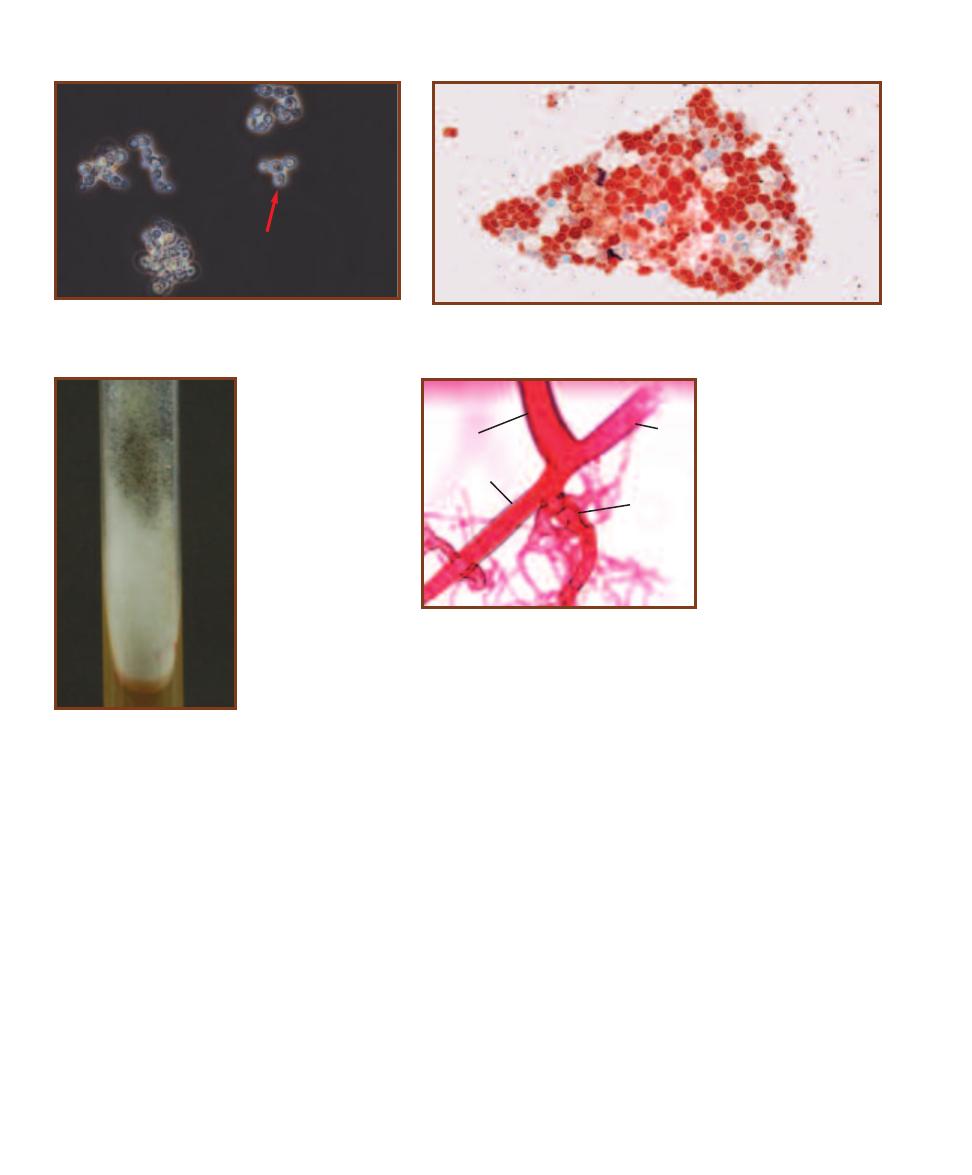
Gram-negative whereas the vegetative cells are Gram-
positive. The asci and ascospores stain pink in a Kinyoun
acid-fast stain, whereas the vegetative cells stain blue.
Rhizopus species are fast growing zygomycetes that
produce white or grayish cottony growth. The mycelium be-
comes darker with age as sporangia are produced, giving
it a “salt and pepper” appearance (Figure 14-47). Micro-
scopically, Rhizopus species produce broad (10 µm), hyaline,
and usually nonseptate surface and aerial hyphae. Anchor-
ing rhizoids (Figure 14-48) are produced where the surface
hyphae (stolons) join the bases of the long, unbranched
sporangiophores.
The Rhizopus life cycle (Figure 14-49) includes sexual
and asexual phases. Asexual sporangiospores are produced
by large, circular sporangia (Figures 14-50 and 14-51) borne
at the ends of long, nonseptate, elevated sporangiophores.
A hemispherical columella supports the sporangium. The
spores develop into hyphae identical to those that produced
them. On occasion, sexual reproduction occurs when hyphae
of different mating types (designated
⫹ and ⫺ strains) make
contact. Initially, progametangia (Figure 14-52) extend from
each hypha. Upon contact, a septum separates the end of
each progametangium into a gamete (Figure 14-53). The
walls between the two gametangia dissolve and a thick-walled
zygospore develops (Figures 14-54 and 14-55). Fusion of
nuclei occurs within the zygospore and produces one or
more diploid nuclei, or zygotes. After a dormant period,
meiosis of the zygotes occurs. The zygospore then germinates
and produces a sporangium similar to asexual sporangia.
Haploid spores are released and develop into new hyphae,
completing the life cycle.
Rhizopus species are common contaminants. R. stolonifer
is the common bread mold. R. oryzae and R. arrhizus are
responsible for producing zygomycosis, a condition found
most frequently in diabetics and immunocompromised
patients. Inhalation of spores may lead to hypersensitivity
reactions in the respiratory system. Entry into the blood
leads to rapid spreading of the organism, occlusion of blood
vessels, and necrosis of tissues.
Pilolobus is another genus of zygomycetes, with the un-
usual ability to aim and shoot its sporangia (Figure 14-56),
which form at the tips of sporangiophores. The subsporan-
gial vesicle acts as a lens and orients itself so that the sporan -
gium is aimed at a light source. Using a burst of water from
the subsporangial vesicle, spores are released a meter or
180
䢇
A Photographic Atlas for the Microbiology Laboratory
14-45
W
ET
M
OUNT OF
S
ACCHAROMYCES CEREVISIAE
V
EGETATIVE
C
ELLS
(C
RYSTAL
V
IOLET
S
TAIN
)
Note the bud-
ding cell (blastoconidium) in the center of field (
arrow).
14-46
S
ACCHAROMYCES CEREVISIAE
A
SCOSPORES
One to four ascospores
are produced in the original cell (acting as an ascus) by meiosis. In this speci-
men, the vegetative cells are blue and the asco spores are red.
14-48
R
HIZOPUS
R
HIZOIDS
Anchoring root-like rhizoids (R)
form at the junction of each
sporangiophore (SP) and the
stolon (ST). Note the absence
of septa.
SP
ST
ST
14-47
R
HIZOPUS
STOLONIFER
Black asexual
sporangia of this bread
mold have begun to form,
giving the growth a “salt
and pepper” appearance.
R
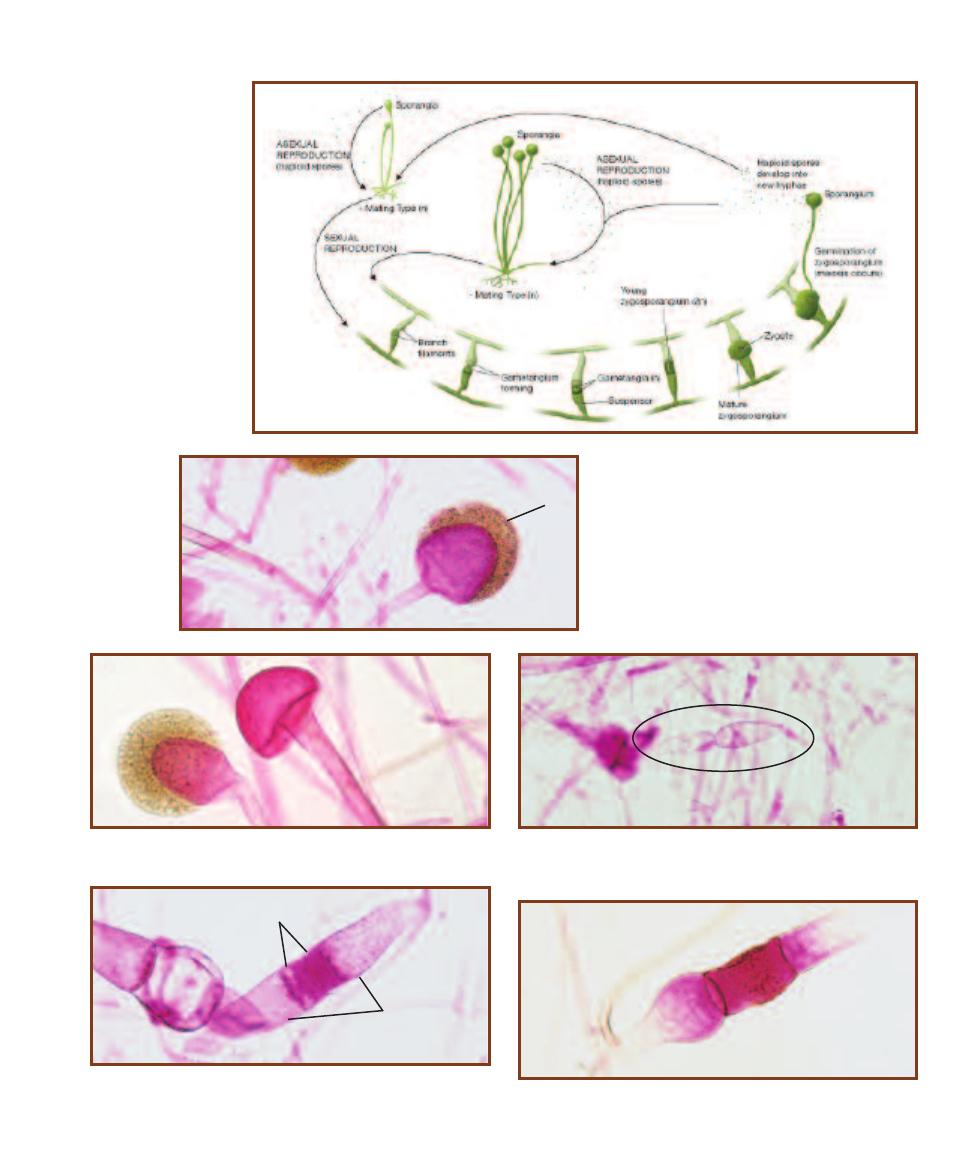
SECTION 14
䢇
Domain Eukarya: Simple Eukaryotes
䢇
181
14-50
R
HIZOPUS
S
PORANGIOPHORES
The sporan gium is found at the end of a long,
unbranched, and nonseptate sporangio phore.
The haploid asexual sporangio spores (S)
cover the surface of the columella (C), which
has a flattened base.
S
14-51
R
HIZOPUS
C
OLUMELLA
Note the umbrella-shaped columella
that remains after the sporangium has released its spores.
14-52
R
HIZOPUS
P
ROGAMETANGIA
Progametangia from different
hyphae are shown in the center of the field. Contact between the pro -
gametangia results in each forming a gamete.
14-53
R
HIZOPUS
G
AMETANGIA AND
S
USPENSORS
Gametangia (G)
and suspensors (S) are shown in the center of the field. Gametangia
contain haploid nuclei from each mating type.
S
G
14-54
Y
OUNG
R
HIZOPUS
Z
YGOSPORE
The zygospore forms when
the cytoplasm from the two mating strains fuse (plasmogamy).
14-49
R
HIZOPUS
L
IFE
C
YCLE
Please refer to the
text for details.
C
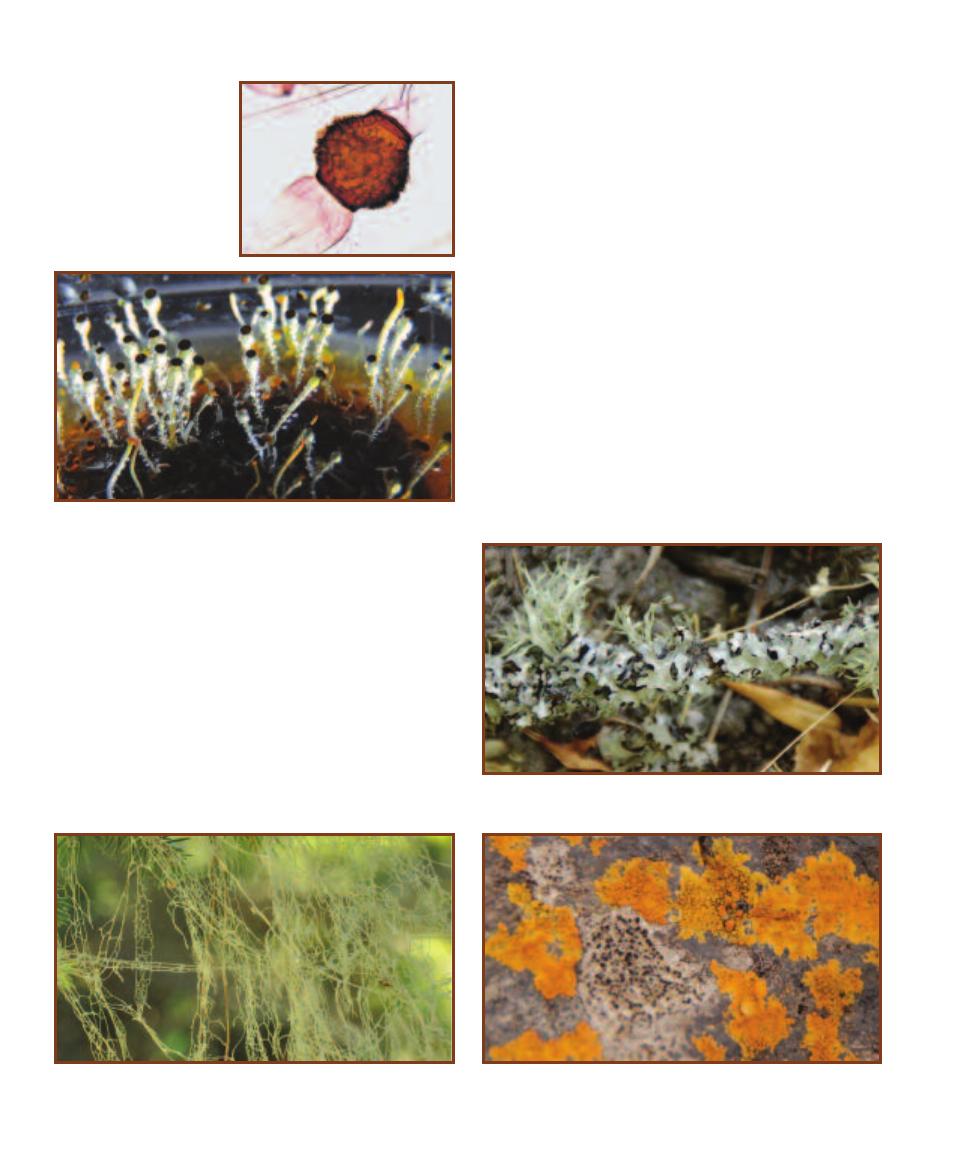
more toward the light with the “intent” of shooting them
toward vegetation that will be ingested by an animal. Spores
are distributed in the animals’ feces, and the cycle repeats.
Lichens
Lichens are an amalgam of two organisms living in a mutual-
istic symbiosis. One partner, the mycobiont, is a fungus. The
other partner, the photobiont, is either a cyanobacterium or a
green alga (or sometimes both are present). Most myco bionts
are ascomycetes and worldwide, approximately 20% of
fungi participate in forming lichens. Photobionts are limited
to a few dozen genera.
The association between mycobiont and photobiont
favors both. In fact, frequently the lichenized fungus can
survive in places where the individuals cannot. The photo-
biont photosynthesizes and produces organic compounds
from CO
2
and water. If it is a cyanobacterium, it may also
be capable of nitrogen fixation. In turn, the mycobiont
benefits from the productivity of its partner and provides
it with moisture and protection.
Lichens reproduce asexually by fragmentation of the
thallus and by producing propagules containing both the
mycobiont and photobiont. Sexual reproduction also occurs,
but the mechanisms are varied and poorly understood. It
appears that the sexually reproducing fungus must obtain a
new photobiont partner each generation, thus emphasizing
the continuity of the fungus and validating the convention
of naming lichens after the mycobiont.
The lichen body (thallus) can usually be categorized into
one of three types: foliose (leafy), fruticose (shrubby), and
crustose (crusty). Examples are shown in Figures 14-57
through Figure 14-59.
182
䢇
A Photographic Atlas for the Microbiology Laboratory
14-56
P
ILOLOBUS
C
ULTURE
These Pilolobus sporangiophores are
oriented vertically because they were incubated in the dark. Had there
been a directional light source, they would have been oriented toward
it. Spores are in the black cap; the clear, swollen area beneath them is
the subsporangial vesicle. The culture was raised on Rabbit Dung Agar;
the brown object is a rabbit pellet.
14-57
A F
OLIOSE
L
ICHEN
This foliose lichen was found in a public
park in Oregon. Note the leafy appearance of the thallus.
14-58
A F
RUTICOSE
L
ICHEN
This stringy lichen was provisionally
identified as Ramalina menziesii. Note the delicate network of thallus
strands. It was photographed in Northern California.
14-59
A C
RUSTOSE
L
ICHEN
This crustose lichen was provisionally
identified as Caloplaca marina. It was found high in the intertidal zone of
a rocky shore in Oregon.
14-55
M
ATURE
R
HIZOPUS
Z
YGOSPORE
Haploid nuclei
from each strain fuse within
the zygospore (
karyogamy) to
produce many diploid nuclei.
Meiosis of each occurs to pro-
duce numerous haploid spores.
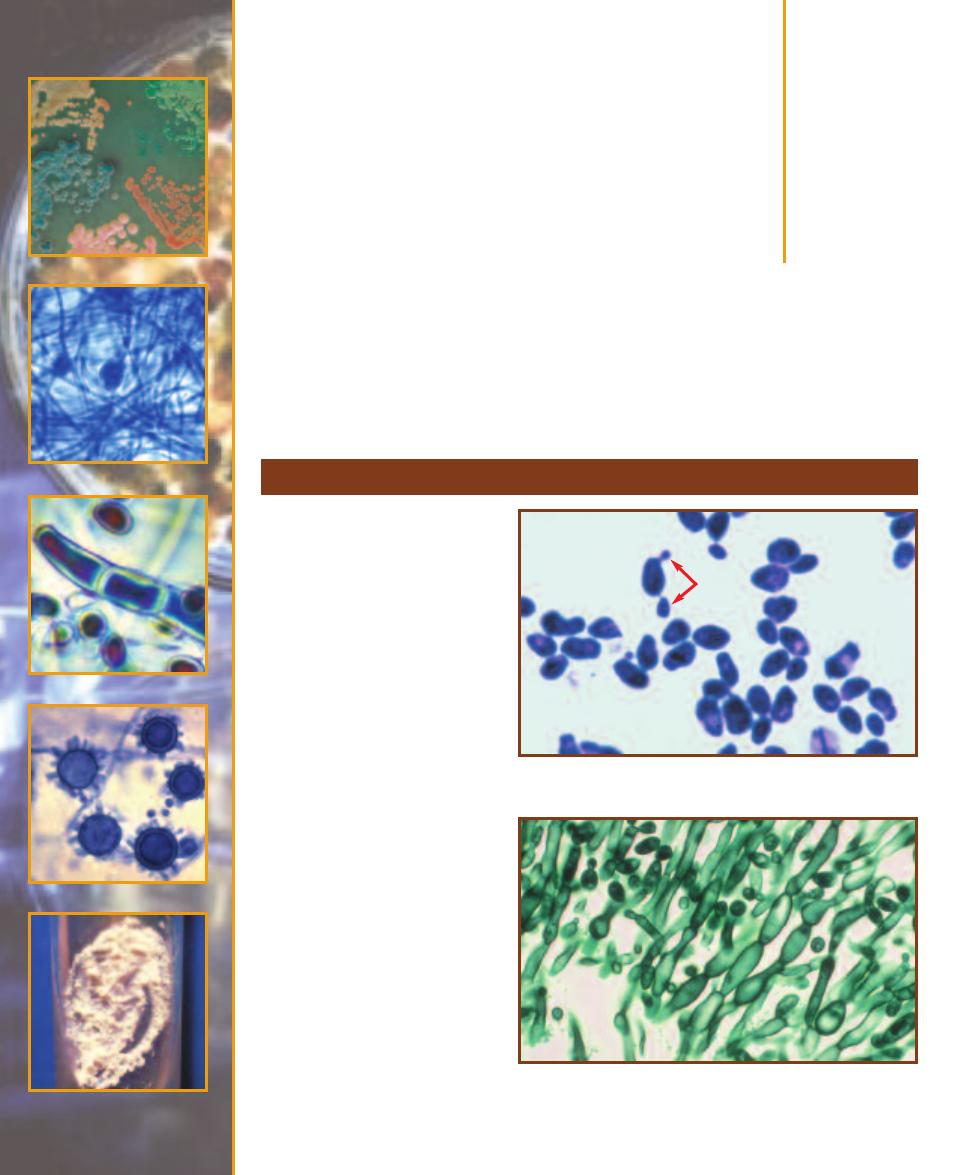
Fungi of Clinical
Importance
Candida albicans
Candida albicans (Figures 15-1
through 15-3) is part of the normal
respiratory, gastrointestinal, and
female urogenital tract floras.
Under the proper circumstances,
it may flourish and produce patho-
logical conditions, such as thrush
in the oral cavity, vulvovaginitis of
the female genitals, and cutaneous
candidiasis of the skin. Systemic
candidiasis may follow infection
of the lungs, bronchi, or kidneys.
Entry into the blood may result
in endocarditis. Individuals most
susceptible to Candida infections
are diabetics, those with immuno -
deficiency (e.g., AIDS), catheterized
patients, and individuals taking
antimicrobial medications. Budding
results in chains of cells called
pseudohyphae that produce clusters
of round, asexual blastoconidia at
the cell junctions. Large, round,
thick-walled chlamydospores form
at the ends of pseudohyphae.
Presumptive identification of
C. albicans can be made from
a positive germ tube test (Figure
15-4).
15
S E C T I O N
183
This section is a brief treatment of fungal pathogens. For an introduction to fungi in general, please
refer to page 178 in Section 14.
Yeasts of Medical Importance
15-1
C
ANDIDA ALBICANS
V
EGETATIVE
C
ELLS
Note the oval shape,
nuclei, and budding cells (arrow).
15-2
C
ANDIDA ALBICANS
P
SEUDOHYPHAE
Note the constrictions
between cells.
© 2003 American Society for Clinical Pathology. Reprinted with permission
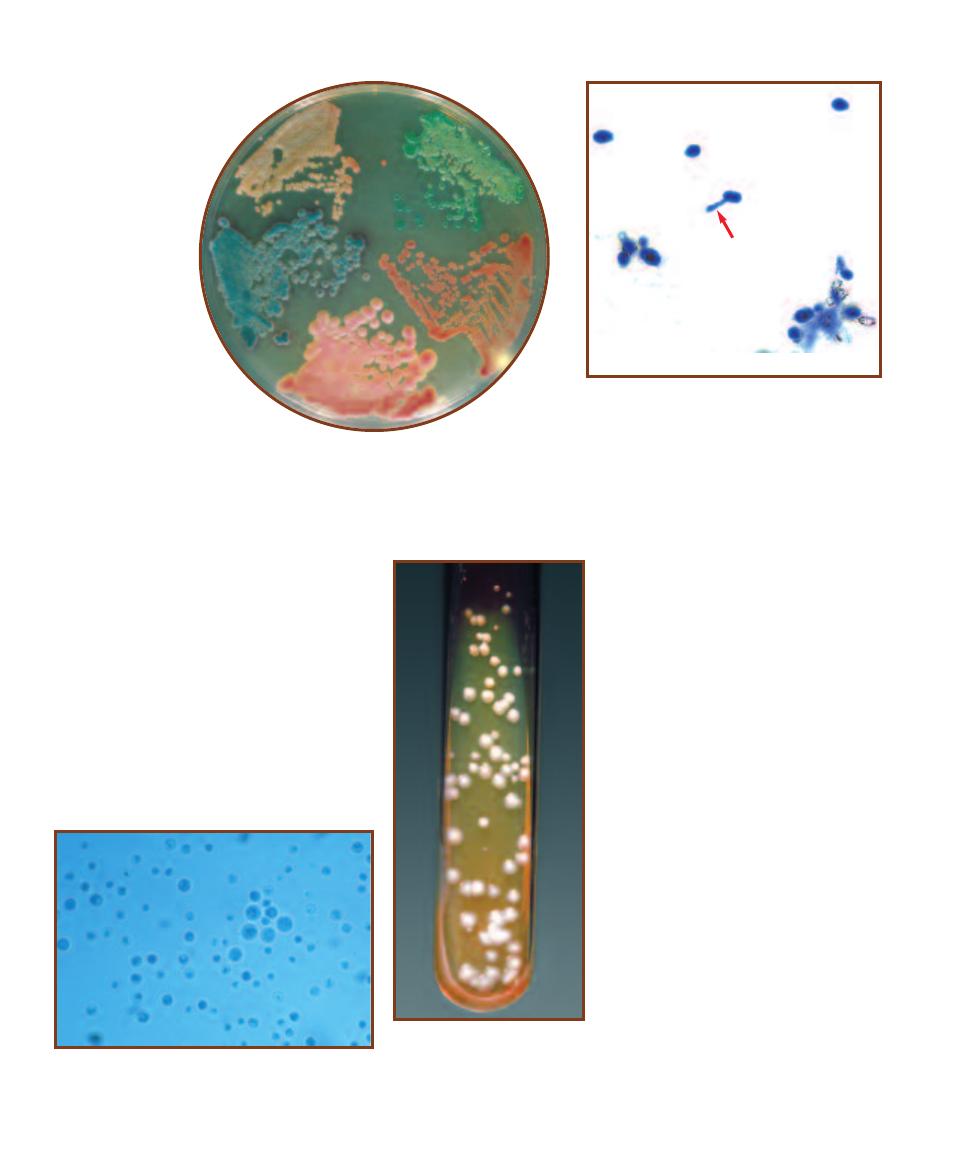
Cryptococcus neoformans
Cryptococcus neoformans causes cryptococcosis and is the only known serious
human pathogen of the genus. It is an encapsulated, nonfermenting, aerobic
yeast (Figure 15-5) often found in soil mixed
with accumulated bird (pigeon) droppings that
enrich it with nitrogen. Urban sites where
pigeons roost may also harbor the organism in
the dried feces. Infection by C. neoformans
from inhalation leads to pneumonia and then
meningitis. Cryptococcosis, at one time a dis-
ease of poultry workers, is increasing in inci-
dence and is among the more common
opportunistic infections of AIDS patients. Due
to the capsule, colonies of C. neoformans are
shiny, cream-colored, and mucoid (Figure 15-6).
Iden tification is made by direct microscopic
examination and biochemical tests.
184
䢇
A Photographic Atlas for the Microbiology Laboratory
15-3
C
ANDIDA ALBICANS
C
OLONIES ON
CHROM
AGAR
C
ANDIDA
CHROMagar Candida
is a commercial differential
medium for isolation and
presumptive identification
of clinically important
yeasts. The colonies
are (clockwise from
top) C. albicans (green),
C. glabrata (dark pink),
C. krusei (pink and
velvety), and C. tropicalis
(blue/purple). The beige
growth at the top left is
Trichosporon beigeli.
Photograph courtesy of
CHROMagar, Paris, France
15-4
C
ANDIDA ALBICANS
G
ERM
T
UBE
T
EST
Presence of germ tubes (arrow) allows presumptive
identification of C. albicans.
15-5
C
RYPTOCOCCUS NEOFORMANS
(L
ACTOPHENOL
B
LUE
S
TAIN
)
C. neoformans is characterized by spherical,
encapsulated cells that range in size from 2–15 µm. The
capsule is faintly visible in this preparation.
15-6
C
RYPTOCOCCUS
NEOFORMANS
C
OLONIES
The
colonies are mucoid due to the
encapsulated yeast cells.
Photograph courtesy of
CDC Public Health Image Library
Pneumocystis jirovecii
Pneumocystis jirovecii (formerly P.
carinii) is an opportunistic patho gen
whose taxonomy and natural history
has been difficult to work out due to the
inability to grow it outside of its mam-
malian host. Comparison of ribosomal
RNA and genome sequencing has led to
the conclusion that Pneumocystis, long
classified as a protozoan, is more closely
related to certain ascomycete yeasts. Its
protozoan roots are still evident, how-
ever, in the terminology associated with
it. Pneumocystis exists as a trophozoite
(trophic stage) and a multinucleate cyst
(spore case) (Figure 15-7). Asexual
reproduction is by fission of the tropho-
zoite, not budding as in most yeast. Its
sexual phase is thought to resemble
yeast-like conjugation to form a zygote
that produces four spores by meiosis.
These then undergo mitosis to produce
a cyst with eight spores.
Most people become seropositive
for Pneumocystis in childhood and
humans—even immunocompetent indi-
viduals—are the apparent reservoirs for
the organism. Transmission is through
the air, with the primary infection occur-
ring in the lungs. Infection produces
pneumocystis pneumonia (PCP) in
AIDS patients and immunosuppressed
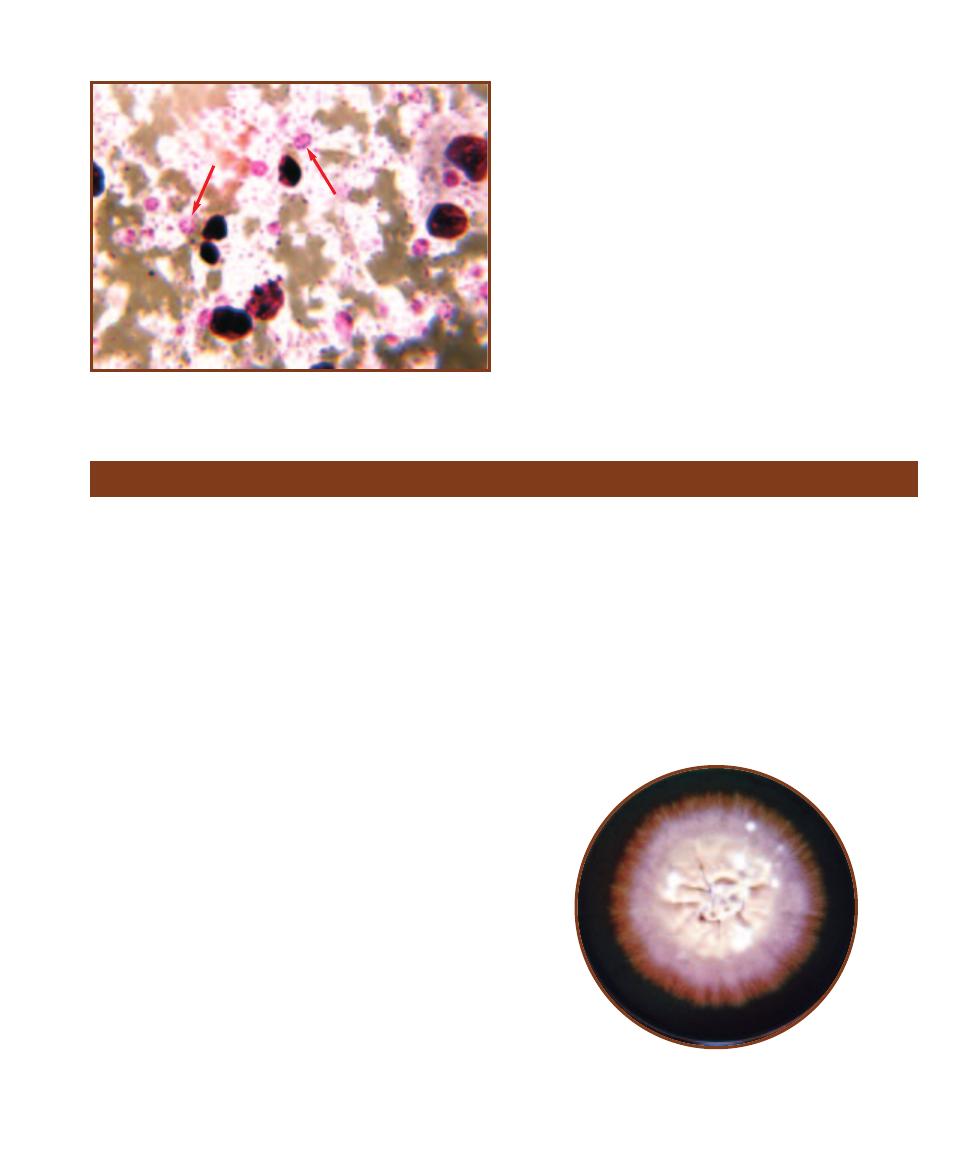
individuals, and interstitial plasma cell pneumonitis in
malnourished infants. Identification is made by direct
examination of the cyst (usually) using immunofluores-
cence. Co-trimoxazole is given to immunocompromised
patients whose CD4 (T-helper) cell counts are less than
200/mm
3
.
SECTION 15
䢇
Fungi of Clinical Importance
䢇
185
15-7
S
ECTION OF
P
NEUMOCYSTIS JIROVECII
C
YST IN AN
I
NFECTED
L
UNG
(P
ERIODIC
A
CID
S
CHIFF
S
TAIN
)
Zygotic meiosis followed by a
mitotic division of each spore results in a mature
cyst with eight spores (arrows). Once released, the
spores become trophozoites.
Monomorphic Molds
Dermatophytes
The dermatophytes include Epidermophyton, Microsporum,
and Trichophyton, related genera of fungi that infect keratin -
ized tissues of mammals—epidermis, nails, and hair. They
produce a group of conditions known as “tinea” or “ring-
worm.” The latter name comes from their growth pattern
in which the infection spreads outwards from the center of
initial infection. The actively growing cells are at the edge
of the growth, whereas healing tissue is toward the middle,
thus giving the impression of a worm at the lesion’s periphery.
Various forms of tinea are recognized based on body location:
tinea capitis occurs on the head, tinea corporis occurs on
the face and trunk, tinea cruris occurs on the groin, tinea
unguium occurs on the nails, and tinea pedis occurs on the
feet (producing a condition known as “athlete’s foot”).
Dermatophytes may infect more than one body region
and often produce similar symptoms, so they are considered
together here. Inflammation of infected tissue due to fungal
antigens is the primary symptom and is often manifested as
scaling, discoloration, and itching. Transmission is through
contact with infected skin or contaminated items, such as
towels, clothing, combs, or bedding.
Identification generally involves consideration of the
tissue infected (as some are fairly specific), examination
of the infection, and microscopic examination of patient
samples and/or cultures. Tissues infected with Microsporum
fluoresce when illuminated with a Wood’s lamp (an ultra -
violet light source) whereas Epidermophyton and Tricho -
phyton do not produce fluorescence. Large macroconidia
and smaller microconidia are especially useful microscopic
characteristics used in differentiating species.
Epidermophyton
Epidermophyton floccosum is the only pathogen in the
genus. It invades the dead, keratinized tissues of skin and
nails, but not hair, and is highly contagious. In culture,
colonies have an olive-green to khaki central portion with
an orange periphery (Figure 15-8). Older cultures become
overgrown with a white aerial mycelium.
Microscopically, characteristic macroconidia can be
observed arising from conidiophores either singly or in
clusters of two or three. These are septate with one to five
cells, and club shaped with thin, smooth walls (Figure 15-9).
Microconidia are absent.
15-8
E
PIDERMOPHYTON
FLOCCOSUM
C
OLONY ON
S
ABOURAUD
D
EXTROSE
A
GAR
Notice the khaki color is somewhat obscured by the
white aerial mycelium.
Photograph by Dr. Lucille K. Georg, courtesy of CDC Public Health Image Laboratory
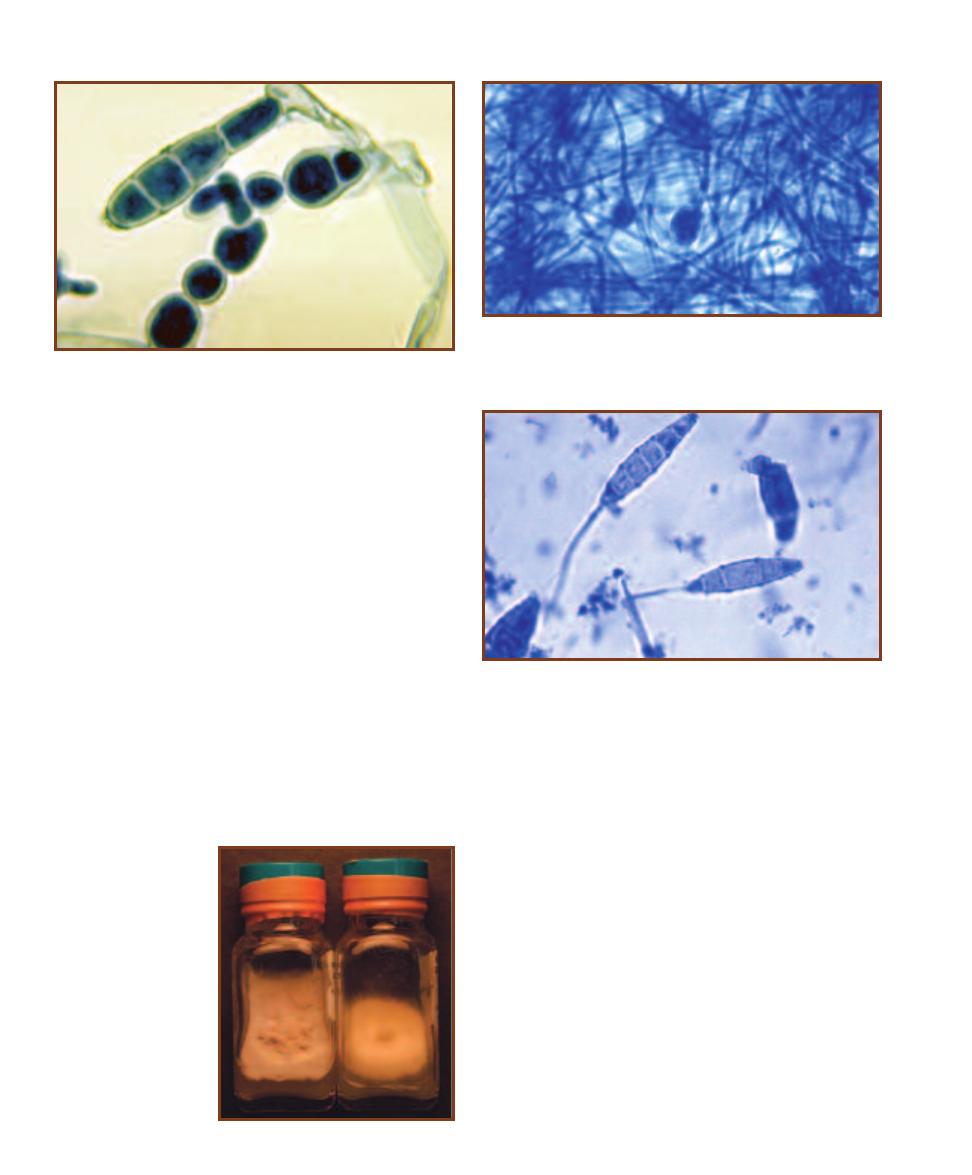
Microsporum
Terminal, septate macroconidia with thick, rough walls
characterize the genus Microsporum. Microconidia may be
present, but are not common. Chlamydoconidia, a resting
stage, are produced by some species. Hyphae are septate
and either branched or unbranched.
M. audouinii was at one time responsible for scalp
ringworm epidemics in children. It rarely infects adults.
Colonies are gray to tan with a light orange reverse (Figure
15-10). Unlike other species in the genus, M. audouinii
rarely produces macroconidia or microconidia. Pointed
chlamydoconidia may be seen (Figure 15-11).
M. gypseum (Figure 15-10) infects humans less fre-
quently than M. adouinii. Colonies are variously colored,
ranging from tan to reddish brown and often developing a
white border or white center. Thin walled and rough macro-
conidia with no more than 6 cells are abundant (Figure
15-12). Club-shaped microconidia may also be observed.
Trichophyton spp.
Trichophyton species (Figures 15-13 through 15-15) are the
most important dermatophytes causing infection in adults.
They are responsible for most cases of tinea pedis and tinea
unguium, and occasionally tinea corporis and tinea capitis.
Macroconidia are rare, but are located at the ends of hyphae
and are club-shaped, smooth, thin-walled and septate with
up to ten cells. Spherical microconidia are more common.
An in vitro hair perforation test is used to distinguish
T. mentagrophytes from other members of the genus (except
T. terrestre and some T. tonsurans) (Figure 15-16).
186
䢇
A Photographic Atlas for the Microbiology Laboratory
15-9
E
PIDERMOPHYTON FLOCCOSUM
M
ACROCONIDIA
Note the
hyphae with characteristic club-shaped, septate macroconidia with thin,
smooth walls. They range in size from 5–10 µm wide by 20–65 µm long.
Photograph by Dr. Libero Ajello, courtesy of CDC Public Health Image Laboratory
15-10
M
ICROSPORUM
C
OLONIES
On the left is
M. gypseum. M. audouinii
is on the right.
15-11
M
ICROSPORUM AUDOUINII
C
HLAMYDOCONIDIUM
(L
ACTO
-
PHENOL
C
OTTON
B
LUE
S
TAIN
)
When grown in culture, M. audouinii
often produces terminal chlamydoconidia, which contain resistant resting
cells.
15-12
M
ACROCONIDIA OF
M
ICROSPORUM GYPSEUM
(L
ACTO
-
PHENOL
C
OTTON
B
LUE
S
TAIN
)
M. gypseum typically has fewer than
six cells in each macroconidium. Note the rough surface. Macroconidia
range in size from 8–16 µm wide by 22–60 µm long.
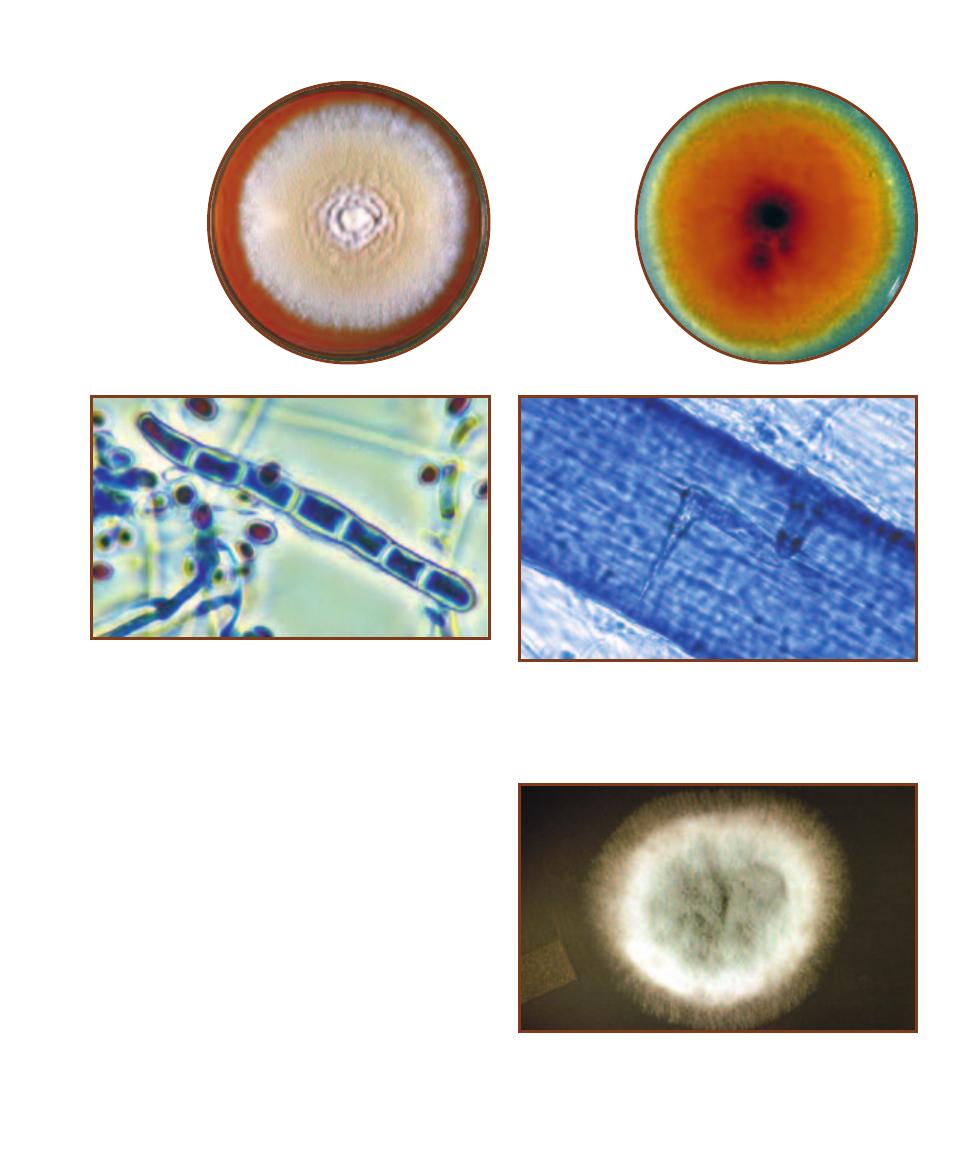
Aspergillus
The genus Aspergillus is characterized by green to yellow or
brown granular colonies with a white edge (Figure 15-17).
One species, A. niger, produces distinctive black colonies
(Figure 15-18). Vegetative hyphae are hyaline (unpigmented)
and septate. The Aspergillus fruiting body is distinctive,
with chains of conidia arising from one (uniseriate) or two
(biseriate) rows of phialides attached to a swollen vesicle at
the end of an unbranched conidiophore (Figure 15-19). The
conidiophore grows from a foot cell in the vegetative hypha
(Figure 15-20). Fruiting body structure and size, and conidia
color are useful in species identification.
A. fumigatus and other species are opportunistic
pathogens that cause aspergillosis, an umbrella term cover-
ing many diseases. One form of pulmonary aspergillosis
(referred to as “fungus ball”) involves colonization of the
bronchial tree or tissues damaged by tuberculosis. Allergic
SECTION 15
䢇
Fungi of Clinical Importance
䢇
187
15-13
T
RICHOPHYTON
MENTAGROPHYTES
The colonies are
granular, whitish
to tan, and may
form concentric
rings. Generally,
no conidiation is
observed.
Photograph by Dr. Libero Ajello,
courtesy of CDC Public
Health Image Laboratory
15-16
H
AIR
P
ERFORATION
T
EST
(L
ACTOPHENOL
C
OTTON
B
LUE
S
TAIN
)
Trichophyton mentagrophytes infection can be diagnosed by a
hair perforation test. Note the indentation in the hair.
15-15
T
RICHOPHYTON RUBRUM
M
ACROCONIDIUM AND
M
ICRO
-
CONIDIA
(L
ACTOPHENOL
C
OTTON
B
LUE
S
TAIN
)
The macroconidia of
T. rubrum are cigar-shaped, have smooth, thin walls and between three
and eight cells. They range in size from 4–8 µm wide by 40–60 µm long.
The microconidia are teardrop in shape and are borne in clusters.
Photograph by Dr. Libero Ajello, courtesy of CDC Public Health Image Laboratory
15-14
T
RICHOPHYTON
MENTAGROPHYTES
R
EVERSE
This is
the same colony
as shown in Figure
15-13, but viewed
from below.
Photograph by Dr. Libero Ajello,
courtesy of CDC Public
Health Image Laboratory
15-17
A
SPERGILLUS FUMIGATUS
C
OLONY ON
S
ABOURAUD
D
EXTROSE
A
GAR
Note the rugose topography and green, granular
appearance with a white margin. The reverse is white. Although a
common cause of aspergillosis, normally healthy people are not at
great risk from A. fumigatus infection.
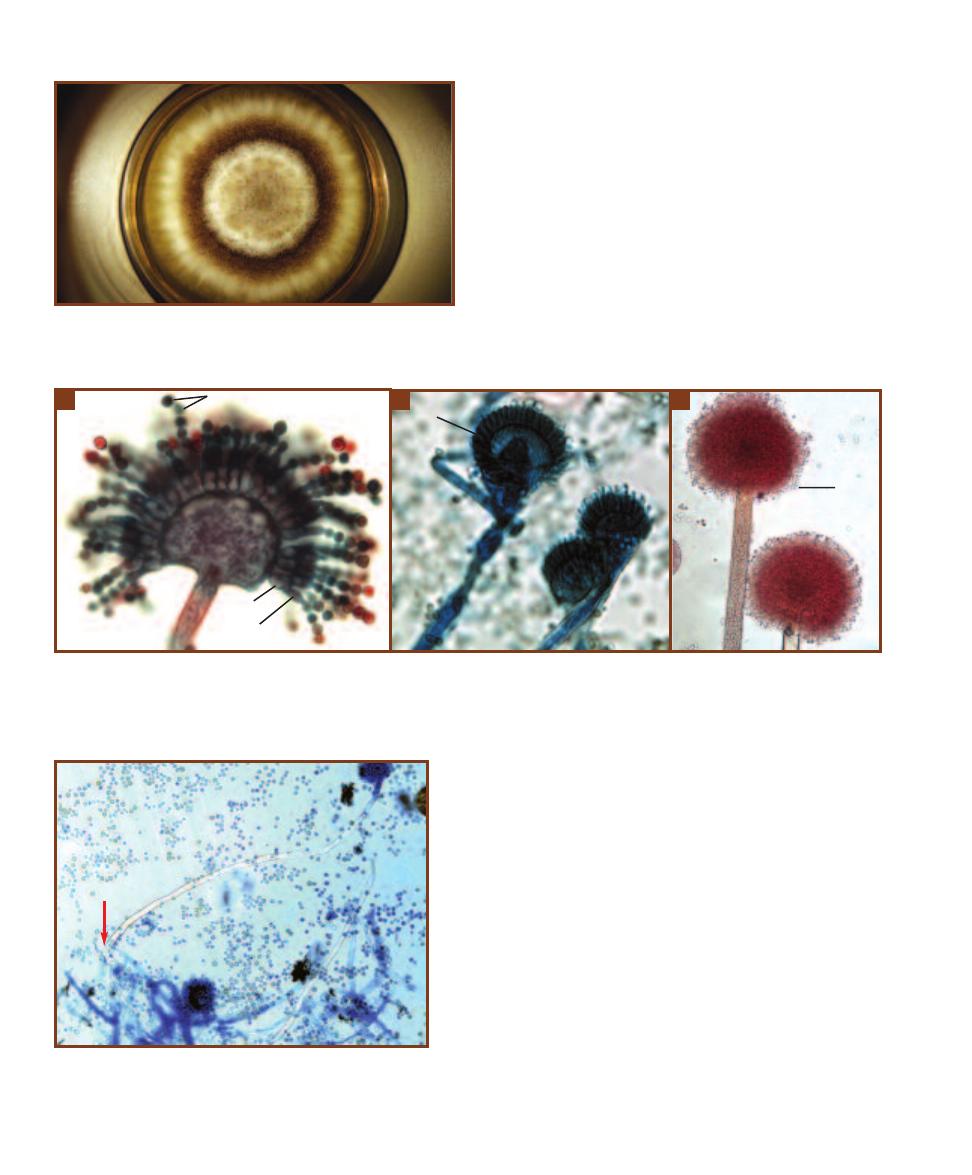
aspergillosis may occur in individuals who are in frequent
contact with the spores and become sensitized to them.
Subsequent contact produces symptoms similar to asthma.
Invasive aspergillosis is the most severe form. It results in
necrotizing pneumonia and may spread to other organs.
Some species of Aspergillus are of commercial impor-
tance. Fermentation of soybeans by A. oryzae produces soy
paste. Soy sauce is produced by fermenting soybeans with a
mixture of A. oryzae and A. soyae. Aspergillus is also used
in commercial production of citric acid.
Coccidioides immitis
Coccidioides immitis causes coccidio idomycosis (“Valley
fever”), a lung disease associated with desert regions of the
southwestern United States, northern Mexico, and parts of
Central and South America. Most infections are asympto-
matic and self-limiting, but in some individuals symptoms
are influenza-like and may include hypersensitivity reac tions.
Rarely, the disease becomes disseminated and then may be
lethal. It is the most frequent cause of laboratory-acquired
fungal infections, so extreme care must be taken when
handling it.
The mold form consists of branched, septate, hyaline
hyphae. Barrel-shaped arthroconidia develop separated by
thin-walled disjunctor cells. When the disjunctor cells die,
the arthroconidia become separated (Figure 15-21). Infec-
tion occurs when these become airborne and are inhaled.
Once in the host, arthroconidia develop into thick-walled
188
䢇
A Photographic Atlas for the Microbiology Laboratory
15-18
A
SPERGILLUS NIGER
C
OLONY ON
S
ABOURAUD
D
EXTROSE
A
GAR
A. niger produces distinctive black colonies. This colony was
grown 7 days at 25°C.
15-19
A
SPERGILLUS
C
ONIDIAL
H
EADS
A
Shown is a section of an A. niger conidiophore. The conidia (C), primary (P) and secondary (S) phialides,
and vesicle (V) are visible. This is a biseriate conidium.
B
The A. fumigatus conidial head is uniseriate with just a single row of phialides (P). The conidia
are mostly absent due to handling during slide preparation.
C
Shown is a whole mount of an A. niger conidiophore. Note the chains of conidia (C) are
shorter than in Figure 15-19A due to handling during slide preparation. The vesicle (V) is visible, but the phialides are not distinct.
B
C
A
C
P
P
S
C
V
15-20
A
SPERGILLUS
F
OOT
C
ELL
(L
ACTOPHENOL
C
OTTON
B
LUE
S
TAIN
)
Sporangiophores emerge from a foot cell with the shape of
an inverted “T” (arrow). This is a wet mount of A. flavus. Notice all
the conidia in the field.
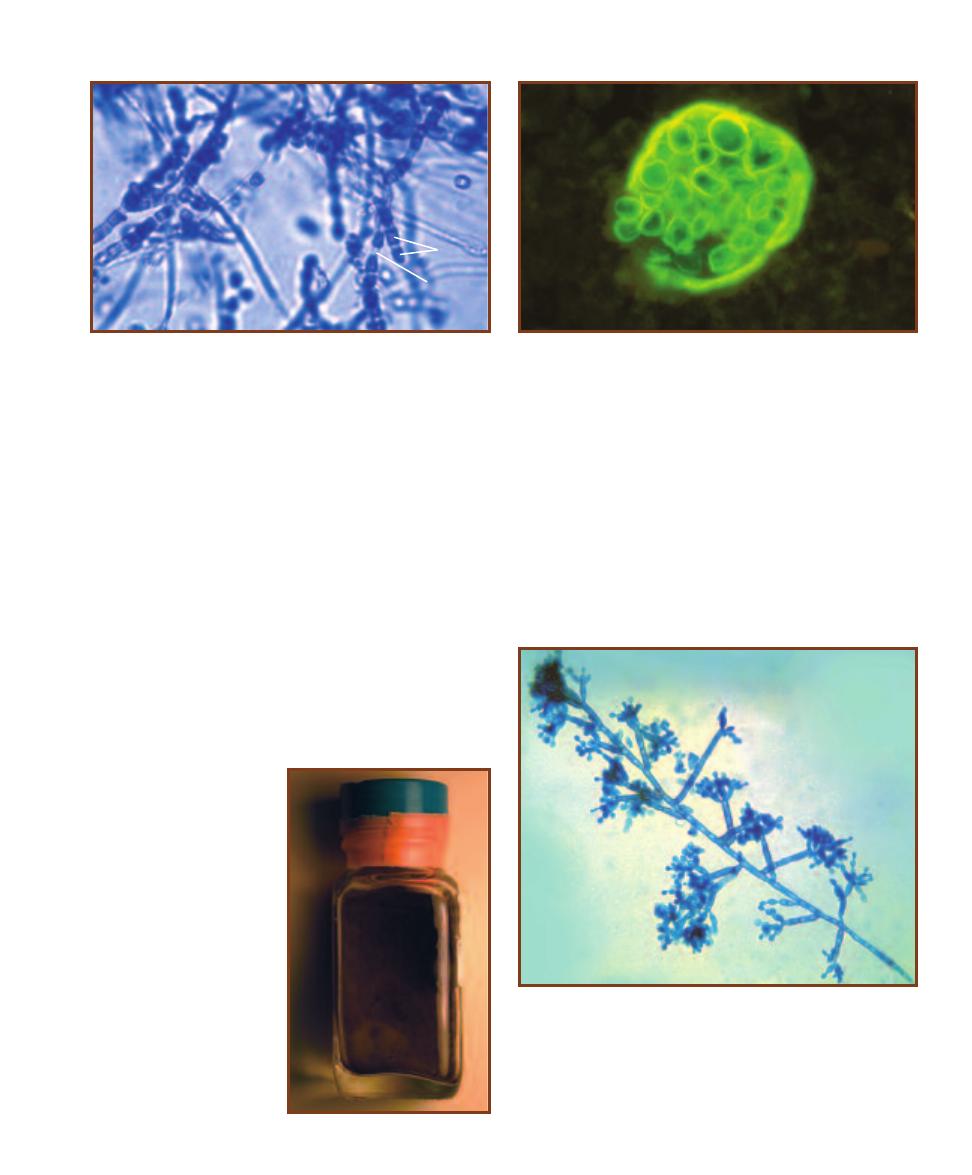
spherules containing endospores (not to be confused with
bacterial endospores), which may in turn develop into
spherules upon release (Figure 15-22). In culture, arthro-
conidia develop into hyphae.
C. immitis colonies are white and wooly, but may
develop a variety of colors with age. The yeast form does
not grow on standard culture media.
Colony morphology, hyphae with alternating barrel-
shaped arthroconidia and disjunctor cells, and direct exami-
nation of patient samples for the presence of spherules are
used in identifying C. immitis. DNA probes are also used in
identification.
Fonsecaea
Fonsecaea pedrosoi is a dematiaceous fungus that causes
chromoblastomycosis, a disease of skin and sub cutaneous
tissues, particularly in the lower extremities. It has a world-
wide distribution, but is more common in tropical and
subtropical regions. Colonies are olive green to black with
a velvety texture and a black reverse (Figure 15-23). The
branched and septate hyphae have dark cell walls due to the
pigment melanin. The dark conidia are borne on septate
conidiophores in four basic patterns (Figure 15-24). At least
two of these must be seen to identify the isolate as F. pedrosoi.
SECTION 15
䢇
Fungi of Clinical Importance
䢇
189
15-21
C
OCCIDIOIDES IMMITIS
A
RTHROCONIDIA
(L
ACTOPHENOL
C
OTTON
B
LUE
S
TAIN
)
Typically, the barrel-shaped arthroconidia (
A)
are separated by thinner walled disjunctor cells (
D). Arthroconidia range
in size from 3–4 µm wide by 3–6 µm long.
D
A
15-22
C
OCCIDIODES IMMITIS SPHERULE
(F
LUORESCENT
A
NTIBODY
S
TAIN
)
Presence of C. immitis spherules in patient specimens is useful
in coccidioidomycosis diagnosis. Spherules range in size from 10–80 µm
in diameter. Specimens examined range from sputum and other pul-
monary samples, to urine, blood, and cerebrospinal fluid.
Photograph courtesy of CDC Public Health Image Library
15-23
F
ONSECAEA PEDROSOI
C
OLONY
This dematiaceous
fungus is the primary cause of
chromoblastomycosis.
15-24
F
ONSECAEA PEDROSOI
C
ONIDIA
(L
ACTOPHENOL
C
OTTON
B
LUE
S
TAIN
)
There is great variation in F. pedrosoi conidia formation,
and at least two different ones must be seen to identify a specimen as
Fonsecaea. Hyphae are septate and branched. Conidia range in size from
1.5–3.0 µm wide by 2.5–6.0 µm long.
Photograph courtesy of CDC Public Health Image Library
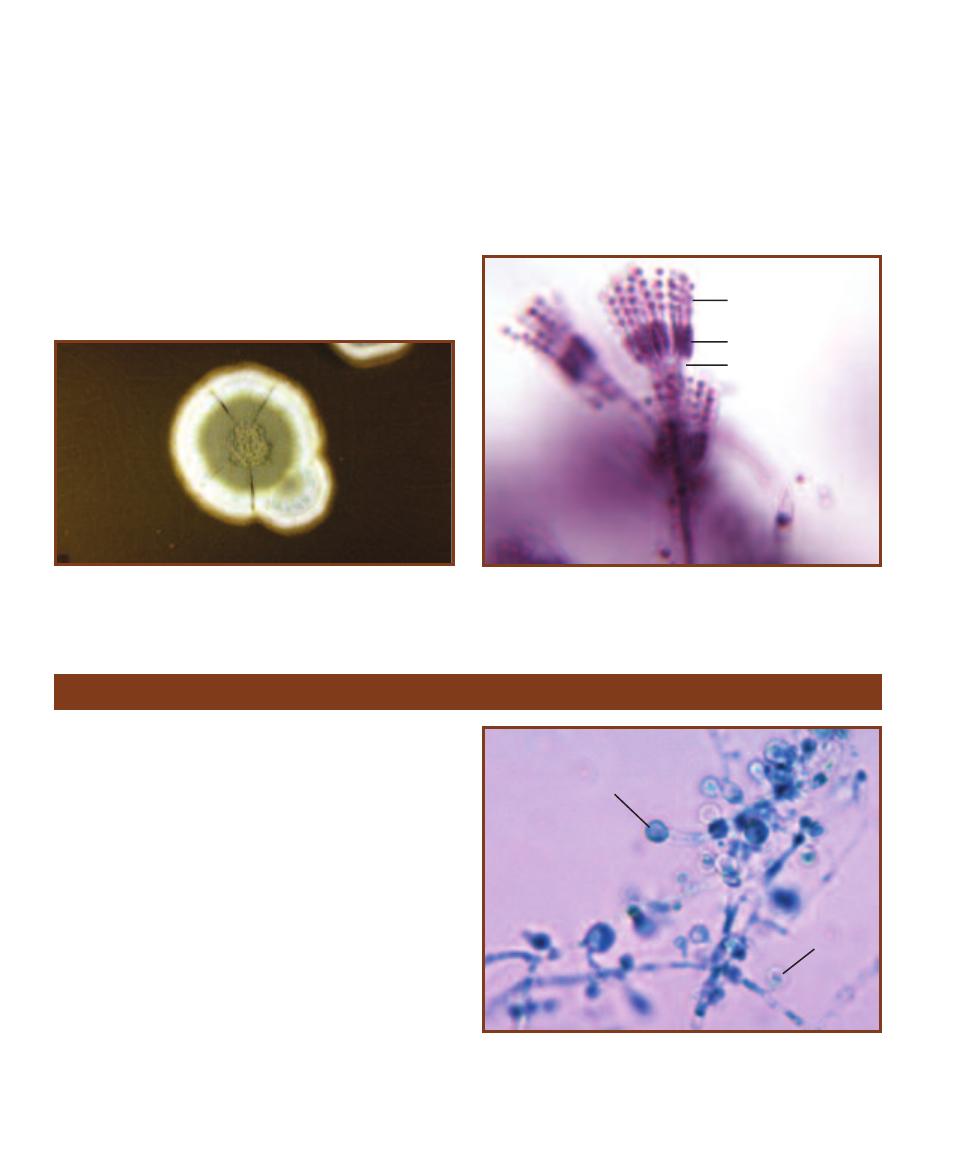
Penicillium
Members of the genus Penicillium produce distinctive green,
powdery, radially furrowed colonies with a white apron
(Figure 15-25) and a light colored reverse surface. The
hyphae are septate and thin. Distinctive Penicillium fruiting
bodies, consisting of metulae, phialides, and chains of
spherical conidia, are located at the ends of branched or
unbranched conidiophores (Figure 15-26).
Penicillium is best known for its production of the
anti biotic penicillin, but it is also a common contaminant.
One pathogen, P. marneffei, is endemic to Asia and is
responsible for disseminated opportunistic infections of the
lungs, liver, and skin in immunosuppressed and immuno-
compromised patients. It is thermally dimorphic, producing a
typical velvety colony with a distinctive red pigment at 25°C
but converting to a yeast form at 35°C. Other species of
Penicillium are of commercial importance for fermentations
used in cheese production. Examples include P. roquefortii
(Roquefort cheese) and P. camembertii (Camembert and
Brie cheeses).
190
䢇
A Photographic Atlas for the Microbiology Laboratory
15-25
P
ENICILLIUM NOTATUM
C
OLONY ON
S
ABOURAUD
D
EXTROSE
A
GAR
The green, granular surface with radial furrows and a white
apron are typical of the genus.
15-26
P
ENICILLIUM
C
ONIDIOPHORE
Penicillium species produce
a characteristic brush-shaped conidiophore (penicillus). Metulae (M),
phialides (P), and chains of spherical conidia (C) are visible.
C
P
M
Dimorphic Molds
Blastomyces dermatitidis
Blastomyces dermatitidis is a dimorphic soil fungus with a
mold and yeast phase. The mold form produces character -
istic oval or pear-shaped, single-celled conidia at the tips of
conidiophores arising from the septate hyphae (Figure 15-27).
The yeast form consists of single cells that bud from a wide
base.
B. dermatitidis is found in damp, alkaline soils rich in
organic material of the Great Lakes, upper Mississippi River,
and southeastern regions of the United States. Pulmonary
infection due to inhalation of conidia from disturbed soil
results in the disease blastomycosis. Colony morphology
(Figure 15-28) varies depending on the medium, but the
mold often has a white to brownish cobweb appearance.
Identification is made through direct exam ination, tissue
samples showing the typical yeast cells, serological methods,
or a DNA probe.
15-27
B
LASTOMYCES DERMATITIDIS
C
ONIDIA
(L
ACTOPHENOL
C
OTTON
B
LUE
S
TAIN
)
This micrograph shows the septate hyphae and
the characteristic thick-walled, lollipop-shaped, unicellular conidia (C).
Conidia range from 2–10 µm in diameter.
Photograph courtesy of CDC Public Health Image Library
C
C
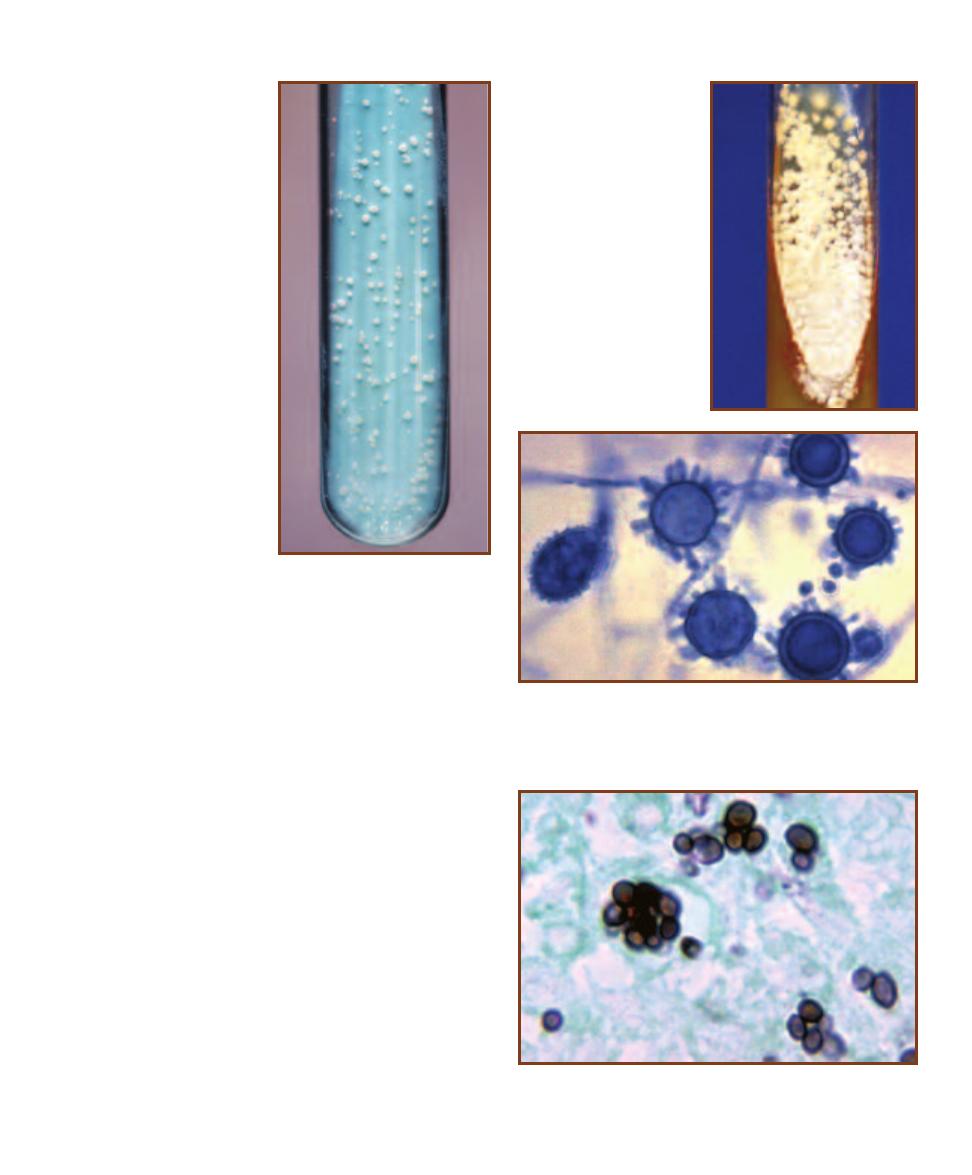
Histoplasma capsulatum
Histoplasma capsulatum (Figure 15-29) is found in the
Midwestern and southern United States where soil or
buildings have accumulated bird or bat droppings.
Alveolar macrophages phagocytize inhaled microconidia
which then spread throughout the reticuloendothelial
system. Most infections are asymptomatic or produce
a flu-like set of symptoms that are self-limiting. In
immunocompromised individuals, a potentially fatal
disseminated histoplasmosis may occur.
Colonies are slow growing and highly variable in
appearance depending on incubation temperature and
medium used. The yeast form grows at 25°C whereas
the mold form is seen at 37°C. Hyphae are slender,
hyaline, and septate. Macroconidia are more or less
spherical and contain a single cell. They develop tuber-
cles as they age (Figure 15-30). Microconidia are borne
on short conidiophores or may be found directly on
the hyphae. Yeast cells are similar to Candida in shape
and budding pattern (Figure 15-31).
Tentative identification may be made from obser-
vation of macroconidia covered with tubercles arising
from the hyphae or by seeing the yeast form inside
macrophages and other cells. Positive iden tification is
now done with a DNA probe or serological techniques.
SECTION 15
䢇
Fungi of Clinical Importance
䢇
191
15-28
B
LASTOMYCES
DERMATITIDIS
Y
EAST
C
OLONIES
ON
L
OWENSTEIN
-J
ENSEN
A
GAR
B. dermatitidis is a thermally
dimorphic fungus, producing
yeast-like colonies at 35°C and
mold-like growth at 25°C. It is
typically grown on Sabouraud
Dextrose Agar or Brain Heart
Infusion Agar.
Photograph by Dr. William Kaplan,
courtesy of CDC Public
Health Image Laboratory
15-29
H
ISTOPLASMA
CAPSULATUM
G
ROWN ON
S
ABOURAUD
D
EXTROSE
A
GAR
H. capsulatum is a slow- growing
dimorphic fungus. It is mold-like
at 25°C and is a yeast at 37°C.
There is great variation in colony
morphology depending on
medium, temperature, and age.
Photograph by Dr. Lenore Haley,
courtesy of CDC Public Health
Image Laboratory
15-31
H
ISTOPLASMA CAPSULATUM
Y
EAST
F
ORM
(M
ETHENAMINE
S
ILVER
S
TAIN
)
Note the budding cells and resemblance to Candida.
Photograph by Dr. Libero Ajello, courtesy of CDC Public Health Image Laboratory
15-30
T
UBERCULATE
M
ACROCONIDIA OF
H
ISTOPLASMA CAPSULA
-
TUM
(L
ACTO PHENOL
C
OTTON
B
LUE
S
TAIN
)
Hyphae of H. capsulatum
showing the distinctive rough (tuberculate) macroconidia (M).
Photograph courtesy of CDC Public Health Image Library
M
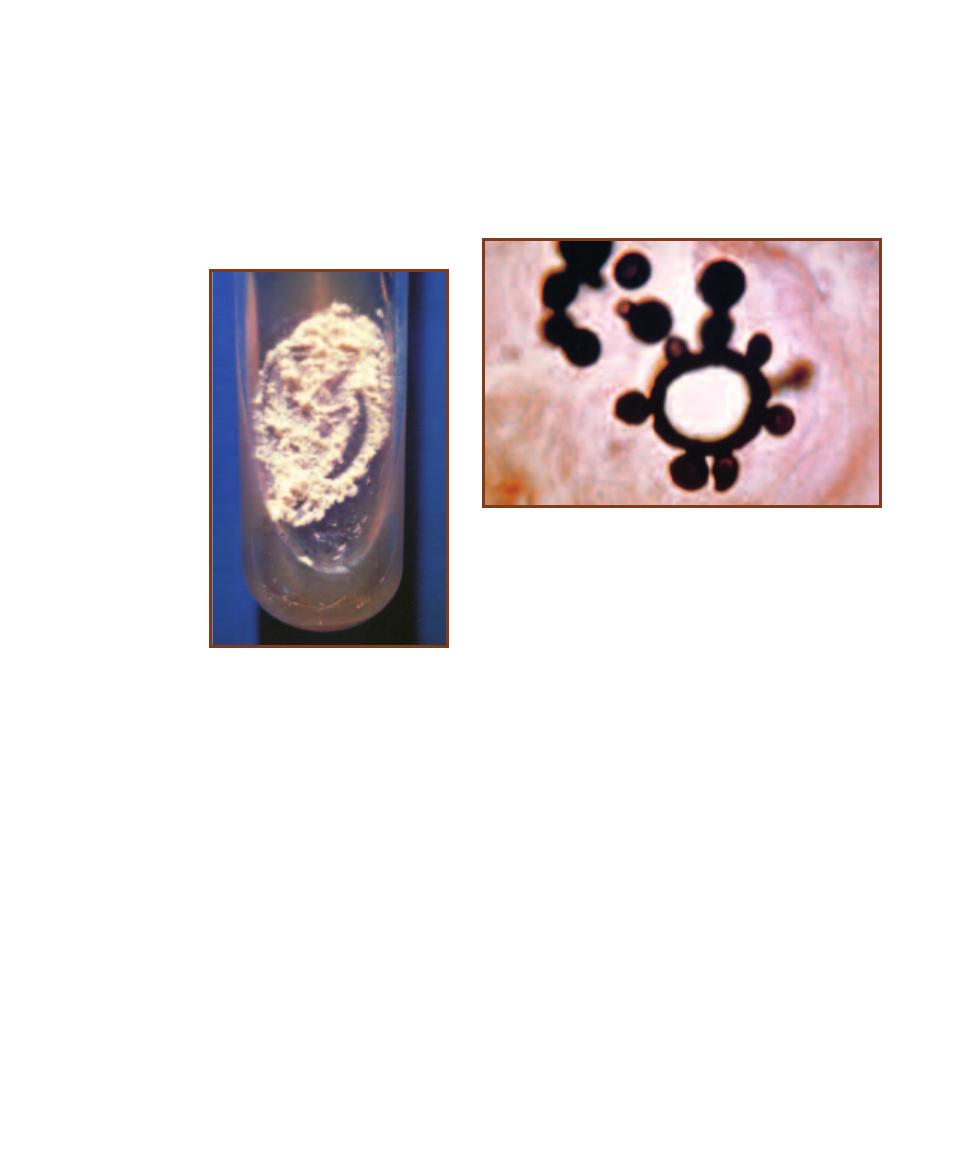
Paracoccidioides brasiliensis
Paracoccidioides brasiliensis is a dimorphic fungus (Figure
15-32) that is a yeast at 37°C and a mold at 25°C. It is
found in acidic soil of humid regions of South America,
Central America, and southern Mexico. It is transmitted by
airborne routes and is very infectious. Pulmonary para cocci -
dioidomycosis may result in immunocompromised or mal-
nourished individuals who inhale the organism. Sub clinical
infections are the rule for persons with normal immune
systems. Secondary infections involving the spread of the
organism occur in some cases.
Identification is made by converting the mold to the
yeast form. The yeast has a characteristic appearance, with
buds arising from around the mother cell (Figure 15-33).
Buds are typically attached by a thin stalk.
192
䢇
A Photographic Atlas for the Microbiology Laboratory
15-32
Y
EAST
P
HASE
OF
P
ARACOCCIDIOIDES
BRASILIENSIS
At 37°C,
P. brasiliensis grows as
a yeast with wrinkled,
whitish colonies. It is
slow growing and mold-
like with a variety of
morphologies at 25°C.
Photograph by Dr. Lenore Haley,
courtesy of CDC Public Health
Image Laboratory
15-33
P
ARACOCCIDIODES BRASILIENSIS
Y
EAST
F
ORM
The budding
of the yeast form produces a characteristic “mariner’s wheel.” Buds are
thick walled and about 10 µm in diameter.
Photograph courtesy of CDC Public Health Image Library
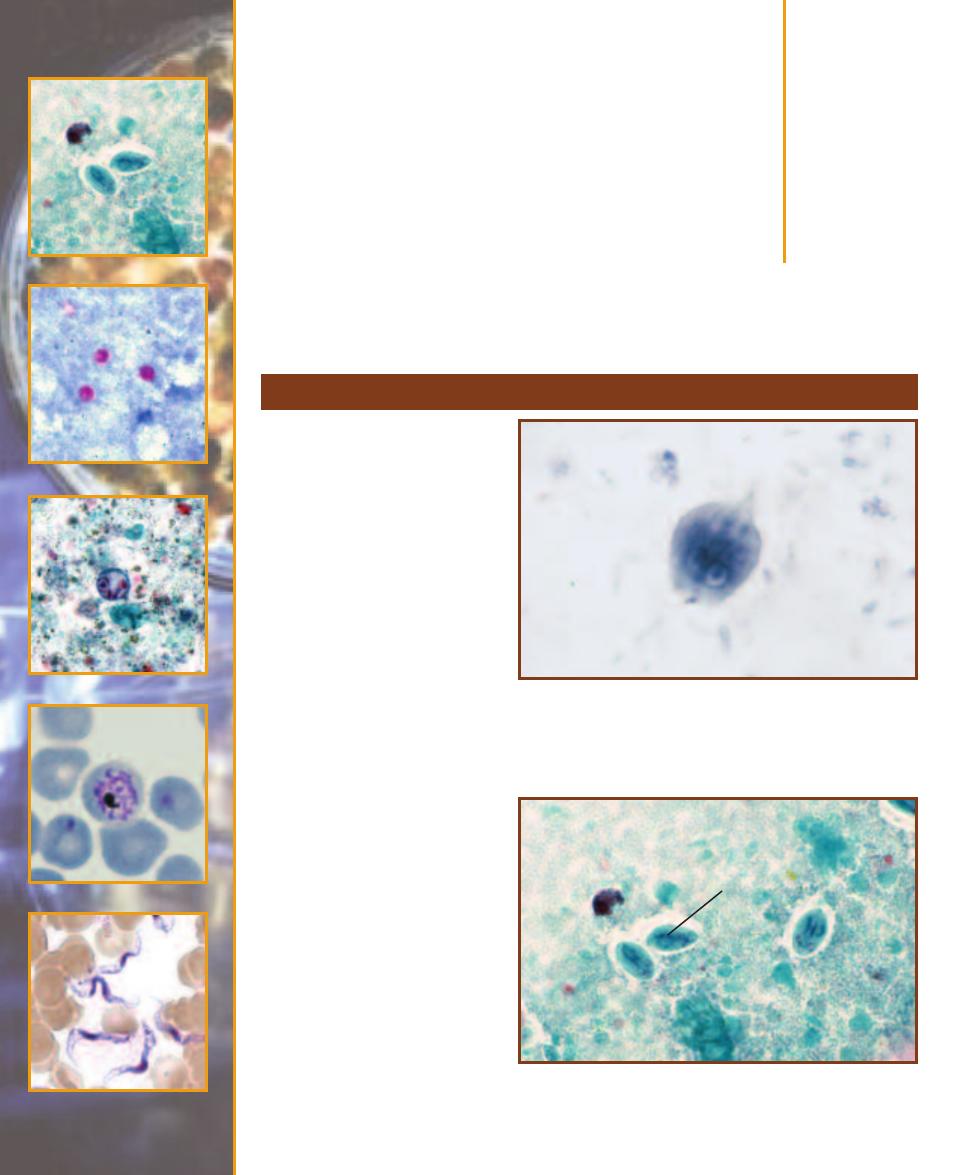
Protozoans of
Clinical Importance
Giardia lamblia
Giardiasis is caused by Giardia
lamblia (also known as Giardia
intestinalis), a diplomonad (page
169). It is most frequently seen in
the duodenum as a heart-shaped
vegetative trophozoite (Figure 16-1)
with four pairs of flagella and a
sucking disc that allows it to resist
gut peristalsis. Multi nucleate cysts
lacking flagella (Figures 16-2 and
14-2) are formed as the organism
passes through the colon. Cysts are
shed in the feces and may produce
infection of a new host upon in -
gestion. Transmission typically
involves fecally contaminated water
or food, but direct fecal-oral con-
tact transmission is also possible.
The organism attaches to epi -
thelial cells, but does not penetrate
to deeper tissues. Most infections
are asymptomatic. Chronic diarrhea,
dehydration, abdominal pain, and
other symptoms may occur if the
infection produces a large enough
population to involve a significant
surface area of the small intestine.
Diagnosis is made by identifying
trophozoites or cysts in stool
specimens. Serological tests are
also available to detect Giardia
antigens.
Group Excavata
16
S E C T I O N
193
16-1
G
IARDIA LAMBLIA
T
ROPHOZOITE
(I
RON
H
EMATOXYLIN
S
TAIN
)
Trophozoites have a long, tapering posterior end and range in size from
9–21 µm by 5–15 µm. There are two nuclei with small karyosomes. Two
median bodies are visible, but the four pairs of flagella are not.
16-2
G
IARDIA LAMBLIA
C
YST
(T
RICHROME
S
TAIN
)
Giardia cysts
are smaller than trophozoites (8–12 µm by 7–10 µm), but the four nuclei
with eccentric karyosomes and the median bodies (M) are still visible.
M
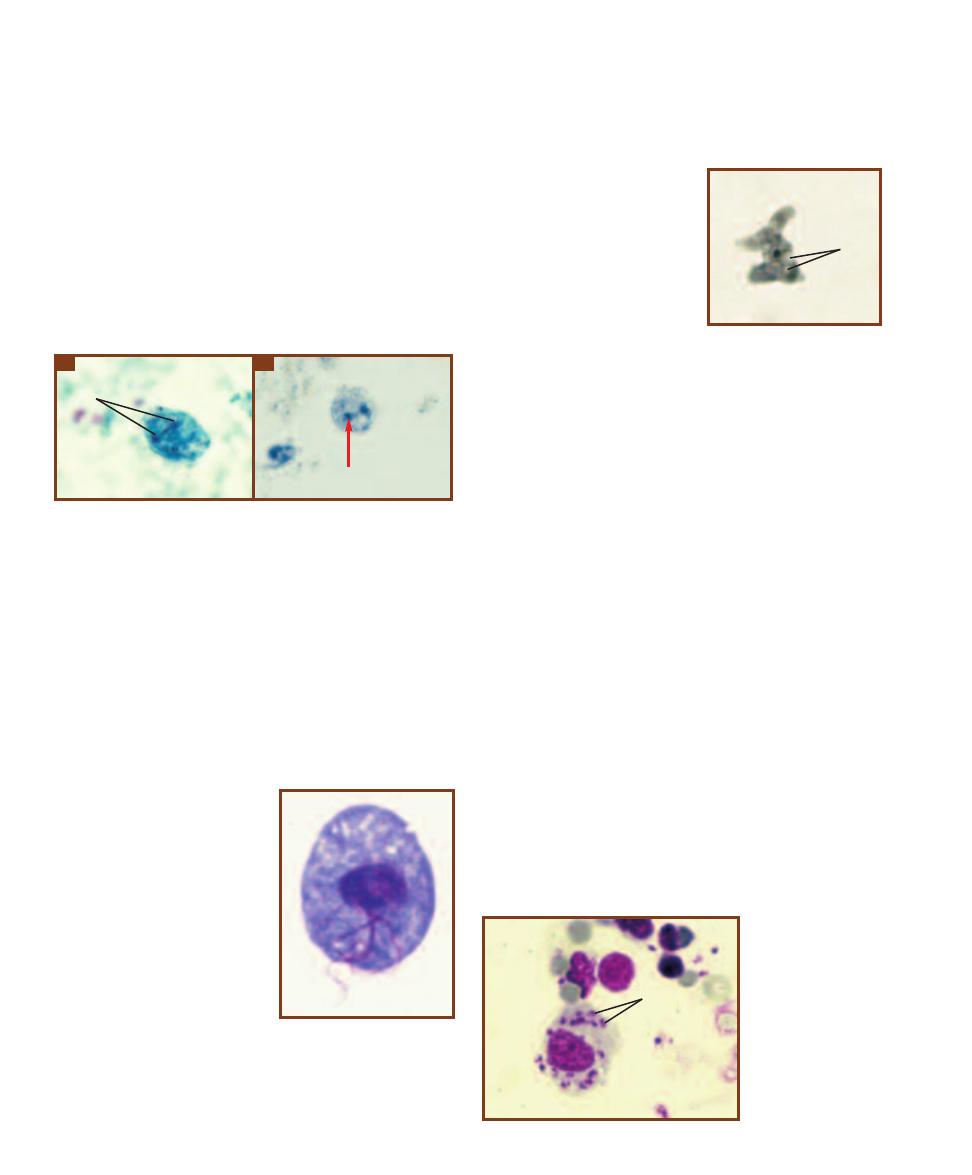
Dientamoeba fragilis
At one time, Dientamoeba fragilis was considered to be an
amoeba, but cytological evidence suggests it is better classified
as a parabasalid (page 169). Only the trophozoite (Figure
16-3) is known; no cyst form has been identified. The
trophozoite lives primarily in the cecum where it feeds on
the bacterial and yeast flora as well as cellular debris. It is
found in approximately 4% of humans and is being identi-
fied in stool samples more frequently. Typical symptoms in-
clude diarrhea, abdominal pain, and fatigue. The mode of
transmission is unclear, but there is evidence supporting the
idea that D. fragilis is transmitted in the eggs of parasitic
helminths, such as Enterobius vermicularis and Ascaris.
Trichomonas vaginalis
Trichomonas vaginalis (Figure 16-4), a parabasalid (page
169), is the causative agent of trichomoniasis (vulvovaginitis)
in humans. It has four anterior flagella and an undulating
membrane.
Trichomoniasis may affect both sexes, but is more com-
mon in females. T. vaginalis causes inflammation of genito -
urinary mucosal
surfaces— typically the vagina,
vulva, and cervix in females
and the urethra, prostate, and
seminal vesicles in males. Most
infections are asymptomatic
or mild. There may be some
erosion of surface tissues and
a discharge associated with in-
fection. The degree of infection
is affected by host factors,
especially the bacterial flora
present and the pH of the
mucosal surfaces. Trans -
mission typically is by sexual
intercourse.
The morphologically
similar nonpathogenic
Tricho monas tenax and T. hominis are residents of the oral
cavity and intestines, respectively.
Naegleria fowleri
Naegleria fowleri is a free-
living soil and water microbe
with an amoeboid stage (Fig-
ure 16-5), a cyst stage, and a
flagellated stage. Under the
proper conditions, it also is a
facultative parasite that causes
primary amebic meningo -
encephalitis (PAM). Infection is
most prevalent in children and
young adults. It probably oc-
curs when the individual forces
contaminated water containing
the protozoan up the nasal
passages (as in diving). The or-
ganisms travel up the olfactory
nerves into the cranial vault
where they multiply and digest the olfactory bulbs and
cerebral cortex. Symptoms occur about a week after infec-
tion and include fever, severe headache, and coma. Death
occurs within about a week from the onset of symptoms.
Leishmania donovani
Leishmania donovani, a kinetoplastid (page 170), actually
represents a number of geographically separate species and
subspecies that are difficult to distinguish morphologically.
All produce visceral leishmaniasis or kala-azar, a disease
found in tropical and subtropical regions. The pathogen
exists as a nonflagellated amastigote (Figure 16-6) in the
mammalian host (humans, dogs, and rodents) and as an
infective, motile promastigote in the sand fly vector (Figure
16-7). They are introduced into the mammalian host by
sand fly bites. Distribution of the disease is associated with
distribution of the appropriate sand fly vector.
Upon introduction into the host by the sand fly, the
organism is phagocytized by macrophages and converts to
the amastigote stage. Mitotic divisions result in filling of
194
䢇
A Photographic Atlas for the Microbiology Laboratory
16-3
D
IENTAMOEBA FRAGILIS
T
ROPHOZOITES
(I
RON
H
EMATOXYLIN
S
TAIN
)
Trophozoites are 5–12 µm in diameter. Most cells have two
nuclei (N), but many have only one. The nucleus contains a single
karyosome and the nuclear membrane is indistinct. The cytoplasm is
often vacuolated.
A
A typical trophozoite.
B
A trophozoite with a frag-
mented karyosome (arrow).
N
A
B
16-4
T
RICHOMONAS VAGI
-
NALIS
The trophozoite is the
only stage of the Trichomonas
life cycle. Several flagella are
visible. Cells range in size from
5–15 µm wide by 7–23 µm long.
16-5
N
AEGLERIA FOWLERI
T
ROPHOZOITE FROM
C
ULTURE
(I
RON
H
EMATOXYLIN
S
TAIN
)
Trophozoites are between
10–35 µm in size. Notice the
large karyosome within the
nucleus and the lobed pseudo -
pods. Vacuoles (V) are also
visible in the cytoplasm.
V
16-6
L
EISHMANIA
DONOVANI
A
MASTIG
-
OTES IN
S
PLEEN
T
ISSUE
Amastigotes (A) are 3–5
µm in size and multiply
within phagocytic cells
by binary fission.
Amastigotes are also
known as Leishman-
Donovan (L-D) bodies.
A
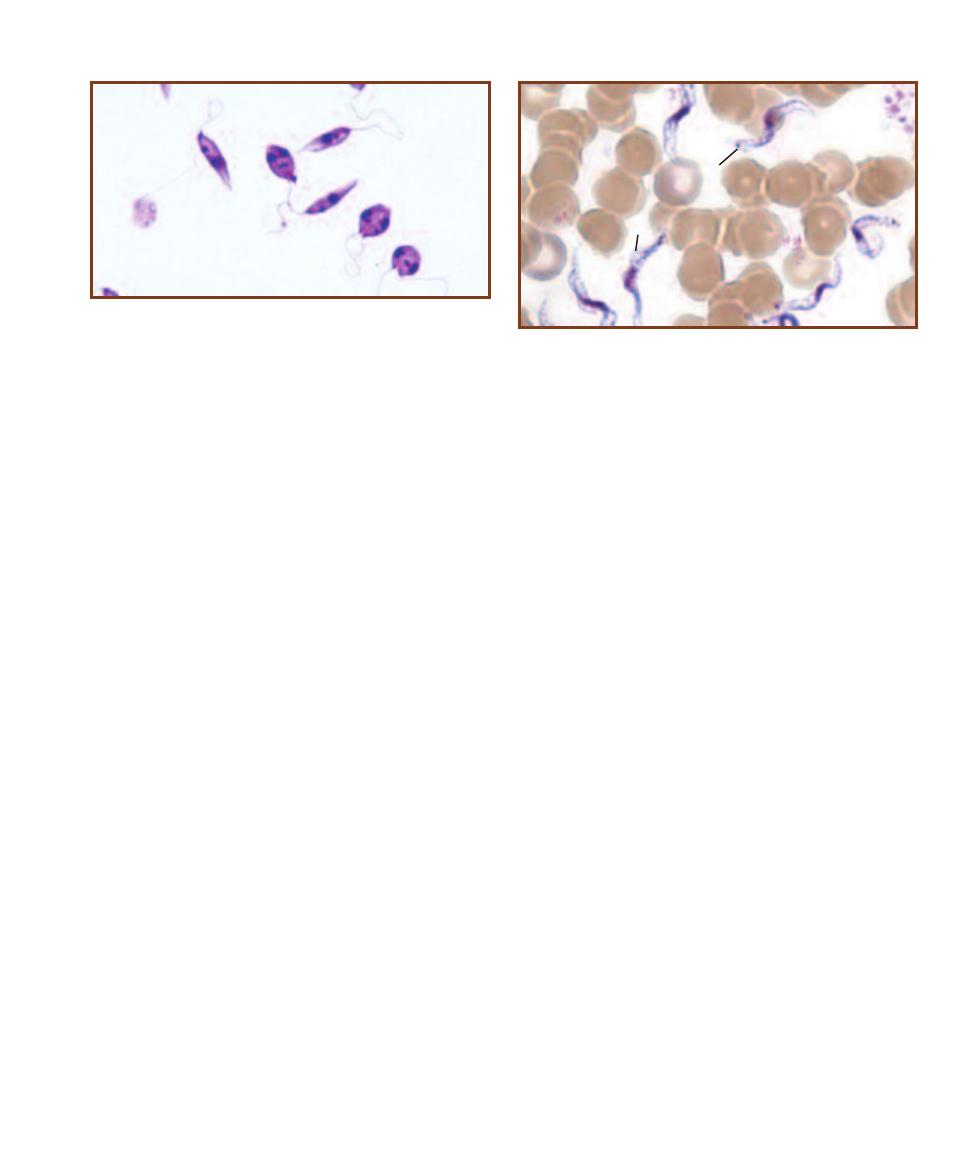
the macrophage, which bursts and releases the parasites.
Phagocytosis by other macrophages follows and the process
repeats. In this way, the organism spreads through much of
the reticuloendothelial system, including lymph nodes, liver,
spleen, and bone marrow. Kala-azar is a progressive disease
and is fatal if untreated.
Amastigotes in an infected host may be ingested by a
sand fly during a blood meal. Once inside the sand fly, they
develop into promastigotes and multiply. They eventually
occupy the fly’s buccal cavity where they can be transmitted
to a new mammalian host during a subsequent blood meal.
Transmission requires the vector and does not occur by
direct contact.
Leishmania tropica and L. major (both subgenus
Leishmania) in the Old World, and L. mexicana (subgenus
Leishmania) and L. braziliensis (subgenus Viannia) in the
New World cause cutaneous leishmaniasis, an infection of
skin and oral, nasal and pharyngeal mucous membranes.
In all cases, infection involves macrophages in the affected
region. Unlike L. donovani, all four may be transmitted by
direct contact with lesions or by sand fly bites.
Trypanosoma brucei
Trypanosoma brucei (Figure 16-8), a kinetoplastid (page
170), is a complex of flagellated microbes divided into
subspecies: T. brucei brucei (which is nonpathogenic), and
T. brucei gambiense and T. brucei rhodesiense, which
produce African trypanosomiasis, also known as African
sleeping sickness. The organisms are very similar morpho-
logically, but differ in geographic range and disease progress.
West African trypanosomiasis (caused by T. brucei gambiense)
is generally a mild, chronic disease that may last for years,
whereas East African trypanosomiasis (caused by T. brucei
rhodesiense ) is more acute and results in death within a
year. Modern molecular methods that compare proteins,
RNA, and DNA, are used to differentiate between them.
Trypanosomes have a complex life cycle. One stage of
the life cycle, the epimastigote, multiplies in an intermediate
host, the tsetse fly (genus Glossina). The infective trypomas -
tigote stage is then transmitted to the human host through
tsetse fly bites. Once introduced, trypomastigotes multiply
and produce a chancre at the site of the bite. They enter the
lymphatic system and spread through the blood, ultimately
to the heart and brain. Immune response to the pathogen is
hampered by the trypanosome’s ability to change surface
antigens faster than the immune system can produce appro-
priate antibodies. This antigenic variation also makes de -
velopment of a vaccine unlikely. Diagnosis is made from
clinical symptoms and identification of the trypomastigote
in patient specimens (e.g., blood, CSF, and chancre aspirate).
An ELISA (page 103) and indirect agglutination test (page
101) also have been developed to detect trypanosome anti-
gens in patient samples.
Progressive symptoms include headache, fever, and
anemia, followed by symptoms characteristic of the infected
sites. The sleeping sickness symptoms—sleepiness, emacia-
tion, and unconsciousness—begin when the central nervous
system becomes infected. Depending on the infecting strain,
the disease may last for months or years, but mortality rate
is high. Death results from heart failure, meningitis, or severe
debility of some other organ(s).
The infective cycle is complete when an infected individ-
ual (humans, cattle, and some wild animals are reservoirs)
is bitten by a tsetse fly, which ingests the organism during its
blood meal. It becomes infective for its lifespan.
Trypanosoma cruzi
Trypanosoma cruzi (Figure 16-9) causes American trypano -
somiasis (Chagas’ disease). Cone-nosed (“kissing”) bugs are
the insect vector. They transmit the infective trypomastigote
during a blood meal through their feces. Scratching intro-
duces the organism into the bite wound or conjunctiva. A
SECTION 16
䢇
Protozoans of Clinical Importance
䢇
195
16-7
L
EISHMANIA DONOVANI
P
ROMASTIGOTES
,
THE
I
NFECTIVE
S
TAGE
, O
BTAINED FROM A
C
ULTURE
Notice the anterior flagellum, the
kinetosome at its base, and the nucleus. The two cells at the lower right
are dividing.
16-8
T
RYPANOSOMA BRUCEI
T
RYPOMASTIGOTES IN A
B
LOOD
S
MEAR
The central nucleus, posterior kinetoplast (K), and undulating
membrane (
UM) are visible. Cells range in size from 1.5–3.5 µm wide by
14–33 µm long.
K
UM
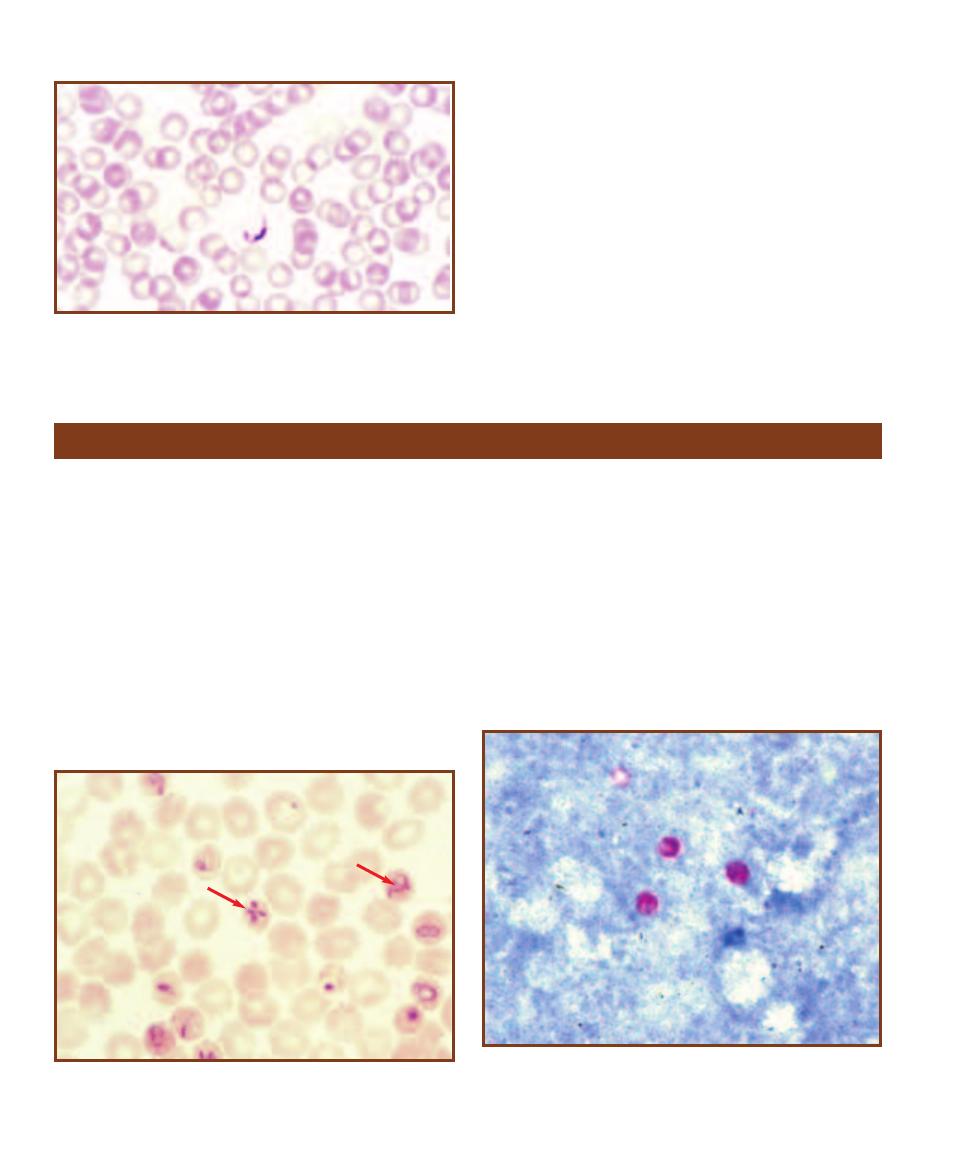
local lesion (chagoma) forms at the entry site and is accom-
panied by fever. Spreading occurs via lymphatics (producing
lymphadenitis) and trypomastigotes may be found in the
blood within a couple of weeks. Trypanosomes then become
localized in reticuloendothelial cells of the spleen, liver, and
bone marrow where they become amas tigotes and multiply
intracellularly. Infected individuals may infect the cone-nosed
bugs during a subsequent blood meal.
American trypanosomiasis occurs in South and Central
America. It may be fatal, mild, or asymptomatic in adults.
It is especially severe in children who often introduce the
trypanosome through the conjunctiva, leading to edema of
the eyelids and face of the affected side. The disease may
spread to the central nervous system or to the heart, causing
severe myocarditis.
196
䢇
A Photographic Atlas for the Microbiology Laboratory
16-9
T
RYPANOSOMA CRUZI IN A
B
LOOD
S
MEAR
The nucleus,
kinetoplast, and undulating membrane are visible. Cells in blood smears
are about 20 µm long and assume a “C” or “V” shape, as seen here.
Group Chromalveolata
Babesia microti
Babesia microti, an apicomplexan (page 170), is a blood
parasite found in the northeastern United States and other
parts of the world. Mice (genus Pero myscus) are the main
reservoir and the parasite is introduced into human hosts by
a bite from an infected tick (Ixodes dammini). The parasites
then infect RBCs and resemble young Plasmodium tropho-
zoites (Figure 16-10). Symptoms of babesiosis, which are
not easily distinguished from other diseases, appear in non-
splenectomized individ uals after about a week and include
malaise, fever, and generalized aches and pains. Other
species may be respon sible for producing a fulminant
hemolytic disease of immunosuppressed or splenectomized
patients. Diagnosis is by detection of parasites in the blood.
Cryptosporidium parvum
Cryptosporidium parvum is an apicomplexan (page 170)
parasite of intestinal micro villi and causes cryptosporidiosis.
Infection of immunocompetent individuals is usually self-
limiting, but infection of immuno compro mised patients
results in a long-term disease characterized by profuse,
watery diarrhea. Infective oocysts containing sporozoites
(Figure 16-11) are passed in the feces, so transmission is by
fecal-oral contact. Infection may also occur through contact
with infected animals. Diagnosis is made by finding acid-fast
oocysts in feces.
16-10
B
ABESIA MICROTI IN
H
UMAN
E
RYTHROCYTES
The ring forms
resemble Plasmodium falciparum (arrow 1), but are more variable in size,
never pigmented, and occasionally form a cross-like tetrad (arrow 2).
16-11
C
RYPTOSPORIDIUM PARVUM
O
OCYSTS FROM A
H
UMAN
F
ECAL
S
AMPLE
(M
ODIFIED
A
CID
-
FAST
S
TAIN
)
Oocysts contain sporo-
zoites (not visible) and are the infective stage. They are typically about
5 µm in diameter.
2
1
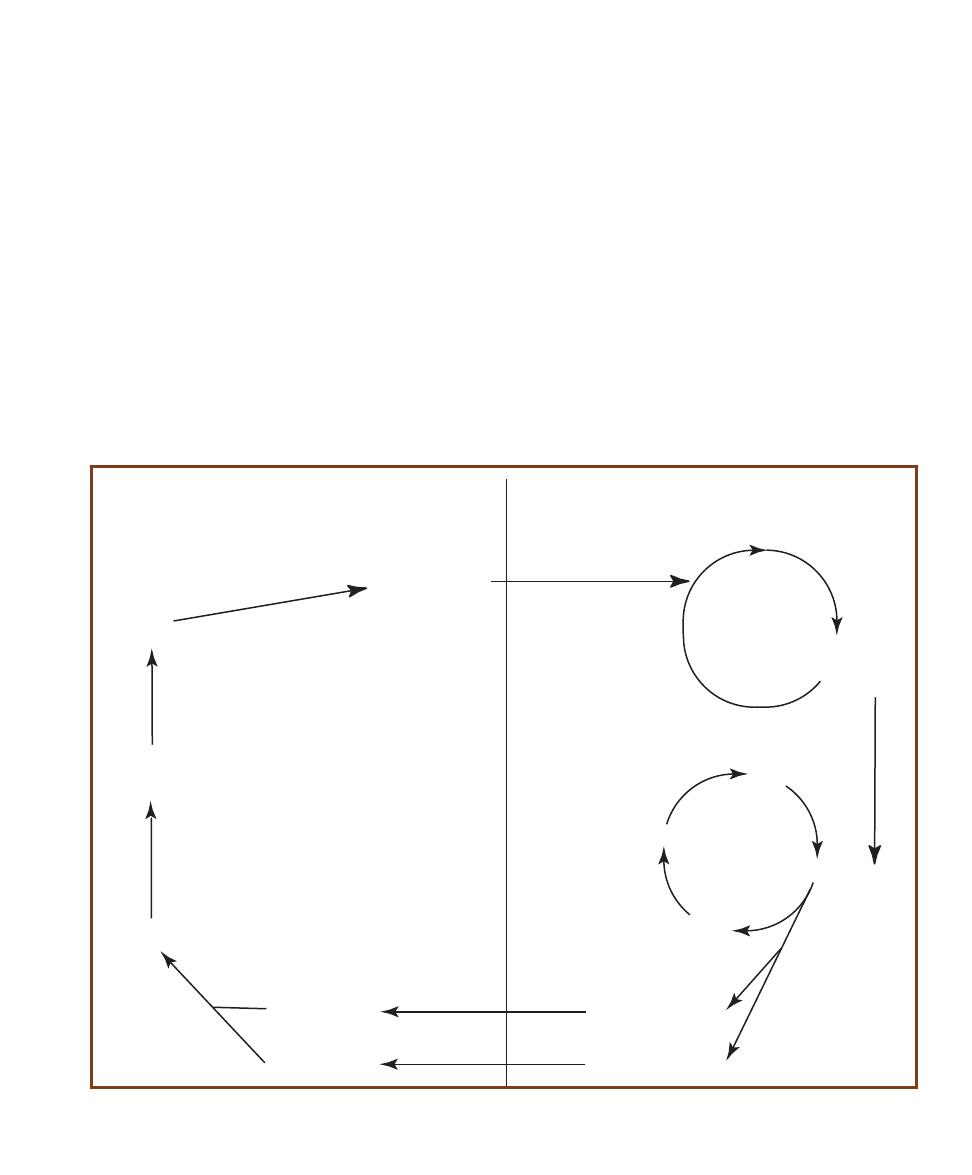
Plasmodium spp.
Plasmodia are apicomplexan parasites (page 170) with a
complex life cycle, part of which is in various vertebrate tis-
sues, while the other part involves an insect. In humans, the
tissues are the liver and red blood cells, while the insect vec-
tor is the female Anopheles mosquito. A gen eralized life
cycle is shown in Figure 16-12. Diagnostic life cycle stages
for the various species are shown in Figures 16-13 to 16-20.
There are four species of Plasmodium that cause malaria
in humans. These are P. vivax (benign tertian malaria), P.
malariae (quartan malaria), P. falciparum (malignant tertian
malaria), and P. ovale (ovale malaria). The life cycles are
similar for each species as is the progress of the disease, so
P. falciparum will be discussed as an example, with unique
aspects of the others mentioned.
The sporozoite stage of the pathogen is introduced
into a human host during a bite from an infected female
Anopheles mosquito. Sporozoites then infect liver cells
and produce the asexual merozoite stage. Merozoites are
released from lysed liver cells, enter the blood, and infect
erythrocytes. (Reinfection of the liver occurs at this stage in
all but P. falciparum infections.) Once in RBCs, merozoites
enter a cyclic pattern of reproduction in which more mero-
zoites are released from the red cells synchronously every
48 hours (hence tertian—every third day—malaria). These
events are tied to the symptoms of malaria. A chill, nausea,
vomiting, and headache are symptoms that correspond to
rupture of the RBCs. A spiking fever ensues and is followed
by a period of sweating. It is during this latter phase that the
parasites reinfect RBCs, and the cycle repeats.
The sexual phase of the life cycle begins when certain
merozoites enter erythrocytes and differentiate into male
or female gametocytes. The sexual life cycle continues when
gametocytes are ingested by a female Anopheles mosquito
during a blood meal. Fertilization occurs and the zygote
eventually develops into a cyst within the mosquito’s gut
SECTION 16
䢇
Protozoans of Clinical Importance
䢇
197
Sporozoites in
mosquito saliva
Merozoites
Erythrocytic
cycle in RBCs
Microgametocytes
Megagametocytes
must enter a mosquito
during a blood meal,
then mature into
Zygote
Cyst in mosquito
gut wall
Microgametes
Megagametes
Sporozoites
bursts to release
migrate to mosquito
salivary glands
injected into human, enter
blood and infect liver
Exoerythrocytic
cycle in liver
undergo
fertilization
and produce a
In Anopheles Mosquito
(Sexual Phase)
In Human
(Asexual Phase)
may become
undergoes many mitotic divisions
to produce a cyst containing
sporozoites
Merozoites
released by
liver
some
enter
blood
Ring Stage
Trophozoite
Schizont
divides and
ruptures
RBC
releasing
infect RBCs
infect liver
cells
may
become
16-12
P
LASMODIUM
L
IFE
C
YCLE
See the text for details.
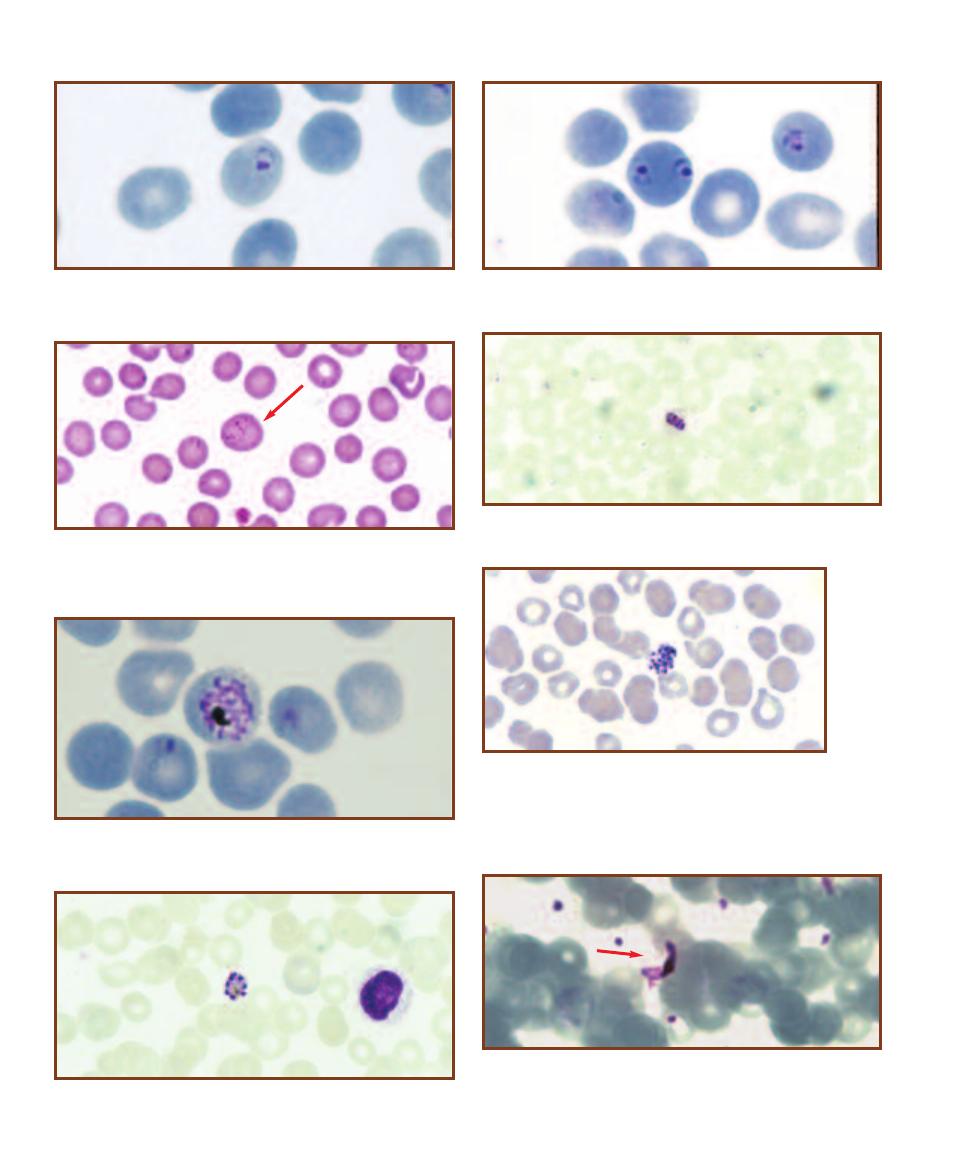
198
䢇
A Photographic Atlas for the Microbiology Laboratory
16-15
E
RYTHROCYTE
I
NFECTED WITH
P
LASMODIUM VIVAX
The
parasite is in the ring stage, and the RBC (arrow) exhibits characteristic
cytoplasmic Schüffner’s dots. Schüffner’s dots are also seen in RBCs
infected with P. ovale.
16-17
P
LASMODIUM FALCIPARUM
D
EVELOPING
S
CHIZONT IN
A
R
ED
B
LOOD
C
ELL
These are usually not seen in peripheral blood
smears since they reside in visceral capillaries.
16-18
A M
ATURE
P
LASMODIUM VIVAX
S
CHIZONT
C
OM
-
POSED OF
A
PPROXIMATELY
16 M
EROZOITES
More than 12
merozoites distinguishes P. vivax from P. malariae and P. ovale,
which both typically have eight, but up to 12. P. falciparum may
have up to 24 merozoites, but they are not typically seen in
peripheral blood smears and so are not confused with P. vivax.
16-13
P
LASMODIUM FALCIPARUM
R
ING
S
TAGE IN A
R
ED
B
LOOD
C
ELL
The ring stage is a young trophozoite. Note the chromatin dots in
the nucleus.
16-14
P
LASMODIUM FALCIPARUM
Double Infection of an RBC.
This is commonly seen in P. falciparum infections.
16-19
P
LASMODIUM MALARIAE
S
CHIZONT
The schizont has 8
merozoites in a distinctive rosette arrangement.
16-20
P
LASMODIUM FALCIPARUM
G
AMETOCYTE IN AN
E
RYTHRO
-
CYTE
Differentiation between microgametocytes and megagametocytes
is difficult in this species. The erythrocyte membrane is visible around
the gametocyte (arrow).
16-16
A B
AND
T
ROPHOZOITE OF
P
LASMODIUM MALARIAE
Older
trophpzoites of P. malariae may elongate to form a band.
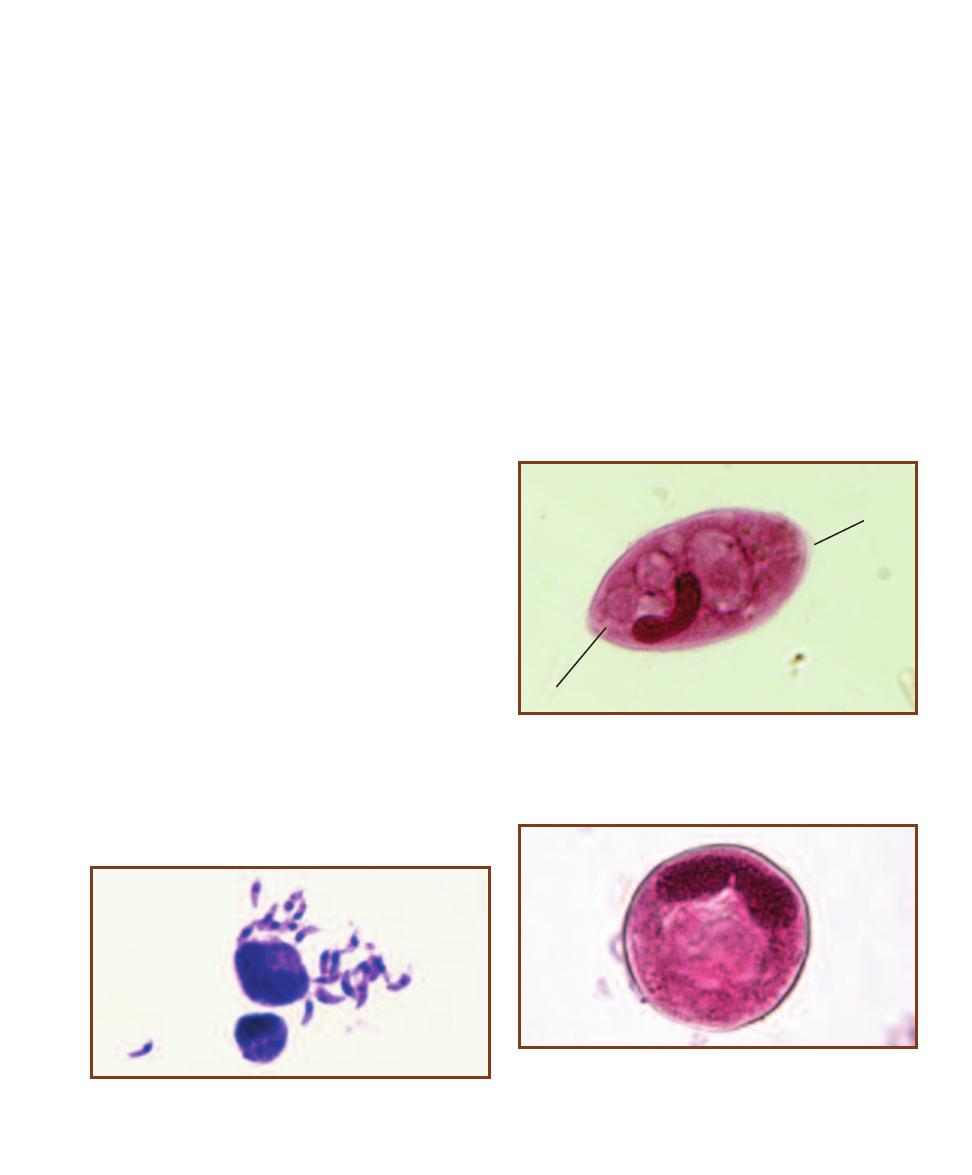
SECTION 16
䢇
Protozoans of Clinical Importance
䢇
199
wall. After many divisions, the cyst releases sporozoites,
some of which enter the mosquito’s salivary glands ready
to be transmitted back to the human host.
Most malarial infections eventually are cleared, but not
before the patient has developed anemia and has suffered
permanent damage to the spleen and liver. The most severe
infections involve P. falciparum. Erythrocytes infected by
P. falciparum develop abnormal projections that cause them
to adhere to the lining of small blood vessels. This can lead
to obstruction of the vessels, thrombosis, or local ischemia,
which account for many of the fatal complications of this
type of malaria—including liver, kidney, and brain damage.
Treatment includes antimalarial drugs and, in severe
cases, blood replacement. Prevention is a better alternative
and targets the mosquito vector. Draining standing water,
which serves as a mosquito breeding site, use of insect
repellant (Deet), mosquito NETS, and minimizing exposed
skin reduce the chance of infection.
Toxoplasma gondii
Like other apicomplexans (page 170), Toxoplasma gondii
(Figure 16-21) has sexual and asexual phases in its life cycle.
The sexual phase occurs in the lining of cat intestines where
oocysts are produced and shed in the feces. Each oocyst
undergoes division and contains 8 sporozoites. If ingested
by another cat, the sexual cycle may be repeated as the
sporozoites produce gametocytes, which in turn produce
gametes. If ingested by another animal host (including
humans) the oocyst germinates in the duodenum and releases
the sporozoites. Sporozoites enter the blood and infect other
tissues where they become trophozoites, which continue to
divide and spread the infection to lymph nodes and other
parts of the reticulo endothelial system. Trophozoites ingested
by a cat eating an infected animal develop into gametocytes
in the cat’s intestines. Gametes are formed, fertilization pro-
duces an oocyst, and the life cycle is completed.
Infection via ingestion of the oocyst typically is not
serious. The patient may notice fatigue or muscle aches. The
more serious form of the disease involves infection of a fetus
across the placenta from an infected mother. This type of
infection may result in stillbirth, liver damage, or brain
damage. AIDS patients may also suffer fatal complications
from infection.
Diagnosis is made by using molecular probes, a variety
of serological tests, and by examining histologic preparations.
Balantidium coli
Balantidium coli, a ciliate (page 171) is the causative agent
of balantidiasis and exists in two forms: a vegetative tropho-
zoite (Figure 16-22) and a cyst (Figure 16-23). Laboratory
diagnosis is made by identification of either the cyst or
trophozoite in feces, with the latter being more commonly
found.
The trophozoite is highly motile due to the cilia and has
a macro- and a micronucleus. Cysts in sewage-contaminated
water are the infective form. Trophozoites may cause ulcera-
tions of the colon mucosa, but not to the extent produced
16-21
T
OXOPLASMA GONDII
T
ROPHOZOITES
(T
ACHYZOITES
)
Notice the bow-shaped cells and the prominent nuclei.
16-23
B
ALANTIDIUM COLI
C
YST
Cysts are usually spherical and
have a diameter in the range of 50–75 µm. There is a cyst wall and the
cilia are absent. As in the trophozoite, the macronucleus is prominent,
but the micronucleus may not be.
16-22
B
ALANTIDIUM COLI
T
ROPHOZOITE
Trophozoites are oval in
shape and have dimensions of 50–100 µm long by 40–70 µm wide. Cilia
(C) cover the cell surface. Internally, the macronucleus is prominent;
the adjacent micronucleus is not. An anterior cytostome (Cy) is usually
visible.
C
Cy
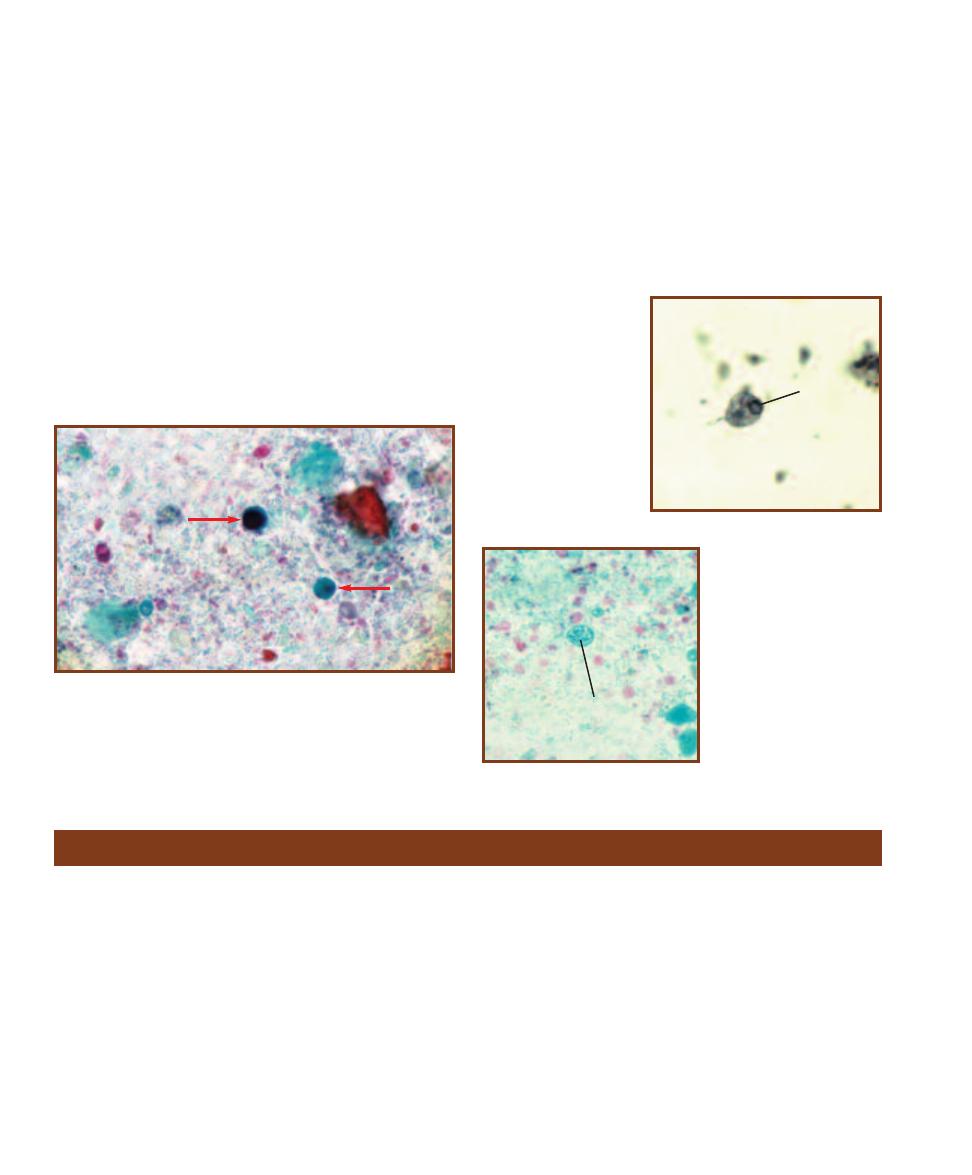
by Entamoeba histolytica. Symptoms of acute infection are
bloody and mucoid feces. Diarrhea alternating with consti-
pation may occur in chronic infections. Most infections are
probably asymptomatic.
Blastocystis hominis
Blastocystis hominis is a heterokont (page 171) commensal
microbe that occupies the large intestine of up to 20% of
the popu lation. In most cases, patients with B. hominis
show no symptoms, but in some it appears responsible for
symptoms such as fever, nausea, diarrhea, and abdominal
cramps. The fecal-oral route of transmission is responsible
for its spread. Identifi cation is made by finding the central
body form (Figure 16-24) in a stool sample and by detecting
antibodies with ELISA (page 103) or fluorescent antibody
tests (page 105).
Chilomastix mesnili
Chilomastix mesnili is a heterokont (page 171) most com-
monly found in warmer climates, but can be found most
anywhere. It exists as a trophozoite and a cyst (Figures 16-25
and 16-26). Both may be found in stool samples and are
used in identifying infection by this nonpathogen. It typically
lives in the cecum and large intestine as a commensal, but
may be indicative of infection by other parasites. Infection
occurs through ingestion of cysts.
200
䢇
A Photographic Atlas for the Microbiology Laboratory
16-24
B
LASTOCYSTIS HOMINIS
T
ROPHOZOITES
(T
RICHROME
S
TAIN
)
Trophozoites vary greatly in size over the range of 6–40 µm. A
large central body surrounded by several small nuclei is distinctive of
the trophozoite. Staining properties also may vary, as shown in these
two specimens (arrows).
16-25
C
HILOMASTIX
MESNILI
T
ROPHOZOITE
(I
RON
H
EMATOXYLIN
S
TAIN
)
Trophozoites are elongated
with a tapering posterior and
a blunt anterior end that
holds the nucleus (
N). The
dimensions are 6–20 µm
long by 5–7 µm wide. There
are four flagella: three at the
anterior end (which may be
difficult to see) and one as-
sociated with the prominent
cytostome.
N
16-26
C
HILOMASTIX
MESNILI
C
YST
(T
RICHROME
S
TAIN
)
Cysts are lemon-
shaped, often with an anterior
knob, and are 6–10 µm long.
The nucleus may be difficult to
see. A distinctive “shepherd’s
crook” (S) associated with the
cytostome is also visible.
S
Group Unikonta
Entamoeba histolytica
Entamoeba histolytica, an amoebozoan (page 176), is the
causative agent of amoebic dysentery (amebiasis), a disease
most common in areas with poor sanitation. Identification
is made by finding either trophozoites (Figure 16-27) or
cysts (Figure 16-28) in a stool sample. The diagnostic
features of each are described in the captions.
Infection occurs when a human host ingests cysts, either
through fecal-oral contact or more typically, contaminated
food or water. Cysts (but not trophozoites) are able to
withstand the acidic environment of the stomach. Upon
entering the less acidic small intestine, the cysts undergo
excystation. Mitosis produces eight small trophozoites from
each cyst.
The trophozoites parasitize the mucosa and submucosa
of the colon causing ulcerations. They feed on red blood
cells and bacteria. The extent of damage determines whether
the disease is acute, chronic, or asymptomatic. In the most
severe cases, infection may extend to other organs, especially
the liver, lungs, or brain. Abdominal pain, diarrhea, blood
and mucus in feces, nausea, vomiting, and hepatitis are
among the symptoms of amebic dysentery.
Initially uninucleate, mitosis produces the mature
quadranucleate cyst. These are shed in the feces and are
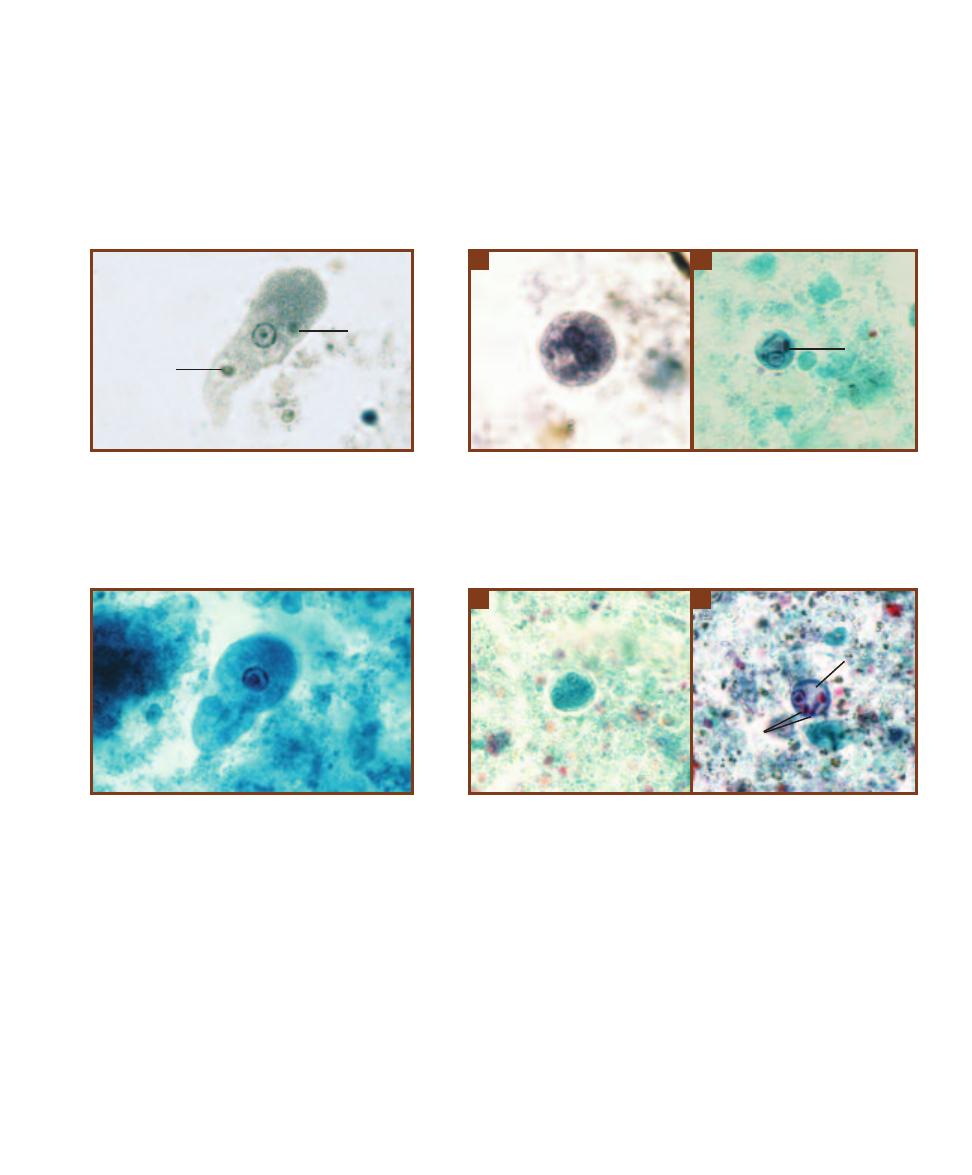
infective. They may also persist in the original host resulting
in an asymptomatic carrier—a major source of contamina-
tion and infection.
Other members of the genus Entamoeba deserve mention
here. Entamoeba hartmanni resembles E. histolytica, but
is nonpathogenic and has smaller trophozoites and cysts.
Entamoeba coli is a fairly common, nonpathogenic intestinal
commensal that must be differentiated from E. histolytica
in stool samples. Its characteristic features are given in the
captions to Figures 16-29 and 16-30. Entamoeba dispar
comprises nonpathogenic strains of E. histolytica and is
morphologically indistinguishable from it. Molecular
methods, such as protein electrophoresis, and rRNA and
DNA comparisons, are used for identification.
SECTION 16
䢇
Protozoans of Clinical Importance
䢇
201
16-27
E
NTAMOEBA HISTOLYTICA
T
ROPHOZOITE
(I
RON
H
EMATOXYLIN
S
TAIN
)
Trophozoites range in size
from 12–60 µm. Notice the small, central karyosome, the
beaded chromatin at the nucleus’ margin, the ingested red
blood cells (RBC), and the finely granular cytoplasm.Com-
pare with an Entamoeba coli trophozoite in Figure 16-29.
RBC
16-28
E
NTAMOEBA HISTOLYTICA
C
YSTS
A
Cysts are spherical with a diam-
eter of 10–20 µm. Two of the four nuclei are visible; other nuclear characteristics
are as in the trophozoite. Compare with an Entamoeba coli cyst in Figure 16-30
(iron hematoxylin stain).
B
E. histolytica cyst (trichrome stain) with cytoplasmic
chromatoidal bars (CB). These are found in approximately 10% of the cysts, have
blunt ends, and are composed of ribonucleoprotein.
A
B
CB
16-29
E
NTAMOEBA COLI
T
ROPHOZOITE
(T
RICHROME
S
TAIN
)
Trophozoites have a size range of 15–50 µm.
Notice the relatively large and eccentrically positioned
karyosome, the unclumped chromatin at the nucleus’
periphery, and the vacuolated cytoplasm lacking ingested
RBCs. The usually nonpathogenic E. coli must be distin-
guished from the potentially pathogenic E. histolytica, so
compare with Figure 16-27.
16-30
E
NTAMOEBA COLI
C
YSTS
Cysts are typically spherical and are
between 10–35 µm in diameter. They contain 8, or sometimes 16 nuclei. This
makes differentiation from E. histolytica cysts simpler, because they never have
more than 4 nuclei.
A
Five nuclei are visible in this specimen (trichrome stain).
B
Chromatoidal bars (CB) and a large glycogen vacuole (GV) characteristic of
immature cysts are visible in this specimen (trichrome stain).
A
B
CB
GV
RBC
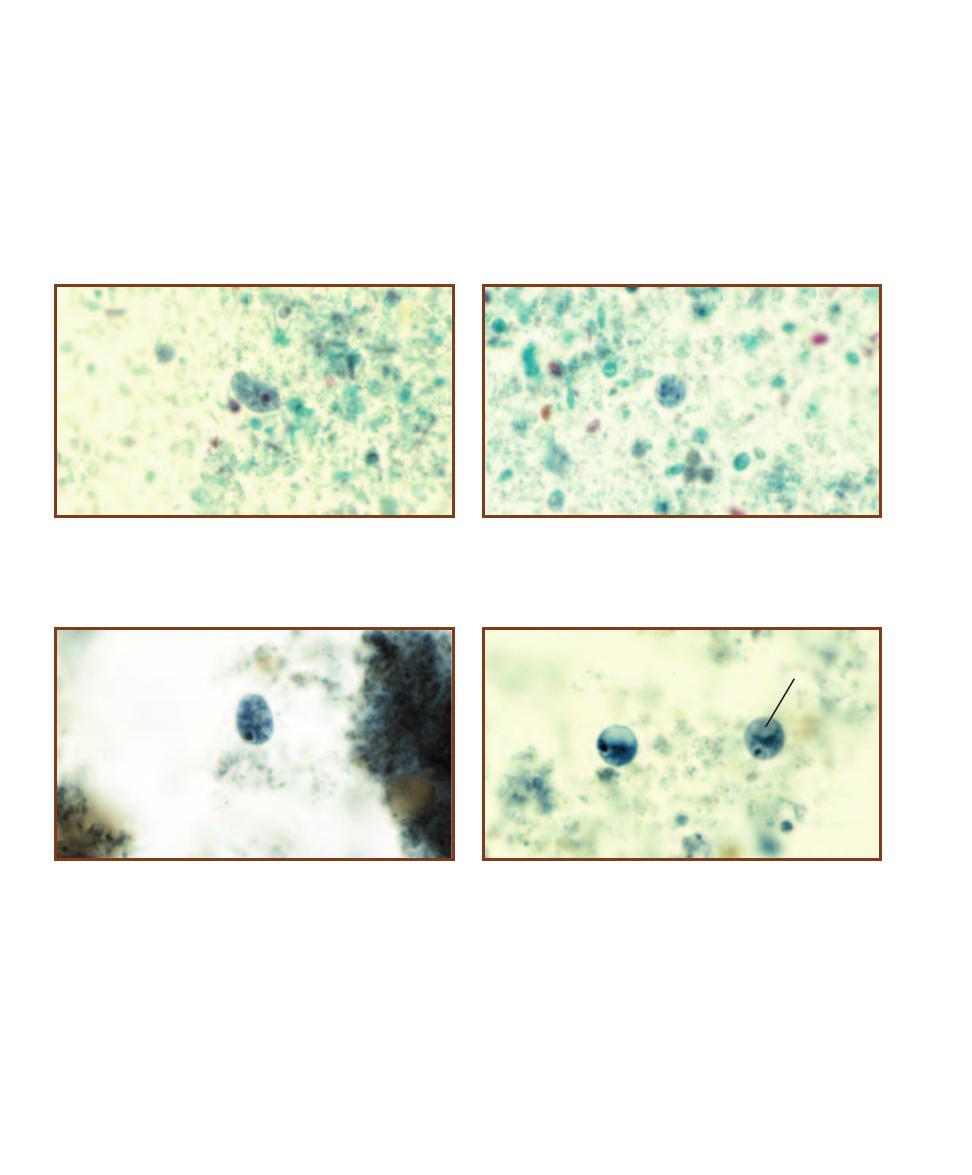
Endolimax nana
Endolimax nana is a fairly common commensal amoebozoan
(page 176) that resides mainly in the cecum of humans. It
exists as a trophozoite and cyst (Figures 16-31 and 16-32)
and its life cycle resembles that of Entamoeba histolytica.
Infection occurs by ingestion of cysts in fecally contaminated
food or water. Identification is made by finding the tropho-
zoites and/or cysts in stool samples.
Iodamoeba bütschlii
Iodamoeba bütschlii is less commonly found in humans than
other amoebozoans, Entamoeba coli or Endolimax nana,
but when present, it lives in the cecum and feeds on the
other resident organisms. Trans mission is by fecal contami-
nation, but it is nonpathogenic. Laboratory diagnosis is done
by identifying trophozo ites and/or cysts (Figures 16-33 and
16-34) in stool specimens. Distinguishing characteristics are
given in the captions.
202
䢇
A Photographic Atlas for the Microbiology Laboratory
16-31
E
NDOLIMAX NANA
T
ROPHOZOITE
(T
RICHROME
S
TAIN
)
Trophozoites are small, with a size range of 6–15 µm. Notice the large
karyosome filling the majority of the nuclear space as well as the
absence of peripheral chromatin.
16-32
E
NDOLIMAX NANA
C
YST
(T
RICHROME
S
TAIN
)
E. nana cysts
range in size from 5–14 µm. There are typically four nuclei, with each
having the distinctive large karyosome.
16-33
I
ODAMOEBA BÜTSCHLII
T
ROPHOZOITE
(I
RON
H
EMATOXYLIN
S
TAIN
)
I. bütschlii trophozoites are 6–15 µm in size. The nucleus has
a large karyosome, but lacks peripheral chromatin. On occasion,
fine karyosome strands may be observed radiating outward from the
karyosome to the nuclear membrane.
16-34
I
ODAMOEBA BÜTSCHLII
C
YSTS
(I
RON
H
EMATOXYLIN
S
TAIN
)
Cysts of I. bütschlii range in size from 6–15 µm. The single nucleus has a
large karyosome and no peripheral chromatin. A glycogen vacuole (GV)
is typically found in these cysts.
GV
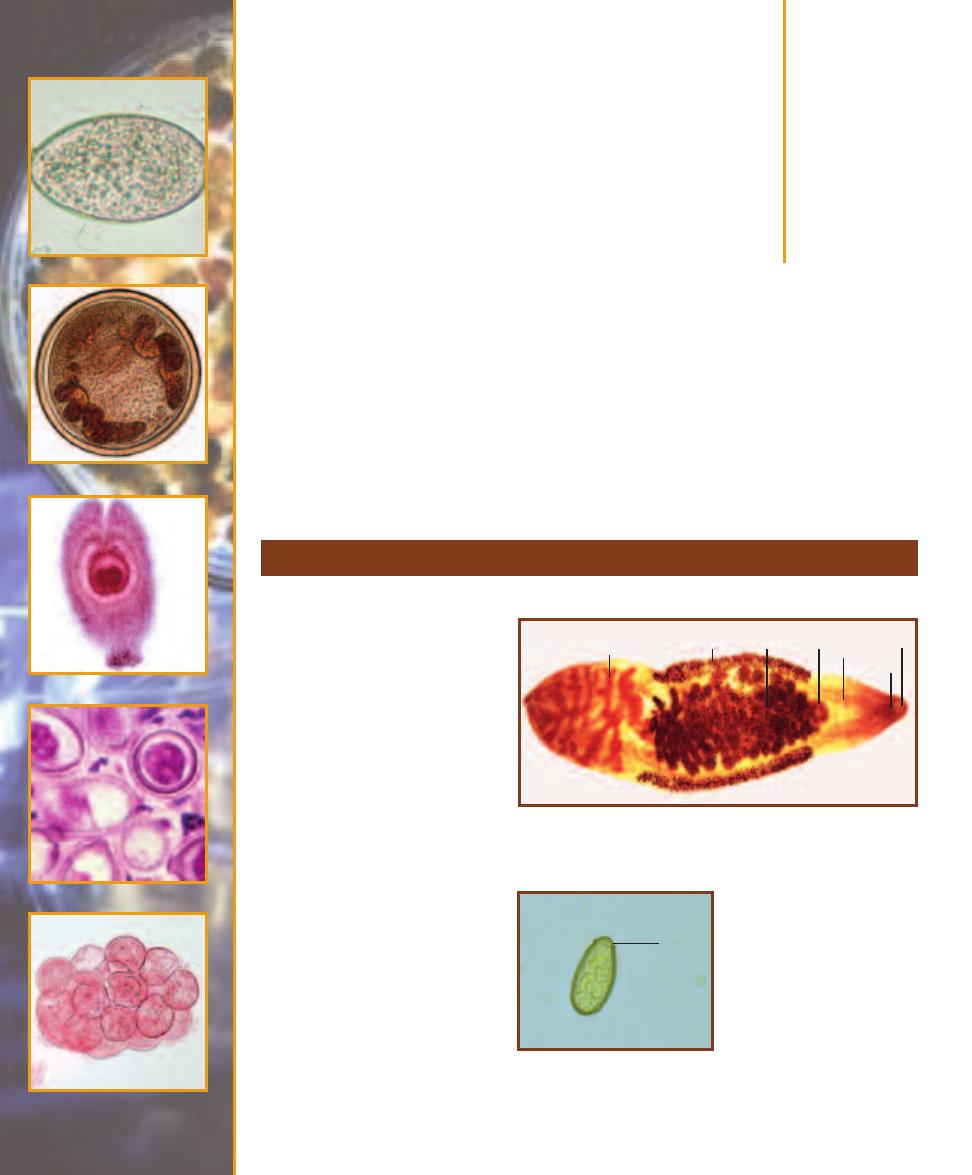
Parasitic
Helminths
A study of helminths is appropriate to the microbiology lab because clinical specimens may contain
microscopic evidence of helminth infection. The three major groups of parasitic worms encountered
in lab situations are trematodes (flukes), cestodes (tapeworms), and nematodes (round worms).
Life cycles of the parasitic worms are often complex, sometimes involving several hosts, and are
beyond the scope of this book. Emphasis here is on a brief background and clinically important
diagnostic features of each worm.
Trematode Parasites Found in Clinical Specimens
17
S E C T I O N
203
Clonorchis (Opisthorchis) sinensis
C. sinensis is the oriental liver
fluke (Figure 17-1) and causes
clonorchiasis, a liver disease. It is a
common parasite of people living
in Japan, Korea, Vietnam, China,
and Taiwan and is becoming more
common in the United States with
the influx of Southeast Asian
immigrants. Infection typically
occurs when undercooked infected
fish is ingested. The adults migrate
to the liver bile ducts and begin
laying eggs in approximately one
month. Degree of damage to the
bile duct epithelium and surround-
ing liver tissue corresponds with the
number of worms and the duration
of infection. Diagnosis is made by
identifying the characteristic eggs
in feces (Figure 17-2).
17-1
C
LONORCHIS SINENSIS
A
DULT
Adults range in size from 1–2.5 cm.
Visible in this specimen are the oral sucker (OS), mouth (M), intestinal
ceca (IC), ventral sucker (VS), uterus (U), vitellaria (V), and testis (T).
T
V
U
VS
IC
OS
M
17-2
C
LONORCHIS SINENSIS
E
GG IN A
F
ECAL
S
PECIMEN
(D’A
NTONI
’
S
I
ODINE
S
TAIN
)
The eggs are thick shelled and
between 27 and 35 µm long. There
is a distinctive operculum (O)
(positioned to give the appear ance
of shoulders) and often a knob at
the aboperular end (not visible in
this specimen).
O
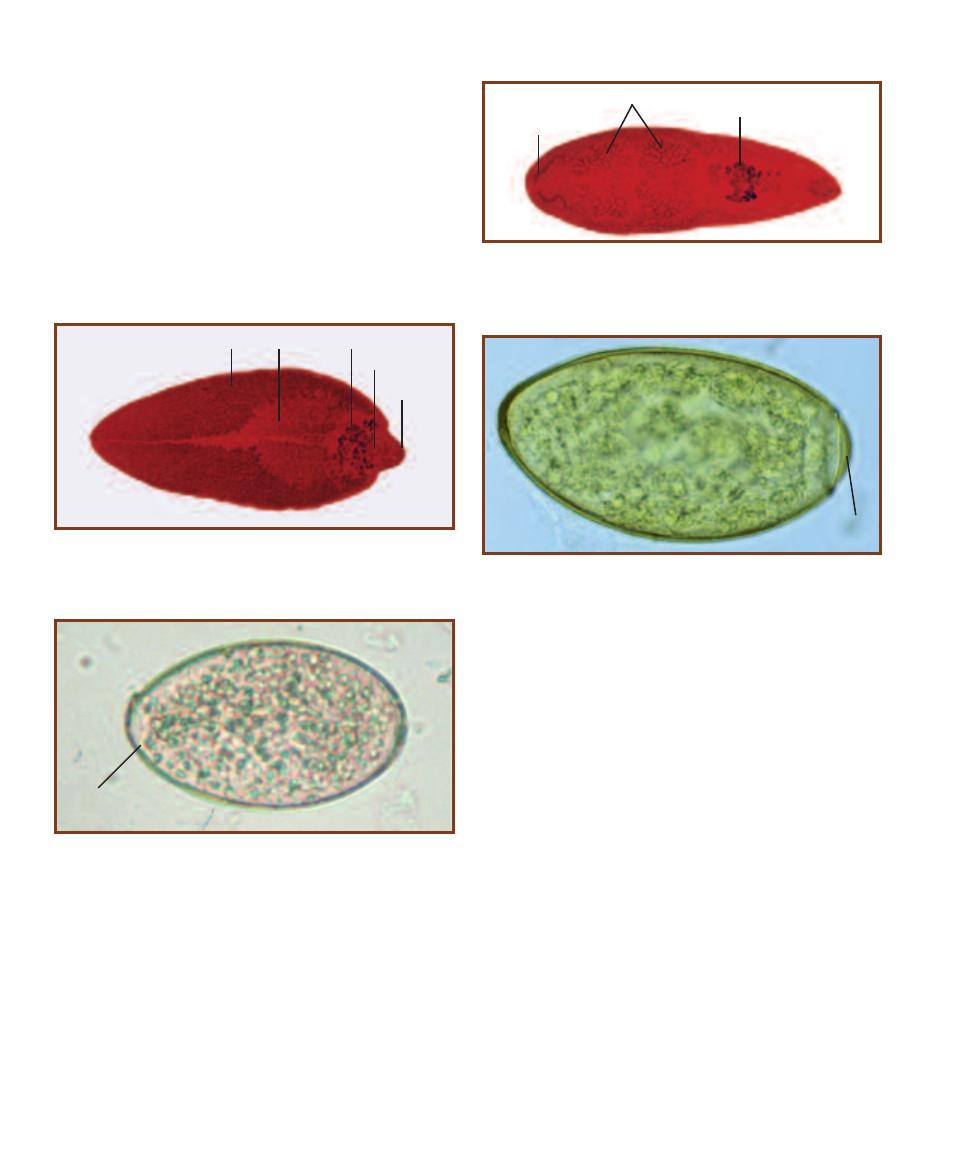
Fasciola hepatica
F. hepatica (Figure 17-3) is a liver fluke commonly associ ated
with domestic sheep and cattle. Human infection results
when juvenile worms attached to aquatic vegetation are
ingested. Penetration of the intestine and subsequently the
liver by metacercaria leads the juveniles to the bile ducts
where they develop into adults. Migration by the juveniles
damages the liver; adults damage the bile ducts, gall bladder,
and liver, resulting in cirrhosis, jaundice, or in severe cases,
abscesses. Diagnosis is made by identification of eggs in
feces (Figure 17-4).
Fasciolopsis buski
F. buski (Figure 17-5) is common in central and southeast
Asia where it infects humans and pigs. Its life cycle is similar
to Fasciola hepatica, but differs in that its site of infection is
the small intestine, not the liver. Consequences of infection
include inflammation of the intestinal wall and obstruction
of the gut if the worms are numerous. Chronic infections
lead to ulceration, bleeding, diarrhea, and abscesses of the
intestinal wall. Metabolites from the worm may sensitize the
host, which may cause death. Diagnosis is made by identifi-
cation of the eggs (up to 25,000 per day per worm!) in fecal
samples (Figure 17-6).
Paragonimus westermani
P. westermani (Figure 17-7) is a lung fluke and one of
several species to cause paragonimiasis, a disease mostly
found in Asia, Africa, and South America. P. westermani is
primarily a parasite of carnivores, but humans (omnivores)
may get infected when eating undercooked crabs or crayfish
infected with the cysts containing juveniles (Figure 17-8).
Ingested juveniles (metacercaria) excyst in the duodenum
and travel to the abdominal wall. After several days, they
resume their journey and find their way to the bronchioles
where the adults mature. Eggs (Figure 17-9) are released in
approximately two to three months and are diagnostic of
infection. They may be recovered in sputum, lung fluids, or
feces. Consequences of lung infection are a local inflamma-
tory response followed by possible ulceration. Symptoms
include cough with discolored or bloody sputum and diffi-
culty breathing. These cases are rarely fatal, but may last a
couple of decades. Occasionally, the wandering juveniles
end up in other tissues, such as the brain or spinal cord,
which can cause paralysis or death.
204
䢇
A Photographic Atlas for the Microbiology Laboratory
17-3
F
ASCIOLA HEPATICA
A
DULT
Adults are leaf shaped with a
conical anterior end. They are about 3 cm long by 1 cm in width. In this
specimen, the oral sucker (OS), ventral sucker (VS), ovary (O), testis (T),
and vitellaria (V) are visible.
17-4
F
ASCIOLA HEPATICA
E
GG IN A
F
ECAL
S
PECIMEN
(D’A
NTONI
’
S
I
ODINE
S
TAIN
)
The large eggs (130–150 µm long by 60–90 µm wide) are
unembryonated in fecal samples and have an inconspicuous operculum
(O). These eggs are difficult to distinguish from Fasciolopsis buski.
O
V
T
O
VS
OS
17-5
F
ASCIOLOPSIS BUSKI
A
DULT
Adults are up to 7.5 cm long and
2 cm wide. The unbranched intestinal ceca (
IC), uterus (U), and highly
branched testes (
T) are visible in this preparation. F. buski lacks the
anterior conical region of Fasciola hepatica.
IC
U
T
17-6
F
ASCIOLOPSIS BUSKI
E
GG IN A
F
ECAL
S
PECIMEN
(D’A
NTONI
’
S
I
ODINE
S
TAIN
)
These eggs are very similar to those of Fasciola hepatica,
but are smooth on the abopercular end. They range in size from 130–140
µm long by 80–85 µm wide. Note the prominent operculum (O).
O
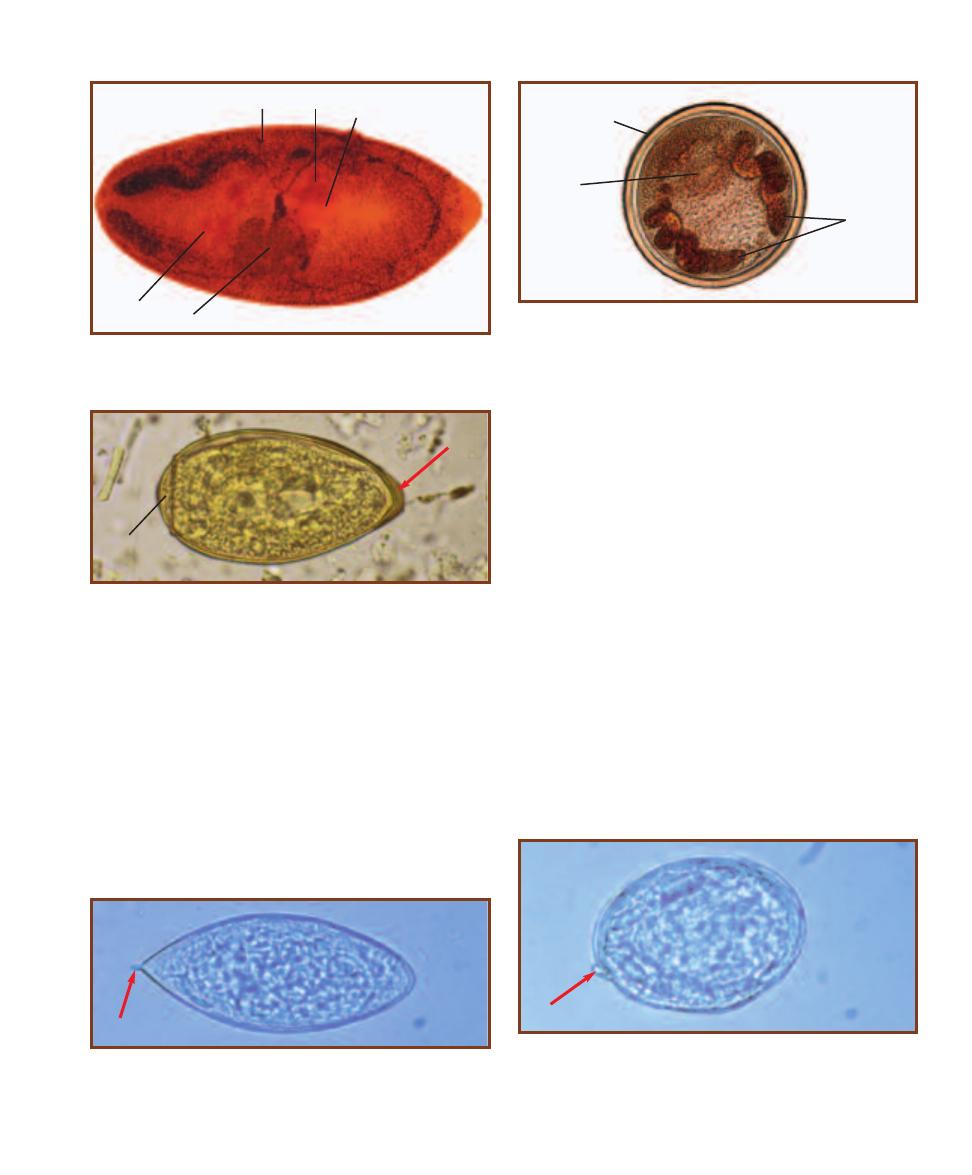
Schistosoma haematobium
S. haematobium is an African and Middle Eastern blood
fluke that causes urinary schistosomiasis. Infection occurs
via contact with fecally contaminated water containing
cercariae which penetrate the skin, enter circulation, and
continue development in the liver. No metacercaria stage
is seen. After about three weeks in the liver, adult worms,
which have separate sexes, colonize the veins associated with
the urinary bladder and begin to lay eggs (Figure 17-10).
Some eggs pass through the wall of the vein and then the
bladder to be passed out in urine, but a majority of them
become trapped in the wall and initiate a build-up of fibrous
tissue as well as an immune response. Symptoms of the
disease include hematuria and painful urination. There is
also a high probability of developing bladder cancer. If there
is a high parasite load and the infection is chronic, other
parts of the genitourinary system may become involved.
Diagnosis is by finding eggs in urine or feces.
Schistosoma japonicum
S. japonicum is a Southeast Asian blood fluke. It has a life
cycle similar to S. haematobium, but the adults reside in
veins of the small intestine. Adults produce eggs (Figure
17-11) that penetrate the intestine and pass out with the
feces. Presence of eggs in the feces indicates infection. Some
patients are asymptomatic, whereas others have bloody
diarrhea, abdominal pain, and lethargy. In some cases, eggs
reach the brain and the infection may be fatal.
SECTION 17
䢇
Parasitic Helminths
䢇
205
17-7
P
ARAGONIMUS WESTERMANI
A
DULT
Adults are up to 1.2 cm
long, 0.6 cm wide, and 0.5 cm thick. Visible in this specimen are the
ventral sucker (
VS), ovary (O), uterus (U), testis (T), and vitellaria (V).
T
U
V
O
VS
17-8
P
ARAGONIMUS WESTERMANI
C
YST
The cyst stage, which is
found in crabs or crayfish, contains a living metacercaria. Once the ver-
tebrate host eats the crab or crayfish, the juvenile fluke is released from
the cyst where it begins its migration from the intestines to the lungs.
Prominent in this cyst are the ventral sucker (VS), intestinal ceca (IC),
and thick cyst wall (CW).
CW
VS
IC
17-9
P
ARAGONIMUS WESTERMANI
E
GG IN A
F
ECAL
S
PECIMEN
(D’A
NTONI
’
S
I
ODINE
S
TAIN
)
P. westermani eggs are ovoid and range in
size from 80–120 µm long by 45–70 µm wide. They have an operculum
(O) and the shell is especially thick at the abopercular end (arrow). They
are unembryonated when seen in feces.
O
17-10
S
CHISTOSOMA HAEMATOBIUM
E
GG IN A
U
RINE
S
PECIMEN
S. haematobium eggs are large (112–170 µm long by 40–70 µm wide),
thin-shelled, and lack an operculum. There is a distinctive terminal spine
(arrow). Each egg contains a larva called a miracidium.
17-11
S
CHISTOSOMA JAPONICUM
E
GG IN A
F
ECAL
S
PECIMEN
S. japonicum eggs are thin-shelled and lack an operculum. They range
in size from 70–100 µm long by 55–65 µm wide. There may be a small
spine (arrow) visible near one end. Each egg contains a larva called a
miracidium.
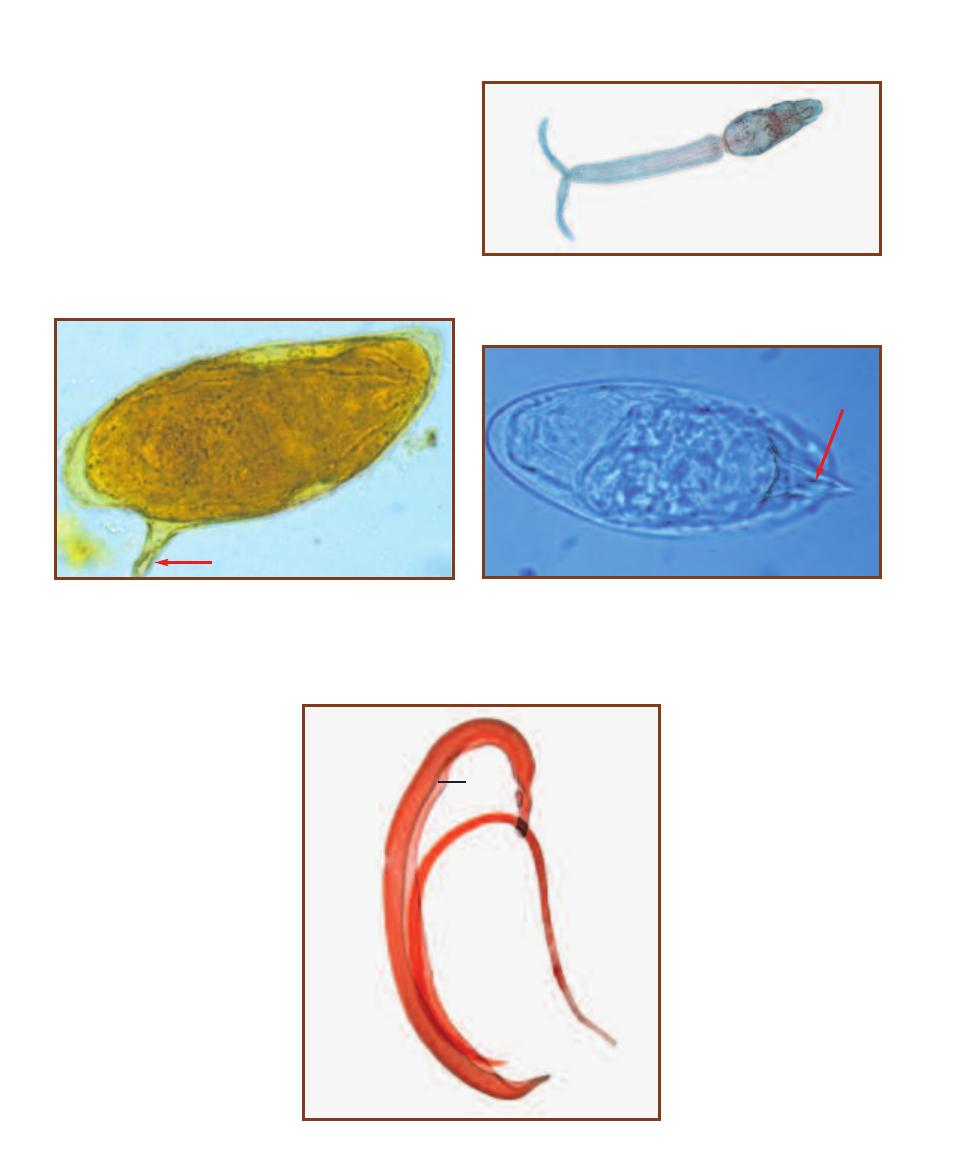
Schistosoma mansoni
S. mansoni (Figure 17-12) is found in Brazil, some Carib bean
islands, Africa, and parts of the Middle East. It has a life
cycle similar to S. haematobium, but the adults reside in the
veins of the hepatic portal system. Eggs (Figures 17-13 and
17-14) from the adults penetrate the intestinal wall and are
passed out with the feces. Presence of eggs in the feces indi-
cates infection. Symptoms are similar to those produced by
S. japonicum infection.
206
䢇
A Photographic Atlas for the Microbiology Laboratory
17-14
S
CHISTOSOMA MANSONI
E
GG IN A
F
ECAL
S
PECIMEN
The
lateral spine may be oriented in such a way as to be difficult to see. In
this specimen, the spine (arrow) is above the egg and the egg may be
misidentified as S. haematobium.
17-12
S
CHISTOSOMA MANSONI
C
ERCARIA
Schistosome cercariae
have a forked tail and penetrate the human host directly. There is no
metacercaria stage, which is unusual among trematodes.
17-15
S
CHISTOSOMA MANSONI
A
DULTS
The male is larger and has a
gynecophoric groove (G) in which the
slender female resides during mating.
G
乆
么
17-13
S
CHISTOSOMA MANSONI
E
GG IN A
F
ECAL
S
PECIMEN
(D’A
NTONI
’
S
I
ODINE
S
TAIN
)
S. mansoni eggs are large (114–175 µm
long by 45–70 µm wide) and contain a larva called a miracidium. They
are thin-shelled, lack an operculum, and have a distinctive lateral spine
(arrow).
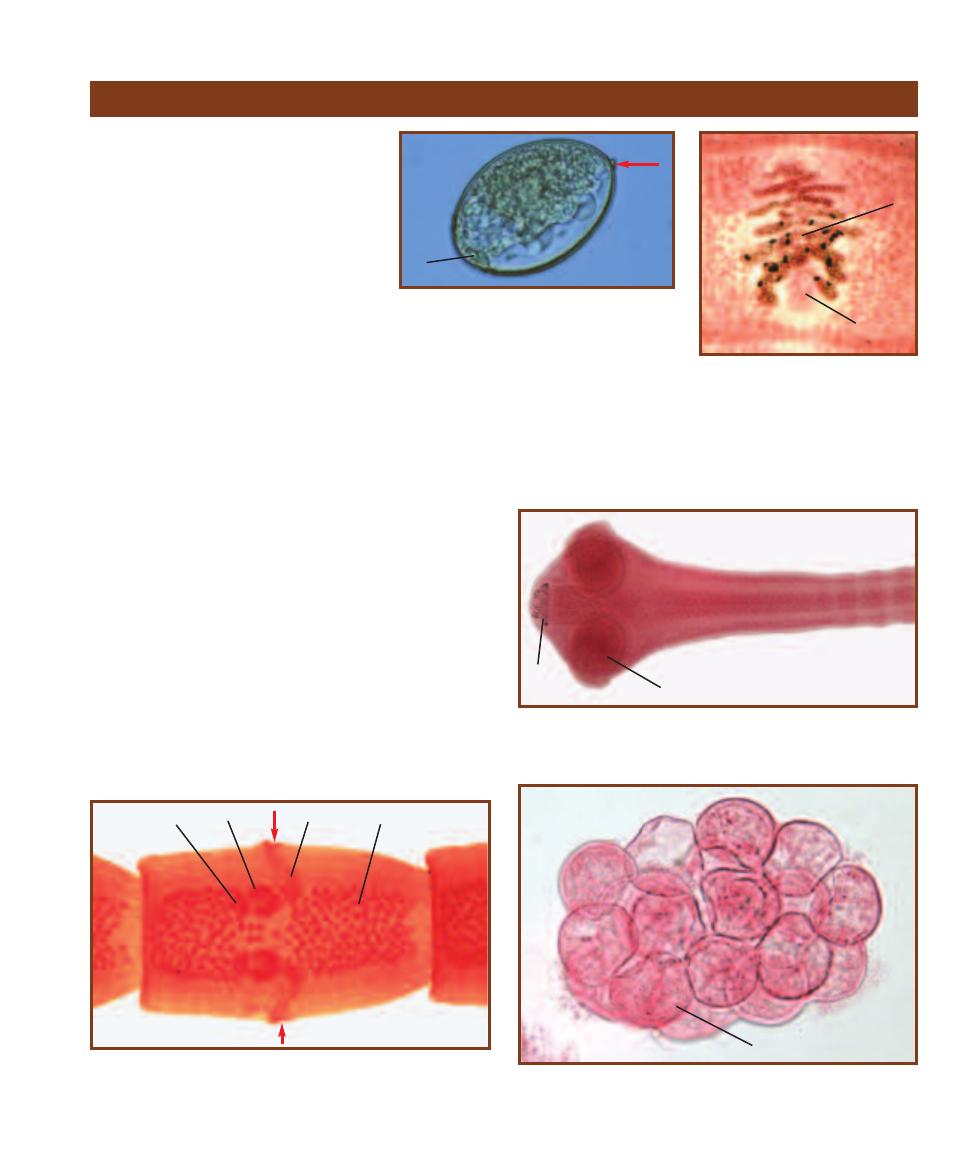
Diphyllobothrium latum
D. latum is the broad fish tapeworm. It is
found in Northern Europe, and the Great
Lakes and west coast regions of North
America. The closely related D. ursi is
responsible for infection in northeastern
North America. D. latum juveniles infect
the muscle of fish-eating carnivores, which
pass the infection on when they are eaten
raw or are undercooked. Adults develop
in the carnivore’s intestine and begin egg
production between one and two weeks
later. Infection may result in no symptoms
or mild symptoms, such as diarrhea, nausea,
abdominal pain, and weakness. In heavy infections, mechan-
i cal blockage of the intestine may occur. Rarely, infection
results in pernicious anemia due to the worm’s uptake of
vitamin B
12
. Diagnosis is commonly made by finding the
eggs (Figure 17-16) or more rarely proglottids (Figure 17-17)
in feces. Adults may reach a length of 9 m with more than
4,000 proglottids!
Dipylidium caninum
D. caninum (Figure 17-18) is a common parasite of dogs and
cats. Human infection usually occurs in children. The adult
worms reside in dog or cat intestines and release pro glottids
(Figure 17-19) containing egg packets that migrate out of the
anus. When these dry, they look like rice grains. Larval fleas
may eat the eggs and become infected. If a dog, cat, or child
ingests one of these fleas, the life cycle is completed in the new
host. Infection may be asymptomatic or produce mild abdom i-
nal discomfort, loss of appetite, and indigestion. Diagnosis is
made by identifying the egg packets (Figure 17-20).
SECTION 17
䢇
Parasitic Helminths
䢇
207
Cestode Parasites Found in Clinical Specimens
17-16
D
IPHYLLOBOTHRIUM LATUM
E
GG IN
A
F
ECAL
S
PECIMEN
(D’A
NTONI
’
S
I
ODINE
S
TAIN
)
The eggs are unembryonated when passed in
feces and have an operculum (O). A knob (arrow)
is often present at the abopercular end. Their
dimensions are 58–75 µm long by 44–50 µm wide.
17-17
D
IPHYLLOBOTHRIUM
LATUM
P
ROGLOTTID
Proglottids are
typically wider than long and contain
a rosette-shaped uterus (
U) opening
to a midventral pore (P). D. latum is
hermaphroditic, but the testes are
obscured by the abundant vitellaria (V)
(yolk glands) in this specimen.
O
U
P
17-18
D
IPYLIDIUM CANINUM
S
COLEX
Adult worms may reach a
length of 50 cm with a width of 3 mm. The scolex has four suckers (S)
and a retractable rostellum with rows of hooks (H).
17-19
D
IPYLIDIUM CANINUM
P
ROGLOTTID
Visible are the testes
(T), vasa deferentia (VD), ovaries (O), and vitelline glands (VG). The
reproductive openings (arrows) on each side of the proglottid give this
worm its common name—the “double-pored tapeworm.”
O
VD
T
H
S
VG
17-20
D
IPYLIDIUM CANINUM
E
GG
P
ACKET
Each D. caninum egg
packet is composed of 5–15 eggs, each with an onchosphere (O). The
onchosphere (larva) contains six hooklets.
O
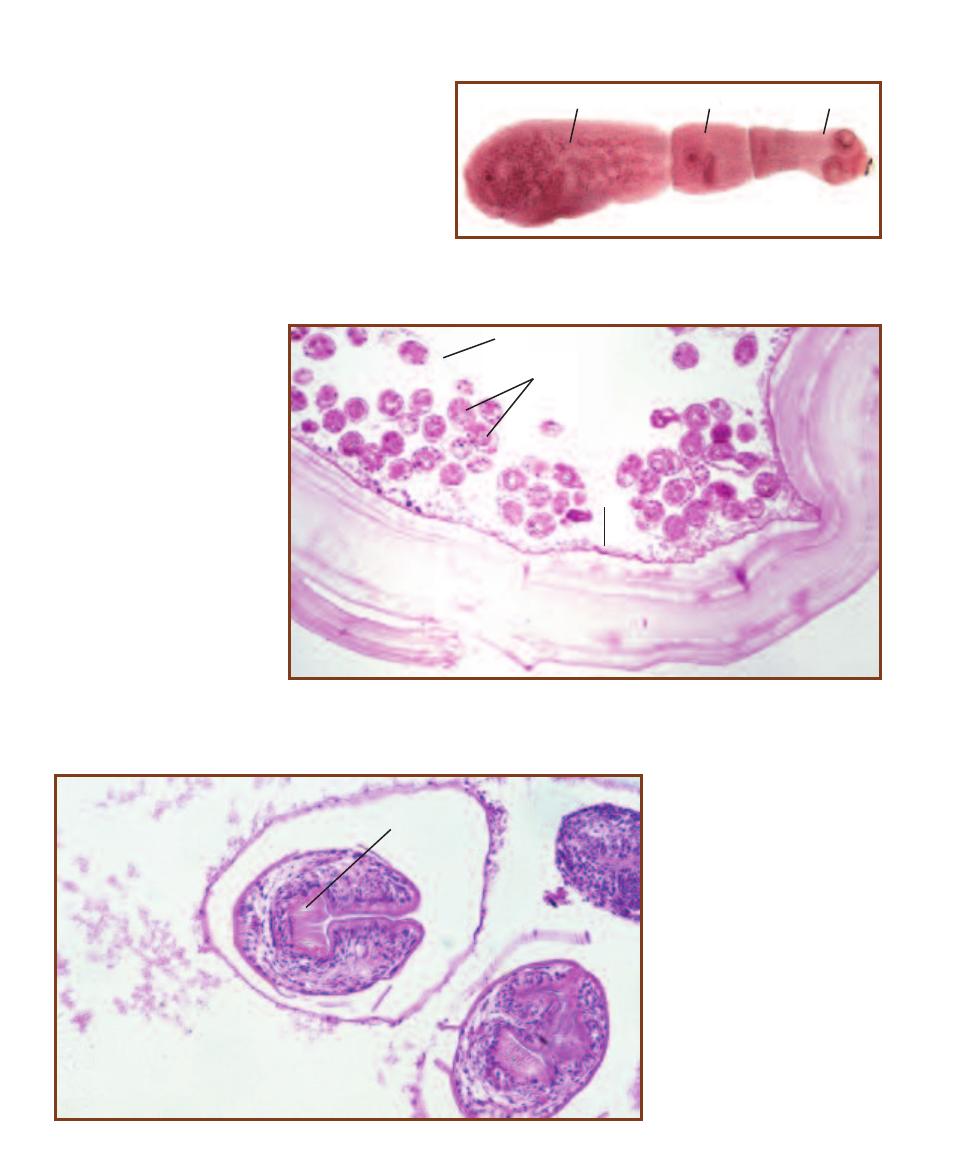
Echinococcus granulosus
The definitive host of E. granulosus (Figure 17-21) is a
carnivore, but the life cycle requires an inter mediate
host, usually an herbivorous mammal. Humans involved
in raising domesticated herbivores (e.g., sheep with their
associated dogs) are most susceptible as intermediate
hosts and develop hydatid disease. Ingestion of a juvenile
E. granulosus leads to development of a hydatid cyst in
the lung, liver, or other organ, a process that may take
many years. The cyst (Figure 17-22) has a thick wall and
develops many protoscolices within (Figure 17-23). The
protoscolices, if ingested, are
infective to the definitive host.
Symptoms depend on the
location and size of the hydatid
cyst, which interferes with
normal organ function. Due to
sensitization by the parasite’s
antigens, release of fluid from
the cyst can result in anaphy-
lactic shock of the host. Diag-
nosis is made by detection of
the cyst by ultrasound or
X-ray.
208
䢇
A Photographic Atlas for the Microbiology Laboratory
17-21
E
CHINOCOCCUS GRANULOSUS
A
DULT
Adult worms are about
0.5 cm in length. There is a scolex (
S) with a ring of hooks, a neck (N), and
one proglottid (P) that contains up to 1,500 eggs.
17-22
S
ECTION OF AN
E
CHINOCOCCUS GRANULOSUS
C
YST IN
L
UNG
T
ISSUE
The cyst wall consists of
a fibrous layer of host tissue (F), an acellular layer (A), and a germinal epithelium (G) that gives rise to
stalked brood capsules (B). Brood capsules produce many E. granulosus protoscolices (P).
B
P
A
F
G
17-23
L
ONGITUDINAL
S
ECTION
OF AN
E
CHINOCOCCUS
GRANULOSUS
P
ROTOSCOLEX
The protoscolex con-
tains an invaginated scolex with hooks
(H). Upon ingestion by the host, the
protoscolex evaginates and produces
an infectious scolex that attaches to the
intestinal wall, matures, and produces
eggs.
H
P
N
S
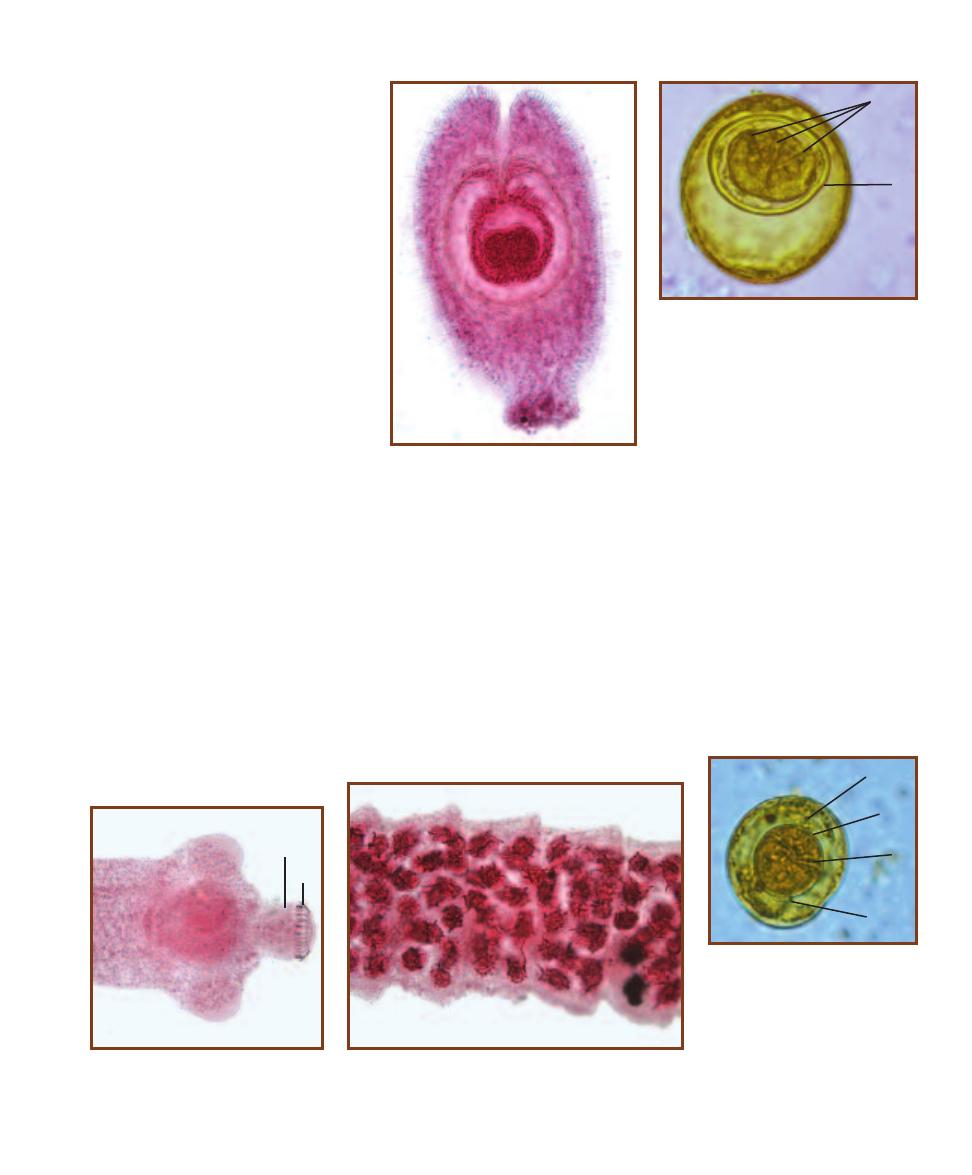
Hymenolepis diminuta
H. diminuta is a tapeworm that has
various arthropods as its intermediate
hosts and rodents as the definitive hosts.
Humans may also be infected via inges-
tion of arthropods infected with the
cysticercoid (Figure 17-24). The adult
worms develop in and attach to the intes-
tinal mucosa, with one host harboring
numerous worms. They release eggs
(Figure 17-25), which exit with the feces
and are useful in diagnosis. Proglottids
are rarely found in feces and are not
of diagnostic value. Many infections are
asymptomatic, but some result in mild
abdominal discomfort and digestive
upset.
SECTION 17
䢇
Parasitic Helminths
䢇
209
17-24
H
YMENOLEPIS DIMINUTA
C
YS
-
TICERCOID
The larval cysti cercoid stage is
found in arthropods of various sorts. Rodents
are the definitive host, but if ingested by
humans, the cysticercoid can develop in the
intestines. Eating grain containing infected
beetles is a common mode of infection.
17-25
H
YMENOLEPIS DIMINUTA
E
GG IN
F
ECES
(D’A
NTONI
’
S
I
ODINE
S
TAIN
)
The
spherical, thick-shelled eggs of H. diminuta
range in size from 70–85 µm long by 60–80
µm wide. The embryo (E) is centrally posi-
tioned separate from the wall. Three pairs of
hooks (H) are also present.
E
H
17-26
H
YMENOLEPIS NANA
S
COLEX
Adults gain a length of up to 10 cm, but
are only 1 mm in width. The rostellum (R)
is armed with up to 30 hooks (H).
H
R
17-27
H
YMENOLEPIS NANA
P
ROGLOTTIDS
H. nana is
hermaphroditic, but in this specimen, the numerous testes
obscure most other structures.
17-28
H
YMENOLEPIS NANA
E
GG
IN
F
ECES
(D’A
NTONI
’
S
I
ODINE
S
TAIN
)
The H. nana egg resembles the egg of
H. diminuta, but it is smaller (30–47 µm
in diameter) and has a thinner shell.
The oncosphere (O) is separated from
the shell and contains six hooks (H).
Another distinguishing feature is the
presence of between four and eight
filaments (F) arising from either end
of the oncosphere.
F
O
H
F
Hymenolepis (Vampirolepis) nana
H. nana (Figures 17-26 and 17-27) is the dwarf tapeworm
and is the most common cestode parasite of humans in the
world. When eggs (Figure 17-28) are ingested, the onco -
spheres develop into juveniles in the lymphatics of intestinal
villi. These juveniles are then released into the lumen within
a week and attach to the intestinal mucosa to mature into
adults. Infection may involve hundreds of worms, yet symp-
toms are usually mild: diarrhea, nausea, loss of appetite, or
abdominal pain. Eggs may reinfect the same host or pass
out with the feces to infect a new host. Eggs in the feces are
used for identification, but proglottids are not as they are
rarely passed.
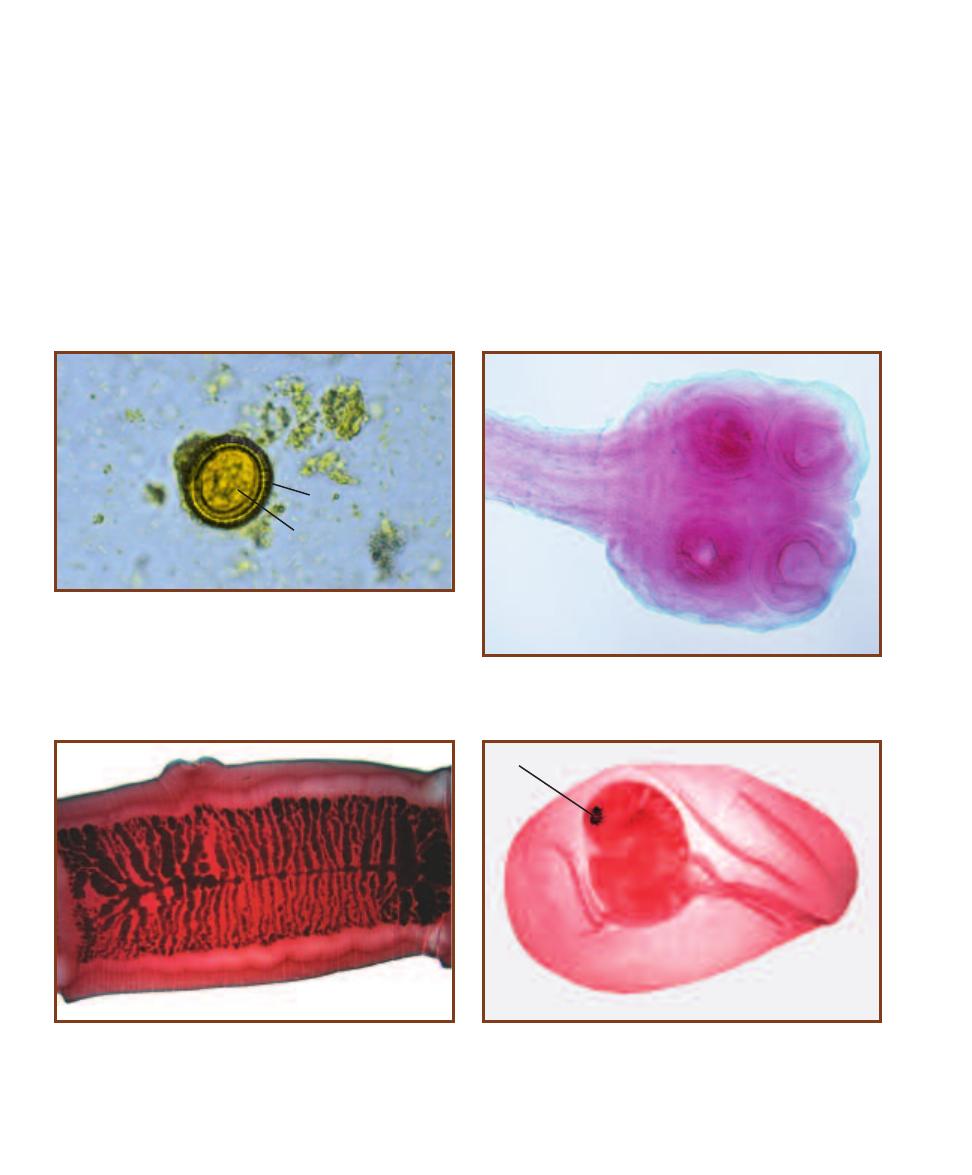
Taenia spp.
Two taeniid worms are important human pathogens. These
are Taenia saginata (Taenia rhynchus saginatus)—the beef
tapeworm—and Taenia solium—the pork tapeworm.
T. saginata infects humans who eat undercooked beef
containing juvenile worms. In the presence of bile salts, the
juvenile develops into an adult and begins producing gravid
proglottids within a few weeks. Symptoms of infection are
usually mild nausea, diarrhea, abdominal pain, and head -
ache. Diagnosis to species is impossible with only the eggs
(Figure 17-29); specific identification requires a scolex or
gravid proglottid (Figures 17-30 and 17-31).
The T. solium life cycle is similar to T. saginata, but
the host is pork, not beef, so human infection occurs when
undercooked pork is eaten. If eggs are ingested, a juvenile
form called a cysticercus develops. Cysticerci (Figure 17-32)
may be found in any tissue, especially subcutaneous con nec-
tive tissues, eyes, brain, heart, liver, lungs, and coelom.
Symptoms of cysticercosis depend on the tissue infected, but
mostly they are not severe. However, death of a cysticercus
can produce a rapidly fatal inflammatory response. As with
T. saginata, diagnosis to species is impossible with only
the eggs; specific identification requires a scolex or gravid
proglottid (Figures 17-33 and 17-34).
210
䢇
A Photographic Atlas for the Microbiology Laboratory
17-29
T
AENIA
E
GG IN
F
ECES
Taeniid eggs are distinctive looking
enough to identify to genus, but not distinctive enough to speciate. Eggs
are spherical and approximately 40 µm in diameter with a striated shell
(S). The oncosphere contains six hooks (H).
17-30
T
AENIA SAGINATA
S
COLEX
The T. saginata scolex has four
suckers (S) and no hooks.
S
H
S
17-31
T
AENIA SAGINATA
P
ROGLOTTID
The uterus of T. saginata
proglottids consists of a central portion with 15–20 lateral branches
(compare to the T. solium uterus in Figure 17-34).
17-32
T
AENIA
C
YSTICERCUS
The cysticercus (cysticercus cellu losae)
consists of a bladder with the head and hooks (H) invaginated.
H
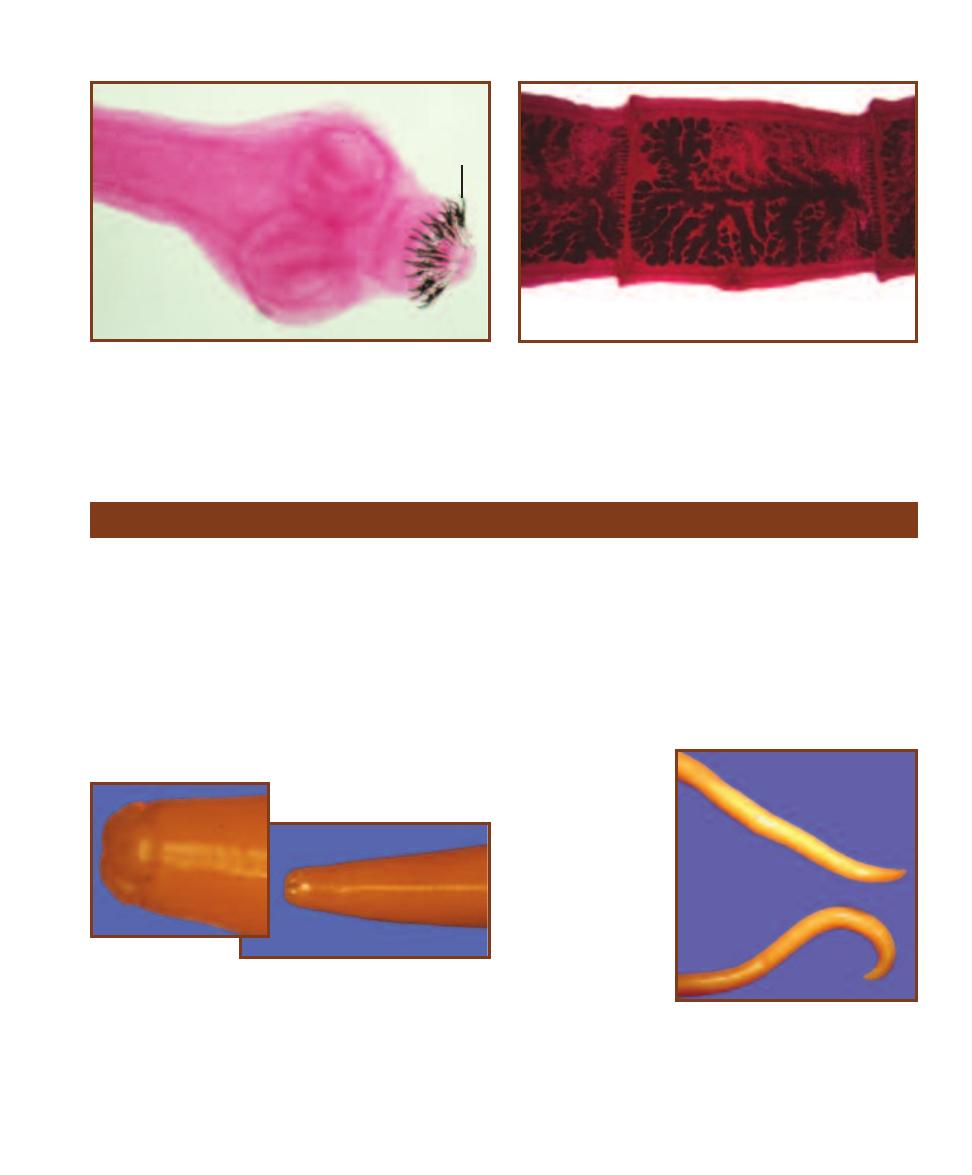
Ascaris lumbricoides
A. lumbricoides (Figures 17-35 and 17-36) is a large nema-
tode—females may reach a length of 49 cm! Human infec-
tion occurs when eggs in fecally contaminated soil or food
are ingested. Juveniles emerge in the intestine, penetrate its
wall, and then migrate to the lungs and other tissues. After
a period of development in the lungs, the juveniles move up
the respiratory tree to the esophagus and are swallowed
again. Adults then reside in the small intestine and produce
eggs (Figures 17-37 and 17-38). Infection may result in
inflammation in organs other than the lungs where juvenile
worms settled incorrectly. Ascaris pneumonia occurs in heavy
infections due to the lung damage caused by the juveniles. If
secondary bacterial infections occur, the pneumonia can be
fatal. Blockage of the intestines and malnutrition also are
possible in heavy infections. Lastly, under certain conditions,
worms can wander to other body locations and cause dam-
age or blockage. Identification of an Ascaris infection is
made by observing the eggs in feces.
SECTION 17
䢇
Parasitic Helminths
䢇
211
17-33
T
AENIA SOLIUM
S
COLEX
The T. solium scolex has two rings
of hooks (
H) and four suckers (S).
17-34
T
AENIA SOLIUM
P
ROGLOTTID
The uterus of T. solium pro -
glottids consists of a central portion with 7–13 lateral branches (com-
pare to the T. saginata uterus in Figure 17-31).
H
S
Nematode Parasites Found in Clinical Specimens
17-35
A
SCARIS LUMBRICOIDES
A
NTERIOR
A. lumbricoides has a
cylindrical shape with three prominent mouth parts (see inset).
17-36
A
SCARIS
LUMBRICOIDES
A
DULT
W
ORMS
A. lumbri-
coides males (bottom)
are shorter than
females (top) (up
to 31 cm vs. 35 cm)
and have a curved
posterior.
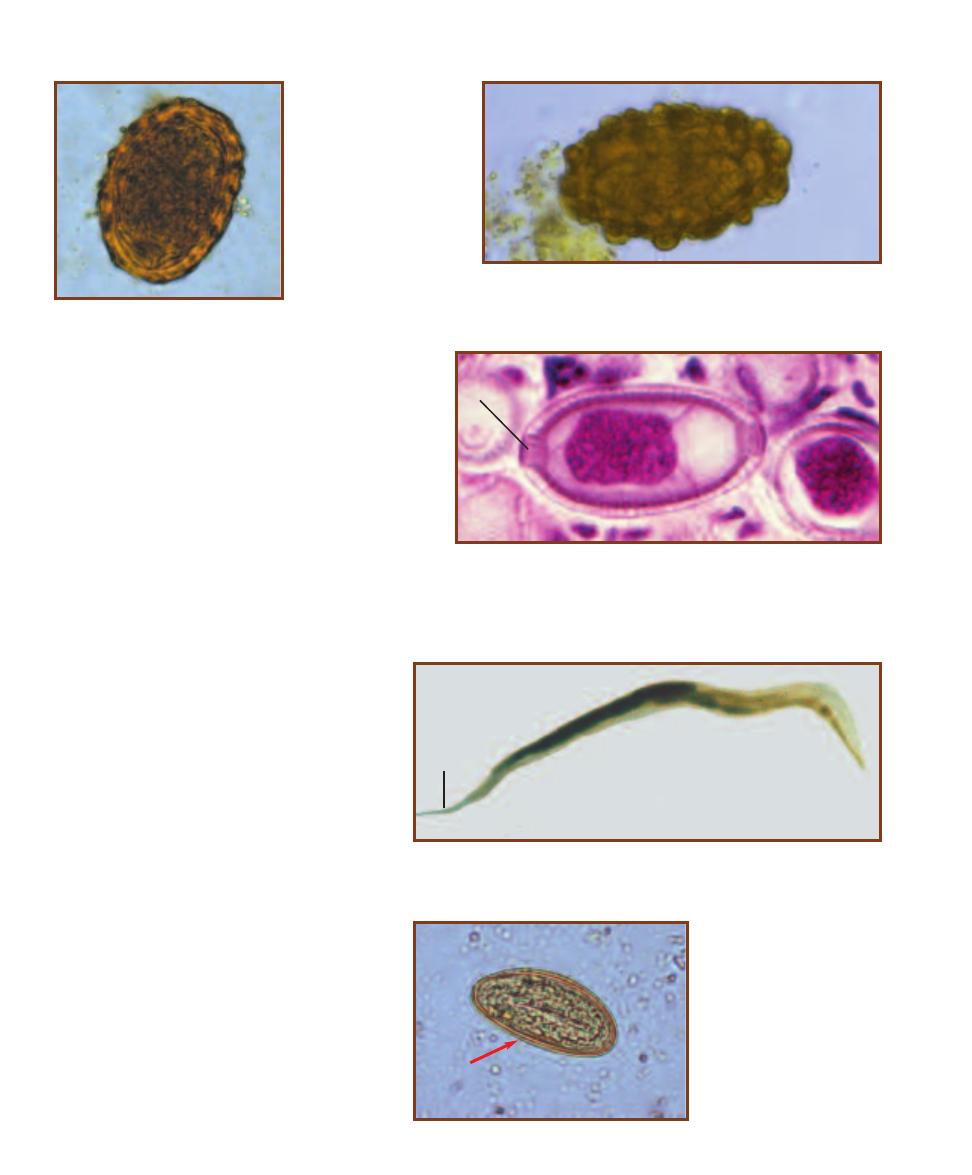
Capillaria hepatica
C. hepatica is mostly a rodent parasite, but human
infections do occur. Infection results when food or soil
contaminated with eggs is ingested. Juveniles emerge
in the small intestine and migrate to the liver where
development into adults occurs. Eggs (Figure 17-39)
are deposited in the liver, but cannot develop there. For
further development, a predator must eat the infected
host’s liver. The eggs pass through the predator’s gut
and are deposited in the soil with the feces. The main
symptom of infection is hepatitis with eosinophilia, but
other symptoms of liver dysfunction may be present.
Identification is made by liver biopsy or postmortem
examinations.
212
䢇
A Photographic Atlas for the Microbiology Laboratory
17-39
S
ECTION OF
C
APILLARIA HEPATICA
E
GGS IN THE
L
IVER
C. hepatica
eggs are 51–67 µm long by 30–35 µm wide and have “plugs” (P) at either end.
These are only passed in the feces if an infected liver has been eaten, but still
must be distinguished from the similar eggs of Trichuris trichiura which has
much more prominent plugs at each end.
P
17-40
E
NTEROBIUS VERMICULARIS
A
DULT
F
EMALE
Female pinworms are about
1 cm long and have a pointed tail (T) from which this group derives its common name.
Males are about half that size and have a hooked tail.
17-41
E
NTEROBIUS
VERMICULARIS
E
GG
(D’A
NTONI
’
S
I
ODINE
S
TAIN
)
The eggs of E.
ver micularis are 50–60 µm long
by 20–40 µm wide with one side
flattened (arrow). They are
usually embryonated in typical
preparations.
T
Enterobius vermicularis
E. vermicularis (Figure 17-40) is the human
pinworm. It is found worldwide and is especially
prevalent among people in institutions because
conditions favor fecal-oral transmission of the
parasite. Bedding, clothing, and the fingers (from
scratching) become contaminated and may be
involved in transmission. Poor sanitary habits of
children make them especially prone to infecting
others. Inhalation of eggs (Figure 17-41) carried
on air currents is another mode of transmission.
After ingestion (or inhalation), eggs hatch in the
duodenum and mature in the large intestine
where the adults reside. Adult females emerge
from the anus at night to lay between 4,600 and
16,000 eggs in the perianal region. About one-
third of pinworm infections are asymptomatic.
The other two-thirds usually do not produce
serious symptoms. Diagnosis is made by identify-
ing the eggs. Since the eggs are laid externally,
they are rarely found in feces. Instead, they are
collected on cellophane tape from the perianal
region and examined microscopically.
17-37
F
ERTILE
A
SCARIS
LUMBRICOIDES
E
GG IN
F
ECES
(D’A
NTONI
’
S
I
ODINE
S
TAIN
)
Fertile A. lumbricoides eggs
are 55–75 µm long by
35–50 µm wide and
are embryonated. Their
surface is covered by
small bumps called
mammillations.
17-38
I
NFERTILE
A
SCARIS LUMBRICOIDES
E
GG IN
F
ECES
(D’A
NTONI
’
S
I
ODINE
S
TAIN
)
Infertile eggs are longer (up to 90 µm) than fertile eggs.
There is no embryo inside.
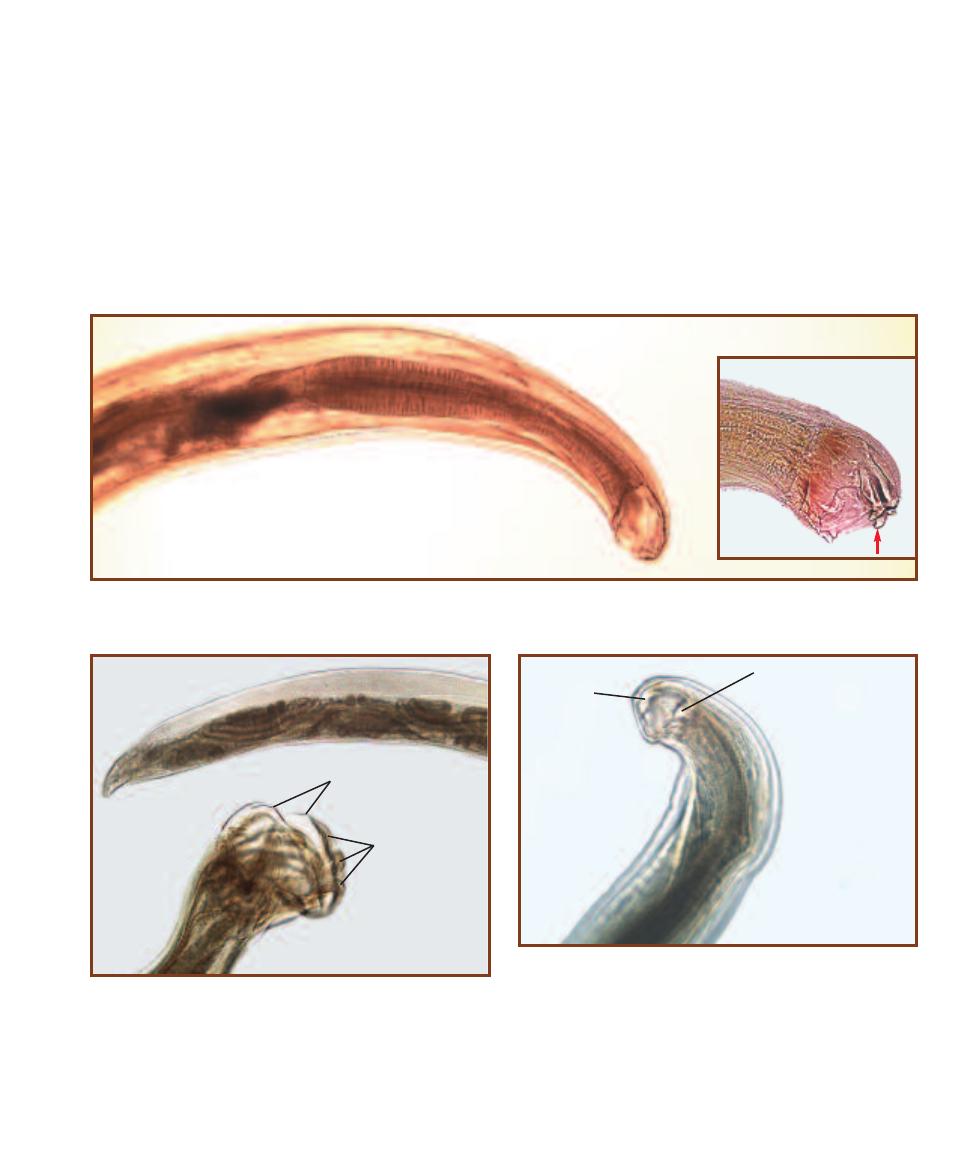
SECTION 17
䢇
Parasitic Helminths
䢇
213
17-42
A
NTERIOR OF
A
NCYLOSTOMA DUODENALE
A. duodenale head showing the mouth and thick-walled esophagus. The bend in the head
gives this group its common name—hookworm. In the inset, the chitinous teeth (arrow) are visible (compare with Figure 17-44).
17-43
S
EXUAL
D
IMORPHISM IN
A
NCYLOSTOMA DUODENALE
Males have a copulatory bursa (CB) at the posterior end; females do
not. The arrangement of the bursal rays (BR) is helpful in identification.
乆
CB
么
BR
17-44
N
ECATOR AMERICANUS
H
EAD
This detail of N. americanus
shows the cutting plates (CP) that help to differentiate it from Ancylostoma
duodenale (compare with Figure 17-42). Also notice the hooked head.
CP
CP
Hookworms (Ancylostoma
duodenale and Necator americanus)
The hookworms A. duodenale (Figures 17-42 and 17-43)
and N. americanus (Figure 17-44) have very similar mor-
phologies and life cycles, and the eggs are indistinguishable,
so they are considered together here. Infection occurs when
juveniles penetrate the skin, enter the blood, and travel to
the lungs. They penetrate the respiratory membrane and
are carried up and out of the lungs by ciliary action to the
pharynx, where they are swallowed. When they reach the
small intestine, they attach and mature into adults that feed
on blood and tissues of the host. Adults are rarely seen as
they remain attached to the intestinal mucosa. Eggs (Figure
17-45) are passed in the feces and are diagnostic of infection.
The severity of hookworm disease symptoms is related to
the parasite load, and most infections are asymptomatic.
As a rule, severe symptoms of bloody diarrhea and iron
deficiency anemia are only seen in heavy acute or chronic
infections.
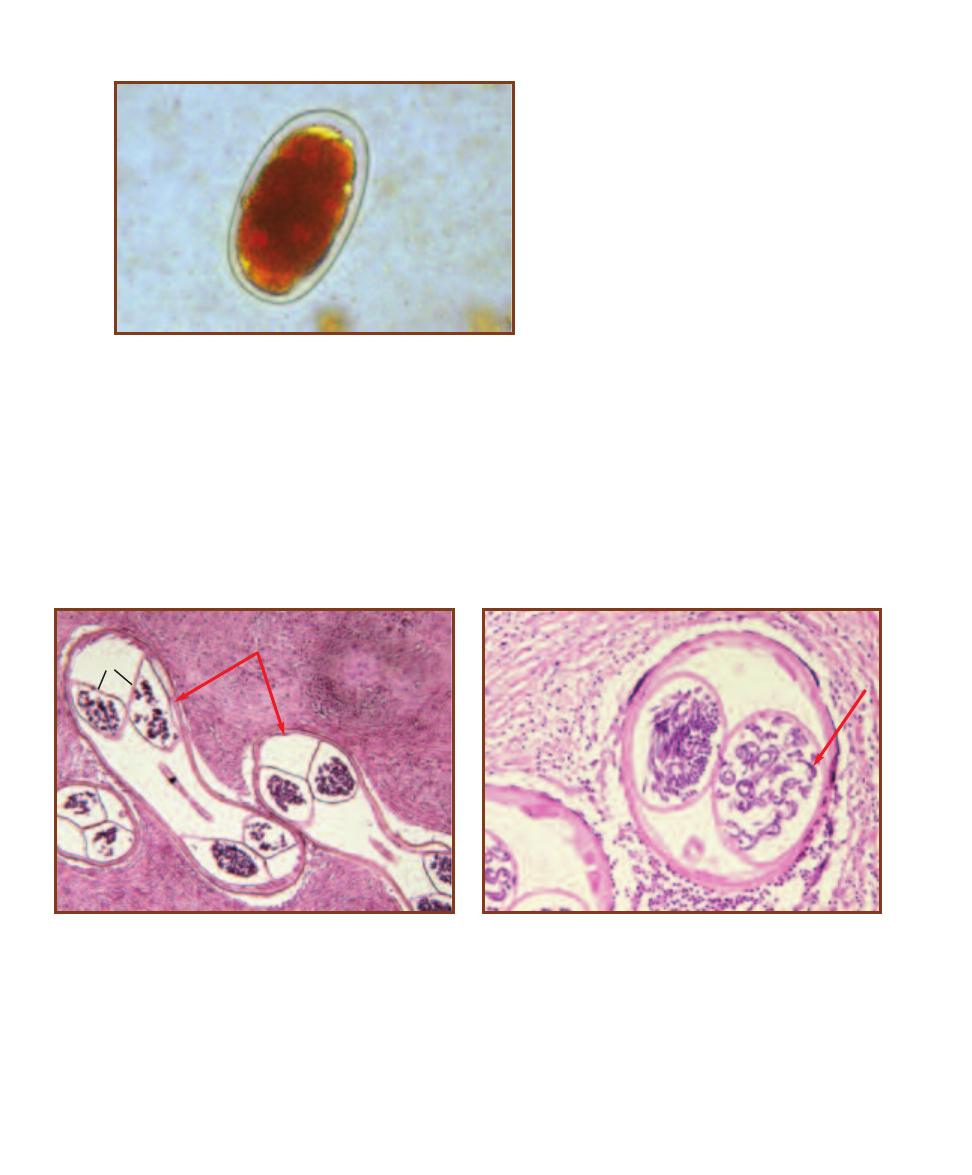
214
䢇
A Photographic Atlas for the Microbiology Laboratory
17-46
S
ECTION OF
A
DULT
O
NCHOCERCA VOLVULUS IN
N
ODULES
The adult worms are highly coiled within fibrous nodules (arrows)
beneath the skin. Some worm cross-sections are labeled (CS).
17-47
S
ECTION OF
A
DULT
O
NCHOCERCA VOLVULUS
S
HOWING
D
EVELOPING
M
ICROFILARIAE
Microfilariae are indicated by the arrow.
They are 220–360 µm long.
Onchocerca volvulus
O. volvulus is found in Africa, Mexico, and parts of South
and Central America. It causes onchocerciasis (“river blind-
ness”) and is transmitted through bites of infected black flies
(Simulium spp.). Juveniles enter the tissues and develop into
adults in about a year. Adults then reside in subcutaneous
tissues and become surrounded by a collagenous capsule
(Figure 17-46). Microfilariae (Figure 17-47) develop and
may be picked up by a black fly when feeding to complete
the cycle. Damage due to the adult worm is negligible, at
worst forming a nodule. The micro filariae are more trouble-
some. Dead microfilariae may cause dermatitis followed by
a thickening, cracking, and depigmen tation of the skin. Liv-
ing microfilariae may infect the eyes, die, and stimulate an
immune response. Sclerosing keratitis, which results in
blindness, is one consequence of chronic eye inflammation.
Diagnosis is by demonstration of micro filariae in skin snips.
17-45
H
OOKWORM
E
GG IN
F
ECES
(D’A
NTONI
’
S
I
ODINE
S
TAIN
)
Hookworm eggs are 55–75 µm long
by 36–40 µm wide. They have a thin shell and contain
a developing embryo (seen here at about the 16 cell
stage) that is separated from the shell when seen in
fecal samples.
CS
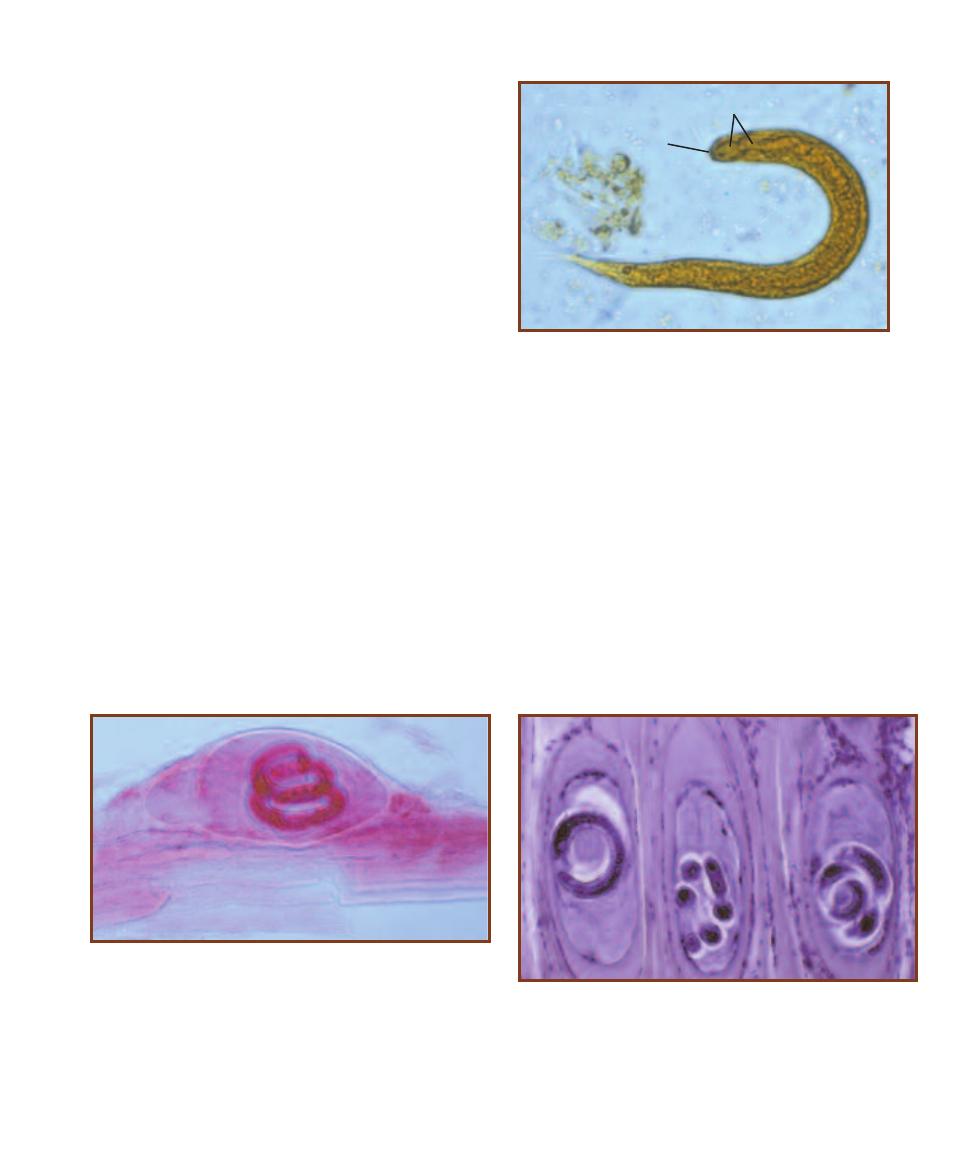
SECTION 17
䢇
Parasitic Helminths
䢇
215
17-48
S
TRONGYLOIDES STERCORALIS
R
HABDITIFORM
L
ARVA
IN
F
ECES
(D’A
NTONI
’
S
I
ODINE
S
TAIN
)
These larvae may be dis-
tinguished from hookworm larvae (which are rarely in feces) by
their short buccal cavity (B). The name “rhabditiform” refers to the
esophagus (E) shape, which has a constriction within it.
B
E
Strongyloides stercoralis
S. stercoralis is the intestinal threadworm. Infection occurs as
infective juveniles from fecally contaminated soil penetrate
the skin. The juveniles then migrate to the lungs and develop
into parthenogenetic females that migrate to the pharynx,
are swallowed, and then burrow into the intestinal mucosa.
Each day they release a few dozen eggs that develop into
juveniles (Figure 17-48) before they are passed in the feces.
These juveniles may become infective or may follow a devel-
opmental path that produces free-living adults. These adults
eventually produce more infective juveniles and the cycle is
completed. Symptoms of infection may be itching or second-
ary bacterial infection at the site of entry by the infective
juveniles, a cough, burning of the chest during the pul-
monary phase, and abdominal pain and perhaps septicemia
during the intestinal phase. Diagnosis is by finding rhabditi-
form larvae in fresh fecal samples.
17-49
W
HOLE MOUNT OF A
T
RICHINELLA SPIRALIS
L
ARVA IN
S
KELETAL
M
USCLE
The spiral juvenile and its nurse cell are visible
in this preparation.
17-50
S
ECTION OF
T
RICHINELLA SPIRALIS
L
ARVAE IN
S
KELETAL
M
USCLE
Each larva has entered a different skeletal muscle cell and
converted it into a nurse cell that sustains it with nourishment.
Trichinella spiralis
T. spiralis produces trichinosis, a disease of car nivorous
mammals. Infection occurs when undercooked meat (e.g.,
pork) containing infective juveniles in nurse cells is eaten.
These juveniles emerge from their nurse cells and enter the
intestinal mucosa. Between two and three days later, the
juveniles have developed into mature adults that burrow
within rows of the intestinal epithelial cells. Juveniles emerge
from the females and are distributed throughout the body.
When they are in skeletal muscle, they enter the muscle
fibers and each induces the formation of a nurse cell (Figures
17-49 and 17-50). In as little as four weeks, these juveniles
become infective. Humans, unless they are eaten, are a
dead-end host for this parasite. Symptoms of infection are
many and varied because the juveniles migrate throughout
the body. Some consequences of infection are pneumonia,
meningitis, deafness, and nephritis. Death may occur due to
heart, respiratory, or kidney failure, but most infections are
subclinical. Diagnosis is by muscle biopsy.
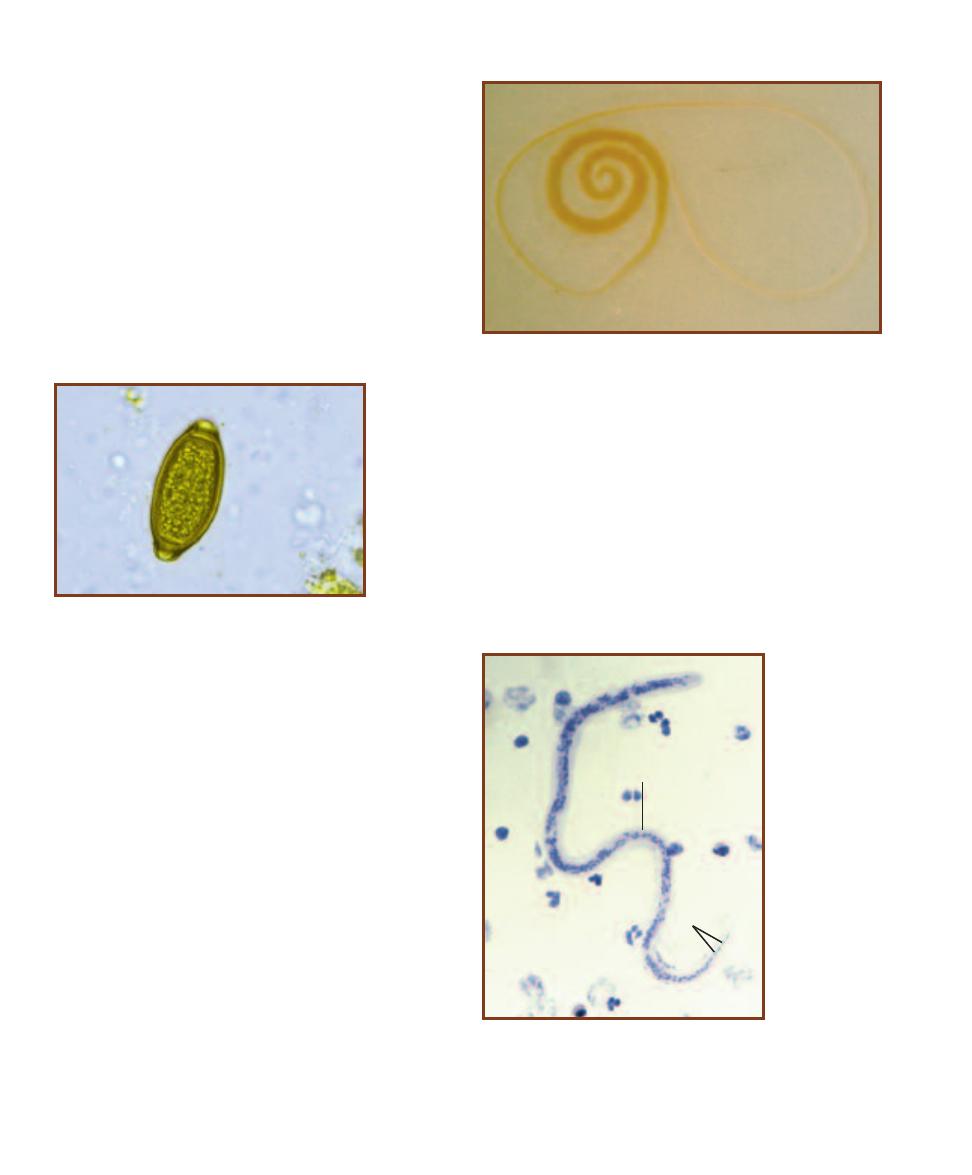
216
䢇
A Photographic Atlas for the Microbiology Laboratory
17-53
W
UCHERERIA BANCROFTI
M
ICROFILARIA
IN A
B
LOOD
S
AMPLE
The microfilariae of W.
bancrofti can be distinguished from others in the
blood by the sheath (S) and the single column of
nuclei (N) not extending to the tip of the tail.
S
N
17-51
A
DULT
F
EMALE
T
RICHURIS TRICHIURA
Adults are about
5 cm in length, with females being slightly longer than males. The blunt
posterior end is indicative of females. The long, thin anterior portion
remains embedded in the intestinal mucosa and feeds.
17-52
T
RICHURIS TRICHIURA
E
GG
IN
F
ECES
(D’A
NTONI
’
S
I
ODINE
S
TAIN
)
The barrel-shaped eggs of T. trichiura
have distinctive plugs at either end.
They are 50–55 µm in length by 22–24
µm wide.
Trichuris trichiura
The whipworm T. trichiura is a parasite of the large intestine
and is often associated with Ascaris infections. Infection
occurs through ingestion of eggs in fecally con taminated
soil or plants. The juveniles then emerge and penetrate the
mucosa of the large intestine. As they grow, their posterior
projects into the lumen while the anterior remains buried in
the mucosa and feeds on cell contents and blood. The adult
females (Figure 17-51) release up to 20,000 eggs a day (Fig-
ure 17-52), which pass out with the feces and are diagnostic
of infection; adult worms are rarely seen. Most infections
are asymptomatic. With heavy worm burdens (more than
100), dysentery, anemia, and slowed growth and cognitive
development are common.
Wuchereria bancrofti
W. bancrofti is a filarial worm that causes lymphatic filariasis.
Infection occurs from the bite of a mosquito harboring
infective juveniles. Upon injection into the host, the worms
migrate into the large lymphatic vessels of the lower body
and mature. Adults are found in coiled bunches and the
females release microfilariae (Figure 17-53) by the thousands.
Microfilariae enter the blood and circulate there, often with
a daily periodicity—most abundant at night when the mos-
quito vector is active and hidden away in lung capillaries
during the day when it is not. Some infections are asympto-
matic, whereas others result in acute inflammation of lym-
phatics associated with fever, chills, tenderness, and toxemia.
In the most serious cases, obstruction of lymphatic vessels
occurs and results in elephantiasis, a disease caused by
accumulation of lymph fluid in the tissues, an accumulation
of fibrous connective tissue, and a thickening of the skin.
Diagnosis of infection is made by identifying micro filariae
in blood smears.

Quantitative
Microbiology
Purpose
The viable count is one method of determining the density of a microbial population. It provides
an estimate of actual living cells in the sample.
Principle
The standard plate count is a procedure that allows micro biologists to estimate the population
density in a liquid sample by plating a very dilute portion of that sample and counting the number
of colonies it produces. The inoculum that is transferred to the plate contains a known proportion
of the original sample because it is the product of a serial dilution.
As shown in Figure 18-1, a serial dilution is simply a series of controlled transfers down a line
of dilution blanks (tubes containing a known volume of sterile diluent—water, saline, or buffer).
The series begins with a sample containing an unknown concentration (density) of cells and ends
with a very dilute mixture containing only a few cells. Each dilution blank in the series receives a
known volume from the mixture in the previous tube and delivers a known volume to the next,
typically reducing the cell density by 1/10 or 1/100 at each step.
For example, if the original sample in Figure 18-1 contains 1,000,000 cells/mL, following the
first transfer, the 1/100 dilution (0.1 mL into 9.9 mL) in dilution tube 1 would contain 10,000
cells/mL. In the second dilution (tube 2), the 1/100 dilution would reduce it further to 100 cells/mL.
Because the cell density of the original sample is not known at this time, only the dilutions (without
mL units) are recorded on the dilution tubes. By convention, dilutions are expressed in scientific nota-
tion. Therefore, a 1/10 dilution is written as 10
–1
and a 1/100 dilution is written as 10
–2
.
A known volume of appropriate dilutions (depending on the estimated cell density of the original
sample) is then spread onto agar plates to produce at least one countable plate. A countable plate
is one that contains between 30 and 300 colonies (Figure 18-2). A count lower than 30 colonies
is considered statistically unreliable and greater than 300 is typically too many to be viewed as
individual colonies. A colony counter (Figure 18-3) with a magnifying lens is useful if the colonies
are small.
In examining Figure 18-1, you can see that the first transfer in the series is a simple dilution,
but that all suc cessive transfers are compound dilutions. Both types of dilutions can be calculated
using the following formula,
V
1
D
1
V
2
D
2
where V
1
and D
1
are the volume and dilution of the concentrated broth, respectively, while V
2
and D
2
are the volume and dilution of the completed dilution. Undiluted samples are always expressed as 1.
Standard Plate Count (Viable Count)
18
S E C T I O N
217
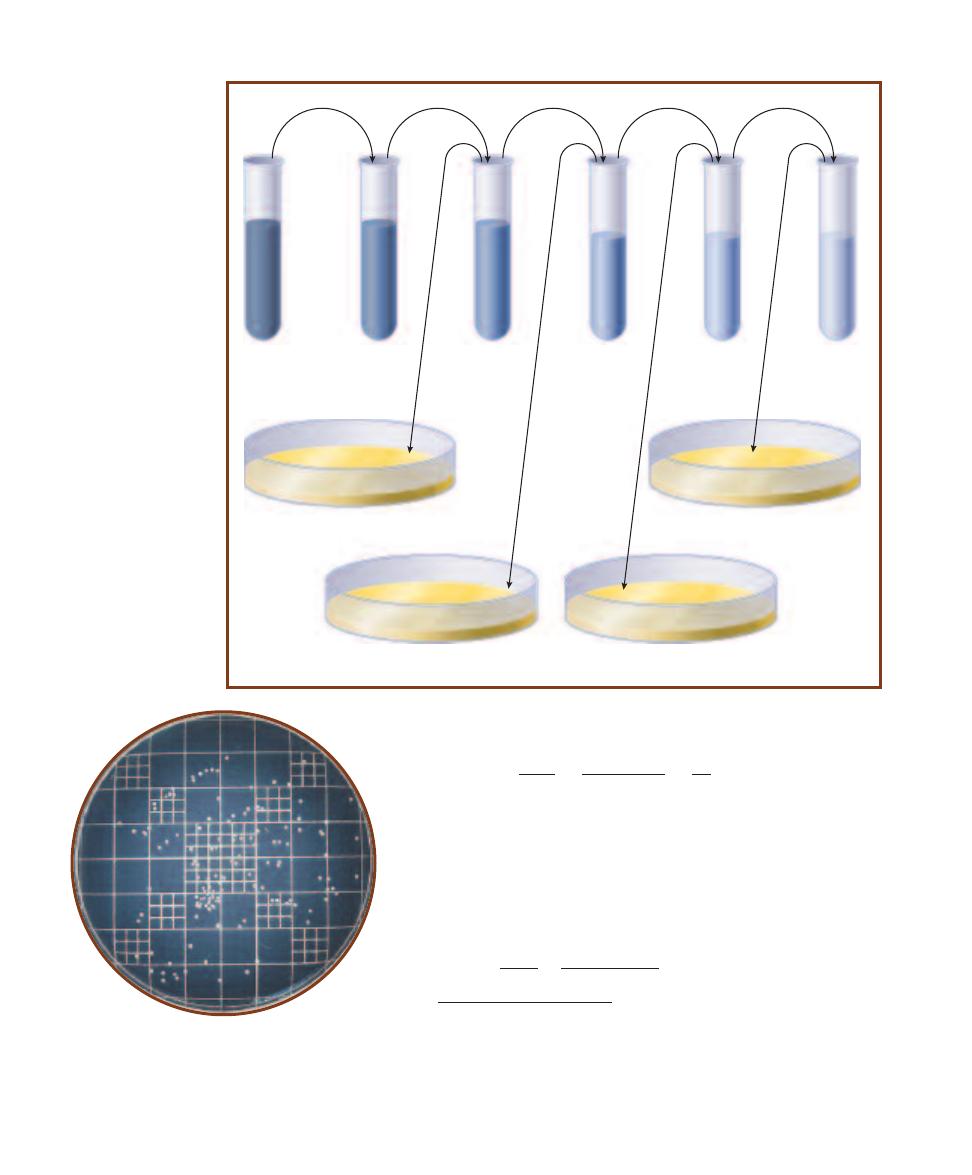
218
A Photographic Atlas for the Microbiology Laboratory
0.1 mL
Original
sample
Tube 1
9.9 mL
diluent
10
– 2
dilution
Tube 2
9.9 mL
diluent
10
– 4
dilution
Tube 3
9.0 mL
diluent
10
– 5
dilution
Tube 4
9.0 mL
diluent
10
– 6
dilution
Tube 5
9.0 mL
diluent
10
– 7
dilution
0.1 mL
1.0 mL
1.0 mL
1.0 mL
0.1 mL
0.1 mL
Plate A
10
– 5
mL original sample volume
Plate B
10
– 6
mL original sample volume
Plate C
10
– 7
mL original sample volume
Plate D
10
– 8
mL original sample volume
0.1 mL
0.1 mL
18-1
S
ERIAL
D
ILUTION
This is a sample dilution
scheme. The dilution as-
signed to each tube (written
below the tube) represents
the proportion of original
sample inside that tube. For
example, if the dilution is
10
–4
, the proportion of origi-
nal sample inside the tube
would be 1/10000th of the
total volume. When 0.1 mL
of that solution is trans-
ferred to a plate, the vol-
ume of sample in the plate
is 0.1 mL
10
–4
10
–5
mL.
Therefore, to calculate the dilution of a 1 mL sample transferred to
9 mL of diluent, the permuted formula would be used as follows.
V
1
D
1
1.0 mL
1
1
D
2
10
–1
V
2
10 mL
10
As mentioned above, compound dilutions are calculated using
the same formula. However, because D
1
in compound dilutions
no longer represents undiluted sample, but rather a fraction of the
original density, it must be represented as something less than 1
(i.e., 10
–1
, 10
–2
, etc.) For example, if 1 mL of the 10
–1
dilution from
the last example were transferred to 9 mL of diluent, it would be-
come a 10
–2
dilution as follows.
1
V
1
D
1
1.0 mL
10
–1
D
2
10
–1
10
–1
10
–2
V
2
10 mL
18-2
C
OUNTABLE
P
LATE
A countable plate has between
30 and 300 colonies. Therefore, this plate with approximately
130 colonies is countable and can be used to calculate cell
density in the original sample. Plates with fewer than 30
colonies are TFTC (“too few to count”). Plates with more than
300 colonies are TMTC (“too many to count”).
1
Permutations of this formula work with all necessary dilution calculations. For calcu-
lations involving unconventional volumes or dilutions, the formula is essential, but for
simple ten-fold or hundred-fold dilutions like the ones described here, the final com-
pounded dilution in a series can be calculated simply by multiplying each of the simple
dilutions by each other. For example, a series of three 10
-1
dilutions would yield a final
dilution of 10
–3
(10
–1
10
–1
10
–1
10
–3
). Three 10
–2
dilutions would yield a final
dilution of 10
–6
(10
–2
10
–2
10
–2
10
–6
). We encourage you to use whatever means
is best for you. In time you will be doing the calculations in your head.
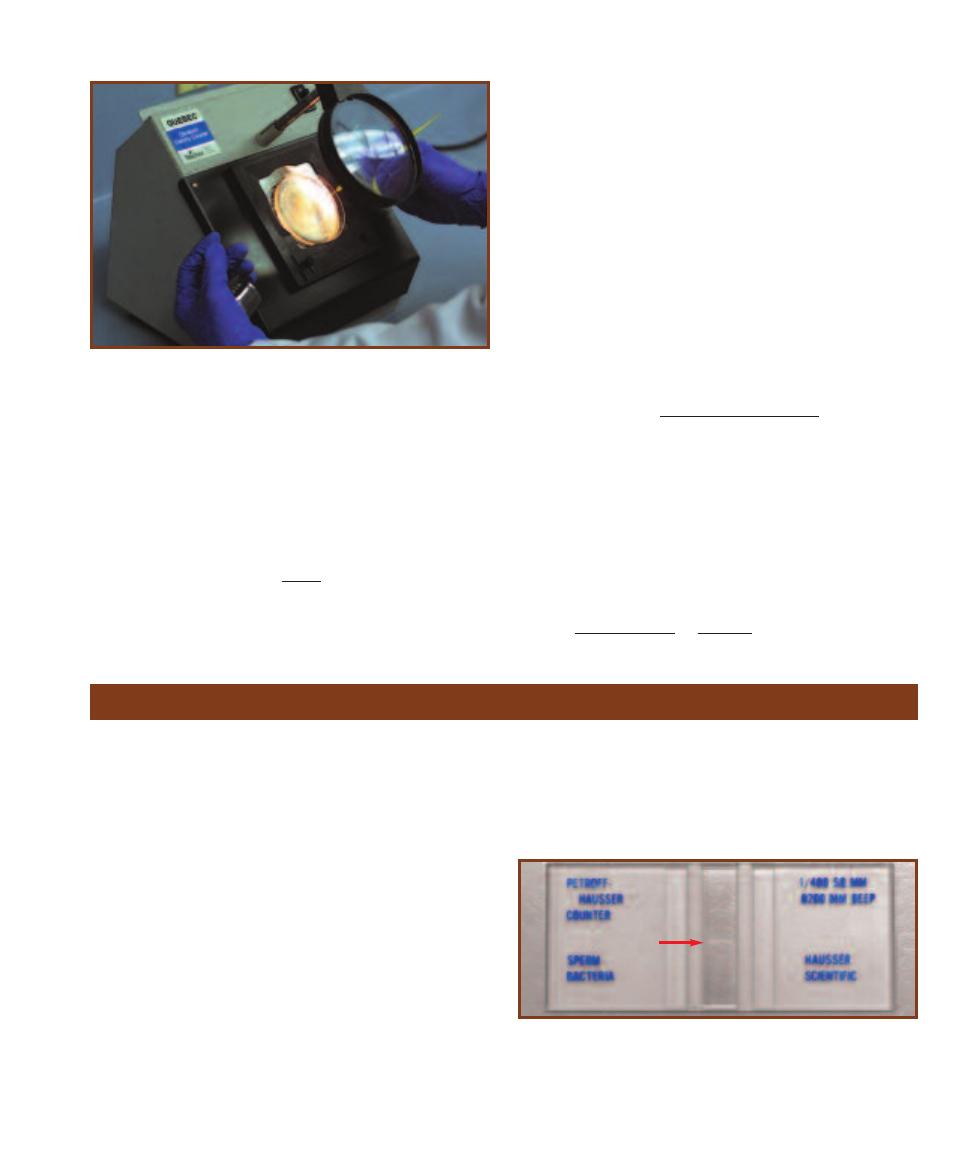
Spreading a known volume of this dilution onto an agar
plate and counting the colonies that develop would give you
all the information you need to calculate the original cell
density (OCD). Below is the basic formula for this calculation.
CFU
OCD
D V
CFU (colony forming units) is actually the number of
colonies that develop on the plate. CFU is the preferred term
because colonies could develop from single cells or from
groups of cells, depending on the typical cellular arrangement
of the organism. D is the dilution as written on the dilution
tube from which the inoculum comes. V is the volume
transferred to the plate. (Note: The volume is included in
the formula because densities are expressed in CFU/mL,
therefore a 0.1 mL inoculation—which would contain
1/10th as many cells as 1 mL—must be accounted for.)
As you can see in the formula, the volume of original
sample being transferred to a plate is the product of the
volume transferred and the dilution of the tube from which
it came. Therefore 0.1 mL transferred from 10
–2
dilution
contains only 10
–3
mL of the original sample (0.1 mL
10
–2
).
The convention among microbiologists is to condense D and
V in the formula into “Original sample volume” (expressed
in mL). The formula thus becomes,
CFU
OCD
Original sample volume
The sample volume is written on the plate at the time of
inoculation. Following a period of incubation, the plates are
examined, colonies are counted on the count able plates, and
calculation is a simple division problem. Suppose, for exam-
ple, you inoculated a plate with 0.1 mL of a 10
–5
dilution.
This plate now contains 10
–6
mL of original sample. Suppose,
too, that after incubation you count 37 colonies on this
plate. Calculation would be as follows:
CFU
37 CFU
OCD
3.7 10
7
CFU/mL
Sample volume
10
–6
mL
SECTION 18
Quantitative Microbiology
219
18-3
C
OLONY
C
OUNTER
The magnifying lens and grid (Figure 18-2)
make colony counting easier. Counted colonies are either punched with
an inoculating needle (as in the photo) or marked on the Petri dish base
with a pen to ensure all colonies are counted and none are counted twice.
A hand tally counter (seen in the left hand) is used to ensure that distrac-
tions don’t cause the microbiologist to lose track of the counted colonies.
Direct Count (Petroff-Hausser)
Purpose
The direct count method is used to determine bacterial cell
density in a sample.
Principle
Microbial direct counts, like plate counts, take a small
portion of a sample and use the data gathered from it to
calculate the overall population cell density. This is made
possible with a device called a Petroff-Hausser counting
chamber. The Petroff-Hausser counting chamber is very
much like a microscope slide with a 0.02 mm deep chamber
or “well” in the center containing an etched grid (Figure
18-4). The grid is one square millimeter and consists of 25
large squares, each of which contains 16 small squares,
making a total of 400 small squares. Figures 18-5 and 18-6
illustrate the counting grid.
When the well is covered with a cover glass and filled
with a suspension of cells, the volume of liquid above each
small square is 5
10
–8
mL. This may seem like an extremely
small volume, but the space above each small square is large
enough to hold about 50,000 average-size cocci! Fortu-
nately, dilution procedures prevent this scenario from occur-
ring and cell counting is easily done using the microscope.
Original cell density (OCD) is determined by counting
the cells found in a predetermined group of small squares and
18-4
P
ETROFF
-H
AUSSER
C
OUNTING
C
HAMBER
The Petroff-Hausser
counting chamber is a device used for the direct counting of bacterial
cells. Bacterial suspension is drawn by capillary action from a pipette
into the chamber enclosed by a coverslip. The cells are then counted
against the grid of small squares in the center of the chamber. The
horizontal lines of the grid are faintly visible at the arrow.
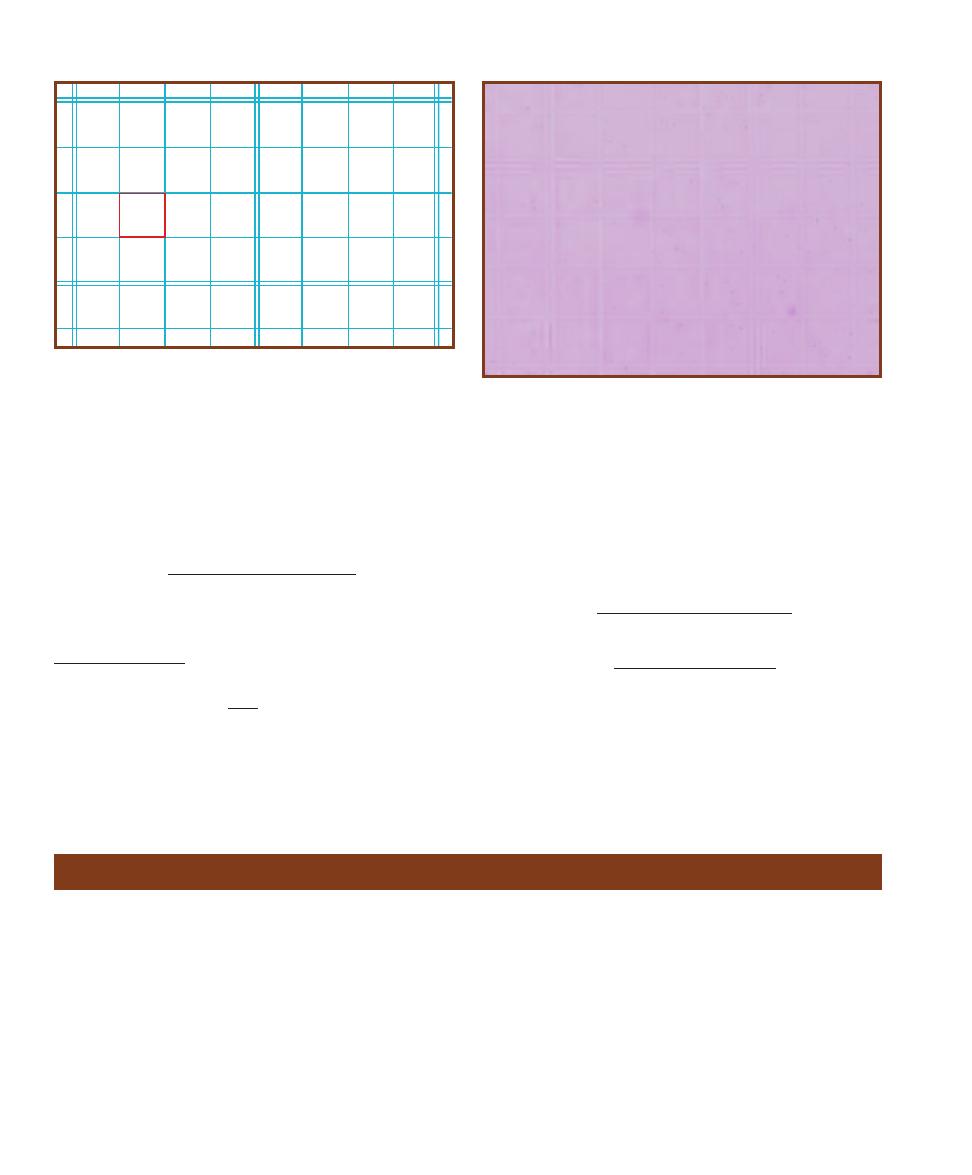
dividing by the number of squares counted multiplied by the
dilution
1
and the volume of sample above one small square.
The following is a standard formula for calculating
original cell density in a direct count.
Cells counted
OCD
(Squares)(Dilution)(Volume)
To maintain accuracy, some experts recommend a
minimum overall count of 600 cells in one or more samples
taken from a single population. Optimum density for count-
ing is between 5 and 15 cells per small square.
If, for example, 200 cells from a sample with a dilution
of 10
–2
were counted in 16 squares (remembering that the
volume above a single small square is 5
10
–8
mL), the cell
density in the original sample would be calculated as follows:
Cells counted
OCD
(Squares) (Dilution) (Volume)
200 cells
OCD
(16)(10
–2
)(5
10
–8
mL)
OCD 2.5
10
10
cells/mL
The advantages of direct counting are that it is fast, easy
to do, and relatively inexpensive. The major disadvantage is
that living as well as dead cells are counted.
220
A Photographic Atlas for the Microbiology Laboratory
18-5
P
ETROFF
-H
AUSSER
C
OUNTING
C
HAMBER
G
RID
This drawing
shows a portion of the Petroff-Hausser counting chamber grid. The
smallest squares are the ones referred to in the formula. The volume
above a small square is 5
10
–8
mL. When cells land on a line, count
them with the square below or to the right.
18-6
O
RGANISM IN A
P
ETROFF
-H
AUSSER
C
OUNTING
C
HAMBER
This is a 10
–4
dilution of Vibrio natriegens on the grid. Can you determine
the original cell density?
Plaque Assay for Determination of Phage Titer
Purpose
This technique is used to determine the concentration of
viral particles in a sample. Samples taken over a period of
time can be used to construct a viral growth curve.
Principle
Viruses that attack bacteria are called bacteriophages, or
simply phages (Figures 18-7, 10-2, and 10-3). Some viruses
attach to the bacterial cell wall and inject viral DNA into
the bacterial cytoplasm. The viral genome then commands
the cell to produce more viral DNA and viral proteins,
which are used for the assembly of more phages. Once as-
sembly is complete, the cell lyses and releases the phages,
which then attack other bacterial cells and begin the replica-
tive cycle all over again. This process, called the lytic cycle,
is shown in Figure 10-4.
Lysis of bacterial cells growing in a lawn on an agar
plate produces a clearing that can be viewed with the
naked eye. These clearings are called plaques. In the plaque
assay, a sample of bacteriophage (generally diluted by
means of a serial dilution) is added to a plate inoculated
1
Dilutions are calculated using the following formula.
V
1
D
1
D
2
V
2
D
2
is the new dilution to be determined. V
1
is the volume of sample being
diluted. D
1
is the dilution of the sample before adding diluent (undiluted
samples have a dilution factor of 1). V
2
is the new combined volume of
sample and diluent after the dilution is completed.
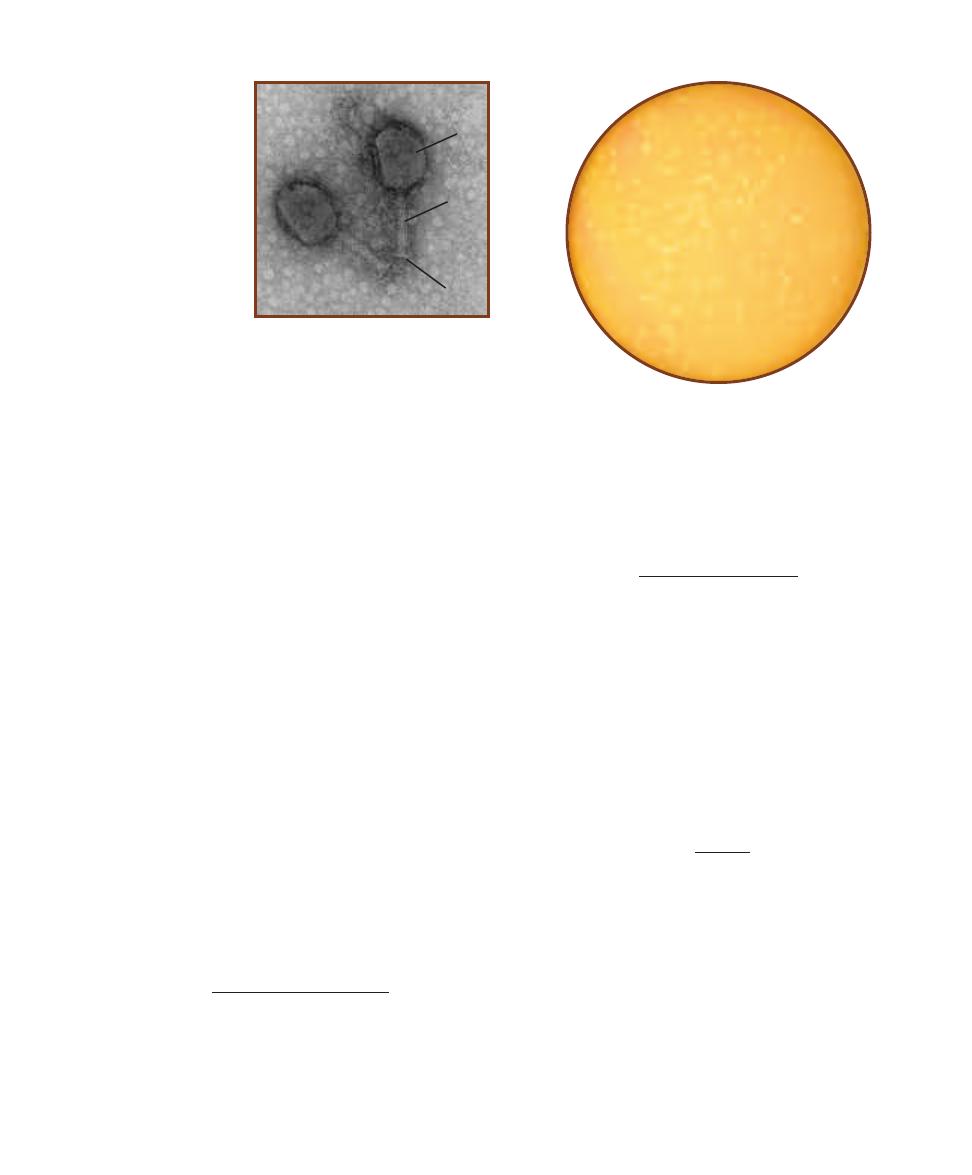
with enough bacterial host to produce a lawn of growth.
After incubation, the number of plaques formed can be used
to calculate the original phage titer (density).
Plaque assay technique is similar to the standard plate
count in that it employs a serial dilution to produce count -
able plates needed for later calculations. (Note: Refer to
Standard Plate Count, pages 217–219, as needed for a
description of serial dilutions and calculations.) One key
difference is that the plaque assay is done using the pour-
plate technique, in which bacterial cells and viruses are first
added to molten agar and then poured into the plate.
In this procedure, diluted phage is added directly to a
small amount of E. coli culture (its host) and allowed a
15-minute preadsorption period to attach to the bacterial
cells. Then this phage–host mixture is added to a tube of
soft agar, mixed, and poured onto prepared Nutrient Agar
plates as an agar overlay. The consistency of the solidified
soft agar is sufficient to immobilize the bacteria while allow -
ing the smaller bacteriophages to diffuse short distances
and infect surrounding cells. During incubation, the E. coli
produces a lawn of growth on the plate in which plaques
appear where contiguous cells have been lysed by the virus
(Figure 18-8).
The procedure for counting plaques is the same as that
for the standard plate count. To be statistically reliable,
countable plates must have between 30 and 300 plaques.
Calculating phage titer (original phage density) uses the
same formula as other plate counts except that PFU (plaque
forming unit) instead of CFU (colony forming unit) becomes
the numerator in the equation. Phage titer, therefore, is
expressed in PFU/mL and the formula is written as follows:
PFU
Phage titer
Volume plated
Dilution
As with the standard plate count, it is customary to
condense volume plated and dilution into original sample
volume. The formula then becomes:
PFU
Phage titer
Original sample volume
The original sample volume is written on the plate at the
time of inoculation. Following a period of incubation, the
plates are examined, plaques are counted on the countable
plates, and calculation is a simple division problem.
Suppose, for example, you inoculated a plate with 0.1 mL
of a 10
–4
phage dilution mixed with a few mL E. coli broth
culture. (Remember, you are calculating the phage density;
the E. coli has nothing to do with the calculations.) This
plate now contains 10
–5
mL of original phage sample. If you
subsequently counted 45 plaques on the plate, calculation
would be as follows:
45 PFU
Original phage density
4.5
10
6
PFU/mL
10
–5
mL
SECTION 18
Quantitative Microbiology
221
18-8
C
OUNTABLE
P
LATE
This plaque assay
plate has between 30 and 300 plaques; therefore,
it is “countable.”
18-7
T4 C
OLIPHAGE
This is a negative stain of
two T4 phage par ticles.
Shown are the capsid (
C),
tail (T), and base plate
(
B). Tail fibers are visible
only as broken pieces
in the background. The
length of this phage from
base plate to tip of capsid
is approximately 180 nm
(0.18 µm).
Photo by author taken at the
San Diego State University
Electron Microscope Facility
C
T
B
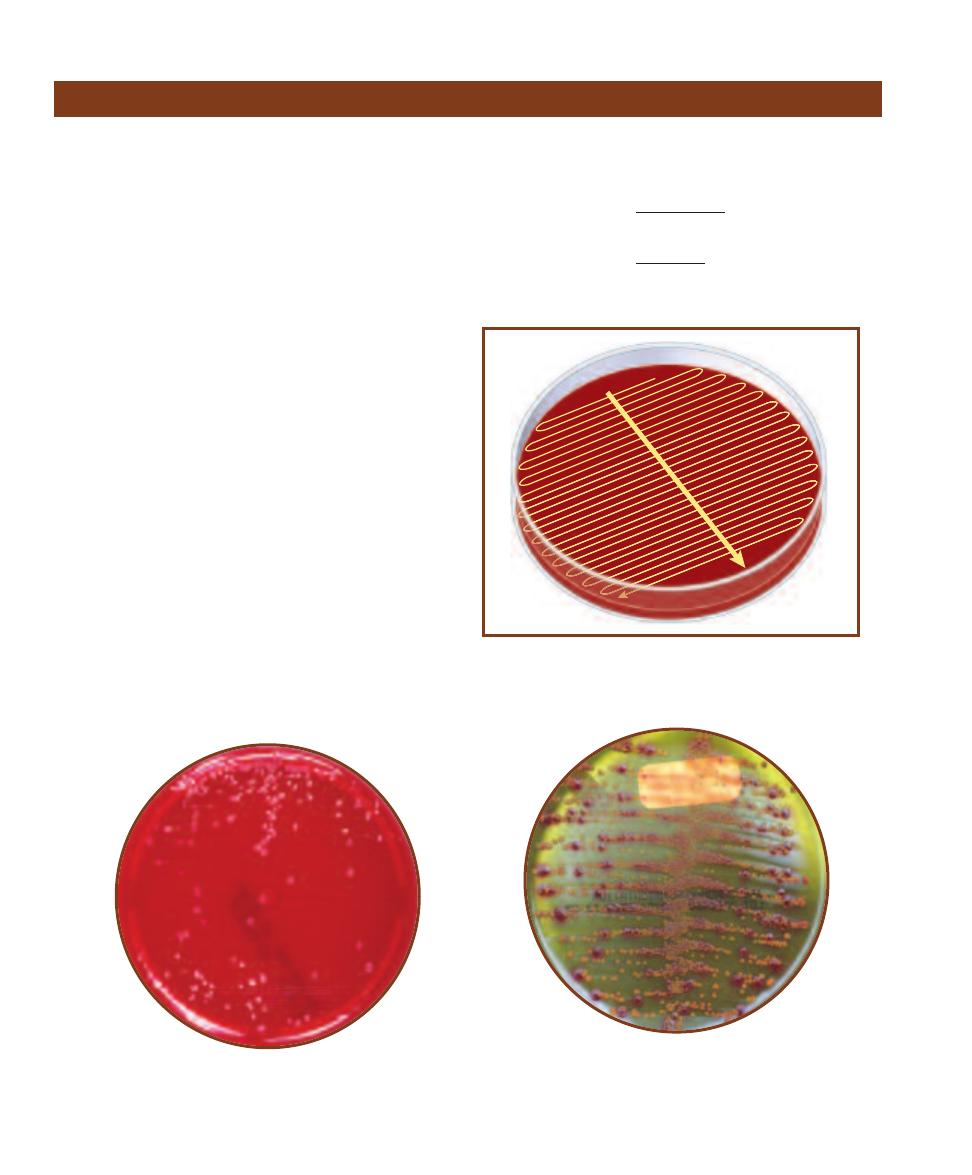
Purpose
Urine culture is a common method of detecting and quan -
tifying bacteria responsible for urinary tract infections. It
frequently is combined with selective media for specific identi-
fication of members of Enterobacteriaceae or Streptococcus.
Principle
Urine culture is a semiquantitative CFU (colony-forming
unit) counting method that quickly produces countable
plates without a serial dilution. The instrument used in this
procedure is a volumetric loop, calibrated to hold 0.001 mL
or 0.01 mL of sample. Urine culture procedures using volu-
metric loops are useful in situations where a rapid diagnosis
is essential and approximations (10
2
CFU/mL) are suffi-
cient to choose a course of action. Volumetric loops are
useful substitutes for serial dilutions in situations where
population density is not likely to exceed 10
5
CFU/mL.
In this standard procedure, a loopful of urine is care-
fully transferred to a Blood Agar plate. The initial inocula-
tion is a single streak across the diameter of the agar plate.
Then the plate is turned 90° and (without flaming the loop)
streaked again, this time across the original line in a zigzag
pattern to evenly disperse the bacteria over the entire plate
(Figure 18-9). Following a period of incubation, the result-
ing colonies are counted and population density, usually re-
ferred to as “original cell density,” or OCD, is calculated
(Figures 18-10 and 18-11).
OCD is recorded in “colony forming units,” or CFU per
milliliter (CFU/mL). CFU/mL is determined by dividing the
number of colonies on the plate by the volume of the loop.
For example, if 75 colonies are counted on a plate inoculated
with a 0.001 mL loop, the calculation would be as follows:
CFU
OCD
loop volume
75 CFU
OCD
0.001 mL
OCD 7.5
10
4
CFU/mL
222
A Photographic Atlas for the Microbiology Laboratory
18-9
S
EMIQUANTITATIVE
S
TREAK
M
ETHOD
Streak 1 is a simple
streak line across the diameter of the plate. Streak 2 is a tight streak
across Streak 1 to cover the entire plate. The loop is not flamed
between streaks.
I
II
18-10
U
RINE
S
TREAK ON
S
HEEP
B
LOOD
A
GAR
This plate was inoculated with a 0.01 mL volumetric
loop. The cell density (in CFU/mL) can be determined
by divid ing the number of colonies by 0.01.
18-11
U
RINE
S
TREAK ON
CHROM
AGAR
O
RIENTATION
M
EDIUM
This medium enables differenti ation of bacterial
species or genera by color production. The rose- colored
colonies are Escherichia coli; the brown colonies are Proteus
mirabilis. Both organisms are common urinary pathogens.
Urine Streak—Semiquantitative Method
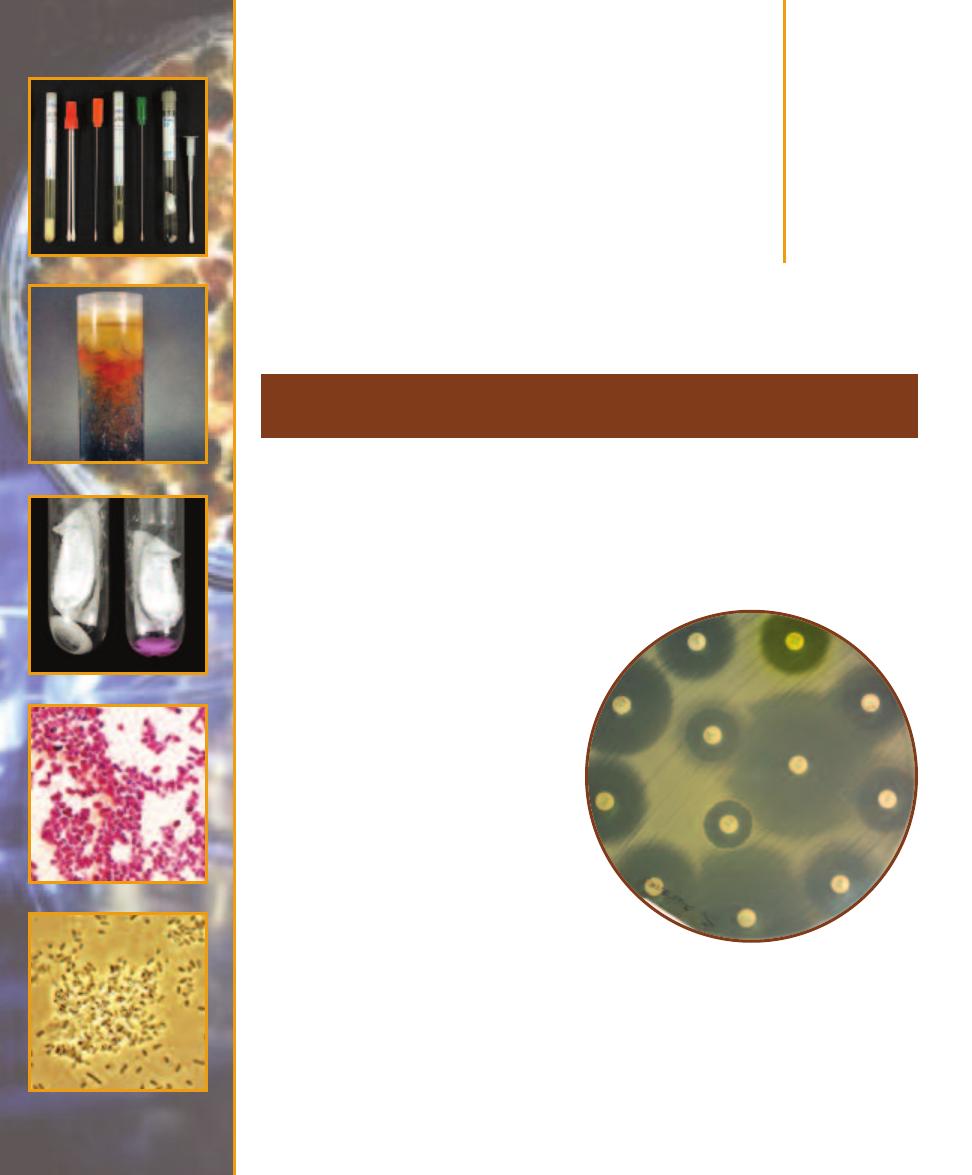
Medical,
Environmental, and
Food Microbiology
Purpose
Antimicrobial susceptibility testing is a standardized method that is used to measure the effective-
ness of anti biotics and other chemotherapeutic agents on pathogenic microorganisms. In many
cases, it is an essential tool in prescribing appropriate treatment.
Principle
Antibiotics are natural antimicrobial agents produced by
microorganisms. One type of penicillin, for example,
is produced by the mold Penicillium notatum (Figure
15-25). Today, because many agents that are used
to treat bacterial infections are synthetic, the
terms antimicrobials or antimicrobics are used
to describe all substances used for this purpose.
The Kirby-Bauer test, also called the disk
diffusion test, is a valuable standard tool for
measuring the effectiveness of antimicrobics
against pathogenic micro organisms. In the
test, antimicrobic-impregnated paper disks
are placed on a plate that is inoculated to form
a bacterial lawn. The plates are incubated to
allow growth of the bacteria and time for the
agent to diffuse into the agar. As the drug moves
through the agar, it establishes a concentra-
tion gradient. If the or ganism is susceptible
to it, a clear zone will appear around the
disk where growth has been inhibited (Fig-
ures 19-1 and 19-2).
The size of this zone of inhibition depends
upon the sensitivity of the bacteria to the
specific antimicrobial agent and the point at
which the chemical’s minimum inhibitory
concentration (MIC) is reached. Some
drugs kill the organism and are said to be
Antimicrobial Susceptibility Test
(Kirby-Bauer Method and E Test)
19
S E C T I O N
223
19-1
D
ISK
D
IFFUSION
T
EST OF
M
ETHICILLIN
-
S
USCEPTIBLE
S
TAPHYLOCOCCUS AUREUS
This plate illus-
trates the effect of (clockwise from top outer right) Nitro -
furantoin (F/M300), Norfloxacin (NOR 10), Oxacillin (OX 1),
Sulfisoxazole (G .25), Ticarcillin (TIC 75), Trimethoprim-
Sulfamethoxazole (SXT), Tetracycline (TE 30), Ceftizoxime
(ZOX 30), Ciprofloxacin (CIP 5), and (inner circle from right)
Penicillin (P 10), Vancomycin (VA 30), and Trimethoprim
(TMP 5) on Methicillin-resistant S. aureus. Compare the zone
sizes with those in Figure 19-2, paying particular attention
to Ceftizoxime, Oxacillin, and Penicillin.
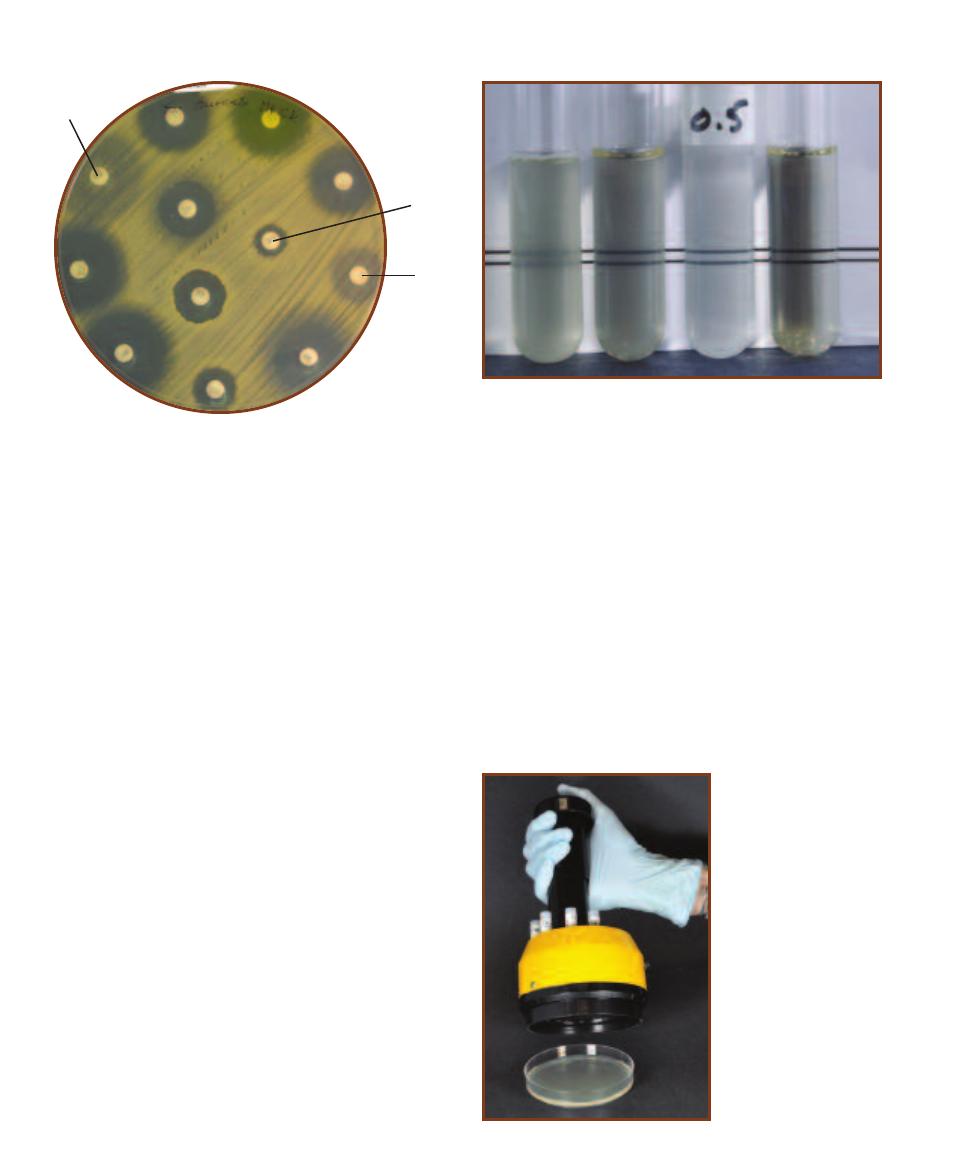
bactericidal. Other drugs are bacterio static; they stop growth
but don’t kill the microbe.
All aspects of the Kirby-Bauer procedure are standardized
to ensure reliable results. Therefore, care must be taken to
adhere to these standards. Mueller-Hinton agar, which has
a pH between 7.2 and 7.4, is poured to a depth of 4 mm in
either 150 mm or 100 mm Petri dishes. The depth is impor-
tant because of its effect upon diffusion. Thick agar slows
lateral diffusion and thus produces smaller zones than plates
held to the 4 mm standard. Inoculation is made with a
broth culture diluted to match a 0.5 McFarland turbidity
standard (Figure 19-3).
The disks, which contain a specified amount of the
antimicrobial agent (printed on the disk) are dispensed
onto the inoculated plate and incubated at 352°C (Figure
19-4). After 16 to 18 hours of incubation, the plates are
removed and the clear zone diameters are measured.
Normally, the zones around each antibiotic disk will be
distinct and separate. Occasionally a synergistic effect of
two antibiotics will produce a clear area between the disks
extending beyond the perimeters of the otherwise circular
zones (Figure 19-5). In this area between the zones both
antibiotics are below MIC, but bactericidal in combination
with each other.
The E-test system for determining antibiotic sensitivity,
illustrated in Figure 19-6, is an alternative to the Kirby-Bauer
method and has the added advantage of allowing the MIC
to be determined. It consists of a paper strip with a gradient
of antibiotic concentrations on one surface and a printed
scale on the other. After an agar plate is inoculated with a
lawn of bacteria (as in the Kirby-Bauer method), the strip
is placed, antibiotic side down, on the agar surface. During
incubation, the antibiotic will diffuse into the agar (higher
concentrations traveling farther than lower concentrations)
and an elliptical zone of inhibition will develop. The point
at which the inhibition zone intersects the scale printed on
the strip is the MIC.
19-2
D
ISK
D
IFFUSION
T
EST OF
M
ETHICILLIN
-R
ESISTANT
S
TAPHYLOCOCCUS AUREUS
(MRSA)
The Kirby-Bauer test
illustrating the effect of the same antibiotics as in Figure 19-1
on Methicillin-resistant S. aureus. Compare the zone sizes
with those in Figure 19-1 and note the breakthrough growth
surrounding Ceftizoxime (ZOX) and Oxacillin (OX) and the
significantly smaller zone surrounding Penicillin (P).
19-3
M
C
F
ARLAND
S
TANDARDS
This is a comparison of a 0.5
McFarland turbidity standard to three broths with varying degrees of
turbidity. Each of the 11 McFarland standards (0.5 to 10) contains a spe-
cific percentage of precipitated barium sulfate to produce turbidity. In
the Kirby-Bauer procedure, the test culture is diluted to match the 0.5
McFarland standard (roughly equivalent to 1.5 10
8
cells per mL) before
inoculating the plate. Comparison is made visually by placing a card
with sharp black lines behind the tubes. The 0.5 McFarland standard is
marked in the photo. Notice that the turbidity of the second tube
matches the McFarland standard exactly, whereas the first and fourth
tubes are too turbid and too clear, respectively.
19-4
D
ISK
D
ISPENSER
This antibiotic disk dispenser
is used to uniformly deposit
disks on a Mueller-Hinton
agar plate.
224
A Photographic Atlas for the Microbiology Laboratory
ZOX
P
OX
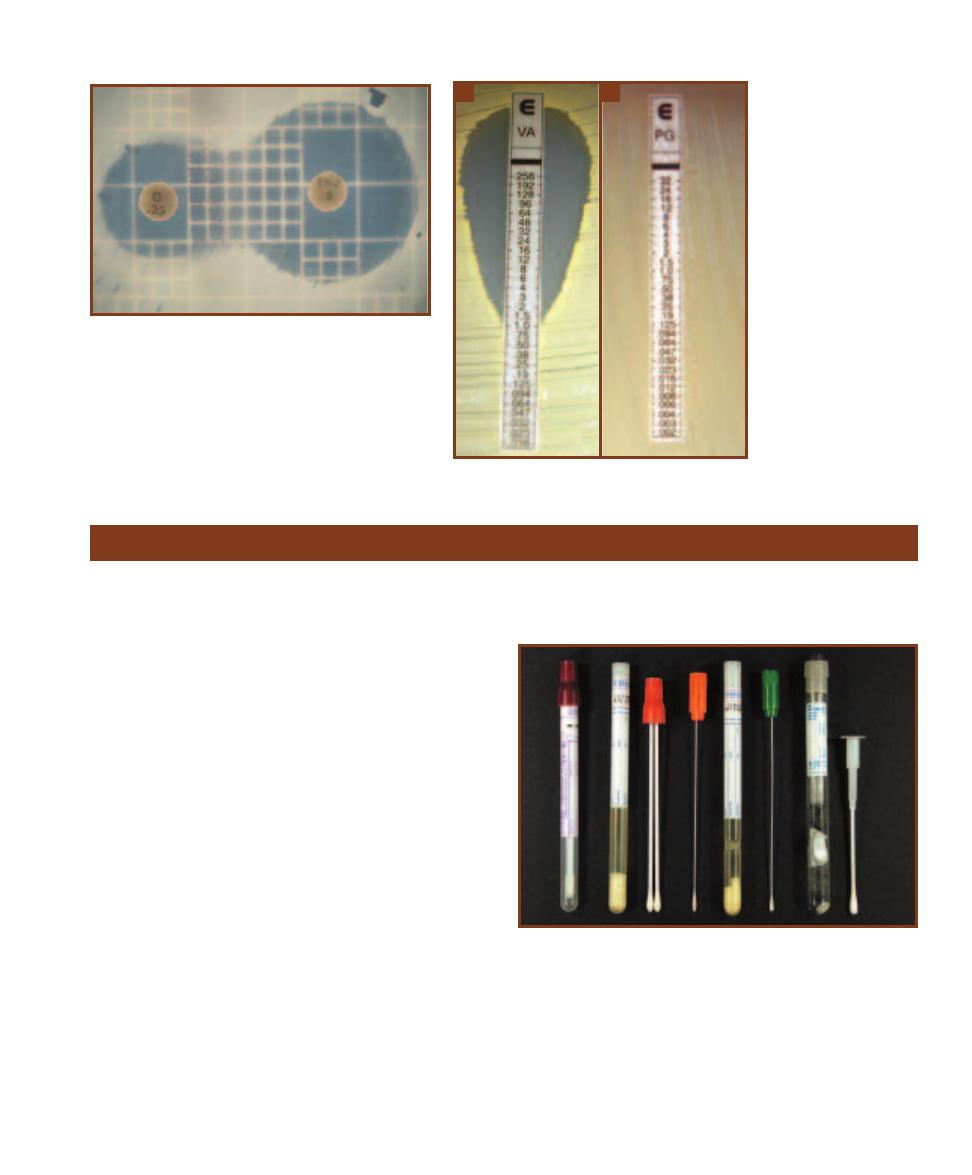
Purpose
Proper collection and transport of patient specimens are
crucial to the correct identification of pathogens by a
clinical laboratory.
Principle
Sample collection and transport are the first steps in identi-
fying pathogens from patients, and their importance cannot
be overstated. Improper collection and transport can make
microbial identification by the laboratory more difficult
assuming that the sample is even usable.
First and foremost, collection of patient specimens for
laboratory diagnosis requires that the site sampled has an
active infection. Collection of patient specimens may involve
tissue removal, collection of sputum, urine or feces, fluid
aspiration, venipuncture, or a surface swab. The method of
choice is dictated by the body region and suspected pathogen,
but regardless of the patient’s normal flora, environmental
surroundings, or the sample taker must not contaminate the
sample. Further, the appropriate sampling instrument and
transport medium must be used. Proper training of medical
staff in sample collection and transport is imperative, because
the laboratory can do little when the sample is contaminated
or is not transported properly.
Samples are frequently obtained with swabs. Swabs
come in a variety of types—wooden, plastic, or metal shafts
and cotton, Dacron, or calcium alginate tips (Figure 19-7).
Plastic swabs are used most often because wooden swabs
may harbor toxins that interfere with microbial growth.
Flexible wire swabs are recommended for nasopharyngeal
19-5
A
NTIBIOTIC
S
YNERGISM
This is an example of
synergism between the antibiotics Sulfisoxazole (
G) and
Trimethoprim (TMP). The numbers on the discs represent
micrograms (µg) of antibiotic.
19-6
E-
TEST
The E-test
is a procedure in which
susceptibility to a particular
antibiotic can be quantified
as a Minimum Inhibitory
Concentration (MIC). After
incubation, the MIC is deter-
mined by where the zone of
inhibition intersects the scale
printed on the strip.
A
Shown
is the zone formed by the
antibiotic vanco mycin when
incubated with Methicillin-re-
sistant Staphylococcus aureus
(MRSA).
B
The anti biotic
penicillin is generally not
effective against Gram-
negative bacteria. Shown is
Escherichia coli grown with
a Penicillin G strip. Note the
absence of an inhibition
zone.
A
B
Sample Collection and Transport
19-7
C
OLLECTION AND
T
RANSPORT
M
EDIA
Various collection
swabs and transport media are shown. The tube with the maroon cap
contains a plastic shaft with a polyurethane tip. Because the polyure -
thane tip is nontoxic, no transport medium is necessary. The red cap
double swab has a rayon tip. The tube to the left contains Stuart’s Liquid
Transport medium, a nonnutritious, buffered medium that keeps the
sample moist. The orange-capped swab has a regular aluminum wire
with a Dacron tip. The green-capped swab has a soft aluminum wire
with a Dacron tip. Both can be transported in the tube between them,
which contains Amie’s medium. So far, all tubes are for transport of
aerobic organisms. The last system on the right is for transporting
anaerobes. See Figure 19-8 for more information.
SECTION 19
Medical, Environmental, and Food Microbiology
225
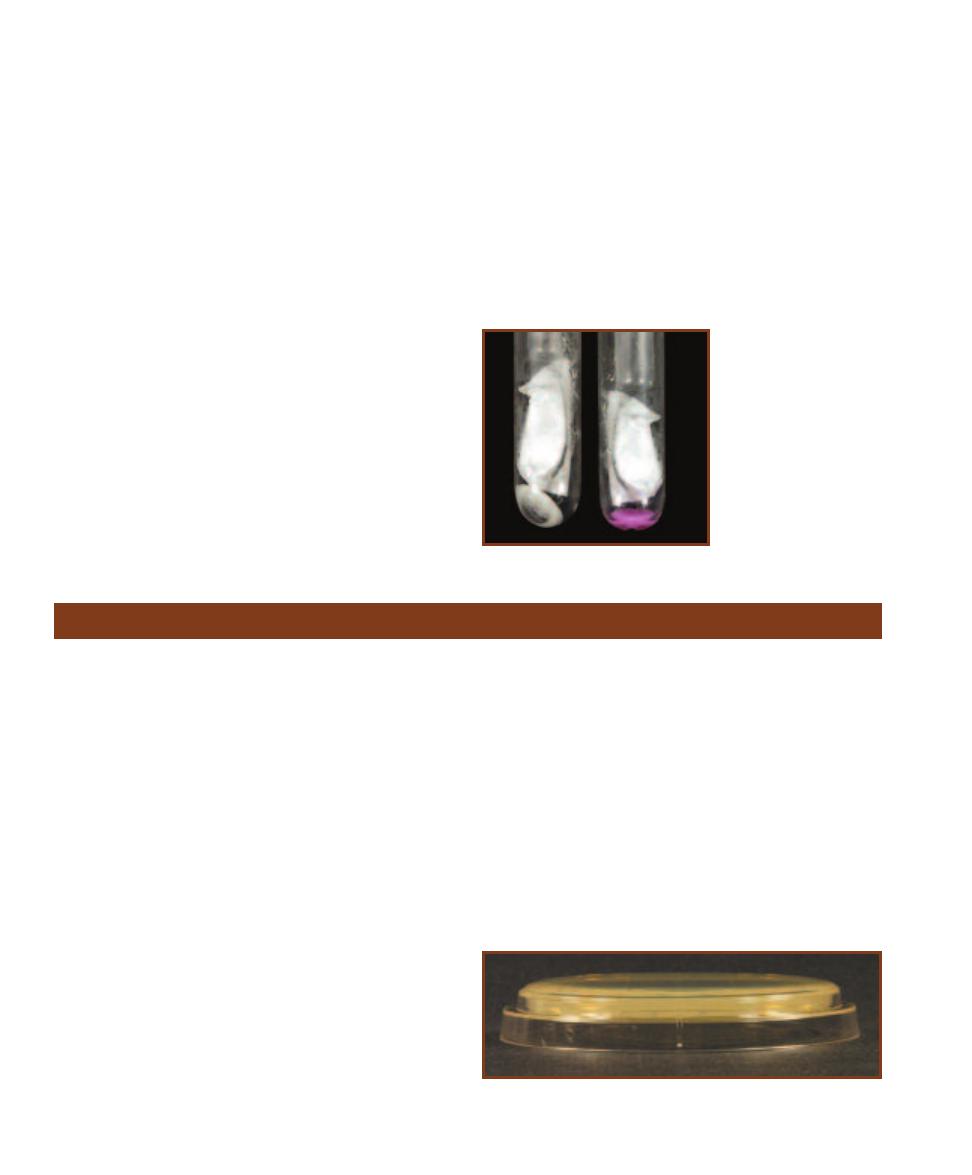
and male urethral samples. Cotton tips are useful in collect-
ing nonfastidious organisms but may contain chemicals
that are inhibitory to fastidious ones. Dacron tips have the
widest application and may even be used for collecting viral
samples. Calcium alginate-tipped swabs are best used to
sample for Chlamydia. Once collected, the sample must be
labeled with all relevant information, including patient name
and ID number, sample site, date and time of collection, and
collector’s initials.
Various guidelines have been developed for transporting
samples within a hospital or between locations, but are
beyond the scope of this book. It stands to reason, though,
that the sample be in a leak-proof container and in an
environment that is suitable for survival of its contents.
A third consideration is time: The faster the sample gets to
the laboratory for processing, the better. Bac terial samples
should be transported within 2 hours, if pos sible; the sample
probably will be useless after 24 hours. And fourth, once in
the laboratory, the sample should be processed in a timely
fashion. In some cases, refrigeration is acceptable for a given
amount of time before processing.
Various transport media are available depending on the
application. Amies, Stuart’s, and Cary-Blair are commonly
used, and we will focus on Amies here. Amies is a defined
medium with a variety of chloride salts to maintain osmotic
pressure. Phosphate buffers maintain the pH, and thiogly-
collate produces a reduced environment to minimize oxi da-
tive damage to the cells. Some formulations contain charcoal
to neutralize fatty acids and bacterial toxins. Note the ab-
sence of a carbon or nitrogen source. This medium is de-
signed to maintain the bacteria, not provide for their growth.
Transport of anaerobes requires a special container that
produces anaerobic conditions inside when the swab is in-
serted. A color indicator is used as a control to assure that
the inside is anaerobic (Figure 19-8).
19-8
T
RANSPORT
S
YSTEM FOR
A
NAEROBES
This is a close-up view of two
anaerobic transport tubes.
They are the same as the
tube shown at the right of
Figure 19-7. The sample is
taken and inserted into the
tube, where it breaks open a
vial that produces anaerobic
conditions. A color indicator
turns pink if oxygen is
present, making the sample
useless.
Environmental Sampling: The RODAC™ Plate
Purpose
The RODAC™ (Replicate Organism Detection and Count-
ing) plate is used to monitor contamination of surfaces in
food preparation, veterinary, pharmaceutical, and medical
settings. The plates also can be used to assess the efficiency
of decontamination of a surface by taking a sample with
different plates before and after decontamination.
Principle
Monitoring of microbial surface contamination is an impor-
tant practice in medical, veterinary, pharmaceutical, and food
preparation settings. Often, the RODAC™ plate is used. It
is a specially designed agar plate into which the medium is
poured to produce a convex surface extending above the
edge of the plate (Figure 19-9). The special design allows
support of the lid above the agar without touching it. As
a result, the sterile plate may be opened and pressed on a
surface to be sampled. Most are 65 mm in diameter, which
is smaller than standard-sized 100 mm Petri dishes. The
smaller size makes it easier to apply uniform pressure across
the entire plate when taking the sample. In addition, the
base is marked in sixteen 1 cm squares, allowing an estimate
of cell density on the surface (Figure 19-10).
The plate can be filled with a variety of media, the choice
of which depends on the surface being sampled and the
microbes to be recovered. For instance, plates with Trypti-
case™ Soy Agar, a good, general-purpose growth medium,
are used. Because the surface sampled may have been dis -
infected recently, Polysorbate 80 and Lecithin are added to
counteract the effect of residual disinfectant. The medium can
be supplemented with 5% sheep blood to improve recovery
of fastidious bacteria. Sabouraud Dextrose Agar is often
employed when monitoring yeast and mold contamination.
The acceptable amount of growth on a RODAC™
plate is determined by the surface being sampled. It stands
to reason that a surgical area would have a lower limit of
acceptability than a food preparation area. Table 19-1
provides some guidelines.
19-9
RODAC™ P
LATE
Notice that the agar extends above the
edges of the plate to allow contact with the surface to be sampled.
226
A Photographic Atlas for the Microbiology Laboratory
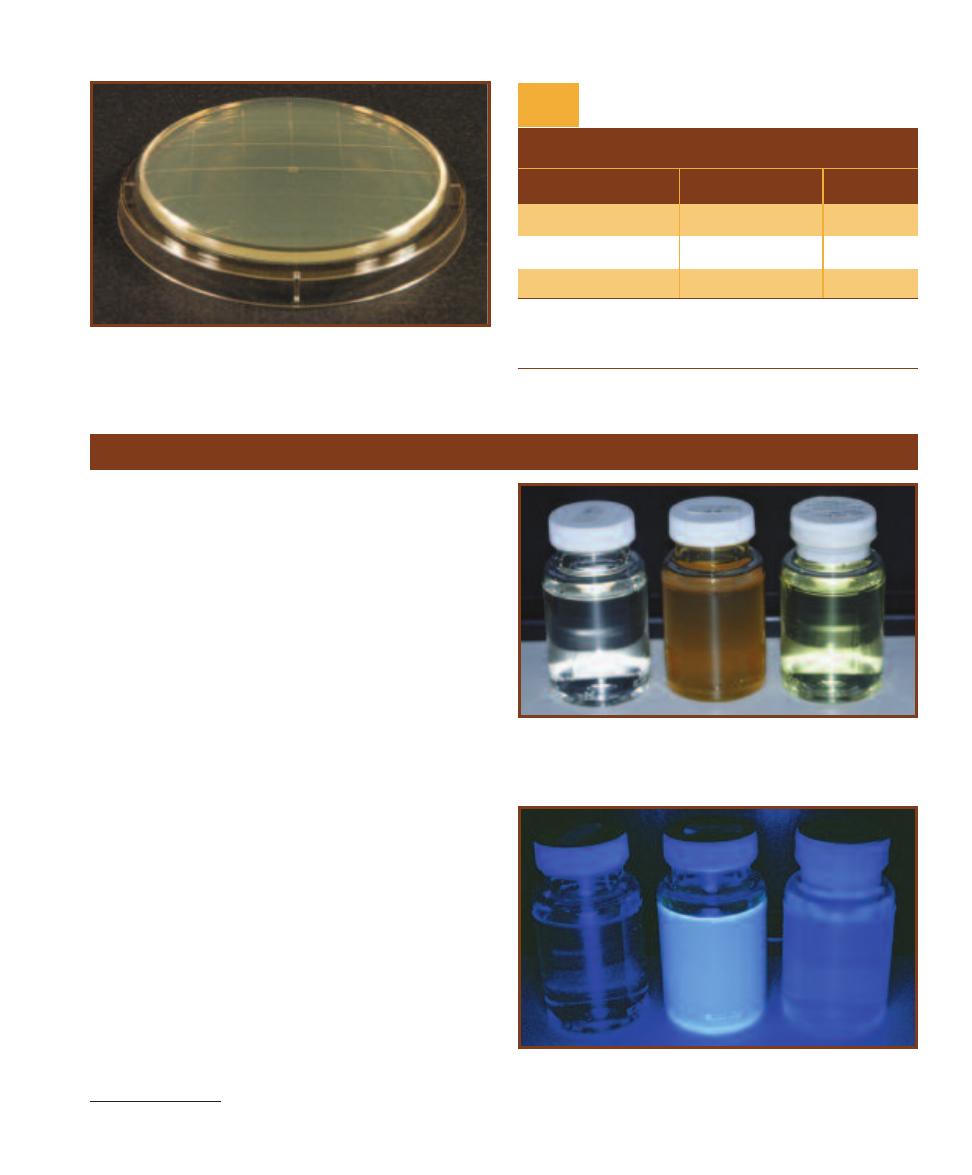
19-10
G
RID ON THE
RODAC™ P
LATE
Typically, RODAC™ plates
are 65 mm in diameter. A grid of 16 squares is molded into the base,
each with an area of 1 cm
2
. Colonies growing in the grid can be counted
and an average number of CFU per cm
2
of surface can be determined.
TA B L E O F R E P R E S E N TAT I V E R E S U LT S
1
(Colonies in 25 cm
2
)
Critical
Interpretation
Surfaces
2
Floors
Good
0–5
0–25
Fair
6–15
26–50
Poor
>16
>50
1
Adapted from BBL™ Trypticase™ Soy Agar with Lecithin and Polysorbate
80 package insert.
2
Critical surfaces include those in operating rooms, nurseries, table tops,
toilet seats, and other nonporous surfaces.
Interpretation of RODAC™ Plate
Colony Counts
T A B L E
19-1
Colilert
®
* Method for Testing Drinking Water
Purpose
The Colilert
®
test is a commercial preparation that examines
drinking water for the presence of total coli forms (in general)
and Escherichia coli (specifically).
Principal
Colilert
®
reagent contains nutrients and salts which favor the
growth of coliforms and inhibit the growth of noncoliforms.
It also contains the indicator nutrients, o-Nitrophenyl-
-D-
Galactopyranoside (ONPG) and 4-Methylumbelliferyl-
-
D-Glucuronide (MUG). The test is conducted by adding
Colilert
®
reagent to a non fluorescing bottle containing a
100 mL sample of drinking water. The sample is incubated
at 35°C for 24–28 hours and then compared to the control.
All coliforms ferment lactose using the enzyme
- galactosidase. ONPG is an artificial substrate of the
same enzyme and, when hydrolyzed, produces the yellow
compound o-Nitrophenol. Refer to Figure 7-73 for this
reaction and Figure 19-11 for the test results. If the test
bottle is as yellow or more yellow than the control, the first
portion of the test is positive and reported as “total coliforms
present.” MUG acts as a substrate for the E. coli enzyme
-glucuronidase, from which a fluorescent compound is
produced. A positive MUG result produces fluorescence
when viewed under an ultra violet lamp (Figure 19-12). If the
test bottle fluorescence is equal to or greater than that of the
control, the presence of E. coli has been confirmed. This
portion of the test is reported as “E. coli present.” A sample
that is not as yellow and does not fluoresce is considered
negative and is reported as “total coliforms absent” and
“E. coli absent.”
*Colilert
®
is a registered trademark of IDEXX Laboratories, Inc.
19-11
C
OLILERT
®
ONPG
This is a Colilert ONPG (o-Nitrophenyl-
-D-Galactopyranoside) test for total coliforms. The bottle on the left is
negative; the bottle in the center is positive; the control “comparator” is
on the right.
19-12
C
OLILERT
®
MUG
This is a Colilert MUG (4-Methylumbellif-
eryl--D-Glucuronide) test for Escherichia coli seen under a UV Lamp.
The bottle on the left is negative; the bottle in the center is positive; the
control “comparator” is on the right.
SECTION 19
Medical, Environmental, and Food Microbiology
227
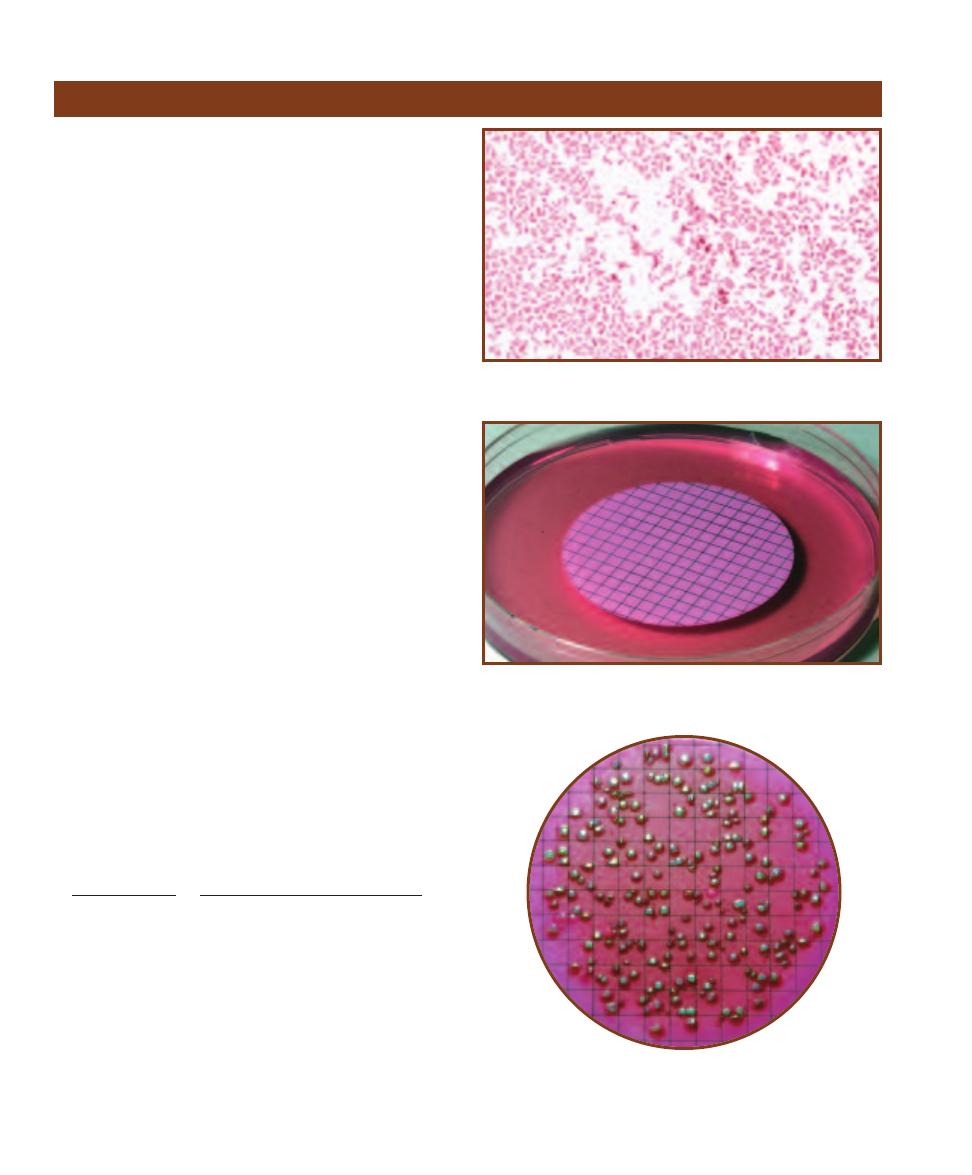
Purpose
The membrane filter technique is commonly used to identify
the presence of fecal coliforms in water.
Principle
Fecal contamination is a common pollutant in open water
and a potential source of serious disease-causing organisms.
Certain members of Enterobacteriaceae, (Gram-negative
facultative anaerobes) such as Escheri chia coli, Klebsiella
pneumoniae, and Enterobacter aerogenes, are able to ferment
lactose rapidly and produce large amounts of acid and gas.
These organisms, called coli forms, are used as the indicator
species when testing water for fecal contamination because
they are relatively abundant in feces and easy to detect
(Figure 19-13). Once fecal contamination is confirmed by
the presence of coliforms, any noncoliforms also present
in the sample can be tested and identified as pathogenic or
otherwise.
In the membrane filter technique, a water sample is
drawn through a special porous membrane designed to
trap microorganisms larger than 0.45 µm. After filtering the
water sample, the membrane (filter) is applied to the surface
of plated Endo Agar and incubated for 24 hours (Figure
19-14).
Endo Agar is a selective medium that encourages Gram-
negative bacterial growth and inhibits Gram- positive
growth. Endo Agar contains lactose for fermentation and a
dye to indicate changes in pH. Because of their vigorous lac-
tose fermentation resulting in acid and aldehyde formation,
coliform colonies typically appear red and/or mucoid with a
gold or green metallic sheen. Noncoliform bacteria (including
several dangerous patho gens) tend to be pale pink, colorless,
or the color of the medium.
After incubation, all red or metallic colonies are counted
and are used to calculate “coliform colonies/100 mL” using
the following formula:
Coliform colonies counted 100
Total coliforms
100 mL
Volume of original sample in mL
A “countable” plate contains between 20 and 80
coliform colonies with a total colony count no larger than
200 (Figure 19-15). To assure that the number of colonies
will fall within this range, it is customary to dilute heavily
polluted samples, thereby reducing the number of cells
collecting on the membrane. When dilution is necessary, it
is important to record the volume of original sample only,
not any added water. Potable water contains less than one
coliform per 100 milliliters of sample.
228
A Photographic Atlas for the Microbiology Laboratory
Membrane Filter Technique
19-13
G
RAM
S
TAIN OF
E
SCHERICHIA COLI
E. coli is a principal
coliform detected by the membrane filter technique.
19-14
F
ILTER
M
EMBRANE
This porous membrane will allow water
to pass through but will trap bacteria and particles larger than 0.45 µm.
19-15
C
OLIFORM
C
OLONIES ON A
M
EMBRANE
F
ILTER
Note the
characteristic dark colonies with a gold or green metallic sheen, indi-
cating that this water sample is contaminated with fecal coliforms.
Potable water has less than one coliform per 100 mL of sample tested.
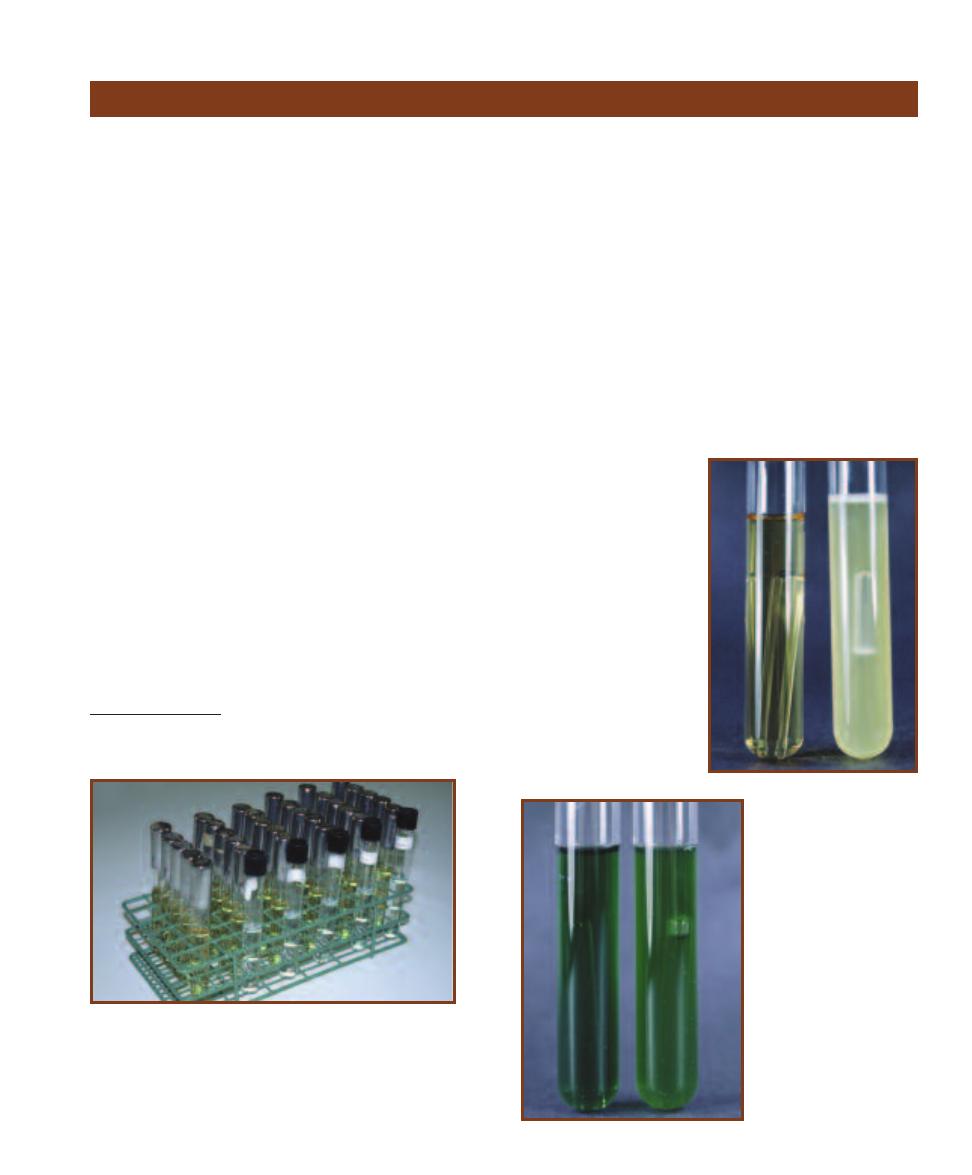
Purpose
This standardized test is used to measure coliform density
(cells/100 mL) in water. It may be used to calculate the den-
sity of all coliforms present (total coliforms) or to calculate
the density of Escherichia coli specifically.
Principle
The multiple tube fermentation method, also called most
probable number, or MPN, is a common means of calculat-
ing the number of coliforms present in 100 mL of a sample.
The procedure determines both total coliform counts and
Escherichia coli counts.
The three media used in the procedure are: Lauryl
Tryptose Broth (LTB), Brilliant Green Lactose Bile (BGLB)
Broth, and EC (E. coli) Broth. LTB, which includes lactose
and lauryl sulfate, is selective for the coliform group. Be-
cause it does not screen out all noncoliforms, it is used to
presumptively determine the presence or absence of col-
iforms. BGLB broth, which includes lactose and 2% bile,
inhibits noncoliforms and is used to confirm the presence
of coliforms. EC broth, which includes lactose and bile salts,
is selective for E. coli when incubated at 45.5°C.
All broths are prepared in 10 mL volumes and contain
an inverted Durham tube to trap any gas produced by fer-
mentation. The LTB tubes are arranged in up to ten groups
of five (Figure 19-16). Each tube in the first set of five re-
ceives 1.0 mL of the original sample. Each tube in the second
group receives 1.0 mL of a 10
–1
dilution. Each tube in group
three receives 1.0 mL of 10
–2
, etc.
1
(Note: The volume of
broth in the tubes is not part of the calculation of dilution
factor. Dilutions of the water sample are made using sterile
water prior to inocu lating the broths. One milliliter of
diluted sample is added to each tube in its designated group.)
After inoculation, the LTB tubes are incubated at
352°C for up to 48 hours, then examined for gas pro -
duc tion (Figure 19-17). Any positive LTB tubes then are used
to inoculate BGLB tubes. Each BGLB receives one or two
loopfuls from its respective positive LTB tube. Again, the
cultures are incubated 48 hours at 352°C and examined
for gas production (Figure 19-18). Positive BGLB cultures
then are transferred to EC broth and incubated at 45.5°C
for 48 hours (Figure 19-19). After incubation the EC tubes
with gas are counted. Calculation of BGLB MPN and EC
MPN is based on the combinations of positive results in
SECTION 19
Medical, Environmental, and Food Microbiology
229
Multiple Tube Fermentation Method for Total Coliform Determination
1
The number of groups, number of tubes in each group, dilutions necessary,
volume of broth in each tube, and volumes of sample transferred vary signifi-
cantly, depending on the source and expected use of the water being tested.
19-16
M
ULTIPLE
T
UBE
F
ERMENTATION
This a multiple tube fer-
mentation of a sea water sample contaminated by sewage. The test
photographed contains six dilution groups (the standard for heavily con -
taminated samples) rather than three, as described in Table 19-2. The
tubes contain Lauryl Tryptose Broth and a measured volume of water
sample as described in the text. Following incubation, each positive
broth (based on gas production) will be used to inoculate a BGLB broth.
19-17
LTB T
UBES
The
bubble in the Durham tube
on the right is presumptive
evidence of coliform contami-
nation. The tube on the left is
negative.
19-18
BGLB B
ROTH
The bubble in the Durham
tube on the right is seen as
confirmation of coliform con-
tamination. The tube
on the left is negative.
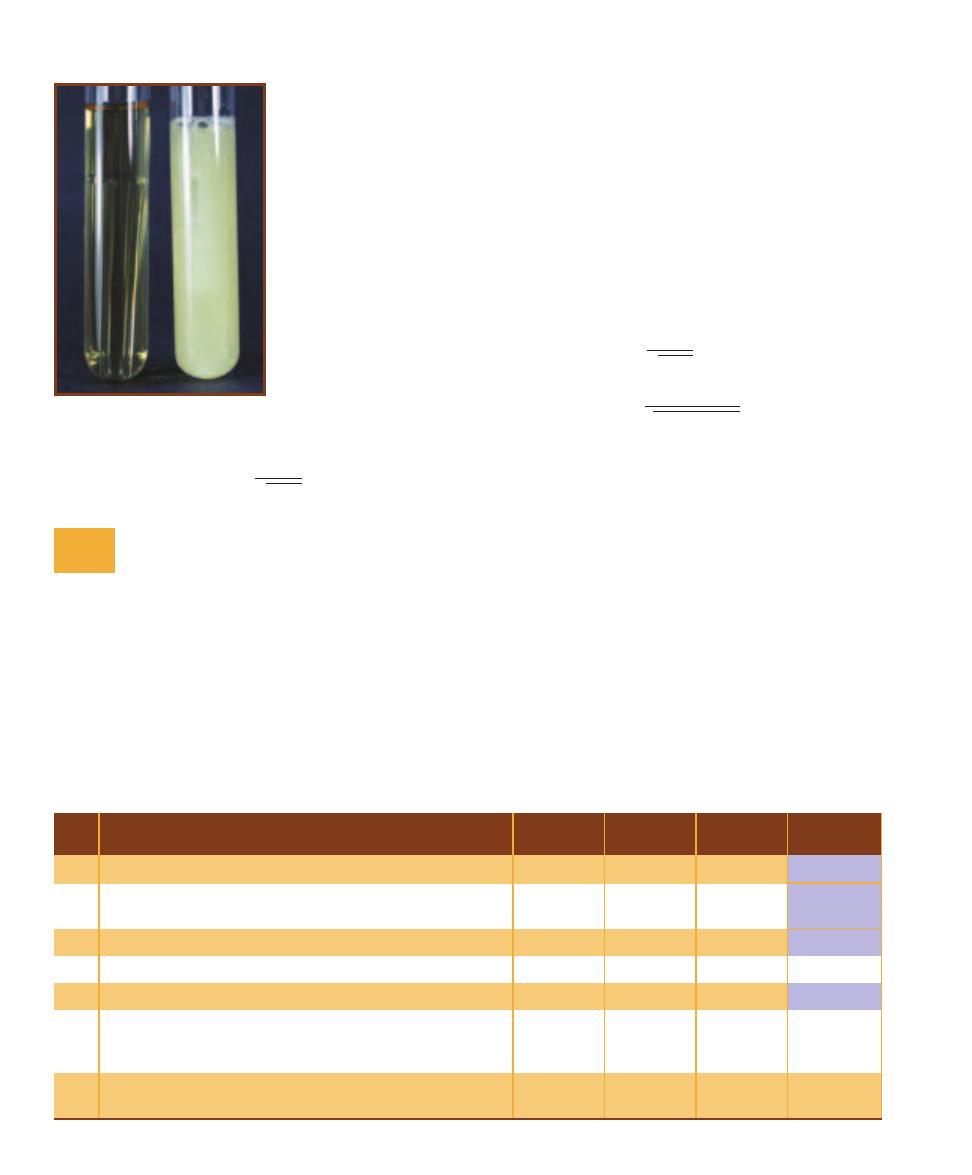
the BGLB and EC broths, respectively, using the following
formula:
100P
MPN/100 mL
V
n
V
a
where
P total number of positive results (BGLB or EC)
V
n
combined volume of sample in LTB tubes that pro-
duced negative results in BGLB or EC
V
a
combined volume of sample in all LTB tubes
It is customary to calculate and report both total coli form
and E. coli densities. Total coliform MPN is cal culated using
BGLB broth results, and E. coli MPN is based on EC broth
results.
Using the data from Table 19-2 and the formula above,
the calculation would be as follows:
100P
MPN/100 mL
V
n
V
a
100 9
MPN/100 mL
0.24 5.55
MPN/100 mL 780
This calculated value is reported as 780 total coliforms per
100 mL of water.
230
A Photographic Atlas for the Microbiology Laboratory
19-19
EC B
ROTH
The
bubble in the Durham tube on
the right is seen as confirmation
of Escherichia coli contamina-
tion. The tube on the left is
negative.
The results shown here are of a hypothetical BGLB test using three groups of five tubes (A, B, and C). A separate table would be produced
using EC broth results. In this example, the original water sample was diluted to 10
0
, 10
–1
, and 10
–2
. The three dilutions were used to inoculate
the broths in groups A, B, and C, respectively. The first row shows the dilution of the inoculum used per group. The second row shows the
actual amount of original sample that went into each broth. The third row shows the number of tubes in each group (five in this example). In
the fourth row the number of tubes from each group of five that showed evidence of gas production has been recorded. This total (in red)
inserts into the equation. Recorded in the fifth row are the numbers of tubes from each group that did not show evidence of gas production.
The sixth row is used for calculating the “combined volume of sample in negative tubes” and refers to the inoculum that went into the LTB
tubes that produced a negative result. (This is calculated by multiplying the number in Row 3 by the number in Row 5 of the same column.)
This total (in red) inserts into the equation. The seventh row is used for calculating the “combined volume of sample in all tubes” and refers
to the total volume of inoculum that went into all LTB tubes. (This is calculated by multiplying the number in Rows 2 and 3 of the same
column.) This total (in red) inserts into the equation. As you can see, the undiluted inoculation (Group A) produced five positive results and
zero negative results; the 10
–1
dilution (Group B) produced three positive results and two negative; and the 10
–2
dilution (Group C) produced
one positive and four negative results. The total volume of original sample that went into LTB tubes was 5.55 mL, 0.24 mL of which produced
no gas (shown in red in rows 7 and 6, respectively).
BGLB Test Results
T A B L E
19-2
Group
Group
Group
Totals
Group
A
B
C
(ABC)
1
Dilution (D)
10
0
10
–1
10
–2
NA
2
Portion of dilution added to each LTB tube that is
original sample (1.0 mL D)
1.0 mL
0.1 mL
0.01 mL
NA
3
# LTB tubes in group
5
5
5
NA
4
# positive BGLB (or EC if that is being calculated) results
5
3
1
9
5
# negative BGLB (or EC if that is being calculated) results
0
2
4
NA
Total volume of original sample in all LTB tubes that
6
produced negative BGLB (or EC if that is being calculated)
0 mL
0.2 mL
0.04 mL
0.24 mL
results (D 1.0 mL # negative tubes)
7
Volume of original sample in all LTB tubes
inoculated (D 1.0 mL # tubes)
5.0 mL
0.5 mL
0.05 mL
5.55 mL

Principle
A few marine bacteria from genera Vibrio
and Photo bacterium are able to emit light
by a process known as bioluminescence.
Many of these organisms maintain
mutualistic relationships with other marine life. For example,
Photobacterium species living in the Flashlight Fish receive
nutrients from the fish and in return provide a unique device
for frightening would-be predators.
Bioluminescent bacteria are given the ability to emit
light because of an enzyme called luciferase (Figure 19-20).
In the presence of oxygen and a long-chain aldehyde (e.g.,
glyceraldehyde), luciferase catalyzes the oxidation of reduced
flavin mono nucleotide (FMNH
2
). In the process, outer elec-
trons surrounding FMN become excited. Light is emitted
when the electronically excited FMN returns to its ground
state (Figure 19-21).
It is estimated that a single Vibrio cell burns between
6000 and 60000 molecules of ATP per second emitting light
(ATP hydrolysis occurs in conjunction with synthesis of the
aldehyde). It also is known that their luminescence only
occurs when a certain threshold population size is reached
in a phenomenon called quorem sensing. This system is
controlled by a genetically produced autoinducer that must
be in sufficient concentration to trigger the reaction.
SECTION 19
Medical, Environmental, and Food Microbiology
231
Bioluminescence
Luciferase
FMNH
2
+ O
2
+ R CH
O
FMN + H
2
O + R C OH + Light
O
19-20
C
HEMISTRY OF
B
IOLUMINESCENT
B
ACTERIA
19-21
B
IOLUMINESCENCE ON AN
A
GAR
P
LATE
This is an unknown
bioluminescent bacteria growing on Seawater Complete (SWC) Agar.
Winogradsky Column
Purpose
The Winogradsky column is a method for growing a variety
of microbes with uniquely microbial metabolic abilities.
Bacterial photoautotrophs, chemolithotrophs, and photo-
heterotrophs may be found in a mature column. And more
“typical” chemoheterotrophs and photoauto trophs also are
likely to be found. A mature Winogradsky column is a good
source for studying these organisms in the laboratory.
Principle
The Winogradsky column bears the name of its developer,
Sergei Winogradsky (1856–1953), a Russian microbiologist
and pioneer in microbial ecology. He studied sulfur bacteria
because of their ease of handling and cultivation, and then
moved on to bacteria associated with the nitrogen cycle.
One of his major discoveries was finding microorganisms
(Beggiatoa) capable of the unheard of type of metabolism
that came to be known as chemolithotrophic autotrophy
(see below). Until he made his discovery, only photoauto -
trophs—those performing photosynthesis—were known to
be autotrophs.
As a result of his work and the work of others, metabolic
categories of microorganisms have been identified based on
their carbon, energy, and electron sources. These are listed
below. Note that in practice, terms are combined to describe
the organism more fully.
Autotroph: an organism capable of obtaining all of its
carbon from CO
2
.
Heterotroph: an organism that can only get its carbon
from organic molecules.
Chemotroph: an organism that gets its energy from the
oxidation of chemicals.
Phototroph: an organism that gets its energy from light
(h
).
Organotroph: an organism that gets its electrons from
an organic molecule.
Lithotroph: an organism that gets its electrons from an
inorganic molecule.
Winogradsky pioneered this method of growing microbes
in the late 19th century. It was (and is) used as a convenient
laboratory source to supply for study a variety of an aerobic,
micro aerophilic, and aerobic bacteria, including purple
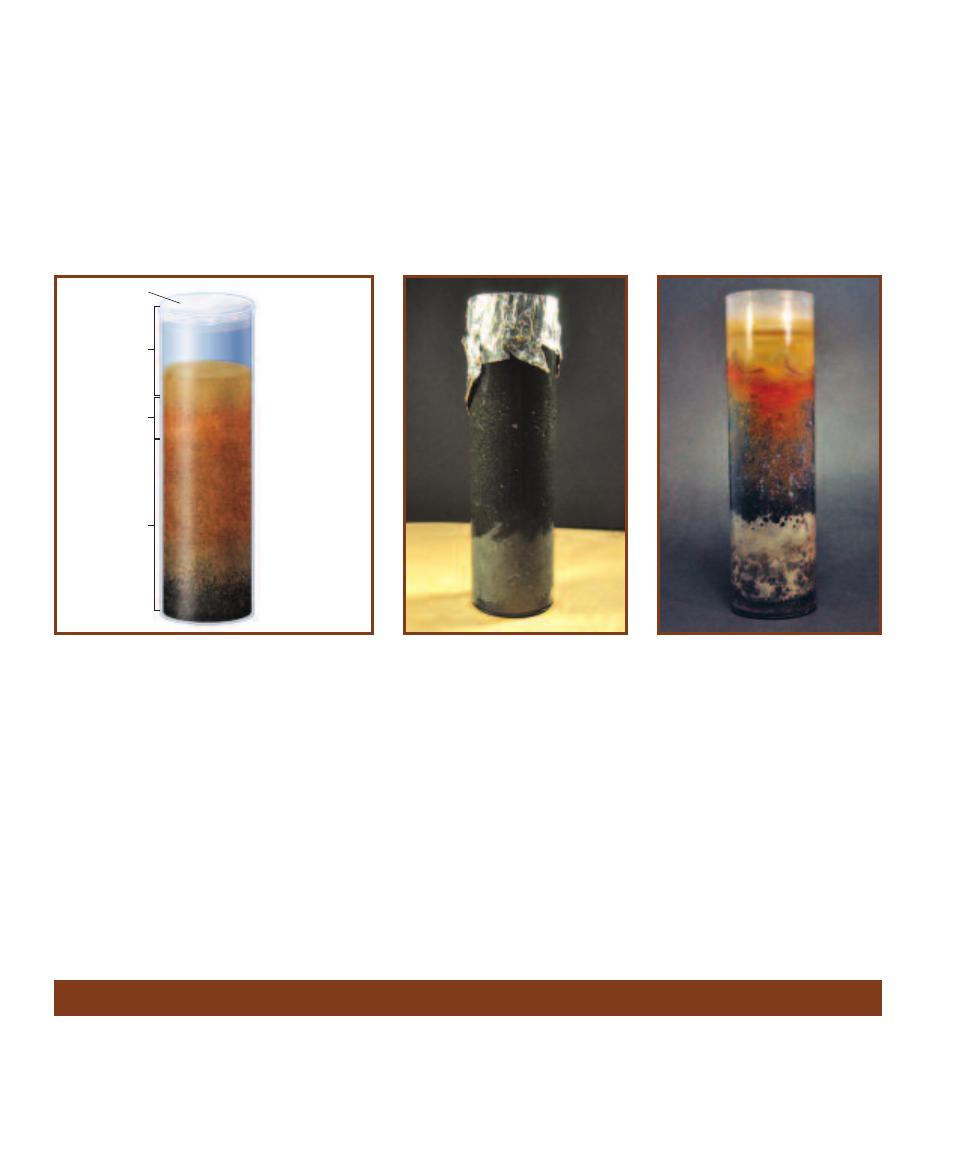
19-22
A
N
A
RTIST
’
S
R
ENDITION OF A
W
INOGRADSKY
C
OLUMN
What you put into a Winogradsky column dic-
tates what you grow. Any well-constructed column has
an oxygen gradient from top to bottom, with the aerobic
zone penetrating perhaps only as much as 20% of the
total depth. The remaining portion of the mud column
becomes progressively more anaerobic. The different
amounts of oxygen lead to layering of microbial com -
munities adapted to that specific environment. This illus-
tration is a generalized picture of the layering that you
might see in a mature column. (The column often produces
intermixed patches rather than distinct layers.) Starting at
the top and working downward, the layers are: air, water
(containing algae and cyanobacteria), aerobic mud (sulfur
oxidizing bacteria), micro aerophilic mud (nonsulfur
photo synthetic bacteria), red/purple zone (purple sulfur
photosynthetic bacteria), green zone (green sulfur photo-
syn thetic bacteria), and black anaerobic zone (sulfur
reducing bacteria).
Aerobic
zone
Plastic wrap
Microaerophilic
zone
Anaerobic
zone
Diatoms
Cyanobacteria
Protists
Aerobic sulfur
oxidizing bacteria
Air
Water
O
2
dominated mud
Rust colored zone
Green zone
Anaerobic H
2
S
dominated zone
(black)
Red zone
Purple sulfur
bacteria
Photoheterotrophs
Non-sulfur bacteria
Green sulfur
bacteria
Sulfur reducing
bacteria
19-23
A F
RESHLY
M
ADE
W
INO
-
GRADSKY
C
OLUMN
The black layer
comprising the majority of the column
is the unenriched mud. The lighter gray
area at the bottom contains mud, CaCO
3
,
CaSO
4
, and shredded paper mixed into a
slurry. Note the absence of air spaces.
19-24
A M
ATURE
W
INOGRADSKY
C
OLUMN AT
E
IGHT
W
EEKS
Notice the
layers and colors! Also notice that the
layers are not as well defined as in
Figure 19-22. In fact, some look mixed
(e.g., the rust and red portions appear
mixed in some regions). But the dark,
anaerobic zone above the whitish layer
at the bottom is well defined. The re-
mainder is—pardon the expression—
clear as mud.
Nitrogen Cycle
Biogeochemical cycles, such as the carbon cycle, the nitrogen
cycle, and the sulfur cycle, are characterized by environmen-
tal phases, in which the element is not incorporated into an
organism, and organismal phases, in which it is. All are im-
portant, but because the nitrogen cycle has so many parts in
which bacteria participate, it will be discussed here. It will
be helpful for you to look at Figure 19-25 as you read the
following.
Organisms require nitrogen as a component of the 20
amino acids, purine and pyrimidine nucleo tides, and other
232
A Photographic Atlas for the Microbiology Laboratory
nonsulfur bacteria, purple sulfur bacteria, green sulfur bac-
teria, chemoheterotrophs, and many others (Figure 19-22).
The basis for the Winogradsky column is threefold. The
first two factors involve opposing gradients that impact the
types of organisms that can grow. The first is the oxygen
gradient, which decreases (gets more and more an aerobic)
toward the bottom. As a result, obligate aerobes, micro -
aerophiles, facultative anaerobes, and obligate anaerobes
are found in different locations in the column. The second is
the H
2
S gradient, which runs opposite in direction to the O
2
gradient. The third factor is the diffuse light shined upon the
column. This promotes growth of phototrophic organisms
at levels where they are adapted to the opposing gradients
of O
2
and H
2
S. These layers of phototrophs occur in natural
ecosystems but are extremely thin because light doesn’t
penetrate mud sediments very far. But with the transparent
column, thicker layers develop and it is easier to obtain
samples for cultures or microscopy (Figures 19-23 and 19-24).
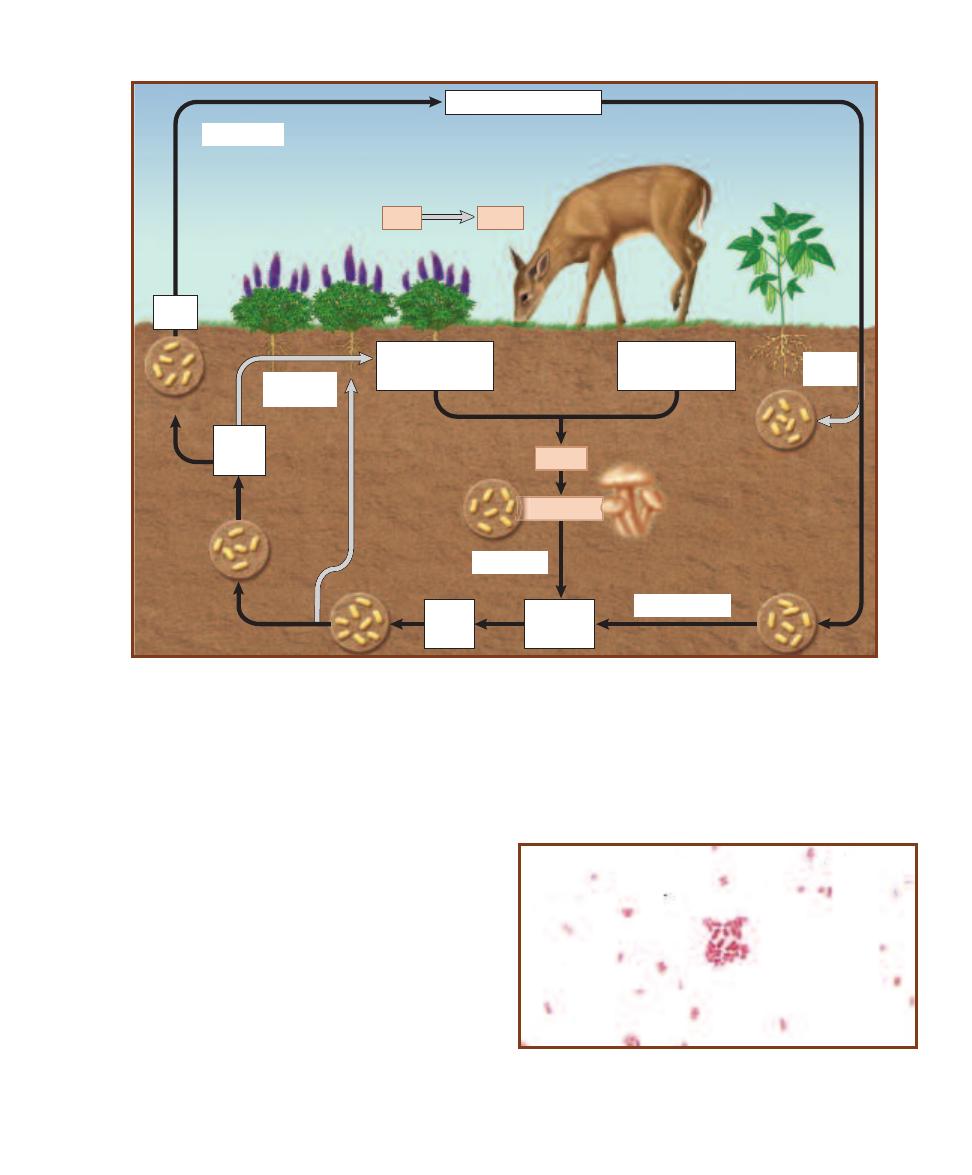
compounds. These organic forms of nitrogen do not occur
outside cells. Most of the air (approximately 80%) is nitro-
gen gas (N
2
), but this is a form of nitrogen that is not usable
by any organisms except nitrogen-fixing bacteria. Some
nitrogen-fixing bacteria (e.g., Rhizobium—Figure 19-26)
are symbionts of certain legumes and form nodules in their
roots (Figures 19-27 and 19-28). Other nitrogen-fixing bac-
teria are free-living in the soil (e.g., Azoto bacter—Figure
19-29) or water (e.g., Anabaena—Figure 19-30). The process
of nitrogen fixation is highly endergonic, requiring about 16
moles of ATP per mole of N
2
reduced to ammonia (NH
3
).
Because nitrogen fixation requires so much energy, the
nitrogenase enzyme is not active if other forms of nitrogen
are available. In addition, nitrogenase is inactivated by oxygen,
so a variety of mechanisms have evolved to protect it from
oxygen, including the heterocysts of filamentous cyanobacteria.
Some chemolithotrophic bacteria are capable of nitrifica-
tion, in which ammonium ion acts as an electron and energy
source when it is oxidized to nitrite, and then to nitrate.
Organisms such as Nitrosomonas oxidize ammonium to
nitrite; then, other nitrifiying organisms, such as Nitro bacter,
continue the oxidation of nitrite to nitrate. The same organ-
isms do not do both.
19-25
T
HE
N
ITROGEN
C
YCLE
The nitrogen cycle involves all forms of metabolism: aerobic respiration (chemoheterotrophic
metabolism), anaerobic respiration, and chemolithotrophic metabolism, in addition to nitrogen fixation. And microbes are participants
in all the steps.
Plant
Animal
Detritus
Decomposers
Nitrogen
fixation
Nitrogen fixation
Nitrogen (N
2
) in atmosphere
Ammonium
(NH
4
+
)
in soil
Nitrites
in soil
(NO
2
-
)
Deamination
Denitrification
Denitrifiers
Nitrifying
bacteria
Decomposition
Death; wastes
Free-living
nitrogen-fixing
bacteria and
cyanobacteria
Nitrogen-fixing
bacteria in root
nodules
Assimilation
by plants
Organic compounds
(e.g., proteins
and nucleotides)
Organic compounds
(e.g., proteins
and nucleotides)
Nitrite
(NO
2
-
)
Nitrates
in soil
(NO
3
-
)
Nitrifying bacteria
19-26
R
HIZOBIUM
G
RAM
S
TAIN
Rhizobium occurs naturally as
a nitrogen-fixing symbiont of leguminous plants. This Gram stain was
made from a culture. Rhizobium and other symbionts are the major
nitrogen-fixers on land.
SECTION 19
Medical, Environmental, and Food Microbiology
233
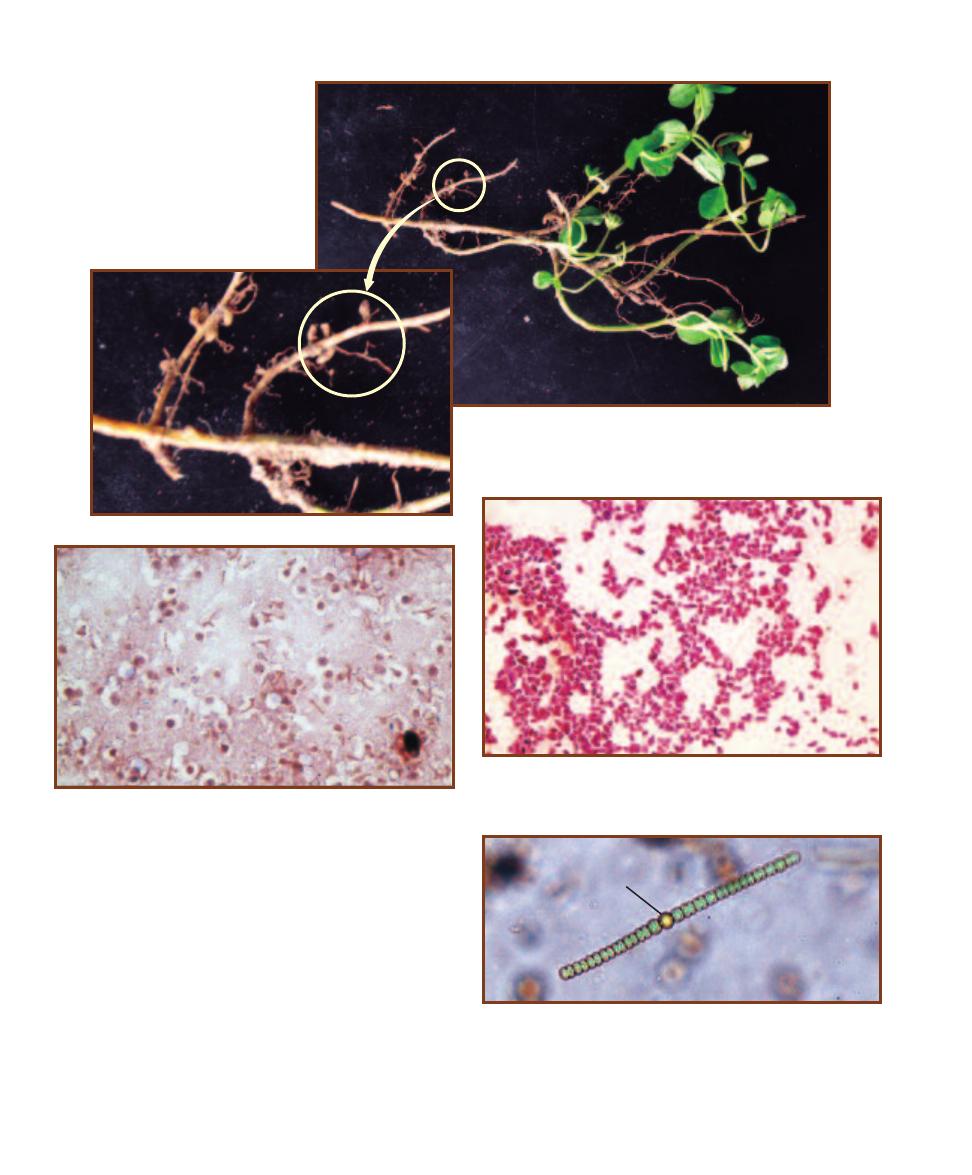
Once nitrogen gas has been reduced to ammonium ion,
it becomes available for assimilation into amino acids by
green plants and other bacteria. It then enters the food chain
as various forms of organic nitrogen, the only form of nitro-
gen consumers can use. Oxidative deamination of amino
acids during hetero trophic catabolism (including decompo-
sition by bacteria and fungi) results in the formation of am-
monium ion once again.
Denitrifying bacteria use nitrate as the final electron ac-
ceptor of anaerobic respiration. The end products of nitrate
reduction include nitrogen gas, nitrite, and ammonium ion.
19-27
C
LOVER
R
OOT
N
ODULES
The roots of this small clover have
been infected with Rhizobium that
causes the formation of tumor-like
root nodules (four are circled).
19-28
R
OOT
N
ODULE
S
ECTION
Symbiotic nitrogen-fixing bacteria,
such as Rhizobium, induce tumor formation in the roots of certain
legumes. Once in the nodule, infected cells become filled with differen -
tiated forms of the bacterium called bacteroids. Uninfected cells are
white in this preparation.
19-29
A
ZOTOBACTER
G
RAM
S
TAIN
Plump, Gram-negative rods
characterize the free-living, nitrogen-fixing Azotobacter. These cells
were grown in culture.
19-30
H
ETEROCYST IN
A
NABAENA
Anabaena is a filamentous
cyanobacterium. Specialized, thick-walled cells called heterocysts (H)
are involved in nitrogen fixation. The oxygen-sensitive nitrogenase
enzyme is protected from oxygen in these cells because they lack Photo -
system II, which produces oxygen from water during photolysis, and
oxygen diffusion from the environment is apparently limited by the thick
wall. Cyanobacteria are the primary N-fixers in aquatic environments.
H
234
A Photographic Atlas for the Microbiology Laboratory

Sulfur Cycle—Introduction
Sulfur Compound
Chemical Formula
Oxidation State
Used By Oxidizers
Used By Reducers
Organic sulfur
R–SH
2
Sulfide
H
2
S, HS
, S
2
2
Elemental sulfur
S
0
0
Thiosulfate
S
2
O
3
2
2 per S
Sulfur dioxide
SO
2
4
Sulfite
SO
3
2
4
Sulfate
SO
4
2
6
Sulfur Compounds and Sulfur Organisms That Use Them
T A B L E
19-3
Representative
Representative
Microbial groups
Organisms
Habitat
Reactions
Summary Reactions
Photoautotrophs
Chromatium,
Anoxic
Anoxygenic
H
2
S CO
2
씮 S
0
[CH
2
O]
Chlorobium
photosynthesis
S
0
CO
2
씮 SO
4
2
[CH
2
O]
Chemolithoautotrophs
Beggiatoa,
Anoxic/oxic
Sulfur/sulfide/
HS
½ O
2
H
씮 S
0
H
2
O
Macromonas,
interface
thiosulfate
H
2
S 2 O
2
씮 SO
4
2
2H
Thiobacillus,
where H
2
S
oxidation
S
0
1½ O
2
H
2
O 씮 H
2
SO
4
Thiobacterium
and O
2
meet
S
2
O
3
2
H
2
O2 O
2
씮 2 SO
4
2
2H
Sulfate/sulfur
Desulfovibrio,
Either oxic
Assimilatory
SO
4
2
씮 S
2
O-acetyl-L-serine
reducers
Desulfobulbus
or anoxic
sulfate reduction
씮 L- cysteine acetate H
2
O
Desulfobacter,
Desulfuromonas
Anoxic
Dissimilatory
SO
4
2
씮 S
0
sulfate reduction
S
0
씮 H
2
S
Many groups
Many organisms
Either oxic
Desulfuration
Organic sulfur compounds
or anoxic
(R–SH) H
2
O 씮 R–OH H
2
S
Major Sulfur Bacteria Reactions
T A B L E
19-4
SECTION 19
Medical, Environmental, and Food Microbiology
235
Sulfur is one of the most abundant elements on Earth. Having
oxidation states from 2 to 6, it is able to form many dif-
ferent compounds usable by living things. Most of the sulfur
compounds used by microorganisms are inorganic molecules,
used strictly for energy or to be incorporated into organic
molecules in biosynthetic processes. Table 19-3 summarizes
some important sulfur compounds and their oxidation states.
The sulfur microorganisms are a diverse group and
include both Bacteria and Archaea. They live in habitats as
diverse as freshwater ponds, lakes, and rivers (especially
where there is sewage contamination), water-saturated soils,
saltwater lagoons, sulfur solfaturas as in Yellowstone National
Park, and in and around deep ocean hydrothermal vents. This
vast group includes photoautotrophs, photoheterotrophs,
chemolithoautotrophs, chemolithohetero trophs, obligate
aerobes, facultative anaerobes, and obligate anaerobes.
Many sulfur oxidizers and reducers live syntrophically
in mutually dependent communities, in which sulfur is con-
verted back and forth between reduced and oxidized forms.
Conversely, sulfur oxidizers living in and around hydro -
thermal vents, although still part of a complex community,
have an abundant source of reduced sulfur flowing up from
the vents. These microbes, receiving no biologically reduced
sulfur, thrive in the ecosystem and produce large living mats
that cover surrounding surfaces.
Sulfur bacteria fall into three major categories—photo -
autotrophs, chemolithoautotrophs, and the sulfur reducers.
Table 19-4 lists the major groups of sulfur bacteria and some
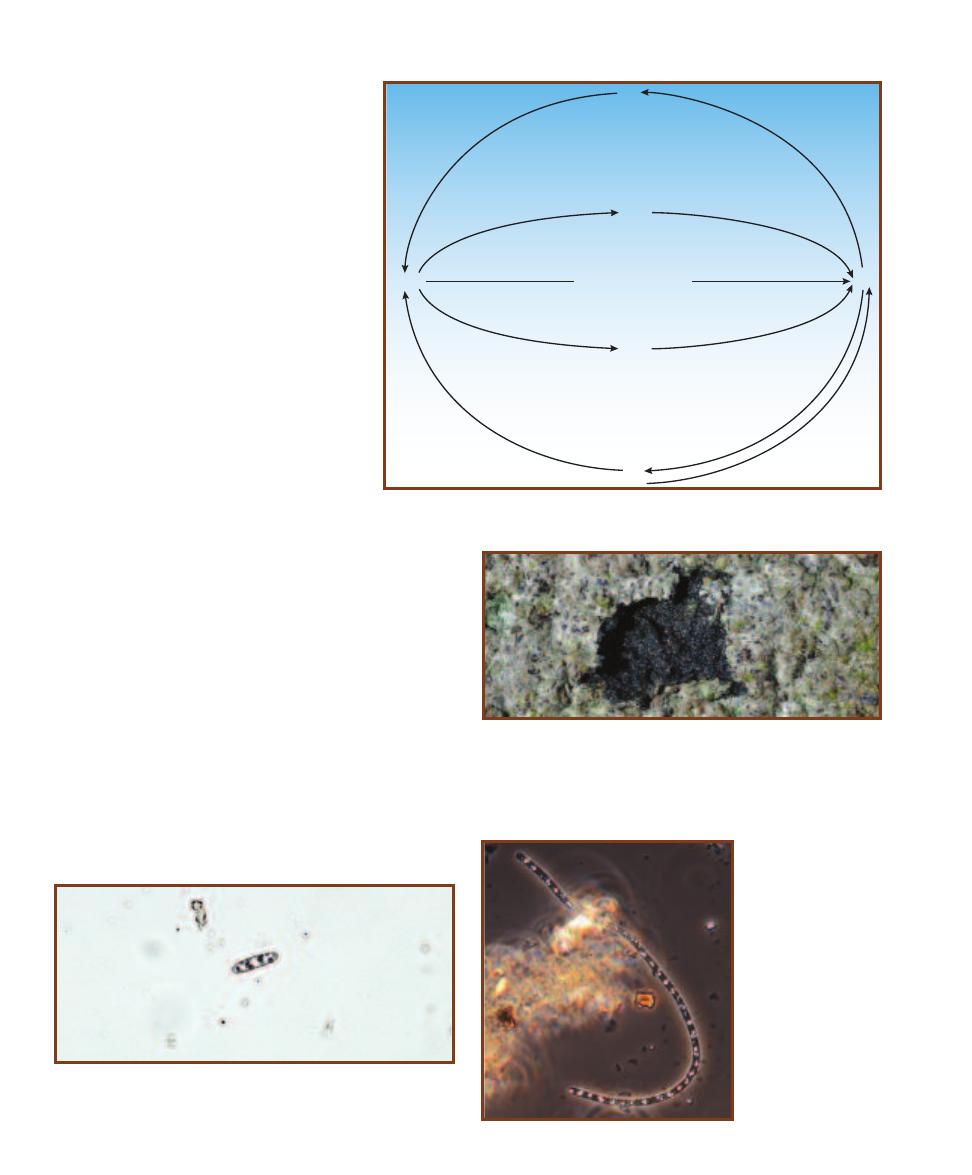
summary reactions they perform. Figure
19-31 illustrates the major biogeochemical
transformations.
The photoautotrophs (Figures 19-32 and
33) are an oxygenic photosynthesizers, that
is, they perform a type of photosynthesis that
does not produce oxygen. These organisms
reside in the anoxic zone of a pond or other
aquatic ecosystem close enough to the surface
to use the sun’s energy to fix carbon from
CO
2
. Rather than chloroplasts, as in green
plants, anoxygenic phototrophs contain
membrane-bound bacteriochlorophyll. In
sulfur bacteria, bacteriochorophyll traps light
energy and converts it to ATP, which ulti-
mately is used to fix CO
2
. Oxidation of H
2
S
or elemental sulfur provides electrons for CO
2
reduction. These reactions are analogous to
the oxygenic photosynthetic reactions per-
formed by cyanobacteria and eukaryotes.
photosynthetic eukaryotes:
CO
2
H
2
O 씮 [CH
2
O]
O
2
photosynthetic sulfur bacteria:
CO
2
H
2
S 씮 [CH
2
O]
S
0
The chemolithoautotrophs (Figures 19-32 and 19-34)
are aerobic organisms that oxidize reduced sulfur compounds
as an energy source and use it to fix CO
2
. Because the most
common form of reduced sulfur is sulfide gas (S
2
, HS
, H
2
S)
produced in anoxic sediments, oxidation by these bacteria
must occur as the gaseous sulfur rises and meets the oxic zone.
Sulfur reducers (Figure 19-35) perform two important
reduction reactions: dissimilatory and assimilatory sulfate
reduction. Assimilatory sulfate reduction is the production
of sulfide in the form of the –SH groups of biochemicals.
Dissimilatory sulfate reduction is a purely energy releasing
respiratory reaction, where sulfate acts as a final electron
acceptor in anaerobic respiration. Finally, desulfuration
(sulfur mineralization) is the reversal of assimilatory reduc tion
and involves the release of H
2
S to the environment.
19-31
B
IOGEOCHEMICAL
S
ULFUR
T
RANSFORMATIONS
These are the major sulfur
transformations in the sulfur cycle. Refer to Tables 19-3 and 19-4 for details.
Dissimilatory sulfate
reduction (anaerobic respiration)
S
0
S
0
R–SH
R–SH
H
2
S
SO
4
2–
Sulf
ur o
xid
atio
n
S
ul
fu
r o
xi
da
tio
n
P
ho
to
tro
ph
ic o
xid
atio
n
Ph
ot
ot
ro
ph
ic
o
xi
da
tio
n
Desulfu
ratio
n
Su
lfu
r r
es
pi
ra
tio
n
Assim
ilatory
sulfate
reduction
Desulfura
tion
Assi
milato
ry
sulfa
te red
uction
AEROBIC
ANAEROBIC
19-32
M
ICROBIAL
M
AT OF
S
ULFUR
B
ACTERIA
The layers of this
microbial mat formed at the edge of the Salton Sea contain sulfur bacte-
ria. The chemoautotroph Beggiatoa is found in the lighter, surface mat.
A portion of the surface mat has been removed to reveal the black mud
less than 1 cm below in which sulfur reducing bacteria reside. Green
sulfur bacteria (photoautotrophs) are found in between.
19-33
P
HOTOAUTOTROPHIC
S
ULFUR
B
ACTERIUM
This organism
was provisionally identified as Allochromatium, purple sulfur bacterium.
Note the evenly distributed sulfur granules in the cytoplasm.
19-34
C
HEMO
-
AUTOTROPHIC
S
ULFUR
O
XIDIZING
B
ACTERIUM
(P
HASE
C
ONTRAST
)
This gliding bacterium,
provisionally identified
as Beggiatoa, shows
numerous sulfur granules
in the cytoplasm. These
are the by-product of H
2
S
oxidation, the method by
which Beggiatoa obtains
energy.
236
A Photographic Atlas for the Microbiology Laboratory
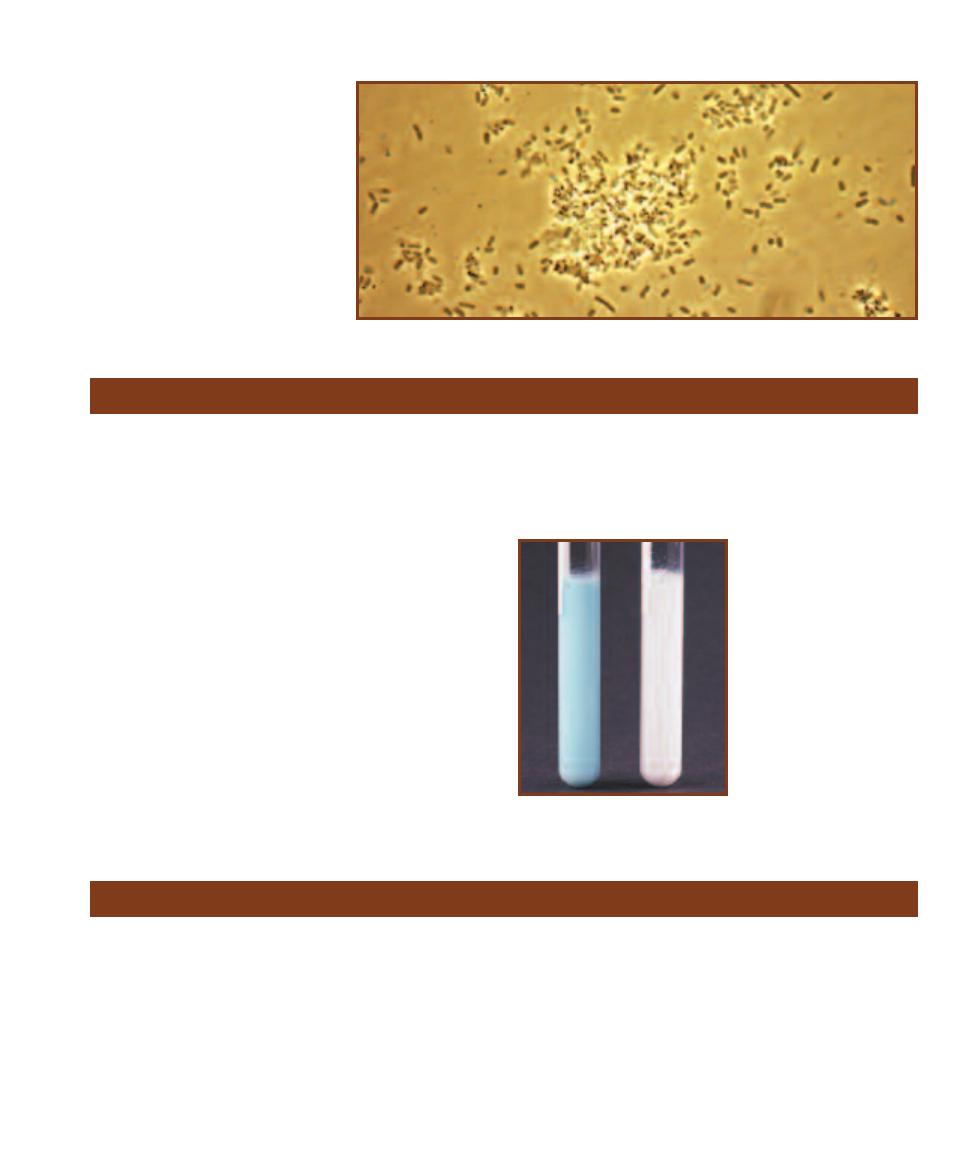
Purpose
This test is helpful in differentiating the enterococci from
other streptococci. It also tests for the presence of coliforms
in raw milk.
Principle
Methylene blue dye is blue when oxidized and colorless when
reduced. It can be enzymatically reduced either aerobically
or anaerobically. In the aerobic electron transport system,
methylene blue is reduced by cytochromes but immediately
is returned to the oxidized state when it reduces oxygen.
Anaerobically, the dye is in the reduced form, and in the
absence of an oxidizing substance, remains colorless.
The reduction of methylene blue may be used as an
indicator of milk quality. In the methylene blue reductase
test, a small quantity of a dilute methylene blue solution is
added to a sterilized test tube containing raw milk. The tube
then is sealed tightly and incubated in a 35°C water bath.
The time it takes the milk to turn from blue to white (be-
cause of methylene blue reduction) is a qualitative indicator
of the number of microorganisms living in the milk (Figure
19-36). Good quality milk takes greater than 6 hours to
convert the methylene blue.
19-35
P
HASE
-C
ONTRAST
I
MAGE OF A
S
ULFUR
R
EDUCER
This is a phase-contrast
photomicrograph of unknown sulfur reducers
recovered from black (anoxic) pond sediment.
Methylene Blue Reductase Test
19-36
T
HE
M
ETHYLENE
B
LUE
R
EDUCTASE
T
EST
The
tube on the left is a control to
illustrate the original color of
the medium. The tube on the
right indicates bacterial reduc-
tion of methylene blue after 20
hours. The speed of reduction
corresponds to the concentration
of microorganisms present in
the milk.
Snyder Test
Purpose
The Snyder test is designed to measure dental caries (tooth
decay) susceptibility, caused primarily by lactobacilli and
oral streptococci.
Principle
Snyder Test Medium is formulated to favor the growth of
oral bacteria (Figure 19-37) and discourage the growth of
other bacteria. This is accomplished by lowering the pH
of the medium to 4.8. Glucose is added as a fermentable
carbohydrate, and bromcresol green is the pH indicator.
Lactobacilli and oral streptococci survive these harsh con -
ditions, ferment the glucose, and lower the pH even further.
The pH indicator, which is green at or above pH 4.8 and
yellow below, turns yellow in the process. Development of
yellow color in this medium, therefore, is evidence of fer-
mentation and, further, is highly sug gestive of the presence
of dental decay-causing bacteria (Figure 19-38).
SECTION 19
Medical, Environmental, and Food Microbiology
237
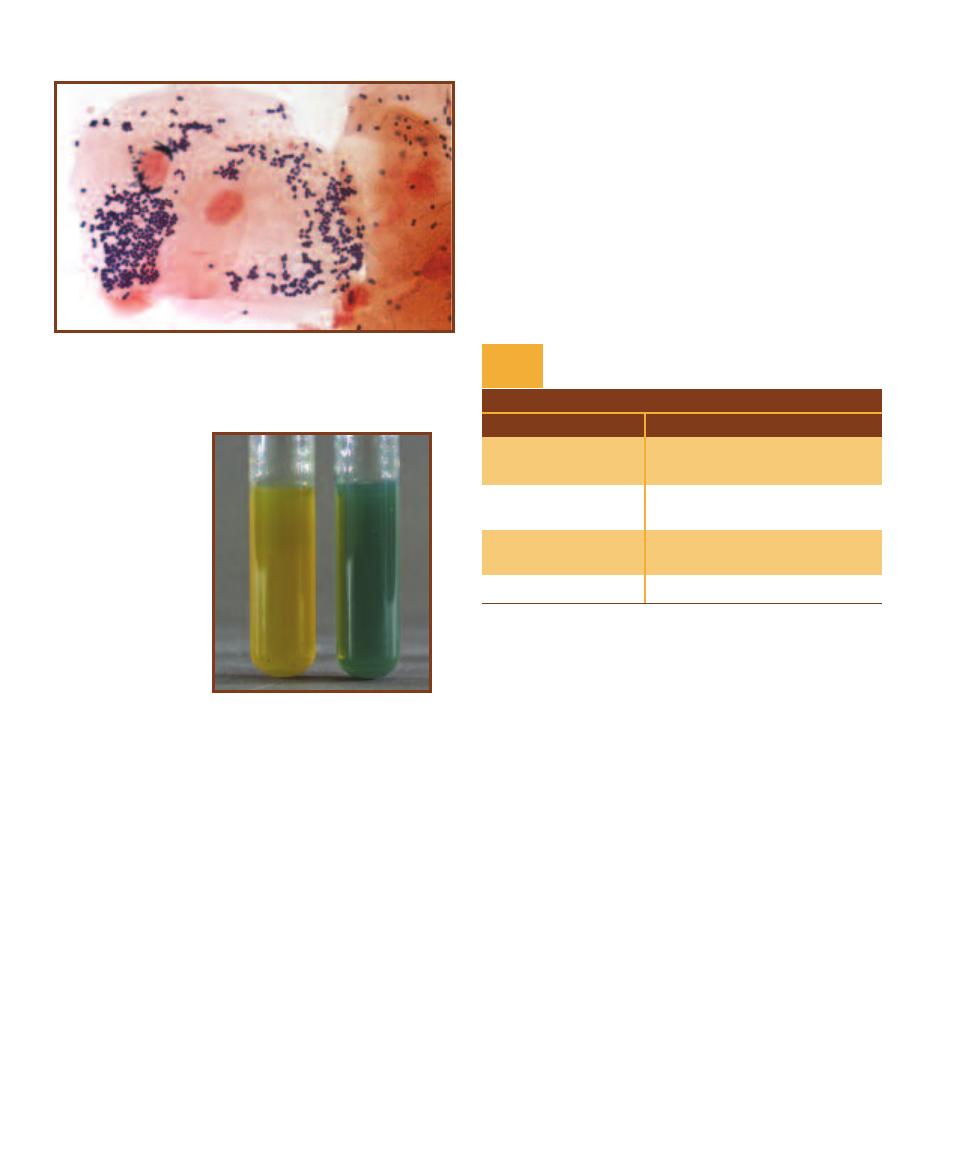
The medium is autoclaved for sterilization, cooled
to just over 45°C, and maintained in a warm water bath
until needed. The molten agar then is inoculated with a
small amount of saliva, mixed well, and incubated for up to
72 hours. The agar tubes are checked at 24-hour intervals
for any change in color. High susceptibility to dental caries
is indicated if the medium turns yellow within 24 hours.
Moderate and slight susceptibility are indicated by a change
within 48 and 72 hours, respectively. No change within
72 hours is considered a negative result. These results are
summarized in Table 19-5.
19-37
G
RAM
S
TAIN OF
O
RAL
B
ACTERIA
Note the predominance
of Gram-positive cocci. Also present are a few Gram-negative rods and
very few Gram-positive rods (Lactobacillus). Note also the size difference
between the large epithelial cells in the center and the bacteria.
19-38
S
NYDER
T
EST
R
ESULTS
A positive result
is on the left, and a nega-
tive result is on the right.
238
A Photographic Atlas for the Microbiology Laboratory
T A B L E O F R E S U L T S
Result
Interpretation
Yellow at 24 hours
High susceptibility to dental
caries
Yellow at 48 hours
Moderate susceptibility to
dental caries
Yellow at 72 hours
Slight susceptibility to dental
caries
Yellow at >72 hours
Negative
Snyder Test Results and Interpretations
T A B L E
19-5
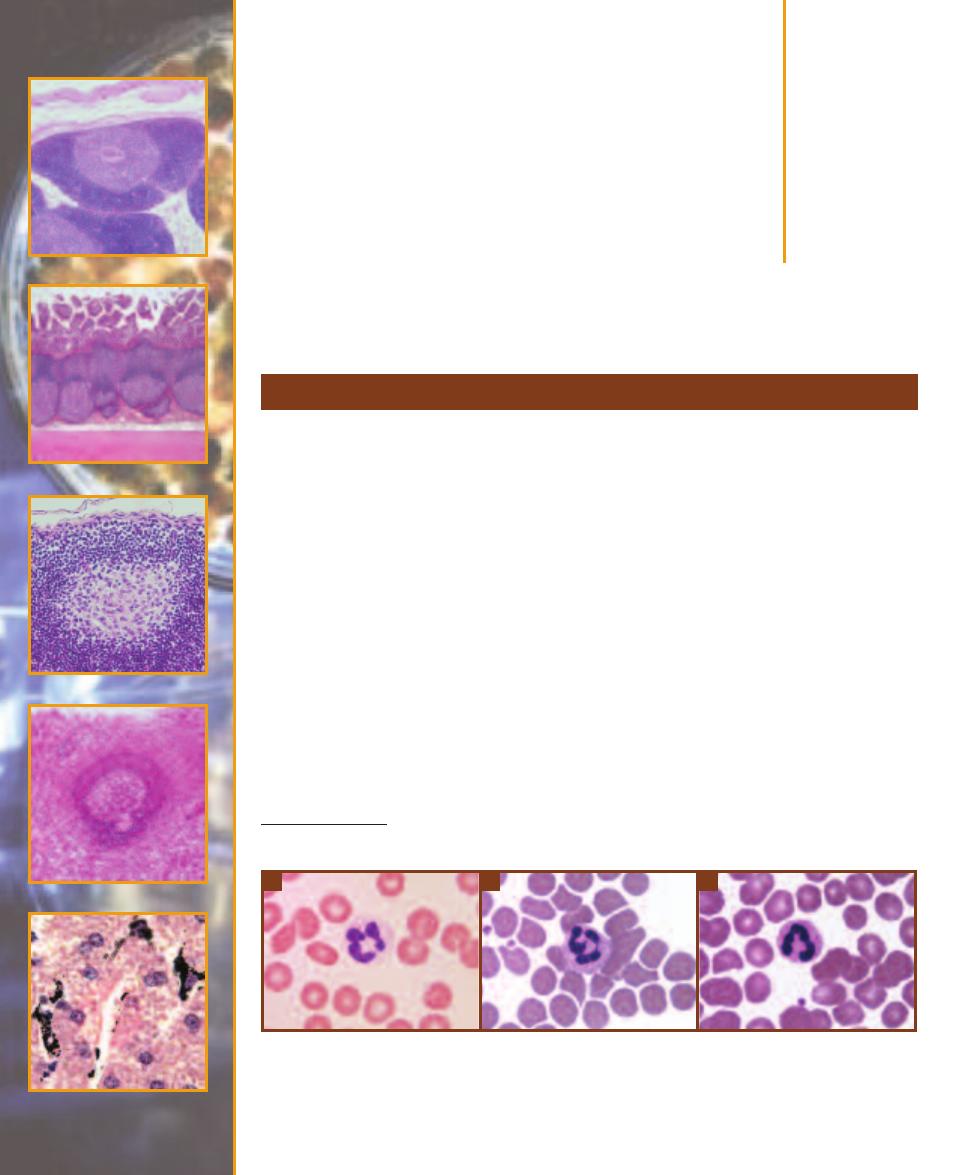
Host Defenses
䢇
Purpose
A differential blood cell count is done to determine approximate numbers of the various leukocytes
in blood. Excess or deficiency of all or a particular group is indicative of certain disease states.
䢇
Principle
Leukocytes (white blood cells or WBCs) are divided into two groups: granulocytes (which have
prominent cytoplasmic granules) and agranulocytes (which lack these granules). There are three
basic types of granulocytes: neutrophils, basophils, and eosinophils. The two types of agranulocytes
are monocytes and lymphocytes.
Neutrophils (Figure 20-1) are the most abundant WBCs in blood. They leave the blood and
enter tissues to phagocytize foreign material. An increase in neutrophils in the blood is indicative of
a systemic bacterial infection. Mature neutrophils are sometimes referred to as segs because their
nucleus is usually segmented into two to five lobes. Because of the variation in nuclear appearance,
they are also called polymorphonuclear neutrophils (PMNs). Immature neutrophils lack this nuclear
segmentation and are referred to as bands. This distinction is useful, because a patient with an
active infection will be producing more neutrophils, meaning a higher percentage will be of the band
(immature) type. Neutrophils are 12–15 µm in diameter, about twice the size of an erythrocyte
(RBC).* Their cytoplasmic granules are neutral staining and thus do not have the intense color of
other granulocytes when prepared with a Wright’s or Giemsa stain.
Differential Blood Cell Count
20
S E C T I O N
239
20-1
N
EUTROPHILS
A
and
B
The segmented nuclei of these cells identify them as mature neutrophils (segs).
About 30% of neutrophils in blood samples from females demonstrate a “drumstick” protruding from the nucleus, as
in
B
. This is the region of the inactive X chromosome.
C
This is an immature band neutrophil with an unsegmented
nucleus. Micrograph
A
was stained with Giemsa stain; the others were prepared with Wright’s stain. Neutrophils are
approximately 12–15 µm in diameter.
A
B
C
*
It is convenient to discuss leukocyte size in terms of erythrocyte size because RBCs are so uniform in diameter. In an isotonic solution,
erythrocytes are 7.5 µm in diameter.
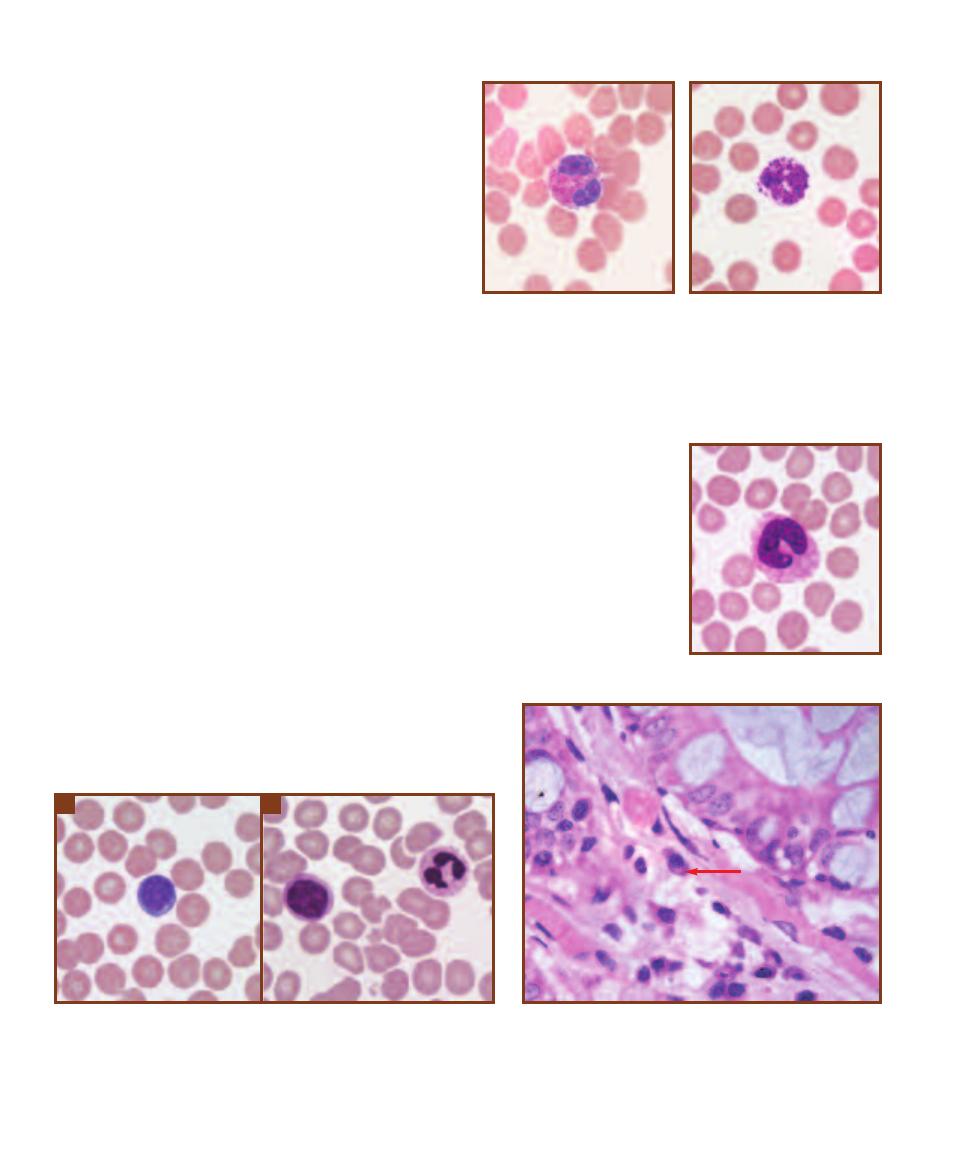
Eosinophils are phagocytic, and their numbers increase
during allergic reactions and parasitic infections (Figure
20-2). They are 12–15 µm in diameter (about twice the
size of an RBC) and generally have 2 lobes in their nucleus.
Their cytoplasmic granules stain red in typical preparations.
Basophils (Figure 20-3) are the least abundant WBCs in
normal blood. They are structurally similar to tissue mast
cells and produce some of the same chemicals (histamine
and heparin), but are derived from different stem cells in
bone marrow. They are 12–15 µm in diameter. The nucleus
is usually obscured by the dark staining cytoplasmic granules,
but it either has two lobes or is unlobed.
Agranulocytes include monocytes and lymphocytes.
Monocytes (Figure 20-4) are the blood form of macrophages.
They are the largest of leukocytes, being two to three times
the size of RBCs (12–20 µm). Their nucleus is horseshoe-
shaped and the cytoplasm lacks prominent granules (but
may appear finely granular).
Lymphocytes (Figure 20-5) are cells of the immune
system. Two functional types of lymphocytes are the T-cell,
involved in cell-mediated immunity, and the B-cell, which
converts to a plasma cell (Figure 20-6) when activated and
produces antibodies. The nucleus is usually spherical and
takes up most of the cell. Lymphocytes are approximately
the same size as RBCs or up to twice their size. The larger
ones form a third functional group of lymphocytes, the null
cell, many of which are natural killer (NK) cells that kill
foreign or infected cells without antigen-antibody interaction
(Figure 20-5b).
In a differential white cell count, a sample of blood is
observed under the microscope and at least 100 WBCs are
counted and tallied (this task is automated now). Approxi-
mate normal percentages for each leukocyte are as follows:
55–65% neutrophils (mostly segs), 25–33% lymphocytes,
3–7% monocytes, 1–3% eosinophils, and 0.5–1% basophils.
240
䢇
A Photographic Atlas for the Microbiology Laboratory
20-3
B
ASOPHIL
(G
IEMSA
S
TAIN
)
Basophils comprise only
about 1% of all WBCs. They are up
to twice the size of RBCs and have
dark purple cytoplasmic granules
that obscure the nucleus.
20-4
M
ONOCYTE
(G
IEMSA
S
TAIN
)
Monocytes are the blood
form of macrophages. They are
about two to three times the size
of RBCs and have a round or
indented nucleus.
20-5
L
YMPHOCYTES
Lymphocytes are common in the blood, comprising up
to 33% of all WBCs. Most are about the size of RBCs and have only a thin halo
of cytoplasm encircling their round nucleus. They belong to functional groups
called B cells and T cells (which are morphologically indistinguishable). Micro-
graph
A
is a small lymphocyte and was prepared with Giemsa stain. Some
lymphocytes are larger, as in micrograph
B
. These are natural killer (NK) cells
or some other type of null cell. Also visible is a neutrophil.
A
B
20-6
P
LASMA
C
ELLS
B-lymphocytes develop into plasma
cells when stimulated by the appropriate antigen. Plasma cells
secrete protective antibodies against the antigen. This plasma
cell (arrow) is recognizable because of its elongated shape, ec-
centric nucleus with “clock face” chromatin, and a pale region
near the nucleus (which is the site of a Golgi apparatus). This
specimen is from the colon.
20-2
E
OSINOPHIL
(G
IEMSA
S
TAIN
)
These granulocytes are
relatively rare and are about twice
the size of RBCs. Their cytoplasmic
granules stain red, and their
nucleus usually has two lobes.
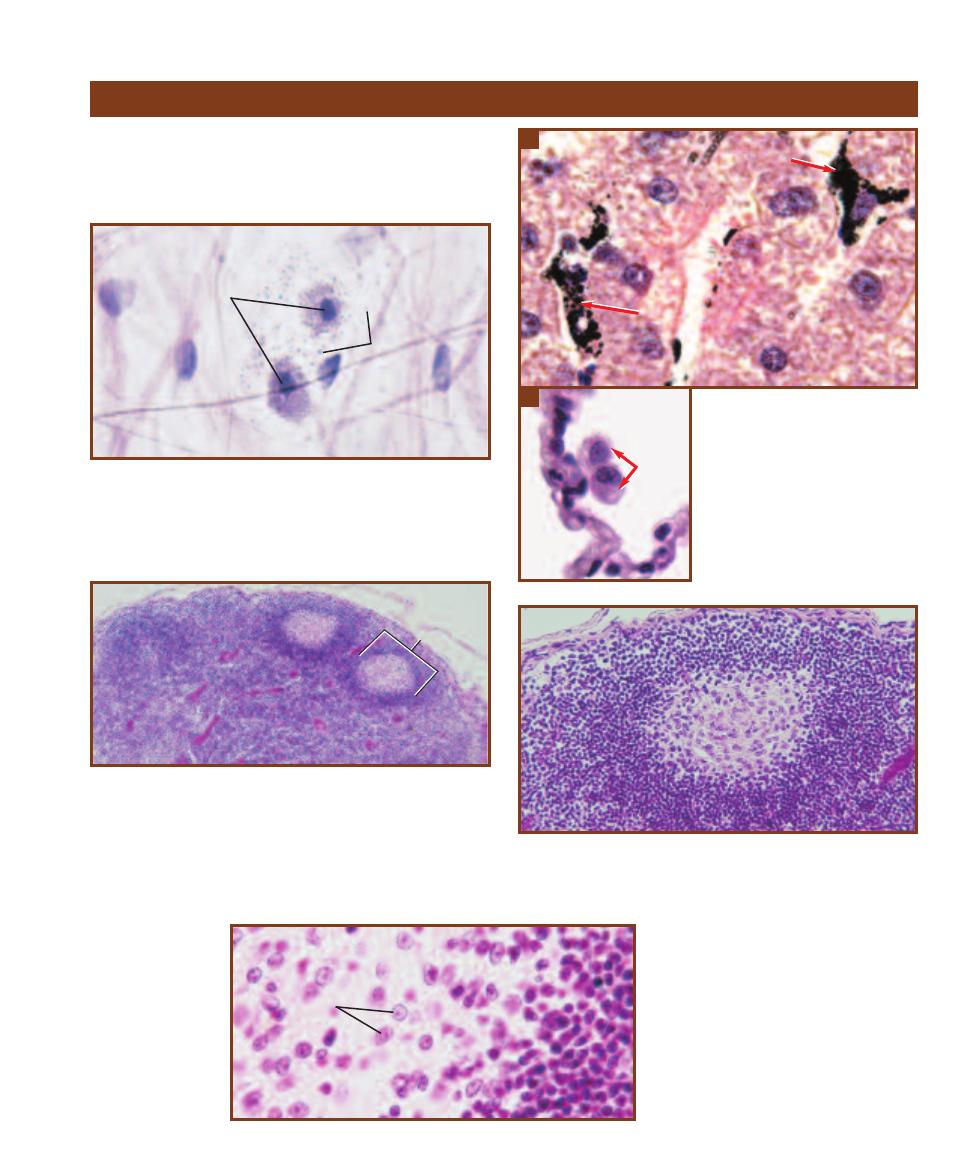
SECTION 20
䢇
Host Defenses
䢇
241
Other Immune Cells and Organs
20-7
M
AST
C
ELLS
Two mast cells (M) of loose connective tissue
are shown. The cytoplasmic granules (G) contain histamine and other
chemicals involved in inflammation as a result of tissue damage. The
mast cells may also be coated with IgE antibodies, which cause degran-
ulation when they bind antigen—as in Type I hypersensitivity (allergic)
reactions.
M
Cells of the reticuloendothelial system and immune system
are involved in host defense and are found scattered
through out the body. Examples are shown in the following
photomicrographs (Figures 20-7 through 20-16).
20-8
M
ACROPHAGES
Macro phages
either remain attached to a surface and
are called
fixed macro phages, or enter
tissues and scavenge foreign material
as wandering macro phages.
A
This
section of the liver shows two Kupffer
(K) cells that have ingested a dye.
Kupffer cells are fixed macrophages
that reside in liver sinus oids.
B
The
arrows indicate two alveolar macro -
phages (M
⌽
) of the lung. They are
wandering macrophages.
M⌽
A
B
K
K
20-9
L
YMPH
N
ODE
This is a section through a lymph node. The
large spherical purple objects are masses of lymphocytes called lymph
nodules or lymph follicles (LF). As lymph passes through the sinuses
(channels) within the node, antigens may contact a lymphocyte with the
ability to produce antibodies against it. This provides the stimulus for
cloning of the lymphocyte and conversion of some clones into antibody-
secreting plasma cells. Other clones become memory cells and reside
in lymphatic tissue around the body. Macrophages are also found in the
node’s sinuses.
20-10
A S
INGLE
L
YMPH
F
OLLICLE
(S
ECTION
)
The light germinal
center (GC) is occupied by lymphoblasts and medium-sized lympho-
cytes. More mature lymphocytes are found in the darker, outer portion
of the follicle.
GC
20-11
T
HE
G
ERMINAL
C
ENTER OF
A
L
YMPH
F
OLLICLE
Medium-sized lym-
phocytes (L) are abundant in the lighter
region, whereas mature lymphocytes
predominate in the darker region. Their
differences in size and nuclear staining
are apparent.
L
G
LF
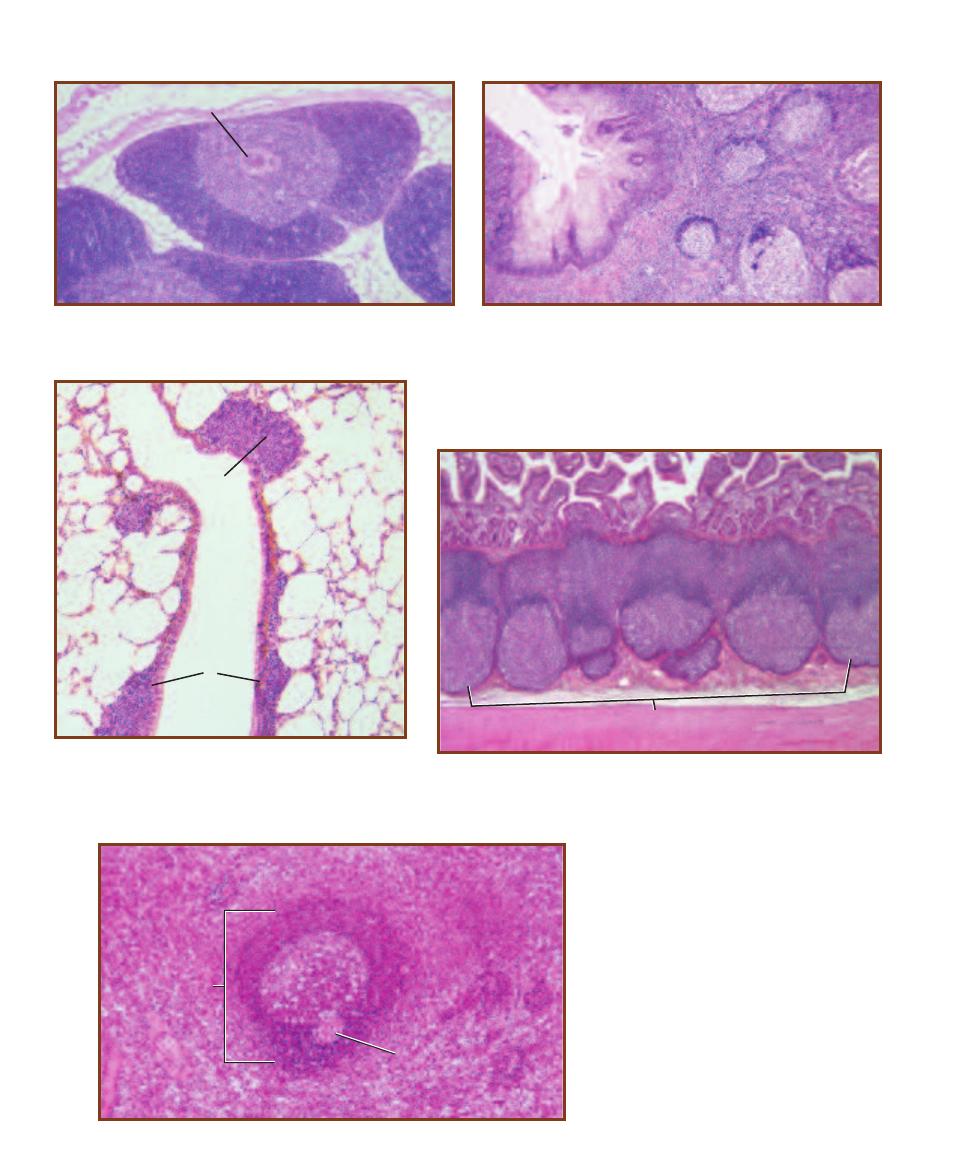
242
䢇
A Photographic Atlas for the Microbiology Laboratory
20-14
MALT
OF A
B
RONCHIOLE
Lymphatic tissue is
found in many places besides the lymph nodes. Shown is a
section through the lung with lymphatic tissue (L) in the wall of
a bronchiole. Such tissue is referred to as Mucosa Associated
Lymphatic Tissue, or MALT.
L
L
TC
20-12
A S
ECTION
T
HROUGH THE
T
HYMUS
One lobule (composed
of lymphocytes) with its thymic corpuscle (TC) is shown. The thymus is
the site of T-lymphocyte maturation.
20-13
A S
ECTION
T
HROUGH A
P
ALATINE
T
ONSIL
Palatine tonsils
are found on either side of the oral cavity’s opening into the throat. Two
other sets of tonsils are also found in the throat: the pharyngeal tonsils
(adenoids) are posterior to the nasal cavity and the lingual tonsils are in
the base of the tongue. Tonsils act much like lymph nodes in that they
are composed of lymph follicles (evident in the right half of the field) that
contact fluids passing through them. A tonsilar crypt (C) is also visible.
C
20-15
MALT
OF THE
S
MALL
I
NTESTINE
This is a section through the
ileum showing a Peyer’s patch (PP) of lymph follicles. Peyer’s patches may
consist of 10 to 70 follicles separated from the intestinal lumen only by a single
layer of epithelial cells.
PP
20-16
T
HE
S
PLEEN
This is a section
through a spleen. In addition to being a blood
filter and reservoir, the spleen contains lymph
follicles (LF) referred to as white pulp. Lympho-
cytes of white pulp respond to antigens in the
blood. The portion of the spleen devoted to
blood-vascular functions is referred to as red
pulp. A single follicle with its central artery (CA)
is shown surrounded by the red pulp.
LF
LF
CA
CA

Biochemical
Pathways
APPENDIX
243
So much of what is done in microbiology relies on an understanding of basic biochemical pathways.
It’s not as important to memorize them (although, with exposure they will become second nature)
as it is to understand their importance in metabolism and to interpret diagrams of them when
available. The following discussion is provided so you can see how the various biochemical tests
presented in this manual fit into the overall scheme of cellular chemistry.
Oxidation of Glucose: Glycolysis, Entner- Doudoroff,
and Pentose-Phosphate Pathways
Most organisms use glycolysis (also known as the “Embden-Meyerhof-Parnas pathway, Figure A-1)
in energy metabolism. It performs the stepwise disassembly of glucose into two pyruvates, releasing
some of its energy and electrons in the process. The exergonic (energy-releasing) reactions are asso-
ciated with ATP synthesis by a process called substrate phosphorylation. Although a total of four
ATPs are produced per glucose in glycolysis, two ATPs are hydrolyzed early in the pathway, leaving
a net production of two ATPs per glucose. In one glycolytic reaction, the loss of an electron pair
(oxidation) from a three-carbon intermediate occurs simultaneously with the reduction of NAD
Ⳮ
to NADHⳭH
Ⳮ
. The NADHⳭH
Ⳮ
then may be oxidized in an electron transport chain or a
fermentation pathway, depending on the organism and the environmental conditions. The former
yields ATP, and the latter generally does not. In summary, each glucose oxidized in glycolysis yields
two pyruvates, 2 NADHⳭ2 H
Ⳮ
, and a net of 2 ATPs (Table A-1).
Although the intermediates of glycolysis are carbohydrates, many are entry points for amino
acid, lipid, and nucleotide catabolism. Many glycolytic intermediates also are a source of carbon
skeletons for the synthesis of these other biochemicals. Some of these are shown in Figure A-1.
Note: For clarity, many details have been omitted from these other pathways in Figure A-1. Single
arrows may represent several reactions, and other carbon compounds not illustrated may be required
to complete a particular reaction.
The Entner-Doudoroff pathway (Figure A-2) is an alternative means of degrading glucose into
two pyruvates. This pathway is found exclusively among prokaryotes (e.g., Pseudomonas and
E. coli, as well as other Gram-negatives and certain Archaea). It allows utilization of a different
category of sugars (aldonic acids) than glycolysis and therefore improves the range of resources
available to the organism. It is less efficient than glycolysis because only one ATP is phosphorylated
and only one NADH is produced. Table A-2 summarizes this pathway.
The pentose-phosphate pathway is a complex set of cyclic reactions that provides a mechanism
for producing five-carbon sugars (pentoses) from six-carbon sugars (hexoses). Pentose sugars are
used in ribonucleotides and deoxyribonucleotides, as well as being precursors to aromatic amino
acids. Further, this pathway produces NADPH, which is used as an electron donor in anabolic
pathways. Unlike NADH, produced in glycolysis and Entner-Doudoroff, NADPH is not used as
an electron donor in an electron transport chain for oxidative phosphorylation of ADP.
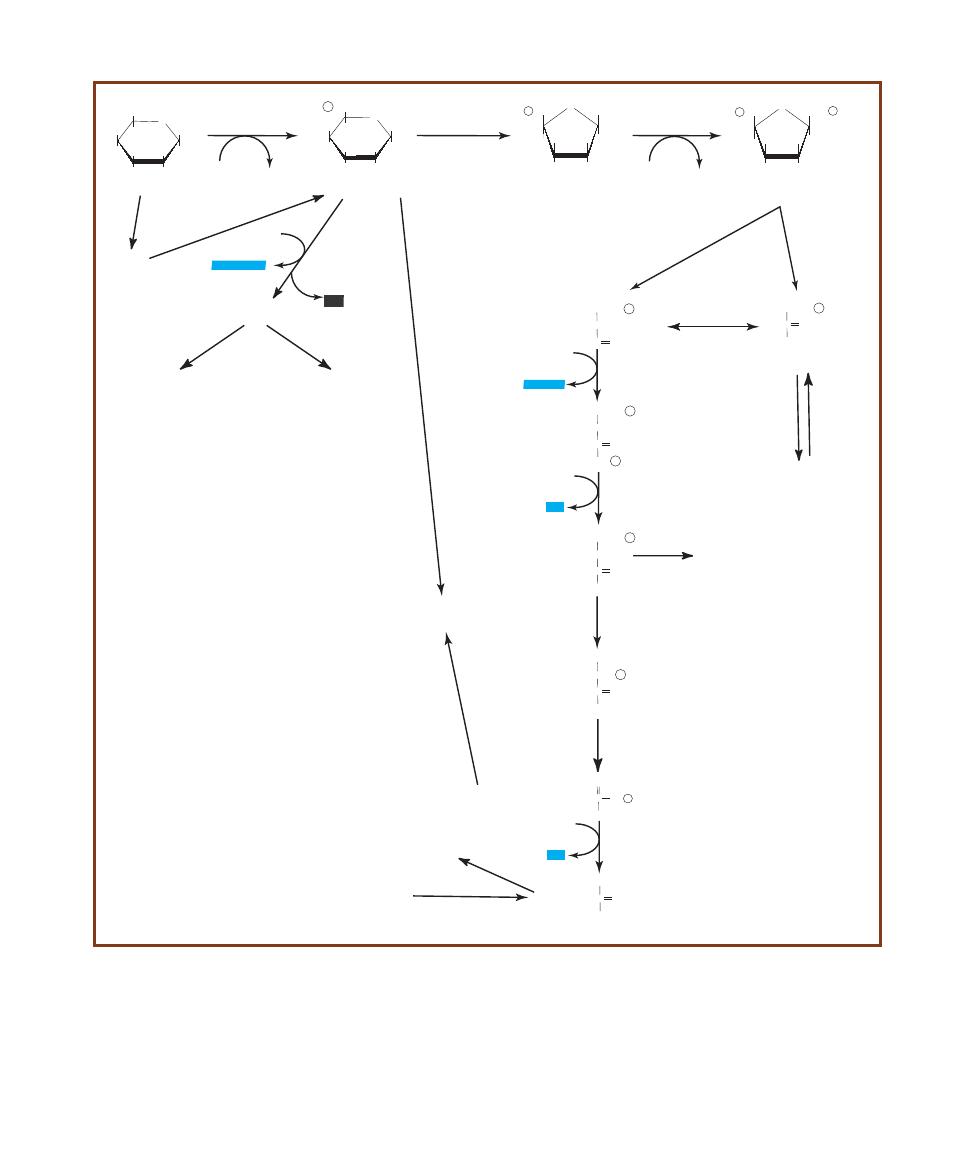
244
䢇
A Photographic Atlas for the Microbiology Laboratory
A-1
G
LYCOLYSIS AND
A
SSOCIATED
P
ATHWAYS
The names of glycolytic intermediates are printed in black ink; the enzyme names are in red.
Reducing power (in the form of NADHⳭH
Ⳮ
) and ATP are highlighted in blue. The major key to getting product yields correct is to recognize that both
C
3
compounds (Glyceraldehyde 3-phosphate and Dihydroxyacetone phosphate) produced from splitting Fructose 1,6-bisphosphate can pass through
the remainder of the pathway because of the triose phosphate isomerase reaction. The conversion of each into pyruvate results in the formation of
2 ATPs and 1 NADHⳭH
Ⳮ
(Table A-1).
ATP
C
CH
3
O
COO
-
Pyruvate
C
CH
2
O~ P
COO
-
Phosphoenolpyruvate
CH
2
O ~
P
Glyceraldehyde
3-phosphate
HCOH
C
O
O ~ P
1,3-Bisphosphoglycerate
HCOH
CH
2
O ~
P
HC
O
CH
2
O ~
P
CHOH
C
O
O
-
3-phosphoglycerate
CH
2
OH
HCO ~
P
C
O
O
-
2-phosphoglycerate
C O
CH
2
O ~
P
CH
2
OH
Dihydroxyacetone phosphate
OH
O
HOCH2
HO
OH
OH
Glucose
O
P OCH2
HO
OH
OH
OH
Glucose 6-phosphate
Fructose 6-phosphate
O
OH
CH
2
OH
HO
P OCH
2
OH
O
OH
CH
2
O P
HO
P OCH
2
OH
Fructose-1,6-bisphosphate
Hexokinase
ATP
ADP
Phosphohexose
isomerase
Phosphofructo-
kinase
ATP
ADP
Fructose
bisphosphate aldolase
Triose Phosphate
Isomerase
Glyceraldehyde
3-phosphate
dehydrogenase
NAD
+
NADH+H
+
Phosphoglycerate
kinase
ATP
ADP
Phosphoglycerate
mutase
Enolase
Pyruvate
kinase
ADP
Triglycerides
Ribulose 5-phosphate
Serine
Glycine
Cysteine
Histidine
Tryptophan
Alanine
Leucine
Valine
Purines
Pyrimidines
Phenylalanine
Tryptophan
Tyrosine
Starch
Alanine
Cysteine
Glycine
Serine
Threonine
Tryptophan
2NADP
+
2NADPH+H
+
CO
2
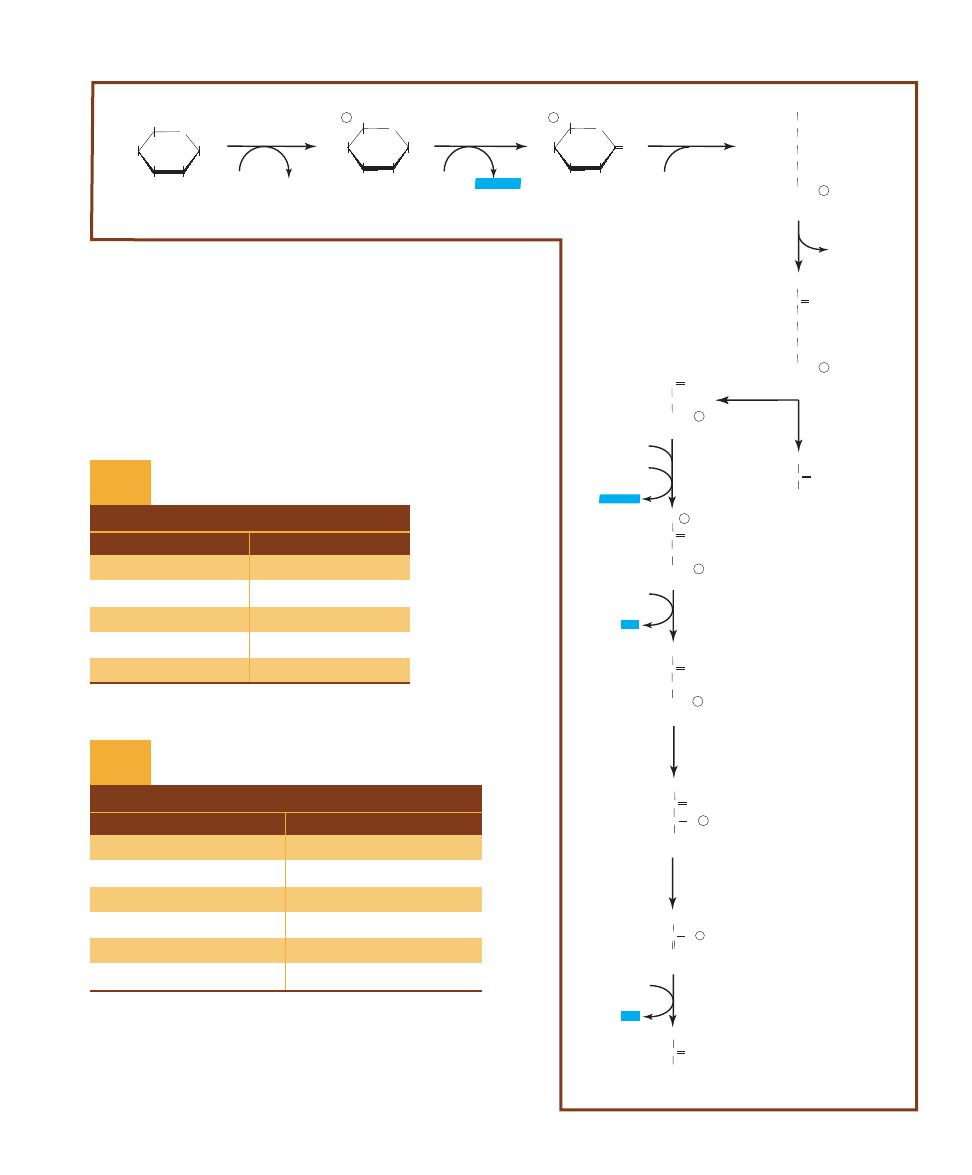
APPENDIX
䢇
Biochemical Pathways
䢇
245
ATP
C
COO-
O
CH
3
Pyruvate
C
COO-
O- P
CH
2
Phosphoenolpyruvate
Glyceraldehyde 3-phosphate
1,3-Bisphosphoglycerate
HCOH
HC
O
3-Phosphoglycerate
2-Phosphoglycerate
OH
O
HOCH
2
HO
OH
OH
Glucose
O
P OCH
2
HO
OH
OH
OH
Glucose 6-phosphate
6-Phosphoglucono-
d-lactone
6-Phosphogluconate
Hexokinase
ATP
ADP
Glucose 6-phosphate
dehydrogenase
Lactonase
6-Phosphogluconate
dehydratase
KDPG aldolase
Glyceraldehyde
3-phosphate
dehydrogenase
NAD
+
NADH+H
+
Phosphoglycerate
kinase
ATP
ADP
Phosphoglycerate
mutase
Enolase
Pyruvate
kinase
ADP
O-
HC O- P
CH
2
OH
C
O
CH
2
O- P
O- P
HCOH
C
O
CH
2
O- P
O-
HCOH
C
O
CH
2
O- P
NADP
+
NADPH+H
+
H
2
O
O
P OCH
2
HO
OH
O
OH
HCOH
COO-
HOCH
HCOH
HCOH
Mg2+
2-Keto-3-Deoxy-6-Phosphogluconate
(KDPG)
C O
COO-
CH
2
HCOH
HCOH
CH
2
O- P
CH
2
O- P
C
COO-
O
CH
3
Pyruvate
Pi
H
2
O
A-2
E
NTNER
-D
OUDOROFF
P
ATHWAY
Notice the similarities between this
pathway and glycolysis (Figure A-1). The main difference is in the six-carbon
compound that is split into two three-carbon compounds. The result of this split
is pyruvate and glyceraldehydes-3-phosphate, which is oxidized as in glycolysis
to pyruvate. Because only one three-carbon compound goes through the sequence
of reactions leading to pyruvate, the ATP and NADH yield is one-half that of
glycolysis. But one NADPH is produced that is not made in glycolysis.
Reactant
Product
Glucose (C
6
H
12
O
6
)
2 Pyruvates (C
3
H
3
O
3
)
2 ATP
2 ADP
4 ADP
4 ATP
NET: 2 ADP
NET: 2 ATP
2 NAD
ⴐ
2 NADHⴐ2 H
ⴐ
Summary of Glycolytic Reactants
and Products per Glucose
T A B L E
A-1
T A B L E O F R E S U L T S
Reactant
Product
Glucose (C
6
H
12
O
6
)
2 Pyruvates (C
3
H
3
O
3
)
1 ATP
1 ADP
2 ADP
2 ATP
NET: 1 ADP
NET: 1 ATP
1 NAD
ⴐ
1 NADHⴐ1 H
ⴐ
1 NADP
ⴐ
1 NADPHⴐ1 H
ⴐ
Summary of Entner-Doudoroff Reactants
and Products per Glucose
T A B L E
A-2
T A B L E O F R E S U L T S

The pentose-phosphate reactants and products are listed
in Table A-3, and the overall path is shown in Figure A-3.
To completely oxidize one hexose to 6CO
2
, a total of six
hexoses must enter the cycle as glucose-6-phosphate and
follow one of three different routes (notice the symmetry of
pathways as drawn). Notice in Figure A-3 that each hexose
loses a CO
2
upon entry into the cycle, but at the end, five
hexoses are produced. Thus, the net reaction is one hexose
being oxidized to 6CO
2
. Notice also the reactions that
transfer two-carbon and three-carbon fragments between
the five-carbon intermediates. Transketolase catalyzes the
two-carbon transfer, whereas transaldolase catalyzes the
three-carbon transfer. Alternatively, the five-carbon inter -
mediates can be redirected into pathways for synthesis of
aromatic amino acids and nucleotides (not shown).
Oxidation of Pyruvate: The
Krebs Cycle and Fermentation
Pyruvate represents a major crossroads in metabolism. Some
organisms are able to further disassemble the pyruvates pro-
duced in glycolysis and Entner-Doudoroff and make more
ATP and NADHⳭH
Ⳮ
in the Krebs cycle. Other organisms
simply reduce the pyruvates with electrons from NADHⳭH
Ⳮ
without further energy production in fermentation.
The Krebs cycle is a major metabolic pathway used in
energy production by organisms that respire aerobically or
anaerobically (Figure A-4). Pyruvate produced in glycolysis
or other pathways is first converted to acetyl-coenzyme A
during the entry step (also known as the intermediate or
gateway step). Acetyl-CoA enters the Krebs cycle through a
condensation reaction with oxalo acetate. Products for each
pyruvate that enters the cycle via the entry step are: 3 CO
2
,
4 NADHⳭH
Ⳮ
, 1 FADH
2
, and 1 GTP. (Because two pyru-
vates are made per glucose, these numbers are doubled in
Table A-4). The energy released from oxidation of reduced
coenzymes (NADHⳭH
Ⳮ
and FADH
2
) in an electron trans-
port chain is then used to make ATP. ATP yields are sum -
marized in Table A-5.
Like glycolysis, many of the Krebs cycle’s intermediates
are entry points for amino acid, nucleotide and lipid catabo-
lism, as well as a source of carbon skeletons for synthesis
of the same compounds. These pathways are shown, but
details have been omitted. Single arrows may represent
several reactions, and other carbon compounds, not illus-
trated, may be required to complete a given reaction.
Figure A-5 illustrates some major fermentation path-
ways exhibited by microbes (though no single organism is
capable of all of them). Pyruvate (shown in the blue box)
is typically the starting point for each. End products of
fermentation are shown in red. Fermentation allows a cell
living under anaerobic conditions to oxidize reduced co -
enzymes (such as NADHⳭH
Ⳮ
and shown in blue) gener-
ated during glycolysis or other pathways. Some bacteria
(aerotolerant anaerobes) rely solely on fermentation and do
not use oxygen even if it is available. Table A-6 summarizes
major fermentations and some representative organisms
that perform each.
Notice that fermentation end products typically fall into
three categories: acid, gas, or an organic solvent (an alcohol
or a ketone). The specific fermentation performed is the
result of the enzymes present in a species and often is used
as a basis of classification.
246
䢇
A Photographic Atlas for the Microbiology Laboratory
Reactant
Product
Glucose-6-phosphate (C
6
)
6 CO
2
ⴐ
1 P
i
12 NADP
ⴐ
12 NADPHⴐ12 H
ⴐ
Summary of Pentose Phosphate Reactants
and Products per Glucose-6-phosphate
T A B L E
A-3
T A B L E O F R E S U L T S

APPENDIX
䢇
Biochemical Pathways
䢇
247
G
lu
c
o
s
e
6
-p
h
o
s
p
h
a
te
(C
6
)
R
ib
u
lo
s
e
5
-p
h
o
s
p
h
a
te
(C
5
)
R
ib
o
s
e
5
-p
h
o
s
p
h
a
te
(C
5
)
X
y
lu
lo
s
e
5
-p
h
o
s
p
h
a
te
(C
5
)
G
ly
c
e
ra
ld
e
h
y
d
e
3
-p
h
o
s
p
h
a
te
(C
3
)
S
e
d
o
h
e
p
tu
o
s
e
7
-p
h
o
s
p
h
a
te
(C
7
)
C
O
2
2
N
A
D
P
+
2
N
A
D
P
H
+
H
+
F
ru
c
to
s
e
6
-p
h
o
s
p
h
a
te
(C
6
)
G
lu
c
o
s
e
6
-p
h
o
s
p
h
a
te
(C
6
)
G
lu
c
o
s
e
6
-p
h
o
s
p
h
a
te
(C
6
)
R
ib
u
lo
s
e
5
-p
h
o
s
p
h
a
te
(C
5
)
C
O
2
2
N
A
D
P
+
2
N
A
D
P
H
+
H
+
C
2
C
3
E
ry
th
ro
s
e
4
-p
h
o
s
p
h
a
te
(C
4
)
G
lu
c
o
s
e
6
-p
h
o
s
p
h
a
te
(C
6
)
F
ru
c
to
s
e
6
-p
h
o
s
p
h
a
te
(C
6
)
G
lu
c
o
s
e
6
-p
h
o
s
p
h
a
te
(C
6
)
R
ib
u
lo
s
e
5
-p
h
o
s
p
h
a
te
(C
5
)
C
O
2
2
N
A
D
P
+
2
N
A
D
P
H
+
H
+
X
y
lu
lo
s
e
5
-p
h
o
s
p
h
a
te
(C
5
)
G
ly
c
e
ra
ld
e
h
y
d
e
3
-p
h
o
s
p
h
a
te
(C
3
)
C
2
G
lu
c
o
s
e
6
-p
h
o
s
p
h
a
te
(C
6
)
R
ib
u
lo
s
e
5
-p
h
o
s
p
h
a
te
(C
5
)
C
O
2
2
N
A
D
P
+
2
N
A
D
P
H
+
H
+
X
y
lu
lo
s
e
5
-p
h
o
s
p
h
a
te
(C
5
)
G
ly
c
e
ra
ld
e
h
y
d
e
3
-p
h
o
s
p
h
a
te
(C
3
)
R
ib
o
s
e
5
-p
h
o
s
p
h
a
te
(C
5
)
S
e
d
o
h
e
p
tu
o
s
e
7
-p
h
o
s
p
h
a
te
(C
7
)
G
lu
c
o
s
e
6
-p
h
o
s
p
h
a
te
(C
6
)
R
ib
u
lo
s
e
5
-p
h
o
s
p
h
a
te
(C
5
)
2
N
A
D
P
+
2
N
A
D
P
H
+
H
+
E
ry
th
ro
s
e
4
-p
h
o
s
p
h
a
te
(C
4
)
C
O
2
R
ib
u
lo
s
e
5
-p
h
o
s
p
h
a
te
(C
5
)
X
y
lu
lo
s
e
5
-p
h
o
s
p
h
a
te
(C
5
)
G
ly
c
e
ra
ld
e
h
y
d
e
3
-p
h
o
s
p
h
a
te
(C
3
)
C
2
C
3
C
2
F
ru
c
to
s
e
1
,6
-b
is
p
h
o
s
p
h
a
te
(C
6
)
F
ru
c
to
s
e
6
-p
h
o
s
p
h
a
te
(C
6
)
G
lu
c
o
s
e
6
-p
h
o
s
p
h
a
te
(C
6
)
F
ru
c
to
s
e
6
-p
h
o
s
p
h
a
te
(C
6
)
G
lu
c
o
s
e
6
-p
h
o
s
p
h
a
te
(C
6
)
G
lu
c
o
s
e
6
-p
h
o
s
p
h
a
te
(C
6
)
F
ru
c
to
s
e
6
-p
h
o
s
p
h
a
te
(C
6
)
G
lu
c
o
s
e
6
-p
h
o
s
p
h
a
te
(C
6
)
2
N
A
D
P
+
2
N
A
D
P
H
+
H
+
C
O
2
A
-3
P
E
N
T
O
S
E
-P
H
O
S
P
H
A
T
E
C
Y
C
L
E
F
o
r
e
v
e
ry
s
ix
g
lu
c
o
se
-6
-p
h
o
sp
h
a
te
s
th
a
t
e
n
te
r
a
n
d
c
o
m
p
le
te
t
h
e
c
y
c
le
,
6
C
O
2
a
n
d
1
2
N
A
D
P
H
Ⳮ
H
Ⳮ
a
re
p
ro
d
u
c
e
d
.
S
o
m
e
o
f
th
e
f
iv
e
-c
a
rb
o
n
i
n
te
rm
e
d
ia
te
s,
h
o
w
e
v
e
r,
m
a
y
b
e
r
e
d
ir
e
c
te
d
i
n
to
s
y
n
th
e
si
s
o
f
a
ro
m
a
ti
c
a
m
in
o
a
c
id
s
a
n
d
n
u
c
le
o
ti
d
e
s.
I
f
th
e
c
y
c
le
i
s
p
e
rf
o
rm
e
d
a
s
sh
o
w
n
,
3
6
c
a
rb
o
n
s
e
n
te
r
a
s
si
x
g
lu
c
o
se
6
- p
h
o
sp
h
a
te
(
6
⳯
C
6
⳱
3
6
C
).
S
ix
C
O
2
a
re
i
m
m
e
d
ia
te
ly
l
o
st
,
le
a
v
in
g
a
t
o
ta
l
o
f
3
0
C
t
o
g
e
t
sh
u
ff
le
d
a
ro
u
n
d
b
y
t
h
e
r
e
m
a
in
in
g
r
e
a
c
ti
o
n
s
to
f
o
rm
f
iv
e
g
lu
c
o
se
6
-p
h
o
sp
h
a
te
s
(5
⳯
C
6
⳱
3
0
C
).
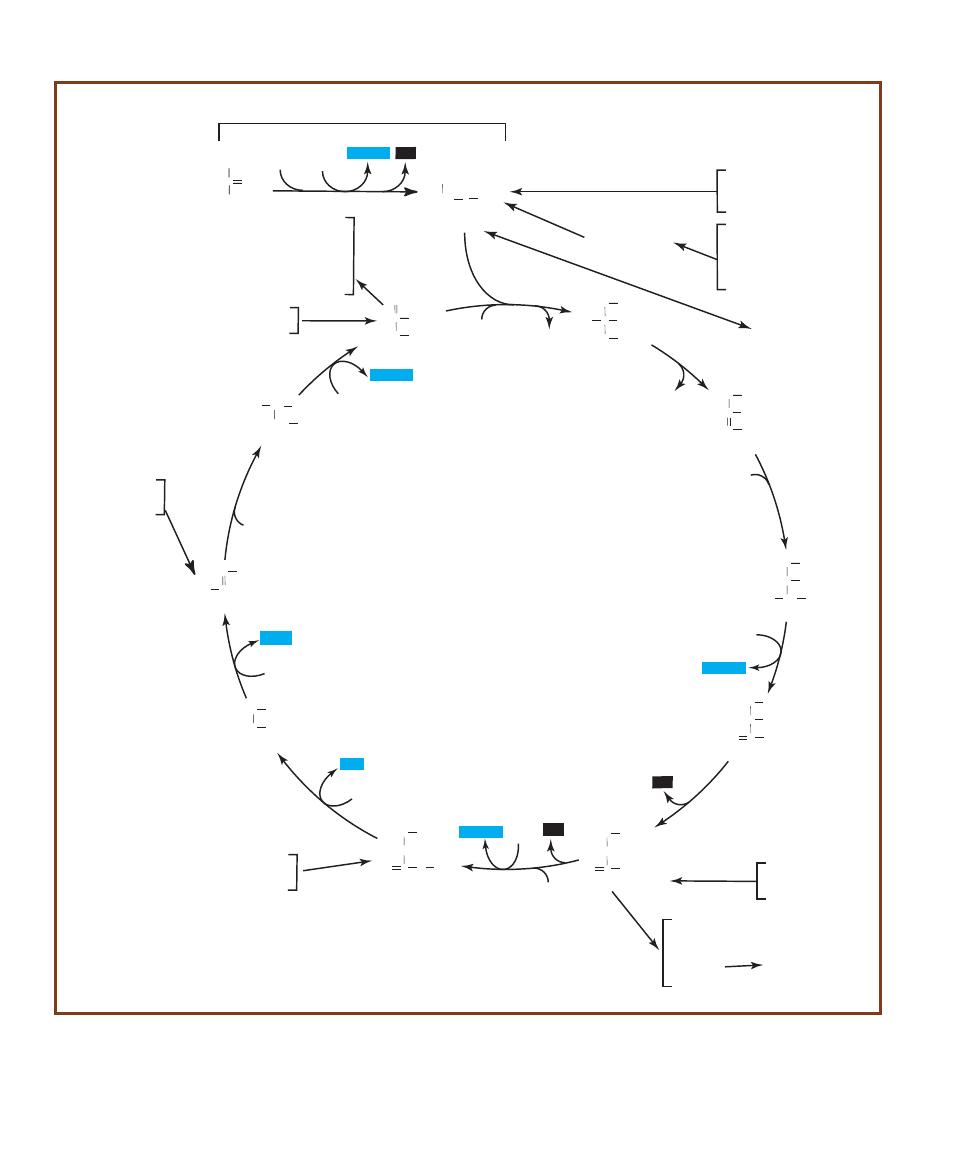
248
䢇
A Photographic Atlas for the Microbiology Laboratory
C
CH
3
O
COO
-
Pyruvate
Acetyl-CoA
CO S CoA
CH
3
CoA
NAD
+
NADH+H
+
Oxaloacetate
C
O
COO
-
H
2
C
COO
COO
-
Citrate
H
2
C
COO
-
HO C
C
COO
-
H
2
C
COO
-
Cis-aconitate
H
2
C
COO
-
C
COO
COO
-
HC
COO
-
Isocitrate
H
2
C
COO
HC
COO
-
COO
-
HO CH
COO
-
Oxalosuccinate
H
2
C
COO
-
HC
COO
COO
-
O C
COO
-
a-Ketoglutarate
H
2
C
COO
-
H
2
C
COO
O C
COO
-
Succinyl-CoA
H
2
C
COO
H
2
C
COO
-
O C
S CoA
Succinate
H
2
C
COO
-
H
2
C
COO
COO
-
Fumarate
HC
COO
-
CH
-
OOC
L-Malate
HO CH
COO
-
CH
2
COO
-
H
2
O
Citrate
synthase
Aconitase
H
2
O
CoA
Fe2+
H
2
O
Aconitase
Fe2+
NAD
+
NADH+H
+
Isocitrate
dehydrogenase
Isocitrate
dehydrogenase
CO
2
Mn2+
NADH+H
+
NAD
+
a-ketoglutarate
dehydrogenase
complex
CO
2
CoA
GTP
GDP+Pi
Succinyl-CoA
ligase
FADH2
FAD
Succinate
dehydrogenase
H
2
O
Fumarase
NADH+H
+
NAD
+
Malate
dehydrogenase
Aspartate
Asparagine
Lysine
Isoleucine
Methionine
Threonine
Arginine
Aspartate
Glutamate
Glutamine
Proline
Pyrimidines
Isoleucine
Leucine
Tryptophan
Aspartate
Asparagine
Aspartate
Phenylalanine
Tyrosine
Isoleucine
Methionine
Valine
Glutamine
Glutamate
Fatty Acids
ENTRY STEP
KREBS CYCLE
Leucine
Lysine
Phenylalanine
Tyrosine
Tryptophan
Acetoacetyl-CoA
CO
2
A-4
T
HE
E
NTRY
S
TEP AND
K
REBS
C
YCLE
The names of intermediates are printed in black ink; enzymes are in red. Reducing power (in the form of
NADHⳭH
Ⳮ
and FADH
2
) and GTP are highlighted in blue. CO
2
produced from the oxidation of carbon is highlighted in black.

APPENDIX
䢇
Biochemical Pathways
䢇
249
Compound
Number Produced
ATP Value in the Aerobic ETC
Total ATPs per Glucose
NADHⴐH
ⴐ
10
3
30
FADH
2
2
2
4
ATP (by substrate
4
4
phosphorylation)
ATP Yields from Complete Oxidation of Glucose to CO
2
by a Prokaryote Using Glycolysis,
Entry Step, and the Krebs Cycle with O
2
as the Final Electron Acceptor
T A B L E
A-5
Fermentation
Major End Products
Representative Organisms
Alcoholic fermentation
Ethanol and CO
2
Saccharomyces cerevisiae
Homofermentation
Lactate
Streptococcus and some
Lactobacillus
Heterofermentation
Lactate, ethanol, and acetate
Streptococcus, Leuconostoc,
and Lactobacillus
Mixed acid fermentation
Acetate, formate, succinate,
Escherichia, Salmonella,
CO
2
, H
2
, and ethanol
Klebsiella, and Shigella
2,3-Butanediol fermentation
2,3-Butanediol
Enterobacter, Serratia,
and Erwinia
Butyrate/butanol fermentation
Butanol, butyrate, acetone,
Clostridium, Butyrivibrio,
and isopropanol
and some Bacillus
Propionic acid fermentation
Propionate, acetate and CO
2
Propionibacterium, Veillonella,
and some Clostridium
Major Fermentations, Their End-Products, and Some Organisms That Performed Them
T A B L E
A-6
Entry Step
Krebs Cycle
Reactant
Product
Reactant
Product
2 Pyruvates
2 Acetyl CoAⴐ2 CO
2
2 Acetyl CoA
4 CO
2
2 Coenzyme A
2 Coenzyme A
2 NAD
ⴐ
2 NADHⴐ2H
ⴐ
6 NAD
ⴐ
6 NADHⴐ6H
ⴐ
2 GDPⴐ2 P
i
(ⴔ2 ADPⴐ2 P
i
)
2 GTP (ⴔ2 ATP)
Summary of Reactants and Products per Glucose in the Entry Step and the Krebs Cycle
T A B L E
A-4
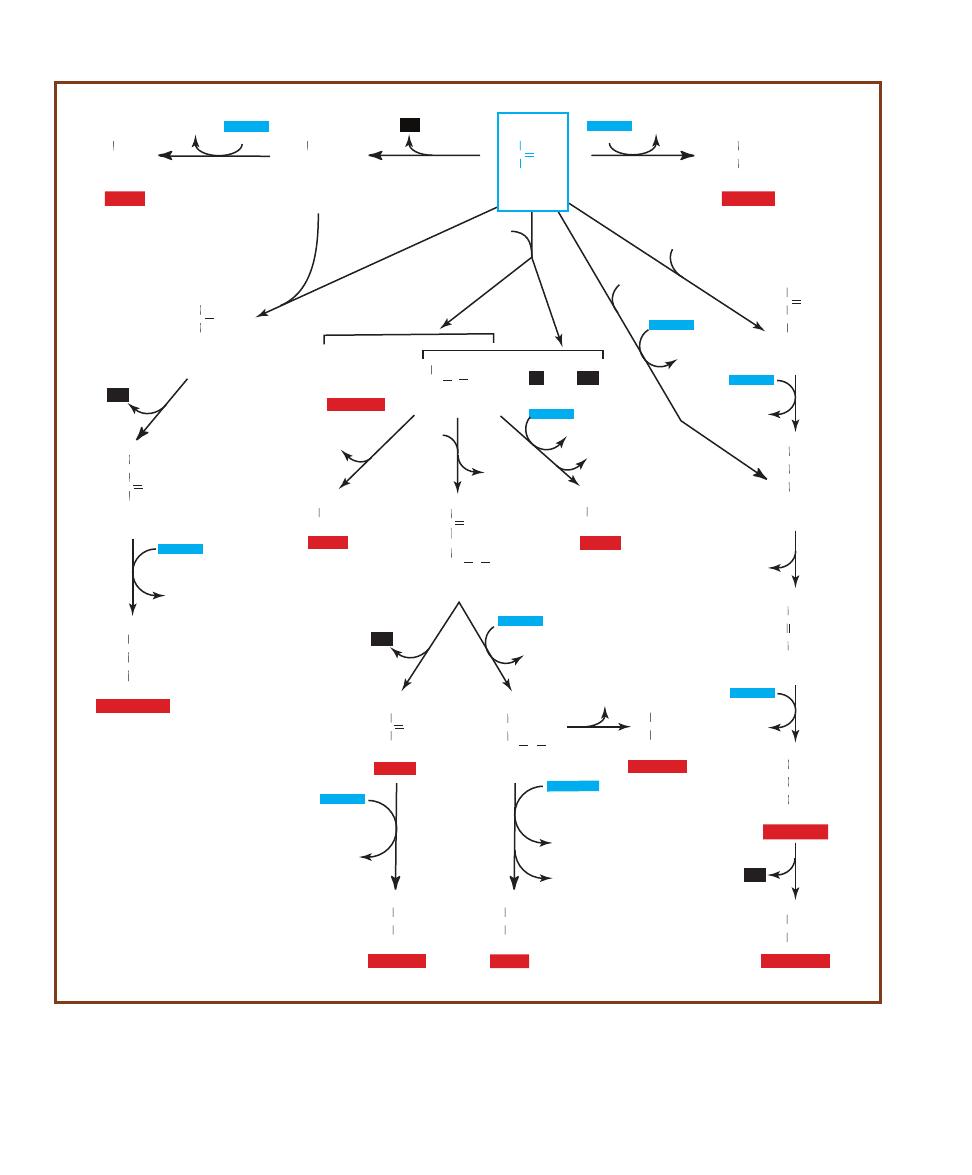
250
䢇
A Photographic Atlas for the Microbiology Laboratory
2NADH+H
+
NADH+H
+
NADH+H
+
NADH+H
+
NADH+H
+
NADH+H
+
NADH+H
+
NADH+H
+
NADH+H
+
C
CH
3
O
COO
-
Pyruvate
CHO
CH
3
Acetaldehyde
CH
2
OH
CH
3
Ethanol
a-Acetolactate
HOC
CH
3
COO
-
COCH
3
Acetoin
HOCH
CH
3
C O
CH
3
2,3-Butanediol
HCOH
CH
3
CH
3
HCOH
Acetyl-CoA
CO S CoA
CH
3
HCOO
-
+
Formate
+
H
2
+
CO
2
COO
-
CH
3
Acetate
C O
CH
3
CO S CoA
CH
2
Acetoacetyl CoA
CH
2
OH
CH
3
Ethanol
C
CH
3
O
CH
3
Acetone
HCOH
CH
3
CH
3
Isopropanol
(CH
2
)
2
CH
3
COO
-
Butyrate
(CH
2
)
2
CH
3
H
2
COH
Butanol
HCOH
CH
3
COO
-
Lactate
Oxaloacetate
C
COO
-
O
CH
2
COO
-
Malate
HCOH
COO
-
CH
2
COO
-
Fumarate
HC
COO
-
CH
COO
-
Succinate
CH
2
COO
-
CH
2
COO
-
CH
3
CH
2
COO
-
Propionate
NAD
+
NADH+H
+
CO
2
NAD
+
CO
2
CoA
CoA
NAD
+
CoA
NAD
+
2NAD
+
NAD
+
NAD
+
CoA
NAD
+
CO
2
NAD
+
H
2
O
NAD
+
CO
2
(CH
2
)
2
CH
3
Butyryl CoA
CoA
CO S CoA
Acetyl
CoA
CoA
CO
2
CO
2
A-5
A S
AMPLING OF
F
ERMENTATION
P
ATHWAYS
Note that all pathways start with pyruvate, have a step(s) where NADHⳭH
Ⳮ
(in blue) is oxidized
to NAD
Ⳮ
, and produce end-products falling into one of three categories: acid, gas, or alcohol.

Selected References for Further Reading
251
Ash, Lawrence R. and Thomas C. Orihel. 2007. Atlas of Human Parasitology, 5th
Ed. ASCP Press. Chicago, IL.
Bradbury, S. and B. Bracegirdle. 1998. Introduction to Light Microscopy (Microscopy
Handbooks 42). Springer-Verlag New York Inc. New York, NY.
Brooks, Geo. F., Karen C. Carroll, Janet S. Butel, Stephen A. Moore, and Timothy A.
Mietzner. 2010. Jawetz, Melnick & Adelberg’s Medical Microbiology, 25th Edition.
McGraw Hill Medical Publishers, New York, NY.
Fisher, Fran and Norma B. Cook. 1998. Fundamentals of Diagnostic Mycology. W.B.
Saunders Company, Philadelphia, PA.
Forbes, Betty A., Daniel F. Sahm, and Alice S. Weissfield. 2007. Bailey and Scott’s
Diagnostic Microbiology, 12th Ed. Mosby, Inc. St. Louis, MO.
Garcia, Lynne Shore. 2006. Diagnostic Medical Parasitology, 5th Ed. ASM Press,
Washington, D.C.
Garrity, George M. (Editor-in-Chief). Volume Editors: David R. Boone and Richard
W. Castenholz. 2001. Bergey’s Manual of Systematic Bacteriology, 2
nd
Ed., Volume 1:
The Archaea and the Deeply Branching and Phototrophic Bacteria. Springer-Verlag,
New York, NY.
Garrity, George M. (Editor-in-Chief). Volume Editors: Don J. Brenner, Noel R. Krieg,
and James T. Staley. 2005. Bergey’s Manual of Systematic Bacteriology, 2nd Ed.,
Volume 2, Parts A, B and C. The Proteobacteria. Springer-Verlag, New York, NY.
Gorbach, Sherwood L., John G. Bartlett, and Neil R. Blacklow. 2004. Infectious
Diseases, 3rd Ed. Lippincott Williams & Wilkins, Philadelphia, PA.
Larone, Davise H. 2002. Medically Important Fungi, A Guide to Identification, 4th
Ed. ASM Press, Washington, D.C.
MacFaddin, Jean F. 2001. Biochemical Tests for Identification of Medical Bacteria,
3rd Ed. Lippincott Williams & Wilkins, Philadelphia, PA.
Mescher, Anthony L. 2009. Junqueira’s Basic Histology, 12th Ed. McGraw-Hill
Medical Publishers, New York, NY.
Moat, Albert G., John W. Foster, and Michael P. Spector. 2002. Microbial Physiology,
4th Ed. Wiley-Liss, Inc. New York, NY.
Murray, Patrick R. (Editor-in-Chief). Volume Editors: Ellen Jo Baron, James H.
Jorgensen, Marie Louise Landry, and Michael A. Pfaller. 2007. Manual of Clinical
Microbiology, 9th Ed. ASM Press, Washington, D.C.
Nelson, David L. and Michael M. Cox. 2008. Lehninger’s Principles of Biochemistry,
5th Ed. W. H. Freeman Publishers, New York, NY.
Sheehan, Kathy B., David J. Patterson, Brett Leigh Dicks, and Joan M. Henson.
2005. Seen and Unseen–Discovering the Microbes of Yellowstone. Falcon Guides,
The Globe Pequot Press, Guilford, CT.

252
䢇
A Photographic Atlas for the Microbiology Laboratory
Shors, Teri. 2009. Understanding Viruses. Jones and Bartlett Publishers LLC,
Sudbury, MA.
Southwick, Frederick. 2008. Infectious Diseases—A Clinical Short Course, 2nd Ed.
McGraw Hill Medical Publishers, New York, NY.
Struthers, J. Keith and Roger P. Westran. 2003. Clinical Bacteriology. ASM Press,
Washington, D.C.
White, David. 2006. The Physiology and Biochemistry of Prokaryotes, 3rd Ed.
Oxford University Press, Inc. New York, NY.
Whitman, William B. (Director of the Editorial Office) and Aidan C. Parte (Manag-
ing Editor). Volume Editors: Paul De Vos, George M. Garrity, Dorothy Jones, Noel
R. Krieg, Wolfgang Ludwig, Fred A Rainey, Karl-Heinz Schleifer, and William B.
Whitman. 2009. Bergey’s Manual of Systematic Bacteriology, 2nd Ed., Volume 3:
The Firmicutes. Springer-Verlag, New York, NY.
Winn, Washington, Jr., Stephen Allen, William Janda, Elmer Koneman, Gary Procop,
Paul C. Schreckenberger and Gail Woods. 2005. Koneman’s Color Atlas and Textbook
of Diagnostic Microbiology, 6th Ed. Lippincott Williams & Wilkins, Philadelphia, PA.
Yellowstone National Park. 2010. Yellowstone Resources & Issues. Mammoth,
WY/Division of Interpretation.
Zimbro, Mary Jo and David A. Power, editors. 2003. Difco
TM
& BBL
TM
Manual—
Manual of Microbiological Culture Media. Becton, Dickinson and Company. Sparks,
MD 21152.

Acetobacter, 127
acetoin, 98
Acetyl-CoA, 77, 87
acid clot / reaction, 78, 80
acid end products, 14
acid-fast bacilli (AFB), 49
acid-fast stain / smear, 49–50, 180
acid hydrolysis of esculin, 60
acne, bacteria producing, 38
Actinobacteria Phylum, 131–132
143, 150, 152
actinomycete genus, 49
Acetobacter, 127
adenoviruses, 121
ADP and ATP, 166, 231
aerobes, 165, 166. See also anaerobes
bacterial, 125, 128, 130, 131
growth environments, 75, 95
obligate 28, 235
Aerococcus
, 61
Aeromonas
hydrophilia, 73, 133–134
sobria, 40, 55
aerotolerance, 28, 127, 132, 165
African sleeping sickness, 195
agar, agar slants, plates, deep stabs
and shakes, 4, 5, 19, 28, 29,
40, 51, 59, 75, 115–116, 231
agarose, 110, 111
agglutination, 65, 66, 101–102
AGMK (African Green Monkey
Kidney) cell culture, 122
agranulocytes, 239, 240
AIDS, 119–120, 152, 184, 199
Ajello, Dr. Libero, 186, 187, 191
(photos)
akinetes, 125, 126. See also spores
Alcaligenes, 75, 89
faecalis, 4, 22, 27, 73, 79, 90
algae, red and green, 171, 172, 174,
175
Allochromatium, 129
Allomyces, 172
Alphaproteobacteria, 127–128, 129,
138
alveolates / alveoli, 170–171
amastigotes, 194, 195, 196
Ames Test, 115–116
Amies medium, 226
amino acids, 18, 62, 63, 91, 93,
131, 234
decarboxylation, 67, 96
peptone, 71, 76
synthesis, 83
ammonia, ammonium phosphate,
ammonium hydroxide, 64, 67,
79, 91, 97, 129, 233
amoeba, “classical,” 177
amoebic dysentery (amebiasis), 200
amoebozoans, 176–178, 202
Anabaena, 126, 129, 233, 234
anaerobes / anaerobic
aerotolerant, 28
bacteria, 63, 125, 130, 131, 132
cultivating, 29, 30
facultative, 7, 128, 130, 157,
165, 166, 235
Gram-positive and Gram-negative,
15
hemolysis, 61
heterotrophs, 123
lab contaminant, 23
obligate, 165, 166, 235
respiration / respirers, 28, 83, 94,
128, 129; Appendix
spores / spore forming, 53, 140,
141
thiosulfate, reduction of, 80
transport system, 226
anaerobic jar, 29, 30
Anaerogen™ Gas Generating System
(Oxoid), 29
anaphylactic shock, 208
Ancylostoma duodenale, 213
anemia, 199, 207, 213, 216
Animal Kingdom, 1
animals
domestic, as carriers, 138, 139,
144, 204
Unikonta, 176
Anopheles mosquito, 197–199
anthrax, 51, 134, 135
antibiotics, 7, 9, 58, 59, 85, 87, 120,
132, 135, 139, 141, 158, 223,
224
antibodies
fluorescent, 105–106
HIV, 119
antigen-antibody reaction / tests, 99,
101–103
Antimicrobial Susceptibility Test,
59, 223–224
antiserum, 99–100
apicomplexans, 170, 171, 196, 197,
199
API 20 E multitest system (bio-
Mérieux, Inc.), 57–58
appendix infections, 142
Aquaspirillum, 128
Aquificales order, 123
Aquifex habitat, 123
Arachnoidiscus, 172
Archaea, 1, 2, 3, 124, 165, 235
archaeobacteria, 1
Archaeplastida, 169, 174–176
ARF (acute rheumatic fever), 161
arginne decarboxylation, 67
Arthrobacter, 132
arthroconidia, 188–189
Ascaris, 194
lumbricoides, 211–212
ascomycetes, 179, 182
ascorbic acid, 29
aspergillosis, 187–188
Aspergillus, 179, 187–188
oriyzae, 188
fumigatus, 187, 188
niger, 187, 188
soyae, 188
athlete’s foot, 185
ATP, 166, 169, 170, 249 (Appendix)
ATPases, 87
auramine O dye, 50
autoclave / autoclaving, 4, 7, 28, 238
autoradiograph, 110, 111, 113
autotrophs, 115, 123, 129, 130,
170, 171, 231
auxochrome, 37
axostyle, 169
azolitmin, 78
Azotobacter, 128, 129, 233, 234
Babesia microti, 196
babesiosis, 196
bacillariophytes, 172
Bacillales Phylum / Bacillaceae, 130
Bacillaria, 173
Bacillus / bacilli, 39, 40, 46, 47, 56,
92
acid-fast, 49
anthracis, 51, 73, 130, 134–135
cereus, 53, 56, 65, 73, 134, 135,
142
coagulans, 56
comparison of three species, 21
cultures, 52
endosore forming genera, 52
growth on slants, 27
licheniformis, 58
megaterium
, 38, 43, 52, 63
mycoides, 130
subtilis
, 39, 93
thuringiensis, 56
Bacitracin Susceptibility Test, 58–59,
94–95
bacteremia, 133, 134, 149, 156, 160
bacteria / Bacteria, 3, 32, 123, 235.
See also Gram-negative and
Gram-positive; prokaryotes
cells, cell walls, and cell structure,
39, 46, 56
chemolithotrophic, 233
colony features, 20
cultivating, 30
domains, 1, 2, 3
enteric, 16, 96
ETCs in, 88
fastidious, sampling for, 226
growth, 19, 27, 89
lactic acid cultures, 78
motile, 62
nitrogen-fixing and nitrifying,
129, 233, 234
oral, 237, 238
pathogenic, 6, 133
pleomorphism, 41
spore-forming, 53
sulfur, nonsulfur, and sulfur
oxidizing, 129–130, 231, 232,
235, 236
swarming, 13, 24, 55
bacteriochlorophyll, 125, 129
bacteriophages, 117, 220
bacteriorhodopsin, 166
Bacteroides, 92
fragilis, 7, 136
Balantidium coloi, 199–200
Baltimore, David, 118
Basidiomycetes, 179
basophils, 239, 240
BBE (Bacteroides bile esculin) Agar,
7
BBL Crystal
™
E/NF, 66, 145
BBL
TM
DrySlide
TM
, 75
BD BBL™ DrySlide™, 89
Becton-Dickinson Microbiology
Systems, 59, 75
Beggiatoa, 130, 231, 236
Betaproteobacteria, 127, 128, 129,
136, 151, 152
BGLB broth, 229, 230
BHIA (Brain Heart Infusion Agar),
4, 15, 20, 21, 22, 23
BiGGY Agar, 7
Bile Esculin Test / Bile Esculin Agar,
60
bile salts (oxgall), 6, 12, 13, 16, 17,
60, 210
biochemical pathways, 243
(Appendix)
bioluminescence, 128, 231
bioMérieux, Inc., 57–58
Bird, Billie Ruth, 127 (photo)
bismuth sulfite, 7
black fly, 214
-galactosidase / -galactose, 79,
86
-hemolytic group / -hemolysis,
58, 61
-Lactamase Test, 59
–oxidation, 77
blastoconidia. 179
Blastocystis hominis, 200
Blastomyces dermatitidis, 190, 191
blastomycosis, 190
Blood Agar, 21, 61, 62, 222
blood cell count, differential, 239–
240
blood factors, X and V, 8, 146
blood parasites / flukes, 196, 197,
205
blood smear / culture, 43, 155, 156,
163, 216. See also Blood Agar
blood typing, 101, 102
Bordetella
, 89
pertussis, 136–137
Borrelia, 125, 126
burgdorferi, 137–138
botulism, 140–141
bread mold, 179, 180
Brochothrix, 130
Brock, Dr. Thomas, 124
bright field microscope. See mi-
croscopy / microscopes
Bromcresol purple, 67, 80
Bromthymol blue, 64, 89–90. See
also pH and pH indicators
broth, 4, 39–40
Cooked Meat, 30
growth patterns in, 27
malonate, 81
MR-VP, 98
Nitrate, 83
spirillum grown in, 41
streptococcus grown in, 42
Thioglycollate, 30
Brownian motion, 55
Brucella melitensis / brucellosis, 138
Bt toxin, 56
bubonic plague, 163
Butyrous colony, 24
Caloplaca marina, 182
CAMP test, 62, 159
Campylobacter, 128
fetus, 128
jejuni, 29, 128, 139
cancer, 142
Candida, 7
albicans, 7, 183–184
candidiasis, 183
Capillaria hepatica, 212
capnophiles, 28
capsid / capsomeres, 117
capsule stain, 51
carbohydrate. See also lactose
fermentation; sucrose
fermentation, 71, 75–76, 82, 95–
96
carbolfuchsin, 40, 50
carbon dioxide (CO
2
), 29, 67, 236
carboxyl group, 18
carboxysomes, 128
casease / casein, 62, 63, 78, 80, 93
casein hydrolysis / Casein Hydrolysis
Test, 62–63, 78
catabolism
arginine, 67
trypophan, 74
Catalase Tests (slide and tube), 63–64
Caulobacter, 128
Cefinase
®
disks, 59
cell(s)
arrangement, 39–43
bacterial, 19, 46, 56
B and T, 240
daughter, 39, 128
dendritic, 119
epithelial, 39, 42, 46, 47, 48
immune, 241
morphology, 39, 40, 127
natural killer (NK), 240
plasma, 240
prokaryotic and eukaryotic, 1, 39
shapes, 39–41
spore mother, 51–52
structure, 2
vegetative, 51
cell culture
hemadsorption in, 122
to identify viruses in vitro, 120–
122
cellulitis, 133, 142, 153
cephalosporins, 59
Ceratium, 170
cestodes, 203
Diphyllobothrium latum, 207
CFU (colony forming units), 219,
221, 222
Chaetoceros, 173
Chagas’ disease, 195
Charophyceans / charophytes, 174,
176
chemoautotrophs, 129, 130
chemoheterotrophs, 124, 125, 132,
165, 166
chemolithotrophs / chemolithoauto -
trophs, 129, 165, 235, 236
chemoorganotrophic mesophiles
and neutrophiles, 130
chemotroph, 231
chickenpox, 121
Chilomastix mesnili, 200
Chlamydomonas / chlamydospores /
chlamydoconidia / Chlamydia,
175, 183, 186, 226
Chlorobi Phylum, 129
Chloroflexi Phylum and habitat,
125
Chlorophyta, 174, 176
chlorosomes, 129
Chocolate agar, 8, 151
cholera, 41, 162
CHROMagar, 184, 222
Chromalveolata, 169, 170, 196–200
Chromatium, 129
Chromobacterium, 128
violaceum, 24, 26
chromoblastomycosis, 189
chromogen /chromophore, 37, 38
chromoplasts, 172, 175, 176
ciliates/ cilia, 170, 171
Stentor, 171
Vorticella, 171
Citrate Utilization Test, 64–65
citric acid, 188
Citrobacter, 128, 139–140
diversus, 27, 46, 65
freundii, 80
koseri, 4, 140
Cladophora, 176
clonorchiasis, 203
Clonorchis (Opisthorchis) sinensis,
203
Index
253

Closteriuim, 176
Clostridiales, 131
Clostridium
, 52, 53, 77, 78, 92, 131
acetobutylicum
, 79
botulinum
, 53, 140–141, 143
butyricum
, 28, 29, 30
difficile
, 141
perfringens
, 73, 142
septicum
, 142
sporogenes (“Medusa Head”),
21, 29, 30, 79, 131
tetani, 73, 131, 143
clotting mechanisms, 65
clumping factor, 65
CMV (cytomegalovirus) CPE in cell
culture, 121
Coagulase Tests, 65–66
cocci, 132
cell arrangement, 39, 42–44
division patterns, 42
Gram-positive, 12, 13, 27, 48,
61, 65, 69, 130, 131
from nasal swab, 39
ovoid, 40
Coccidiodes immitis, 188–189
coccidioidomycosis, 188
coccobacilli, 130, 137, 138
Coccolithophora, 172, 173
coliforms, 6, 11, 12, 228. See also
lactose fermentation
methods to determine, 229–230
Colilert
®
method, 227–227
coliphages, 118
colistin and nalidixic acid (CNA), 9
colitis (PMC and AAC), 141
collagen, 73
colony(ies)
morphology, 19, 25
mucoid, 24
rhizoid, 21
umbonate, 23
colony counter, 19, 217, 219
colony-forming unit (CFU), 5
Columbia CAN with 5% Sheep
Blood Agar, 9
Computer Coding and Identification
System (CCIS), 70
Congo red stain, 38, 51
conidia / conidiophores, 187, 188,
189, 190
Coomassie blue, 110
corticosteroids, 152
corynebacteria / Corynebacterium /
Corynebacteriaceae, 39, 53,
92, 131
diphtheriae, 44, 54, 143–144
xerosis, 23, 39
Cosmarium, 176
countable plate, 217, 218
Crenarchaeota, 165
CRF (coagulase-reacting factor), 65
cryptococcosis, 184
Cryptococcus neoformans, 184
cryptosporidiosis, 196
Cryptosporidium parvum, 196
crystal violet, 39, 42, 46, 47
cultures
cell, to identify viruses, 120–122
mixed and pure, 2, 4, 5, 19
throat, 26
curds, 78–79, 80
Cynobacteria Phylum / cyanobacteria,
1, 3, 125–127, 129, 182, 233,
236
Anabaena, 126, 129
xerosis, 41
cysteine, 94, 96
cysticercus, 210
cytochromes and cytochrome c
oxidase, 87, 88–89
cytolysis, 56
cytomegaloviruses (CMV), 121
cytopathic effect (CPE), 120, 121,
122
cytoplasm, 3, 37, 48, 56
deamination, 71, 80, 234
decarboxylation, 18, 80
Decarboxylation Test, 67–68
decolorization, 46, 50
Deinococcus, 124
radiodurans, 23
Deltaproteobacteria, 127, 129, 130
denitrification, 83, 84
dental caries, 159, 237
deoxyribonucleotides, 112
dermatophytes, 185
desoxycholate, 9, 18
Desulfobibrionales / Desulfovibrio,
130
DFA (direct fluorescent antibody),
104, 136
DGI (disseminated gonococcal
infection), 151
diacetyl, 98
diarrhea, 133, 135, 139, 141, 142,
144, 145, 155, 156, 162, 193,
194, 200, 204, 205, 207, 209,
210, 213
diatoms, 1, 32, 171, 172–173
Dictyostelium
slug, 178
dientamoeba fragilis
, 194
digestion reaction (Litmus Milk), 79
dimorphic molds, 190–192
dinoflagellates, 170–171
diphtheria, 143–144
Diphyllobothrium latum and ursi, 207
diplomonads, 169–170
Dipylidium caninum, 207
direct count method, 219–220
direct smear, 46–48
disk diffusion test and dispenser,
223, 224
DMABA, 74
DMSO (Dimethyl Sulfoxide), 115,
116
DNA, 1, 106. See also RNA
Deinococcus repair mechanism,
124
eukaryotic, 109
extraction, 109–110
fingerprinting, 110
hydrolysis, 68
PCR technique of cloning, 124
Polymerase, 111, 114
replication, 9
sequencing, dideoxy method
(Sanger), 112, 113
in viruses / viral, 117–119, 220
DNA Polymerase (Taq1), 111, 124
DNase Test Agars, 24, 68–69
DOC (Dexoxycholate) Agar, 9, 10
domains, 1
comparison of three, 2
Durham tubes, 71, 229
dysentery, bacillary and parasitic,
156, 216
EC Broth, 229, 230
Echinococcus granulosus, 208
E. coli (Escherichia coli), 10, 11, 12,
13, 15, 16, 17, 29, 47, 73, 76,
79, 81, 82, 86, 88, 91, 93, 95,
98, 114, 118, 144–145
testing for, 222, 227, 228, 230
edema, 134
Ehrlichia, 128
electromagnetic spectrum, 114
electron acceptor, 6, 17, 130, 234
electron microscope, 1. See also mi-
croscopy / microscopes
electron transport chains (ETCs),
63, 87–88, 89
electrophoresis, 106, 108, 110–111,
113
elephantiasis, 216
ELISA tests / screening, 103–105,
106, 136, 163, 195
Elphidium, 174
EMB (Eosin Methylene Blue) Agar,
12
emulsions, preparing, 46
encephalitis, 122
Endo Agar, 11, 24, 228
endocarditis, 183
Endolimax nana, 202
endoplasmic reticulum, 1
endospore stain, 51–54
endosymbiosis, 170
entamoebas/ Entamoeba, 177
coli, 201
dispar, 201
hartmanni, 201
histolytica, 200, 201. 202
enteric(s), 6, 18, 134, 144
gram-negative, 60, 78
lactose fermenters, 11, 12
Enterobacter
, 68, 81, 128
aerogenes
, 11, 12, 13, 27, 37, 69,
71, 75, 81, 83, 84, 98, 128,
228
cloacae
, 128
Enterobacteriacae
, 6, 13, 57, 64, 67,
69, 71, 73, 75, 76, 77, 78, 81,
82, 83, 87, 88, 89, 93, 95, 98,
139, 144, 154, 222, 228
Enterobius vermicularis, 194, 212
Enterococcus, 13, 59, 60, 61, 92,
131
faecalis, 12, 16, 17, 27, 84, 85
faecium
, 20, 42, 60, 64, 131
enterotoxins, 133, 142, 157
Enterotube II, 70–71, 145
enteroviruses, 121
Entner-Doudoroff pathway,
Appendix 243, 245
environmental
factors, 19, 24, 157
phases, 232
sampling, 226–227
enzymes, 59, 62, 63, 82, 91
bacterial, 59
coagulase, 65
cysteine desulfurse, 93, 94
cytochrome c oxidase, 87
decarboxylate, 67
DNA Polymerase, 124
ETC, 88
extracellular, 65, 73
inducible, 86
intracellular, 86
lipases, 77
nitrate reductase, 83
nitrogenase, 233
oxidase, 89
proteolytic, 78
respiratory, 87
reverse transcriptase, 119
succinate, 81
thiosulfate reductase, 93, 94
tryptophanase, 74
urease, 96
in viruses, 117
Eosin Methylene Blue Agar, 12
eosinophilia / eosinophils, 212, 239,
240
Epidermophyton, 185
floccosum, 185, 186
epithelial cells. See cell(s), epithelial
epitopes, 100
Epsilonproteobacteria, 127, 128,
139
Erwinia, 128
amylovora, 22
erythrocytes, 43, 239. See also red
blood cells
Escherichia, 81, 128. See also E. coli
esculin / esculetin, 7, 60, 131, 133
E-test system, 224–225
ethidium bromide, 110, 111
euglenids, 169, 170
Eukarya domain / eukaryotes, 1, 2,
3, 169, 236
cells, 1, 56
ETC in, 88
fungi, 178
Euyarchaeota, 165–166
Excavata, 169–170
exoenzymes, 68–69. See also enzymes
exotoxins, 44, 61, 134, 156, 157,
163
extremophiles, 165
eyespot, 170
Fasciola hepatica, 204
Fasciolopsis buski, 204
fecal contamination, 11, 195, 196,
200, 202, 203, 204, 205, 206,
209, 210, 211, 214, 215, 216,
228. See also stool samples
fermentation, 11, 28, 89, 131, 159;
Appendix 246, 249, 250. See
also glucose; lactose; mannitol
carbohydrate, 75, 90, 96
of E. coli, 82
mixed-acid, 82
stormy, 78, 79
sulfur, 76
tests, 71–73
2,3-butanediol, 98
ferric ions, 6, 7, 17, 80
ferric ammonium citrate / ferric
citrate, 12, 16, 17, 18, 60
fibrinogen, 65
filipods, 149
final electron acceptor (FEA), 63
Firmicutes Phylum, 130–131, 134,
140, 141, 142, 143, 149, 157,
158, 159, 160, 161
FITC dye, 105
flagella. See also motility
Caulobacter, 128
eukaryote, 169, 170, 171
lophotrichous, 55
periplasmic, 125
polar, 129
stain, 54–55
Flashlight Fish, 221
flavoproteins, 63, 87, 88
flea infestation, 163, 207
flukes, 203, 204
fluorescent antibody (FA) technique,
105–106
fly. See black fly; sand fly; tsetse fly
fluorescent dyes / fluorochrome /
fluorescence, 50, 185, 200, 227
Fonsecaea pedrosoi
, 189
foraminiferans, 174
food poisoning, 135, 142, 157
Fragillaria
, 173
Francisella
, 93
Freeze, Dr. Hudson, 124
frustule, 172
fucoxanthin, 172
fumarate, 81
Fungi Kingdom, 1
fungus, 77, 132, 176, 178–182, 189,
192. See also yeasts
Fusobacteria / Fusobacterium, 92,
145
necrophorum, 145
nucleatum, 145
gall bladder, 204
Gammaproteobacteria Class, 127,
129, 130, 144, 146, 147, 148,
154, 155, 156, 163
gametangia, 172, 179
gametocytes, 197
Gardnerella vaginalis, 92
gastrointestinal disorders / gastro -
enteritis, 122, 128, 135, 136,
139, 139, 142, 145, 147, 149,
155, 204
Gelatin Hydrolysis Test, 73–74
gel immunodiffusion, 100
genetic
characteristics of the three
domains, 2
environmental influence, 19
genome, 2, 117, 124, 220
Georg, Lucille K., 185 (photo)
gentamicin, 7
Giardia lamblia / Giardia intesti-
nalis, 169–170, 193
Giemenez stain, 127, 138
Giemsa stain, 138, 239
Gloeocapsa, 126
Gluconobacter, 127
glucose and galactose
fermenter / fermentation, 67–68,
71, 75–76, 80, 81, 95, 96, 98,
123
hydrolysis, 79
oxidation, 243, Appendix 246–
249
glutathione, 30
glycine, 7
glycolysis, 71, 72, 77, 82, 87, 98,
170, Appendix 243–244
glycoprotein, 119, 122
Glycerol Yeast Extract, 24
Golgi bodies / Golgi complex, 1, 169
gonorrhea, 151
Gram-negative and Gram-positive.
See also bacilli; cocci
bacteria, 123, 125, 129, 130,
131, 132, 133
rods / cells, 6, 9, 12, 13, 15, 16,
17, 18, 46–48, 55, 57, 64, 71,
83, 95, 98
gram stains, 45–49
granulocytes, 239
granulomatosis infantiseptica, 149
Green Sulfur Bacteria, 129–130
guanidine nuclei, 98
gut peristalsis, 193
Guillain-Barré syndrome, 139
gymnamoebas, 177
Gyrosigma, 173
Haemophilus
influenzae, 8, 146
parainfluenzae, 146
Hafnia alvei
, 97
hair perforation test, 187
Haley, Dr. Lenore, 192 (photo)
Halobacterium
, 3, 166–167
halophiles, extreme, 3, 166
halorhodopsin, 166
hanging drop technique, 55
haptophytes / haptonema, 172, 173
heat-fixing, 38, 51
Hektoen Enteric (HE) Agar, 12, 13,
16
HeLa cells, 120
Helicobacter pylori, 147
helminths, parasitic, 194, 203. See
also
parasites
hemadsorption in cell culture, 122
hemagglutination / syphilis test, 101,
102
hemoglobin, 61
hemolysins, 61, 62, 152
hemolysis / -hemolytic
in blood agar, 61, 62
and nonhemoltic on CAN with
sheep blood agar, 9
of three throat cultures, 26
hepatitis, 212
herpes simplex viruses (HSV), 121,
122
Herpesviridae, 121
heterocysts, 125, 126
Heterokontophyta, 170, 171–172
heterotrophs / heterophy / hetero kont,
171, 174, 177, 178, 231
Histoplasma capsulatum, 191
HIV (human immunodeficiency
virus), 119–120
tests for, 103, 105, 106–108, 119
hookworms, 213–215
americanus, 213
duodenale, 213
hormones HCG and LH, 103
Hugh and Leifson’s O–F medium,
89
human chorionic gonadotropin, 103
hydatid cyst, 208
Hydrocdictyon, 175
hydrogenosomes, 169
hydrogen peroxide (H
2
O
2
)
production, 63
hydrogen sulfide / hydrogen sulfide
gas, 75, 76, 80, 94, 95
hydrolysis, 63, 79, 97, 231
Hymenolepis
diminuta, 209
nana, 209
hyperthermophiles, 123
hyphae (in fungi), 178, 179
immune
response, 65, 150, 157
system and cells, 134, 241–242
immunodiffusion test, 100
IMViC, 64, 82, 98
indicator. See pH and pH indicators
Indirect Fluorescent Antibody (IFA)
Test, 119
Indole Test, 74–75
influenza viruses, 106, 122
inoculating needles and loops, 65
intestinal disorders. See gastro -
intestinal
Iodamoeba bütschlii, 202
iodine, 93
Irgasan
®
, 15
isolation techniques, 5–6, 8, 10
Ixodes dammini, 196
254
䢇
A Photographic Atlas for the Microbiology Laboratory

kala-azar, 194, 195
Kaplan, William, 191 (photo)
karyogamy, 182
karyosomes, 177
keratin, 51
keratitis, 153, 214
kidney stones, 153
kinetoplastids / kinetoplasts, 170,
169, 170
Kingdoms, debate over, 2, 3
Kinyoun (K) method, 49–50, 180
Kirby-Bauer Test, 223–224
Klebsiella, 9, 128
mobilis, 37, 128
pneumoniae
, 11, 15, 22, 51,
147–148, 228
Kligler’s Iron Agar (KIA), 75–76
KNO
3
, 83
Koch, Robert, 4
Kocuria rosea
, 20, 26
KOH and KOH Test, 47, 98
Kovacs’ reagent, 74, 75
Krebs cycle and reverse Krebs cycle,
64, 74, 77, 81, 87, 89, 123,
129, Appendix 246, 248, 249
lactic acid, 130. See also fermentation
Lactobacillales order, 130
Lactobacillaceae / Lactobacillus,
130–131, 159, 237, 237
plantarum, 27, 131
Lactococcus, 131
lactis
, 40, 79
lactose fermentation, 6, 7, 9, 10, 11,
12, 13, 16, 71, 72, 75–76, 78,
86, 95, 155
Lancefield groups (Rebecca
Lancefield), 131
leech gut symbiont, 133
Legionella pneumophilia, 148, 150
Legionellosis / Legionnaires’ disease,
148
legumes, 129
Leishmania
donovani, 194–195
major, 195
tropica, 195
leishmaniasis, 194
Lepidopterans, 56
leprosy, 49, 150
Leptospsira, 125
leukemia, 133
leukocytes, 240
lichens, 182
Lipase Test, 77–78
lipases, 77
lipid
granules, 53
metabolism, 77
liquefaction, crateriform, 74
Listeriaceae / Listeria, 130, 150
monocytogenes, 149
listeriosis, 149
lithotroph, 231
Litmus Milk Medium, 78–80
liver fluke and liver diseases, 203,
209, 212
lockjaw, 143
LTB (Lauryl Tryptose Broth) and
tubes, 229
lucifersae, 230
lung conditions, 136, 150, 204, 208,
211, 216. See also pulmonary
Lyme disease, 137
lymph node and follicles / lympho-
cytes, 239, 240, 241, 242
lymphoma, 133, 152
Lyngbya, 126
lysine decarboxylation, 67–68, 80,
133
Lysine Iron Agar (LIA), 80–81
lytic cycle, 118, 220
MacConkey Agar, 12, 58, 133
macroconidia and microconidia,
185–186, 191
macrofungi, 178–179
macrophages, 240, 241
malachite green, 51
malaria, 199
Malonate Test, 81
MALTs of bronchiole and small
intestine, 242
Maneval’s stain, 51
mannitol and mannitol fermentation,
14, 16, 133
McFarland turbidity standard, 85,
224
measles virus, 122
media, 2–3
decarboxylase, 67
growth and maintenance, 120
selective and differential, 5–6, 9,
18, 57
slanted, 8
tubed, 4, 28
meiosis / meiospores, 172, 176, 184,
185
melanin, 189
Membrane Filter Technique, 11, 228
meningitis, 122, 139, 144, 145, 146,
152, 159, 160, 184, 195, 215
meningococcemia, 152
meningoencephalitis, 149
Merismopedia, 126
metabolism, 2, 28. See also
fermentation
aerobic respiration, 166
carbohydrate, 71
energy, 127
fatty acid, 64
metacercaria, 204
Metaphyta Kingdom, 1
Metazoa Kingdom, 1
Methanococci, 166
Methanogens / methane, 166
methylene blue dye and reductase
test, 237
methyl green dye, 69
Methyl Red (MR) Test, 82, 98
microaerophiles, 28, 29, 30, 128
microbes / microbial growth, 3, 28
microbial taxonomy, rewriting, 2
microbiologist, role of, 2, 40
Micrococcus/ Micrococcacae, 43,
58, 58, 131, 132
catarrhalis, 43
luteus, 20, 26, 43, 59, 73, 74, 83
roseus, 43, 47, 63, 73
Microsporum, 186
microscopy / microscopes
bright field and dark field, 31–35
components, 33
compound, 31, 32
contrast, 37
electron, 1, 129
fluorescence, 31, 32, 34,
105–106
scanning electron microscope
(SEM), 34, 36
transmission electron micro-
scope (TEM), 34, 35, 36
grid and grid holder, 35
inverted, 121
light, 1, 33, 37
magnification and magnification
formula, 32, 33
numerical aperture, 33
phase contrast, 31, 32, 34, 52,
53, 54, 237
resolution, 33
sputter coater, 36
stub, 36
ultramicrotome, 35
UV, 119
viewing screen, 35
wavelengths, 34
Microsporum audouinii and
gypseum,185
microtiter plate reader, 105
Milk Agar, 62–63
minimum inhibitory concentration
(MIC), 223
mitochondria, 1
mitochondrial ETC, 88
mitosomes, 170
mitosporangium, 172
molds
bread, 179
dimorphic, 190–192
filamentous, 178
monomorphic, 185–190
slime, 177–178
testing for, 226
water, 171, 172
Møller’s medium, 68
Molloy, Jan and Todd, 127 (photo)
Monera Kingdom, 1, 165
monocytes, 239, 240
monomorphic molds, 185–190
Moraxella, 89
catarrhalis
, 43, 68
mordant, 54
Morganella
, 97
morganii, 75, 76, 93, 95, 97
mosquito vectors, 197–199, 216
motility, 55, 58, 74, 125, 126, 129,
152, 155, 156
swarming, 153
Motility Test / Motility Test Agar,
82–83
MRC-5, 121
mRNA, 2
MR-VP Broth, 82
MSA (Mannitol Salt Agar), 14
MUG indicator nutrients, 227
Mullis, Kary, 111
multiple tube fermentation method /
most probable number
(MPN), 229–230
mumps virus, 122
mushroom, 179
mutation, frameshift, substitution,
and back, 115–116
mycelium, 132, 178
mycetoma, 153
Mycobacterium / Mycobacteriaceae,
49, 63, 131–132
kansasii, 32, 50
leprae, 49, 132, 150
phlei, 27
smegmatis, 23, 27, 50
tuberculosis, 23, 39, 44, 49, 132,
150–151
mycobiont, 182
mycolic acid, 50
myocarditis, 196
myonecrosis, 133, 142
NAD and NADH, 77, 87, 88, 98
Naegleria fowleri, 194
nasal swab, 48
Navicula, 172
Necator Americanus, 213
necrosis, 142, 157, 163
Neisseria / Neisseriales, 68, 77, 87,
92, 128
gonorrhoeae, 8, 42, 59, 151
influenza, 8
meningitidis 8, 151, 152
nematodes, 203, 211–216
nephritis, 215
neutrophils (segs), 48, 239
neurotoxins A, B, E, 140
Nigrosin stain, 38, 51
Nitrate Broth, 83, 84, 85
nitrate reduction and Nitrate
Reduction Test, 58, 83–85, 234
Nitrobacter/ nitrification, 129, 233
nitrocefin, 59
nitrogen cycle, 83, 232–233
Nitrosomonas, 129, 233
Nocardia / Nocardiaceae, 131, 132
asteroides, 49, 152–153
brasiliensis, 49
Nostoc, 126
novobiocin, 85
nucleic acid, 110
nucleoplasm, 56
nucleotides, 68, 113, 165
Nutrient Agar, 20, 22, 24, 26, 29, 221
nutrient availability, 24, 26. See also
environmental factors
obligate
anaerobes, cultivation of, 29
intracellular parasites, 117
thermophiles, 165
OCD (original cell density), 219–220,
222
ocular infection, 135
Oedogonium, 175
Onchocerca volvulus, 214
onchocerciasis, 214
ONPG Test, 86, 133, 227
oogonium / oomycetes,/ oocysts,
171, 172, 199
opportunistic pathogens / infections,
7, 20, 41, 43, 49, 65, 139,
144, 145, 152, 154, 184, 187,
190
Optochin Susceptibility Test, 87
organelles, 2, 169
organisms. See also Gram-negative
and Gram-positive
acid-fast, 49
coliform, 6, 11, 12
enteric, 6
sulfur, 235
organotroph, 231
ornithine decarboxylation, 67
Oscillatoria,
3, 126
oxaloacetate, 64
oxgall, 6, 17, 60. See also bile salts
oxidase and Oxidase Test, 57, 87–
89, 134
Oxidation-Fermentation (O–F) Test,
89–90
Oxoid Campygen™ sachet, 29
oxygen in aerotolerance / oxygen
reduction, 28, 29
PAGE (polyacrylamide gel electro -
phoresis), 110
palatine tonsil, 242
PAM (primary amebic meningo -
encephalitis), 194
parabasalids, 169, 194
Paracoccidioides brasiliensis, 192
paragonimiasis, 204
Paragonimus westermani, 204–205
parainfluenza virus, 122
paramecium, ciliate, 171
Paramyxoviridae, 122
parasites, 200, 204
animal / rodent, 170, 207, 212
apicomplexan(s), 170, 197–199
blood, 196
cestode, 207–211
coccidian, 49
fungi as, 178
intestinal, 196
intracellular / obligate intracellular,
117, 127, 132, 138
nematode, 211–216
trematode, 201–207
water mold, 172
parasporal crystals, 56
pathogens, 22, 49, 131, 132. See
also opportunistic pathogens
bacterial, 133
fungal, 183
human, 162, 184
nosocomial, 153, 158
PCP (pneumocystis pneumonia), 184
PCR. See polymerase chain reaction
PEA (Phenylethyl Alcohol Agar), 15
Pediastrum, 176
pellicle, 27
penicillins, 59, 155, 159, 162, 190
Penicillium, 190
camembertii (Camembert and
Brie cheeses), 190
marneffei, 190
notatum, 190, 223
roquefortii (Roquefort cheese),
190
pentose-phosphate cycle, Appendix
247
peptidoglycan, 46, 58
peptone, 71, 76, 79, 82, 83, 95, 96,
97, 98
pertussis, 136
Petroff-Hausser method, 219–220
phages and phage titer, 219–220.
See also bacteriophages
phagocytosis, 51, 65, 149, 156, 159,
160, 177
pH and pH indicators, 6, 14, 16, 17,
18, 64, 71, 75, 78, 79, 81, 82,
90, 92, 98, 120, 237
PHB granules, 56
phenol red, 14, 75, 97
Phenol Red Broth Fermentation
Test, 71
Phenylalanine Agar / Phenylalanine
Deaminase Test, 91
phenylethyl alcohol, 15
phialides, 187
phosphate buffers, 226
photoautotrophs, 129, 236
Photobacterium, 231
photobionts, 182
photogenesis, 2, 134
photoheterotrophs, 27, 125, 166
photosynthesis, 3
anoxygenic and oxygenic, 125,
129
of stramenopiles, 171–172
phototaxis, 175
phototrophs, 231, 232
phycoerythrin, 174
phylogeny, 2
PIA (Pseudomonas Isolation Agar),
15
Picornaviridae, 121
pigbel, 142
pigment production, 24, 25, 26
Pilolobus
, 182
pinworm, 212
plague epidemics, 163
Plant Kingdom, 1
plant pathogens, 22
plaque assay, 220–221
plasma cells, 240
plasma reagin tests, 162
plasmids, 2, 134
Plasmodium
, 170–171, 177, 197–
199
falciparum
, 198, 199
malariae, 198
physarium, 177
trophozoites, 196
vivax, 198
plasmogamy, 181
pleomorphism, 39, 41, 167
PMNs (polymorphonuclear
neutrophils), 239
pneumocystis jirovecii, 184–185
pneumonia, 22, 139, 145, 147, 152,
154, 160, 184, 211, 215
pneumonic plague, 163
pneumonitis, 185
polyacrylamide, 110
polymerase chain reaction (PCR),
111–112, 124, 136, 148
Pontiac fever, 148
Porphyridum, 174, 175, 175
potassium
hydroxide, 47
nitrate (KNO
3
), 83
permanganate, 50
phosphate, 97, 98
pour-plate technique, 221
precipitation reactions / precipitates,
99–100
precipitin ring test, 99–100
pregnancy tests, 103
progametangia, 180, 182
prokaryotes/ Prokaryotic domain, 2,
3, 165
promastigote, 194, 195
Propionibacterium, 132
acnes, 38, 132
protein(s), 1, 82, 98, 106, 109, 110.
See also flavoproteins
ActA, 149
gelatin as, 73
hydrolysis, 63
iron-sulfur, 87, 88
synthesis, 143
in viruses, 117, 119
Proteobacteria Phylum, 127–130
Proteus, 9, 12, 15, 16, 73, 93, 96,
97, 128
mirabilis, 12, 18, 76, 78, 80, 91,
95, 153–154, 222
vulgaris, 55, 68, 73, 83, 86
Protista Kingdom / protists, 1, 170
prototrophs, 115
protozoans, 193. See also groups
Chromalveolata; Excavata,
Unikonta
Providencia, 18, 97
rettgeri, 93
stuartii, 22
pseudohyphae, 179, 183
Pseudomonadaceae, 87
Pseudomonas, 9, 15, 89, 95, 128
Index
䢇
255

aeruginosa, 15, 24, 25, 26, 28,
29, 54, 68, 76, 79, 84, 85, 90,
95, 154–155
flagella, 55
fluorescens
, 15
as Gram-negative, 75
peritrichous, 55
Pseudomonas
Isolation Agar. See
PIA
pseudohyphae, 183
pseudopods / pseupodia, 3, 174,
176–177
pulmonary diseases, 50, 192. See
also lung
Purple Broth Fermentation Test,
71–73
purple sulfur and nonsulfur bacteria,
129
putrescine, 67
pyocyanin, 15
pyrenoids, 174
pyrimidine dimers, 114
PYR Test, 91–92
pyruvate, 64, 71, 87, 94, 98, 246
(Appendix)
quadrant method, 5–6
quorem sensing, 231
rabies virus, 106
Radiolarian test, 174
Ramalina menziesii
, 182
red blood cells (RBCs)
agglutination of, 101
guinea pig in hemadsorption test,
122
infection of, 196, 197, 198
hemolyzing, 22, 61, 152
respiratory syncytial viruses (RSV),
121
reticuloendothelial cells, 241
retroviruses, 119
reversion, 71, 75, 76, 95, 96
Rh factor / blood groups, 101, 102
rhinoviruses, 121
Rhizaria, 169, 174
Rhizobium, 129, 233, 234
leguminosarum, 23
Rhizopus, 179, 180–182
arrhizus, 180
columella, 181
oryzae, 180
progametangia, 181
rhizoids, 180
stolonifer, 180
zygospore, 181
Rhodococcus rhodochrous, 21
Rhodophyta, 174
Rhodospirallales, 127
Rhodospirillum rubrum, 27, 40, 41
ribosomal RNA. See RNA
ribosome, types of, 2
Rickettsiales, 127–128
Rickettsia rickettsii, 127
ringworm, 185
river blindness, 214
RODAC™ plate, 226–227
roller drum, incubation of culture
in, 120
round worms, 203
RPR (Rapid Plasma Reagin) test for
syphilis, 102
RNA / rRNA, 1, 106, 108, 201
viral, 117–119
rubella virus and antibodies, 103, 122
Sabourand Dextrose Agar, 226
Saccharomyces cerevisiae, 178, 179,
180
safranin stain, 37, 41, 52
Salmonella, 12, 16, 18, 80, 82, 93,
128, 139, 155
agglutination of, 102
Enteritidis, 155
histidine auxotrophs, 115–116
typhi, 155, 156
typhimurium, 4, 11, 12, 13, 16,
18, 80, 115
salterns, 167
Salton Sea microbial mat, 236
sample collection and transport
media, 225–226
sand fly, 194–195
Sanger, Frederick, 112, 113
Saprolegnia, 172
saprophytes, 172, 178
sarcina division pattern, 42
Sarcina
aurantiaca, 20
aurens, 43
maxima, 43
Scenedesmus, 175
Schaeffer-Fulton method, 51–52
Schistosoma
haematobium
, 205
japonicum
, 205
mansoni
, 206
sediment, 27
semiquantitative streak method, 222
sepsis, 139, 141, 144
septicemia, 215
serial dilution, 217, 218
serological reactions / tests / tech-
niques, 99, 103, 137, 162,
191, 199
Serratia
, 6, 73
DNase, 68
marcescens
, 6, 25, 26, 69, 115
Sheep Blood Agar, 9. See also Blood
Agar
bacteria on, 20, 22, 23, 24, 226
bacitracin susceptibility on, 59
hemolysis on, 61
optochin on, 87
SXT test on, 94–95
throat cultures on, 26
urine streak on, 222
Shigella, 10, 12, 16, 18, 80, 82, 128,
139
boydii, 156
dysenteriae, 156–157
flexneri, 13, 16, 90, 155, 156, 157
sonnei, 13, 83, 156
shingles, 121
SIM Medium, 74, 75, 83, 93–94
Simmons Citrate slant and agar, 64,
65
slants
growth texture on, 27
KIA, 75–76
LIA, 80–81
sleeping sickness, 195
slime molds, 177–178
slugs, 178
smear
acid-fast, 49
direct, 46–48
heat-fixed, 51
snapping division, 39, 44, 131
Snyder test, 237–238
sodium cholate, 17
sodium thiosulfate, 12, 17, 80
soil
bacteria, 38, 39, 129, 130, 131,
132, 142, 140, 142, 149, 152,
153, 154
cultures on Nutrient Agar, 26
fungi / yeast, 184, 190, 191
protozoans, 194
saprophyte, 172
solvent, 37
soybean and soy sauce, 188
spirilla, 39, 40, 41
Spirochaetes Phylum / Spirochaeta,
125, 137, 162
Spirogyra, 176
Spirulina, 126
Spirillum volutans, 54
Spirit Blue Agar, 77–78
spleen section, 242
sporangia / sporangiophores, 179,
180, 181, 182, 188
spore(s) / sporulation
mother cells, 51–52
with phase contrast microscopy,
53
subterminal, 54
Sporosarcina ureae
, 52
SS (Salmonella–Shigella) Agar, 16
stains
acid-fast, 49–50
acidic, 38, 51
basic, 37–38
capsule, 51
differential, 49
endospore, 51–54
flagella, 54–55
Gram, 46–47
negative, 38
precipitate, 48
simple, 54
using Crystal Violet, 38
using Safranin, 37
spore, 52
standard plate count, 217–219
Staphyloccus / Staphylococcacae,
13, 39, 58, 58, 59, 61, 77, 130
arrangements, 46
aureus, 14, 15, 16, 17, 26, 27,
28, 29, 59, 60, 62, 64, 65, 66,
68, 69, 73, 78, 130, 157–158,
223
division patterns, 42
DNase, 68
epidermidis,
14, 17, 20, 26, 46,
50, 61, 65, 66, 69, 73, 85,
130, 158
Gram-staining, 47
saprophyticus, 85
starch and starch hydrolysis, 91–93
Starch Agar, 92, 93
Stauffer, Larry, 164 (photo)
STDs (sexually transmitted diseases),
162
Stomatococcus, 58
stool specimens / samples, 193,
200, 202. See also fecal
contamination
stramenopiles, 170, 171–172
streak plate methods of isolation,
5–6
streak-stab technique, 61
strep throat, 161
Streptobaccilus arrangement, 43
Streptococcacae / streptococci /
Streptococcus, 94–95, 130–
131, 131
agalactiae, 62, 159
Bacitracin and SXT reactions, 95
bovis, 60
catalase-negative, 63
division pattern and arrange-
ment, 42
mutans, 159–160
oral, 237
pneumoniae, 51, 87, 131, 160
pyogenes, 91, 92, 131, 161
urine culture to detect, 222
streptolysins, 61
Streptomycetaceae / Streptomyces /
27, 132
griseus, 23
stromatolites, 127
Strongyloides stercoralis, 215
succinate, 81
sucrose and sucrose fermenters /
fermentation, 17, 72, 95, 133
Sulfamethoxazole, 94
Sulfolobus, 165
sulfur, 235–237
and nonsulfur bacteria, 129–130,
231, 232
and sulfur reduction / reducers, 6,
12, 16, 17, 18, 74, 75, 76, 80,
81, 94, 96, 123, 236–237
Sulfur Reduction Test, 93–94
superoxide dismutase, 63
swabs, 225–226
SXT Susceptibility Test, 94–95
Synedra
, 173
synergistic effect of antibiotics, 224
syphilis, and tests for, 101, 102, 162
Tabellaria
, 173
Taenia
cysticercus, 210
saginata, 210
solium, 210, 211
tapeworms, 203, 207, 209, 210
TCBS (Thiosulfate Citrate Bile
Sucrose) Agar, 17
Tellurite Glycine Agar, 16–17
tetanus, 143
thermocycler, 112
Thermotogae Phylum, 123–124
Thermotoga maritima
, 124
Thermus aquaticus
, 124
thioglycollate and Thioglycollate
broth, 30, 226
thiosulfate and thiosulfate reduc-
tion, 6, 17, 76, 94
Thiothrix, 130
threadworm, 215
thymine dimers, 114
thymus lymphocytes, 242
tick vector, 196
tinea, 185, 186
tobacco mosaic virus (TMV) / disease,
117
Todd-Hewitt Broth, 27
toluidine blue, 69, 69
toxemia, 216
toxicity / toxins, 134, 141
bacteremia, 133
Shiga, 145
testing for, 116
toxic shock syndrome, 157
Toxoplasma gondii, 199
transpeptidase, 59
trematode parasites, 203–207
Treponema, 38, 125
antibodies, 102
pallidum, 101, 162
Tributyrin Agar, 77, 78
Trichinella spiralis, 215
trichinosis, 215
trichomes, 125, 126
Trichomonas
hominis, 194
tenax, 194
vaginalis, 194
Trichophyton, 185
mentagrophytes, 186, 187
rubrum, 187
terrestre, 186, 187
tonsurans, 186, 187
Trichuris trichiura, 216
triglycerides / triacylgloycerols, 77
Trimethoprim, 94
Triple Sugar Iron Agar (TSIA), 80,
95
Trypanosoma, 170
brucei, 195
cruzi, 195–196
trypanosomiasis, African 195
Tryptic Soy Agar (TSA), 28, 61
Trypticase Soy Agar, 23, 26, 226
tryptophan / tryptophanase, 74
tsetse fly, 195
TSLS (toxic shock-like syndrome),
161
TTC (tetrazolium salt), 82
tuberculosis / tubercles, 49, 150
turbidity, 27
Ulothrix, 175
ultraviolet (UV) radiation damage
and repair, 114–115
ultraviolet spectrophotometer, 109,
110
undecaprenyl phosphate, 58
undulant fever, 138
Unikonta group, 169, 176, 200–202
urea / urease, 67, 96, 97
Urea Agar and Urea Broth, 97
Urease Tests / urease, 96–97, 154
urinary tract infections, 22, 139,
144, 145, 153, 154
urine streak–semiquantitative
method, 222
Valley fever, 188
Vampirolepsis, 209
viable count, 217
Vibrio, 17, 128, 231
cholerae, 17, 41, 162–163
parahaemolyticus
, 163
viral DNA, 220
virus(s)
categories of, 118–119
cell culture, 120
influenza, 106, 122
MRC-5 and, 121
rabies, 106
replication, 117–118
rubella antibodies, 103
Voges-Proskauer (VP) test, 82, 98,
140, 160
Volvix, 175
vulvovaginitis, 194
VZV (varicella-zoster virus), 121,
122
water
molds, 171, 172
potable, 228
Western Blot technique, 106–108,
137
wet mounts, 55, 125–127, 172
whey, 79
white blood cells (WBCs), 239, 240
whole mount, 32
whooping cough, 136
Winogradsky column (Sergei
Winogradsky), 129, 130,
231–232
Wood’s lamp, 185
World Health Organization MDT
drug recommendation, 150
worms, parasitic, 203, 204, 207,
210, 211, 216. See also
parasites
Wright’s stain, 239
Wuchereria bancrofti, 216
XLD (Xylose Lysine Desoxycholate)
agars, 16
xylose, 18
X and V blood factors, 8, 146
yeasts. See also fungus
ascomycete, 184
Blastomyces dermatitidis, 190,
191
Histoplasma capsulatum, 191
media to test, 226
of medical importance, 181–185
Paracoccidiodes brasiliensis, 192
and yeast extract, 7, 9, 28, 30,
178
Yersinia, 128
pestis, 163–164
Ziehl-Neelsen (ZN) method, 49–50
zinc, 84, 85
zone of equivalence, 99
zone of inhibition, 87, 116, 223
zygospores / zygomycosis, 180, 181,
182
zygotes, 180
256
䢇
A Photographic Atlas for the Microbiology Laboratory