1
Medicine
ECG
Electrocardiography
http://goo.gl/rjRf4F
I
LOKA
©
http://www.muhadharaty.com/ECG
I

2
Content
Topics:
Page:
Electrical activity in the myocardial cells
4
Method of recording the electrical activity of the heart
6
Electrical events in the heart during one cardiac cycle
7
Drawing the ECG waves
9
ECG paper
10
ECG patterns
10
ECG lead
12
Determining the heart rate by ECG
15
Determining the axis by ECG
15
Atrial enlargement
17
Ventricular hypertrophy
18
Secondary repolarization abnormalities
19
Intrinsicoid deflection
19
Right bundle branch block
20
Left bundle branch block
21
Incomplete blocks
21
Fascicular blocks (Hemiblocks)
22
Bifasicular block
22
Sinus Tachycardia
24
Atrial fibrillation
24
Atrial flutter
25
Multifocal atrial tachycardia
26
Supraventricular tachycardia
26
Ventricular tachycardia
27
1
st
Degree AV block
29
2
nd
Degree AV block
29
3
rd
Degree AV block
31
R wave progression
32
ST segment elevation
33
ST segment depression
33
T wave abnormalities
34
Low voltage
35
Electrical alternans
35
Myocardial infarction
35

3
Sinus arrhythmia
41
SA nodal exit block
41
Sinus pause
42
Sinus arrest
42
Sick sinus syndrome
43
Pericarditis
43
Massive Pericardial Effusion
44
Dilated Cardiomyopathy
44
Hypertrophic Cardiomyopathy
45
Restrictive Cardiomyopathy
45
Dextrocardia
46
Pacemaker Rhythms
46
Chronic Obstructive Pulmonary Disease
47
Pulmonary Embolism
48
Hypercalcaemia
49
Hypocalcaemia
50
Hyperkalemia
50
Hypokalemia
51
Hypomagnesaemia
52
Hyperthyroidism
52
Hypothyroidism
53
Hypothermia
53
Beta-blocker & Calcium-channel blocker toxicity
54
Digoxin Effect
54
Systematic method of ECG interpretation
55
Sources
1.
The Only EKG Book You'll Ever Need, 8E (2015)
2.
http://lifeinthefastlane.com/ecg-library/
3.
4.
Dr. Najeeb Lectures

4
Part1:
Basic information in ECG
#Definition:
Graphical presentation of the electrical activity of the heart.
#Electrical activity in the myocardial cells:
Normally Na is more outside the cells, and Ca also more outside, but K is more inside
the cells.
Normally the cells are negative inside.
First these cells are unstimulated (electrical resting state) and they have what is called
resting membrane potential.
Resting membrane potential (R.M.P) is the electrical voltage difference between the
inside of the membrane and outside of the membrane normally these cells are
negatively polarized internally (-90 mV).
When there is appropriate stimulation to the cells (cations Na or Ca enter) the resting
membrane potential reach start to be less negatively (-80, -70, …) and the cell reach
the threshold potential (70 mV) so the voltage gated sodium channels open up and a
lot of Na get inside the cell, so the large amount of Na will neutralized the negative
charge and eventually become positive (+10 mV).
So the membrane which is initially negatively polarized, become positive and loss its
negativity so ((depolarized)).
Then Ca and K channels both open and K start to reflux outside so the positive charge
start to be less positivity.
Then for short duration K still go out and Ca start to enter, so the electrical charge
balance and fixed at the same level this state is called plateau.
By time the Ca channels are closed and the K channels become more active, and there
is heavy K reflux.
So the cell loss the positive charge and become electro-negative.
The K still being lost until the cell charge reach the resting membrane potential (-90
mV) so the membrane is ((repolarized)).
Adjacent myocardial cells have electrical connections called Gap junction.
So of the cations which enter the first cell go to the second cell through the gap
junctions, and rise the resting membrane potential of the second cell toward the
threshold level, and the same cycle is start in the second cells.
So the first cell is depolarized then repolarized and transfer the cations to the second
cell which also depolarized and repolarized and transfer the cations to the third cell
and so on, this is called ((syncytium)).
5
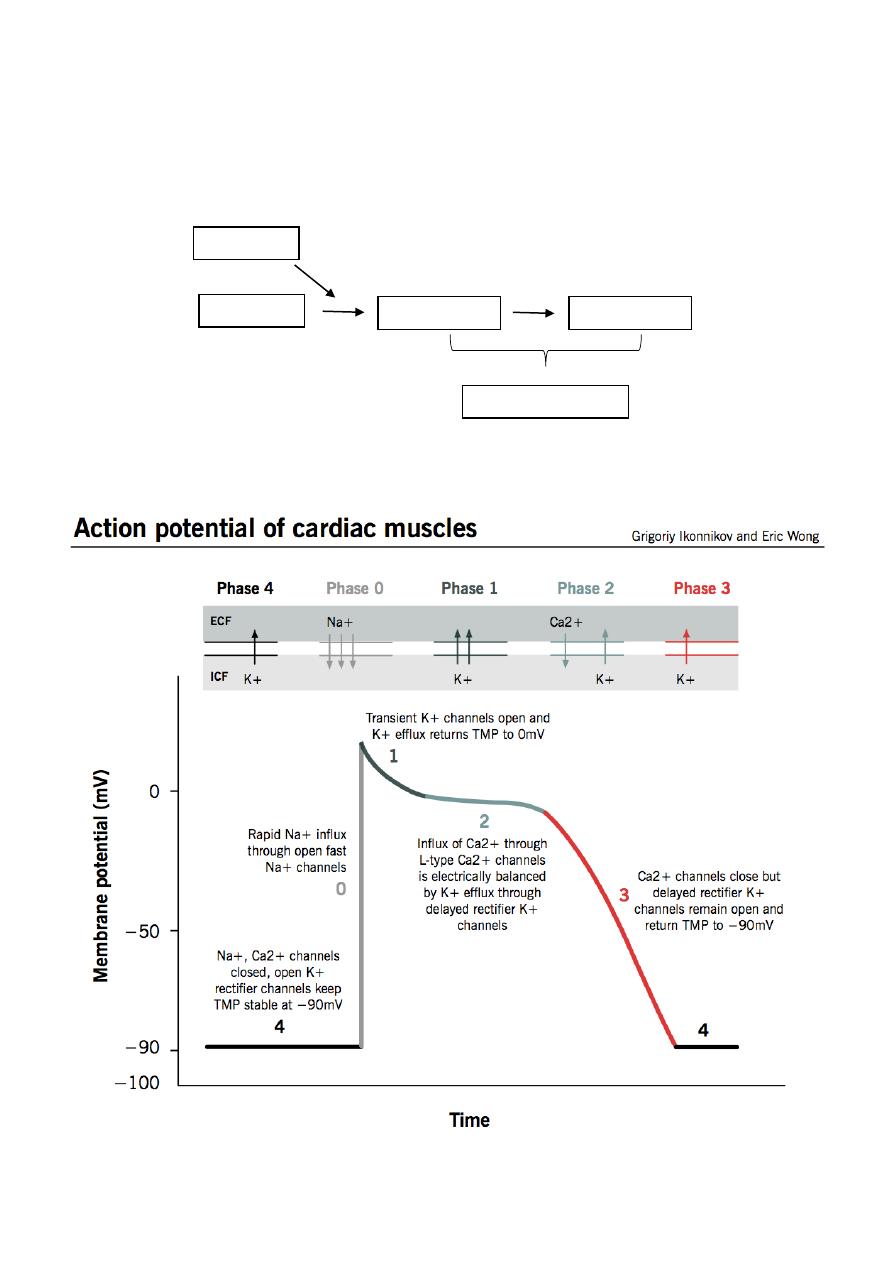
This fluctuation between the depolarization and repolarization of the membrane
potential because it is moving from cell to cell it called ((action potential)).
In action potential the positive charge is move.
Depolarization and repolarization of cells of the SA node is not Na dependent but it is
Ca dependent.
Stimulation
R.M.P
Depolarization
Repolarization
Action potential
6
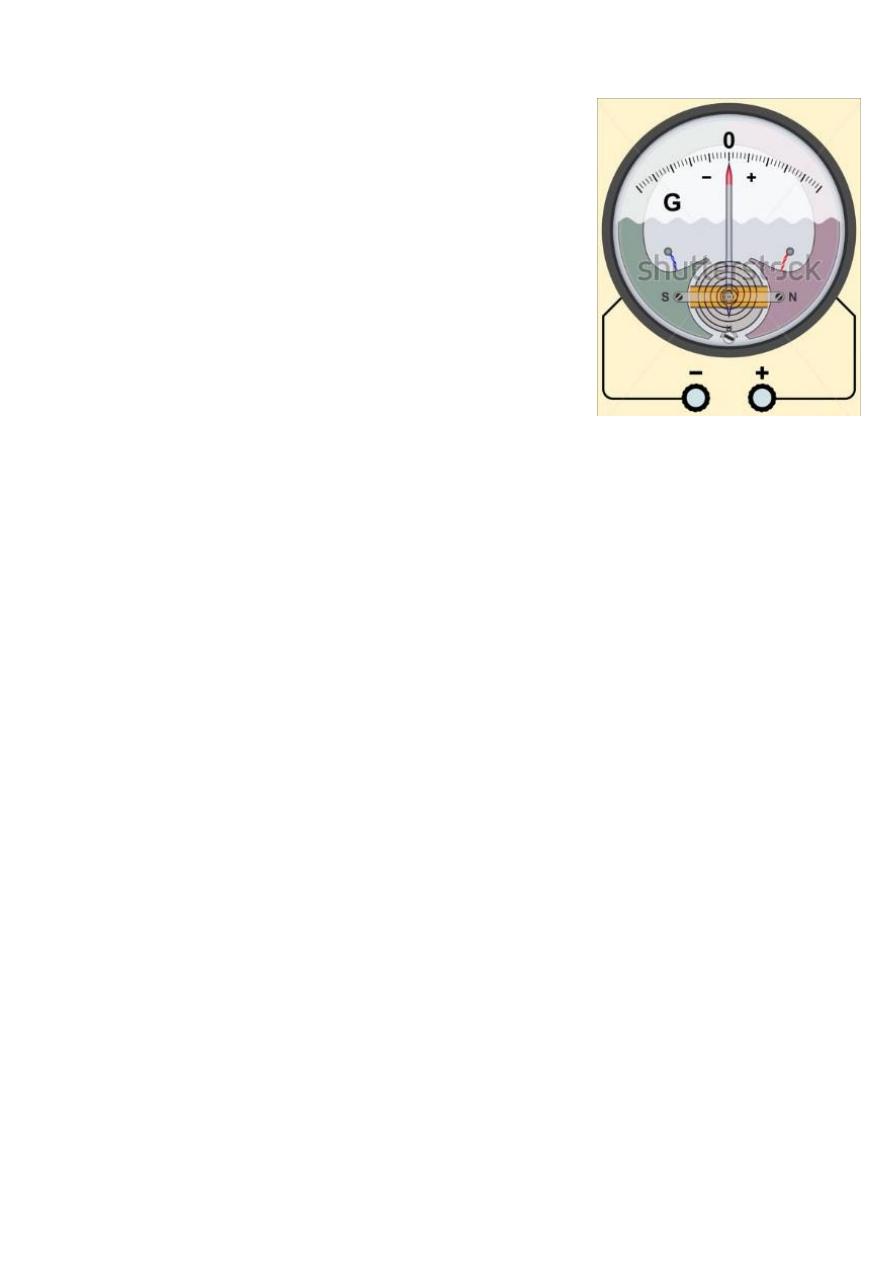
#Method of recording the electrical activity of the heart:
The electrical activity of the myocardial cells is detected
by the ((galvanometer)) which composed from positive
electrode, negative electrode and needle.
When we connect a piece of the ventricle (contains a lot
of myocardial cells) to the galvanometer, the needle
pointed toward the zero in the beginning which means
there is resting membrane potential.
Then, when there is depolarization in some cells which
means positive charge that moves from the negative
electrode to the positive electrode (net electrical charge),
the needle deflected toward the positive side.
The electrical arrow (cardiac vectors) which represent the
net electrical charge has two important things, first is the direction of the vector which
represent the direction of the net electrical wave, second is the length of the vector
which proportional to the strength of the net electrical wave.
Increasing the thickness of the piece of myocardium will increase the net electrical
activity and lead to longer electrical vector, so piece of ventricle will produce longer
arrow than piece of atrium.
When we reverse the connection of electrodes, the electrical wave of depolarization
(positive charge) go away form (not toward) the positive electrode, and the needle will
deflected to the negative side.
Next when the myocardial cells in this piece of ventricle all become completely
depolarized there is no net electrical charge, so there is no further movement of the
electrical charge so needle is come back to the zero (neutral position).
Then, the last point which was depolarized in this piece of ventricle will become the
first point get repolarization, so there is repolarization (negative) wave will move from
the positive electrode toward the negative electrode, so the needle is deflected to the
positive side because similar charges moves toward similar electrode so the deflection
is positive.
Depolarization positive wave / toward positive electrode positive deflection.
Repolarization negative wave / toward negative electrode positive deflection.
A specialized fast connecting myocardial cells in the ventricles called ((purkinje cells))
and the action potential moves faster in these cells so the deflection of the needle will
be very fast.

7
#Electrical events in the heart during one cardiac cycle:
The electrical activity of the heart start by wave of depolarization generated by the AS
node and stimulate the cells near the SA node, then this wave moves through the
whole atrium.
The direction of this wave in the atrium is downward and leftward because the SA node
which generate the depolarization present in the right and upward.
So all of atrial cells together make a vector that directed downward and leftward
((atrial depolarization vector)) this vector is small and not fast.
When both atria become completely depolarized, the electrical current will hit the
fibrous annulus (connective fibrous tissue separate the atria from ventricles) and most
of current will die because the fibrous annulus is poor conductor, the only point from
where the depolarization will go from atria to ventricles is AV node.
The current pass through AV node very slowly down to the ventricles and this is good,
because this thing help the atria to complete its contraction then the ventricles can
start the contraction.
AV node is very tiny piece of tissue so it produce small vector so ECG machine will not
pick it up, so heart appear electrically silent for (0.1 ms) duration.
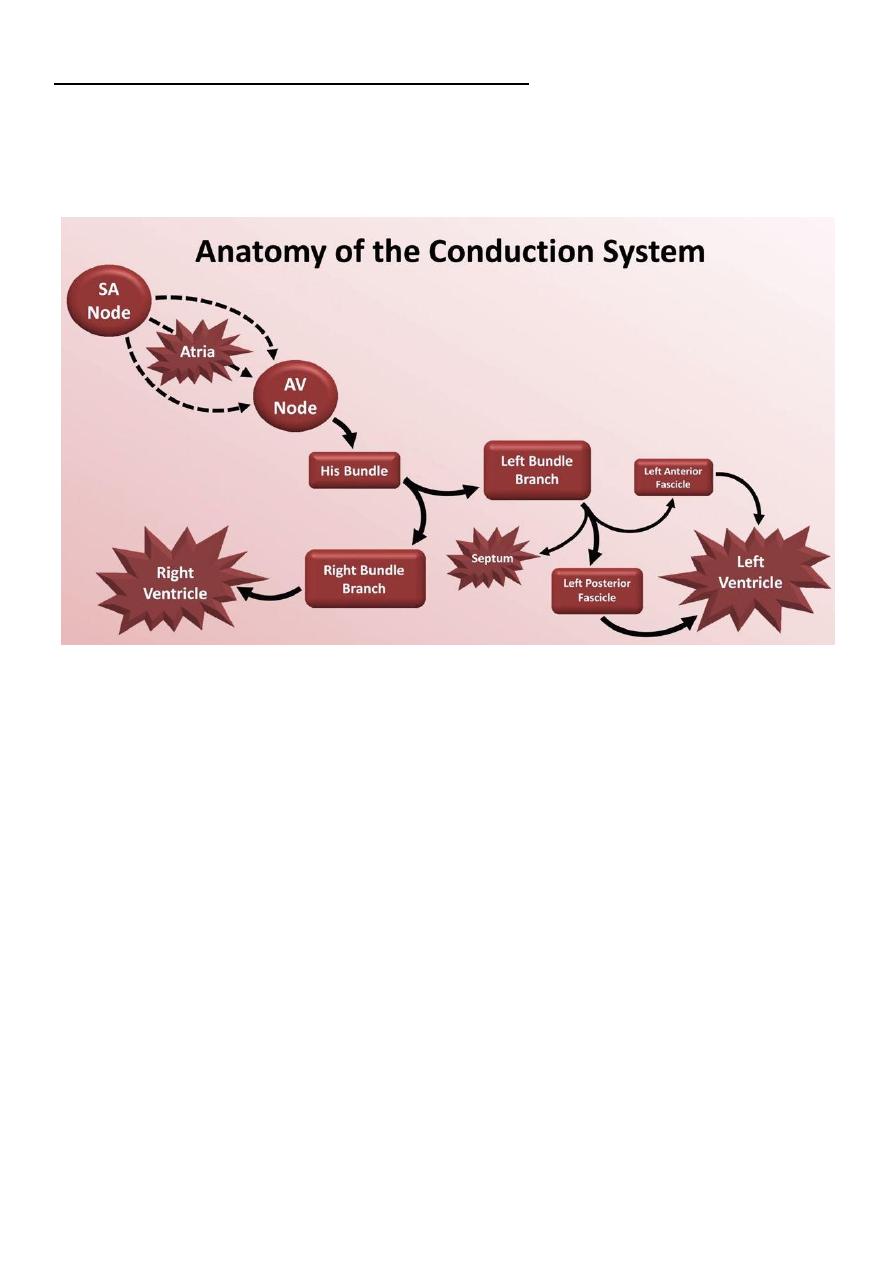
Then the current moves through the purkinje system (bundle of his, right & left
bundles, purkinje fibers) which is very fast conductor, so slow conductor (AV node)
with fast conductor (purkinje) will create a sufficient ventricular contraction with
sufficient cardiac output.
Purkinje system will depolarize the inter-ventricular septum firstly then depolarize the
major part of ventricles and lastly depolarize the base of the ventricles.
The inter-ventricular septum divided into upper fibrous portion which make fibrous
cover around the purkinje bundles which isolate them, and lower muscular portions.
The septum is stimulated by the left bundle branch (not the right) because there is
connections between left bundle branch and lower part of the septum, so the first part
of the septum that stimulated is lower left part, so the vector will be fast upward and
rightward in the septum and this vector is small because septum is small tissue.
Next the depolarization will generated in the major part of ventricles, firstly in the
inner myocardium because it is near the purkinje fibers, so the depolarization moves
from inward to outward, and the current waves in the left ventricle are stronger
because left ventricle is three time thicker than right ventricle, so vectors of right
ventricle are small and directed outward and of left ventricle are large and directed
outward, and all these vectors are generated simultaneously so can be added together
and produce left ventricular vector (large, downward, leftward) and right ventricular
vector (small, downward, rightward) also these two can be added together to one
vector that represent the major part of the ventricle.
The last part of ventricular depolarization is the base, here there are right and left
vectors both directed upward and rightward.
8
At the same time of ventricular depolarization, there is atrial repolarization which is
masked by the ventricular depolarization, so not appear in the ECG recoding.
Then there is ventricular repolarization which start from outer part of the ventricle to
the inner part and lead to negative vector that directed to upward and rightward.
Note: the inner myocardium depolarize first because purkinje fibers near it, but the
outer myocardium start repolarization first because it has better blood flow during
contraction than blood flow in the inner myocardium.
Depolarization is fast but repolarization is slow because it depend on K channels which
are not very fast, so the septal repolarization start then the major ventricular
repolarization start but the septal repolarization not completed and the basal
repolarization start but the major ventricular repolarization not completed
(overlapped) so all produce only one wave, and because the depolarization is very fast
so every event start and end then the other is start so every event produce its wave so
there is three waves that is QRS complex.
Summery:
o First electrical event SA depolarization then atrial depolarization vector is
small slow downward and leftward.
o Second electrical event AV node stimulation silent.
o Third electrical event inter-ventricular depolarization vector is small fast
upward and rightward.
o Forth electrical event depolarization of major part of the ventricles vector is
fast large downward and leftward.
o Fifth electrical event basal depolarization vectors are right and left small fast
directed upward and rightward.
o Sixth electrical event atrial repolarization hidden by ventricular
depolarization.
o Seventh electrical event ventricular repolarization negative vector is upward
and rightward.
Q: Why AV node is slow conductor and Purkinje system is fast conductor?
AV node
Purkinje system
Huge number of small cells
Few number of large cells
Cells arranged in direction that is right
angle to the direction of the current flow
Cells arranged in direction that is parallel to
the direction of the current flow
There are few number of gap junctions
between these cells
There are large number of gap junctions
between these cells
The depolarization of AV node depend on
calcium (slow channels)
The depolarization of purkinje system
depend on sodium (fast channels)
AV nodal cells have small diameter which
means more resistant to the current flow
Purkinje cells have large diameter which
means less resistant to the current flow
RMP here is -60 mV so there is less
attraction to the cations
RMP here is -90 mV so there is more
attraction to the cations
9
#Drawing the ECG waves:
If we connect the galvanometer to see the waves, first connect the positive electrode
to the left foot and the negative electrode to the right arm.
Note1: the body will conduct all the electrical events that occur in the heart to the
surface of the body, so we can apply the electrode to the surface of the body to pick up
the electrical events that occur in the heart.
Note2: applying the electrode to the left foot is the same of applying the electrode to
the junction between left lower limb and the trunk, and applying the electrode to the
right arm is the same of applying the electrode to the junction between right upper
limb and the trunk.
Then connect the galvanometer to paper roll and put ink on the top of the needle to
draw the electrical events of the heart on the paper.
The positive side of the galvanometer is located upward and the negative side is
located downward.
When there is no electrical events in the heart the needle will not deflect and it will
draw straight line on the paper.
Note3: isoelectric line = is a straight line when needle is not
fluctuating.
Then SA node fire, and produce small atrial vector which
moves toward the right electrode and lead to small positive
(upward) deflection of the needle and draw small wave that
represent the atrial depolarization called ((P wave)).
Then both atria are completely depolarized so draw straight line.
Then there is AV nodal silence (AV nodal delay) so draw straight line represent the
conduction through the AV node called ((P-R segment)).
Then there is septal depolarization that produce small and fast vector go away from
the positive electrode so the deflection on the needle is negative (downward) and
draw small and fast negative wave that represent the ventricular septal depolarization
called ((Q wave)).
Then depolarization of major part of ventricle produce large fast vector toward the
positive electrode so there is fast needle deflection to the positive side (upward) and
draw large fast upward wave that represent major ventricular depolarization called ((R
wave)).
Then there is basal ventricular depolarization which produce small fast vector directed
away from the positive electrode and lead to downward deflection of the needle and
draw small fast negative (downward) wave represent the basal depolarization called ((S
wave)).
Then the whole ventricles are completely depolarized so there is no current moves so
the needle will stay in the zero level and draw a straight line called ((ST segment)).
11
Then there is ventricular repolarization that produce negative vector toward the
negative electrode so make gradual positive (upward) deflection and draw positive
upward wave that represent the ventricular repolarization called ((T wave)).
QRS complex represent the depolarization phase in the myocardial cells Na
influx.
ST segment represent the plateau phase in the myocardial cells K efflux and Ca
efflux.
T wave represent the repolarization phase in the myocardial cells K efflux.
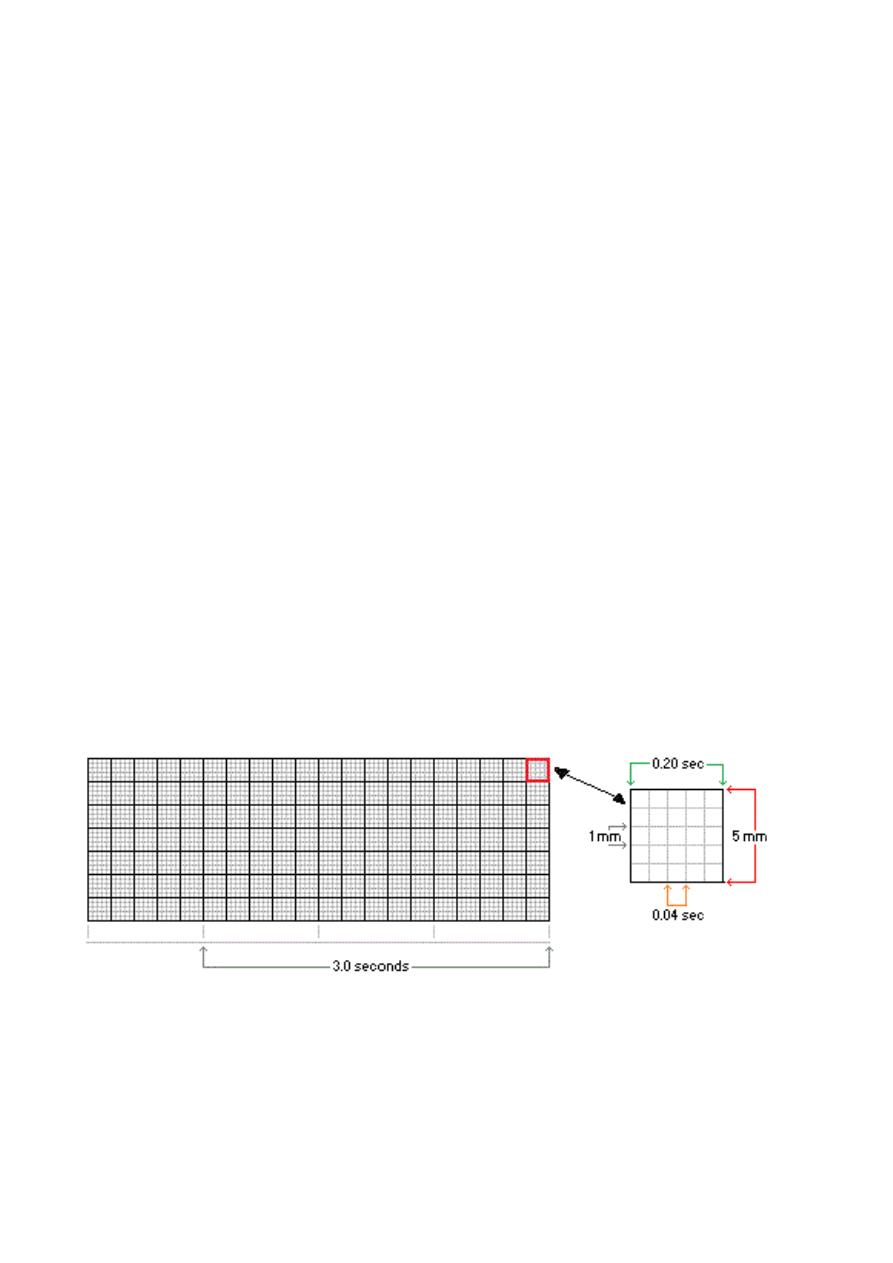
#ECG paper:
Divided by horizontal and vertical heavy lines into large squares.
During 1 minute 300 big squares will pass 300 big = 1 min 300 big = 60 sec
1 big = 60/300 sec 1 big = 0.20 sec.
Also there are light lines divide each big square, 4 light lines horizontally and 4 light
lines vertically so there is 5 small squares in each big one (1 big = 5 small) in each
direction so the total number is 25 small in one big square.
During 1 minute 1500 small squares pass.
1 big = 0.20 sec 1 big = 5 small 5 small = 0.20 sec 1 small = 0.04 sec.
The horizontal axis measures time. The distance across one small square represents
0.04 seconds. The distance across one large square is five times greater, or 0.2 seconds.
The vertical axis measures voltage. The distance along one small square represents 0.1
mV, and along one large square, 0.5 mV.
#ECG patterns:
Wave:
Waves are ECG patterns that represent fluctuation of the needle.
Waves are caused by changes in voltage as measured between two points on the body.
P wave: represent the atrial depolarization, take 2.5 small squares = 0.1 sec.
Q wave: represent the septal depolarization.
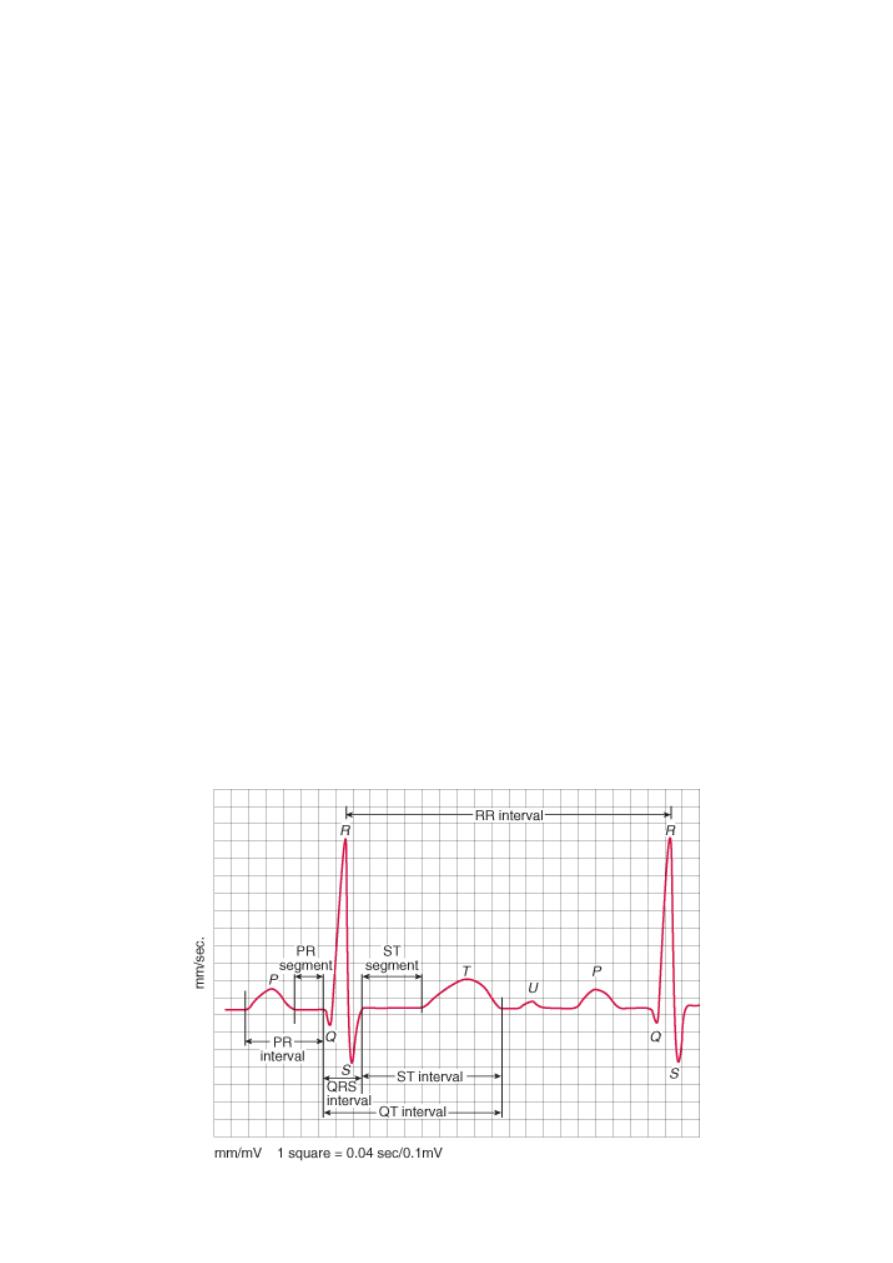
11
R wave: represent the major ventricular depolarization.
S wave: represent the basal depolarization.
T wave: represent the ventricular repolarization.
U wave: represent electrical activity in the papillary muscles of the valve, sometimes
appear.
Characteristics used to describe waves include: duration (sec), amplitude (mV),
morphology.
Segment:
Segments are iso-electrical straight lines that located between the waves.
PR segment: represent the AV nodal delay, take 2.5 small squares = 0.1 sec.
ST segment: represent the time at which both ventricles are completely depolarized.
TP segment: in the absence of u wave the TP segment is the least place in the ECG that
can be affected by pathology so it serves as a reference for the deflection of other
segments and waves.
Characteristics used to describe waves include: morphology (whether there is negative
or positive deflection according to the TP segment).
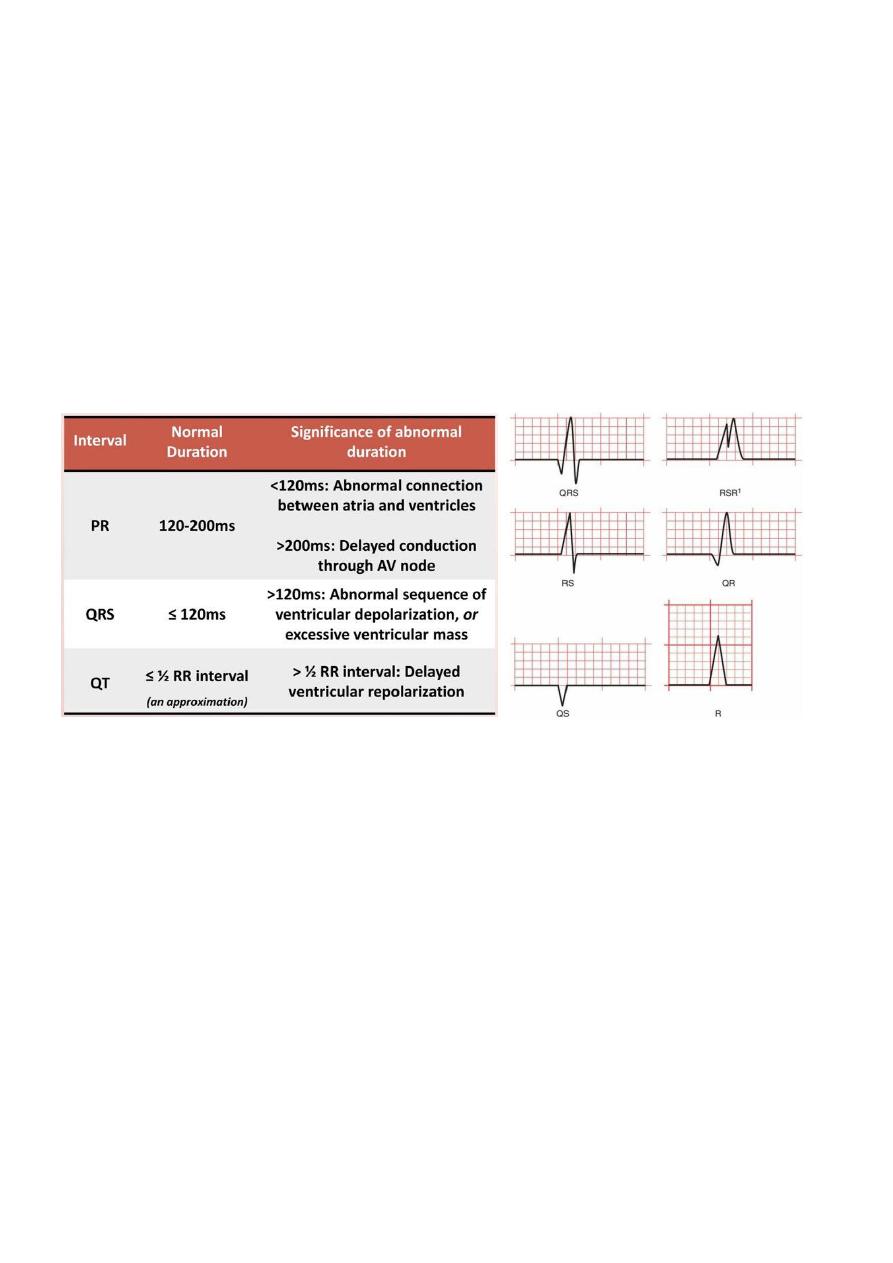
Interval:
Intervals are combination of waves or segments.
PR interval (P wave + PR segment): it takes 2.5 small square + 2.5 small = 1 large = so it
takes 0.2 sec.
QRS interval (Q wave + R wave + S wave): it takes 2.5 small squares = 0.1 sec.
QT interval (Q wave + R wave + S wave + ST segment + T wave): it takes 10 to 11 small
squares = 0.4 sec.
RR interval (all waves and segments in one cardiac cycle).
Characteristics used to describe waves include: duration.
12
Notes:
The beginning of QT interval show the onset of ventricular systole (First heart sound
S1), and the end of it show the onset of the ventricular diastole (Second heart sound
S2).
The junction between the QRS complex and ST segment is known as J point.
Due to normal personal variation will say that:
o P wave takes from 2 to 3 small squares = 0.08 – 0.12 sec.
o PR segment takes from 2 to 3 small squares = 0.08 – 0.12 sec.
o QRS complex takes from 2 to 3 small squares = 0.08 – 0.12 sec.
o PR interval takes from 4 to 6 small squares = 0.16 – 0.24 sec.
o QT interval takes from 8 to 12 small squares = 0.32 – 0.48 sec.
There are many types of QRS complex like QRS, qRs, QR, Qr, RS, QS, RsR', R.
#ECG lead:
Lead is a view of the voltage between two points (known as pols) as a function of time.
The positive pole for each lead is marked by a single recording electrode on the body.
The negative pole for each lead is marked by either a single recording electrode, or a
virtual electrode known as a "central terminal" which averages input from multiple
other electrodes.
A lead is not the same as an electrode.
The electrode is the physio-connective sticker attached either to chest wall or a limb to
which electrical potential is measured.
Different combination of leads and electrodes enable us for viewing the heart from
different views.
Patient electrodes on his body leads connect to a junction connect to the
ECG machine screen and printer.
13
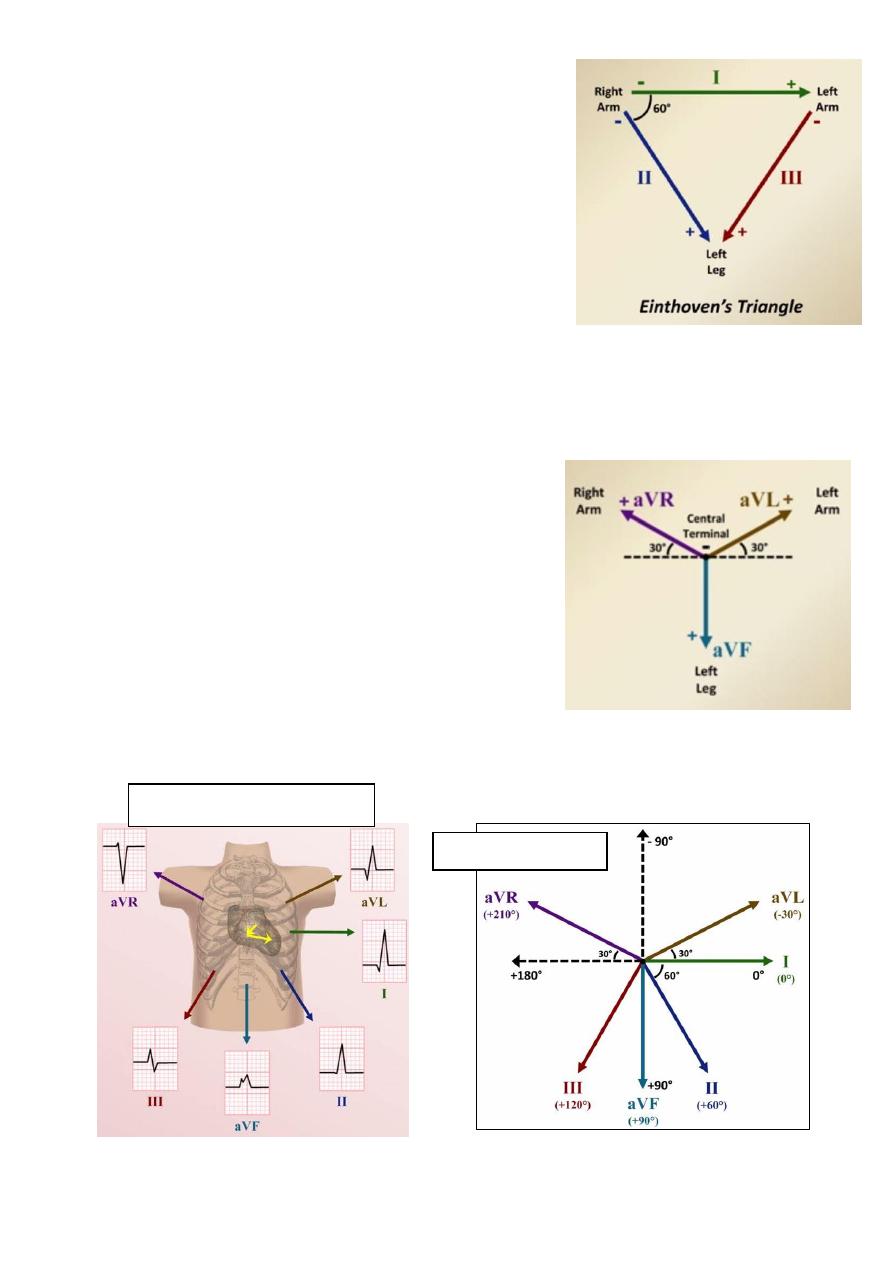
Standard limb leads:
Attach recoding electrodes to the right arm, left arm,
and left leg to create the three stand limb leads.
Lead I: negative pole (right arm) positive pole (left arm)
Lead II: negative pole (right arm) positive pole (left leg)
Lead III: negative pole (left arm) positive pole (left leg)
The right leg is used to ground the system.
Einthoven's law I + III = II this means at any time
voltage measured by lead I plus the voltage measured
by lead III equals the voltage measured by lead II.
These lead are limited because they can record the electrical activity of the heart from
three views only.
Augmented limb leads:
To increase the number of directions from which the heart can be viewed, the ECG
machine also uses a "central terminal".
The central terminal is made by connecting the right
arm, left arm, and left leg electrodes together.
This result in a virtual negative terminal that is
composed of the average electrical potentials from
the 3 limbs.
The "a" stands for augmented.
The "V" is listed in any lead that uses the central
terminal as a negative pole including precordial leads.
aVR + aVL + aVF = 0
The Hexaxial system
Ventricular depolarization
14
Modern ECG machine only directly measure lead I and II and calculate the four others
by these equations:
o III = II – I
o aVR = -1/2 (I + II)
o aVL = I – 1/2 (II)
o aVF = II – 1/2 (I)
All these 6 limb leads record the electrical activity of the heart in the frontal plane
(imaginary plane divide the body into front and back halves) so only 2 dimensions.
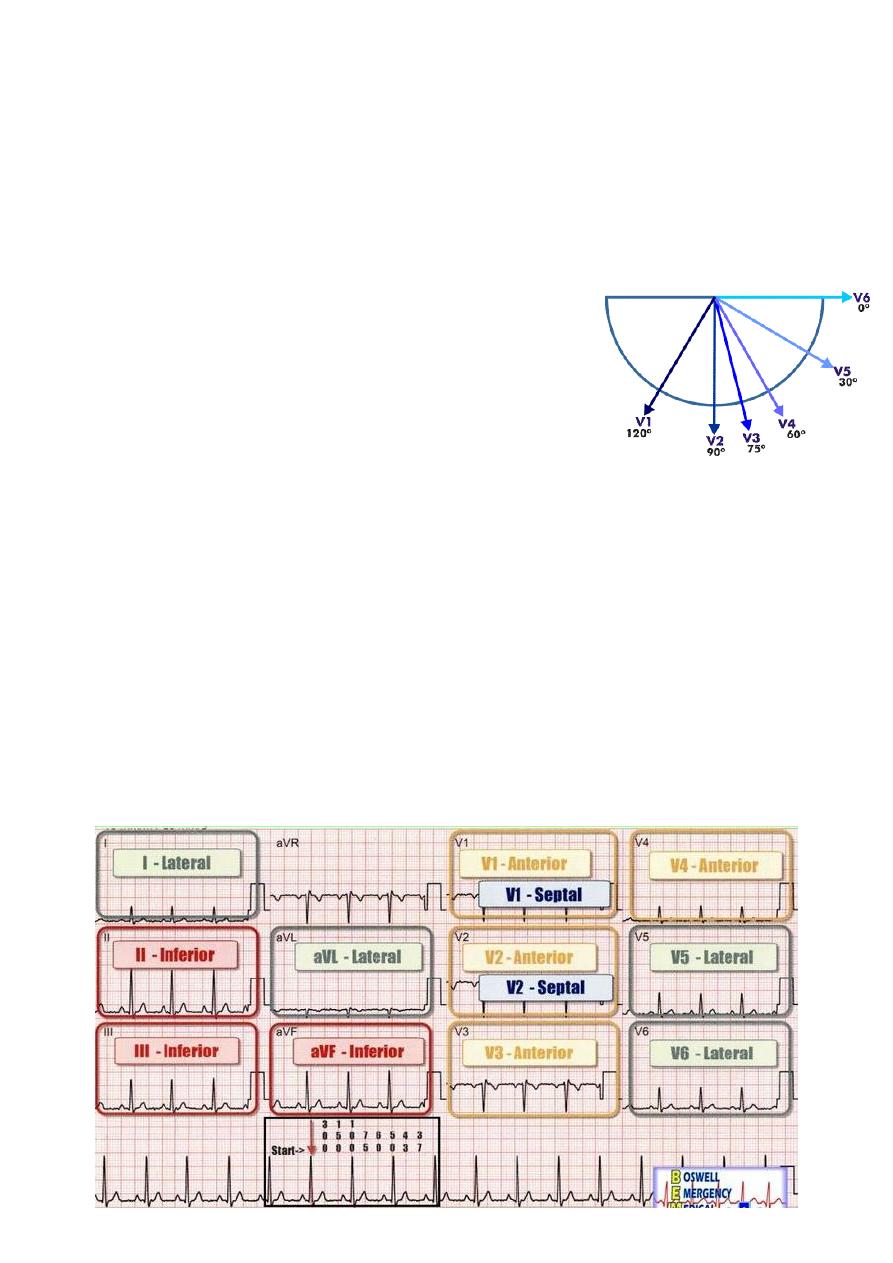
Precordial leads:
There are 6 leads which examine the heart's electrical
activity in the transverse (axial) plane.
The positive pole for each is at a location on the anterior
or left lateral chest wall.
The negative pole for each is the central terminal.
The leads are named V1 – V6 as moving from right to left.
V1 is placed in the 4
th
ICS to the right of the sternum.
V2 is placed in the 4
th
ICS to the left of the sternum.
V3 is placed halfway between V2 and V4.
V4 is placed in the 5
th
ICS in the mid-clavicular line.
V5 is placed halfway between V4 and V6.
V6 is placed in the 5
th
ICS in the mid-axillary line.
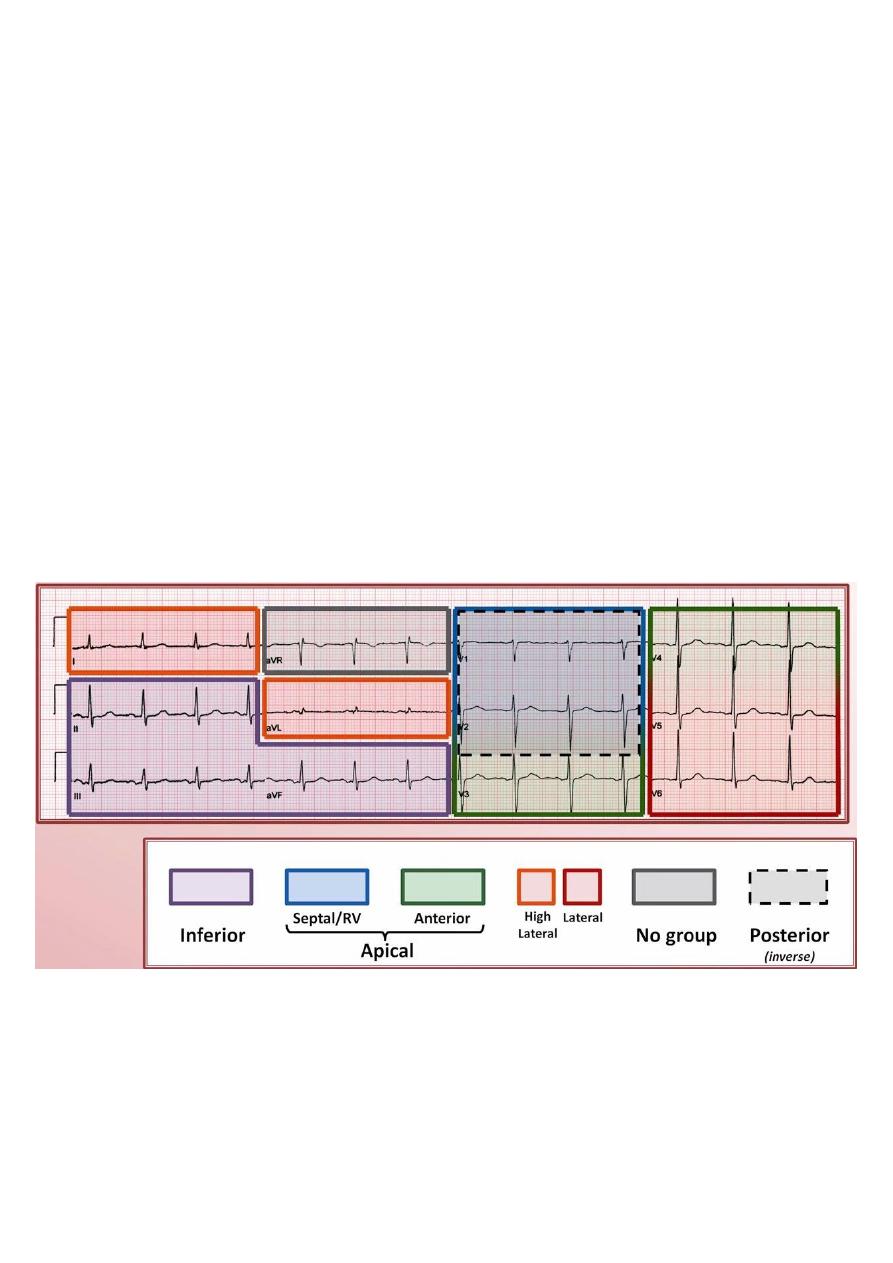
Anatomic correlations:
Inferior leads II, III, aVF.
Septal leads V1, V2. ((also used to examine right ventricle))
Anterior leads V3, V4.
Lateral leads I, aVL, V5, V6.
No grouping aVR.
15
#Determining the heart rate by ECG:
1- The 300 rule:
One big = 5mm = 200 ms = 0.2 sec.
One small = 1mm = 40 ms = 0.04 sec.
Each 1 min = 300 big 60 sec = 300 big.
Heart rate (bpm) = 300 / number of big squares between beats (between R and R).
Heart rate (bpm) = 1500 / number of small squares between beats
The 300 rule cannot be applied when the ventricular rhythm is irregular.
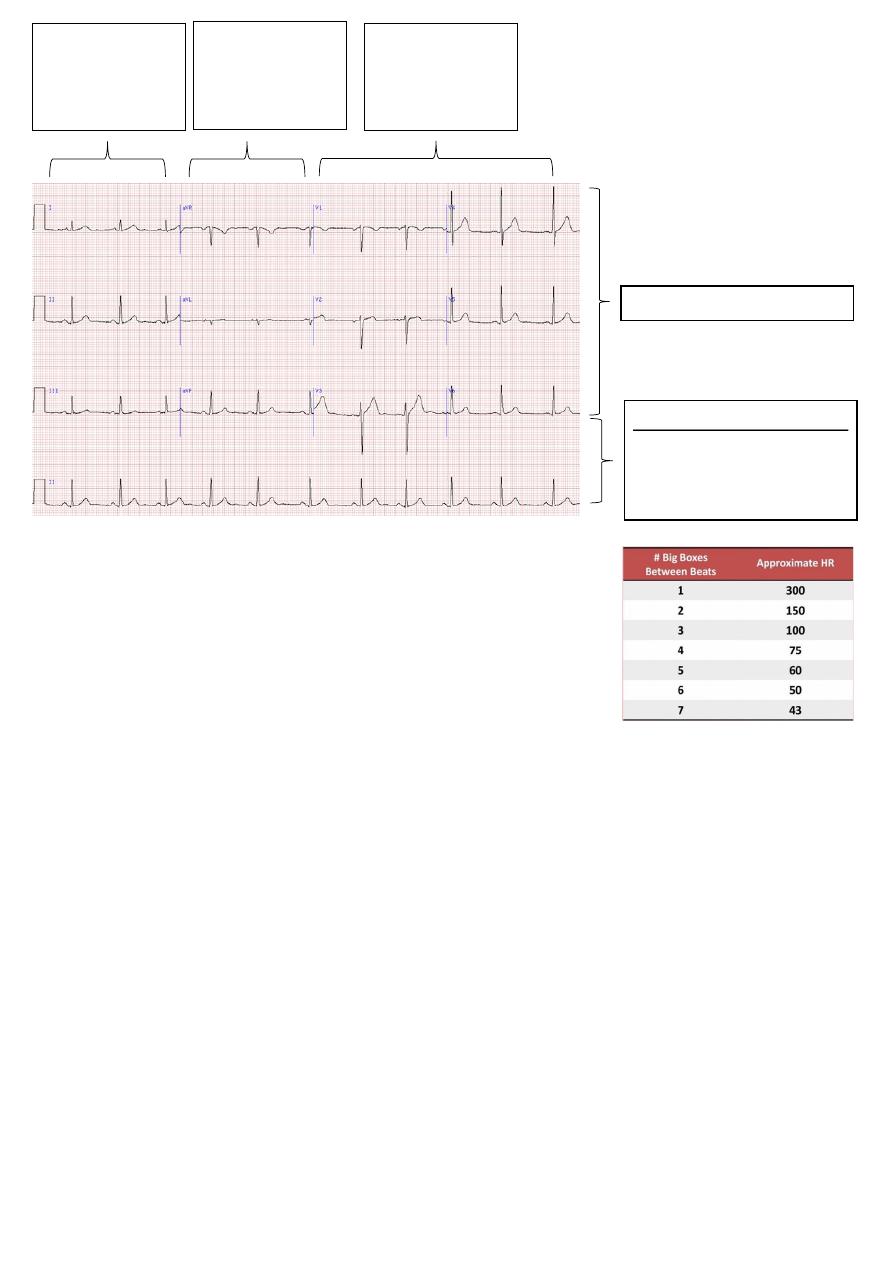
2- The 10 second rule:
The duration of ECG record is 10 sec, and each lead is 2.5 sec.
So Heart rate (bpm) = number of beats across ECG x 6
#Determining the axis by ECG:
The QRS axis represent the average direction of electrical activity in the heart during
ventricular depolarization.
The QRS axis is the sum of all vectors that represent the ventricular depolarization.
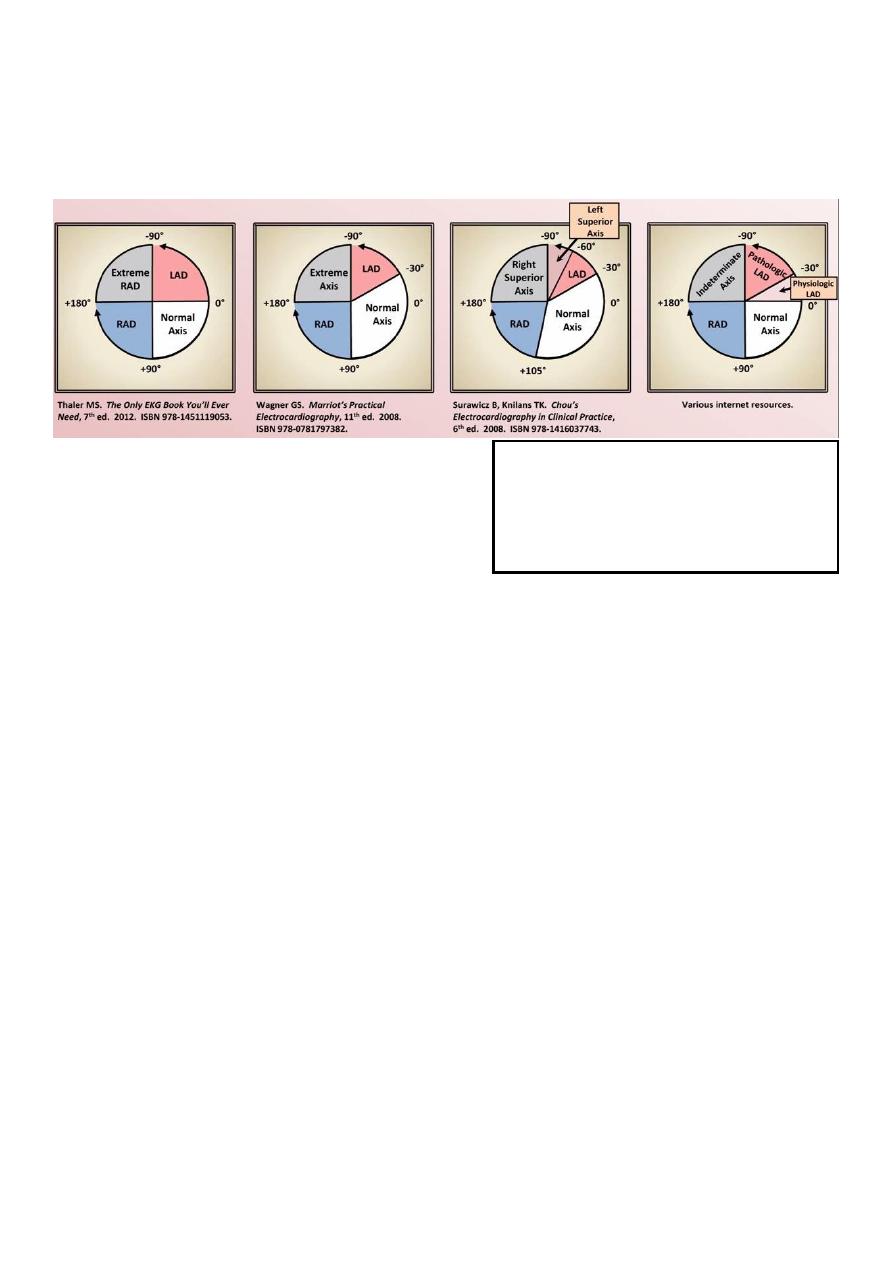
Reporting of the axis uses the classic hexaial reference system.
Deviation of the QRS axis can provide insight into chamber enlargement, abnormalities
of the conduction system, myocardial infarction, and the origin of some arrhythmias.
A QRS axis less (negative) than normal is considered a "left axis deviation" (LAD)
Second three leads
are augmented or
unipolar limb leads
aVR, aVL, aVF.
Each leads recorded for 2.5 sec
Each leads recorded for 10 sec
Rhythm strips: usually V1, II,
and V5. Used to identify the
rhythm.
First three leads
are standard or
bipolar limb leads
I, II, III.
Six leads are
precordial leads
V1-V6.
16
A QRS axis greater (positive) than normal is considered a "right axis deviation" (RAD)
Unfortunately, there is no consistently applied normal range for QRS axis.
A QRS axis that lies between +180 and +270 is called "extreme axis", "superior axis", or
"indeterminate axis", but the term (indeterminate axis) hear is wrong.
Normal QRS axis from different sources:
Normal axis from +90 to -30.
LAD from -30 to -90.
Extreme axis from -90 to +180.
RAD from +180 to +90.
Non-pathologic factors affecting QRS axis:
o Age: moves leftward as an individual ages (there is difference between gender).
o Body type: Tall and thin (vertical axis), Short and obese (leftward axis).
Classifying QRS complex:
o Predominantly positive: the positive portion of the QRS more than negative.
o Predominantly negative: the negative portion of the QRS more than positive.
o Equiphasic: the negative portion of the QRS is equal to the positive portion.
Qualitative method of determining the axis ((Quadrant approach)):
o Examine the QRS complex in lead I and aVF.
o I (positive) aVF (positive) Normal axis.
o I (positive) aVF (negative) LAD or normal look to QRS in lead II:
Predominantly positive QRS in lead II Normal (-30 to 0).
Predominantly negative QRS in lead II LAD (-90 to -30).
o I (negative) aVF (positive) RAD.
o I (negative) aVF (negative) Extreme.
Quantitative method of determining the axis ((Equiphasic approach)):
o First determine which lead contains the most equiphasic QRS complex so called
(equiphasic lead).
o Then determine which lead lies 90 degree away from the most equiphasic lead (use
the Hexaxial system).
o Finally, if the QRS complex in this 2nd lead is predominantly positive, the direction
of this lead is approximately the QRS axis. If it is predominantly negative, the QRS
axis is 180 degree away from the direction of this lead (use the Hexaxial system).
Indeterminate axis:
Occurs when all of
the limb leads have a QRS complex that is
equal parts positive and negative. Most
commonly seen in COPD as a manifestation
of the pulmonary disease pattern.

17
Part2:
Abnormalities in ECG
First abnormality: Chamber enlargement
#Enlargement VS hypertrophy:
Enlargement is increase in the chamber size.
Hypertrophy is increase in the chamber wall thickness.
The ECG is poor in distinguishing enlargement from hypertrophy.
Use Echo or MRI to distinguishing between enlargement and hypertrophy.
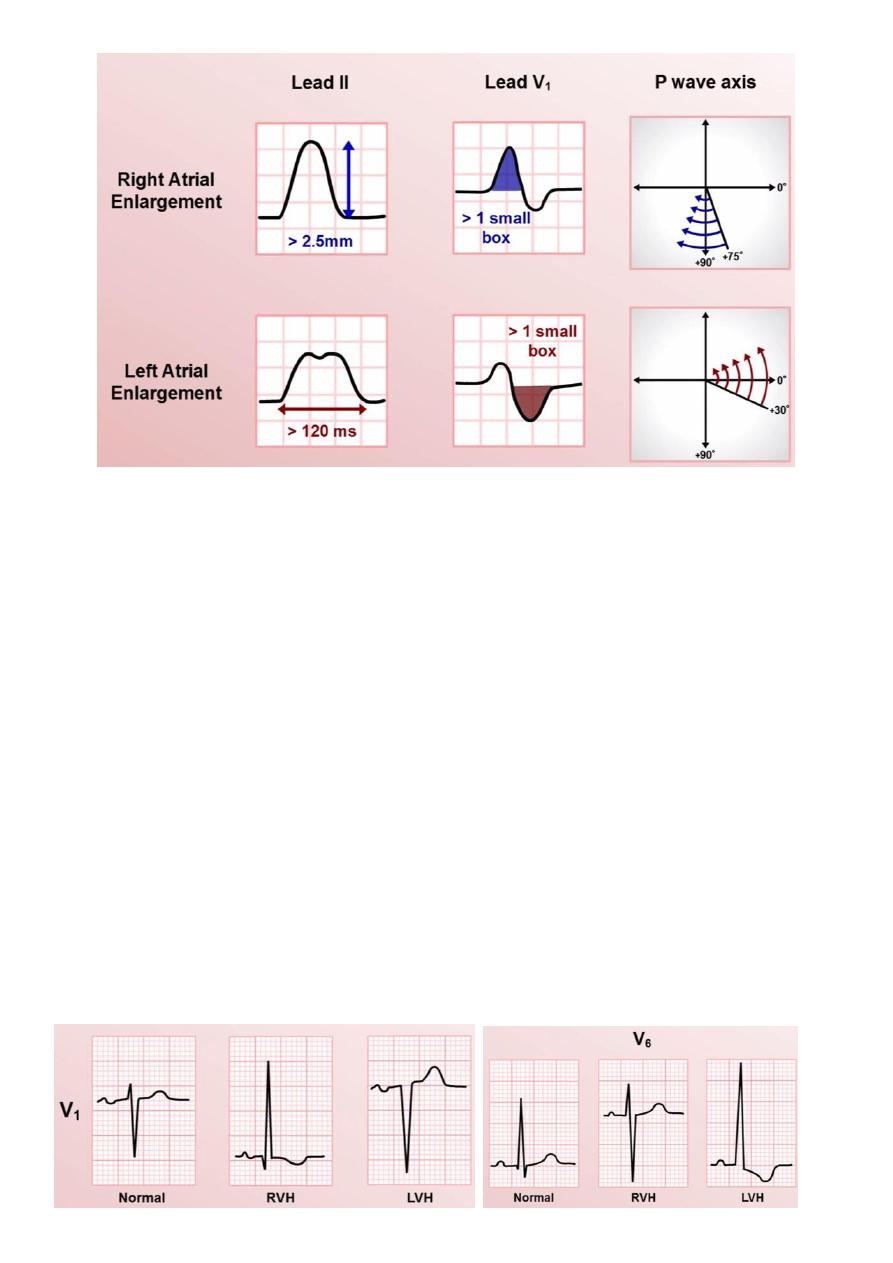
#P wave axis:
Is a measure of the vector sum of waves of the atrial depolarization.
Normally = +30 to +75 degree.
Roughly the axis is in the same direction of lead II, so P wave in lead II should always be
positive in sinus rhythm and generally the most prominent P wave in the ECG.
Lead II is a great place to look for changes suggestive of atrial enlargement.
Axis shifted rightward +75 degree suggest right atrial enlargement (RAE).
Axis shifted leftward +30 degree suggest left atrial enlargement (LAE).
Changes in P wave axis have poor sensitivity and specificity, particularly for LAE.
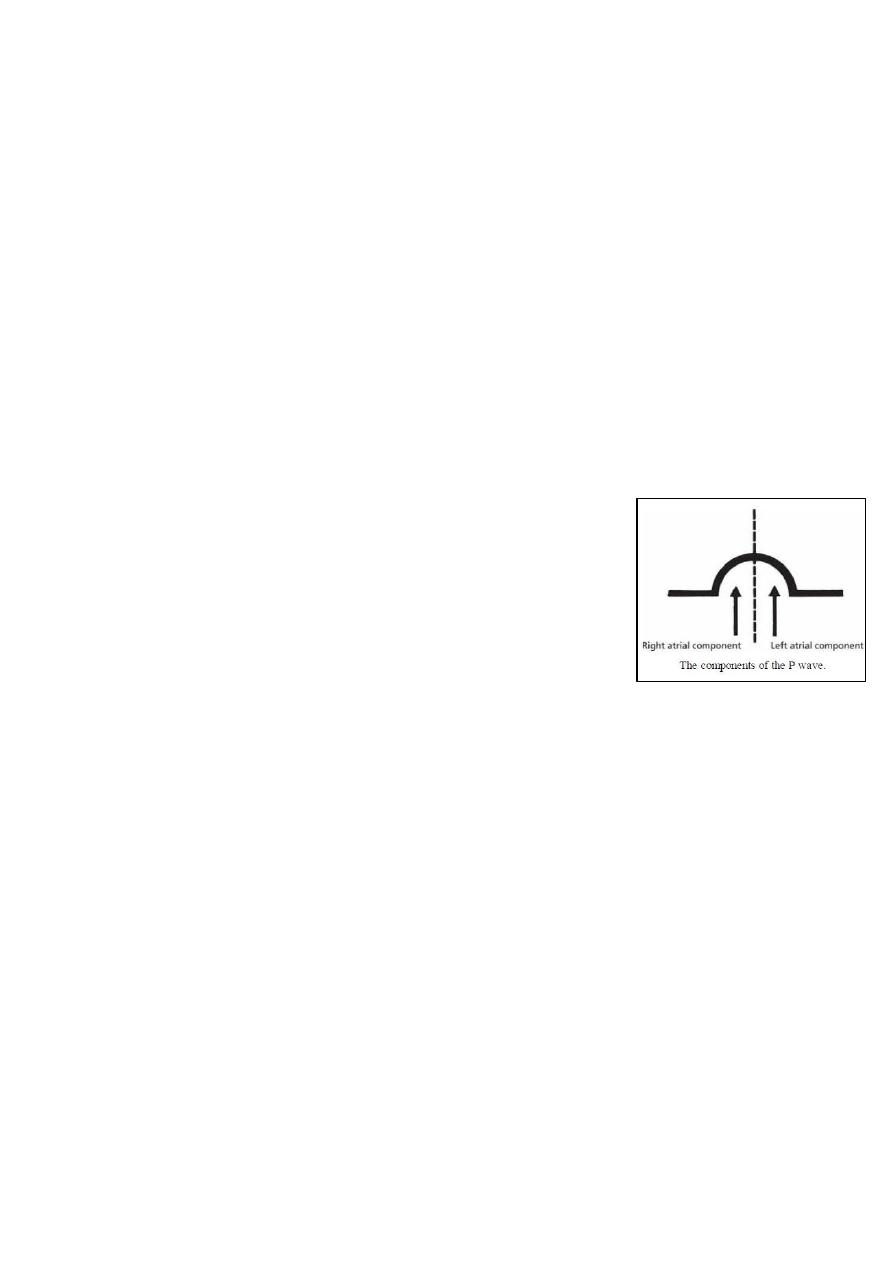
P wave in lead V1 appears as positive deflection (right atrial depolarization) then
negative deflection (left atrial depolarization) so it is useful in diagnosis of atrial
enlargement.
#Atrial enlargement:
RAE affect the first half of the P wave, LAE affect the second half of the P wave.
RAE in lead II show tall P wave >2.5 mm = 0.25 mV.
LAE in lead II show wide (prolonged) P wave >120 ms with two peaks.
RAE in lead V1 show prominent (more than 1.5 mm or more than one small square)
positive deflection and unchanged negative deflection.
LAE in lead V1 show unchanged positive deflection and prominent (more than 1.5 mm
or more than one small square) negative deflection.
18
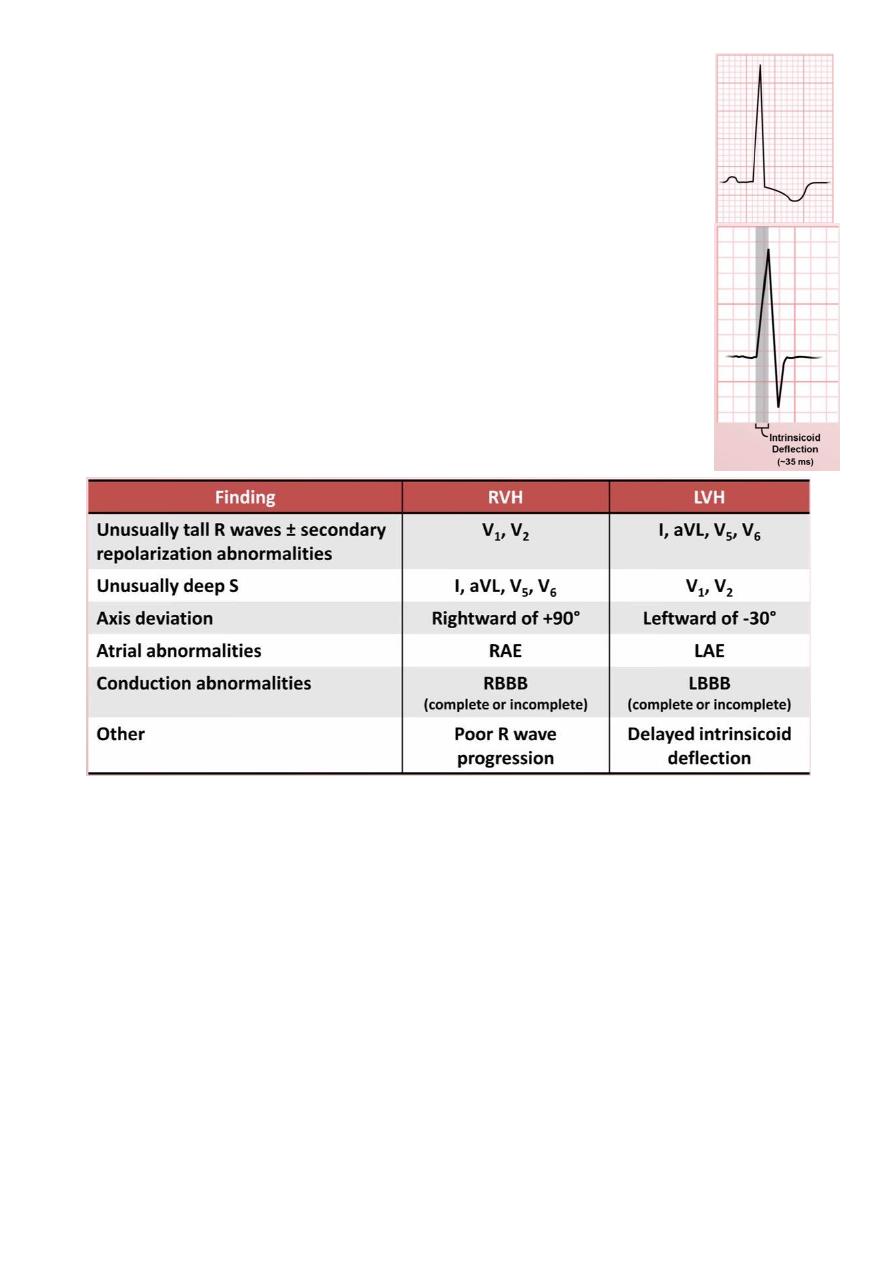
#QRS axis:
Normally = -30 to +90 degree.
Axis shifted rightward of +90 suggest right ventricular hypertrophy (RVH).
Axis shifted leftward of -30 suggest left ventricular hypertrophy (LVH).
Not depend of axis shifting only because it could be unspecific and insensitive.
Normally QRS complex in lead V1 show initial (septal) upward deflection then large
downward deflection (major part depolarization).
Normally QRS complex in lead V6 show initial downward deflection called (physiologic
septal Q wave) then large upward deflection (major part depolarization).
#Ventricular hypertrophy:
RVH show upward deflection of QRS in the lead V1 and downward deflection in V6
(reverse of normal).
LVH show deeper & broader downward deflection of QRS in lead V1 and deeper &
broader upward deflection of QRS in lead V6 (amplification of the normal).
19
#Secondary repolarization abnormalities:
Consists of a downsloping ST segment and T wave inversion.
Formerly known as a "strain pattern".
Most commonly seen in leads over the hypertrophied ventricle.
Other causes include: bundle branch block, pre-excitation.
#Intrinsicoid deflection:
The duration of time from the beginning of the QRS complex to the
peak of the R wave.
It is typically only measured in the precordial leads.
Normally: <35 ms in V1 and <45 ms in V6.
Prolongation of this time means that there is ventricular hypertrophy
particularly LVH.
#COPD variant of RVH:
Unique findings are a consequence of hyperinflated lungs and a physical shift in how
the heart lines in the chest.
In addition to typical findings of RHV:
o Low voltage.
o All precordial leads consist of a small r wave followed by deep S wave.
o Extreme axis (+180 to +270 degree) uncommon.
#Factors affecting diagnosis of LAH by ECG:
Factors that increase sensitivity & decrease specificity (increase QRS voltage)
younger age less than 40 years, male gender.
Factors that decrease sensitivity & increase specificity (decrease QRS voltage) old
age more than 40 years, female gender, obesity, COPD, pericardial effusion, pleural
effusion.
21
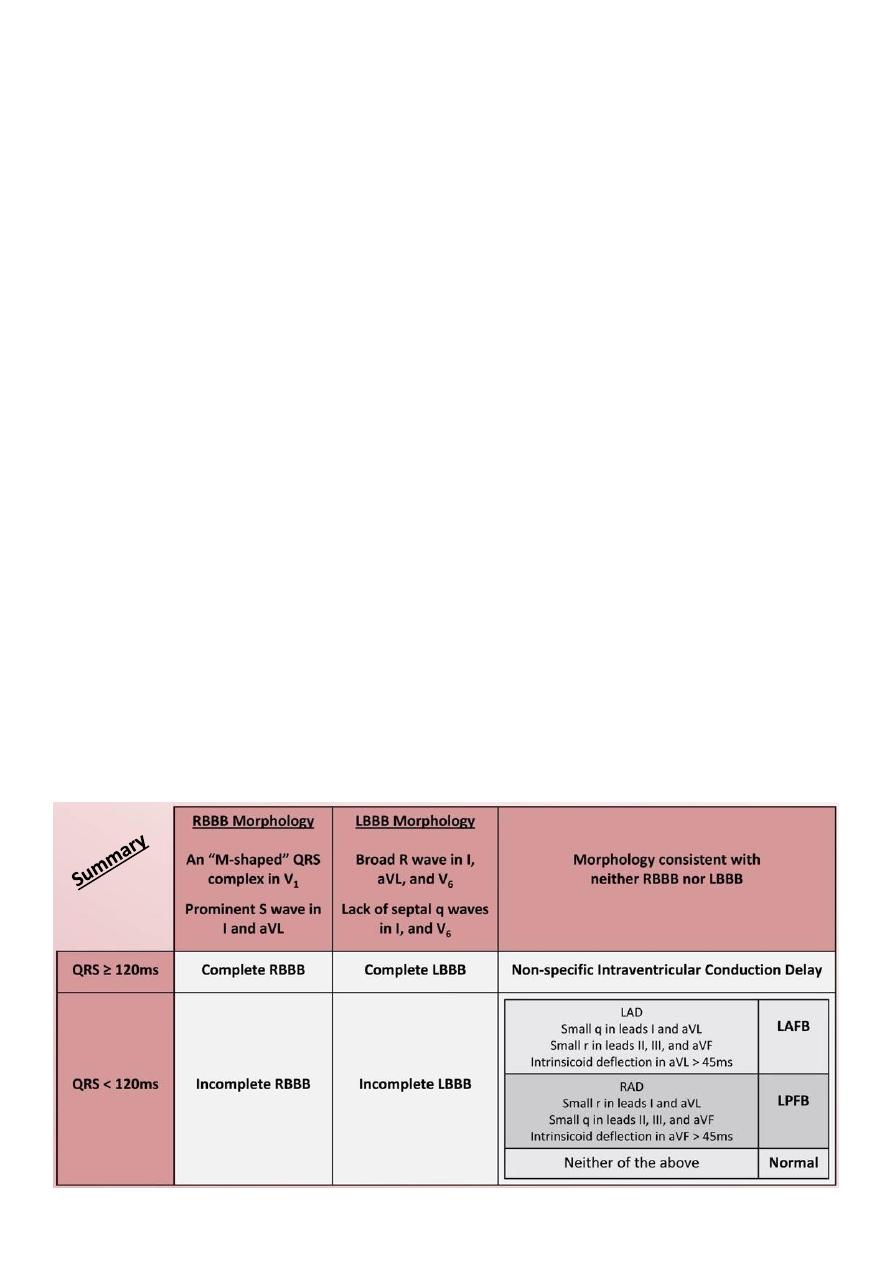
Second abnormality: Bundle branch blocks
#Basics:
Bundle branch block = Intra-ventricular conduction delay
RBBB = wide QRS complex.
LBBB = wide QRS complex.
Left anterior fascicular block = QRS duration is normal, but axis is shifted leftward.
Left posterior fascicular block = QRS duration is normal, but axis is shifted rightward.
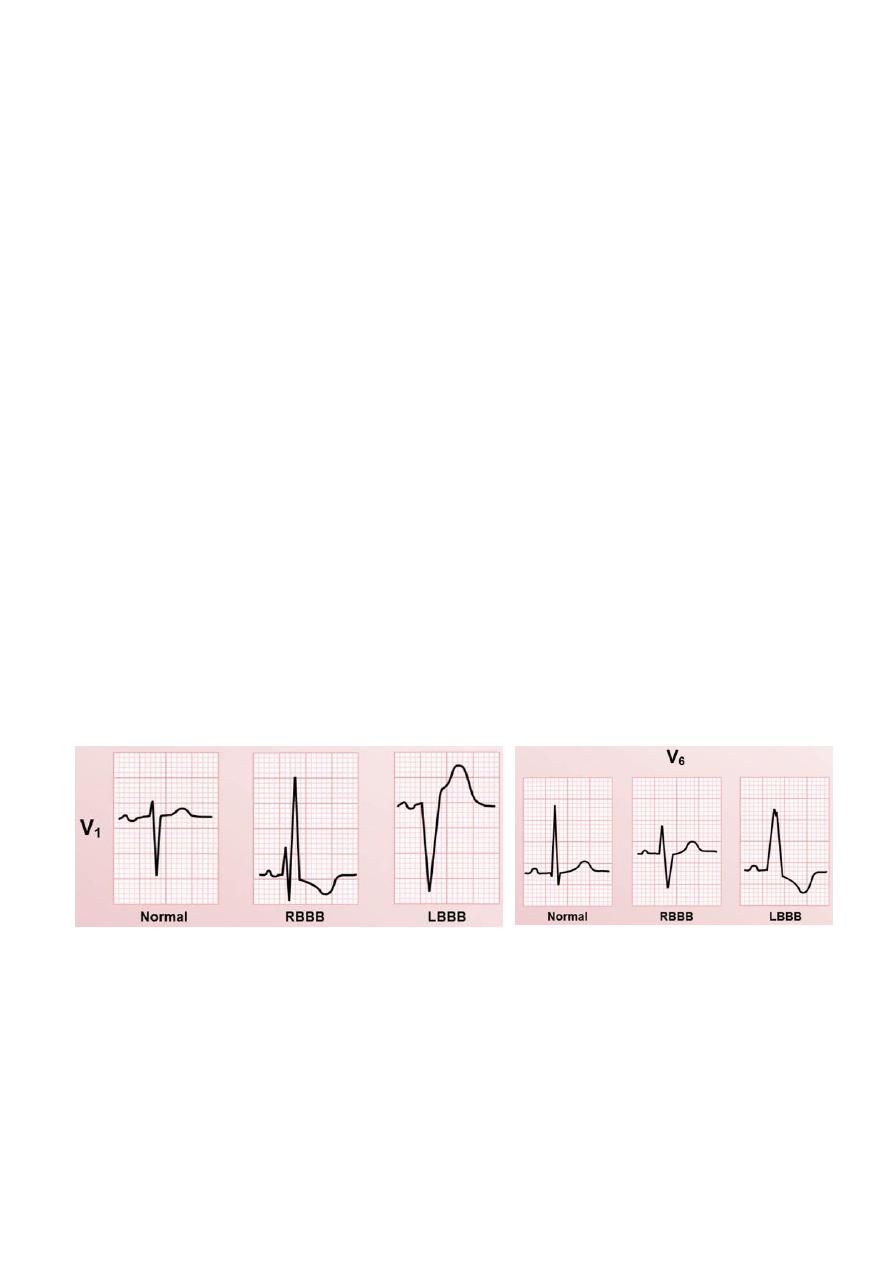
#Right bundle branch block (RBBB):
Diagnostic Criteria:
o Broad QRS > 120 ms
o RSR’ pattern in V1-3 (‘M-shaped’ QRS complex)
o Wide, prominent, slurred S wave in the lateral leads (I, aVL, V5-6)
o Secondary repolarization abnormalities (ST depression and T wave inversion) in the
right precordial leads (V1-3)
Causes of RBBB:
o Right ventricular hypertrophy / cor pulmonale
o Pulmonary embolus
o Ischemic heart disease (Coronary artery disease)
o Rheumatic heart disease
o Myocarditis or cardiomyopathy
21
o Degenerative disease of the conduction system
o Congenital heart disease (e.g. atrial septal defect)
o Iatrogenic during right sided cardiac catheterization
RBBB severely limits the ability to diagnose RVH.
#Left bundle branch block (LBBB):
Diagnostic Criteria:
o QRS duration of > 120 ms
o Dominant S wave in V1
o Broad monophasic R wave in lateral leads (I, aVL, V5-V6)
o Absence of Q waves in lateral leads (I, V5-V6; small Q waves are still allowed in aVL)
o Widespread secondary repolarization abnormalities should also be present: Lead I,
aVL, V6 usually display a downsloping ST depression leading into an inverted T
wave, and leads V1-3 usually display a deep S wave, with upsloping ST elevation
leading into a upright and prominent T wave.
Causes of LBBB:
o Aortic stenosis
o Coronary artery disease (Anterior MI), Hypertension
o LVH (any cause), Heart failure (any cause)
o Dilated cardiomyopathy
o Primary degenerative disease (fibrosis) of the conducting system (Lenegre disease)
o Hyperkalemia, Digoxin toxicity
LBBB severely limits the ability to diagnose LVH, and an ST elevation MI.
#Incomplete blocks:
Intra-ventricular conduction abnormalities in which conduction is slowed in a bundle,
but not completely blocked.
Generally manifests as a similar morphology to a complete right or left bundle branch
block, but with QRS duration 100-120 ms.
Compared to complete blocks, etiologies are the same, but clinical significance is
reduced.
Many patient with incomplete blocks will develop complete blocks many years later.
22
#Fascicular blocks (Hemiblocks):
Left anterior fascicular block (LAFB):
o Left axis deviation (LAD) usually beyond -45 degree.
o Small q in leads I and aVL.
o Small r in leads II, III, and aVF.
o Intrinsicoid deflection in aVL > 45 ms.
Left posterior fascicular block (LPFB):
o RAD.
o Small r in leads I and aVL.
o Small q in leads II, III, and aVF.
o Intrinsicoid deflection in aVF > 45 ms.
o No additional evidence of RVH.
#Non-specific intra-ventricular conduction delay:
Occurs when the QRS duration is prolonged >= 120 ms, but criteria for neither RBBB
nor LBBB is met.
It is a marker of non-specific cardiac pathology.
#Bifasicular block:
Bifasicular block = RBBB + either LAFB or LPFB.
Causes: coronary artery disease, degenerative disease of conduction system,
hypertension, aortic stenosis, congenital heart disease.
23
Third abnormality: Tachyarrhythmias
#Normal intrinsic rates of pacemaker sites:
Sinus node = 50 – 90 bpm.
Atria pacemaker = 40 – 60 bpm.
AV junction pacemaker = 40 – 60 bpm.
Ventricles (His-Purkinje system) = 15 – 40 bpm.
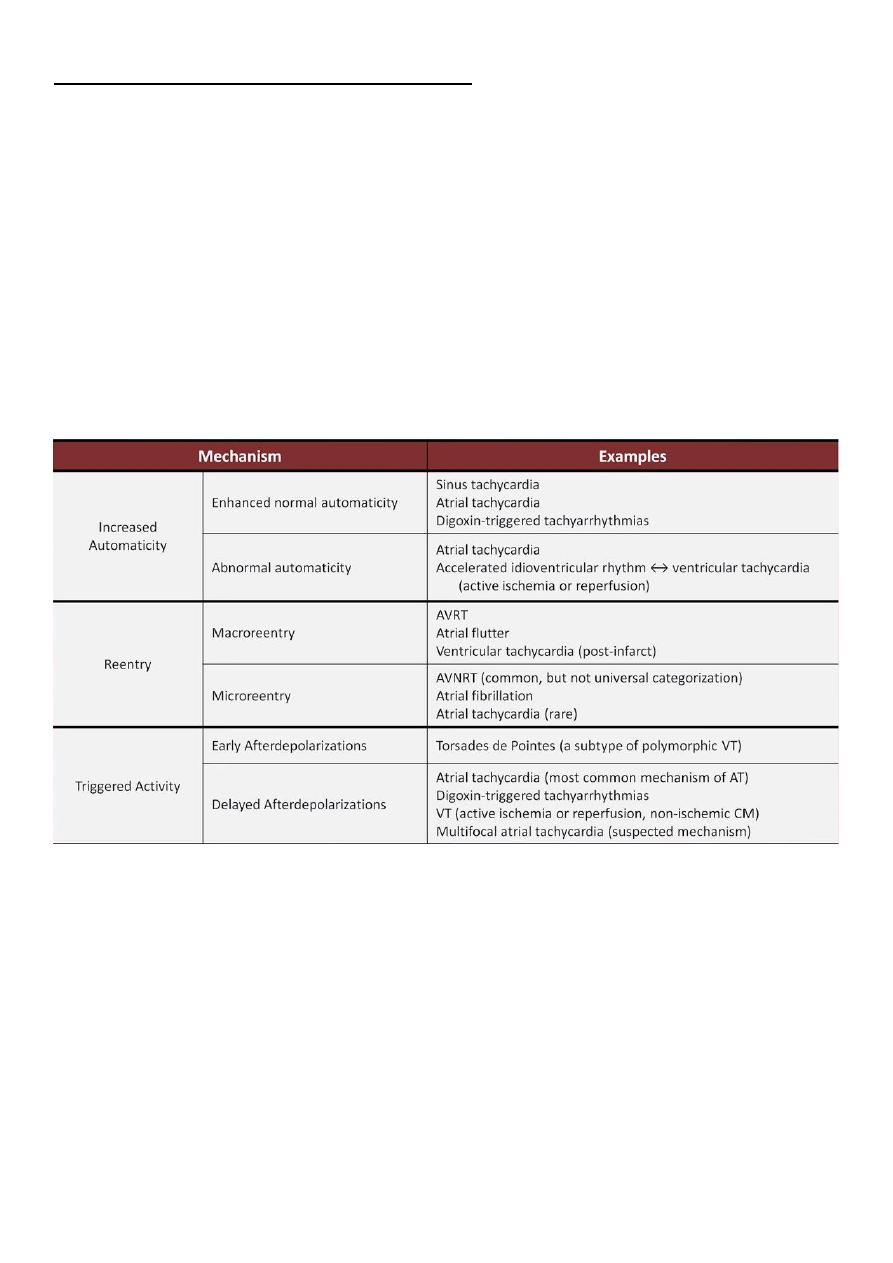
#Mechanisms of Arrhythmia
Reentry (most common), Automaticity, Parasystole, Triggered activity.
#The 6 basic types of Tachyarrhythmias:
1- Sinus tachycardia
2- Atrial fibrillation
3- Atrial flutter
4- Multifocal atrial tachycardia
5- Supraventricular tachycardia (AVNRT, AVRT, atrial tachycardia)
6- Ventricular tachycardia (monomorphic vs. polymorphic)
The First 5 typically has a narrow QRS complex unless there are Underlying BBB,
preexcitation (WPW), Profound hyperkalemia, Use of drugs which prolog the QRS
complex (class Ia and Ic antiarrhythmics).
The last one always has a wide QRS complex.
24
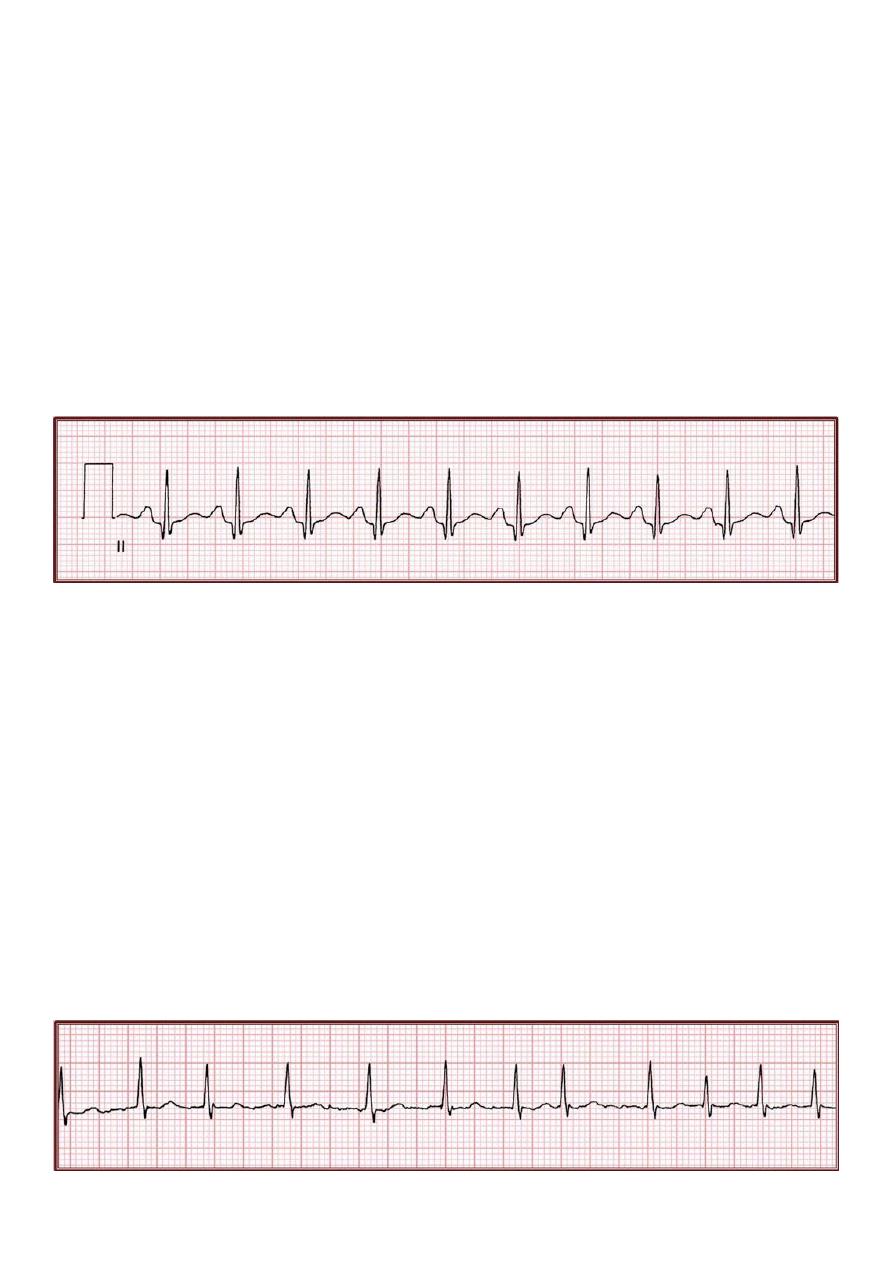
#Sinus Tachycardia:
General mechanism enhanced normal automaticity mediated by stimulation of B1
adrenergic receptors by epinephrine and norepinephrine.
Etiologies dehydration, hypotension, sepsis, fever, severe anemia, hypoxemia,
exercise, drug intoxication, drug withdrawal, pain, anxiety, psychosis, delirium,
hyperthyroidism, congestive heart failure, idiopathic.
ECG findings:
o Regular.
o P waves clearly discernable before each QRS complex, with identical morphology to
normal sinus rhythm.
o Develops over minutes to hours.
o Rate usually variable over time.
#Atrial fibrillation (A.fib):
General mechanism microreentery: involve multiple, simultaneous, chaotic waves
of depolarization propagating through the atria with frequencies in excess of 500 bpm.
There is no organized atrial contraction.
Risk factors hypertension, congestive heart failure, mitral disease, coronary artery
disease, cardiac surgery, intoxication (cocaine/amphetamine/alcohol), obstructive
sleep apnea, pulmonary embolism, hyperthyroidism, hypomagnesaemia.
ECG findings:
o The classic irregularly irregular rhythm
o Atrial activity consists of irregular, low amplitude undulations called fibrillation
waves (f waves) and usually there is no P wave.
o Develops abruptly.
o Rate can vary dramatically over time.
25
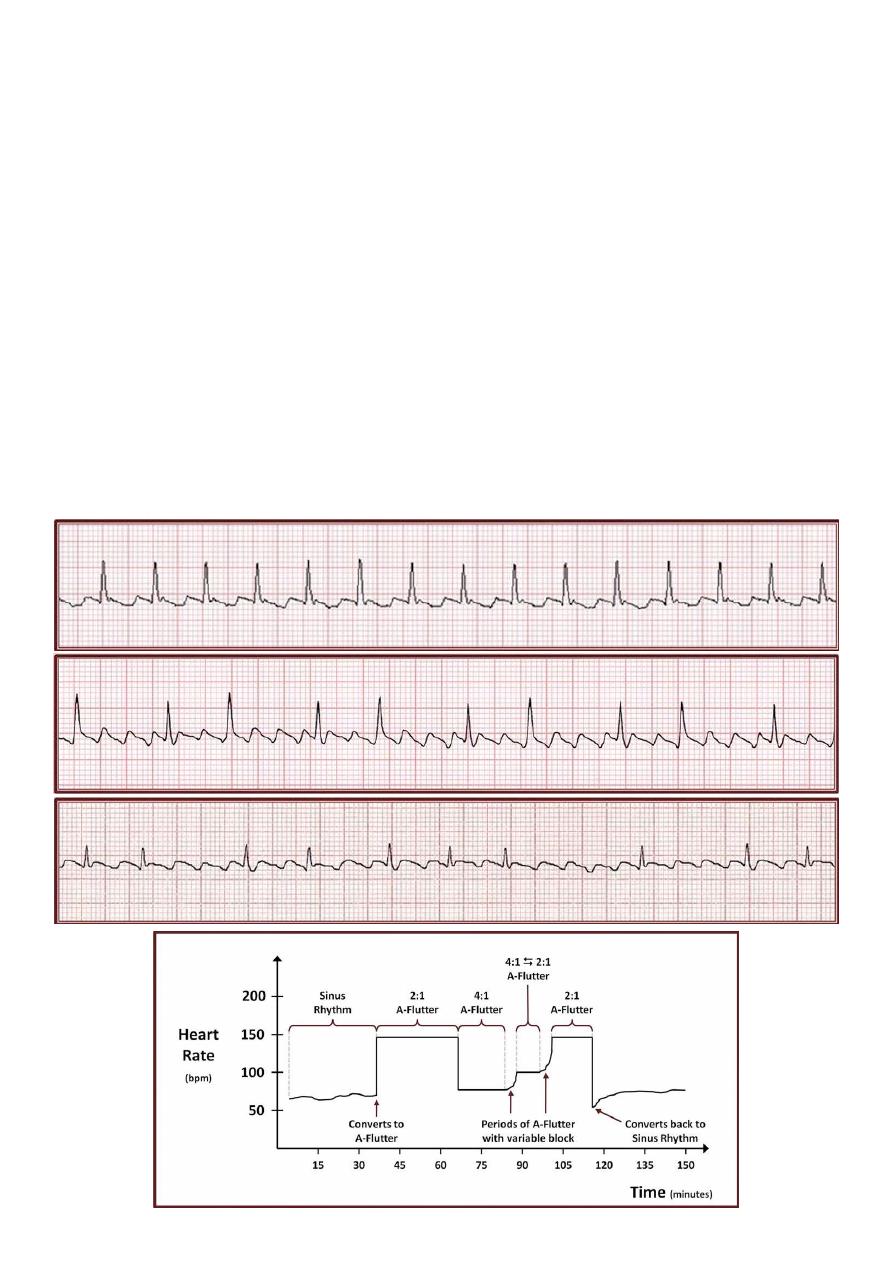
#Atrial flutter:
General mechanism macroreentery: a counterclockwise circuit encircling the right
atrium, passing through the cavotricuspid isthmus "isthmus dependent flutter".
Etiologies/Risk factors any risk factor for atrial fibrillation (particularly those
associated with atrial dilation) can generate the electrophysiologic substrate
conductive for atrial flutter.
ECG findings:
o Regular, regularly irregular, or irregularly irregular.
o Atrial activity consists of regular sawtooth waveforms in II, III, aVF, and upright
deflection in V1 which occur at a rate of 240-340 bpm, most commonly 300 bpm
called flutter rate (F wave).
o Usually 50% or more of atrial impulses are blocked by the AV node (example: atrial
rate = 300 bpm ventricular rate = 150 bpm).
o Develops abruptly.
o Rate can vary over time, and can demonstrate abrupt, discreet incremental changes
associated with changes in degree of AV block.
Regular
Regularly irregular
Irregularly irregular
26
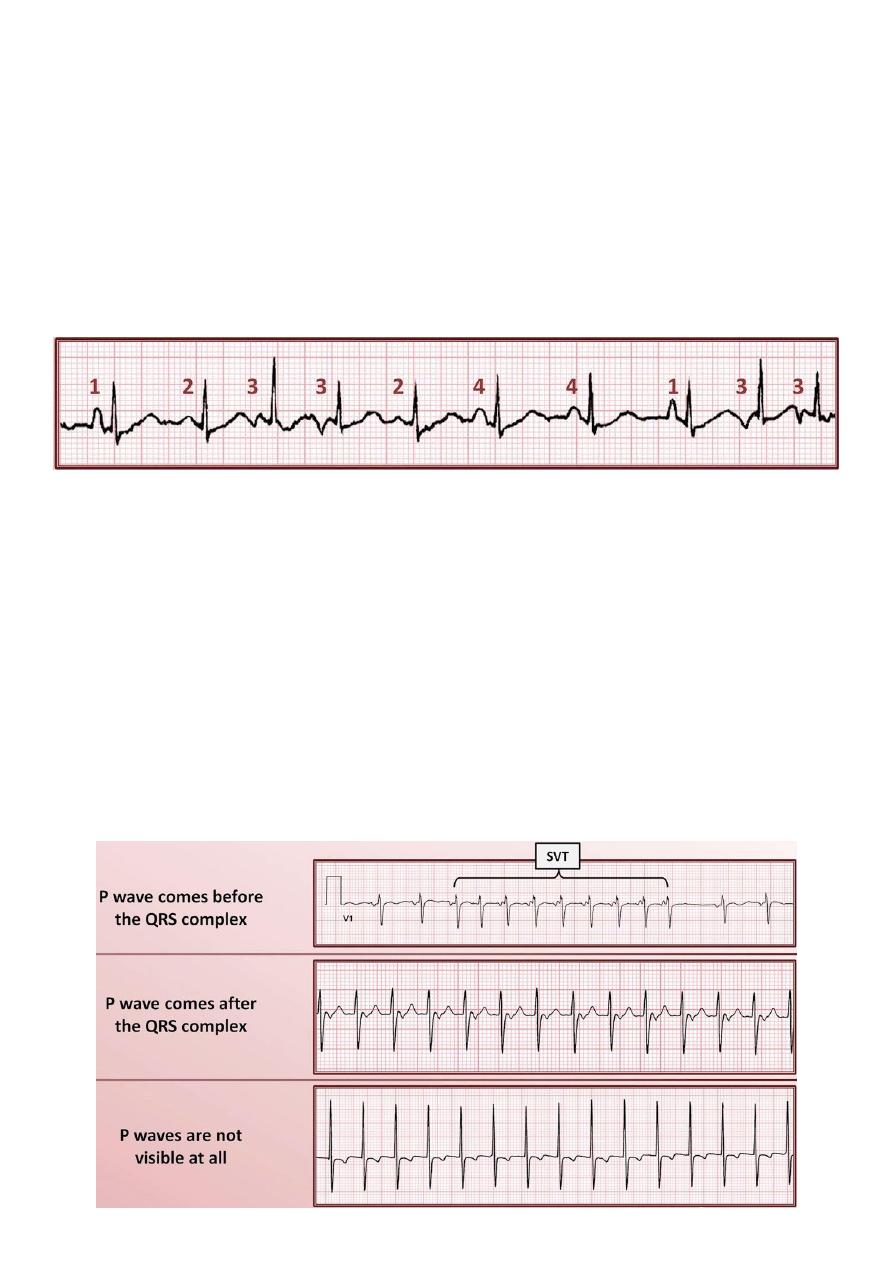
#Multifocal atrial tachycardia (MAT):
General mechanism unknown, but believed to be triggered activity from delayed
afterdepolarizations.
Etiologies COPD exacerbation, pneumonia, pulmonary embolism, CHF exacerbation,
theophylline.
ECG findings:
o Irregularly irregular.
o There are 3 or more distinctly P wave morphologies.
o No one predominant P wave morphology.
#Supraventricular tachycardia (SVT):
General mechanism all mechanisms, reentry is most common.
Etiologies anatomic anomaly, digoxin toxicity.
ECG findings:
o Regular.
o Rate is usually 150-200 bpm, but can be as slow as 120 bpm or as fast as 250 bpm.
o P waves may come before the QRS, after the QRS, or not be visible at all.
o When visible, P waves usually have an abnormal morphology consistent with either
an ectopic atrial focus, or retrograde atrial conduction.
o Most (but not all) begin abruptly.
o Rate is usually (but not always) very constant.
27
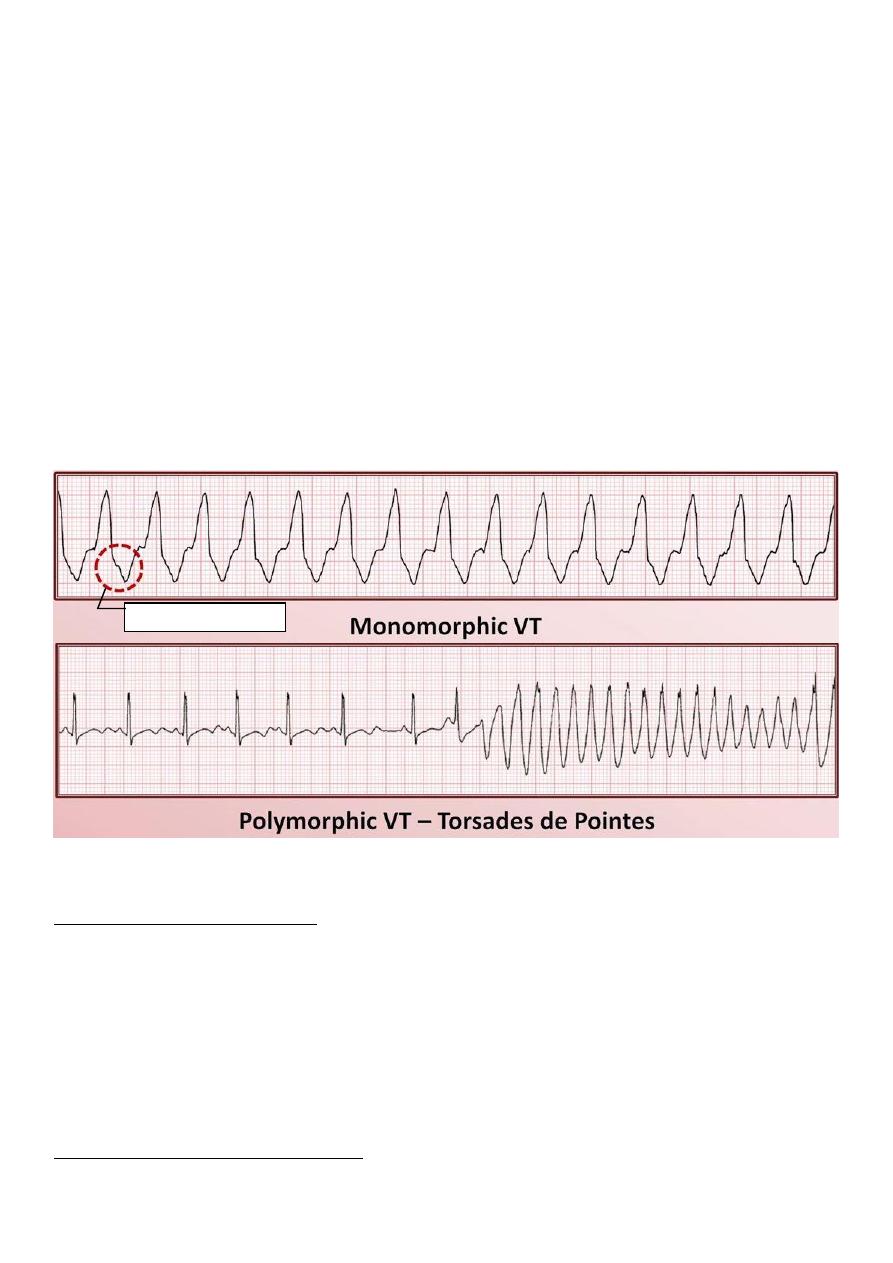
#Ventricular tachycardia (VT):
General mechanism all mechanisms.
Etiologies prior MI, active ischemia, cardiomyopathy, CHF (any cause), complex
congenital heart disease, medications (antiarrhythmics), genetic diseases, profound
electrolyte abnormalities, idiopathic.
ECG findings:
o Most commonly has a single QRS morphology, usually regular and called
(Monomorphic VT).
o Rarely has multiple QRS morphologies, in which case it's usually irregular and called
(Polymorphic VT).
o Always has a wide QRS complex.
o Evidence of AV dissociation, fusion beats, or capture beats are not always present,
but are essentially diagnostic of VT.
o Note: abrupt onset of long RR + short RR is characteristics for Torsades de pointes.
#How to Identify Any Tachyarrhythmia with 6 Easy Questions:
Question #1: what is the rate?
Most Tachyarrhythmias have largely overlapping possible rates, limiting the usefulness of
this characteristics, however a few observations:
Maximum predicted sinus rate = 220 – age in years.
Ventricular rate of exactly 150 is suggestive of atrial flutter with 2:1 AV block.
Most SVTs have rates of 150-200 bpm.
MAT is almost always < 160 bpm.
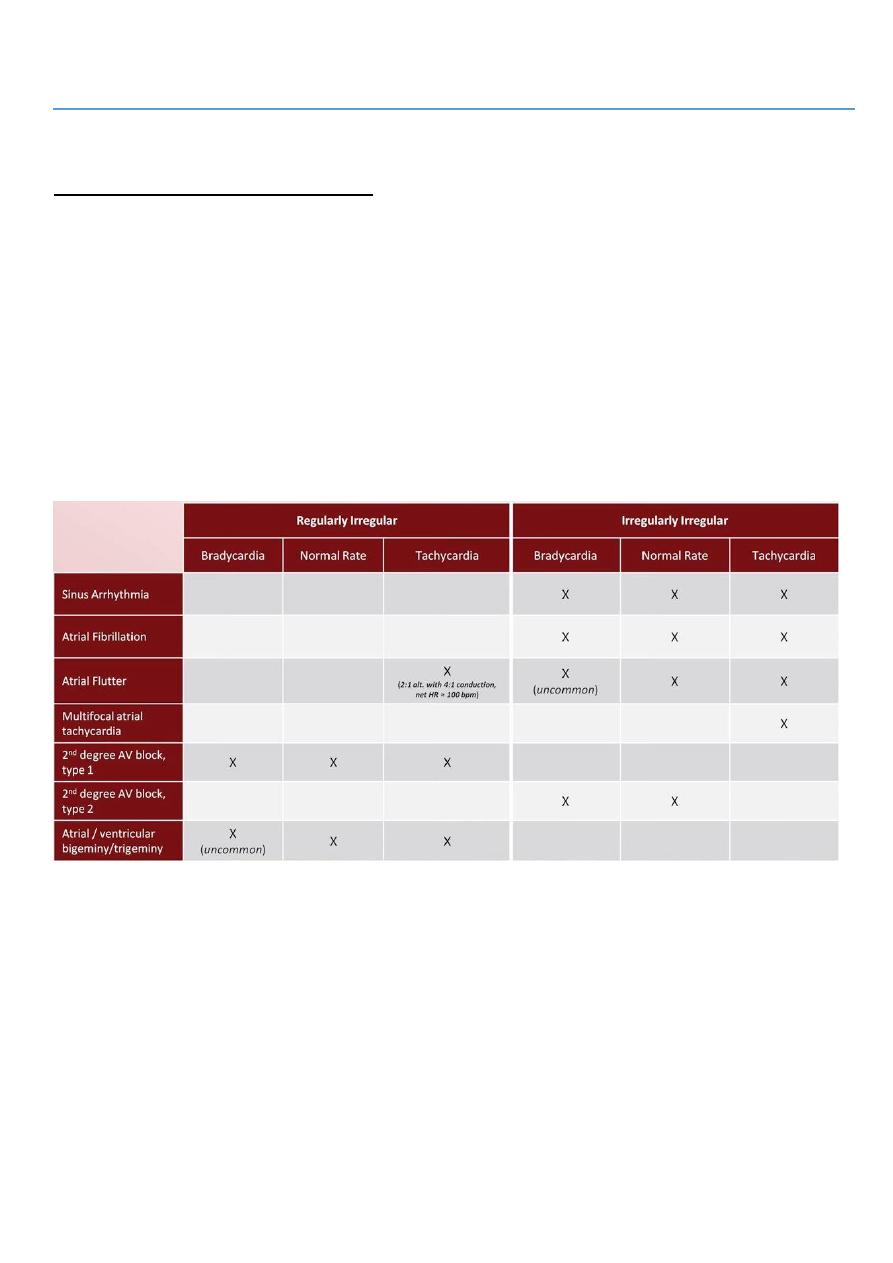
Question #2: is the rhythm regular?
Regularly irregular Tachyarrhythmias:
Dissociated P wave
28
o Atrial flutter with variable AV block in fixed pattern (usually 2:1 alternating with 4:1).
o Any SVT with type 1 2nd degree AV block.
Irregularly irregular Tachyarrhythmias:
o Atrial fibrillation.
o Atrial flutter with variable AV block in unfixed pattern.
o MAT.
o Polymorphic VT.
Question #3: are the QRS complexes narrow or wide?
A narrow QRS complex (<120 ms) exclude VT.
A wide QRS complex can be consistent with either:
o VT.
o Any other rhythm with:
aberrancy (like BBB).
preexcitation.
concurrent use of class Ia or Ic antiarrhythmics.
profound hyperkalemia.
Question #4: what is the atrial activity?
Are the P waves the same morphology as when the patient is in normal sinus rhythm (if
baseline ECG available for comparison)? Same P wave as sinus strongly suggests
sinus tachycardia.
Are the P waves retrograde (downgoing in II and/or upright in aVR)? retrograde P
waves strongly suggests SVT.
Are there flutter waves? best seen in inferior leads (II, III, aVF) and V1.
Is there no discernable atrial activity? if irregular atrial fibrillation // if regular
suggests SVT or VT.
Question #5: what is the relationship of P wave to QRS complexes?
Do the P waves come before or after the QRS complexes? P waves after the QRS
complexes are highly suggestive of an SVT.
Is there evidence of AV dissociation, fusion beats, or capture beats? if yes, the
rhythm is almost certainly VT.
Question #6: is the onset of the arrhythmia abrupt or gradual? is there any variation of
rate during the arrhythmia?
A very abrupt onset without rate variation is consistent with atrial flutter, SVT, or VT.
A very abrupt onset with rate variation is consistent with atrial fibrillation, atrial flutter
with variable block, or MAT.
Gradual onset (from 10 sec to hours) is highly suggestive of sinus tachycardia, also
could be from atrial tachycardia, junctional tachycardia, or ventricular tachycardia.
29
Forth abnormality: AV blocks
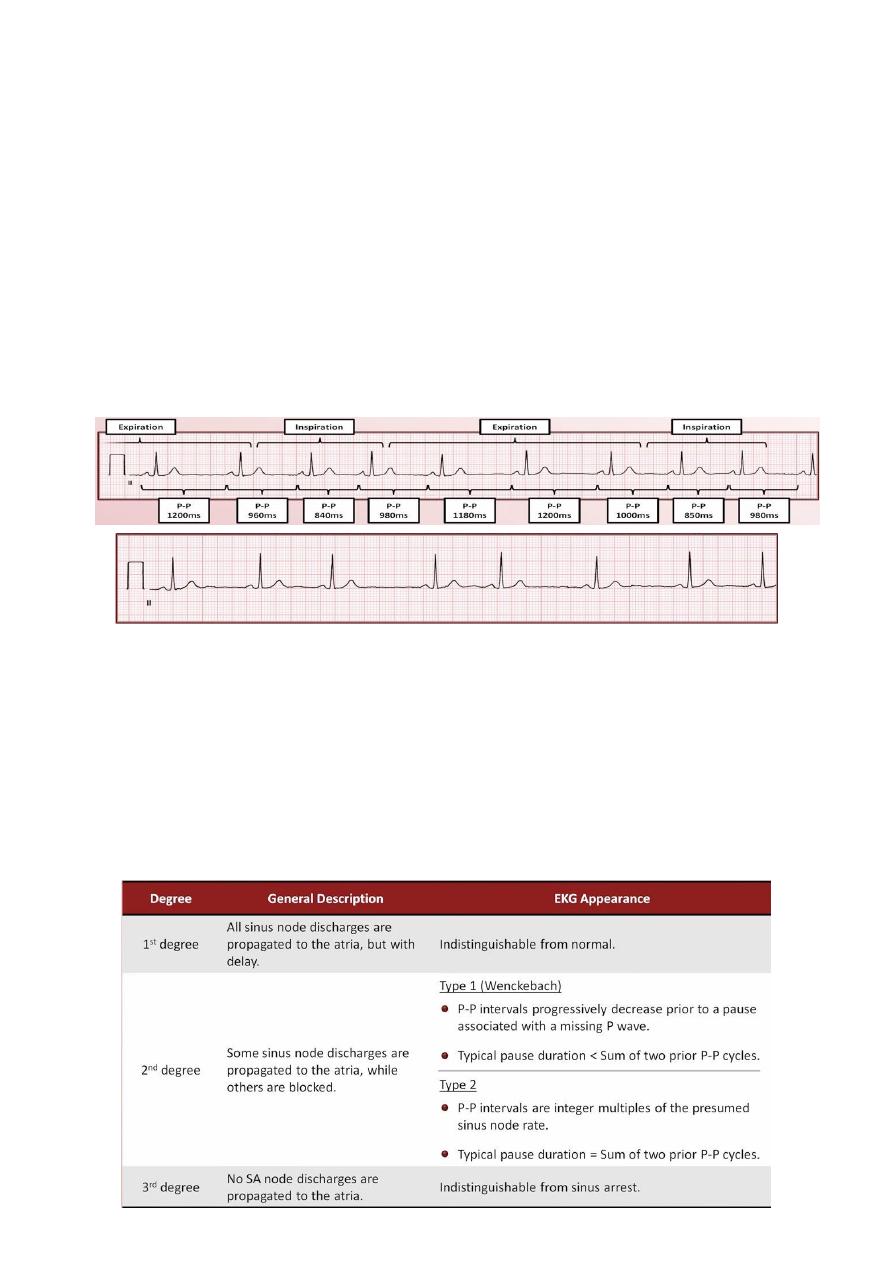
#3 degrees of AV block:
1st Degree – all atrial impulses are conducted to the ventricles, but with longer than
normal delay.
2nd Degree – only some atrial impulses are conducted (there are 3 different types of it)
3rd Degree – no atrial impulses are conducted.
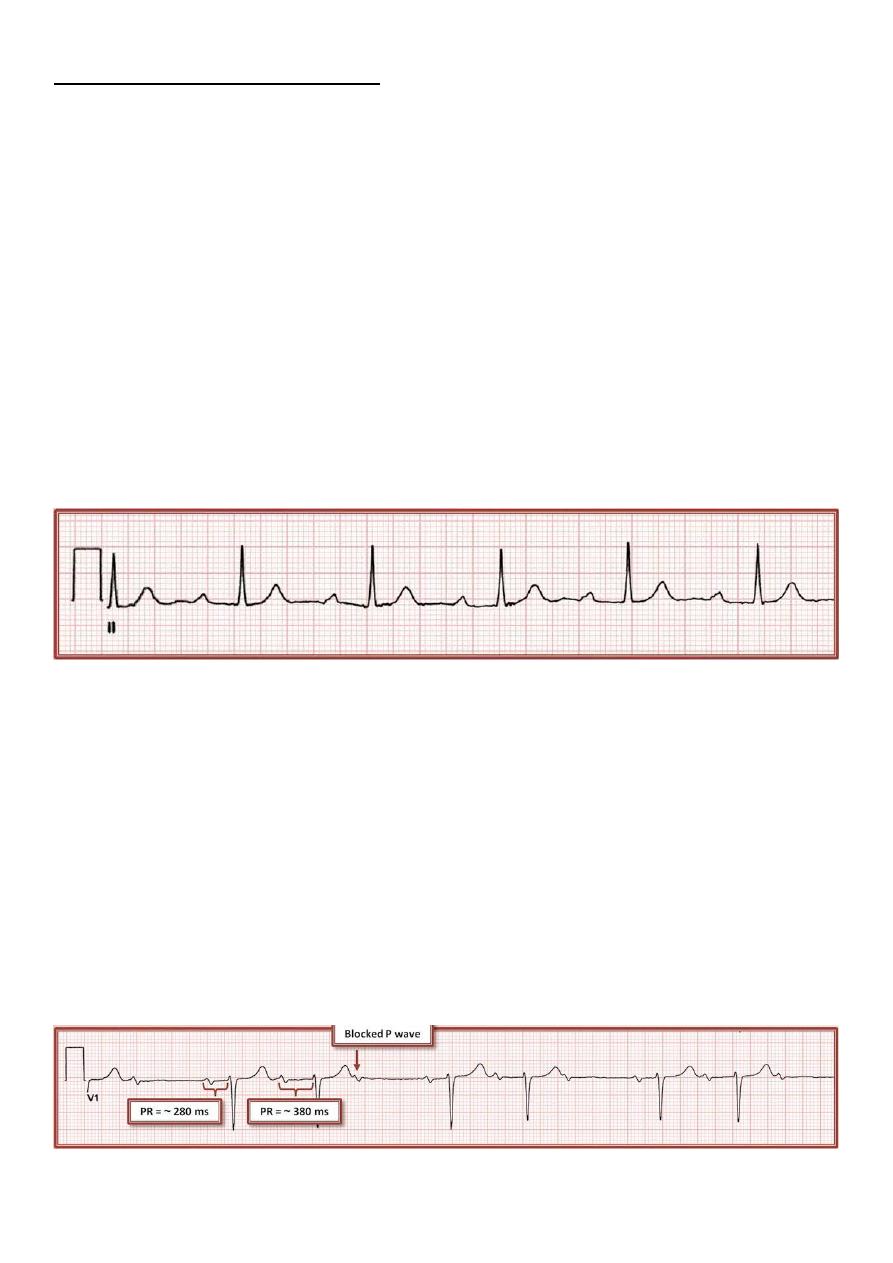
#1
st
Degree AV block:
All atrial impulses are conducted to the ventricles, but with longer than normal delay.
Every P wave is followed by a QRS complex, but the PR interval > 200 ms.
1:1 correlation between P waves and QRS complexes with prolonged constant PR
interval.
#2
nd
Degree AV block:
Some, but not all, atrial impulses are conducted to the ventricles.
Only some P wave are followed by a QRS complex.
Three different types of 2
nd
degree block:
o Type 1 2
nd
degree block.
o Type 2 2
nd
degree block.
o 2:1 2
nd
degree block.
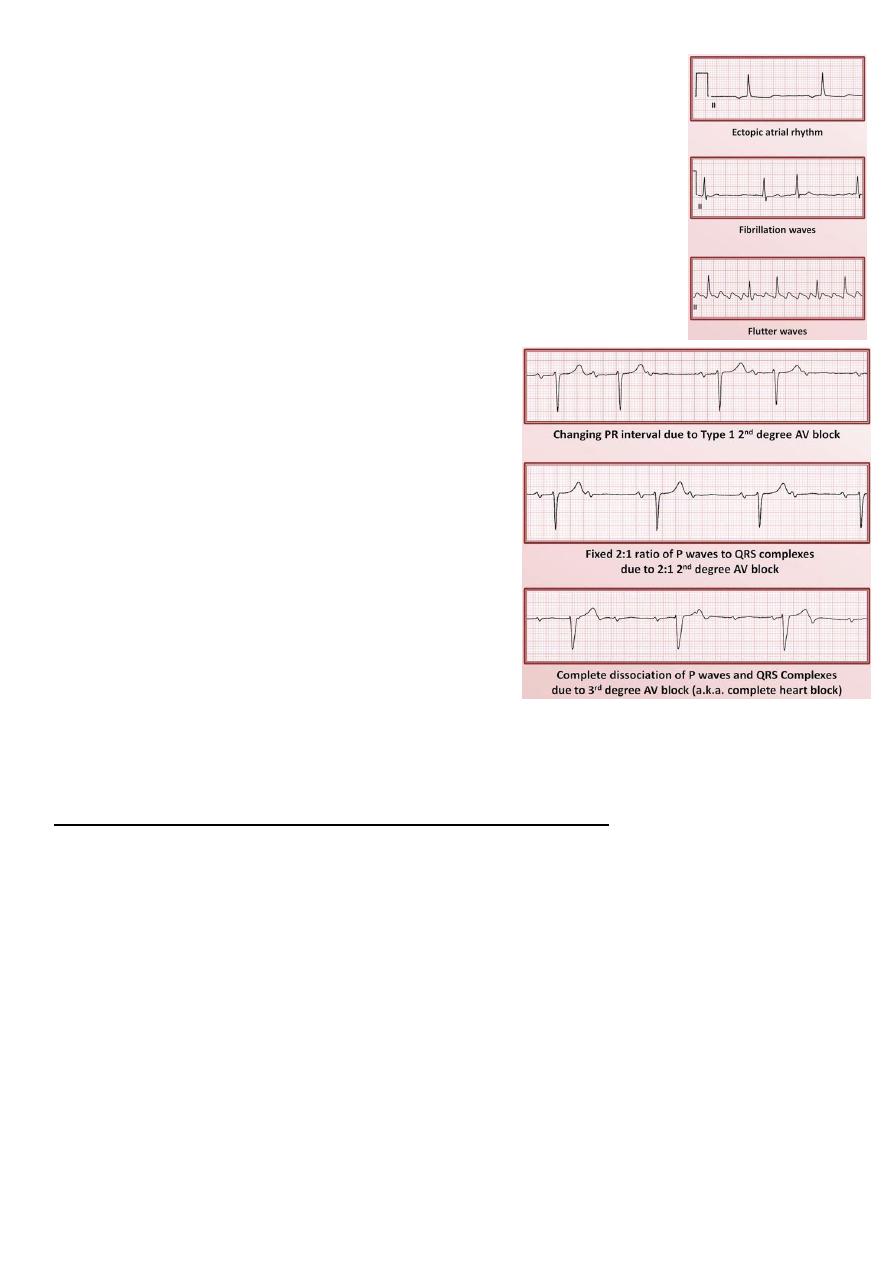
Type 1 (Wenckebach) 2
nd
degree block:
o PR progressively lengthens until a P wave is not conducted (blocked).
o This results in "grouped" beating, detectable on exam as a regularly irregular
rhythm.
o Greatest change in PR interval classically happens between 1st and 2nd conducted
P waves, and gets smaller with each successive P wave.
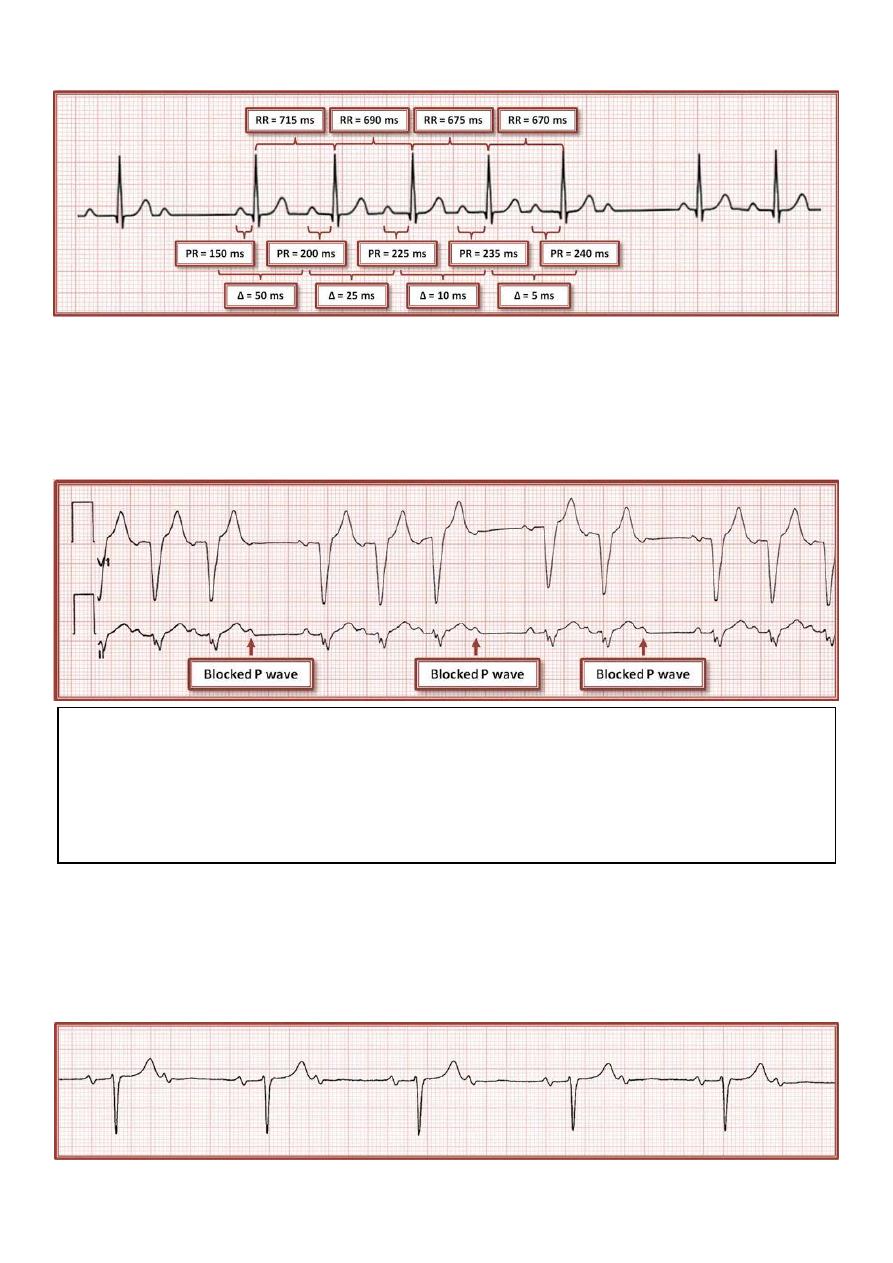
31
o An unexpected consequence: RR interval may progressively shorten.
Type 2 2
nd
degree block:
o PR is constant, and P waves are intermittently blocked, often at unpredictable
intervals.
o Since the location of type 2 block is usually distal to the actual AV node and bundle
of His (infra-Hisian), most patients with type 2 block have a wide QRS complex.
2:1 2nd degree block:
o It is often not possible to tell where the level of block is.
o A narrow QRS complex in 2:1 block favors an intranodal location, but this is not
guaranteed.
Note: AV conduction ratio
degree block is consistent, it is sometimes referred to by the ratio of P waves to QRS
nd
When the pattern of 2
complexes:
degree AV block.
nd
3:2 type 1 2
for every 2 QRS complexes
3 P waves
degree AV block.
nd
6:5 type 1 2
6 P waves for every 5 QRS complexes
31
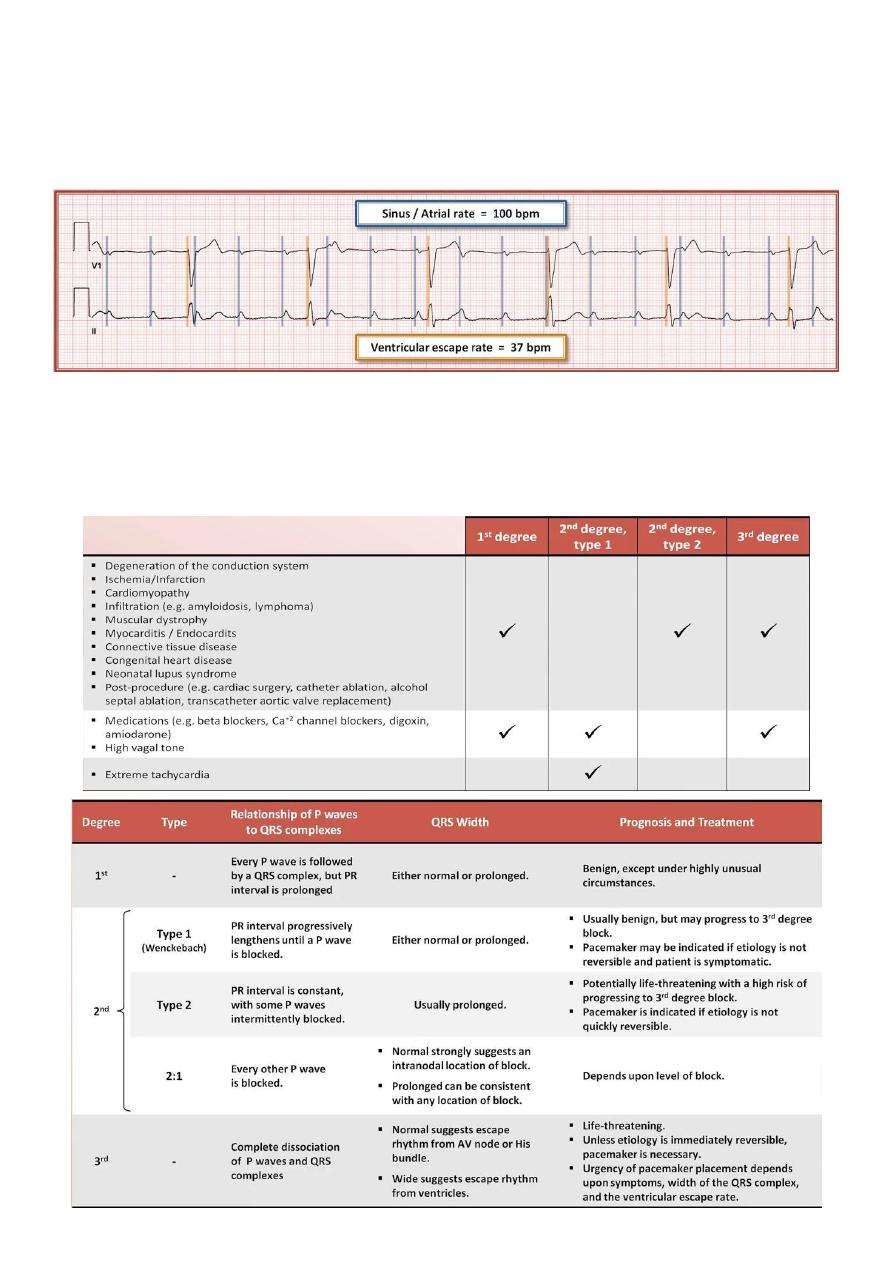
#3
rd
Degree AV block:
No atrial impulses are conducted to the ventricles.
P wave have no relationship to QRS complexes (AV dissociation).
Also known as "complete AV block" or "complete heart block".
Although 3
rd
degree AV block results in AV dissociation, not all AV dissociation is a
consequence of 3
rd
degree block.
AV dissociation also may be produced by any situation in which the ventricular rate
exceeds the atrial rate: Severe sinus bradycardia or sinus arrest, with a junctional or
ventricular escape rhythm // Ventricular tachycardia (VT).
Typical etiologies of AV block
32
Fifth abnormality: QRST changes
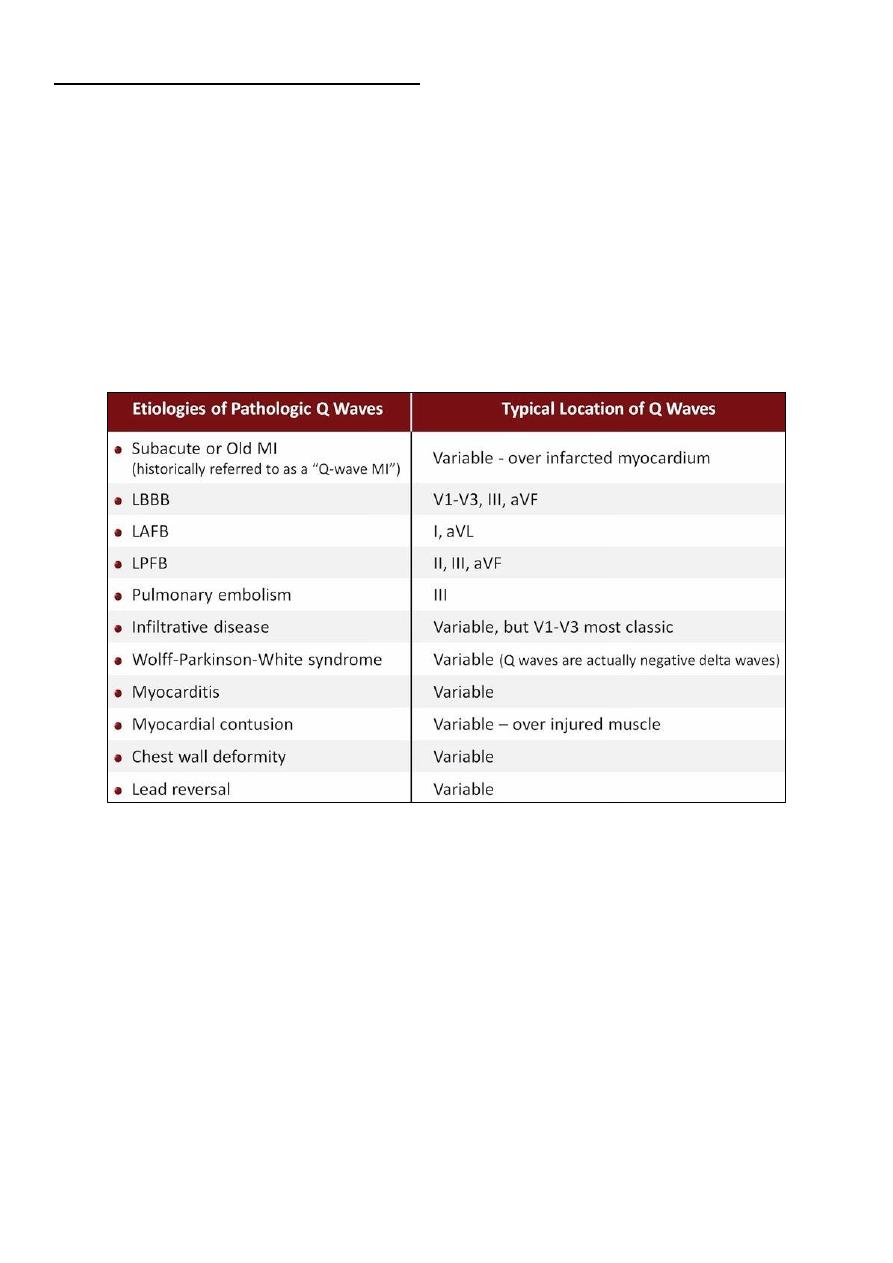
#Distinguishing pathologic from non-pathologic Q waves:
Small q waves are normal in most leads.
These are due to left to right depolarization of the septum.
They are often referred to as "septal q waves".
Any of the following is generally considered indicative of a pathologic Q wave:
o >= 30 ms in duration (
3/4
of 1 small square).
o Presence in V1, V2, or V3.
o Depth >= 1/3-1/4 of the R wave height.
Note: all etiologies from LBBB to lead reversal are called "Pseudoinfarct".
#R wave progression:
"R wave progression" refers to the pattern by which the R:S ratio gradually increases as
one moves across the precordium from V1 to V6.
The "zone of transition" which is the point where the R:S ratio = 1, normally occurs
between V2 and V3, or V3 and V4.
"Poor R wave progression" is frequently used to describe any form of abnormal R wave
progression.
o Delayed R wave progression (Transition zone between V4 and V5, or V5 and V6)
o Absent R wave progression (No transition zone, R<S in all precordial leads)
o Reverse R wave progression (Maximal R:S ratio in V1 or V2)
33
Etiologies of delayed or absent R wave progression:
o Anterior/anteroseptal MI.
o COPD (pulmonary disease pattern).
o LVH or RVH.
o Left anterior fascicular block.
o Electrode misplacement (V3-V6 placed too medially).
Etiologies of reverse R wave progression RBBB, RVH, Dextrocardia.
#ST segment elevation:
Two types: 1- Concave upward 2- Convex upward (Tombstoning)
ST segment elevation consistent with an acute STEMI requires ST elevation at the J
point in >= 2 anatomically contiguous leads of >=2 mm in V1, V2, or V3, and >=1 mm in
other leads.
There is a benign variant of ST elevation called "early repolarization" or "J-point
elevation" (neither are good terms) can result in concave upwards ST elevations,
particularly in V2-V3.
Clinical context is more important than specific ECG characteristics when assessing a
patient with ST elevations.
Most important etiologies of ST segment are: ST elevation MI (STEMI), LBBB, LVH,
Normal variant (early repolarization), pericarditis, vasospasm, hypokalemia.
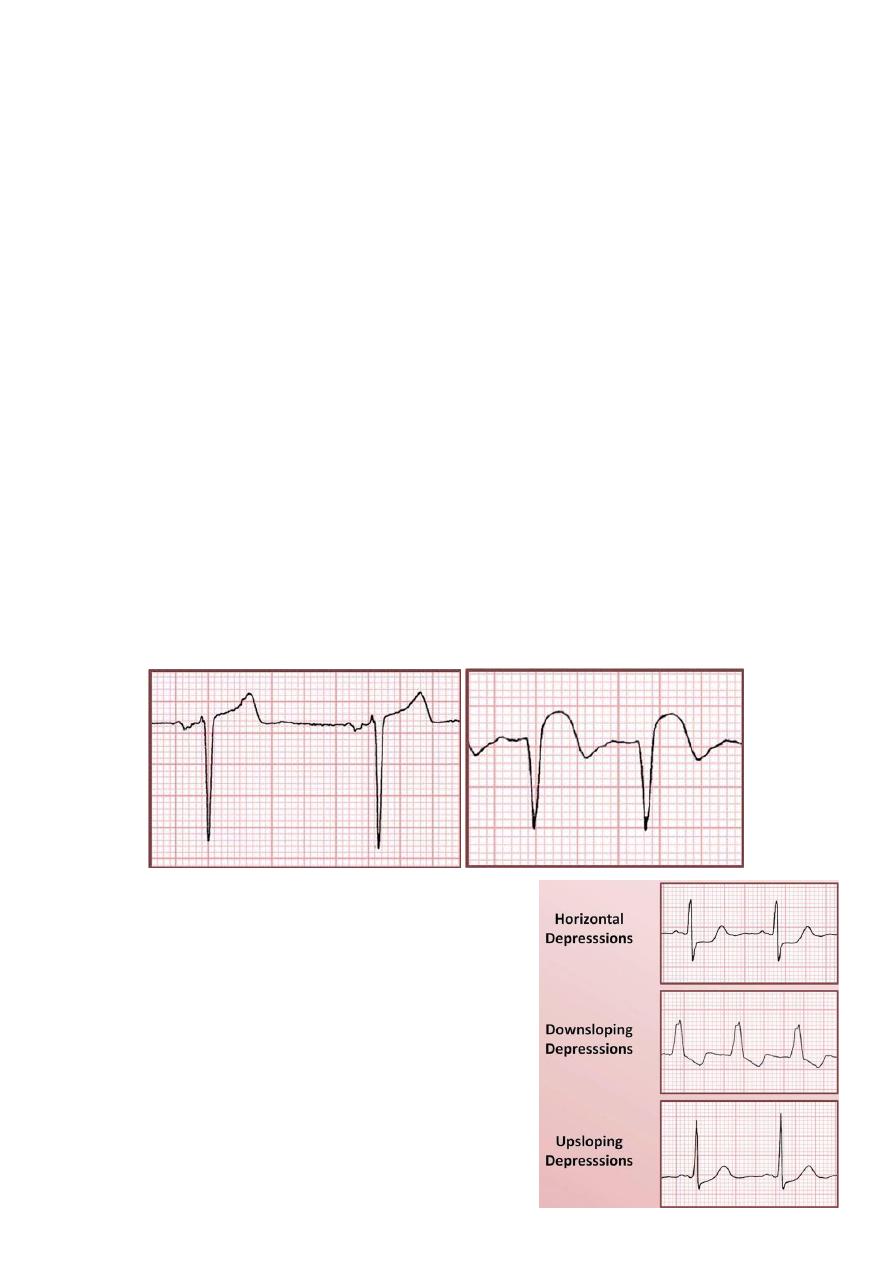
#ST segment depression:
Types Horizontal, Downsloping, Upsloping.
Etiologies:
o Primary repolarization abnormality: ischemia,
infarction, tachycardia, digoxin, hypokalemia.
o Secondary repolarization abnormality: RBBB,
LBBB, IVCD, RVH/LVH (strain pattern).
Strain pattern = downsloping depressions + T wave
inversions.
Concave upward
Convex upward
34
In primary repolarization abnormality the defect is in the process of repolarization itself
and preceding QRS complex may be totally normal.
In secondary repolarization abnormality the ST segments are depressed due to the fact
the sequence of ventricular repolarization is abnormal.
Any Time the QRS complex is severely abnormal, both subsequent ST segment and T
wave in the same lead will be likely abnormal too.
#T wave abnormalities:
The polarity of the T waves in a normal ECG should be similar to that of the QRS
complexes.
Quantification of the similarity of polarity is referred to as the QRS-T angle.
QRS-T angle is the difference between the QRS axis and the T wave axis in the 6 limb
leads.
An abnormally large angle may be an independent risk factor for
cardiovascular mortality.
Inverted T waves:
o T wave inversion should normally be present in aVR.
o T wave inversion can be normal in: III, aVF (if patient has a QRS
axis close to 0 degree), aVL (if patient has a QRS axis close to +90
degree), V1, V2.
o Etiologies of inverted T waves same etiologies of ST segment
depression, intracranial hemorrhage, pericarditis, hypothyroidism.
Flattened T waves:
o ECG machine algorithms will often interpret these as a
"nonspecific T wave abnormality"
o Etiologies: similar to etiologies of inverted T waves.
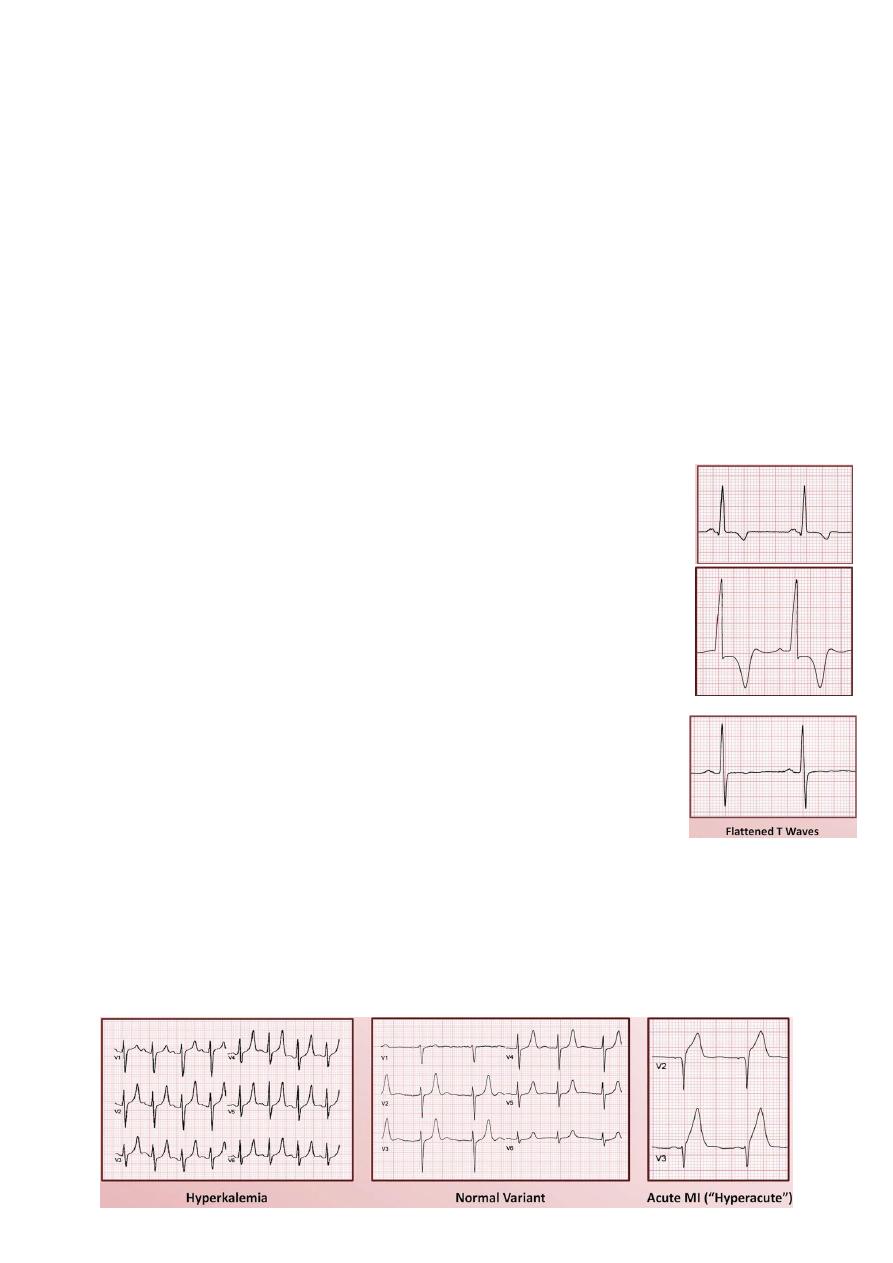
Peaked T waves:
o Presence of peaked T waves are usually diagnosed based on gestalt, rather then
strict criteria.
o Inconsistently applied criteria include T waves height > 5mm in limb leads // T
wave height > 10mm in precordial leads.
o Etiologies: hyperkalemia, normal variant (usually affects mid precordial leads), acute
MI (hyperacute T waves).
35
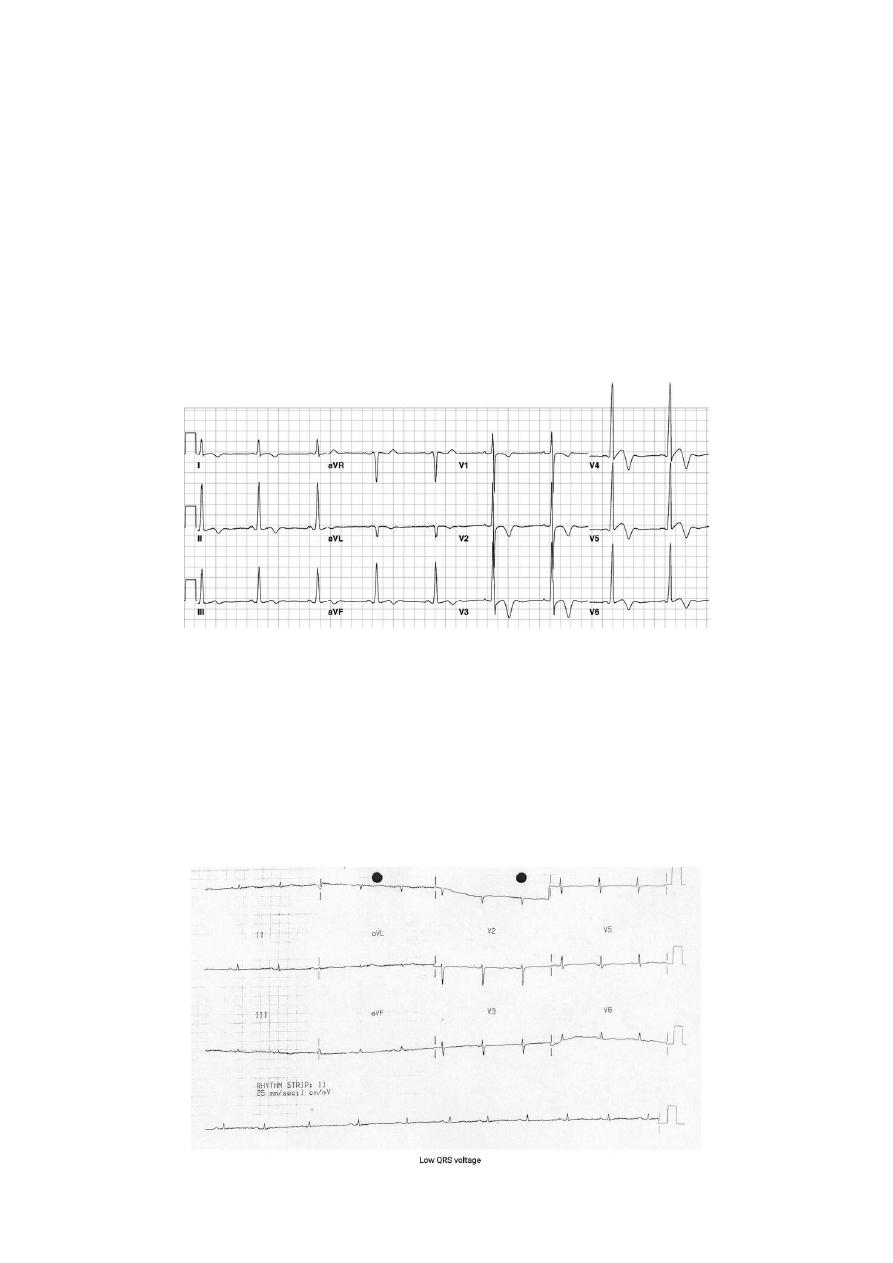
#Low voltage:
Low voltage is defined as presence of QRS amplitude in all limb leads < 5mm // QRS
amplitude in all precordial leads < 10mm.
Etiologies consequence of some insulating substances coming between the
electrodes, chest wall, and the conduction system, include obesity, COPD, pleural or
pericardial effusion, hypothyroidism, myocardial infiltrations (amyloidosis, sarcoidosis).
#Electrical alternans:
It is a beat to beat alternation in the appearance of waveforms.
Most commonly manifest as a tall R wave alternating with short R wave.
Etiology: large pericardial effusion.
Could appear in tamponade but the presence of electrical alternans not suggest the
tamponade specifically.
Sixth abnormality: myocardial infarction
#Electrocardiographic classification of MIs:
Waveform morphology STEMI vs. NSTEMI, Q waves vs. non Q wave.
Age acute vs. subacute vs. "old".
Localization affected wall, culprit vessel.
36
#Acute coronary syndrome:
STEMI:
o ST elevation is >= 2 anatomically contiguous leads.
o +/- ST depression and/or T wave inversions in other leads.
NSTEMI and unstable angina (UA):
o May or may not have ST depressions and/or T wave inversions.
o ECG may be completely normal.
o NSTEMI and UA differentiated only be elevation of biomarkers (troponin).
#Other common ECG findings during or following MIs:
Pathologic Q waves.
New QRS axis deviation.
Poor R wave progression.
Conduction block (AV block, BBB).
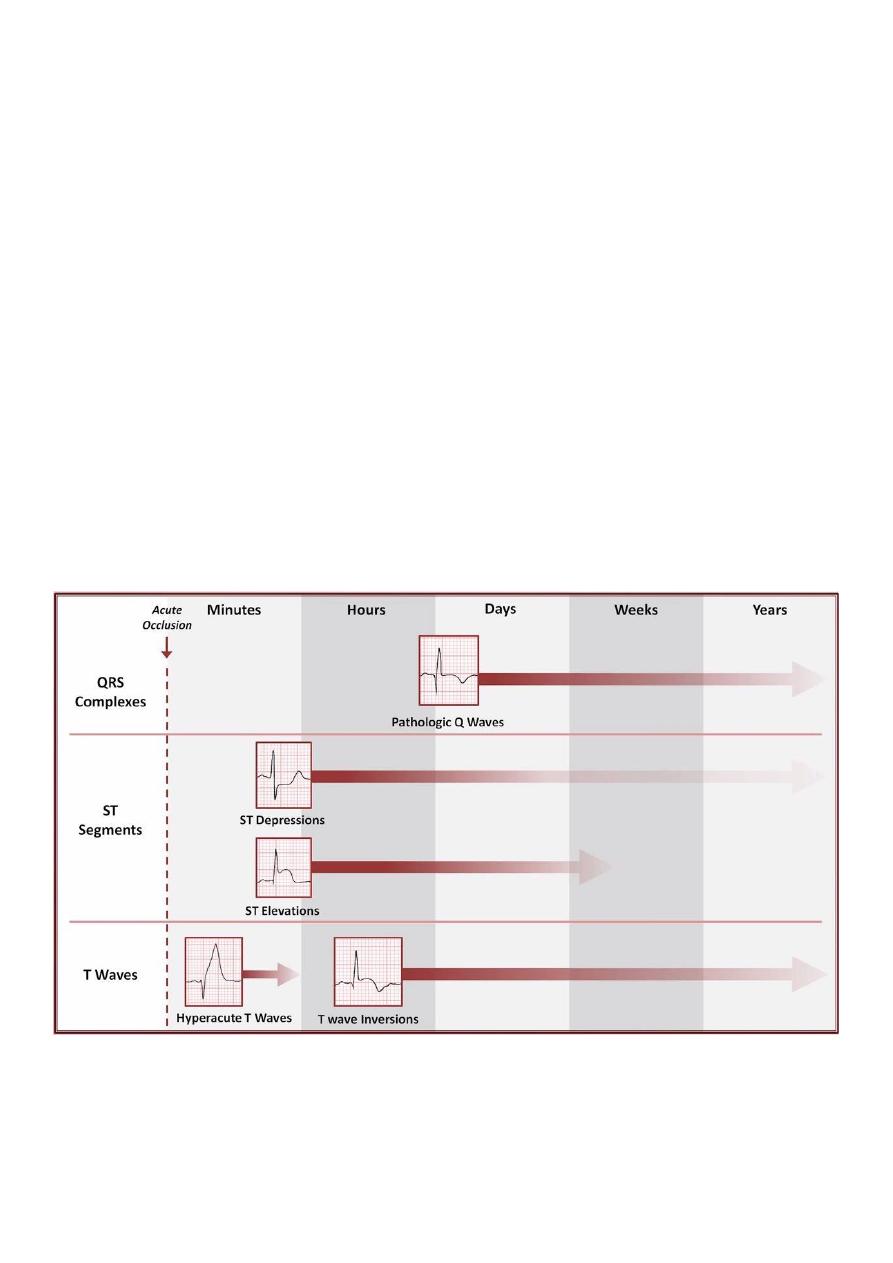
#The chronological evolution of ECG findings following an acute MI:
#Anatomic localization:
Acute STEMIs can be localized to a specific anatomic region.
37
Subacute or old MIs which have resulted in pathologic Q waves (Q wave MI) can also
be localized to an anatomic region, through this is not completely reliable, and assumes
the cause of the Q wave must be an old infarct (which may not be true) .
However, acute NSTEMIs and old non Q wave MIs cannot be accurately localized. The
location of ST-T changes (ST depressions, T wave inversions) seen in these situations do
not correspond to the location of infarcted territory.
#Vessels territory:
Left anterior descending artery (LAD) supply apex, anterior wall, septum, high
lateral wall.
Left circumflex artery (Cx) supply lateral wall, high lateral wall.
Right coronary artery (COA) supply right ventricle.
Posterior descending artery (PDA) supply inferior wall, posterior wall.
o Right dominant circulation (80%) PDA is supplied by RCA.
o Left dominant circulation (15%) PDA is supplied by Cx.
o Co-dominant circulation (5%) PDA is supplied by RCA and Cx.
o Warp around LAD (rare) PDA is supplied by LAD in apical to basal direction.
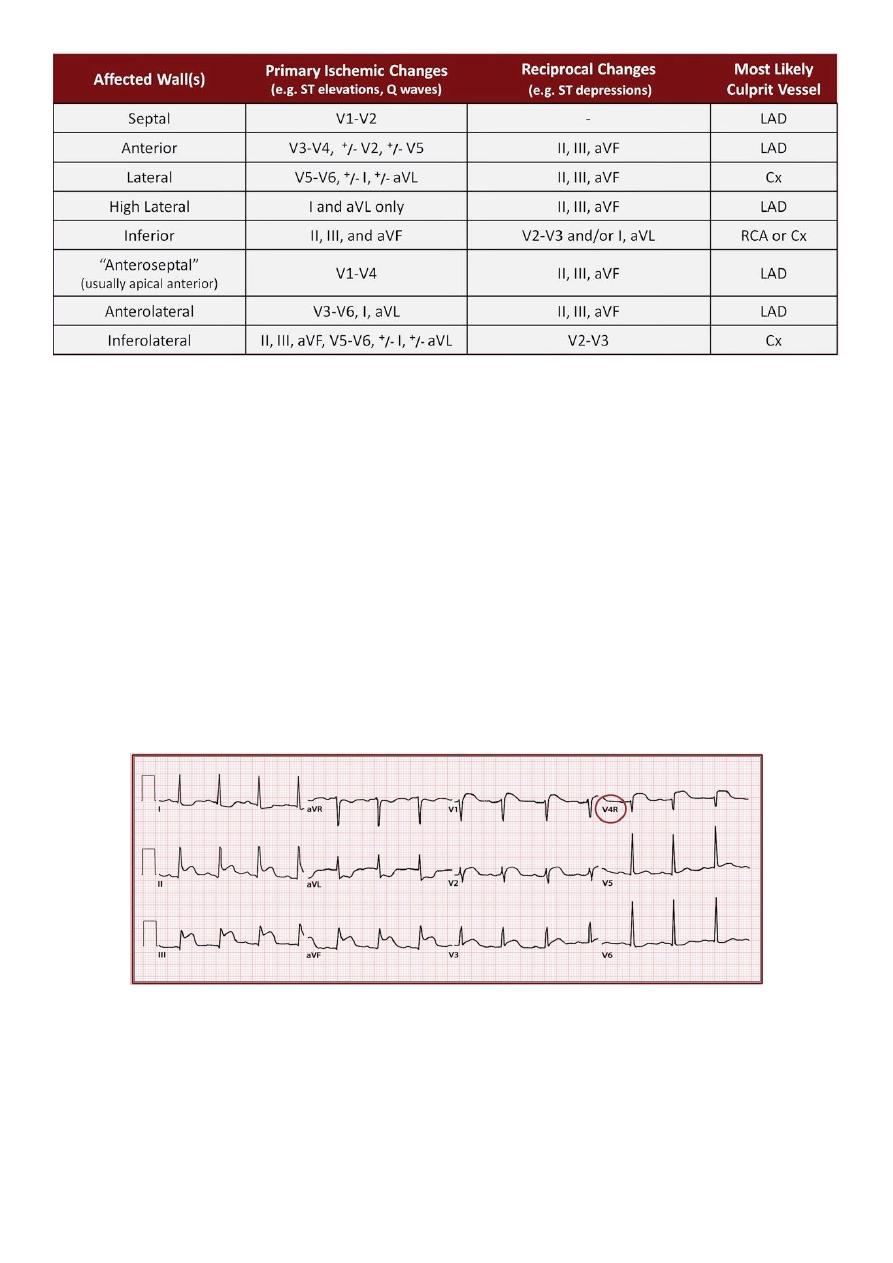
#Reciprocal changes:
Reciprocal changes are those ECG changes that are seen on the side of the heart
"opposite" from the site of injury (typically in the form of ST depressions).
As the heart is an irregularly shaped structure without clear pairing of opposite sides,
the location of reciprocal changes may not be intuitive.
Inferior STEMIs can lead to reciprocal changes in anterior leads.
38
Anterior STEMIs can lead to reciprocal changes in inferior leads.
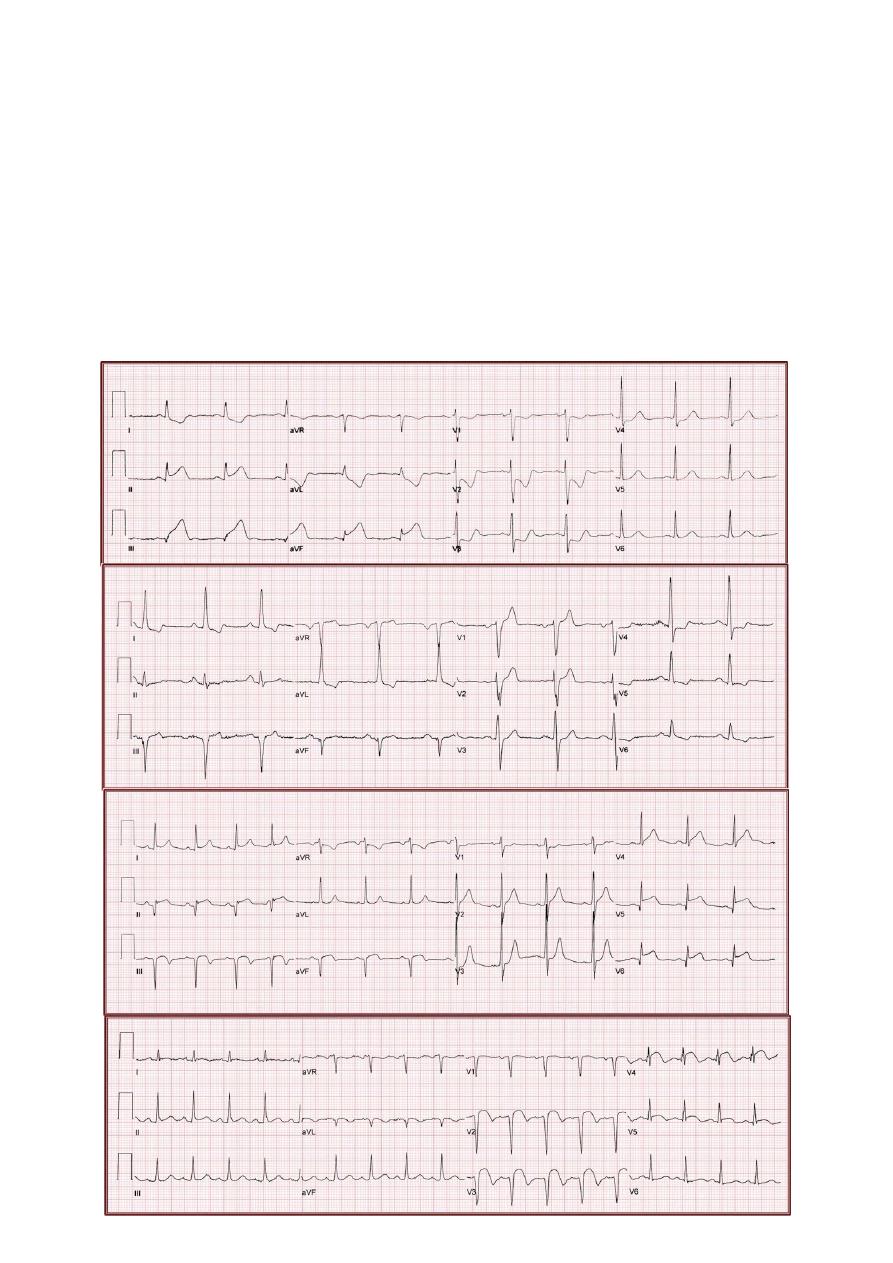
#How to describe the findings of an MI on ECG:
What region of the heart is involved? By detecting the abnormal lead then know
which region of the heart is presented by this abnormal lead.
Where is the most likely location of occlusion? By knowing the vessel territory.
Approximately how old is the infarct? By knowing the chronological evolution of
ECG findings following MI.
What is the overall impression? By summation the results of the 3 above questions.
Acute inferior STEMI
Subacute anterior STEMI
Probable old inferior MI
Subacute inferolateral STEMI
39
#The diagnosis of right ventricular infarct:
RV infarcts are relatively uncommon because they require a proximal RCA occlusion,
and The RV is less susceptible to ischemia/infarction due to reduced workload and a
thinner chamber wall (allowing intracavitary blood to serve as secondary source of O2)
Presence of an RV infarct is suggested by:
o Hypotension and/or acute conduction system problems accompanying an inferior
infarct.
o ST elevation in V1 when V2 has either less significant ST elevation or has ST
depression.
Presence of an RV infarct can be confirmed by using leads V3R, V4R, V5R, V6R (same
places of V3-4-5-6 leads but on the right side of the chest).
The presence of ST elevation in lead V4R confirm the diagnosis of RV infarct.
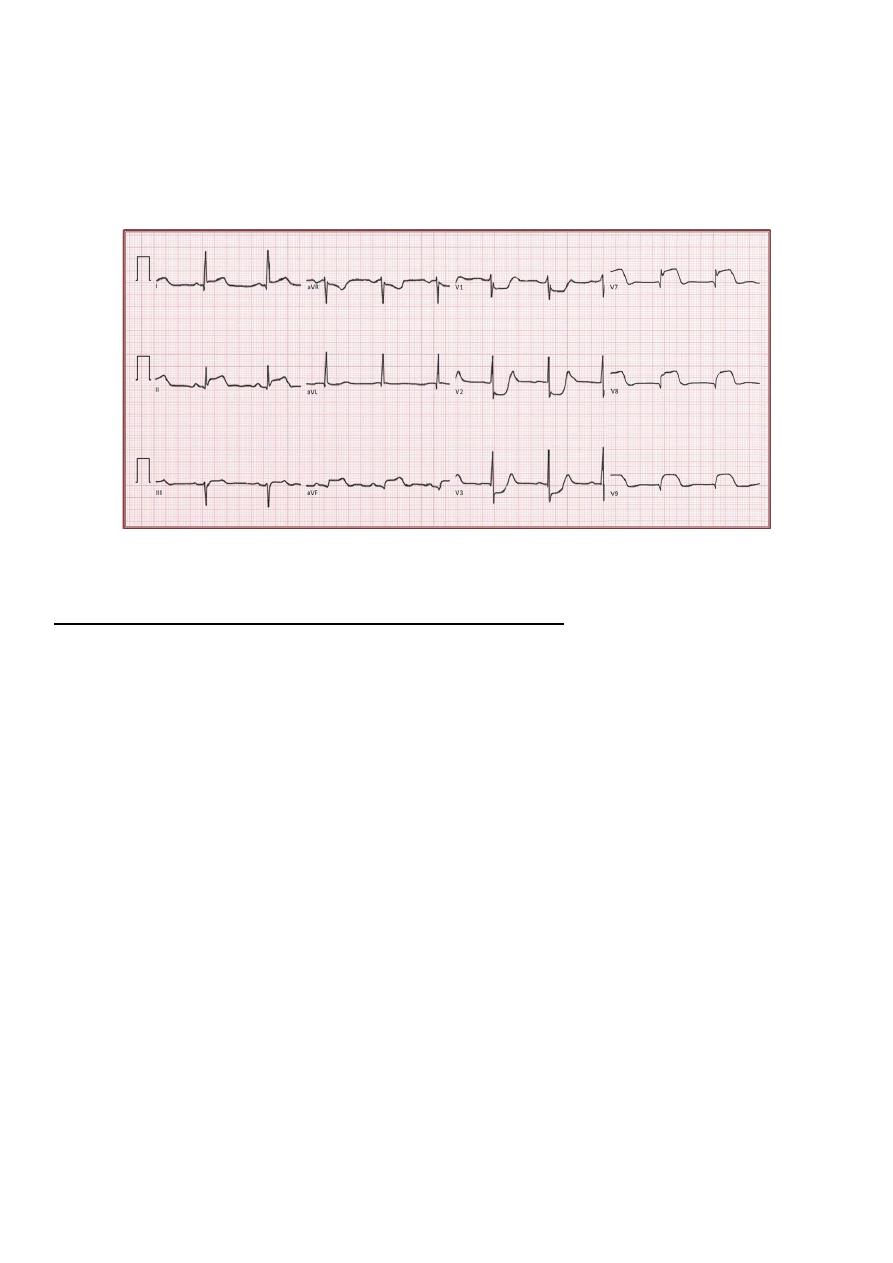
#The diagnosis of posterior infarct:
Posterior infarcts can co-exists with inferior infarcts.
Presence of a posterior infarcts is suggested by:
o Horizontal ST depressions and prominent upright T waves in V1 and V2.
o R:S ratio > 1 in V1 or V2.
41
Presence of a posterior infarct can be confirmed by using leads V7, V8, V9.
V7 placed in the posterior axillary line in the same horizontal plane of V6.
V8 placed on the tip of the scapula in the same horizontal plane of V6.
V9 placed in left para-spinal region in the same horizontal plane of V6.
The very prominent ST elevation in these leads confirm the presence of posterior
infarct.
Seventh abnormality: Sinus Node Dysfunction
#Introduction:
Sinus node dysfunction is a broad category of electrophysiological defects of either
impulse formation within the sinus node and/or propagation from the sinus node into
the atria.
Such problems include:
o Sinus arrhythmia.
o Sinus pauses.
o Sinus arrest.
o SA nodal exit block.
o Inappropriate sinus bradycardia.
o Chronotropic incompetence (result in exercise intolerance).
First 5 problems can occur in normal people during sleep particularly in athletes.
Etiologies of sinus node dysfunction include:
o Age related sinus node fibrosis.
o Atrial remodeling (a-fib, heart failure).
o Atherosclerosis of the SA nodal artery.
o Infiltrative diseases (amyloidosis).
o Post-cardiac surgery.
41
o Medications (B blockers, Ca channels blockers, amiodarone, digoxin).
o Hypothyroidism.
o Hypothermia.
#Sinus arrhythmia:
The P-P interval between successive beats vary slightly normally, even when the P
waves are identical and PR segment is constant.
If the shortest and longest P-P intervals differ by >10%, the patient is said to have
"sinus arrhythmia".
There are 2 variations:
o Respiratory (physiologic) sinus arrhythmia (common) in which the P-P interval vary
according the patient's respiratory cycle.
o Non-respiratory sinus arrhythmia (uncommon)
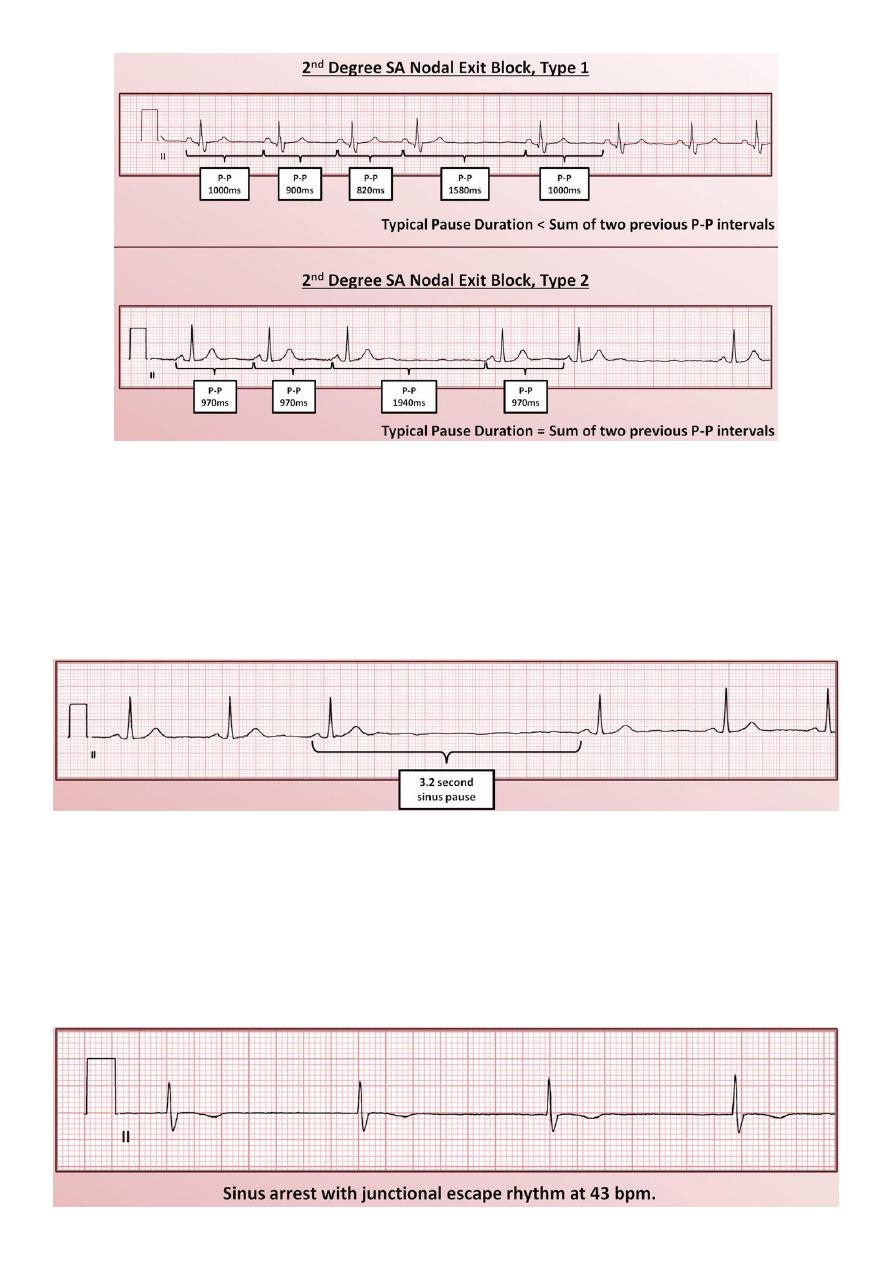
#SA nodal exit block:
SA nodal exit block occurs when impulses originating from within the sinus node are
blocked from reaching the rest of the atria.
This results in either a delay or an absence of the P wave.
Identification of SA nodal exit block can be difficult for two reasons:
o Depolarization of the sinus node produces no discernable waveform on the ECG.
o Either form of sinus arrhythmia can limit the identification of specific patterns of
changing P-P intervals.
Respiratory sinus arrhythmia
Non-respiratory sinus arrhythmia
42
#Sinus pause:
Sinus pause is a temporary interruption in sinus rhythm caused by failure of impulse
generation within the SA node.
Typically defined as being > 2-3 seconds.
Must be distinguished from SA nodal exit block, if possible.
#Sinus arrest:
Sinus arrest is a prolonged failure of impulse generation within the SA node.
It is like a sinus pause last for very long time or permanent.
It is dangerous, and will result in a systole if there is not an escapes rhythm present.
43
#Sick sinus syndrome:
Sick sinus syndrome is the combination of sinus node dysfunction and symptoms
secondary to it (lightheadness, syncope), and other symptoms like palpitation, fatigue,
and heart failure symptoms.
One half a patient with sick sinus syndrome have a condition slightly more specific
called the "tachycardia-bradycardia syndrome"
Tachycardia-bradycardia syndrome is the combination of sick sinus syndrome and atrial
Tachyarrhythmias (a-fib, a-flutter).
Etiologies of sick sinus syndrome: atherosclerosis, cardiomyopathies.
Treatment of sick sinus syndrome is a pacemaker.
Treatment of tachycardia-bradycardia syndrome is pacemaker + AV nodal blocking
agents (B blockers, Ca channel blockers).
Eighth abnormality: pericardium and myocardium diseases
#Pericarditis:
Causes:
o Infectious (coxsackie virus), Immunological (SLE, rheumatic fever), Uraemia, Post-
myocardial infarction, Trauma, Following cardiac surgery.
o Paraneoplastic syndromes, Drug-induced (isoniazid), Post-radiotherapy.
ECG Changes:
o Widespread concave ST elevation and PR depression throughout most of the limb
leads (I, II, III, aVL, aVF) and precordial leads (V2-6).
o Reciprocal ST depression and PR elevation in lead aVR (± V1).
o Sinus tachycardia is also common in acute pericarditis due to pain and/or
pericardial effusion.
Tachycardia-bradycardia syndrome
44
#Massive Pericardial Effusion:
Tachycardia
Electrical alternans:
o When consecutive, normally-conducted QRS complexes alternate in height.
o Produced by the heart swinging backwards and forwards within a large fluid-filled
pericardium.
#Dilated Cardiomyopathy (DCM):
Causes: Ischemic: following massive anterior MI / Non-ischemic: idiopathic.
ECG Changes:
o Left atrial enlargement -> may progress to atrial fibrillation.
o Biatrial enlargement, Left axis deviation.
o Left ventricular hypertrophy or biventricular enlargement
o Left bundle branch block (RBBB can also occur).
o Poor R-wave progression with QS complexes in V1-4 (“pseudo-infarction” pattern).
o Frequent ventricular ectopics and ventricular bigeminy (seen with severe DCM).
o Ventricular dysrhythmias (VT / VF).
45
#Hypertrophic Cardiomyopathy (HCM):
It is a heterogeneous disorder, produced by mutations in multiple genes coding for
sarcomeric proteins (e.g. beta-myosin heavy chain, troponin T). Inheritance is primarily
autosomal dominant.
ECG Changes:
o Left atrial enlargement.
o Left ventricular hypertrophy with associated ST segment / T-wave abnormalities.
o Deep, narrow (“dagger-like”) Q waves in the lateral > inferior leads.
o Giant precordial T-wave inversions in apical HCM.
o Signs of WPW (short PR, delta wave).
o Dysrhythmias: atrial fibrillation, supraventricular tachycardias, PACs, PVCs, VT.
#Restrictive Cardiomyopathy (RCM):
It occurs in the advanced stages of myocardial infiltrative disease — e.g. due to
haemochromatosis, amyloidosis or sarcoidosis.
ECG Changes:
o Low voltage QRS complexes, Non-specific ST segment / T wave changes.
o Atrioventricular block (3rd degree AV block may occur in sarcoidosis).
o Bundle branch blocks, Pathological Q waves, Atrial and ventricular dysrhythmias.
46
Ninth abnormality: other cardiac conditions
#Dextrocardia:
Right axis deviation
Positive QRS complexes (with upright P and T waves) in aVR
Lead I: inversion of all complexes, aka ‘global negativity’ (inverted P wave, negative
QRS, inverted T wave)
Absent R-wave progression in the chest leads (dominant S waves throughout)
#Pacemaker Rhythms:
Pacemakers consist of:
o Pulse generator: Power source, Battery, Control circuitry, Transmitter / Receiver,
Reed Switch (Magnet activated switch).
o Lead(s): Single or multiple, Unipolar or bipolar.
Features of the paced ECG are:
Pacing spikes:
o Vertical spikes of short duration, usually 2 ms.
o May be difficult to see in all leads.
o Amplitude depends on position and type of lead.
o Bipolar leads result in a much smaller pacing spike than unipolar leads.
o Epicardially placed leads result in smaller pacing spikes than endocardially placed
leads.
Atrial Pacing:
o Pacing spike precedes the p wave.
o Morphology of p wave dependent of lead placement but may appear normal.
Ventricular Pacing:
o Pacing spike precedes the QRS complex.
o Right ventricle pacing lead placement results in a QRS morphology similar to LBBB.
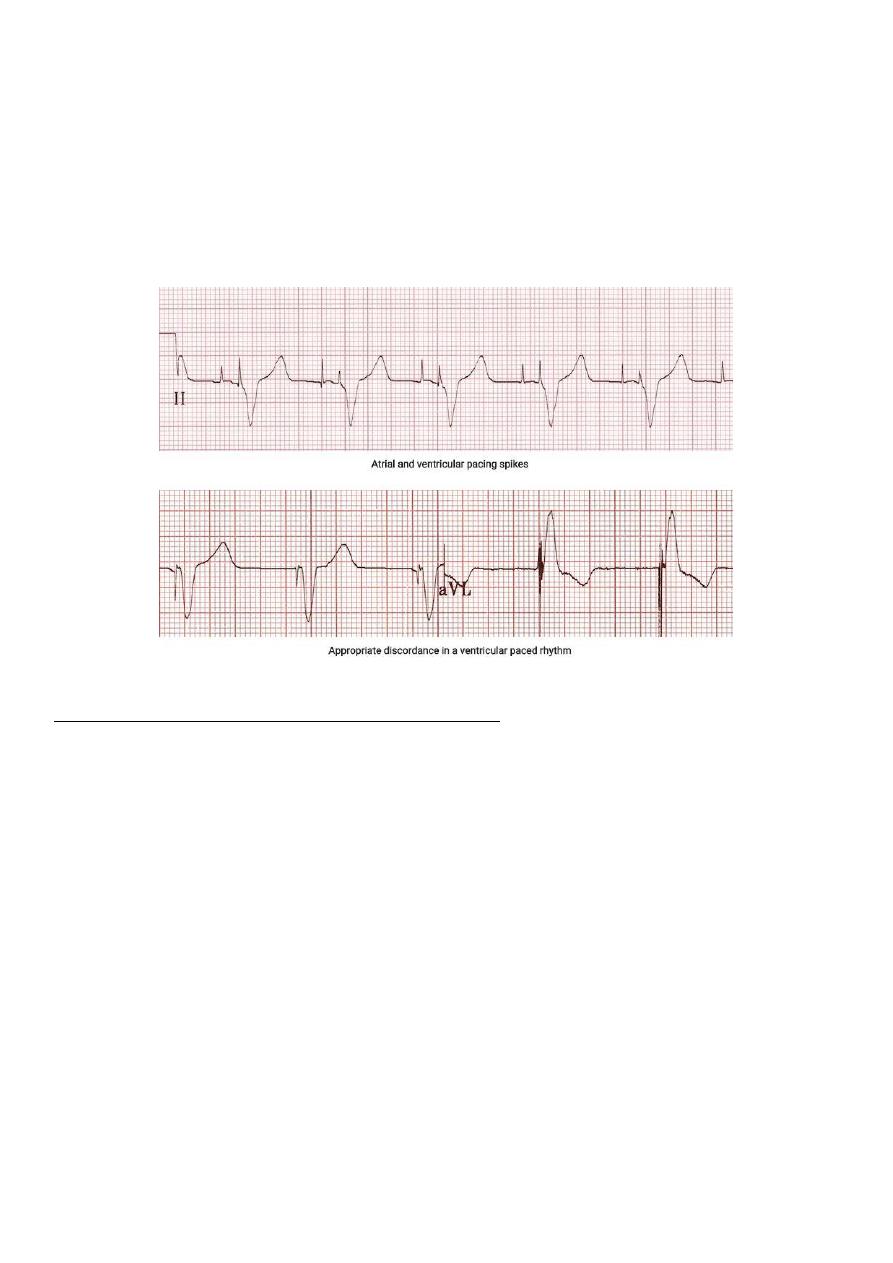
47
o Left epicardial pacing lead placement results in a QRS morphology similar to RBBB.
o ST segments and T waves should be discordant with the QRS complex i.e. the major
terminal portion of the QRS complex is located on the opposite side of the baseline
from the ST segment and T wave.
Dual Chamber Pacing:
o Dependent on areas begin paced.
o May exhibit features of atrial pacing, ventricular pacing or both.
o Pacing spikes may precede only p wave, only QRS complex, or both.
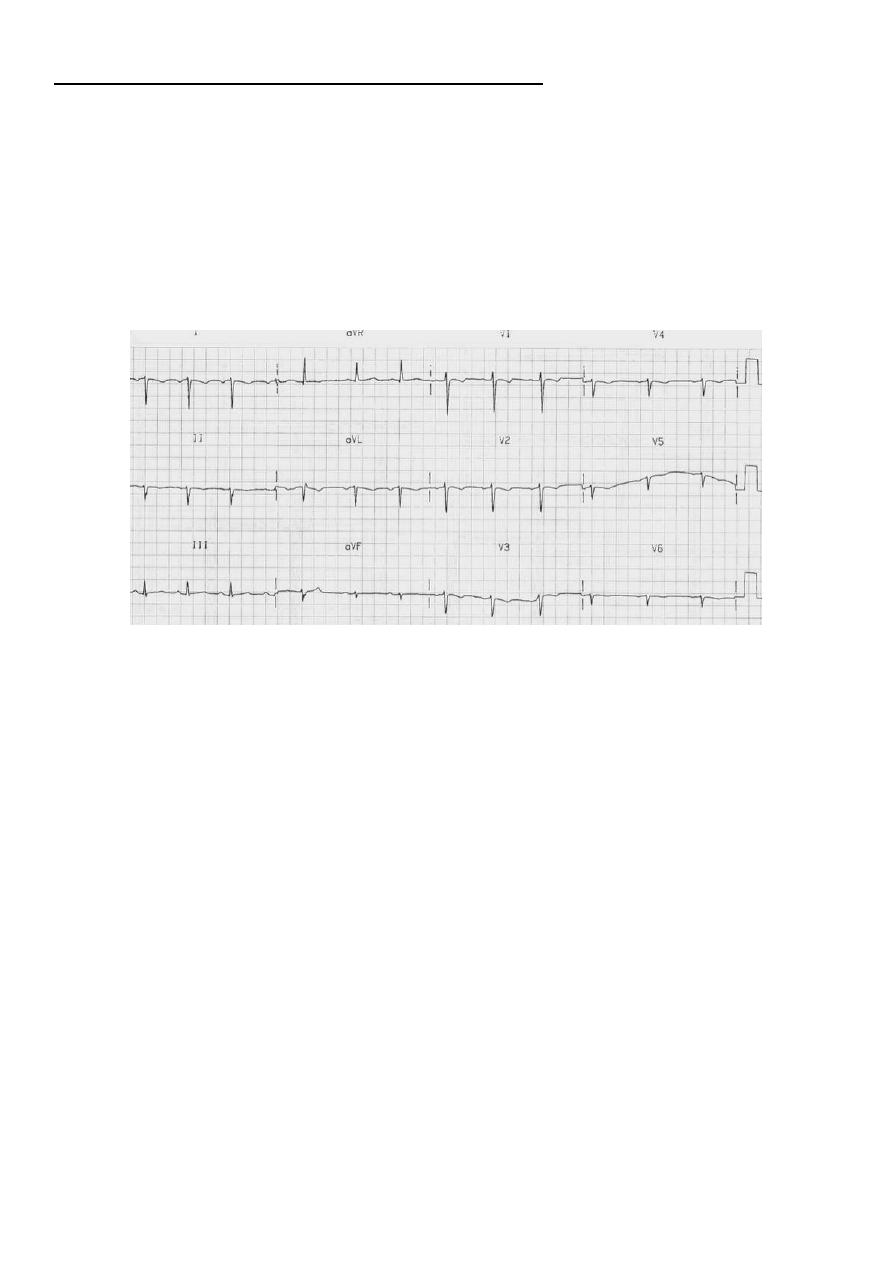
Tenth abnormality: respiratory diseases
#Chronic Obstructive Pulmonary Disease:
The most typical ECG findings in emphysema are:
o Rightward shift of the P wave axis with prominent P waves in the inferior leads and
flattened or inverted P waves in leads I and aVL.
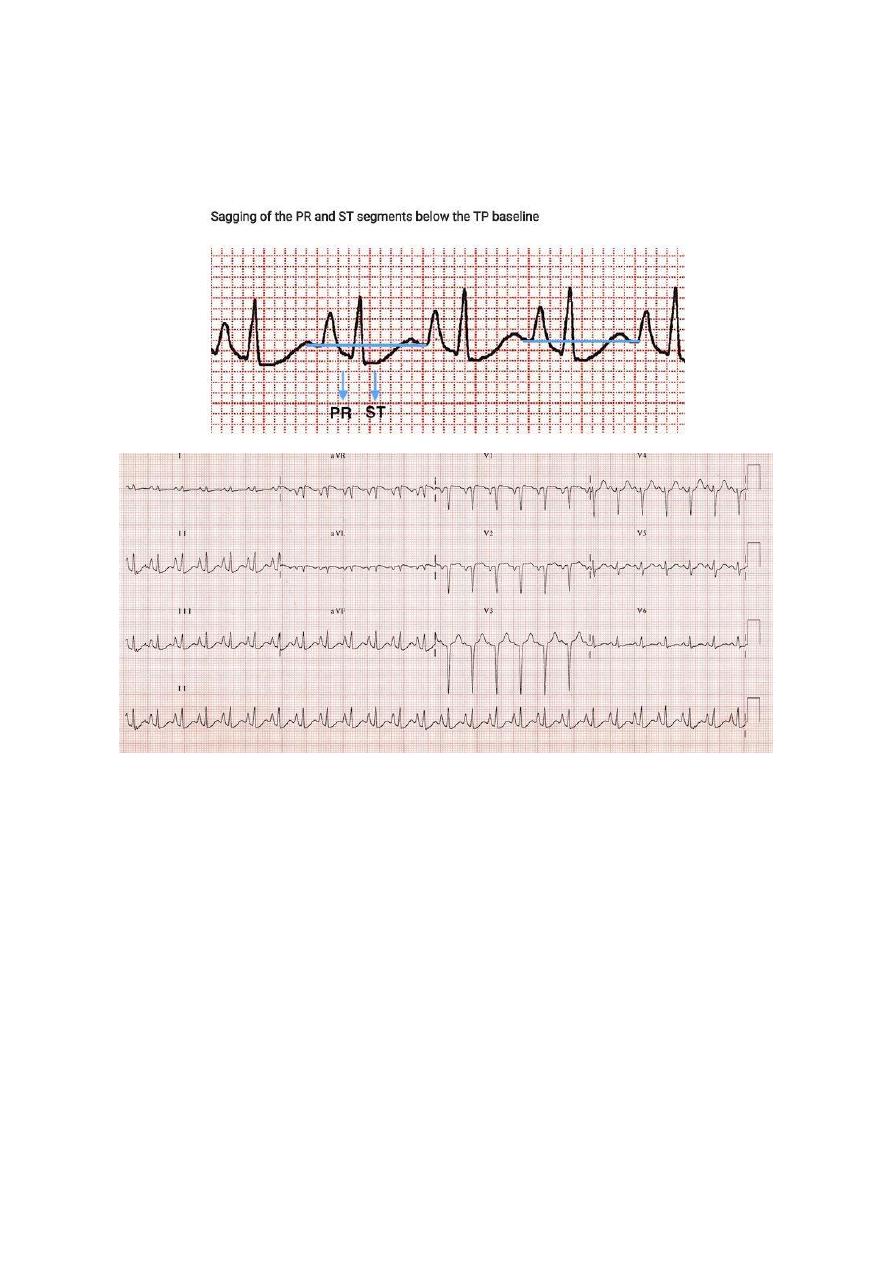
o Rightward shift of the QRS axis towards +90 degrees (vertical axis) or beyond (right
o Exaggerated atrial depolarization causing PR and ST segments that “sag” below the
TP baseline.
o Low voltage QRS complexes, especially in the left precordial leads (V4-6).
o Clockwise rotation of the heart with delayed R/S transition point in the precordial
leads +/- persistent S wave in V6. There may be complete absence of R waves in
leads V1-3 (the “SV1-SV2-SV3″ pattern).
With development of cor pulmonale, the following additional changes are seen:
o Right atrial enlargement (P pulmonale).
o Right ventricular hypertrophy.
48
Other ECG changes that may be seen include:
o Right bundle branch block (usually due to RVH).
o Multifocal atrial tachycardia – a rapid, irregular atrial tachycardia with at least 3
distinct P wave morphologies (associated with increased mortality in patients with
COPD).
#Pulmonary Embolism:
Sinus tachycardia, Complete or incomplete RBBB.
Right ventricular strain pattern – T wave inversions in the right precordial leads (V1-4)
± the inferior leads (II, III, aVF).
Right axis deviation, Extreme right axis deviation may occur, with axis between zero
and -90 degrees, giving the appearance of left axis deviation (“pseudo left axis”).
Dominant R wave in V1 – a manifestation of acute right ventricular dilatation.
Right atrial enlargement (P pulmonale) – peaked P wave in lead II > 2.5 mm in height.
SI QIII TIII pattern – deep S wave in lead I, Q wave in III, inverted T wave in III. This
“classic” finding is neither sensitive nor specific for pulmonary embolism.
Clockwise rotation – shift of the R/S transition point towards V6 with a persistent S
wave in V6 (“pulmonary disease pattern”), implying rotation of the heart due to right
ventricular dilatation.
49
Atrial tachyarrhythmias – AF, flutter, atrial tachycardia.
Non-specific ST segment and T wave changes, including ST elevation and depression.
Eleventh abnormality: metabolic disturbances
#Hypercalcaemia:
Normal serum corrected calcium = 2.1 – 2.6 mmol/L
Causes:
o Hyperparathyroidism (primary and tertiary), Myeloma, Bony metastases.
o Paraneoplastic syndromes, Milk-alkali syndrome, Sarcoidosis, Excess vitamin D.
ECG Changes:
o Bizarre-looking QRS complexes.
o Very short QT interval.
o J waves = notching of the terminal QRS, best seen in lead V1.
51
#Hypocalcaemia:
Normal serum corrected calcium = 2.1 – 2.6 mmol/L
Causes:
o Hypoparathyroidism, Vitamin D deficiency, Acute pancreatitis,
Hyperphosphataemia, Hypomagnesaemia, Diuretics (frusemide).
o Pseudohypoparathyroidism, Congenital disorders (e.g. DiGeorge syndrome), Critical
illness (e.g. sepsis), Factitious (e.g. EDTA blood tube contamination).
ECG Changes:
o Hypocalcaemia causes QTc prolongation primarily by prolonging the ST segment.
o The T wave is typically left unchanged.
o Dysrhythmias are uncommon, although atrial fibrillation has been reported.
o Torsades de pointes may occur, but is much less common than
with hypokalaemia or hypomagnesaemia.
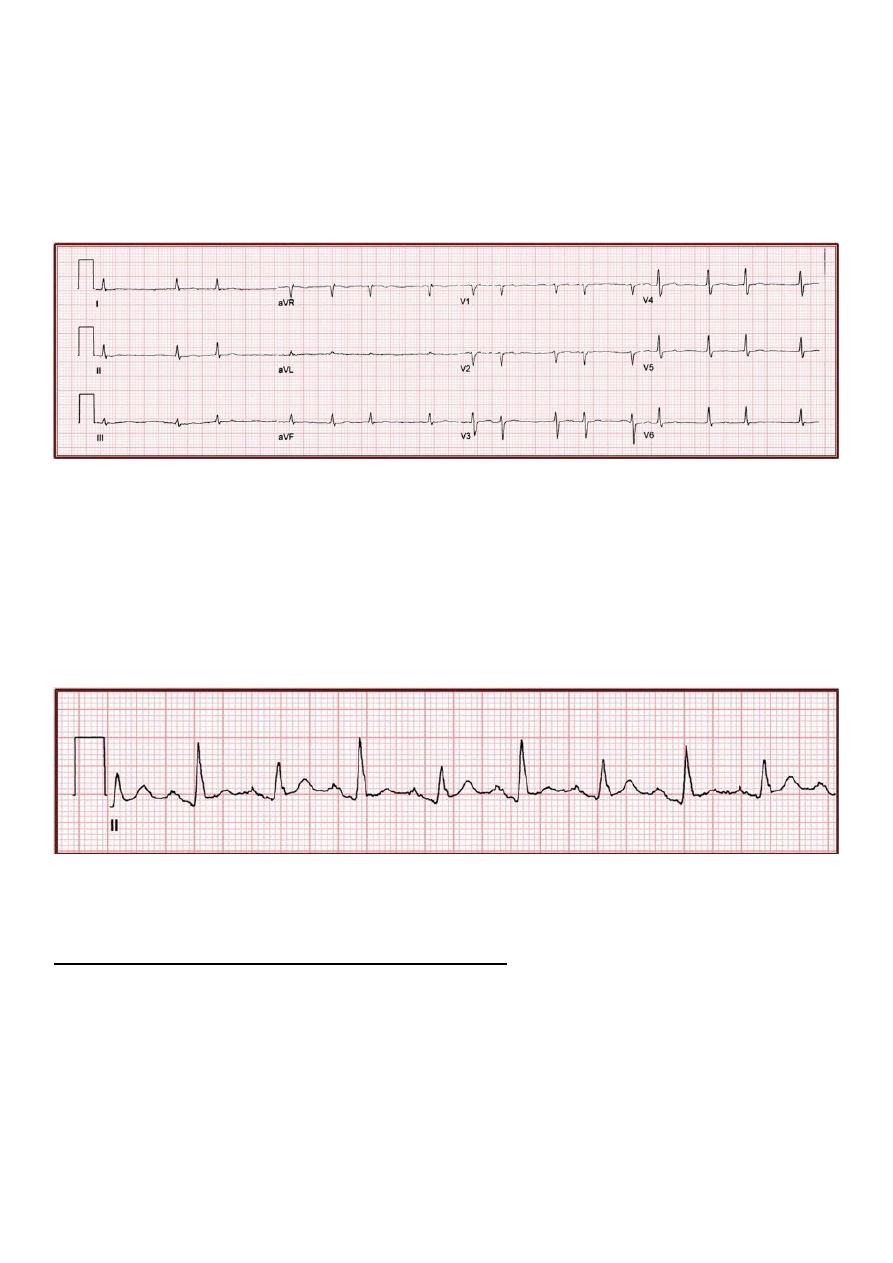
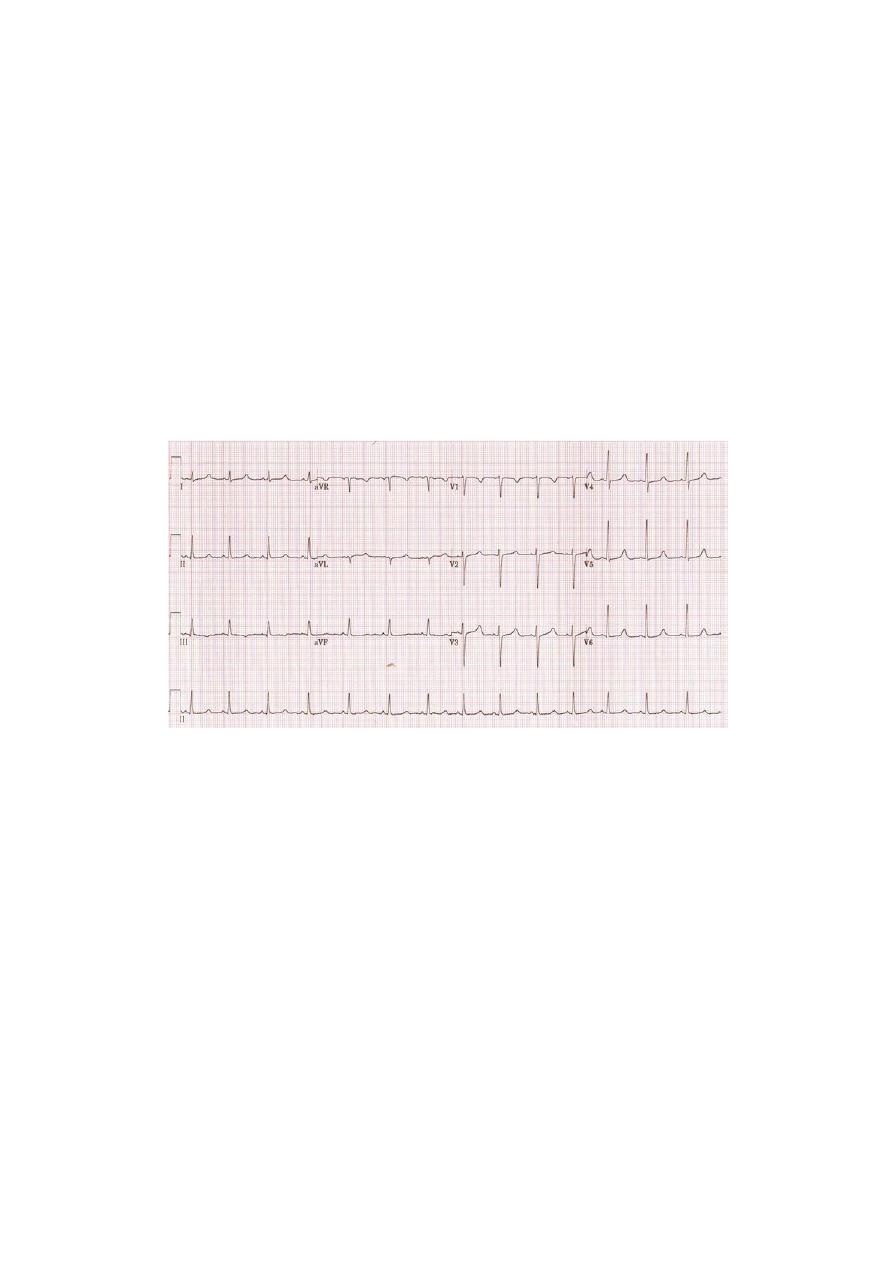
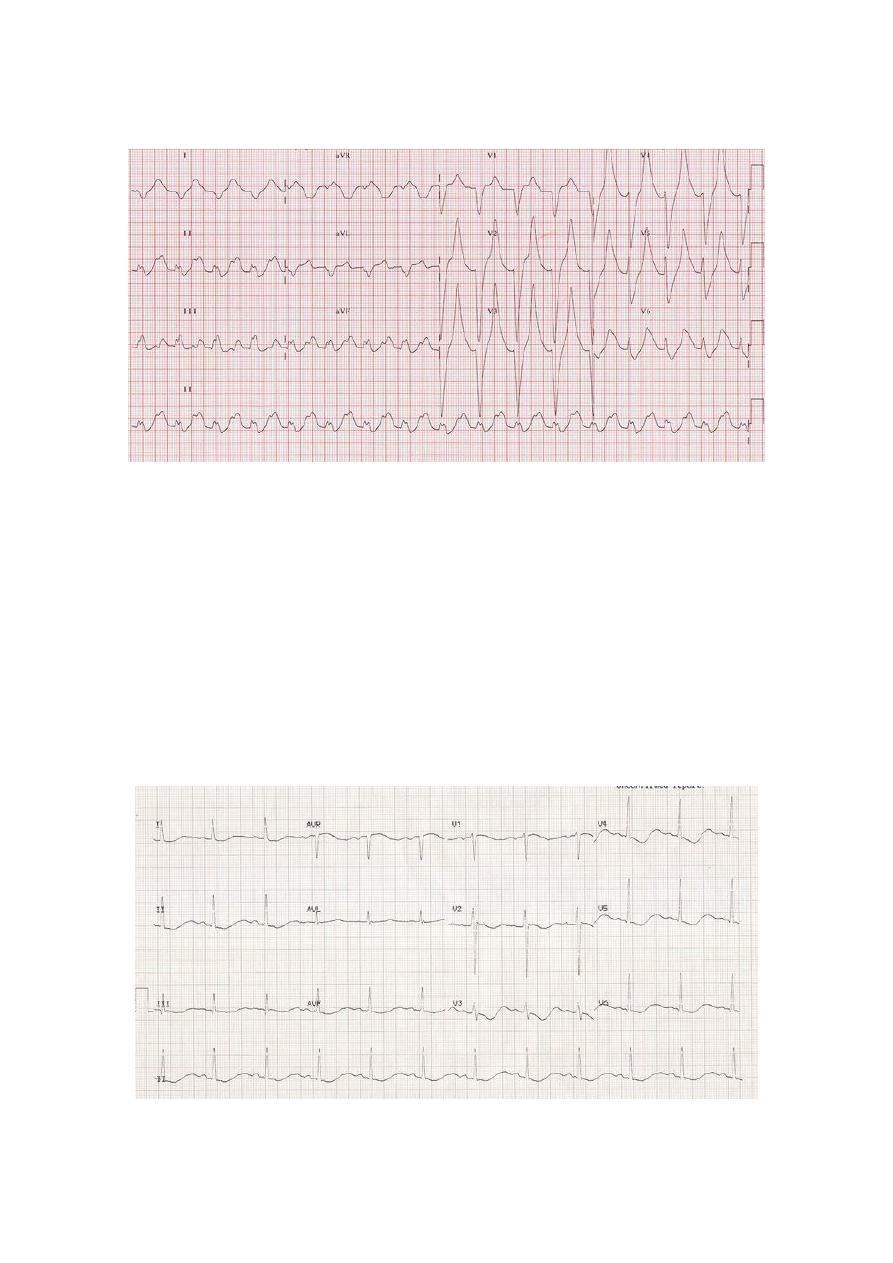
#Hyperkalemia:
Hyperkalemia is defined as a potassium level > 5.5 mEq/L.
Serum potassium > 5.5 mEq/L is associated with repolarization abnormalities:
o Peaked T waves (usually the earliest sign of hyperkalemia)
Serum potassium > 6.5 mEq/L is associated with progressive paralysis of the atria:
o P wave widens and flattens
o PR segment lengthens
o P waves eventually disappear
Serum potassium > 7.0 mEq/L is associated with conduction abnormalities and
bradycardia:
o Prolonged QRS interval with bizarre QRS morphology
o High-grade AV block with slow junctional and ventricular escape rhythms
o Any kind of conduction block (bundle branch blocks, fascicular blocks)
o Sinus bradycardia or slow AF
o Development of a sine wave appearance (a pre-terminal rhythm)
Serum potassium level of > 9.0 mEq/L causes cardiac arrest due to:
51
o Asystole
o Ventricular fibrillation
o PEA with bizarre, wide complex rhythm
#Hypokalemia:
Hypokalemia is defined as a potassium level < 3.5 mmol/L
ECG Changes:
o Increased amplitude and width of the P wave
o Prolongation of the PR interval
o T wave flattening and inversion
o ST depression
o Prominent U waves (best seen in the precordial leads)
o Apparent long QT interval due to fusion of the T and U waves (= long QU interval)
52
#Hypomagnesaemia:
Normal serum magnesium = 0.8 – 1.0 mmol/L.
ECG Changes:
o Prolonged QTc.
o Atrial and ventricular ectopy, atrial tachyarrhythmias and torsades de pointes are
seen in the context of hypomagnesaemia.
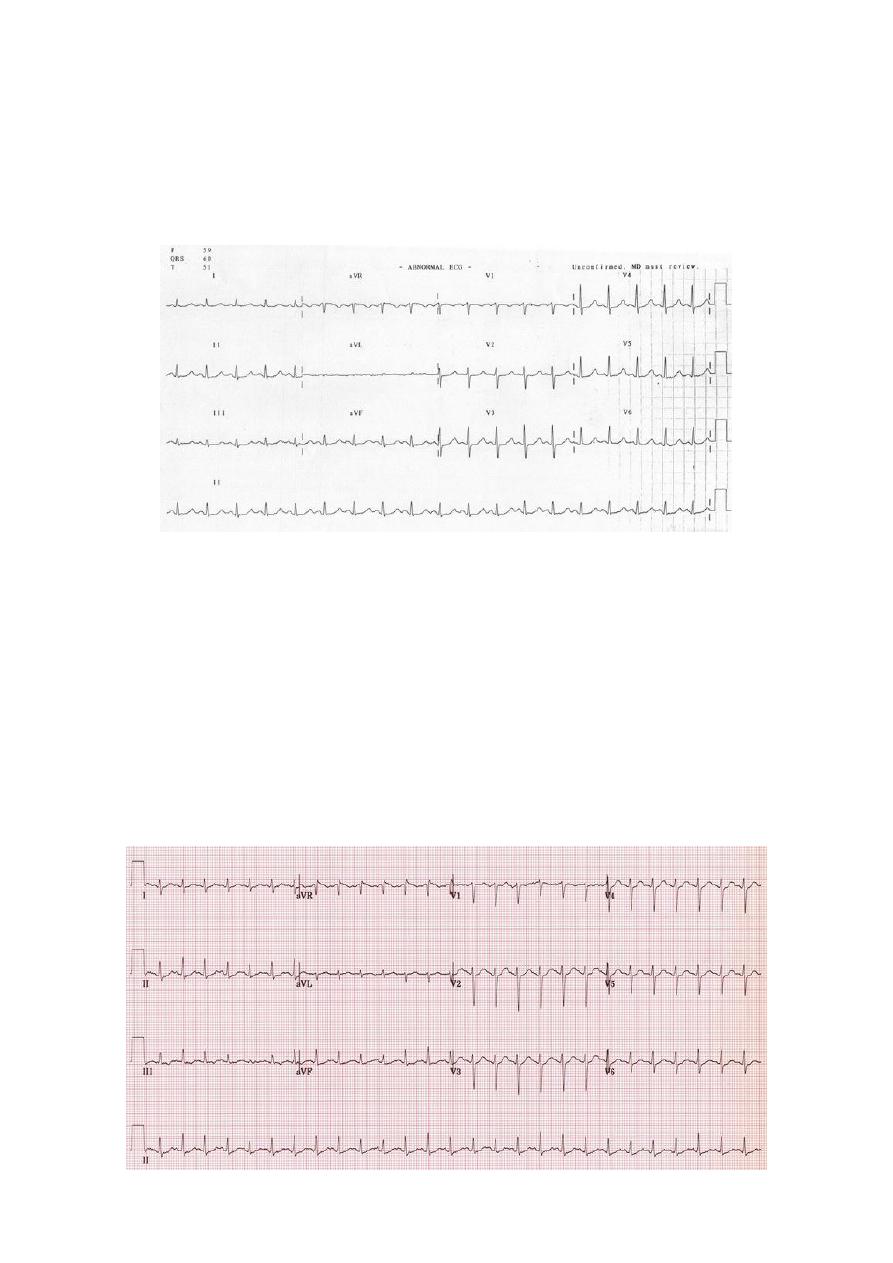
#Hyperthyroidism:
ECG Changes:
o Sinus tachycardia
o Atrial fibrillation with rapid ventricular response.
o High left-ventricular voltage “voltage criteria” for LVH without evidence of LV
strain.
o Supraventricular arrhythmias.
o Non-specific ST and T wave changes.
o Ventricular extrasystoles.
53
#Hypothyroidism:
Severe hypothyroidism (myxoedema) causes a triad of:
o Bradycardia.
o Low QRS voltage.
o Widespread T-wave inversions (usually without ST deviation).
Other ECG changes that may be seen include:
o QT prolongation.
o First degree AV block.
o Interventricular conduction delay.
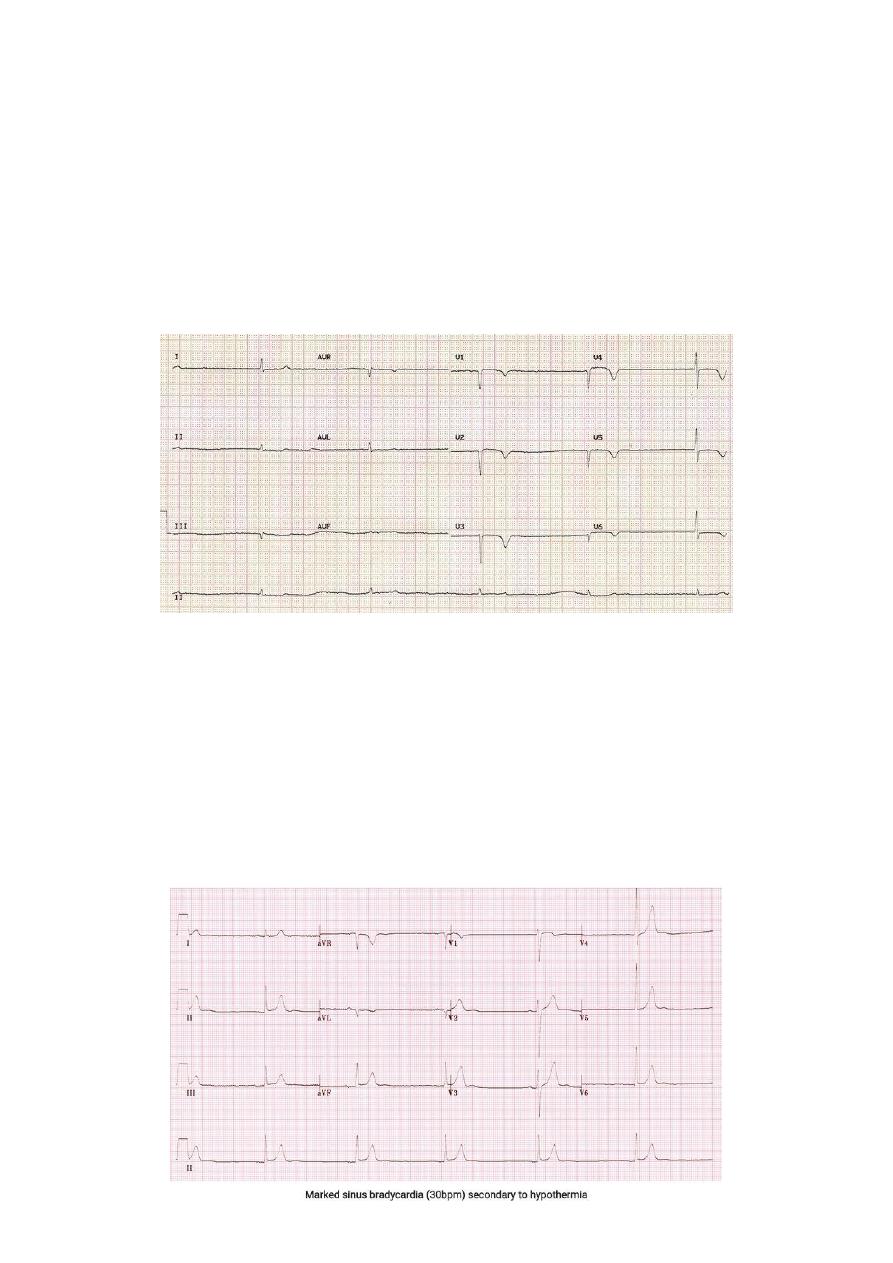
#Hypothermia:
Hypothermia is defined as a core body temperature of < 35 degrees centigrade.
ECG Changes:
o Bradyarrhythmias (Sinus bradycardia, atrial fibrillation with slow ventricular
response, slow junctional rhythms, varying degrees of AV block).
o Osborne Waves (= J waves), Prolonged PR, QRS and QT intervals.
o Shivering artefact (seen as a “fuzziness” of the ECG baseline).
o Ventricular ectopics.
o Cardiac arrest due to VT, VF or asystole.
54
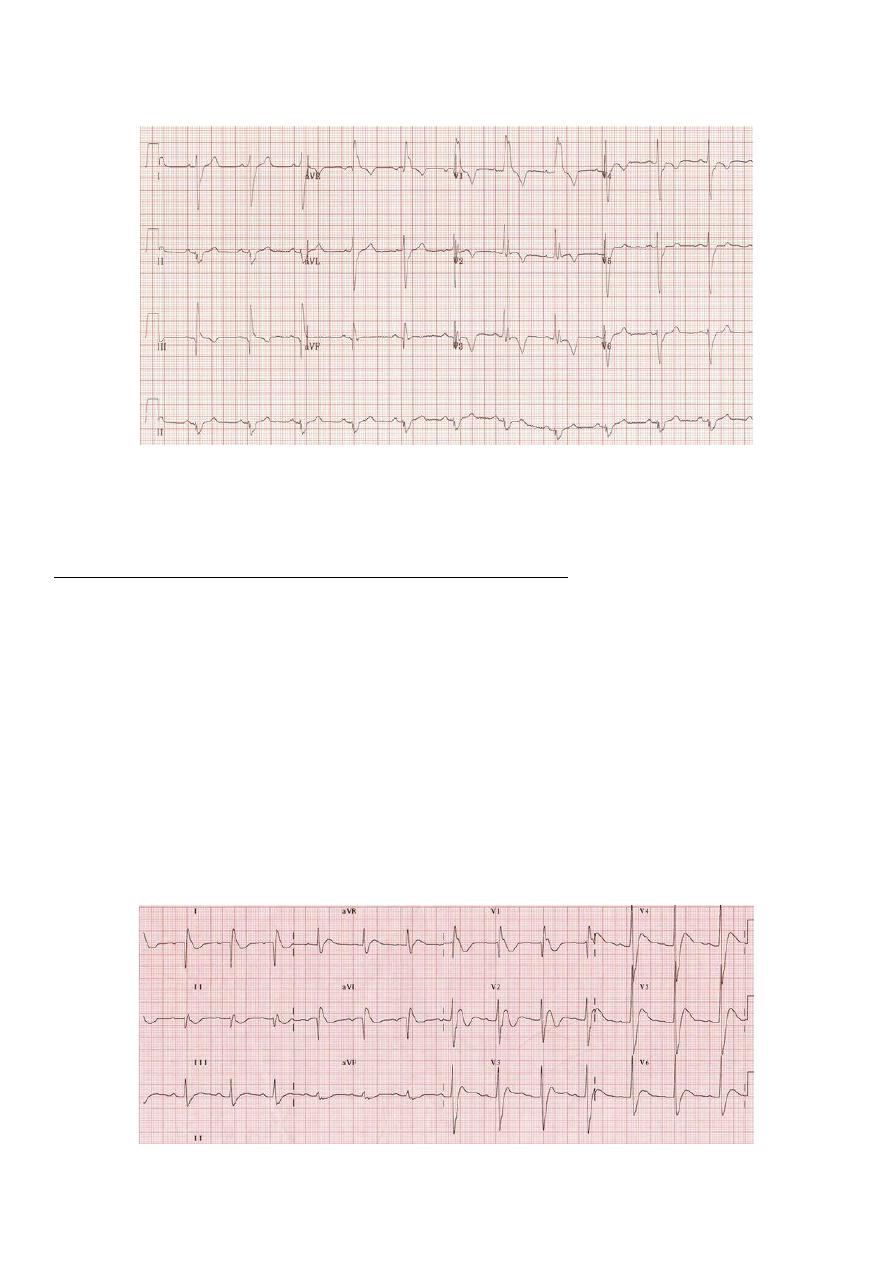
Twelfth abnormality: drugs toxicity
#Beta-blocker & Calcium-channel blocker toxicity:
Beta-blockers: Atenolol, metoprolol, propranolol, sotalol.
Cardioselective calcium-channel blockers: Verapamil and diltiazem.
Effects on the ECG:
o Sinus bradycardia.
o 1st, 2nd and 3rd degree AV block.
o Junctional bradycardia (Regular rhythm at 30 bpm, Narrow QRS complexes, No
visible P waves) shown in the ECG below.
o Ventricular bradycardia.
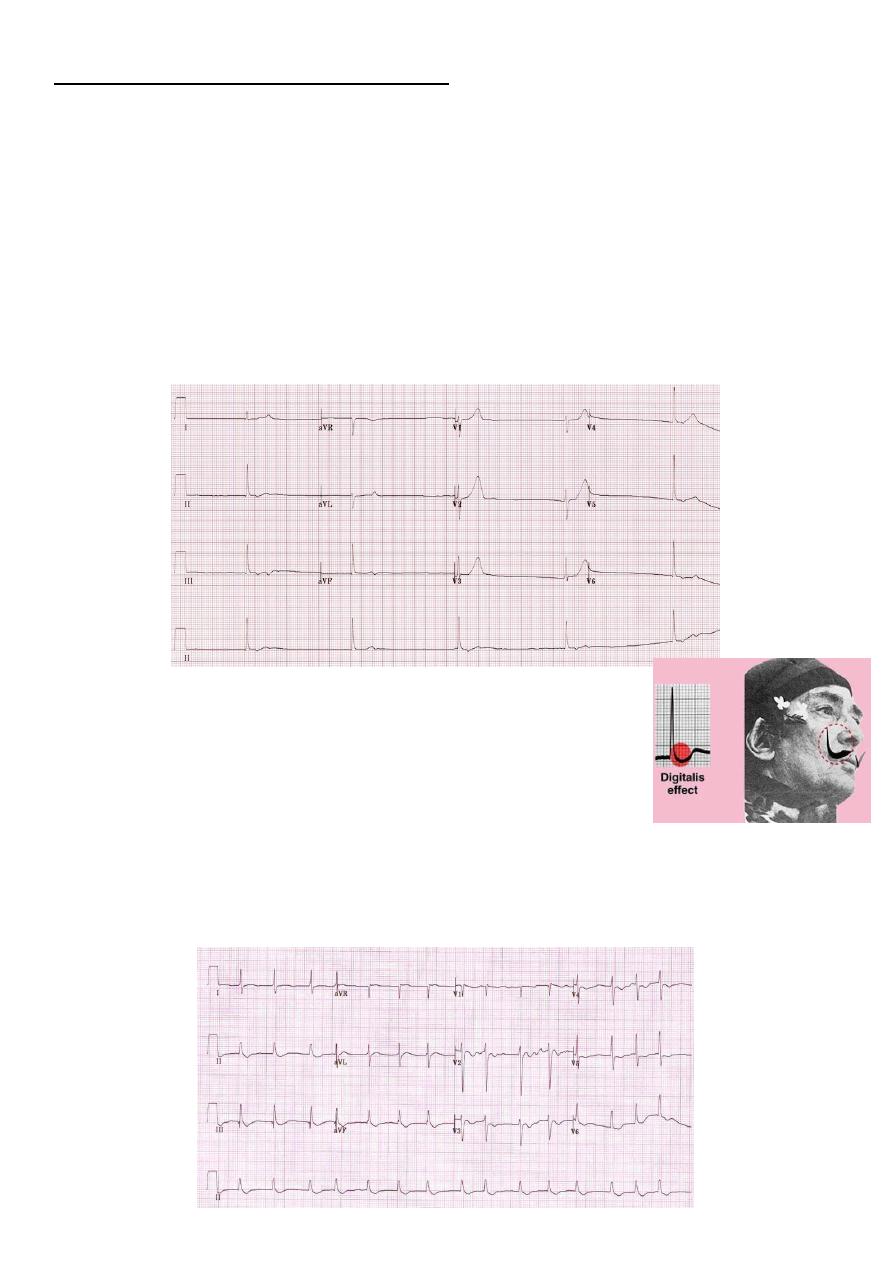
#Digoxin Effect:
Downsloping ST depression with a characteristic “sagging”
appearance shown in the picture.
Flattened, inverted, or biphasic T waves.
Shortened QT interval, Prominent U waves.
Mild PR interval prolongation of up to 240 ms (due to increased vagal tone).
Peaking of the terminal portion of the T waves.
J point depression (usually in leads with tall R waves).
Digoxin toxicity cause multitude of dysrhythmias, any type of AV block.
55
Part3:
Systematic method of ECG interpretation
First step: Assess the rhythm
#Measure the rate:
Determine if the rate is normal, tachycardic, or bradycardic.
For adults, normal resting heart rate is 50-90 bpm (not 60 – 100).
Maximum sinus rate = 220 – patient age in years ((except for athletes)).
A rate of 140-150 bpm suggests possibility of atrial flutter with 2:1 AV block.
#Determine the regularity of the rhythm:
#Determine if QRS complex narrow or wide:
Narrow QRS <120 ms (3 small squares).
Wide QRS >=120 ms (3 small squares).
Etiologies of wide QRS complex BBB, ventricular origin or rhythm, LVH, pacemaker,
drugs (class Ia and Ic antiarrhythmics), Wolff-Parkinson-White pattern, hyperkalemia.
56
#Evaluate the atrial activity:
Are there P waves?
If so, what is their morphology?
o Sinus P waves should be up in I and down in aVR if not
ectopic atrial rhythm.
o Can also look for evidence of atrial enlargement.
If there are no P waves, are there fibrillation (irregular undulations)
or flutter waves (sawtooth)?
#Identify the relationship between atrial &
ventricular activity:
Is the PR interval normal (120-200 ms), short, or
prolonged?
o above 200 ms is indicative for 1
st
degree AV
block
Does the PR interval change?
Is there a 1:1 correspondence between P waves
and QRS complexes?
If not, is there any association between them?
Do the P waves come before or after the QRS
complexes with which they are associated?
Second step: Assess the QRS axis and morphology
#Determine the QRS axis:
Normal axis is from +90 to -30 degree.
Etiologies of right axis deviation (RAD): normal variant in children and young thin
adults, RVH, COPD without RVH, LPFB, lateral wall MI, ectopic ventricular rhythm,
WPW pattern.
Etiologies of left axis deviation (LAD): normal variant in older obese adults, LVH,
elevated diaphragm (ascites, pregnancy), LAFB, inferior wall MI, ectopic ventricular
rhythm, WPW pattern.

57
#Determine the QRS morphology:
Look for pathologic Q waves, usually indicative of a prior MI.
Look for evidence of RVH and LVH.
If the QRS complex is wide, identify whether the cause is RBBB, LBBB, or nonspecific
intraventricualr conduction delay (IVCD).
Look for low voltage. (Causes: obesity, COPD, pleural or pericardial effusion, myocardial
infiltration like amyloidosis or sarcoidosis, hypothyroidism).
Look for electrical alternans, which is indicative of large pericardial effusion (though
not necessarily pericardial tamponade).
Look for evidence of a delta wave (initial shallow upstroke before each QRS complex),
can be present even if the PR interval is > 120 ms. Delta wave is indicative of WPW.
- WPW pattern (Delta waves + wide QRS + short PR interval)
- WPW syndrome (WPW pattern associated with small tachycardias)
Third step: Assess the ST segment, T waves, and QT interval
#Examine the ST segment:
ST elevation is generally only notable when the elevation is >=1 mm in at least 2
anatomically contagious leads.
Etiologies of ST elevation: STEMI, LBBB, LVH, normal variant (early repolarization),
pericarditis, LV aneurysm, vasospasm, severe hyperkalemia, hypothermia, brugada
syndrome, Takotsubo cardiomyopathy (broken heart syndrome).
First four etiologies usually limited to V1-V3.
Etiologies of ST depression: Ischemia, infarction, tachycardia, digoxin, hypokalemia,
RBBB, LBBB, IVCD, RHV/LVH (strain pattern).
#Examine the T waves:
Inverted T waves etiologies: similar to etiologies of ST depression + intracranial
hemorrhage, pericarditis, hypothyroidism.
Peaked T waves suggest hyperkalemia.
Hyperacute T waves unusually prominent T waves may also be indicative of a very
early STEMI.
58
#Measure the QT interval and correct for heart rate
(should be < 1/2 RR interval
:
Prolonged QT etiologies: congenital long QT syndrome, medications, hypocalcemia,
hypothyroidism, hypothermia, hypokalemia.
A very short QT interval (QTc <350 ms) etiologies: congenital short QT syndrome,
hypercalcaemia.
The 5 cardinal rules for ECG interpretation
#Rule1: never trust the computer:
The algorithm is not reliable enough to trust the people's life on.
The computer calculated heart rate is correct > 99.9% of the time.
If the computer's overall impression is "normal ECG", then ECG is highly likely to be
normal, however, the converse is not true (plenty of normal ECGs are interpreted as
"abnormal" by the computer).
#Rule2: always examine the ECG systematically:
Assess the rhythm.
Assess the QRS axis and morphology.
Examine ST segment and T wave morphology and QT interval.
#Rule3: synthesize individual ECG findings into a unifying ECG impression, with
strong consideration of the clinical context.
#Rule4: compare current ECG to the patient's previous ECGs (if available):
Most critical in evaluating ischemia and/or infraction.
#Rule5: incorporate the ECG impression into the generation of the differential
diagnosis:
The ECG is the functional gold standard for some diagnosis like most arrhythmias, BBB.
The ECG is only another piece of imperfect data for other diagnosis like chamber
enlargement, MI, electrolyte abnormalities.