
1
Pediatric E.C.G
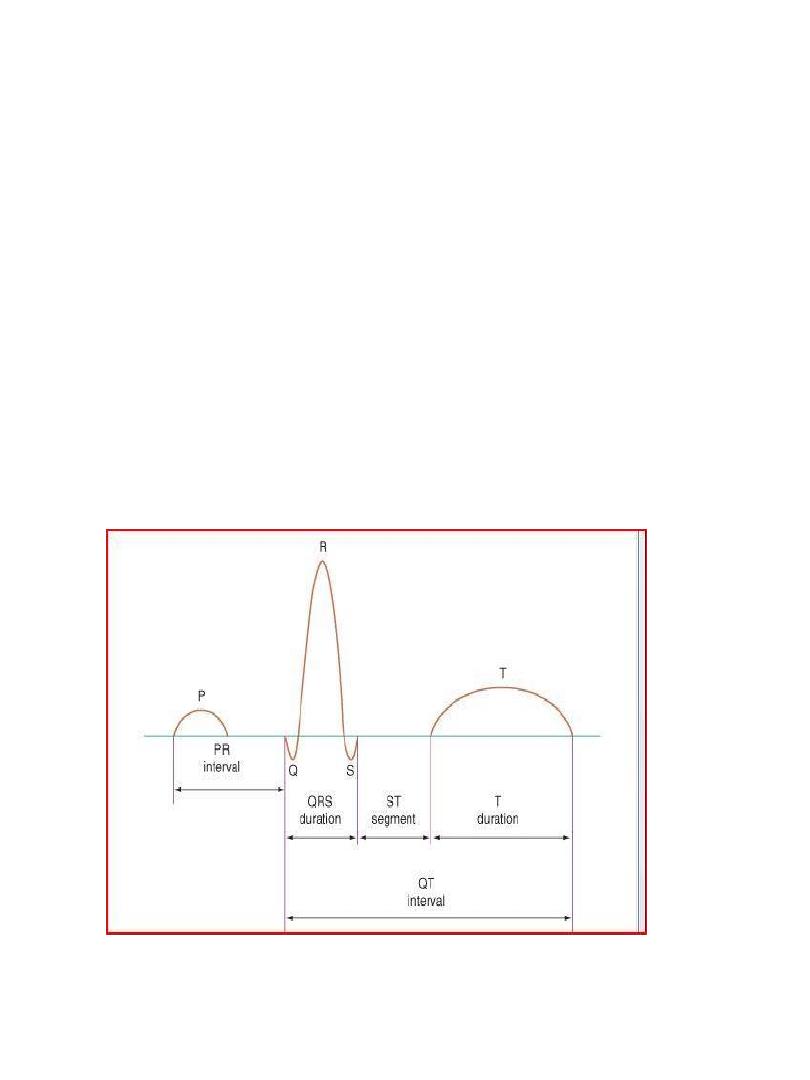
The electrocardiogram should be read systematically
Heart rate (300/no.of large squares between R-
R)OR(1500/NO.of small squares between R-R)
P wave axis (the P wave should be upright in leads I
and aVF and inverted in lead Avr)Normally less than
2-3 small squares (0.08-0.12 sec) wide and tall
Rhythm
QRS axis (In a newborn, the mean QRS frontal-plane
axis normally lies in the range of +110 to +180
degrees. The right-sided chest leads reveal a larger
positive (R) than negative (S) wave and may do so for
months or years because the right ventricle remains
relatively thick throughout infancy-Over the years,
the QRS axis gradually shifts leftward, and the right
ventricular forces slowly regress. Leads V
1
, V
3
R, and
V
4
R display a prominent R wave until 6 mo to 8 yr of
age)
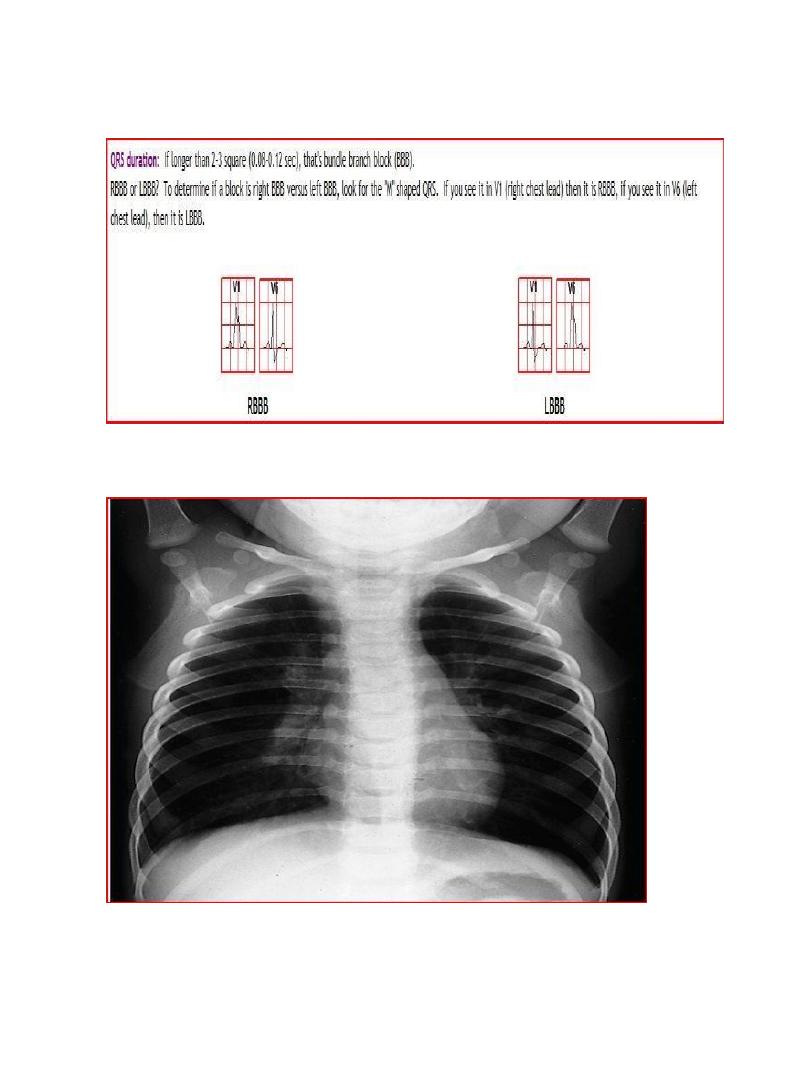
Intervals PR, QRS, QT/QTc (PR 3-5 SMALL
SEQUARES)(QRS If longer than 2-3 square (0.08-0.12
sec), that's bundle branch block (BBB).
P wave amplitude and duration (RA and LA
enlargement)
QRS amplitude, R/S ratio, Q waves (RVH – LVH) • ST
segments and T wave
2
T wave inversion:
Infants older than 48 hours of age should have
inverted T waves in the right praecordial leads. These
findings persist throughout childhood with inversion
to V4 being accepted as normal. There is a
progressive change to an upright T wave across the
praecordial leads from left to right as the child grows
older. Until 8 years of age an upright T wave in V1 is
considered a sign of right ventricular hypertrophy.
Many children will show persistence of an inverted T
wave in V1 until their late teens
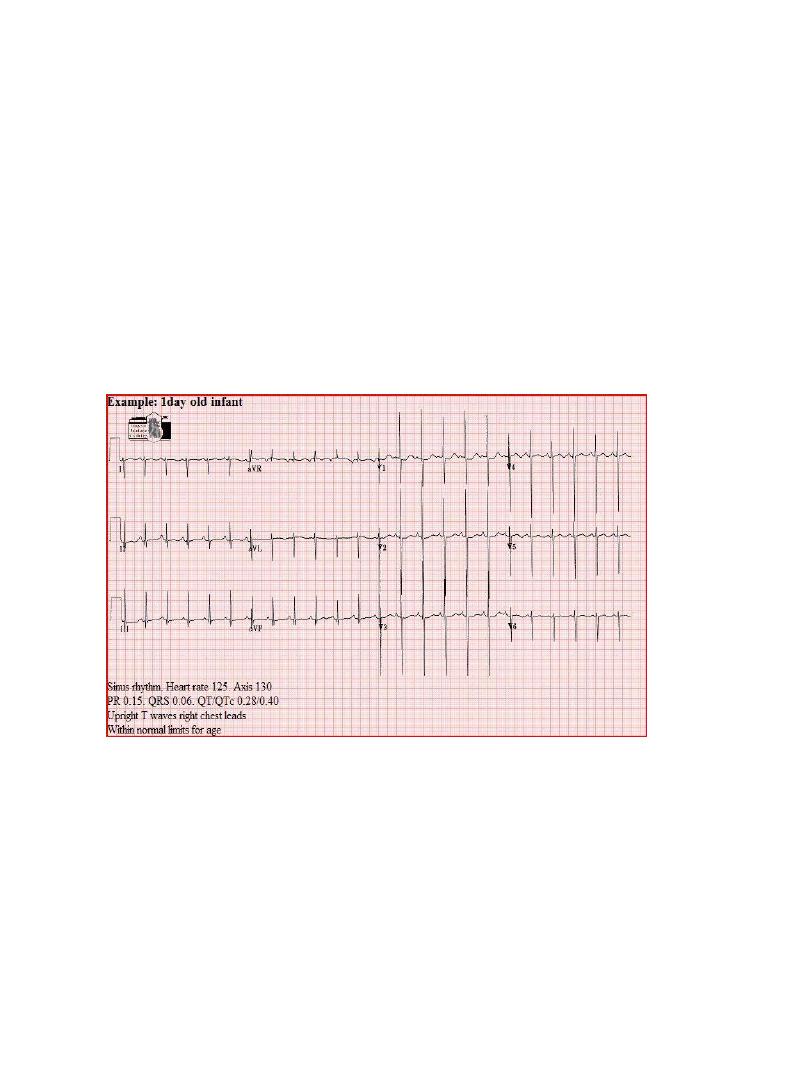
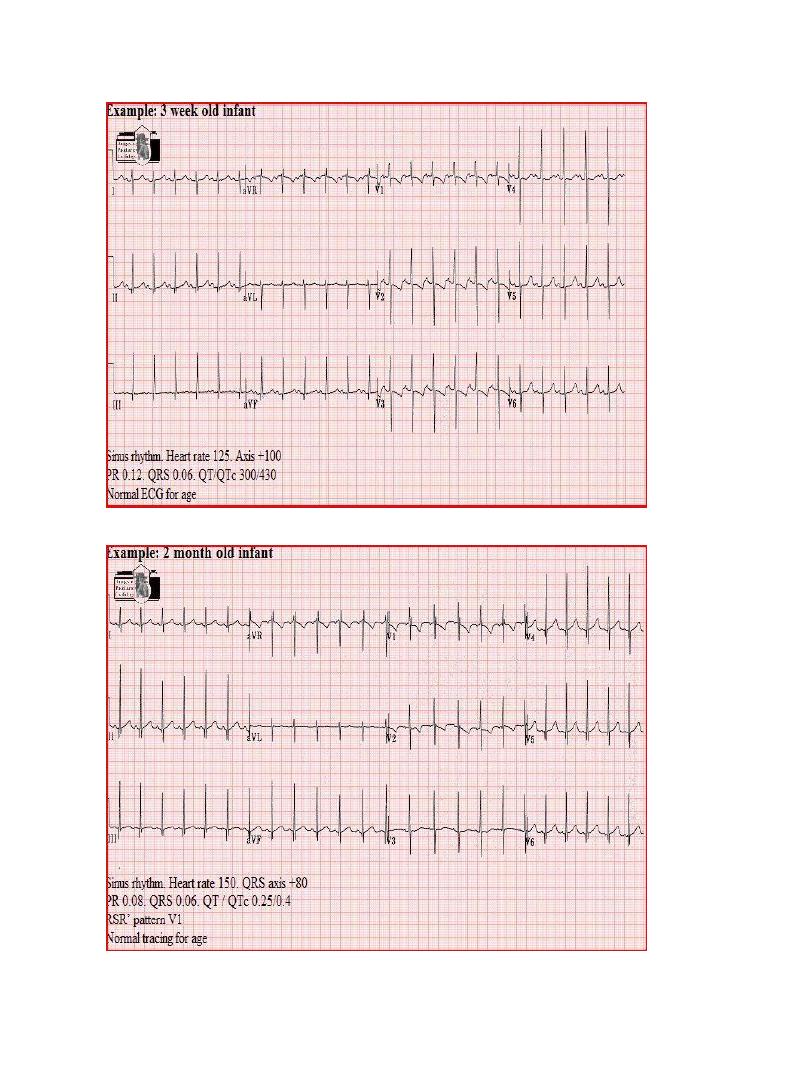
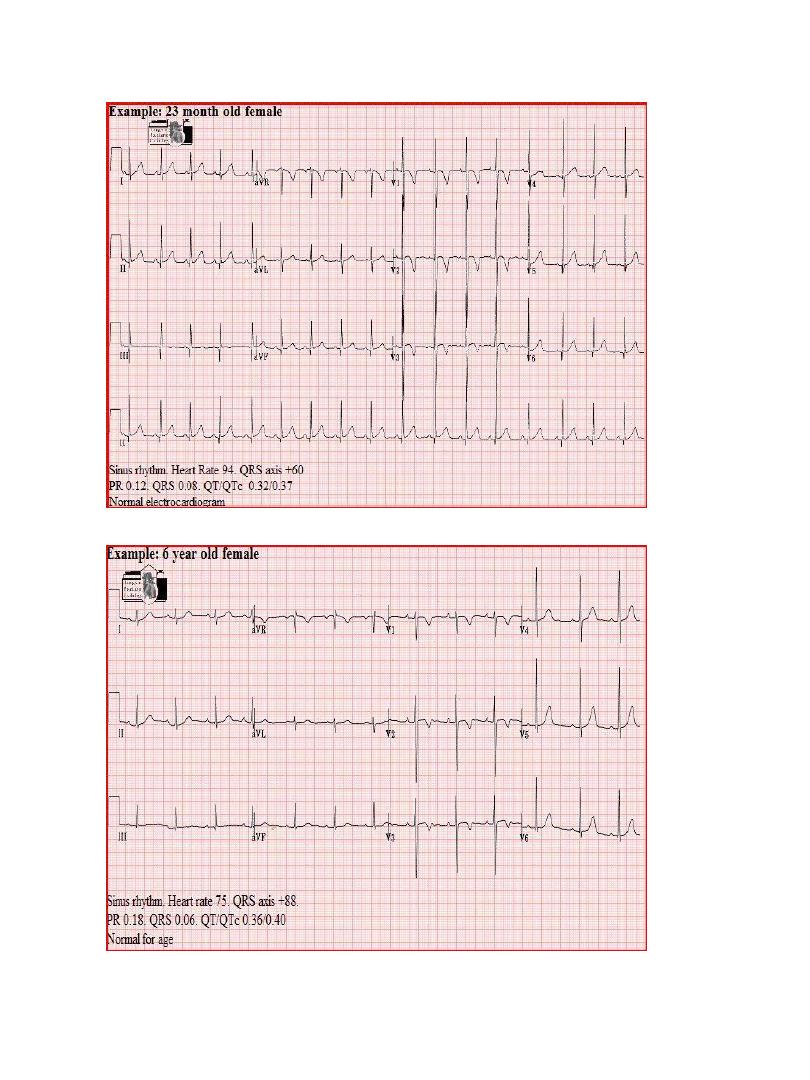
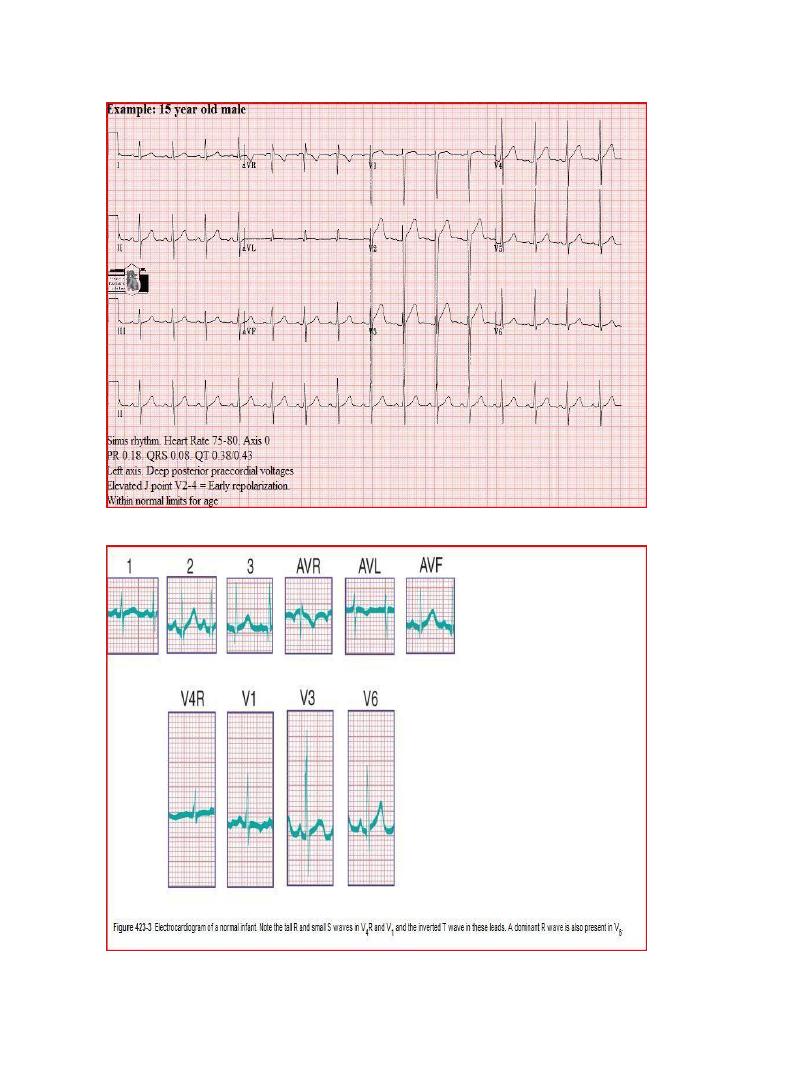
Normal tracings
3
Examples of normal tracings for the different age
groups follow, preceded by a general description of
the characteristics of that age group.
4
5
6
7
8
9
10
11
12
13
14
15
16
17
18
19
20
21
22
23
24
25
26
27
28
29
30
31
32
33
34