CARDIOVASCULAR SYSTEM
Dr. Ahmed Moyed HusseinCABMS(Cardiol) - FIBMS(Cardiol)
CABMS(Med) - FIBMS(Med)
M.B.Ch.B
Objectives:
Review of most used investigations for CVS.Indication and advantages of each investigation.
For more presentations www.medicalppt.blogspot.com
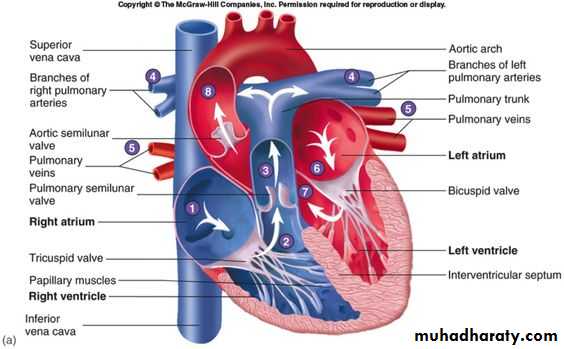
Cardiac Anatomy
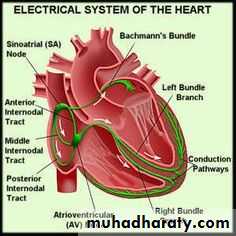
Conductive System
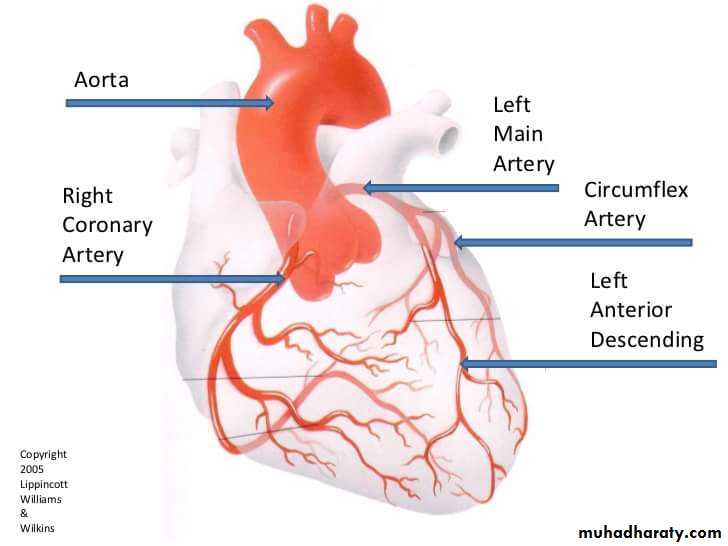
Blood Supply of The Heart
INVESTIGATIONS IN CARDIOVASCULAR DISEASE
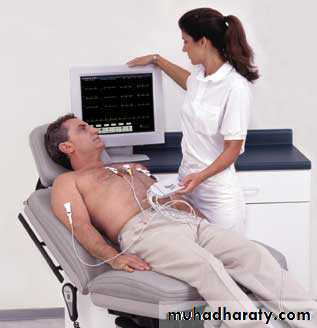
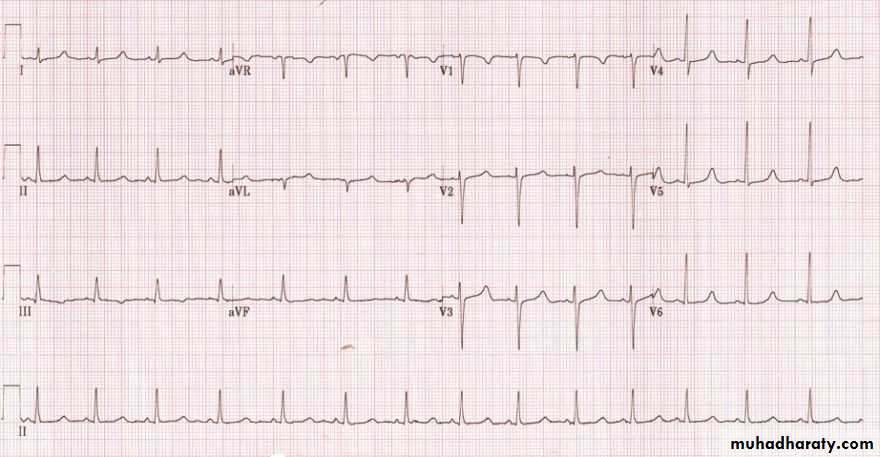
What is an ECG?The electrocardiogram (EKG) is a representation of the electrical events of the cardiac cycle.
Each event has a distinctive waveform
the study of waveform can lead to greater insight into a patient’s cardiac pathophysiology.
With EKGs we can identify
ArrhythmiasMyocardial ischemia and infarction
Pericarditis
Chamber hypertrophy
Electrolyte disturbances (i.e. hyperkalemia, hypokalemia)
Drug toxicity (i.e. digoxin and drugs which prolong the QT interval)
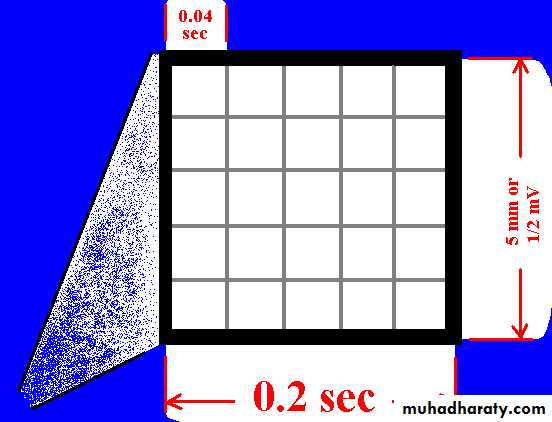
The ECG Paper
HorizontallyOne small box - 0.04 s
One large box - 0.20 s
Vertically
One large box - 0.5 mV
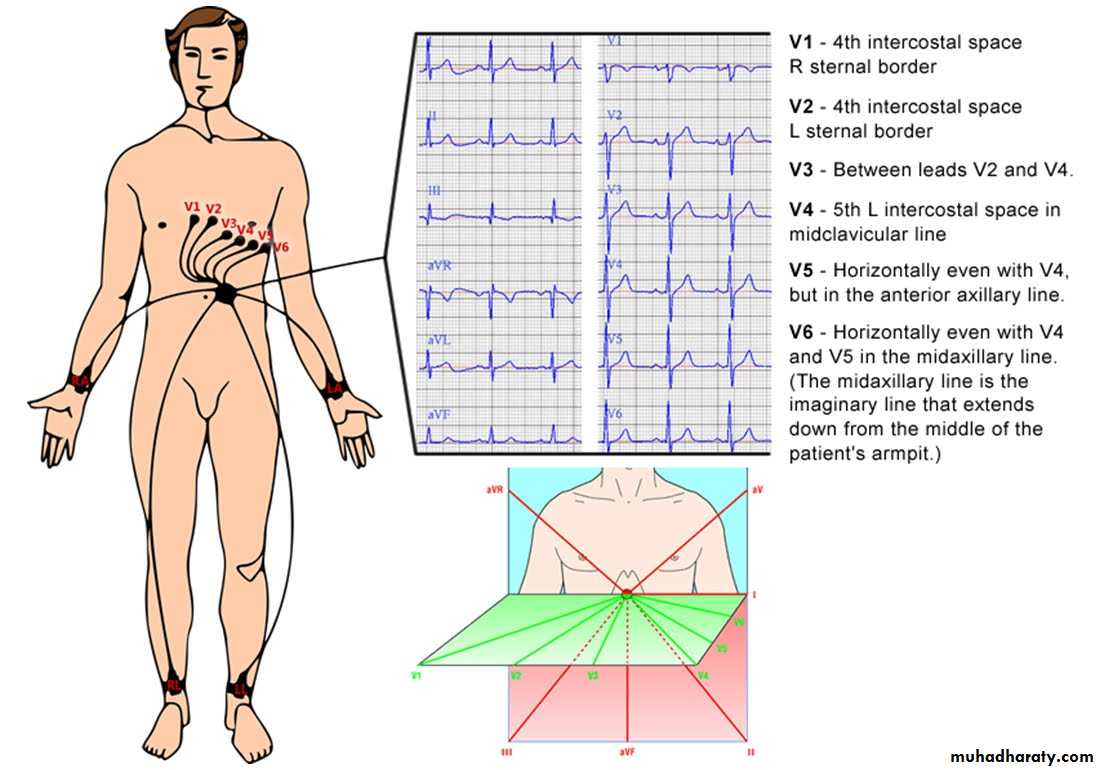
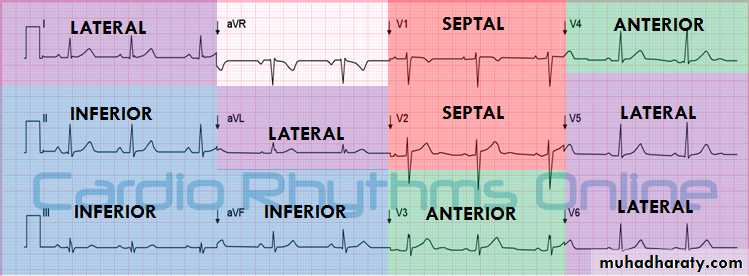
Arrangement of Leads on the EKG
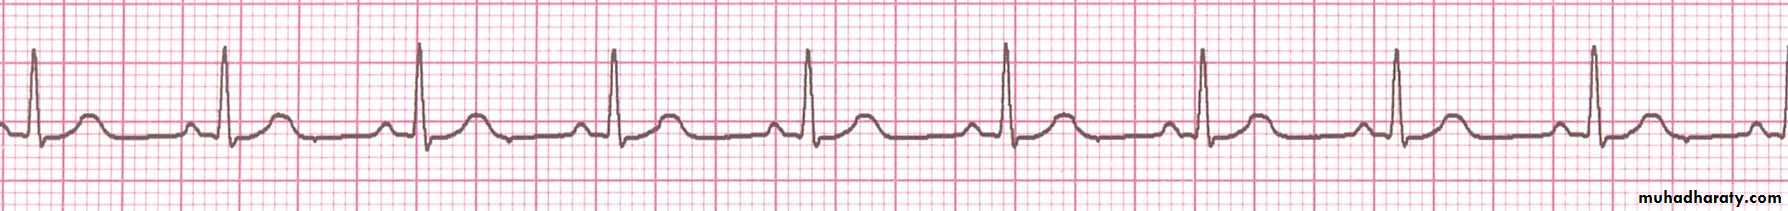
P wave represent atrial contraction
When examining a rhythm strip for P waves, ask yourself:Are P waves present?
Absent P wave occur in atrial fibrillation
Do the P waves have a normal configuration?
Wide P wave: Lt atrial dilatation
Peaked P wave: Rt atrial dilatation
Do all the P waves have a similar size and shape?
Is there one P wave for every QRS complex?
PR interval
• To measure the PR interval, count the small squares between the start of the P wave and the start of the QRS complex; then multiply the number of squares by 0.04 second.
• Normal PR= 0.12- 0.2 sec
• Abnormalities of PR interval:
• Short: WPW syndrome
• Long: heart block
• Is the PR interval constant?
The QRS complex
• It represent ventricular depolarization
• Normal QRS=0.8 - 0.12 sec
• Does the duration of the QRS complex fall within normal limits?
• Are all QRS complexes the same size and shape? (If not, measure each one and describe them individually.)
• Does a QRS complex appear after every P wave?
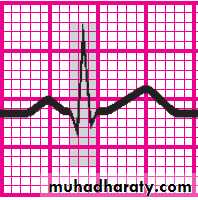
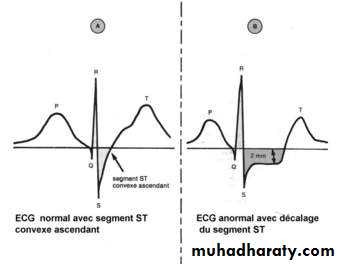
ST Segment
• ST segments abnormality:• Are the ST segments elevated?
• Are the ST segments depressed?
• Causes of ST segment elevation:
• acute coronary syndrome(STEMI)
• left ventricular aneurysm
• Prinzmetal’s (vasospastic) angina
• Pericarditis
• high take-off (early repolarization)
• left bundle branch block
• Brugada syndrome.
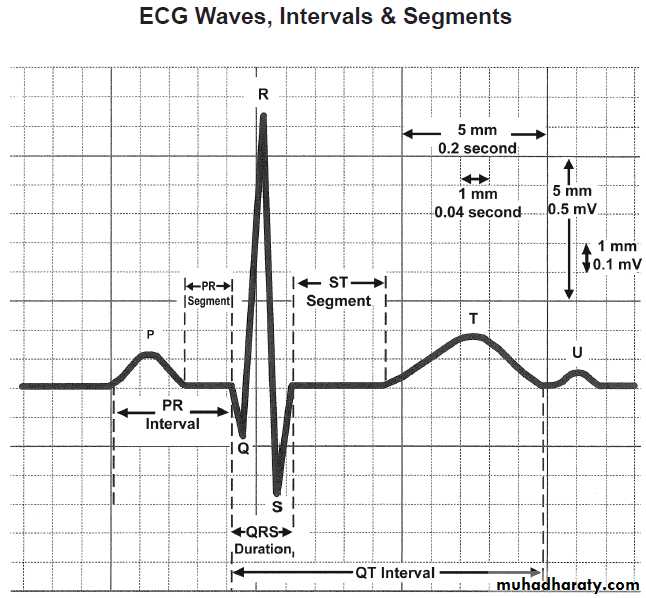
Acute pericarditis
Wide spread ST segment elevation (concave )
PR depressionLBBB
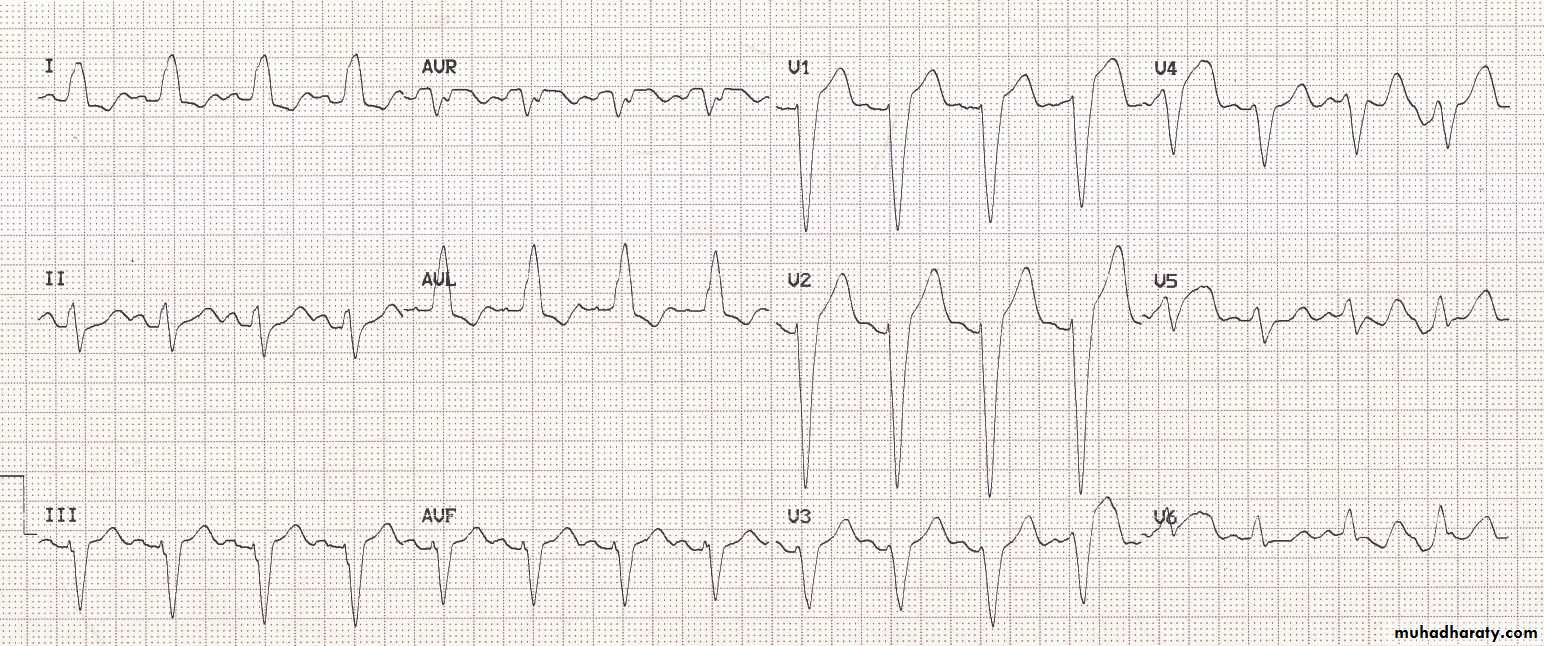
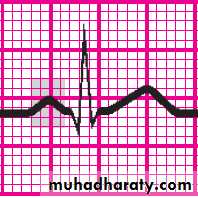
ST elevation with negative QRS
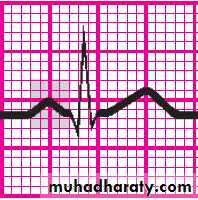
ST depression with positive QRSThe T wave
• Examine the T waves on the ECG strip. Then ask yourself:• Are T waves present?
• Do all of the T waves have a normal shape?
• Could a P wave be hidden in a T wave?
• Do all T waves have a normal amplitude?
• Do the T waves have the same deflection as the QRS complexes?
•
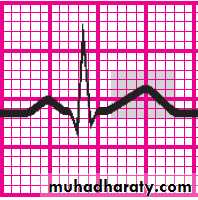
The QT interval
• the duration of the QT interval fall within normal limits, 0.36 to 0.44 second?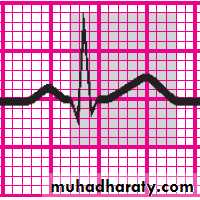
Long QT
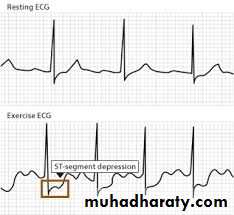
Exercise (stress) ECG
Exercise electrocardiography is used to detect myocardial ischaemia during physical stress and is helpful in the diagnosis of coronary artery disease. A 12-lead ECG is recorded during exercise on a treadmill or bicycle ergometerFor more presentations www.medicalppt.blogspot.com
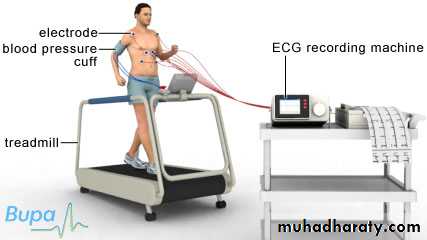
Exercise (stress) ECG
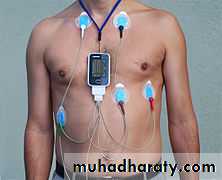
Ambulatory ECG(Holter)
Continuous (ambulatory) ECG recordings can be obtained using a portable digital recorder.These devices usually provide limb lead ECG recordings only, and can record for between 1 and 7 days.
Ambulatory ECG recording is principally used in the investigation of patients with suspected arrhythmia , such as those with intermittent palpitation, dizziness or syncopy
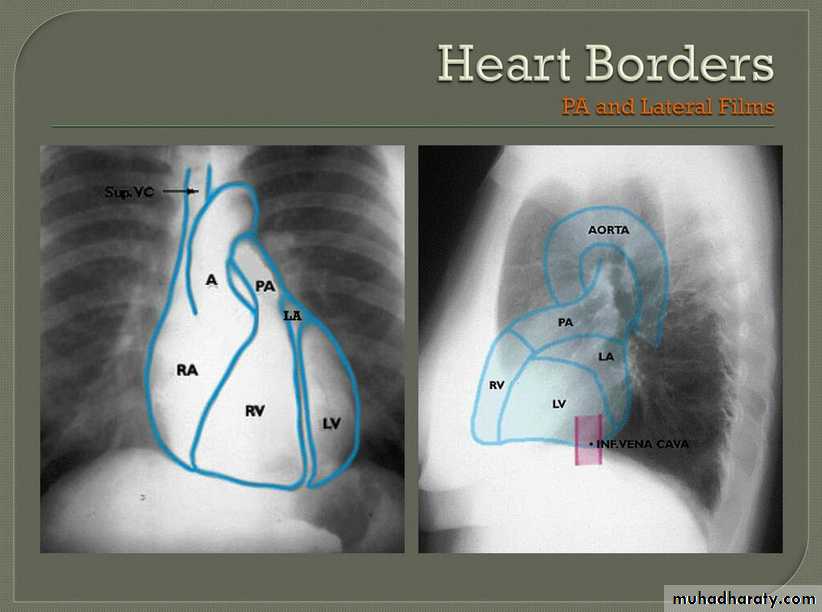
Chest X-ray
This is useful for determining the size and shape of the heart, and the state of the pulmonary blood vessels and lung fields. Most information is given by a posteroanterior (PA) projection taken in full inspiration or lateral projection.Chest X-Ray
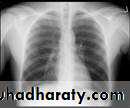
CXR
For more presentations www.medicalppt.blogspot.com
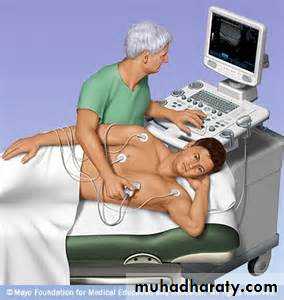
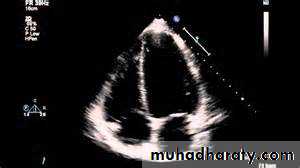
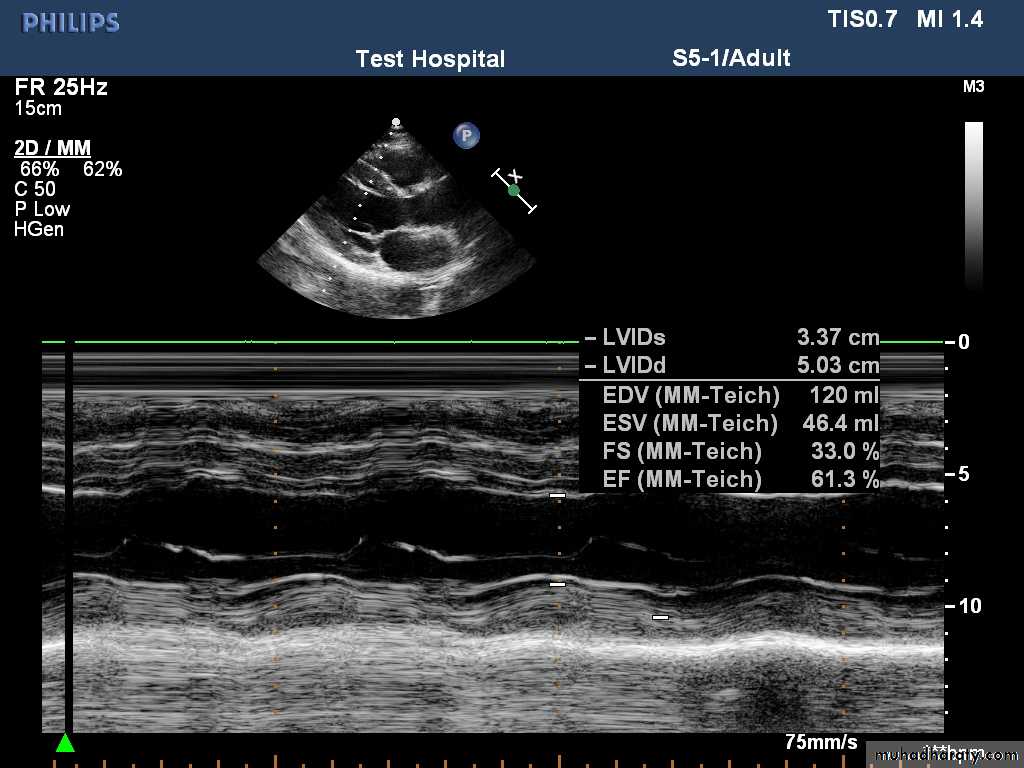
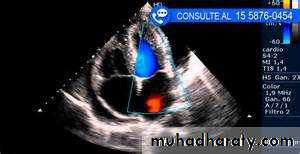
Echocardiography (echo)
Echocardiography, or cardiac ultrasound, is obtained by placing an ultrasound transducer on the chest wall to image the heart structures as a real-time, two dimensional ‘slic
Echocardiography (echo)
Transthoracic echo.Transoesophageal echo.
For more presentations www.medicalppt.blogspot.com
www.medicalppt.blogspot.com
For more presentations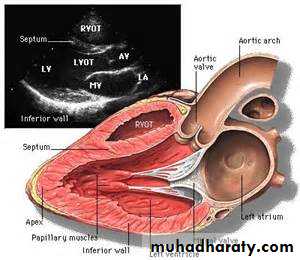
For more presentations www.medicalppt.blogspot.com
For more presentations www.medicalppt.blogspot.com
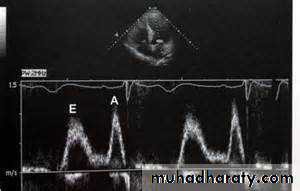
Doppler echocardiography This depends on the Doppler principle that sound waves reflected from moving objects, such as intracardiac red blood cells, undergo a frequency shift. The speed and direction of the red cells, and thus of blood, can be detected in the heart chambers and great vessels
For more presentations www.medicalppt.blogspot.com
For more presentations www.medicalppt.blogspot.com
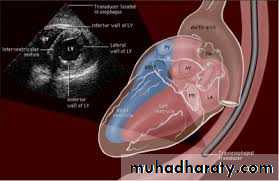
Transoesophageal echocardiographyendoscope-like ultrasound probe which is passed into the oesophagus under light sedation and positioned behind the LA. This produces high-resolution images.
Transoesophageal echocardiography
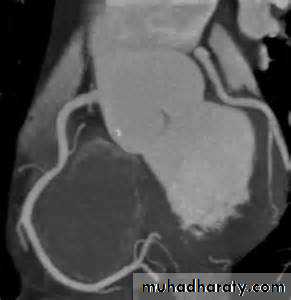
Computed Tomographic Imaging
Useful for imaging the cardiac chambers, great vessels , pericardium, and mediastinal structures and massesAnd recently even the coronaries (CT coronary angiography).
For more presentations www.medicalppt.blogspot.com
Magnetic resonance imagingMagnetic resonance imaging (MRI) requires no ionising radiation and can be used to generate cross-sectional images of the heart, lungs and mediastinal structures
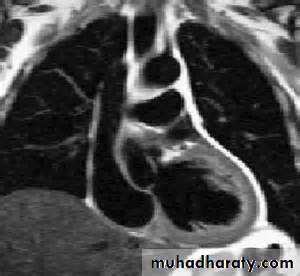
For more presentations www.medicalppt.blogspot.com
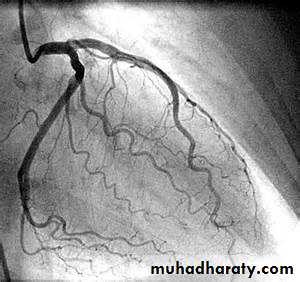
Cardiac catheterisation
This involves passage of a preshaped catheter via a vein or artery into the heart under X-ray guidance, which allows the measurement of pressure and oxygen saturation in the cardiac chambers and great vessels, and the performance of angiograms by injecting contrast media into a chamber or blood vessel
Coronary Angiography
For more presentations www.medicalppt.blogspot.com
Electrophysiology studyFor assessment , diagnosis and treatment of arrhythmias
Radionuclide imaging
Blood pool imagingMyocardial perfusion imaging
Cardiac biomarkers
Brain natriuretic peptide-diagnosis and assess prognosis and response to therapy in patients with heart failure .Cardiac troponins Troponin I and troponin T are structural cardiac muscle proteins that are released during myocyte damage and necrosis, and represent the cornerstone of the diagnosis of acute myocardial infarction.