
ANALYTIC STUDIES
Dr. Sijal Fadhil Farhood Al-Joborae
F.I.C.M.S
(Baghdad)
M.Sc. Comm.Med
.(Nahrain)
M.B.Ch.B
(Babylon)

INTRODUCTION
The basic premise of analytic epidemiology is that disease
does not occur randomly but rather in describable patterns
that reflect the underlying etiology.
This rationale is certainly applied to case-control studies.
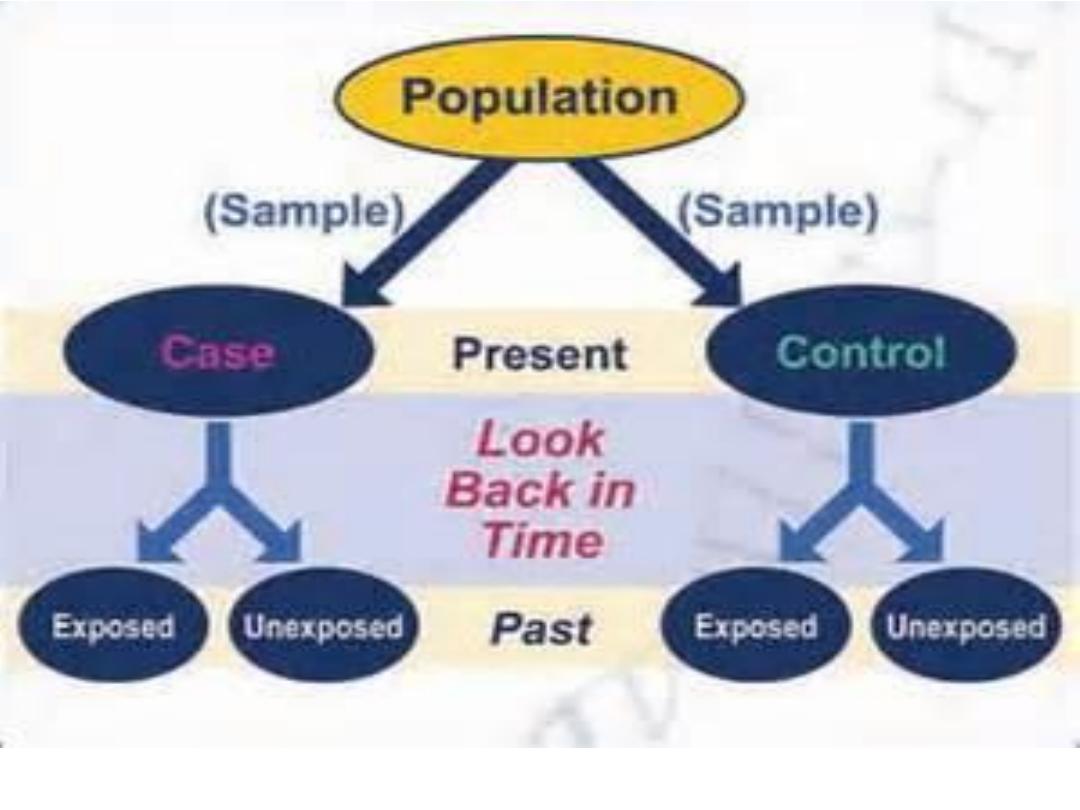
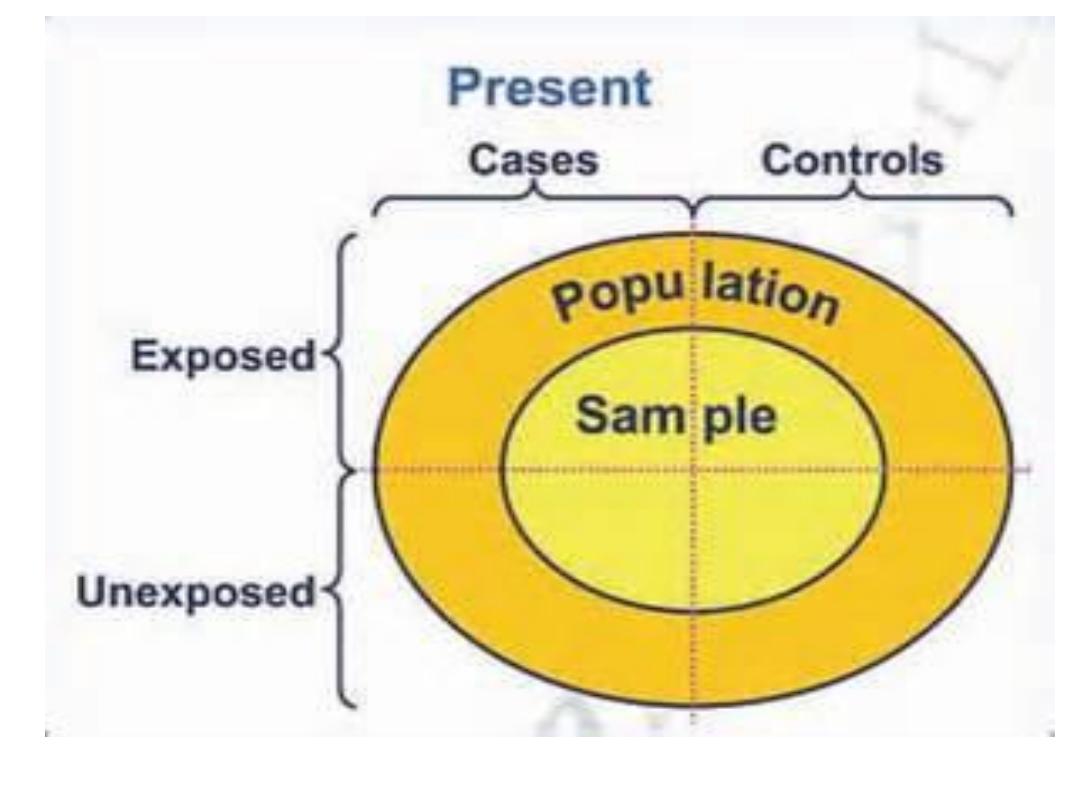
Consider two groups one in which every one has
the disease of interest (cases) and a comparable
one in which every one is free of the disease
(controls).

The case-control study seeks to
identify possible
causes of the disease by finding out how the two
groups differ.
That is, because disease does not
occur randomly, the case group must have been
exposed to some factor, either voluntarily (eg.
through diet , exercise, or smoking) .
Or involuntarily(through such factors as cosmic
radiation, air pollution, occupational hazard, or
genetic constitution) that contribute to the
causation of their disease.
Therefore a comparison of the frequency of
exposure among cases and controls may permit
inferences as to the basis for the difference in
disease status.

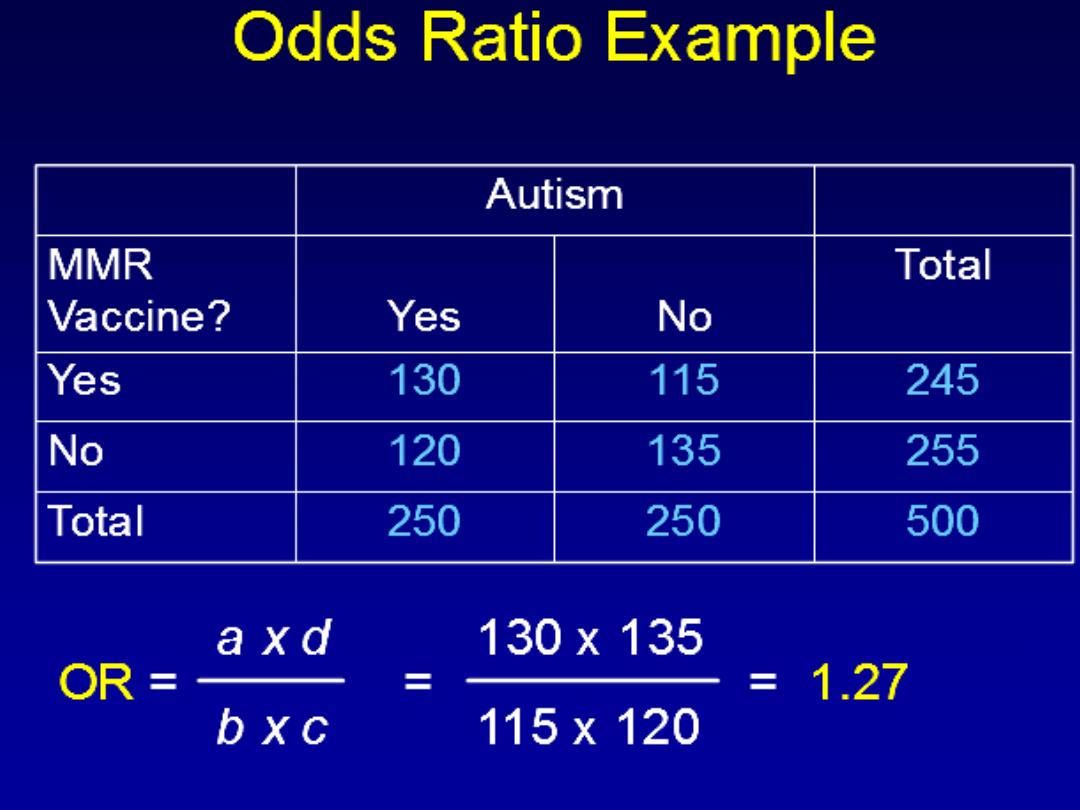
Examples
• Study to determine an association between
autism and vaccination
• Study to determine an association between
lung cancer and radon exposure
• Study to determine an association between
salmonella infection and fast food restaurants

STRENGTHS:
1-Is relatively quick and inexpensive compared with
other analytic designs.
2-Is particularly well suited to the evaluation of
disease with long latent period.
3-Is optimal for the evaluation of rare disease.
4-Can examine multiple etiological factors for a
single disease.

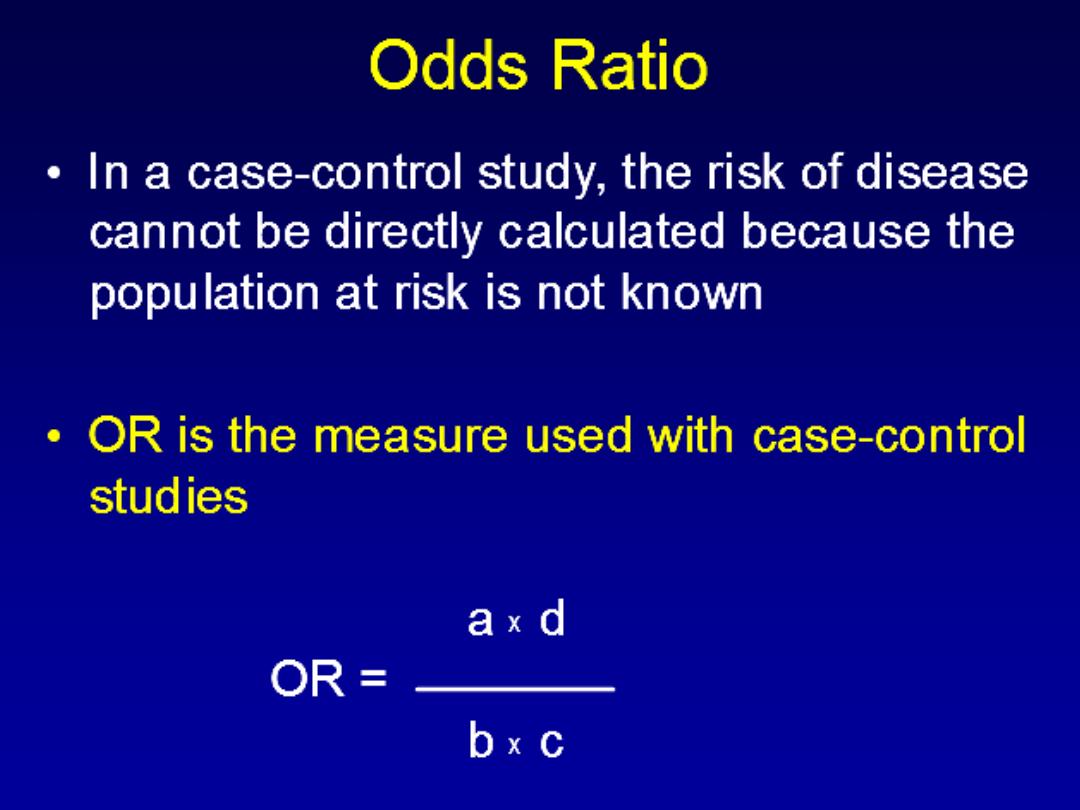
LIMITATION
1-Is inefficient for the evaluation of rare exposure
2-Cannot directly compute incidence rates of
disease in exposed and non exposed individuals,
but can estimate the relative risk
(odds ratio)
3-In some situations the temporal relationship
between exposure and disease may be difficult to
establish.
4-Is particularly prone to bias compared with other
analytic designs, in particular selection and recall
bias.
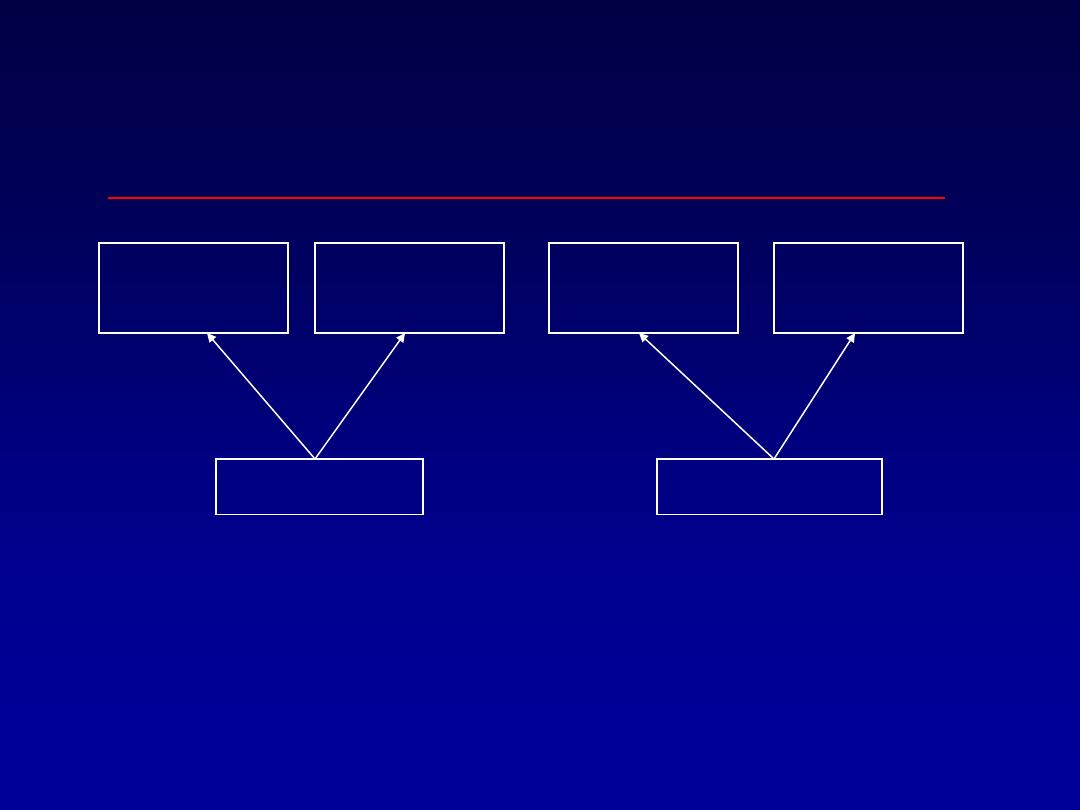
Design of a Case-Control
Study
Not
Exposed
Exposed
Not
Exposed
Disease
No Disease
“CASES”
“CONTROLS”
Exposed

Types of case-control study
• If all the cases were already diagnosed at the
time the investigator initiates the study, this is
called
Retrospective Case Control
study.
• If the study is begun and all the new cases that
will be diagnosed within the next period of time
will be included in the study it is called
Prospective Case Control Study
.

How to conduct case- control
study
1. Identify cases of disease of concern
2. Identify appropriate non-diseased comparison
group (“controls”)
3. Document exposures among cases and
controls
4. Calculate odds ratios
5. Perform statistical tests or calculate
confidence intervals

In design ccs the major issues are:
1- select of case and control
2-the comparability of case and control is essential
(matching)
which is
done to eliminate confounding factors
- group matching (eg:25% of case were married --25% of control were
married)
-Individual matching (eg.:if the first case enrolled in a study is a 45year
old white female--- control also 45year old white female)
3. accuracy and completeness of data , on the same level for cases and
for control (measure of exposure)
4- analysis and interpretation .

Sources of Selection of the
cases:
1.
Hospital-based case control studies
The cases will be identified from the
hospitals, or other health care facilities.
These are common, relatively easy, and
inexpensive.
2- Population based case-control studies.
It involves locating and obtaining data from
all affected individuals or a random sample
from a defined population.

Selection of cases
specify definition of the disease or outcome
• “strict diagnosis” appropriate
• “case definition” and “
• “diagnostic criteria” “should be made .

Source of selection of
controls:
1.
Hospital control:
consist of patients at the
same hospital with conditions other than the
disease under study.
• In a CCS of association between cigarette smoking and MI
among women .
• Case : identify from admission to coronary care unit at
particular hospital
• Control: from admission to surgical , orthopedic and medical
services of same institute (other than coronary disease)

2-General population control:
Used when the cases are chosen from the general
population, and if the hospital control is not desirable
or feasible.
3.Specific control series(friend, neighbor,
relative).

Criteria of control
1. Not having the disease being studied.
2. Represents population from which cases
arose.
3. Represents persons who, if they develop
disease, would have been a case in the
study.
4. Be selected independently of exposure.

Size of control:
• we have to put in mind cost and feasibility
aspect.
• The optimal ratio of case to control is
1:1
(if
the study group is large) but increasing control
will increase the strength of study and
1:4
for
instance especially if the number of cases are
small.(1:2,1:3,1:4)

Types of bias in ccs:
• Bias is not the reason to avoid ccs but to
careful consideration of the source from which
the bias may arise,and well designed and
conducted ccs can provide a valuable
information on the association between the
disease and exposure.

Types of bias in ccs:
1.selection bias:
Arise from systematic differences in selecting
the study groups
Eg:
-control selection bias(selection of an
inappropriate control group)
-self-selection bias(non response or agreement
to participate that is related to exposure and
disease)

2.observational bias:
A- recall bias
: the source of error depends on
whether the cases remember exposures better
than non-cases.
B- misclassification bias
: There is an error in in
the classification of exposure or the disease

• In general bias may affect the validity of
the results by the possibility of
exaggeration or under estimation.
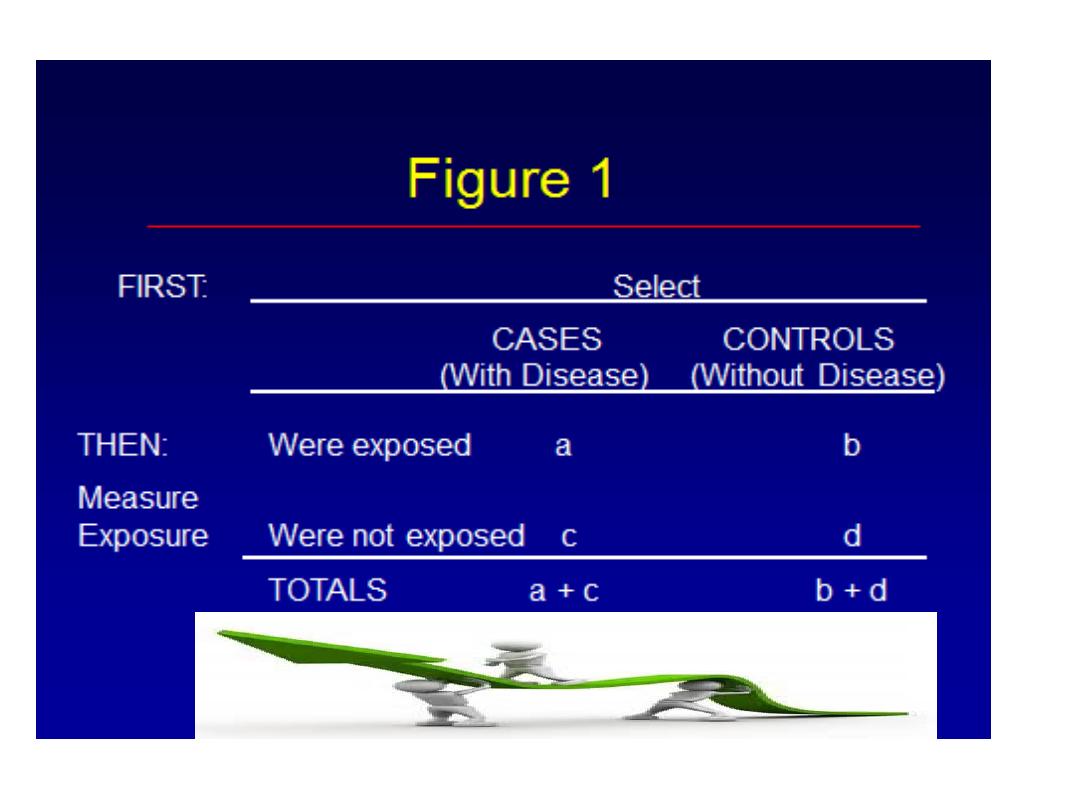
MEASURES OF ASSOCIATION
Odds ratio:
is the ratio of the number of the ways the
event can occur to the number of ways the
events cannot occur.
It measures the association between
exposure and outcome.
a
c
ad
Odds Ratio = =
b
bc
d
a
b
c
d
Case
Control
E+
E-

According to the table:
Proportion of cases exposed=
a/a+c
Proportion of the control exposed=
b/b+d
Proportion of the case non exposed =
c/a+c
Proportion of the control non exposed =
d/b+d
Interpret the Results
Odds Ratio = (15x10) / (20x5) =150/100
=1.5
Cases
Controls
Total
Exposed
15
20
35
Unexposed
5
10
15
20 30
50

• OR =1 (risk factor not related to the disease)
• OR<1 (risk factor is actually protective factor
against the disease)
• OR>1 (risk factor positively associated with
the disease

Example
A study of infertility found prior use of intra uterine
devise(IUD) in 89 out of 283 infertile women.
In contrast 640 out of 3833 controls used IUD.
1-conduct 2x2 table.
2-what is the design of the study?
3-what are the advantages and limitations of this
type of study?
4-Is there a relationship between infertility and the
use of IUD? interpret it.

OR=(89x3193)/(640x194)
=
2.3
times more infertile women to be prior users
of IUD than fertile women.
Here the risk estimate shows a direct association
between prior use of IUD and infertility.
case
control
total
infertile
fertile
IUD user
89
640
729
Non user
194
3193
3387
total
283
3833
4116