
Improving Community Health to Achieve
Optimal Child Growth
Dr.Sijal Fadhil Farhood Al Joborae
M.B.Ch.B.
M.Sc. Community Medicine
F.I.C.M.S. Community Medicine

Lecture Objectives:
1.Importance of growth monitoring
2. Who are at risk of malnutrition
3. Malnutrition and brain
4. Screening for growth faltering(FTT)

What is growth monitoring and why is it
important?
• Growth: increase in the physical size of the body
• Development increase in skills and functions.
• Both are considered together because a child grows and develops
as a whole.
Optimal growth does not only include physical aspect but
also intellectual, emotional and social aspects.

Childs Growth takes place only in the presence of optimal
nutrition, freedom from recurrent infections…. in addition
to:
• Genetic inheritance
• How young the child is
• Sex
• Physical surroundings
• Psychological factors
• Economic factors

WHAT IS GROWTH MONITORING
• Monitoring means keeping a regular track of something,
Weighing of the child at regular intervals, the plotting of that
weight on a graph (called a growth chart) enabling one to see
changes in weight
It is the change in weight over a period of time which is most
important, rather than the weight itself.
υ
Should be done once every month, up to age of 3 years and
at least once in 3 months, thereafter.

Risk of Underweight
Nutrient deficiencies
Stunting
Anemia, weakness
Immune suppression
Infectious diseases
Chronic diseases
Cognitive Damage
Mortality
Economic burden
Risk of Overweight
Nutrient deficiencies
Hypertension
Dyslipidemia
Diabetes type II
Cardiovascular disease
Stroke
Cancer
Mortality
Economic burden

• It is important to note that BOTH over and under weight are two
paths that can lead to the same list of chronic cardio-metabolic
diseases in later life. But unique to the period of early childhood,
under-nutrition and its associated micronutrient deficiencies can
damage the developing brain at a critical juncture, which impairs
cognitive function and cannot be reversed later in life.
3/27/2019

Weight & height below genetic potential
Greater body fat
Lower muscle mass
Poor work capacity
Lower mental test scores
Fewer years of school
Social & behavioral problems
Higher risk of poverty
Higher risk of disease
Growth Faltering & Stunting

• Studies regarding long-term growth outcomes of children with growth failure
during the first 2-3 years of life in the developed world are limited, but
demonstrate lower mean weight, height, BMI, and other anthropometric
measures. One study in the US followed 249 children for over 6 years. All
children were <25 months at entry, >36 weeks gestational age and >2500 gm at
birth, and had no significant medical conditions. 130 of the children met criteria
for FTT, and 119 had adequate growth. The FTT children were randomized to
one of two groups: a clinical intervention only group (all FTT were treated in the
same multidisciplinary FTT clinic) and a clinical intervention plus home
intervention group (they got the same care in the clinic along with home visits
that promoted maternal sensitivity, parent-infant relationships, and child
development). At follow-up when the children were 8 years old, children in the
clinical intervention only group were significantly shorter, lighter, and had lower
arithmetic scores than the adequate growth group, with the home intervention
group showing intermediate results between the other two groups. There were
no group differences in IQ, reading or mother-reported behavior problems.
Children in the home intervention group had fewer teacher-reported internalizing
problems and better work habits than the clinical intervention only group (Black).

Malnutrition affects
length, weight, and
brain
development
Childhood Malnutrition
Reduces Cognitive Function
Permanently

4 Crucial Areas
of Neonatal Growth
Linear growth
Weight gain
Continued development of
organs and tissues
Brain expansion
Growth Velocity and Basal Metabolic Rate X
Age

• An infant’s rapid rate of growth coupled with a very high metabolic
rate makes the risk of growth faltering highest during the first 3
years.

At birth the brain has 85 billion neurons
Synapses form at rate of 700/ second
Volume 2x by 12 months, 3x by 3 years
Brain accounts for
>50% of the
basal metabolic rate
In a 1 year old
Newborn
1 Month
4 Months
3 years

• As impressive as the early linear growth of the fetus, newborn, infant, and
young child, the brain expansion during this time is even more startling.
Brain volume doubles by age 1 and triples b
• age 3 years of life. The immense growth of infant brain is result of synaptic
connections and myelinization with lipid, not from additional neurons. Brain
continues to grow and refine connections until young adulthood, around
age 25 years. It accounts for more than half of the infant’s basal metabolic
rate. In adults, the rate is only 2%. Unfortunately, we have almost no data
on the energy expenditure of mental activity, particularly for infants.
• Son’kin V, Tambovtseva R. Energy metabolism in children and adolescents.
In, Bioenergetics. Ed, Dr. Kevin Clark. Intech Press. Chapter 5: 121-142
• The highly metabolic brain in an infant accounts for 12% of body mass;
whereas, in the adult it is only 2%. The adult human brain accounts for
24% of basal metabolism, while brain in a 1 year old accounts for 53%.

HEAD CIRCUMFERENCE
CORRELATES WITH
BRAIN GROWTH

Many Nutrients Build the Brain
•
Vit B1 – utilize glucose, modulate
cognition, language development,
neurotransmitter synthesis
•
Vit B6, B12, choline, tryptophan, tyrosine,
phenylalanine, copper, histidine, threonine –
synthesis of neurotransmitters
•
Vit B12 – cognition, language, myelination
•
Vit C – antioxidant, cognition, memory,
myelination
•
Vit D – prevents neurodegenerative disease
•
Vit E – cell membrane integrity, antioxidant,
protection of DHA
•
Iron – oxygenation, synthesis of myelin &
neurotransmitters, IQ
•
Magnesium – energy and ion regulation,
neural plasticity
•
Zinc –neuromotor transmission, cell
proliferation, taste
•
Iodine – (via thyroid) cellular energy
metabolism
•
Omega 3 PUFA (DNA) – cognition, visual
development
•
Lutein – macular protection
•
Flavonoids – protect & enhance neurons,
anti-inflammatory, cognition

• Optimal development requires consistently available energy and a
wide array of specific nutrients, particularly neural development.

Current approaches to
growth faltering (FTT)
Identify Children at Risk
for Malnutrition??
Is the Child’s Weight Normal?

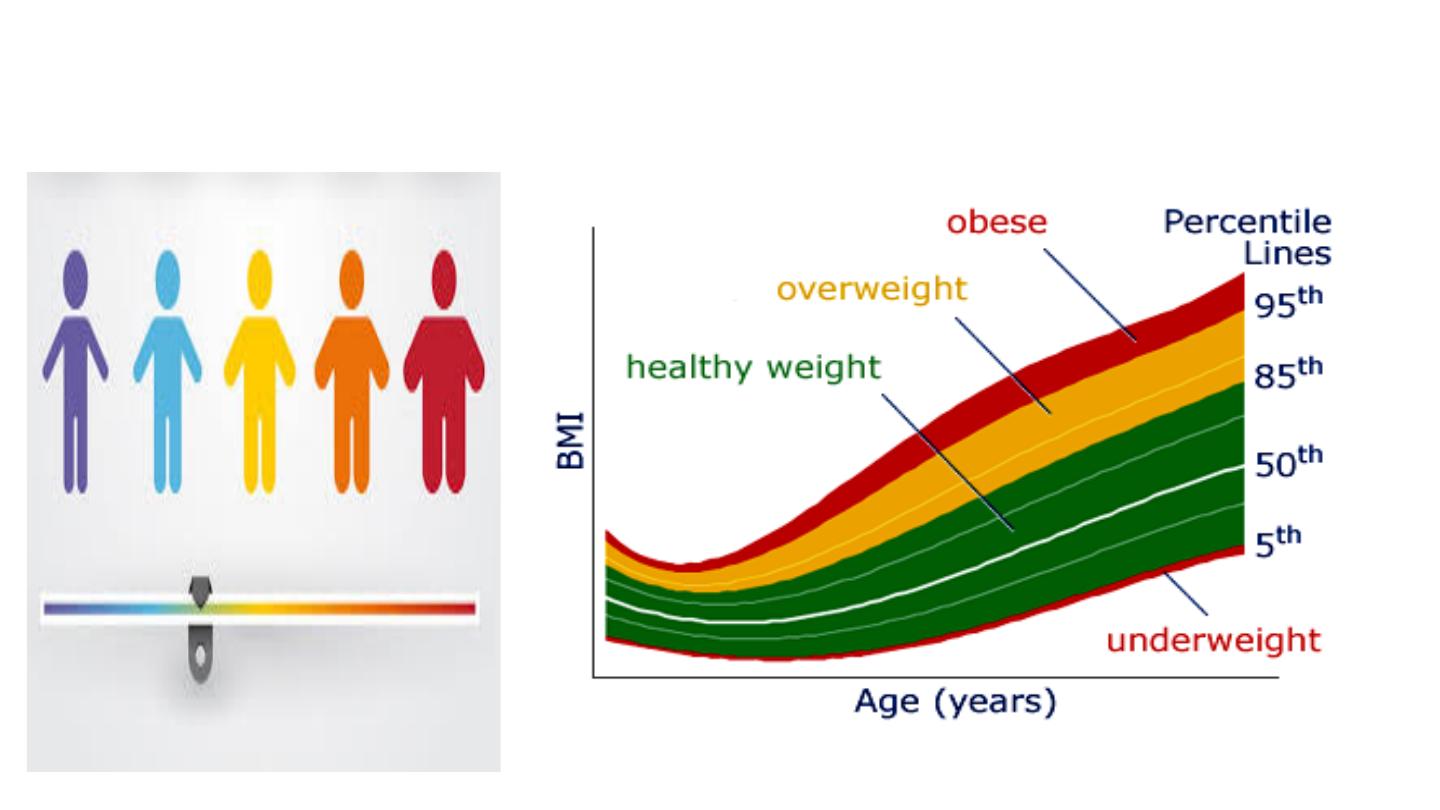
• Using Prevalence Ranges
• The BMI percentile graph is often used to see where the child falls
relative to others of the same age. This is helpful to make a
diagnosis, but due to the wide range of normal, between the 5th and
95th percentiles, it is less likely to help the clinician early in the
course. For children outside the normal range, a dilemma arises.
How do we determine the magnitude of their problem? To determine
the child’s degree of growth risk, Z-scores have proved more helpful.

short, thin or bloated,
listless, and have
weakened immunity
Their senses of sight,
taste, and smell are
affected & also have
anxiety, changes in
mood
Community screening
for malnourished
children

Look Carefully
Physical Exam
• Pale, thick, dry skin
• Rash or bruising
• Skin pigment changes
• Aching joints
• Thinning fine curled hair
• Bones tender
• Swollen tongue
• Night blindness
• Sensitivity to light and
glare
A – Anthropometry (body)
B – Biochemical
C – Clinical
D - Dietary

• Malnourished children may be short for their age, thin or bloated,
listless, and have weakened immune systems. Nutritional disorders
can affect any system in the body and the senses of sight, taste, and
smell. They may also produce anxiety, changes in mood, and other
psychiatric symptoms.

• *Calcium is important for maintaining strong bones and controlling muscle and
nerve function. Signs of severely low calcium include fatigue, muscle cramps,
abnormal heart rhythms, and a poor appetite. Vit D This vitamin is also critical for
bone health. Symptoms of a vitamin D deficiency can be vague — fatigue and
muscle aches or weakness. Potassium Potassium helps the kidneys, heart, and
other organs work properly. You could become low in potassium in the short term
because of diarrhea or vomiting, excessive sweating, or antibiotics, or because of
chronic conditions such as eating disorders and kidney disease, according to the
U.S. National Library of Medicine. Symptoms of a deficiency include weight loss,
muscle weakness, constipation, and in severe cases, an abnormal heart rhythm.
Iron helps your body make red blood cells. When iron levels get too low, your body
can’t effectively carry oxygen. The resulting anemia can cause fatigue. You might
also notice pale skin and dull, thin, sparse hair. With an increasing number of
vegans and people who've had weight loss surgery, vitamin B12 deficiency is
becoming more common, according to Harvard Health Publications. The
organization says symptoms of severe B12 deficiency include numbness in the
legs, hands, or feet; problems with walking and balance; anemia; fatigue;
weakness; a swollen, inflamed tongue; memory loss; paranoia; and hallucinations.
A folate deficiency can cause a decrease in the total number of cells and large red
blood cells as well as neural tube defects in an unborn child, Psota says.
Symptoms of a folate deficiency include fatigue, gray hair,

25
• mouth ulcers, poor growth, and a
swollen tongue.
• Magnesium deficiency can cause
loss of appetite, nausea and
vomiting, fatigue, and weakness.
In more severe cases, it can lead
to numbness, muscle cramps,
seizures, abnormal heart
rhythms, personality changes, or
low potassium or calcium levels.
•
• Other symptoms include:
• Pale, thick, and dry skin
• Bruises easily
• Rashes
• Changes in skin pigmentation
• Thin hair that is tightly curled,
and pulls out easily
• Achy joints
• Bones are soft and tender
• Gums bleed easily
• Tongue may be swollen or
shriveled and cracked
• Night blindness
• Increased sensitivity to light
and glare

Community screening of children with risk
factors for growth failure
• Premature infants /LBW
• Repeated infections
• Difficulty tolerating foods
• Hospitalized children
• Chronic disease states
• Special needs children
• First months of life
Wright CM. Arch Dis Child 2000; 82:5

• The child with growth faltering is commonly missed in affluent countries.
• Using community screening in the UK, Wright et al found that cases of growth faltering
were missed in more than 10% of children. Of these cases, most showed early faltering.
Several risk factors were identified that should have raised clinical suspicion, such as
prematurity, repeated infections, hospitalization and children with special needs. During
the first year of life over 10% of infants will cross centiles, most temporarily.
• Clinically, the risk in growth faltering is based on future anthropometric outcomes: stature,
lean body mass, and adiposity.
• Ref:
• Wright, CM. Arch Dis Child 2000;82:5-9. Identification and management of failure to
thrive: a community perspective
• Wright C, Loughridge J, Moore J. Failure to thrive in a population context: two contrasting
case control studies of feeding and nutritional status. Proc Nutr Soc, 2000; 59:37-45
• Parkinson KN, Wight CM, Drewtt RF. Mealtime energy intake and feeding behavior in
children who fail to thrive: a population-based case-control study. J Child Psychol
Psychiatry 2004; 45:1030-1035.

GROWTH
FALTERING
Weight Slows
Weight Stops
Height Falls
Head Circumference Stops

Measurements
Weight
Height / Length
Skin fold thickness
Mid arm circumference
Measures of Growth

• New consensus guidelines for defining the approach to malnutrition
were published in 2013, which recommended the following 4
measures to assess risk of growth problems.

New Consensus Guidelines 2014
Cause-Based Diagnosis and Intervention for Malnutrition
Etiology
Mechanism
Problem
Outcomes
No apparent
illness
Poor Intake
Energy
Growth/ lean body
mass/ muscle
weakness
History of Illness:
Higher Nutrient Need
Protein/Energy
Cognitive impairment
Acute
Nutrient Loss
Micro-nutrients
Immune dysfunction
Chronic
Hyper-metabolism
Poor wound healing
Inflammation
Need for
hospitalization

• Clinical complications from prolonged or severe nutritional deficiency are extremely detrimental
in early life.
• New guidelines from American Society of Enteral and Parenteral Nutrition (ASPEN) have moved
our view of growth failure to a cause-based algorithm.
• There are only 3 potential reasons for growth failure: 1) Energy intake is inadequate to sustain
growth in an otherwise healthy child. This is by far the most common of the 3 groups. 2) The
intake pattern is normal, but there are energy/ nutrient losses. This occurs through vomiting or
reflux or through fecal loss. 3) The intake is normal, but there are metabolic demands that
require more energy/ nutrients than normal. This may be seen in thyroid disease, cancer,
congenital organic dysfunction, such as pulmonary or renal disease, etc.
• Complications associated with growth impairment follow a continuum from loss of weight and
lean muscle mass to more severe deficits in immune function, risk of infections, wound healing,
and poor homeostatic functions.

• The risk of cognitive impairment during growth faltering depends on the
timing, the degree of dietary limitation, and the effects on diet quality
(nutrients).
• Note that cognitive impairment is cited as an outcome of acute or chronic
malnutrition, but is not considered a high risk for children with inadequate
energy intake. There are scarce data on possible subtle neuro-cognitive
complications that may accompany nutrient insufficiency in the critical
early years of life.
• Ref:
• Mehta NM, Corkins MR, Lyman B, et al. Defining pediatric malnutrition: a
paradigm shift toward etiology-related definitions. JPEN J Parenter Enteral
Nutr. 2013;37(4):460-81.
• Becker P, et al, Academy of Nutrition and Dietetics, American Society for
Parenteral and Enteral Nutrition. Indicators recommended for the
identification and documentation of pediatric malnutrition (undernutrition).
Nutr Clin Prac, 2014; 30:147-161

Inadequate Intake of energy (kcals)
• Repeated infections
• Lack of available food
• Neglect
• Breast feeding issues
• Improper mixing of formula
• Physical disorders
• Extremely picky eater
• Child-parent issues
• Development problems
• Unhealthy food choices

• What is the child’s usual diet? What is their routine day? Are there
parent-child struggles over food? How picky is the child? Neglect:
family history of stress, mental illness, mental impairments, signs of
abuse, flattened head, poor hygiene, hunger cues, inattentive parent,
cell phone obsession.

Weakened
Immunity
Limited
Growth
Repeated
Infections
+/- Diarrhea
Inadequate
Nutrition
Poverty
Obesity
& its
Comorbidities
Cognitive
Impairment
Energy &
Nutrients Fall
The vicious cycles of diseases of poverty.

• The vicious cycles of diseases of poverty. Enteric infections, especially in
the first 2–3 years of life, with or without overt diarrhoea, can predispose
an individual to malnutrition and stunted
• growth through multiple mechanisms. Stunting by 2 years of age, in turn,
is associated with impaired cognitive development that extends into later
childhood and even adulthood and adult productivity. In addition,
malnourished children experience both greater frequency and duration of
diarrhoeal illnesses, and, documented in animal models, heavier
infections. The latter is documented with Cryptosporidium and with
enteroaggregative E. coli. Finally, enteric infections or stunting can
predispose to obesity and its comorbidities of diabetes, hypertension,
cardiovascular disease, metabolic syndrome and burgeoning health-care
expenditures, contributing to individual and societal poverty in vicious
cycles.
Repeated Infection Impairs Growth
SD below
normal
weight
moderate–severe
stunting occurs in
178 million
children
worldwide (20% of
children
worldwide

• Reports of ‘poor appetite’ by caregivers of children under 2 in developing countries are
common and may account for a substantial proportion of low energy intakes in this age
group (Brown et al. 1995). Appetite is controlled by a group of chemicals called satiety
hormones. Two important hormones involved in appetite regulation are ghrelin and
leptin. Ghrelin stimulates food intake; leptin suppresses food intake. During infection,
elevated levels of cytokines can lead to increased blood leptin concentrations and
diminished appetite (Somech et al. 2007). This effect has been verified in cases of
severe systemic infection such as neonatal blood infections (Orbak et al. 2003).
• Immune system activation also lowers circulating levels of certain nutrients, in particular
vitamin A and zinc, and increases iron retention in the liver, which restricts the
availability of iron to other tissues in the body. These effects are probably part of an
adaptive response to withhold key nutrients from invading pathogens, but they can
result in inadequate availability of certain nutrients to support growth, even if intake is
adequate, during the period of metabolic disturbance. Among children 6–20 months of
age in Zambia, blood markers of inflammation (usually associated with infection) were
negatively related to growth in length during the subsequent 3 months (Hautvast et al.
2000).

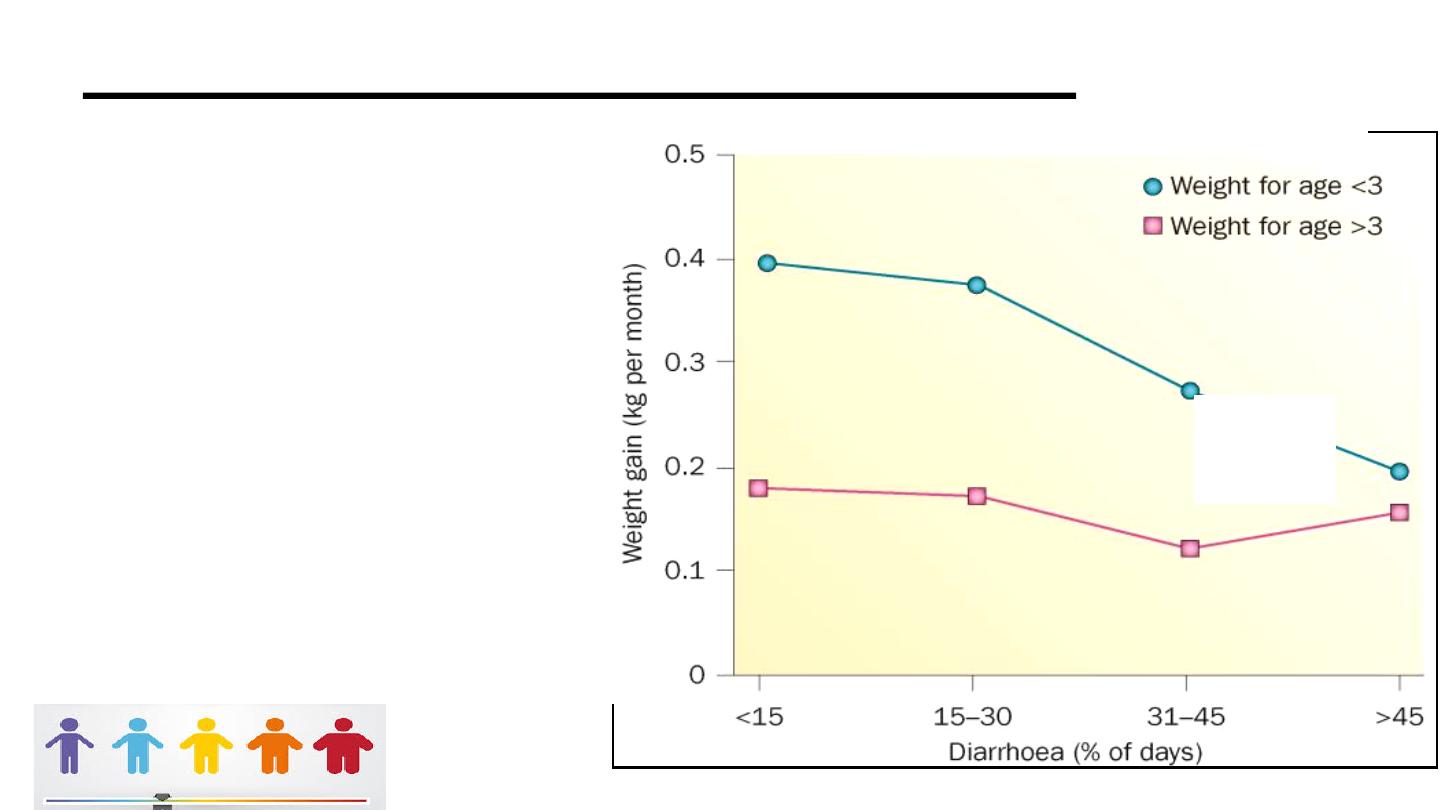
• Note: moderate–severe stunting occurs in 178 million children worldwide (20%
of children worldwide; 32% of children in developing countries). Catch-up growth
in malnourished
• children and its eradication by recurring diarrhoea. Malnourished children (that
is, with weight-for-age <3 z-scores, less than three standard deviations below
normal weight for age) tend to catch up with a doubling of weight gains, if they
do not experience heavy diarrhoeal burdens (that is, <15% of their days are
spent with diarrhoea in this observation period in the first 2 years of life).
However, heavy diarrhoeal burdens are associated with a progressive ablation
of this crucial catch-up growth. Permission obtained from Elsevier © Schorling,
J. B. & Guerrant, R. L. Lancet 335, 599–600 (1990). Indeed, a 20-year
multicountry analysis revealed that five or more diarrhoeal infections in the first 2
years of life accounted for 25% of all stunting observed; moreover, every five
diarrhoeal episodes increased stunting risk by 13%.23 . DEWEY: In response to
infection, the immune system becomes activated and produces specific immune
cells and cytokines in large amounts to combat the invading organism.
Cytokines are protein molecules that assist in fighting infection. They are
beneficial in the short term; however, a chronic condition – like EE – can lead to
continuously high levels of cytokines, which can cause negative metabolic
consequences and suppress appetite (Wong & Pinkney 2004).

“The Impoverished Gut”(Pathway)
Infections often injure the intestinal
barrier
• Inflame the mucosa
• Impair absorption
• Bacterial overgrowth
• Nutrient malabsorption
Post infectious diarrhea accounts for 50% of
the growth faltering ,blunting catch-up
growth.

• Post infectious enteropathy accounts for 50% of the growth faltering
after infections and “smolders” between overt episodes of diarrhea,
blunting catch-up. The relative impact of pathways associated with
infection and undernutrition may, however, differ across socio-
economic groups: in poorer children, the impact of mucosal damage
and immunostimulation could be masked by nutritional constraints.
This has important implications for public health interventions.

Type 1 Nutrient Deficiencies
Type 2 Nutrient Deficiencies
Iron, copper, manganese
Iodine, selenium, calcium,
flourine, nicotinic acid,
cobalamin, folate, retinol,
vit E, vit B1, vit A,
vit C, vit D, vit K
Water, potassium, sodium
magnesium, zinc, phosphorus, protein,
nitrogen, threonine, lysine, sulphur, oxygen
Growth continues (early)
Clinical signs
Diagnosis: lab testing
Body stores fall
Specific tissues and enzymes
Anthropometric changes (late)
Growth failure
No clinical signs
Diagnosis: anthropometry
No body stores of these nutrients
General effect on metabolism
Dependent on all other Type II

• SCN News. 1995;(12):10-4.
• Specific deficiencies versus growth failure: type I and type II nutrients.
• Golden MH.
• A child responds to a deficiency of an essential nutrient either by continuing to grow and consuming
body stores with eventual reduction in the bodily functions (Type I) or by reducing growth and avidly
conserving the nutrient to maintain the concentration of the nutrient in the tissues (Type II).
Examples of Type I nutrient deficiency are anemia (iron deficiency), beri-beri (thiamin deficiency),
pellagra (niacin or nicotinic acid deficiency), scurvy (vitamin C or ascorbic acid deficiency),
xerophthalmia (vitamin A or retinol deficiency) and iodine deficiency disorders. Diagnosis is
relatively simple via clinical symptoms and measurement of the concentration of the nutrient itself.
There are no characteristic symptoms to distinguish which Type II nutrient deficiency an individual
has; all deficiencies result in the poor growth, stunting, and wasting generally ascribed to protein-
energy malnutrition. In Type II, growth stops, the body starts to conserve the nutrient, and its
excretion falls to very low levels. In severe deficiency the body may start to break down its own
tissues and the reduction of appetite accompanies this condition. An animal can die from zinc
deficiency even though it is has a normal concentration of zinc in its tissues, but it can respond
rapidly to small amount of dietary zinc. The mechanisms by which the body stops growing in
response to nutritional lack are similar to the hormonal picture seen in endocrine disease (reduction
of the production of the hormonal mediators of growth, down-regulation of receptors, and reduction
of protein synthesis). Growth failure is the clinical sign characteristic of a diet deficient in protein,
zinc, magnesium, phosphorus, and potassium. Wasting may be also ascribed to toxins, infection,
worms, or persistent diarrhea. Anorexia is another common response in nutrient deficiency. Only a
supplementation diet with a balance of nutrients will promote rapid recovery.

16
45
Tools to Evaluate Body Composition
1. Mid-upper arm circumference
2. Skin-fold thickness
3. Bioelectrical impedance (BEI)
4. DEXA scan

A New Tool
: Hand Grip Strength
• Indicates nutritional status in adults. An
emerging method in children > 5years
• Impaired muscle strength due to illness-related undernutrition
• Follow nutrition deficit and repletion
• Earlier indication of poor nutrition than body composition

Free Clinical Calculators Online
• Growth calculator for
premature infants
• Gestational age calculator for
newborns
• Olsen 2015 BMI calculator for
premies
• Growth velocity charts
• Growth curves for Down’s
• WHO growth standards and
charts
• CDC growth calculator and
charts
• WHO skin fold standards
• MUAC standards for children

• Nutritional “risk” is serious
• Early life is a critical time
• Growth = weight, length, body
,
& brain
• Illness results in poor appetite
• Use a
balanced
nutritional
approach
• Ensure complete linear growth