
with Open Texts
Introduction to
Financial Accounting
by Henry Dauderis & David Annand
Edited by Athabasca University
VERSION 2019– REVISION A
ADAPTABLE | ACCESSIBLE | AFFORDABLE
*Creative Commons License (CC BY-NC-SA)


a
d
v
a
n
c
i
n
g
l
e
a
r
n
i
n
g
Champions of Access to Knowledge
OPEN TEXT
ONLINE
ASSESSMENT
All digital forms of access to our high-
quality open texts are entirely FREE! All
content is reviewed for excellence and is
wholly adaptable; custom editions are pro-
duced by Lyryx for those adopting Lyryx as-
sessment. Access to the original source files
is also open to anyone!
We have been developing superior on-
line formative assessment for more than
15 years. Our questions are continuously
adapted with the content and reviewed for
quality and sound pedagogy. To enhance
learning, students receive immediate per-
sonalized feedback. Student grade reports
and performance statistics are also provided.
SUPPORT
INSTRUCTOR
SUPPLEMENTS
Access to our in-house support team is avail-
able 7 days/week to provide prompt resolu-
tion to both student and instructor inquiries.
In addition, we work one-on-one with in-
structors to provide a comprehensive sys-
tem, customized for their course. This can
include adapting the text, managing multi-
ple sections, and more!
Additional instructor resources are also
freely accessible. Product dependent, these
supplements include: full sets of adaptable
slides and lecture notes, solutions manuals,
and multiple choice question banks with an
exam building tool.
Contact Lyryx Today!
info@lyryx.com


a
d
v
a
n
c
i
n
g
l
e
a
r
n
i
n
g
Introduction to Financial Accounting
by Henry Dauderis & David Annand
Edited by Athabasca University
Version 2019 — Revision A
BE A CHAMPION OF OER!
Contribute suggestions for improvements, new content, or errata:
A new topic
A new example
An interesting new question
Any other suggestions to improve the material
Contact Lyryx at
info@lyryx.com
with your ideas.
Lyryx Learning Team
Bruce Bauslaugh
Peter Chow
Nathan Friess
Stephanie Keyowski
Claude Laflamme
Martha Laflamme
Jennifer MacKenzie
Tamsyn Murnaghan
Bogdan Sava
Ryan Yee
LICENSE
Creative Commons License (CC BY-NC-SA)
: This text, including the art and illustrations, are
available under the Creative Commons license (CC BY-NC-SA), allowing anyone to reuse, revise,
remix and redistribute the text.
To view a copy of this license, visit


Table of Contents
iii
1 Introduc on to Financial Accoun ng
1
. . . . . . . . . . . . . . . . . . . . . . . . . . . . . .
1
. . . . . . . . . . . . . . . . . . . . . . . . . . . . . . . . . . . .
1
. . . . . . . . . . . . . . . . . . . . . . . . . . . . . . . . .
3
. . . . . . . . . . . . . . . . . . . . . . . . . . . . . . .
3
Generally Accepted Accoun ng Principles (GAAP)
. . . . . . . . . . . . . . . . .
5
. . . . . . . . . . . . . . . . . . . . . . . . . . . . . . . .
8
Transac on Analysis and Double-entry Accoun ng
. . . . . . . . . . . . . . . .
15
Summary of Chapter 1 Learning Objec ves
. . . . . . . . . . . . . . . . . . . . . . . .
23
. . . . . . . . . . . . . . . . . . . . . . . . . . . . . . . . . . .
24
. . . . . . . . . . . . . . . . . . . . . . . . . . . . . . . . . . . . . . . . . .
25
. . . . . . . . . . . . . . . . . . . . . . . . . . . . . . . . . . . . . . . . .
38
45
. . . . . . . . . . . . . . . . . . . . . . . . . . . . . .
45
. . . . . . . . . . . . . . . . . . . . . . . . . . . . . . . . . . . .
45
. . . . . . . . . . . . . . . . . . . . . . . . . . . . . . . . . . . . . . .
46
Transac on Analysis Using Accounts
. . . . . . . . . . . . . . . . . . . . . . . .
51
. . . . . . . . . . . . . . . . . . . . . . . . . . . . . . . . . .
57
Using Formal Accoun ng Records
. . . . . . . . . . . . . . . . . . . . . . . . .
62
. . . . . . . . . . . . . . . . . . . . . . . . . . . . . . . .
71
iii

iv
Table of Contents
Summary of Chapter 2 Learning Objec ves
. . . . . . . . . . . . . . . . . . . . . . . .
72
. . . . . . . . . . . . . . . . . . . . . . . . . . . . . . . . . . .
73
. . . . . . . . . . . . . . . . . . . . . . . . . . . . . . . . . . . . . . . . . .
74
. . . . . . . . . . . . . . . . . . . . . . . . . . . . . . . . . . . . . . . . .
85
3 Financial Accoun ng and Adjus ng Entries
97
. . . . . . . . . . . . . . . . . . . . . . . . . . . . . .
97
. . . . . . . . . . . . . . . . . . . . . . . . . . . . . . . . . . . .
97
. . . . . . . . . . . . . . . . . . . . . . . . . . . . . . . . .
98
. . . . . . . . . . . . . . . . . . . . . . . . . . . . . . . . . .
104
. . . . . . . . . . . . . . . . . . . . . . . . . . . . .
116
Using the Adjusted Trial Balance to Prepare Financial Statements
. . . . . . . . .
117
. . . . . . . . . . . . . . . . . . . . . . . . . . . . . . . .
121
. . . . . . . . . . . . . . . . . . . . . . . . . . . . . . . . .
122
Summary of Chapter 3 Learning Objec ves
. . . . . . . . . . . . . . . . . . . . . . . .
126
. . . . . . . . . . . . . . . . . . . . . . . . . . . . . . . . . . .
128
. . . . . . . . . . . . . . . . . . . . . . . . . . . . . . . . . . . . . . . . . .
130
. . . . . . . . . . . . . . . . . . . . . . . . . . . . . . . . . . . . . . . . .
140
4 The Classified Balance Sheet and Related Disclosures
151
. . . . . . . . . . . . . . . . . . . . . . . . . . . . . .
151
. . . . . . . . . . . . . . . . . . . . . . . . . . . . . . . . . . . .
151
Financial Statement Disclosure Decisions
. . . . . . . . . . . . . . . . . . . . . .
152
. . . . . . . . . . . . . . . . . . . . . . . . . . . . . .
154
. . . . . . . . . . . . . . . . . . . . . . . . . . .
158
. . . . . . . . . . . . . . . . . . . . . . . . . . . . . . . . . . .
161
Management’s Responsibility for Financial Statements
. . . . . . . . . . . . . .
163
Summary of Chapter 4 Learning Objec ves
. . . . . . . . . . . . . . . . . . . . . . . .
164

v
. . . . . . . . . . . . . . . . . . . . . . . . . . . . . . . . . . .
166
. . . . . . . . . . . . . . . . . . . . . . . . . . . . . . . . . . . . . . . . . .
167
. . . . . . . . . . . . . . . . . . . . . . . . . . . . . . . . . . . . . . . . .
173
5 Accoun ng for the Sale of Goods
179
. . . . . . . . . . . . . . . . . . . . . . . . . . . . . .
179
. . . . . . . . . . . . . . . . . . . . . . . . . . . . . . . . . . . .
179
. . . . . . . . . . . . . . . . . . . . . . . . . . . .
181
The Purchase and Payment of Merchandise Inventory (Perpetual)
. . . . . . . .
183
Merchandise Inventory: Sales and Collec on (Perpetual)
. . . . . . . . . . . . .
186
Adjustments to Merchandise Inventory (Perpetual)
. . . . . . . . . . . . . . . .
189
Merchandising Income Statement
. . . . . . . . . . . . . . . . . . . . . . . . .
193
Closing Entries for a Merchandiser
. . . . . . . . . . . . . . . . . . . . . . . . .
195
Appendix A: The Periodic Inventory System
. . . . . . . . . . . . . . . . . . . .
195
Summary of Chapter 5 Learning Objec ves
. . . . . . . . . . . . . . . . . . . . . . . .
199
. . . . . . . . . . . . . . . . . . . . . . . . . . . . . . . . . . .
200
. . . . . . . . . . . . . . . . . . . . . . . . . . . . . . . . . . . . . . . . . .
201
. . . . . . . . . . . . . . . . . . . . . . . . . . . . . . . . . . . . . . . . .
206
6 Assigning Costs to Merchandise
215
. . . . . . . . . . . . . . . . . . . . . . . . . . . . . .
215
. . . . . . . . . . . . . . . . . . . . . . . . . . . . . . . . . . . .
215
Inventory Cost Flow Assump ons
. . . . . . . . . . . . . . . . . . . . . . . . . .
216
Financial Statement Impact of Different Inventory Cost Flows
. . . . . . . . . . .
229
Lower of Cost and Net Realizable Value (LCNRV)
. . . . . . . . . . . . . . . . . .
231
Es ma ng the Balance in Merchandise Inventory
. . . . . . . . . . . . . . . . .
233
Appendix A: Ra o Analysis—Merchandise Inventory Turnover
. . . . . . . . . .
237
Appendix B: Inventory Cost Flow Assump ons Under the Periodic System
. . . .
238

vi
Table of Contents
Summary of Chapter 6 Learning Objec ves
. . . . . . . . . . . . . . . . . . . . . . . .
240
. . . . . . . . . . . . . . . . . . . . . . . . . . . . . . . . . . .
242
. . . . . . . . . . . . . . . . . . . . . . . . . . . . . . . . . . . . . . . . . .
243
. . . . . . . . . . . . . . . . . . . . . . . . . . . . . . . . . . . . . . . . .
247
255
. . . . . . . . . . . . . . . . . . . . . . . . . . . . . .
255
. . . . . . . . . . . . . . . . . . . . . . . . . . . . . . . . . . . .
255
. . . . . . . . . . . . . . . . . . . . . . . . . . . . . . . . . . .
256
. . . . . . . . . . . . . . . . . . . . . . . . . . . . . . . . . . . . . .
258
. . . . . . . . . . . . . . . . . . . . . . . . . . .
260
. . . . . . . . . . . . . . . . . . . . . . . . . . . . . . . .
269
. . . . . . . . . . . . . . . . . . . . . . . . . . . .
277
Appendix A: Ra o Analysis—Acid Test
. . . . . . . . . . . . . . . . . . . . . . .
279
Appendix B: Ra o Analysis—Accounts Receivable Turnover
. . . . . . . . . . . .
280
Summary of Chapter 7 Learning Objec ves
. . . . . . . . . . . . . . . . . . . . . . . .
281
. . . . . . . . . . . . . . . . . . . . . . . . . . . . . . . . . . .
283
. . . . . . . . . . . . . . . . . . . . . . . . . . . . . . . . . . . . . . . . . .
283
. . . . . . . . . . . . . . . . . . . . . . . . . . . . . . . . . . . . . . . . .
288
297
. . . . . . . . . . . . . . . . . . . . . . . . . . . . . .
297
. . . . . . . . . . . . . . . . . . . . . . . . . . . . . . . . . . . .
297
Establishing the Cost of Property, Plant, and Equipment (PPE)
. . . . . . . . . . .
298
. . . . . . . . . . . . . . . . . . . . . . . . . . . . . . . . . . . . .
302
. . . . . . . . . . . . . . . . . . . . . . . . . . . . . .
308
. . . . . . . . . . . . . . . . . . . . . . . . . . . . . . . .
308
Impairment of Long-lived Assets
. . . . . . . . . . . . . . . . . . . . . . . . . .
312

vii
Derecogni on of Property, Plant, and Equipment
. . . . . . . . . . . . . . . . .
313
. . . . . . . . . . . . . . . . . . . . . . . . . . . . . . . . . .
317
. . . . . . . . . . . . . . . . . . . . . . . . . . . . . . . . . . . . . . .
320
. . . . . . . . . . . . . . . . . . . . . . . . . . . . . . . . . . . . . .
322
Summary of Chapter 8 Learning Objec ves
. . . . . . . . . . . . . . . . . . . . . . . .
322
. . . . . . . . . . . . . . . . . . . . . . . . . . . . . . . . . . .
326
. . . . . . . . . . . . . . . . . . . . . . . . . . . . . . . . . . . . . . . . . .
328
. . . . . . . . . . . . . . . . . . . . . . . . . . . . . . . . . . . . . . . . .
334
9 Debt Financing: Current and Long-term Liabili es
339
. . . . . . . . . . . . . . . . . . . . . . . . . . . . . .
339
. . . . . . . . . . . . . . . . . . . . . . . . . . . . . . . . . . . .
339
Current versus Long-term Liabili es
. . . . . . . . . . . . . . . . . . . . . . . .
340
. . . . . . . . . . . . . . . . . . . . . . . . . . . . . .
342
. . . . . . . . . . . . . . . . . . . . . . . . . . . .
346
Long-Term Liabili es—Bonds Payable
. . . . . . . . . . . . . . . . . . . . . . .
349
Long-term Liabili es—Loans Payable
. . . . . . . . . . . . . . . . . . . . . . . .
358
Appendix A: Present Value Calcula ons
. . . . . . . . . . . . . . . . . . . . . .
360
Appendix B: Addi onal Payroll Transac ons
. . . . . . . . . . . . . . . . . . . .
363
Appendix C: The Effec ve Interest Rate Method
. . . . . . . . . . . . . . . . . .
367
Summary of Chapter 9 Learning Objec ves
. . . . . . . . . . . . . . . . . . . . . . . .
371
. . . . . . . . . . . . . . . . . . . . . . . . . . . . . . . . . . .
372
. . . . . . . . . . . . . . . . . . . . . . . . . . . . . . . . . . . . . . . . . .
373
. . . . . . . . . . . . . . . . . . . . . . . . . . . . . . . . . . . . . . . . .
380
381
. . . . . . . . . . . . . . . . . . . . . . . . . . . . . .
381
. . . . . . . . . . . . . . . . . . . . . . . . . . . . . . . . . . . .
381

viii
Table of Contents
. . . . . . . . . . . . . . . . . . . . . . . . . . . . . .
382
10.2 Recording Share Transac ons
. . . . . . . . . . . . . . . . . . . . . . . . . . . .
388
. . . . . . . . . . . . . . . . . . . . . . . . . . . . . . . . . . .
393
. . . . . . . . . . . . . . . . . . . . . . . . . . . . . . . . . . .
397
. . . . . . . . . . . . . . . . . . . . . . . . . . . . . . . . . . . . .
399
10.6 Appendix A: Repor ng for Mul ple Classes of Shares
. . . . . . . . . . . . . . .
400
Summary of Chapter 10 Learning Objec ves
. . . . . . . . . . . . . . . . . . . . . . .
401
. . . . . . . . . . . . . . . . . . . . . . . . . . . . . . . . . . .
402
. . . . . . . . . . . . . . . . . . . . . . . . . . . . . . . . . . . . . . . . . .
403
. . . . . . . . . . . . . . . . . . . . . . . . . . . . . . . . . . . . . . . . .
412
11 The Statement of Cash Flows
417
. . . . . . . . . . . . . . . . . . . . . . . . . . . . . .
417
. . . . . . . . . . . . . . . . . . . . . . . . . . . . . . . . . . . .
417
11.1 Financial Statement Repor ng
. . . . . . . . . . . . . . . . . . . . . . . . . . .
418
11.2 Preparing the Statement of Cash Flows
. . . . . . . . . . . . . . . . . . . . . . .
419
11.3 Interpre ng the Statement of Cash Flows
. . . . . . . . . . . . . . . . . . . . .
432
11.4 Appendix A: Pu ng It All Together: Corporate Financial Statements
. . . . . . .
433
11.5 Appendix B: Statement of Cash Flows – Direct Method
. . . . . . . . . . . . . .
439
11.5.1 Preparing a Statement of Cash Flows: Direct Method
. . . . . . . . . . .
443
Summary of Chapter 11 Learning Objec ves
. . . . . . . . . . . . . . . . . . . . . . .
449
. . . . . . . . . . . . . . . . . . . . . . . . . . . . . . . . . . .
450
. . . . . . . . . . . . . . . . . . . . . . . . . . . . . . . . . . . . . . . . . .
450
. . . . . . . . . . . . . . . . . . . . . . . . . . . . . . . . . . . . . . . . .
465
12 Financial Statement Analysis
471
. . . . . . . . . . . . . . . . . . . . . . . . . . . . . .
471
. . . . . . . . . . . . . . . . . . . . . . . . . . . . . . . . . . . .
471

ix
12.1 Introduc on to Ra o Analysis
. . . . . . . . . . . . . . . . . . . . . . . . . . . .
472
12.2 Liquidity Ra os: Analyzing Short-term Cash Needs
. . . . . . . . . . . . . . . . .
475
12.3 Profitability Ra os: Analyzing Opera ng Ac vi es
. . . . . . . . . . . . . . . . .
483
12.4 Leverage Ra os: Analyzing Financial Structure
. . . . . . . . . . . . . . . . . . .
487
12.5 Market Ra os: Analysis of Financial Returns to Investors
. . . . . . . . . . . . .
490
12.6 Overall Analysis of Big Dog’s Financial Statements
. . . . . . . . . . . . . . . . .
493
12.7 Horizontal and Ver cal Trend Analysis
. . . . . . . . . . . . . . . . . . . . . . .
494
Summary of Chapter 12 Learning Objec ves
. . . . . . . . . . . . . . . . . . . . . . .
499
. . . . . . . . . . . . . . . . . . . . . . . . . . . . . . . . . . .
500
. . . . . . . . . . . . . . . . . . . . . . . . . . . . . . . . . . . . . . . . . .
501
. . . . . . . . . . . . . . . . . . . . . . . . . . . . . . . . . . . . . . . . .
510
13 Proprietorships and Partnerships
513
. . . . . . . . . . . . . . . . . . . . . . . . . . . . . .
513
. . . . . . . . . . . . . . . . . . . . . . . . . . . . . . . . . . . .
513
. . . . . . . . . . . . . . . . . . . . . . . . . . . . . . . . . . .
514
. . . . . . . . . . . . . . . . . . . . . . . . . . . . . . . . . . . . .
519
Summary of Chapter 13 Learning Objec ves
. . . . . . . . . . . . . . . . . . . . . . .
525
. . . . . . . . . . . . . . . . . . . . . . . . . . . . . . . . . . .
525
. . . . . . . . . . . . . . . . . . . . . . . . . . . . . . . . . . . . . . . . . .
526
. . . . . . . . . . . . . . . . . . . . . . . . . . . . . . . . . . . . . . . . .
531
Solu ons To Discussion Ques ons
533
. . . . . . . . . . . . . . . . . . . . . . . . . . . . . . . . . . . .
533
. . . . . . . . . . . . . . . . . . . . . . . . . . . . . . . . . . . .
535
. . . . . . . . . . . . . . . . . . . . . . . . . . . . . . . . . . . .
537
. . . . . . . . . . . . . . . . . . . . . . . . . . . . . . . . . . . .
541
. . . . . . . . . . . . . . . . . . . . . . . . . . . . . . . . . . . .
542

x
Table of Contents
. . . . . . . . . . . . . . . . . . . . . . . . . . . . . . . . . . . .
543
. . . . . . . . . . . . . . . . . . . . . . . . . . . . . . . . . . . .
546
. . . . . . . . . . . . . . . . . . . . . . . . . . . . . . . . . . . .
548
. . . . . . . . . . . . . . . . . . . . . . . . . . . . . . . . . . . .
551
. . . . . . . . . . . . . . . . . . . . . . . . . . . . . . . . . . .
554
. . . . . . . . . . . . . . . . . . . . . . . . . . . . . . . . . . .
557
. . . . . . . . . . . . . . . . . . . . . . . . . . . . . . . . . . .
559
. . . . . . . . . . . . . . . . . . . . . . . . . . . . . . . . . . .
562
565
. . . . . . . . . . . . . . . . . . . . . . . . . . . . . . . . . . . .
565
. . . . . . . . . . . . . . . . . . . . . . . . . . . . . . . . . . . .
577
. . . . . . . . . . . . . . . . . . . . . . . . . . . . . . . . . . . .
589
. . . . . . . . . . . . . . . . . . . . . . . . . . . . . . . . . . . .
601
. . . . . . . . . . . . . . . . . . . . . . . . . . . . . . . . . . . .
609
. . . . . . . . . . . . . . . . . . . . . . . . . . . . . . . . . . . .
617
. . . . . . . . . . . . . . . . . . . . . . . . . . . . . . . . . . . .
621
. . . . . . . . . . . . . . . . . . . . . . . . . . . . . . . . . . . .
627
. . . . . . . . . . . . . . . . . . . . . . . . . . . . . . . . . . . .
635
. . . . . . . . . . . . . . . . . . . . . . . . . . . . . . . . . . .
648
. . . . . . . . . . . . . . . . . . . . . . . . . . . . . . . . . . .
663
. . . . . . . . . . . . . . . . . . . . . . . . . . . . . . . . . . .
680
. . . . . . . . . . . . . . . . . . . . . . . . . . . . . . . . . . .
690
701
. . . . . . . . . . . . . . . . . . . . . . . . . . . . . . . . . . . .
701
. . . . . . . . . . . . . . . . . . . . . . . . . . . . . . . . . . . .
706
. . . . . . . . . . . . . . . . . . . . . . . . . . . . . . . . . . . .
723

xi
. . . . . . . . . . . . . . . . . . . . . . . . . . . . . . . . . . . .
746
. . . . . . . . . . . . . . . . . . . . . . . . . . . . . . . . . . . .
755
. . . . . . . . . . . . . . . . . . . . . . . . . . . . . . . . . . . .
766
. . . . . . . . . . . . . . . . . . . . . . . . . . . . . . . . . . . .
775
. . . . . . . . . . . . . . . . . . . . . . . . . . . . . . . . . . . .
783
. . . . . . . . . . . . . . . . . . . . . . . . . . . . . . . . . . . .
790
. . . . . . . . . . . . . . . . . . . . . . . . . . . . . . . . . . .
792
. . . . . . . . . . . . . . . . . . . . . . . . . . . . . . . . . . .
796
. . . . . . . . . . . . . . . . . . . . . . . . . . . . . . . . . . .
803
. . . . . . . . . . . . . . . . . . . . . . . . . . . . . . . . . . .
806


Chapter 1
Introduc on to Financial Accoun ng
Accoun ng involves a process of collec ng, recording, and repor ng a business’s economic ac-
vi es to users. It is o en called the language of business because it uses a unique vocabulary
to communicate informa on to decision makers. To understand accoun ng, we first look at the
basic forms of business organiza ons. The concepts and principles that provide the founda on
for financial accoun ng are then discussed. With an emphasis on the corporate form of business
organiza on, we will examine how we communicate to users of financial informa on using finan-
cial statements. Finally, we will review how financial transac ons are analyzed and then reported
on financial statements.
Chapter 1 Learning Objec ves
LO1 – Define accoun ng.
LO2 – Iden fy and describe the forms of business organiza on.
LO3 – Iden fy and explain the Generally Accepted Accoun ng Principles (GAAP).
LO4 – Iden fy, explain, and prepare the financial statements.
LO5 – Analyze transac ons by using the accoun ng equa on.
Concept Self-Check
Use the following as a self-check while working through Chapter
1. What is accoun ng?
2. What is the difference between internal and external users of accoun ng informa on?
3. What is the difference between managerial and financial accoun ng?
4. What is the difference between a business organiza on and a non-business organiza on?
5. What are the three types of business organiza ons?
6. What is a PAE? A PE?
7. What does the term limited liability mean?
1

2
Introduc on to Financial Accoun ng
8. Explain how ethics are involved in the prac ce of accoun ng.
9. Describe what GAAP refers to.
10. Iden fy and explain the six qualita ve characteris cs of GAAP.
11. Iden fy and explain at least five of the nine principles that support the GAAP qualita ve
characteris cs.
12. How is financial informa on communicated to external users?
13. What are the four financial statements?
14. Which financial statement measures financial performance? Financial posi on?
15. What informa on is provided in the statement of cash flows?
16. Explain how retained earnings and dividends are related.
17. What are the three primary components of the balance sheet?
18. Equity consists of what two components?
19. How are assets financed?
20. Iden fy and explain the three types of ac vi es a business engages in.
21. What are notes to the financial statements?
22. What is the accoun ng equa on?
23. What are the dis nc ons among calendar, interim, and fiscal year ends?
NOTE: The purpose of these ques ons is to prepare you for the concepts introduced in the chap-
ter. Your goal should be to answer each of these ques ons as you read through the chapter. If,
when you complete the chapter, you are unable to answer one or more the Concept Self-Check
ques ons, go back through the content to find the answer(s). Solu ons are not provided to these
ques ons.

1.1. Accoun ng Defined
3
1.1 Accoun ng Defined
LO1 – Define
accoun ng.
Accoun ng is the process of iden fying, measuring, recording, and com-
munica ng an organiza on’s economic ac vi es to users. Users need in-
forma on for decision making. Internal users of accoun ng informa on
work for the organiza on and are responsible for planning, organizing,
and opera ng the en ty. The area of accoun ng known as managerial
accoun ng serves the decision-making needs of internal users. External
users do not work for the organiza on and include investors, creditors,
labour unions, and customers. Financial accoun ng is the area of account-
ing that focuses on external repor ng and mee ng the needs of external
users. This book addresses financial accoun ng. Managerial accoun ng is
covered in other books.
1.2 Business Organiza ons
LO2 – Iden fy
and describe the
forms of business
organiza on.
An organiza on is a group of individuals who come together to pursue
a common set of goals and objec ves. There are two types of business
organiza ons: business and non-business. A business organiza on sells
products and/or services for profit. A non-business organiza on, such as
a charity or hospital, exists to meet various societal needs and does not
have profit as a goal. All businesses, regardless of type, record, report,
and, most importantly, use accoun ng informa on for making decisions.
This book focuses on business organiza ons. There are three common forms of business organi-
za ons — a proprietorship, a partnership, and a corpora on.
Proprietorship
A proprietorship is a business owned by one person. It is not a separate legal en ty, which means
that the business and the owner are considered to be the same en ty. This means, for example,
that from an income tax perspec ve, the profits of a proprietorship are taxed as part of the owner’s
personal income tax return. Unlimited liability is another characteris c of a sole proprietorship
meaning that if the business could not pay its debts, the owner would be responsible even if the
business’s debts were greater than the owner’s personal resources.
Partnership
A partnership is a business owned by two or more individuals. Like the proprietorship, it is not a
separate legal en ty and its owners are typically subject to unlimited liability.
4
Introduc on to Financial Accoun ng
Corpora on
A corpora on is a business owned by one or more owners. The owners are known as shareholders.
A shareholder owns shares of the corpora on. Shares
are units of ownership in a corpora on.
For example, if a corpora on has 1,000 shares, there may be three shareholders where one has
700 shares, another has 200 shares, and the third has 100 shares. The number of shares held by a
shareholder represents how much of the corpora on they own. A corpora on can have different
types of shares; this topic is discussed in a later chapter. When there is only one type of share, it
is usually called common shares.
A corpora on’s shares can be privately held or available for public sale. A corpora on that holds
its shares privately and does not sell them publicly is known as a private enterprise (PE). A corpo-
ra on that sells its shares publicly, typically on a stock exchange, is called a publicly accountable
enterprise (PAE).
Unlike the proprietorship and partnership, a corpora on is a separate legal en ty. This means, for
example, that from an income tax perspec ve, a corpora on files its own tax return. The owners
or shareholders of a corpora on are not responsible for the corpora on’s debts so have limited
liability meaning that the most they can lose is what they invested in the corpora on.
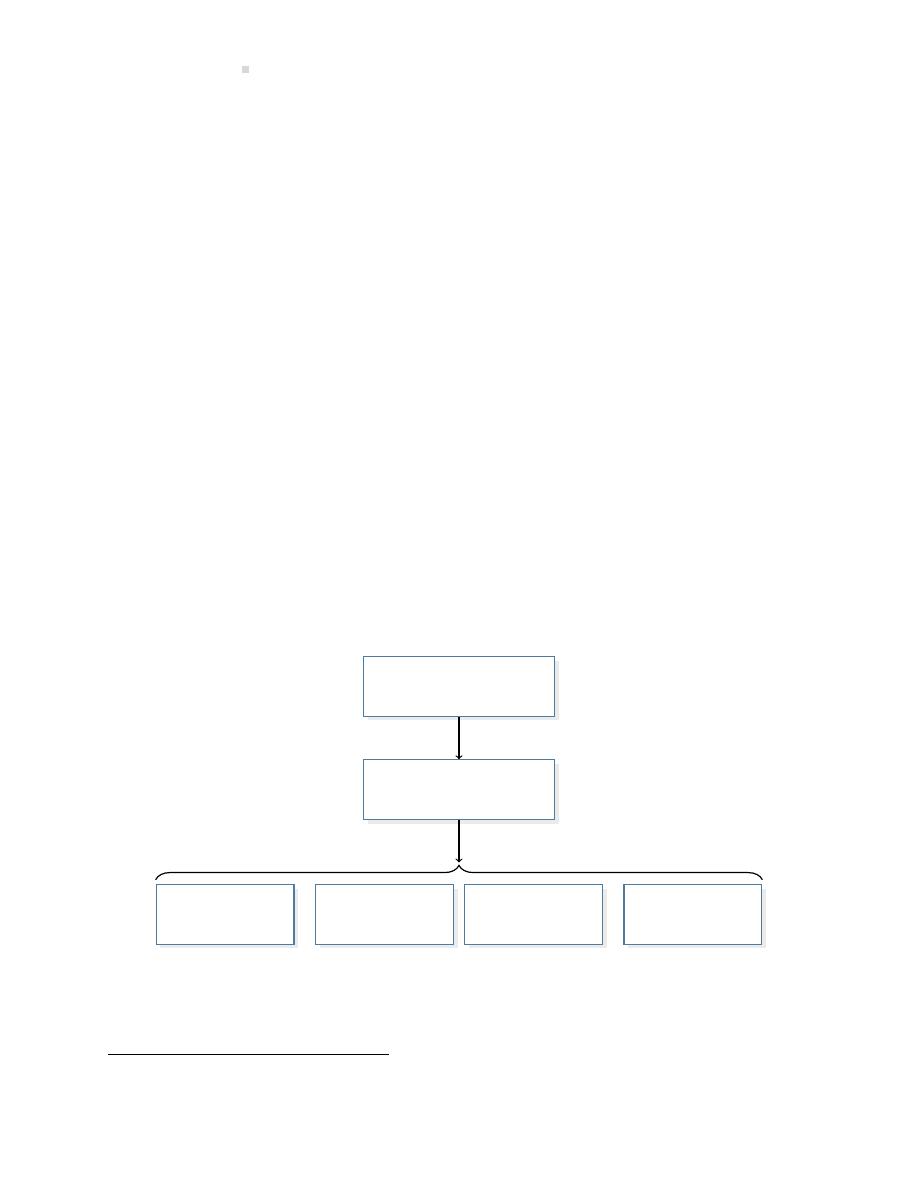
In larger corpora ons, there can be many shareholders. In these cases, shareholders do not man-
age a corpora on but par cipate indirectly through the elec on of a Board of Directors. The Board
of Directors does not par cipate in the day-to-day management of the corpora on but delegates
this responsibility to the officers of the corpora on. An example of this delega on of responsibility
is illustrated in Figure
SHAREHOLDERS
(Owners)
BOARD OF DIRECTORS
(Represent Owners)
PRESIDENT
VICE PRES.
MARKETING
VICE PRES.
FINANCE
VICE PRES.
PRODUCTION
Elect
Appoint
Figure 1.1: Generalized Form of a Corporate Organiza on
Shareholders usually meet annually to elect a Board of Directors. The Board of Directors meets
1
Shares are also called stock.
1.3. Generally Accepted Accoun ng Principles (GAAP)
5
regularly to review the corpora on’s opera ons and to set policies for future opera ons. Unlike
shareholders, directors can be held personally liable if a company fails.
The focus of these chapters will be on the corporate form of business organiza on. The propri-
etorship and partnership organiza ons will be discussed in more detail in Chapter
An explora on is available on the Lyryx site. Log into your Lyryx course to run
.
1.3 Generally Accepted Accoun ng Principles (GAAP)
LO3 – Iden fy
and explain the
Generally
Ac-
cepted Account-
ing
Principles
(GAAP).
The goal of accoun ng is to ensure informa on provided to decision mak-
ers is useful. To be useful, informa on must be relevant and faithfully
represent a business’s economic ac vi es. This requires ethics, beliefs
that help us differen ate right from wrong, in the applica on of under-
lying accoun ng concepts or principles. These underlying accoun ng con-
cepts or principles are known as Generally Accepted Accoun ng Princi-
ples (GAAP).
GAAP in Canada, as well as in many other countries, is based on Interna onal Financial Repor ng
Standards (IFRS) for publicly accountable enterprises (PAE). IFRS are issued by the Interna onal
Accoun ng Standards Board (IASB). The IASB’s mandate is to promote the adop on of a single set
of global accoun ng standards through a process of open and transparent discussions among cor-
pora ons, financial ins tu ons, and accoun ng firms around the world. Private enterprises (PE)
in Canada are permi ed to follow either IFRS or Accoun ng Standards for Private Enterprises
(ASPE), a set of less onerous GAAP-based standards developed by the Canadian Accoun ng Stan-
dards Board (AcSB). The AcSB is the body that governs accoun ng standards in Canada. The focus
in this book will be on IFRS for PAEs
.
Accoun ng prac ces are guided by GAAP which are comprised of qualita ve characteris cs and
principles. As already stated, relevance and faithful representa on are the primary qualita ve
characteris cs. Comparability, verifiability, meliness, and understandability are addi onal qual-
ita ve characteris cs.
Informa on that possesses the quality of:
• relevance has the ability to make a difference in the decision-making process.
• faithful representa on is complete, neutral, and free from error.
• comparability tells users of the informa on that businesses u lize similar accoun ng prac-
ces.
2
It should be noted, however, that at the introductory level, there are no significant differences in how IFRS and
ASPE are applied.

6
Introduc on to Financial Accoun ng
• verifiability means that others are able to confirm that the informa on faithfully represents
the economic ac vi es of the business.
•
meliness is available to decision makers in me to be useful.
• understandability is clear and concise.
Table
lists the nine principles that support these qualita ve characteris cs.

1.3. Generally Accepted Accoun ng Principles (GAAP)
7
Accoun ng Principle
Explana on/Example
Business en ty
Requires that each economic en ty maintain separate records.
Example:
A business owner keeps separate accoun ng records
for business transac ons and for personal transac ons.
Consistency
Requires that a business use the same accoun ng policies and proce-
dures from period to period.
Example: A business uses a par cular inventory cos ng method.
It cannot change to a different inventory cos ng method in the next
accoun ng period.
Cost
Requires that each economic transac on be based on the actual
original cost (also known as historical cost principle).
Example: The business purchases a delivery truck adver sed for
$75,000 and pays $70,000. The truck must be recorded at the cost of
$70,000, the amount actually paid.
Full disclosure
Requires that accoun ng informa on communicate sufficient informa-
on to allow users to make knowledgeable decisions.
Example:
A business is applying to the bank for a $1,000,000
loan. The business is being sued for $20,000,000 and it is certain that
it will lose. The business must tell the bank about the lawsuit even
though the lawsuit has not yet been finalized.
Going concern
Assumes that a business will con nue for the foreseeable future.
Example: All indica ons are that Business X will con nue so it
is reported to be a ‘going concern’. Business Z is being sued for
$20,000,000 and it is certain that it will lose. The $20,000,000 loss
will force the business to close. Business Z must not only disclose the
lawsuit but it must also indicate that there is a ‘going concern’ issue.
Matching
Requires that financial transac ons be reported in the period in which
they occurred/were realized.
Example: Supplies were purchased March 15 for $700. They will
be recorded as an asset on March 15 and then expensed as they are
used.
Materiality
Requires a business to apply proper accoun ng only for items that
would affect decisions made by users.
Example: The business purchases a stapler for $5 today. Techni-
cally, the stapler will last several years so should be recorded as
an asset. However, the business will record the $5 as an expense
instead because deprecia ng a $5 item will not impact the decisions of
financial informa on.

8
Introduc on to Financial Accoun ng
Accoun ng Principle
Explana on/Example
Monetary unit
Requires that financial informa on be communicated in stable units of
money.
Example: Land was purchased in 1940 for $5,000 Canadian. It is
maintained in the accoun ng records at $5,000 Canadian and is not
adjusted.
Recogni on
Requires that revenues be recorded when earned and expenses be
recorded when incurred, which is not necessarily when cash is received
(in the case of revenues) or paid (in the case of expenses).
Example: A sale occurred on March 5.
The customer received
the product on March 5 but will pay for it on April 5. The business
records the sale on March 5 when the sale occurred even though the
cash is not received un l April 5.
Table 1.1: Accoun ng Principles
Note: Some of the principles discussed above may be challenging to understand because related
concepts have not yet been introduced. Therefore, most of these principles will be discussed again
in more detail in a later chapter.
1.4 Financial Statements
LO4 – Iden fy,
explain, and pre-
pare the financial
statements.
Recall that financial accoun ng focuses on communica ng informa on to
external users. That informa on is communicated using financial state-
ments. There are four financial statements: the income statement, state-
ment of changes in equity, balance sheet, and statement of cash flows.
Each of these is introduced in the following sec ons using an example
based on a fic
ous corporate organiza on called Big Dog Carworks Corp.
The Income Statement
An income statement communicates informa on about a business’s financial performance by
summarizing revenues less expenses over a period of me. Revenues are created when a business
provides products or services to a customer in exchange for assets. Assets are resources result-
ing from past events and from which future economic benefits are expected to result. Examples
of assets include cash, equipment, and supplies. Assets will be discussed in more detail later in
this chapter. Expenses are the assets that have been used up or the obliga ons incurred in the
course of earning revenues. When revenues are greater than expenses, the difference is called
net income or profit. When expenses are greater than revenue, a net loss results.
1.4. Financial Statements
9
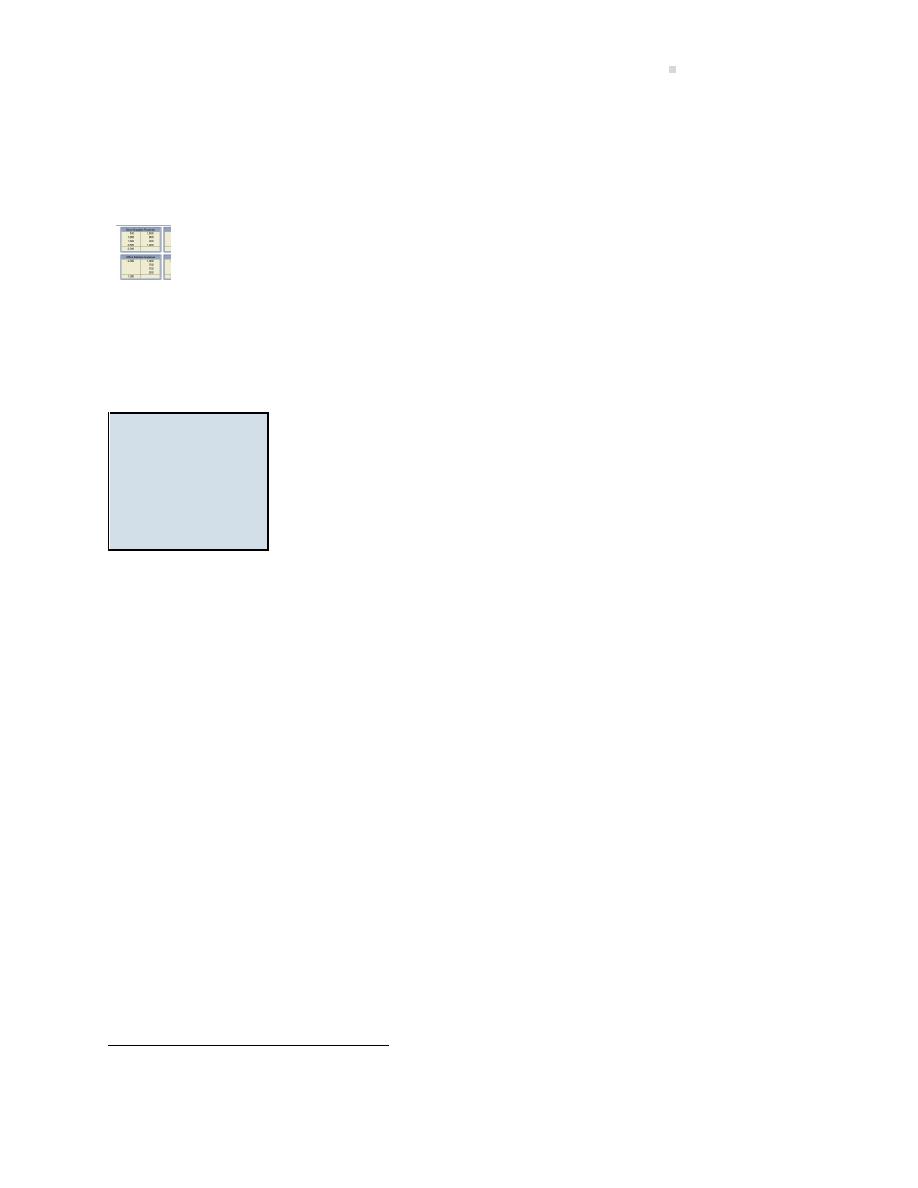
Consider the following income statement of Big Dog Carworks Corp. (BDCC). This business was
started on January 1, 2015 by Bob “Big Dog” Baldwin in order to repair automobiles. All the shares
of the corpora on are owned by Bob.
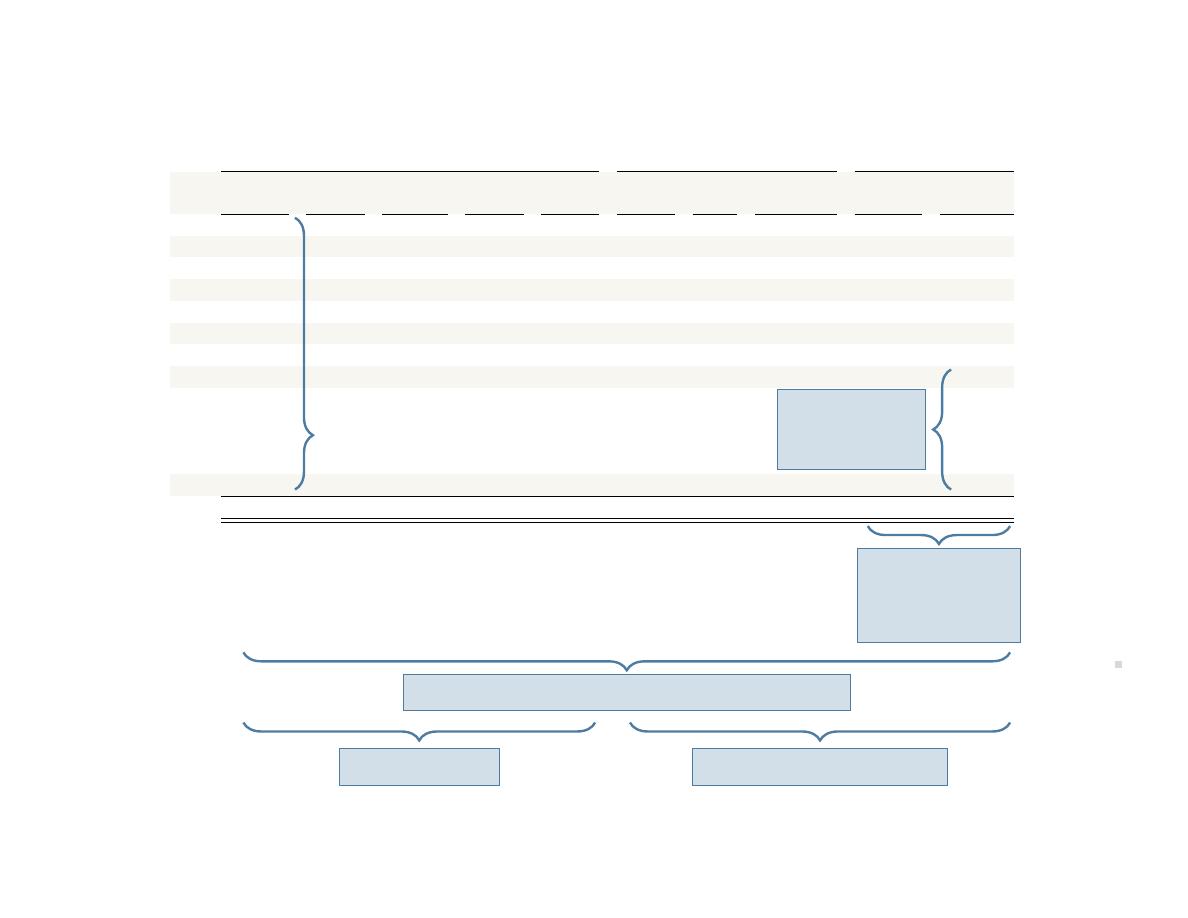
At January 31, the income statement shows total revenues of $10,000 and various expenses to-
taling $7,800. Net income, the difference between $10,000 of revenues and $7,800 of expenses,
equals $2,200.
Big Dog Carworks Corp.
Income Statement
For the Month Ended January 31, 2015
Revenues
Repair revenues
$10,000
Expenses
Rent expense
$1,600
Salaries expense
3,500
Supplies expense
2,000
Fuel expense
700
Total expenses
7,800
Net income
$2,200
The heading shows the
name of the en ty,
the type of financial
statement, and the
period-in- me date.
The net income
is transferred to
the statement
of changes in
equity.
An explora on is available on the Lyryx site. Log into your Lyryx course to run
The Statement of Changes in Equity
The statement of changes in equity provides informa on about how the balances in Share capital
and Retained earnings changed during the period. Share capital is a heading in the shareholders’
equity sec on of the balance sheet and represents how much shareholders have invested. When
shareholders buy shares, they are inves ng in the business. The number of shares they purchase
will determine how much of the corpora on they own. The type of ownership unit purchased by
Big Dog’s shareholders is known as common shares. Other types of shares will be discussed in a
later chapter. When a corpora on sells its shares to shareholders, the corpora on is said to be
issuing shares to shareholders.
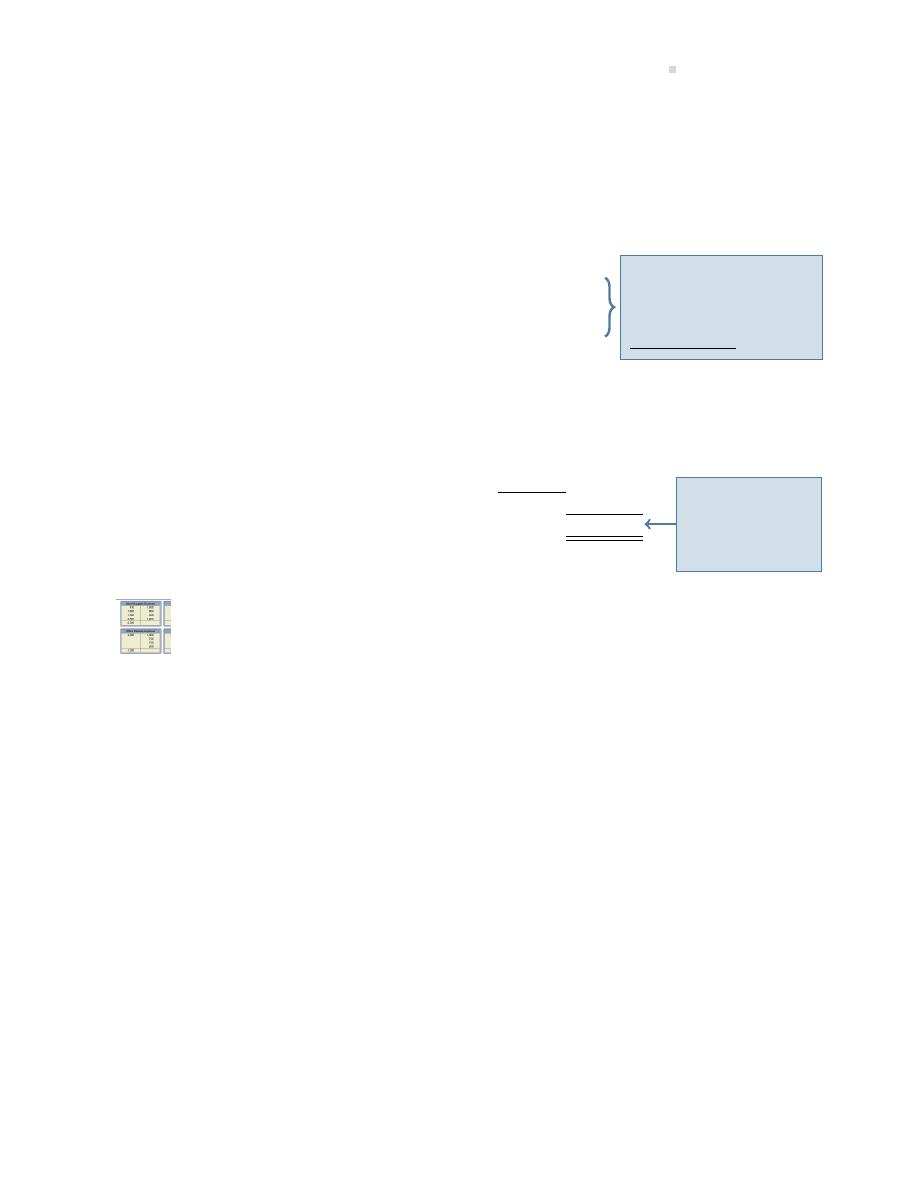
In the statement of changes in equity shown below, Share capital and Retained earnings balances
at January 1 are zero because the corpora on started the business on that date. During January,
Share capital of $10,000 was issued to shareholders so the January 31 balance is $10,000.
Retained earnings is the sum of all net incomes earned by a corpora on over its life, less any
distribu ons of these net incomes to shareholders. Distribu ons of net income to shareholders
are called dividends. Shareholders generally have the right to share in dividends according to the
10
Introduc on to Financial Accoun ng
percentage of their ownership interest. To demonstrate the concept of retained earnings, recall
that Big Dog has been in business for one month in which $2,200 of net income was reported.
Addi onally, $200 of dividends were distributed, so these are subtracted from retained earnings.
Big Dog’s retained earnings were therefore $2,000 at January 31, 2015 as shown in the statement
of changes in equity below.
Big Dog Carworks Corp.
Statement of Changes in Equity
For the Month Ended January 31, 2015
Share
Retained
Total
Capital
Earnings
Equity
Opening balance
$
-0-
$
-0-
$
-0-
Shares issued
10,000
10,000
Net income
2,200
2,200
Dividends
(200)
(200)
Ending balance
$10,000
$2,000
$12,000
The heading shows the
name of the en ty,
the type of financial
statement, and the
period-in- me date.
These totals are transferred
to the balance sheet at Jan-
uary 31, 2015.
To demonstrate how retained earnings would appear in the next accoun ng period, let’s assume
that Big Dog reported a net income of $5,000 for February, 2015 and dividends of $1,000 were
given to the shareholder. Based on this informa on, retained earnings at the end of February
would be $6,000, calculated as the $2,000 January 31 balance plus the $5,000 February net income
less the $1,000 February dividend. The balance in retained earnings con nues to change over me
because of addi onal net incomes/losses and dividends.
An explora on is available on the Lyryx site. Log into your Lyryx course to run
Statement of Changes in Equity
.
The Balance Sheet
The balance sheet, or statement of financial posi on, shows a business’s assets, liabili es, and
equity at a point in me. The balance sheet of Big Dog Carworks Corp. at January 31, 2015 is
shown below.
1.4. Financial Statements
11
Big Dog Carworks Corp.
Balance Sheet
At January 31, 2015
Assets
Liabili es
Cash
$ 3,700
Bank Loan
$ 6,000
Accounts receivable
2,000
Accounts payable
700
Prepaid insurance
2,400
Unearned revenue
400
Equipment
3,000
Total liabili es
$ 7,100
Truck
8,000
Equity
Share capital
$10,000
Retained earnings
2,000
Total equity
12,000
Total assets
$19,100
Total liabili es and equity
$19,100
The heading shows the name of
the en ty, the type of financial
statement, and the point-in- me
date.
Total assets ($19,100 here)
always equal Total liabili es
($7,100) plus Equity ($12,000).
What Is an Asset?
Assets are economic resources that provide future benefits to the business. Examples include
cash, accounts receivable, prepaid expenses, equipment, and trucks. Cash is coins and currency,
usually held in a bank account, and is a financial resource with future benefit because of its pur-
chasing power. Accounts receivable represent amounts to be collected in cash in the future for
goods sold or services provided to customers on credit. Prepaid expenses are assets that are paid
in cash in advance and have benefits that apply over future periods. For example, a one-year in-
surance policy purchased for cash on January 1, 2015 will provide a benefit un l December 31,
2015 so is a prepaid asset. The equipment and truck were purchased on January 1, 2015 and will
provide benefits for 2015 and beyond so are assets.
What Is a Liability?
A liability is an obliga on to pay an asset in the future. For example, Big Dog’s bank loan represents
an obliga on to repay cash in the future to the bank. Accounts payable are obliga ons to pay a
creditor for goods purchased or services rendered. A creditor owns the right to receive payment
from an individual or business. Unearned revenue represents an advance payment of cash from
a customer for Big Dog’s services or products to be provided in the future. For example, Big Dog
collected cash from a customer in advance for a repair to be done in the future.

12
Introduc on to Financial Accoun ng
An explora on is available on the Lyryx site. Log into your Lyryx course to run
.
What Is Equity?
Equity represents the net assets owned by the owners (the shareholders). Net assets are assets
minus liabili es. For example, in Big Dog’s January 31 balance sheet, net assets are $12,000, cal-
culated as total assets of $19,100 minus total liabili es of $7,100. This means that although there
are $19,100 of assets, only $12,000 are owned by the shareholders and the balance, $7,100, are
financed by debt. No ce that net assets and total equity are the same value; both are $12,000.
Equity consists of share capital and retained earnings. Share capital represents how much the
shareholders have invested in the business. Retained earnings is the sum of all net incomes earned
by a corpora on over its life, less any dividends distributed to shareholders.
In summary, the balance sheet is represented by the equa on: Assets = Liabili es + Equity. Assets
are the investments held by a business. The liabili es and equity explain how the assets have been
financed, or funded. Assets can be financed through liabili es, also known as debt, or equity.
Equity represents amounts that are owned by the owners, the shareholders, and consists of share
capital and retained earnings. Investments made by shareholders, namely share capital, are used
to finance assets and/or pay down liabili es. Addi onally, retained earnings, comprised of net
income less any dividends, also represent a source of financing.
An explora on is available on the Lyryx site. Log into your Lyryx course to run
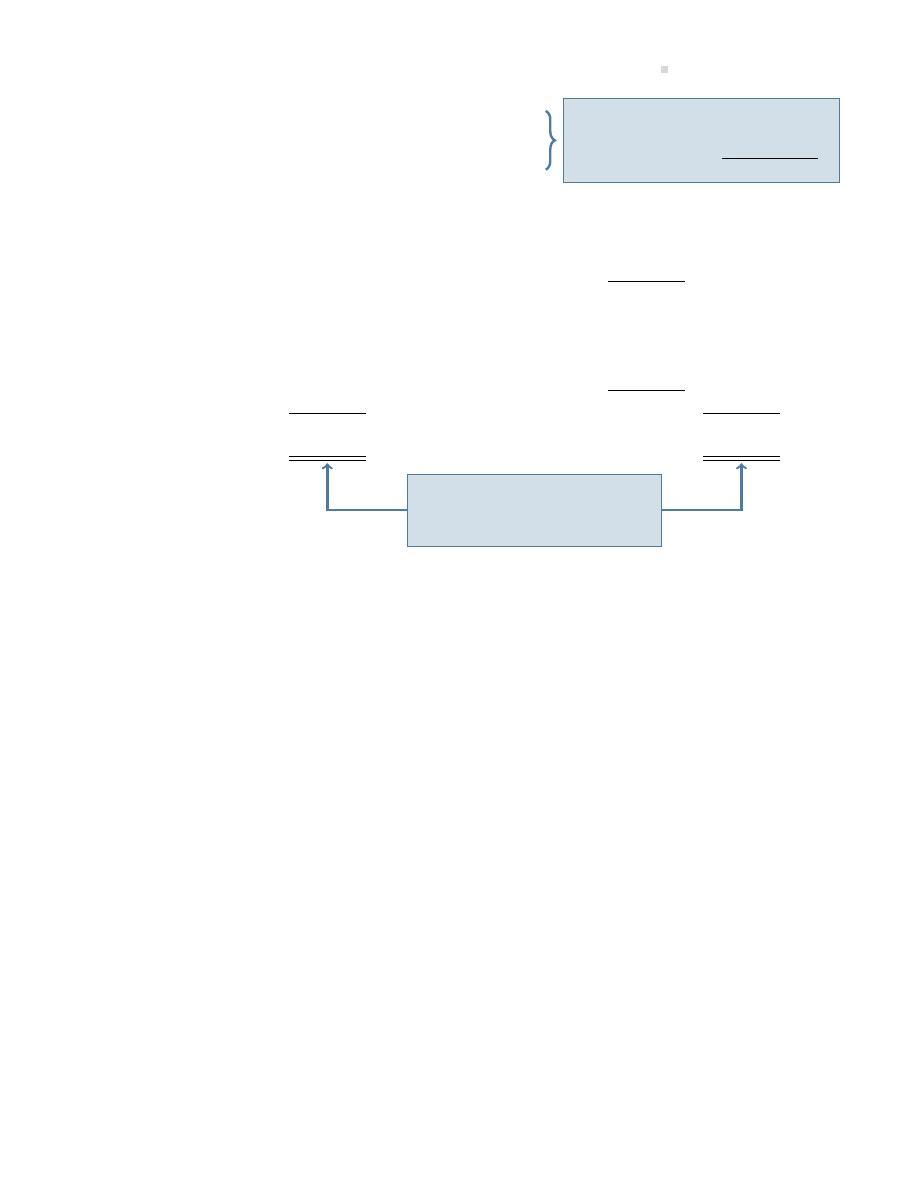
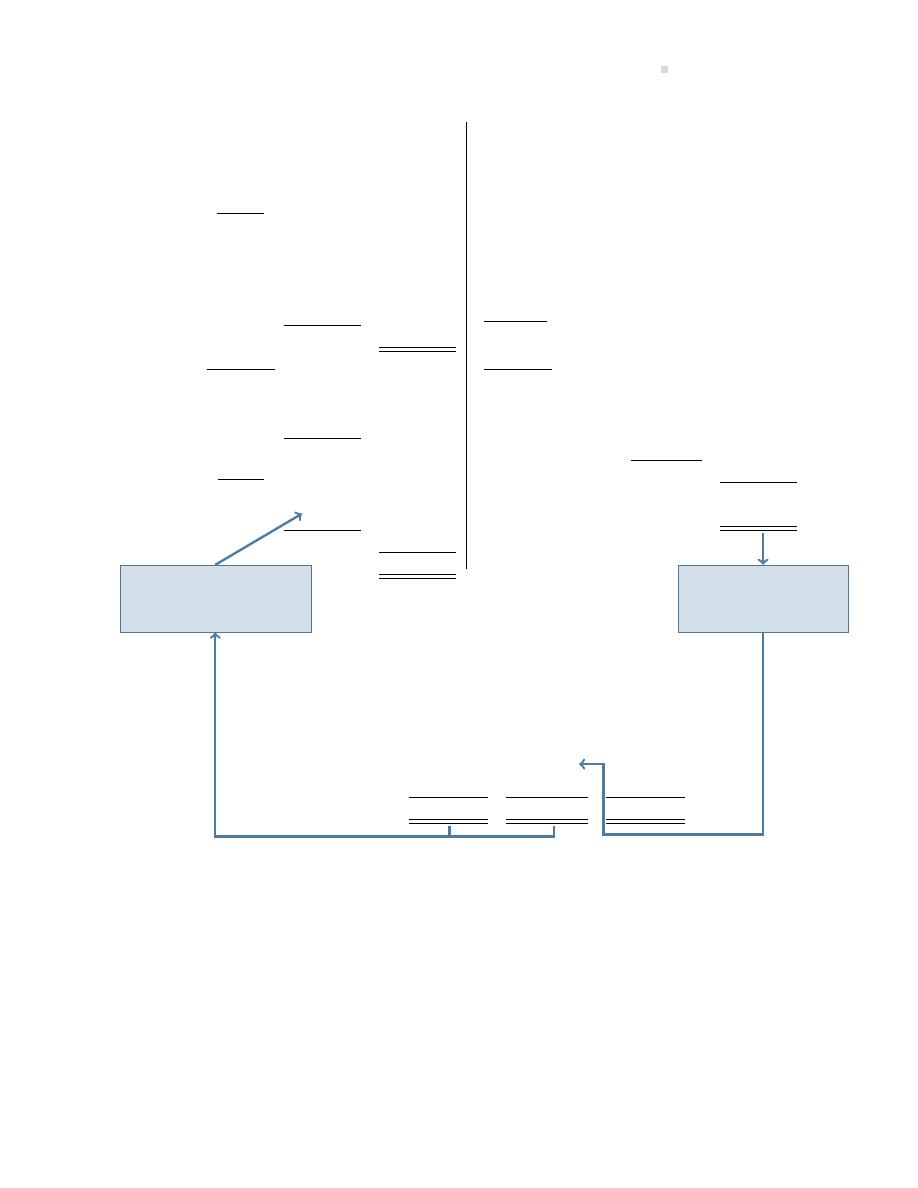
The Statement of Cash Flows (SCF)
Cash is an asset reported on the balance sheet. Ensuring there is sufficient cash to pay expenses
and liabili es as they come due is a cri cal business ac vity. The statement of cash flows (SCF)
explains how the balance in cash changed over a period of me by detailing the sources (inflows)
and uses (ou lows) of cash by type of ac vity: opera ng, inves ng, and financing, as these are the
three types of ac vi es a business engages in. Opera ng ac vi es are the day-to-day processes
involved in selling products and/or services to generate net income. Examples of opera ng ac vi-
es include the purchase and use of supplies, paying employees, fuelling equipment, and ren ng
space for the business. Inves ng ac vi es are the buying of assets needed to generate revenues.
For example, when an airline purchases airplanes, it is inves ng in assets required to help it gen-
erate revenue. Financing ac vi es are the raising of money needed to invest in assets. Financing
can involve issuing share capital (ge ng money from the owners known as shareholders) or bor-
rowing. Figure
summarizes the interrela onships among the three types of business ac vi es.

1.4. Financial Statements
13
Opera ng
Ac vi es
(creates net
income)
Inves ng
Ac vi es
(buys assets to
generate revenues)
Financing
Ac vi es
(raises money to
invest in assets)
Cash flows result-
ing from opera ng
ac vi es can be
reinvested in
Cash flows resul ng
from opera ng
ac vi es can be
used to pay down
Cash flows resul ng
from financing
ac vi es can be
used to buy assets
Figure 1.2: Rela onships Among the Three Types of Business Ac vi es
The statement of cash flows for Big Dog is shown below.

14
Introduc on to Financial Accoun ng
Big Dog Carworks Corp.
Statement of Cash Flows
For the Month Ended January 31, 2015
Opera ng ac vi es:
Net income
$ 2,200
Adjustments:
Increase in unearned revenues
400
Increase in accounts payable
700
Increase in prepaid insurance
(2,400)
Increase in accounts receivable
(2,000)
Net cash used by opera ng ac vi es
$(1,100)
Inves ng ac vi es:
Purchase of equipment
$(3,000)
Purchase of truck
(3,000)
Net cash used by inves ng ac vi es
(6,000)
Financing ac vi es:
Issued shares
$10,000
Borrowed from bank
3,000
Payment on bank loan
(2,000)
Paid dividends
(200)
Net cash provided by financing ac vi es
10,800
Net increase in cash
3,700
Cash balance, January 1
-0-
Cash balance, January 31
$3,700
The heading shows
the name of the en-
ty, the type of finan-
cial statement, and
the period-in- me
date.
This agrees with the Cash
amount shown on the Balance
Sheet at January 31, 2015.
The statement of cash flows is useful because cash is one of the most important assets of a corpo-
ra on. Informa on about expected future cash flows are therefore important for decision makers.
For instance, Big Dog’s bank manager needs to determine whether the remaining $6,000 loan can
be repaid, and also whether or not to grant a new loan to the corpora on if requested. The state-
ment of cash flows helps inform those who make these decisions.
Notes to the Financial Statements
An essen al part of financial statements are the notes that accompany them. These notes are
generally located at the end of a set of financial statements. The notes provide greater detail about
various amounts shown in the financial statements, or provide non-quan ta ve informa on that
is useful to users. For example, a note may indicate the es mated useful lives of long-lived assets,
or loan repayment terms. Examples of note disclosures will be provided later.
1.5. Transac on Analysis and Double-entry Accoun ng
15
An explora on is available on the Lyryx site. Log into your Lyryx course to run
Communica ng Through Financial Statements
.
1.5 Transac on Analysis and Double-entry Accoun ng
LO5 – Analyze
transac ons
by
using
the
accoun ng
equa on.
The accoun ng equa on is founda onal to accoun ng. It shows that the
total assets of a business must always equal the total claims against those
assets by creditors and owners. The equa on is expressed as:
ASSETS
=
LIABILITIES
+
EQUITY
(economic resources
(creditors’ claims
(owners’ claims
owned by an en ty)
on assets)
on assets)
When financial transac ons are recorded, combined effects on assets, liabili es, and equity are
always exactly offse ng. This is the reason that the balance sheet always balances.
Each economic exchange is referred to as a financial transac on — for example, when an orga-
niza on exchanges cash for land and buildings. Incurring a liability in return for an asset is also a
financial transac on. Instead of paying cash for land and buildings, an organiza on may borrow
money from a financial ins tu on. The company must repay this with cash payments in the fu-
ture. The accoun ng equa on provides a system for processing and summarizing these sorts of
transac ons.
Accountants view financial transac ons as economic events that change components within the
accoun ng equa on. These changes are usually triggered by informa on contained in source
documents (such as sales invoices and bills from creditors) that can be verified for accuracy.
The accoun ng equa on can be expanded to include all the items listed on the Balance Sheet of
Big Dog at January 31, 2015, as follows:
ASSETS
=
LIABILITIES
+
EQUITY
Cash + Accounts + Prepaid + Equipment + Truck
=
Bank + Accounts + Unearned
+
Share + Retained
Receivable Insurance
Loan
Payable
Revenue
Capital Earnings
If one item within the accoun ng equa on is changed, then another item must also be changed
to balance it. In this way, the equality of the equa on is maintained. For example, if there is an
increase in an asset account, then there must be a decrease in another asset or a corresponding
increase in a liability or equity account. This equality is the essence of double-entry accoun ng.
16
Introduc on to Financial Accoun ng
The equa on itself always remains in balance a er each transac on. The opera on of double-
entry accoun ng is illustrated in the following sec on, which shows 10 transac ons of Big Dog
Carworks Corp. for January 2015.
Effect on the Accoun ng Equa on
Transac on
Number
Date Descrip on of Transac on
ASSETS
=
LIABILITIES
+
EQUITY
1
Jan.1
Big Dog Carworks Corp.
issued
1,000 shares to Bob Baldwin, the
owner or shareholder, for $10,000
cash.
The asset Cash is increased while
the equity item Share Capital is also
increased. The impact on the equa-
on is:
CASH
+10,000
SHARE CAPITAL
+10,000
2
Jan.2
Big Dog Carworks Corp. borrowed
$3,000 from the bank and de-
posited the cash into the business’s
bank account.
The asset Cash is increased and the
liability Bank Loan is also increased.
The impact on the equa on is:
CASH
+3,000
BANK LOAN
+3,000
3
Jan.2
The corpora on purchased $3,000
of equipment for cash.
There is an increase of the asset
Equipment and a decrease to an-
other asset, Cash. The impact on
the equa on is:
EQUIPMENT
+3,000
CASH
-3,000
4
Jan.2
The corpora on purchased a tow
truck for $8,000, paying $3,000
cash and incurring an addi onal
bank loan for the balance.
The asset Cash is decreased while
the asset Truck is increased and the
liability Bank Loan is also increased.
The impact on the equa on is:
CASH
-3,000
TRUCK
+8,000
BANK LOAN
+5,000
1.5. Transac on Analysis and Double-entry Accoun ng
17
Effect on the Accoun ng Equa on
Transac on
Number
Date Descrip on of Transac on
ASSETS
=
LIABILITIES
+
EQUITY
5
Jan.5
Big Dog Carworks Corp. paid $2,400
for a one-year insurance policy, ef-
fec ve January 1.
Here the asset Prepaid Insurance is
increased and the asset Cash is de-
creased. The impact on the equa-
on is:
PREPAID INSURANCE
+2,400
CASH
-2,400
Since the one-year period will not
be fully used at January 31 when
financial statements are prepared,
the insurance cost is considered to
be an asset at the payment date.
The transac on does not affect lia-
bili es or equity.
6
Jan.10
The corpora on paid $2,000 cash to
the bank to reduce the loan out-
standing.
The asset Cash is decreased and
there is a decrease in the liability
Bank Loan. The impact on the equa-
on is:
BANK LOAN
-2,000
CASH
-2,000
7
Jan.15
The corpora on received $400 as
an advance payment from a cus-
tomer for services to be performed
over the next two months as fol-
lows: $300 for February, $100 for
March.
The asset Cash is increased by $400
and a liability, Unearned Revenue,
is also increased since the revenue
will not be earned by the end of Jan-
uary. It will be earned when the
work is performed in later months.
At January 31, these amounts are
repayable to customers if the work
is not done (and thus a liability).
The impact on the equa on is:
CASH
+400
UNEARNED REVENUE
+400
18
Introduc on to Financial Accoun ng
Effect on the Accoun ng Equa on
Transac on
Number
Date Descrip on of Transac on
ASSETS
=
LIABILITIES
+
EQUITY
8
Jan.20
Automobile repairs of $10,000
were made for a customer; $8,000
of repairs were paid in cash and
$2,000 of repairs will be paid in the
future.
Cash and Accounts Receivable as-
sets of the corpora on increase.
The repairs are a revenue; rev-
enue causes an increase in net in-
come and an increase in net income
causes an increase in equity. The
impact on the equa on is:
CASH
+8,000
ACCOUNTS RECEIVABLE
+2,000
REPAIR REVENUE
+10,000
This ac vity increases assets and
net income.
9
Jan.31
The corpora on paid opera ng ex-
penses for the month as follows:
$1,600 for rent; $3,500 for salaries;
and $2,000 for supplies expense.
The $700 for truck opera ng ex-
penses (e.g., oil, gas) was on credit.
There is a decrease in the asset
Cash. Expenses cause net income
to decrease and a decrease in net
income causes equity to decrease.
There is an increase in the liability
Accounts Payable. The impact on
the equa on is:
RENT EXPENSE
-1,600
SALARIES EXPENSE
-3,500
SUPPLIES EXPENSE
-2,000
TRUCK OPERATING EXPENSE
-700
CASH
-7,100
ACCOUNTS PAYABLE
+700
10
Jan.31
Dividends of $200 were paid in cash
to the only shareholder, Bob Bald-
win.
Dividends cause retained earnings
to decrease. A decrease in retained
earnings will decrease equity. The
impact on the equa on is:
DIVIDENDS
-200
CASH
-200
1.5.
Tr
ansacon
Analy
sis
and
Double-en
tr
y
Acc
oun
ng
19
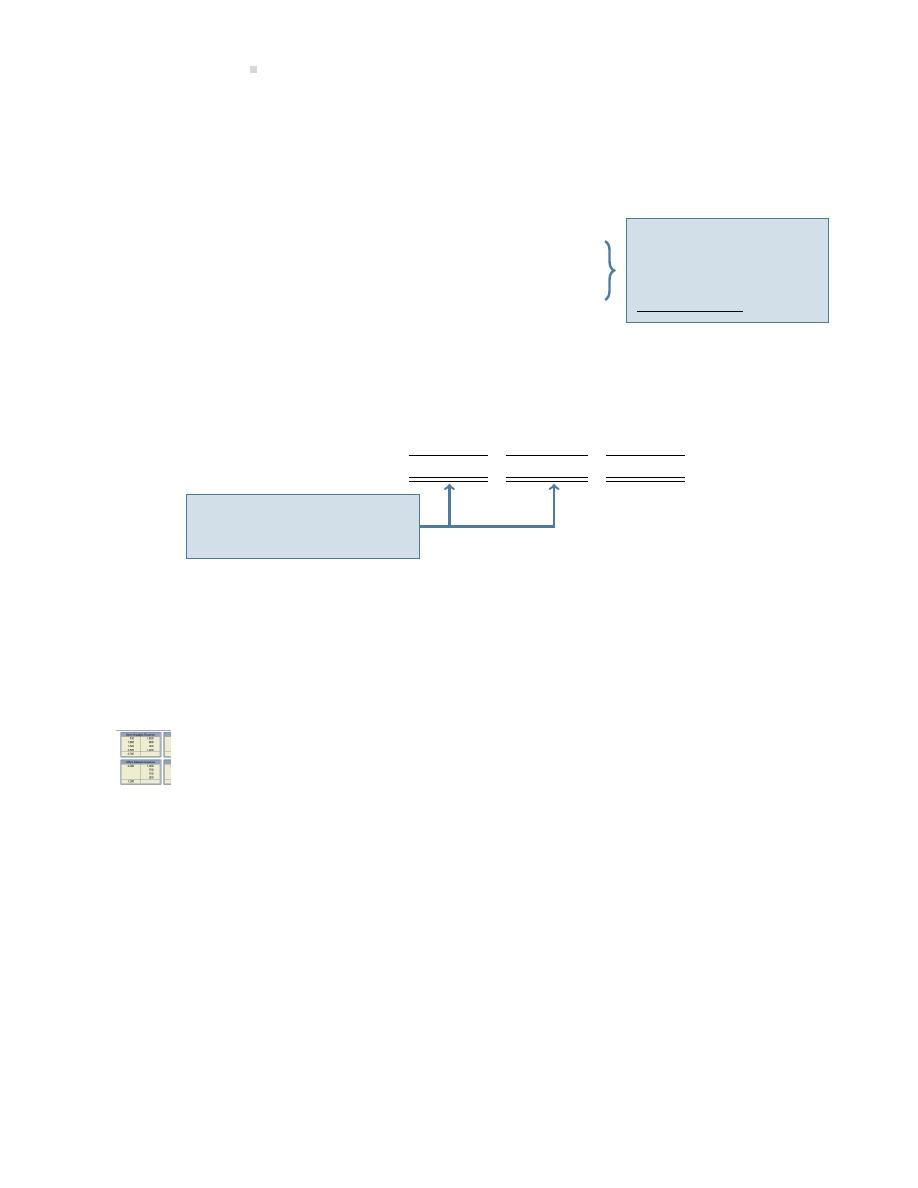
These various transac ons can be recorded in the expanded accoun ng equa on as shown below:
ASSETS
=
LIABILITIES
+
EQUITY
Trans.
Cash
+
Acc.
+ Prepaid + Equip. + Truck
=
Bank + Acc. + Unearned
+
Share + Retained
Rec.
Insur.
Loan
Pay.
Revenue
Capital
Earnings
1.
+10,000
+10,000
2.
+3,000
+3,000
3.
-3,000
+3,000
4.
-3,000
+8,000
+5,000
5.
-2,400
+2,400
6.
-2,000
-2,000
7.
+400
+400
8.
+8,000
+2,000
+10,000
9.
-7,100
+700
-1,600
-3,500
-2,000
-700
10.
-200
-200
3,700 + 2,000 +
2,400 + 3,000 + 8,000
=
6,000
+ 700 +
400
+
10,000 +
2,000
These numbers
are used to pre-
pare the Income
Statement.
Transac ons in
these columns are
used to prepare
the Statement of
Changes in Equity.
Column totals are used to prepare the Balance Sheet.
ASSETS = $19,100
LIABILITIES + EQUITY = $19,100
Figure 1.3: Transac ons Worksheet for January 31, 2015

20
Introduc on to Financial Accoun ng
Transac ons summary:
1. Issued share capital for $10,000 cash.
2. Received a bank loan for $3,000.
3. Purchased equipment for $3,000 cash.
4. Purchased a truck for $8,000; paid $3,000 cash and incurred a bank loan for the balance.
5. Paid $2,400 for a comprehensive one-year insurance policy effec ve January 1.
6. Paid $2,000 cash to reduce the bank loan.
7. Received $400 as an advance payment for repair services to be provided over the next two
months as follows: $300 for February, $100 for March.
8. Performed repairs for $8,000 cash and $2,000 on credit.
9. Paid a total of $7,100 for opera ng expenses incurred during the month; also incurred an
expense on account for $700.
10. Dividends of $200 were paid in cash to the only shareholder, Bob Baldwin.
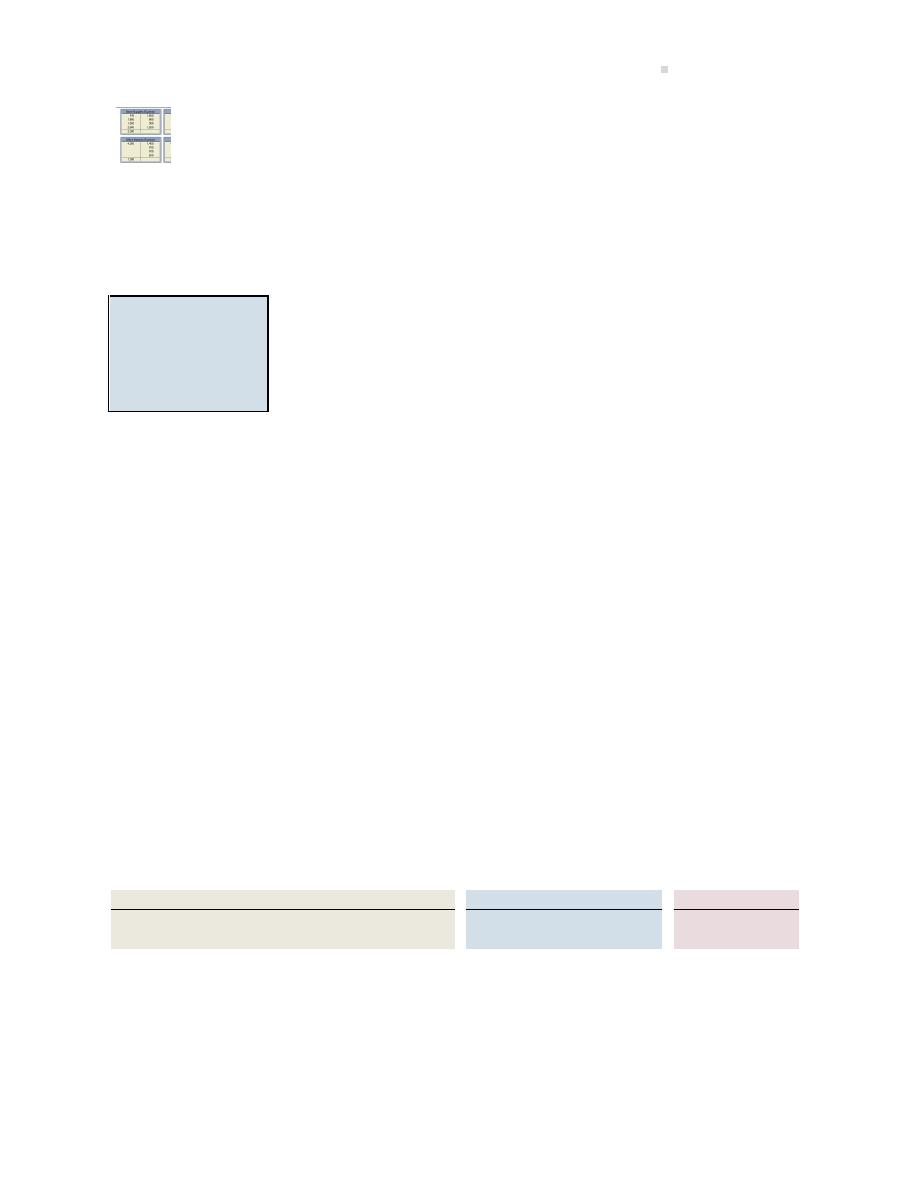
The transac ons summarized in Figure
were used to prepare the financial statements de-
scribed earlier, and reproduced in Figure
below.
1.5. Transac on Analysis and Double-entry Accoun ng
21
Big Dog Carworks Corp.
Big Dog Carworks Corp.
Balance Sheet
Income Statement
At January 31, 2015
For the Month Ended January 31, 2015
Assets
Cash
$ 3,700
Accounts receivable
2,000
Prepaid insurance
2,400
Equipment
3,000
Truck
8,000
Revenue
$19,100
Repairs
$10,000
Liabili es
Expenses
Bank loan
$ 6,000
Rent
$ 1,600
Accounts payable
700
Salaries
3,500
Unearned revenue
400
7,100
Supplies
2,000
Truck opera on
700
Equity
Total expenses
7,800
Share capital
$10,000
Retained earnings
2,000
Net income
$2,200
12,000
$19,100
Big Dog Carworks Corp.
Statement of Changes in Equity
For the Month Ended January 31, 2015
Share
Retained
Total
Capital
Earnings
Equity
Opening balance
$
-0-
$
-0-
$
-0-
Shares issued
10,000
10,000
Net income
2,200
2,200
Dividends
(200)
(200)
Ending balance
$10,000
$2,000
$12,000
The components of
equity are shown on
the Balance Sheet.
Net Income be-
comes part of Re-
tained Earnings.
Figure 1.4: Financial Statements of Big Dog Carworks Corp.
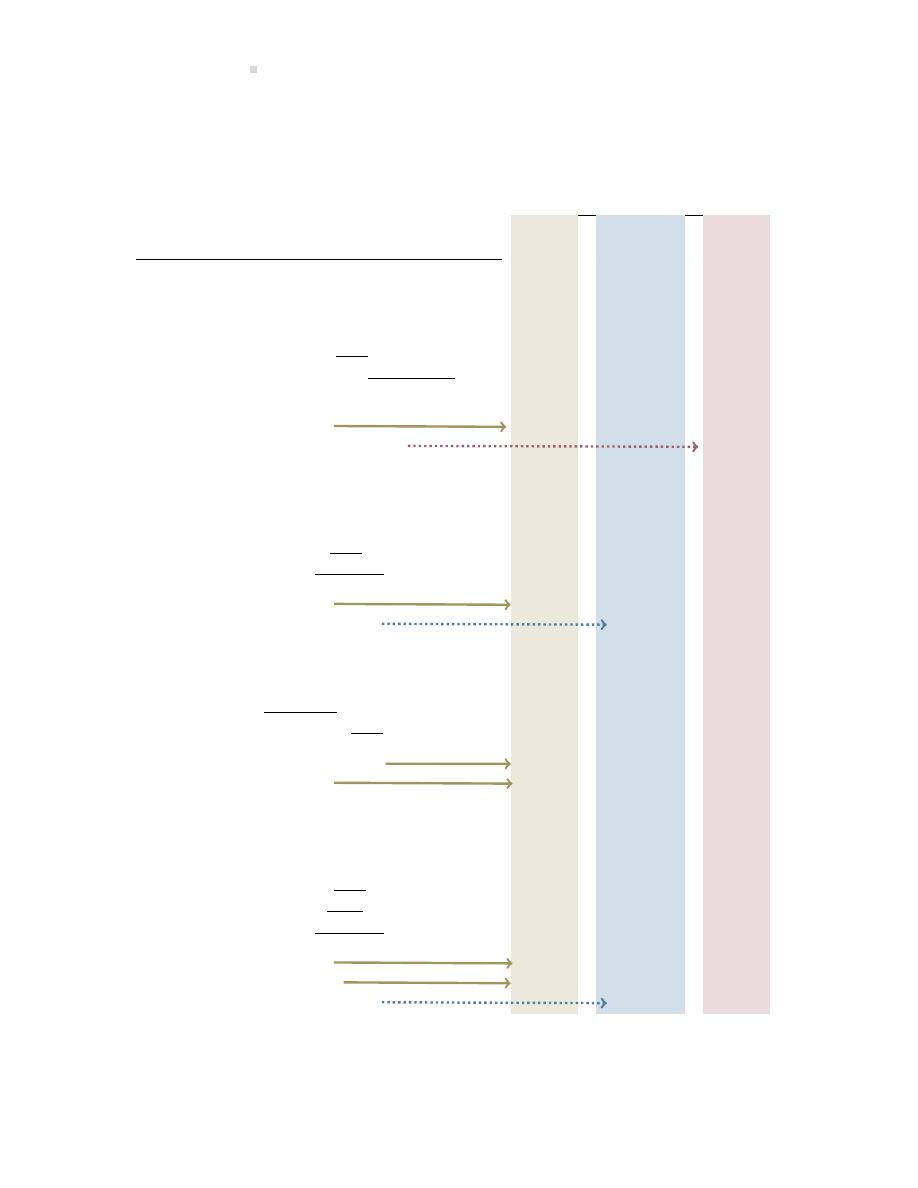
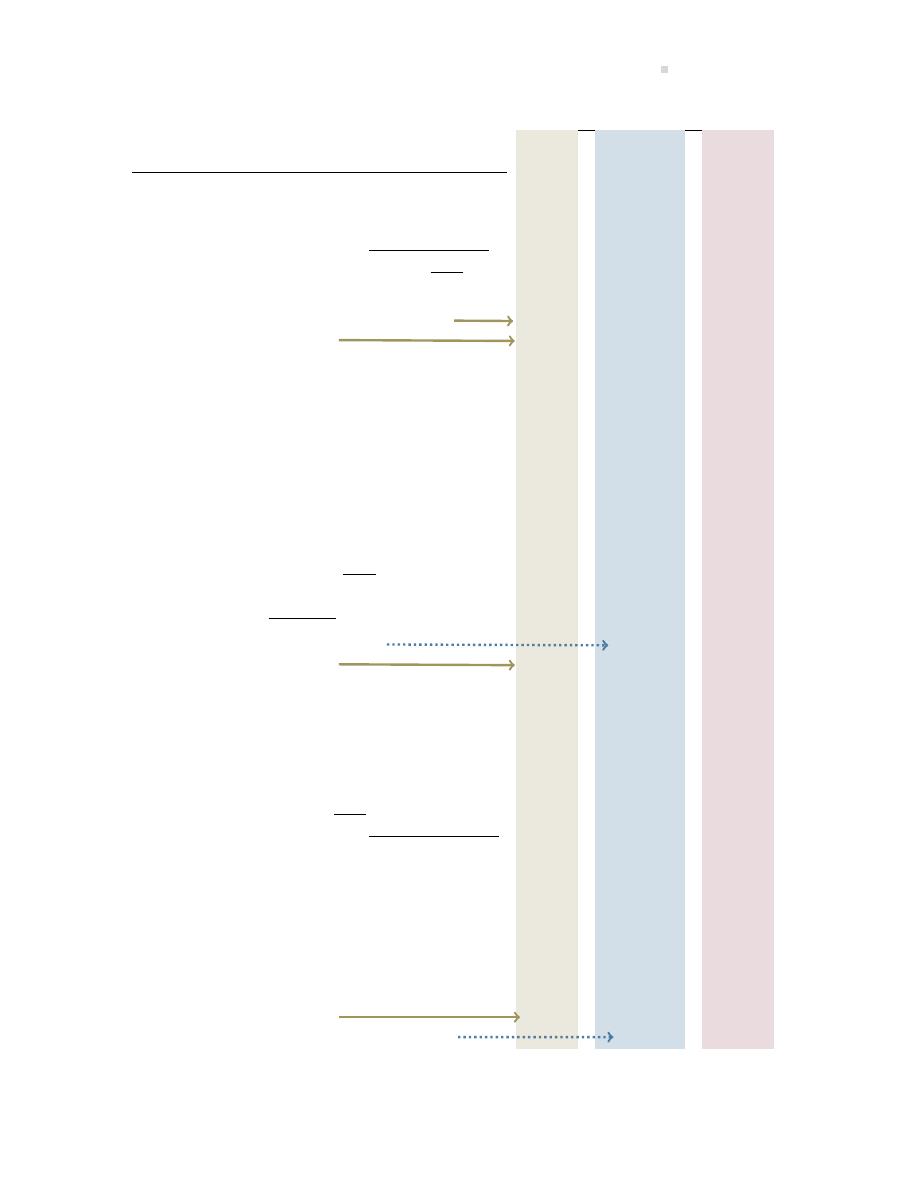
Accoun ng Time Periods
Financial statements are prepared at regular intervals — usually monthly or quarterly — and at
the end of each 12-month period. This 12-month period is called the fiscal year. The ming
of the financial statements is determined by the needs of management and other users of the
financial statements. For instance, financial statements may also be required by outside par es,
such as bankers and shareholders. However, accoun ng informa on must possess the qualita ve
22
Introduc on to Financial Accoun ng
characteris c of meliness — it must be available to decision makers in me to be useful — which
is typically a minimum of once every 12 months.
Accoun ng reports, called the annual financial statements, are prepared at the end of each 12-
month period, which is known as the year-end of the en ty. Some companies’ year-ends do not
follow the calendar year (year ending December 31). This may be done so that the fiscal year
coincides with their natural year. A natural year ends when business opera ons are at a low
point. For example, a ski resort may have a fiscal year ending in late spring or early summer when
business opera ons have ceased for the season.
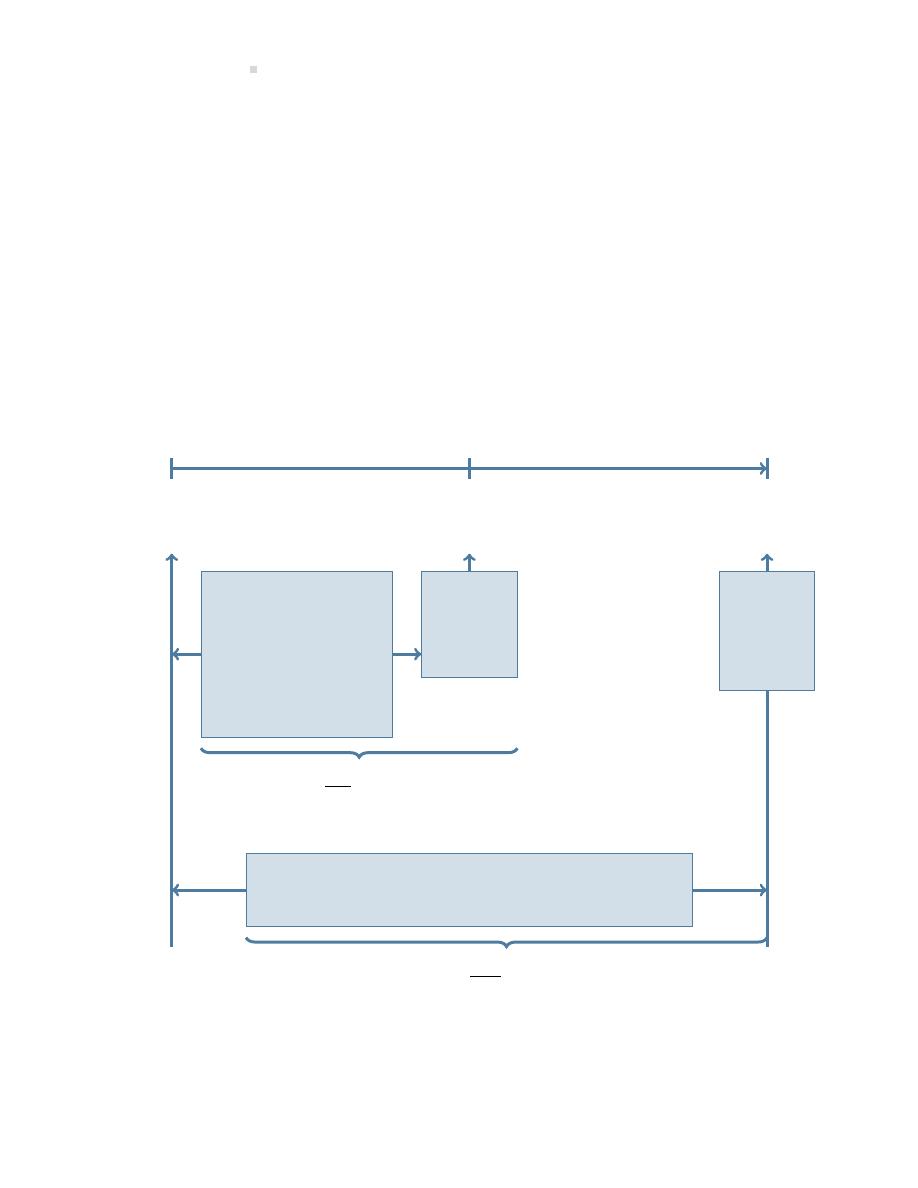
Corpora ons listed on stock exchanges are generally required to prepare interim financial state-
ments, usually every three months, primarily for the use of shareholders or creditors. Because
these types of corpora ons are large and usually have many owners, users require more up-to-
date financial informa on.
The rela onship of the interim and year-end financial statements is illustrated in Figure
.
Jan. 1, 2015
(commencement
of opera ons)
Jan. 31, 2015
(interim)
Dec. 31, 2015
(fiscal year end)
INTERIM
BALANCE
SHEET
(prepared
on this
date)
INTERIM INCOME
STATEMENT
INTERIM STATE-
MENT OF CHANGES
IN EQUITY
INTERIM STATEMENT
OF CASH FLOWS
(for the month
of January)
YEAR
END
BALANCE
SHEET
(prepared
on this
date)
YEAR END INCOME STATEMENT
YEAR END STATEMENT OF CHANGES IN EQUITY
YEAR END STATEMENT OF CASH FLOWS
These may be prepared.
These must be prepared.
Figure 1.5: Rela onship of Interim and Year-end Financial Statements
Summary of Chapter
Learning Objec ves
23
An explora on is available on the Lyryx site. Log into your Lyryx course to run
Summary of Chapter 1 Learning Objec ves
LO1 – Define accoun ng.
Accoun ng is the process of iden fying, measuring, recording, and communica ng an organiza-
on’s economic ac vi es to users for decision making. Internal users work for the organiza on
while external users do not. Managerial accoun ng serves the decision-making needs of internal
users. Financial accoun ng focuses on external repor ng to meet the needs of external users.
LO2 – Iden fy and describe the forms of business organiza on.
The three forms of business organiza ons are a proprietorship, partnership, and corpora on.
The following chart summarizes the key characteris cs of each form of business organiza on.
Characteris c
Proprietorship
Partnership
Corpora on
Separate legal en ty
No
No
Yes
Business income is taxed as part of the business
No
3
No
4
Yes
Unlimited liability
Yes
Yes
No
One owner permi ed
Yes
No
Yes
5
Board of Directors
No
No
Yes
LO3 – Iden fy and explain the Generally Accepted Accoun ng Principles (GAAP).
GAAP followed in Canada by PAEs (Publicly Accountable Enterprises) are based on IFRS (Interna-
onal Financial Repor ng Standards). PEs (Private Enterprises) follow GAAP based on ASPE (Ac-
coun ng Standards for Private Enterprises), a less onerous set of GAAP maintained by the AcSB
(Accoun ng Standards Board). GAAP have qualita ve characteris cs (relevance, faithful repre-
senta on, comparability, verifiability, meliness, and understandability) and principles (business
en ty, consistency, cost, full disclosure, going concern, matching, materiality, monetary unit, and
recogni on).
3
Business income is added to the owner’s personal income and the owner pays tax on the sum of the two.
4
Business income is added to the owner’s personal income and the owner pays tax on the sum of the two.
5
A corpora on can have one or more owners.

24
Introduc on to Financial Accoun ng
LO4 – Iden fy, explain, and prepare the financial statements.
The four financial statements are: income statement, statement of changes in equity, balance
sheet, and statement of cash flows. The income statement reports financial performance by
detailing revenues less expenses to arrive at net income/loss for the period. The statement of
changes in equity shows the changes during the period to each of the components of equity: share
capital and retained earnings. The balance sheet iden fies financial posi on at a point in me by
lis ng assets, liabili es, and equity. Finally, the statement of cash flows details the sources and
uses of cash during the period based on the three business ac vi es: opera ng, inves ng, and
financing.
LO5 – Analyze transac ons by using the accoun ng equa on.
The accoun ng equa on, A = L + E, describes the asset investments (the le side of the equa-
on) and the liabili es and equity that financed the assets (the right side of the equa on). The
accoun ng equa on provides a system for processing and summarizing financial transac ons re-
sul ng from a business’s ac vi es. A financial transac on is an economic exchange between two
par es that impacts the accoun ng equa on. The equa on must always balance.
Discussion Ques ons
1. What are generally accepted accoun ng principles (GAAP)?
2. When is revenue recognised?
3. How does the matching concept more accurately determine the Net Income of a business?
4. What are the quali es that accoun ng informa on is expected to have? What are the limi-
ta ons on the disclosure of useful accoun ng informa on?
5. What are assets?
6. To what do the terms liability and equity refer?
7. Explain the term financial transac on. Include an example of a financial transac on as part
of your explana on.
8. Iden fy the three forms of business organiza on.
9. What is the business en ty concept of accoun ng? Why is it important?
10. What is the general purpose of financial statements? Name the four financial statements?

Exercises
25
11. Each financial statement has a tle that consists of the name of the financial statement, the
name of the business, and a date line. How is the date line on each of the four financial
statements the same or different?
12. What is the purpose of an income statement? a balance sheet? How do they interrelate?
13. Define the terms revenue and expense.
14. What is net income? What informa on does it convey?
15. What is the purpose of a statement of changes in equity? a statement of cash flows?
16. Why are financial statements prepared at regular intervals? Who are the users of these
statements?
17. What is the accoun ng equa on?
18. Explain double-entry accoun ng.
19. What is a year-end? How does the ming of year-end financial statements differ from that
of interim financial statements?
20. How does a fiscal year differ from a calendar year?
Exercises
EXERCISE 1–1
(LO1,2,3)
Matching
Ethics
Managerial accoun ng
Financial accoun ng
Partnership
Interna onal Financial Repor ng Standards
Separate legal en ty
Limited liability
Unlimited liability
Required: Match each term in the above alphabe zed list to the corresponding descrip on below.
a.
The owners pay tax on the business’s net income.
b.
Accoun ng standards followed by PAEs in Canada.
c.
Rules that guide us in interpre ng right from wrong.
d.
Accoun ng aimed at communica ng informa on to external users.
e.
Accoun ng aimed at communica ng informa on to internal users.
f.
The business is dis nct from its owners.
g.
The owner(s) are not responsible for the debts of the business.
h.
If the business is unable to pay its debts, the owner(s) are responsible.

26
Introduc on to Financial Accoun ng
EXERCISE 1–2
(LO3)
Accoun ng Principles
Business en ty
Full disclosure
Materiality
Consistency
Going concern
Monetary unit
Cost
Matching
Recogni on
Required: Iden fy whether each of the following situa ons represents a viola on or a correct
applica on of GAAP, and which principle is relevant in each instance.
a. A small storage shed was purchased from a home supply store at a discount sale price of
$5,000 cash. The clerk recorded the asset at $6,000, which was the regular price.
b. One of the business partners of a small architect firm con nually charges the processing of
his family vaca on photos to the business firm.
c. An owner of a small engineering business, opera ng as a proprietorship from his home
office, also paints and sells watercolour pain ngs in his spare me. He combines all the
transac ons in one set of books.
d. ABS Consul ng received cash of $6,000 from a new customer for consul ng services that
ABS is to provide over the next six months. The transac on was recorded as a credit to
revenue.
e. Tyler Tires, purchased a shop tool for cash of $20 to replace the one that had broken earlier
that day. The tool would be useful for several years, but the transac on was recorded as a
debit to shop supplies expense instead of to shop equipment (asset).
f. Embassy Ligh ng, a small company opera ng in Canada, sold some merchandise to a cus-
tomer in California and deposited cash of $5,000 US. The bookkeeper recorded it as a credit
to revenue of $7,250 CAD, which was the Canadian equivalent currency at that me.
g. An owner of a small car repair shop purchased shop supplies for cash of $2,200, which will
be used over the next six months. The transac on was recorded as a debit to shop supplies
(asset) and will be expensed as they are used.
h. At the end of each year, a business owner looks at his es mated net income for the year and
decides which deprecia on method he will use in an effort to reduce his business income
taxes to the lowest amount possible.
i. XYZ is in deep financial trouble and recently was able to obtain some badly needed cash
from an investor who was interested in becoming an equity partner. However, a few days
ago, the investor unexpectedly changed the terms of his cash investment in XYZ company
from the proposed equity partnership to a long-term loan. XYZ does not disclose this to
their bank, who they recently applied to for an increase in their overdra line-of-credit.

Exercises
27
EXERCISE 1–3
(LO4)
Calcula ng Missing Amounts
Assets
=
Liabili es
+
Equity
a.
50,000
=
20,000
+
?
b.
10,000
=
?
+
1,000
c.
?
=
15,000
+
80,000
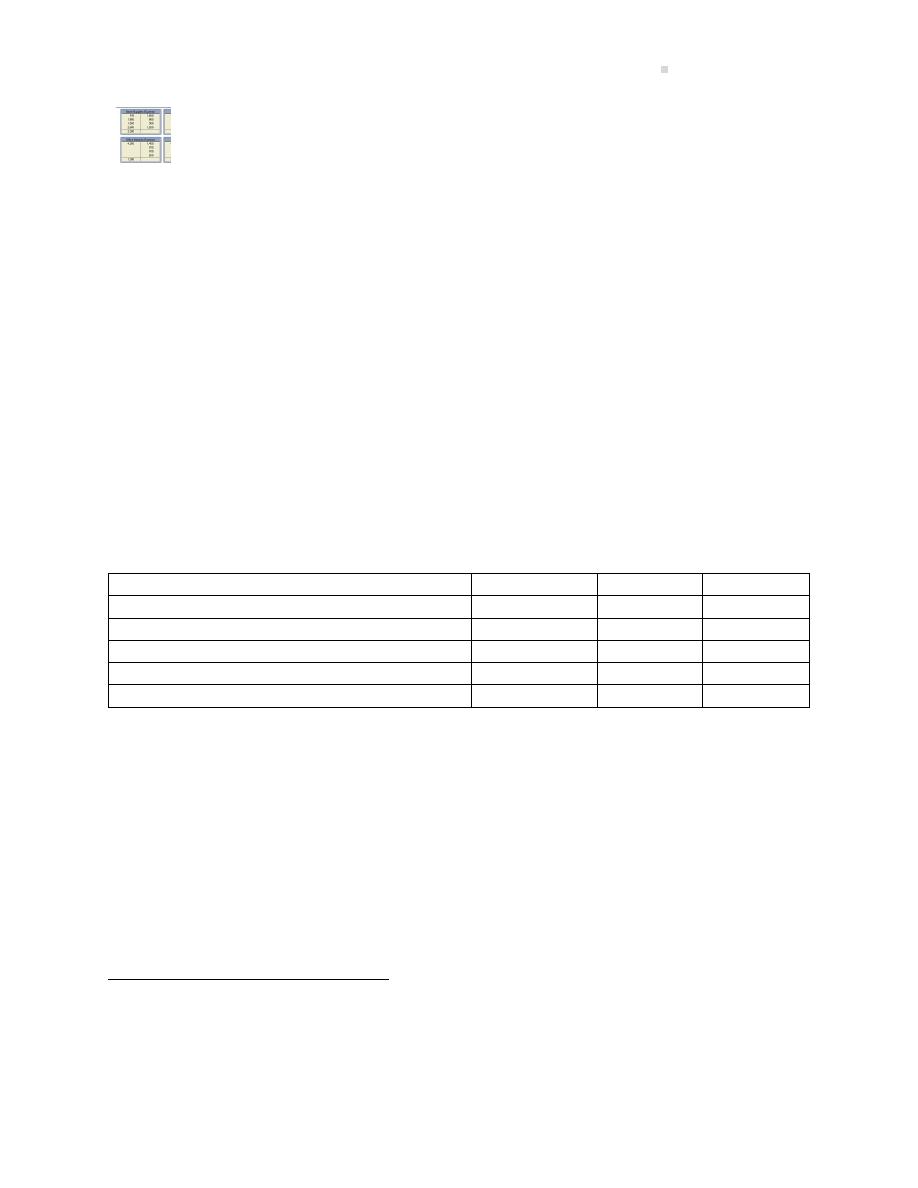
Required: Calculate the missing amounts in a, b, and c above. Addi onally, answer each of the
ques ons in d and e below.
d. Assets are financed by debt and equity. The greatest percentage of debt financing is reflected
in a, b, or c?
e. The greatest percentage of equity financing is reflected in a, b, or c?
EXERCISE 1–4
(LO4)
Calcula ng Missing Amounts
Required: Calculate the missing amounts for companies A to E.
A
B
C
D
E
Cash
$3,000
$1,000
$
?
$6,000
$2,500
Equipment
8,000
6,000
4,000
7,000
?
Accounts Payable
4,000
?
1,500
3,000
4,500
Share Capital
2,000
3,000
3,000
4,000
500
Retained Earnings
?
1,000
500
?
1,000
EXERCISE 1–5
(LO4)
Calcula ng Missing Amounts
Assets
=
Liabili es
+
Equity
Balance, Jan. 1, 2015
$50,000
$40,000
?
Balance, Dec. 31, 2015
40,000
20,000
?
Required: Using the informa on above, calculate net income under each of the following assump-
ons.
a. During 2015, no share capital was issued and no dividends were declared.
b. During 2015, no share capital was issued and dividends of $5,000 were declared.

28
Introduc on to Financial Accoun ng
c. During 2015, share capital of $12,000 was issued and no dividends were declared.
d. During 2015, share capital of $8,000 was issued and $12,000 of dividends were declared.
EXERCISE 1–6
(LO4)
Iden fying Assets, Liabili es, Equity Items
Required: Indicate whether each of the following is an asset (A), liability (L), or an equity (E) item.
a.
Accounts Payable
k.
Dividends
b. Accounts Receivable
l.
Interest Receivable
c.
Bank Loan Payable
m.
Retained Earnings
d. Building
n.
Interest Revenue
e.
Cash
o.
Interest Payable
f.
Share Capital
p.
Interest Expense
g.
Loan Payable
q.
Prepaid Insurance
h. Office Supplies
r.
Insurance Expense
i.
Prepaid Insurance
s.
Insurance Revenue
j.
U li es Expense
t.
Machinery
EXERCISE 1–7
(LO4)
Calcula ng Financial Statement Components
The following informa on is taken from the records of Jasper Inc. at January 31, 2015, a er its
first month of opera ons. Assume no dividends were declared in January.
Cash
$33,000
Equipment
$30,000
Accounts Receivable
82,000
Bank Loan
15,000
Unused Supplies
2,000
Accounts Payable
27,000
Land
25,000
Share Capital
?
Building
70,000
Net Income
40,000
Required:
a. Calculate total assets.
b. Calculate total liabili es.
c. Calculate share capital.
d. Calculate retained earnings.
e. Calculate total equity.

Exercises
29
EXERCISE 1–8
(LO4)
Net Income, Shares Issued
Accounts Receivable
$4,000
Miscellaneous Expense
$ 2,500
Accounts Payable
5,000
Office Supplies Expense
1,000
Cash
1,000
Service Revenue
20,000
Equipment
8,000
Share Capital
?
Insurance Expense
1,500
Wages Expense
9,000
Required: Using the alphabe zed informa on above for EDW Inc. a er its first month of opera-
ons, complete the income statement, statement of changes in equity, and balance sheet using
the templates provided below.
EDW Inc.
EDW Inc.
Income Statement
Statement of Changes in Equity
Month Ended March 31, 2015
Month Ended March 31, 2015
Revenues
Share
Retained
Total
Service Revenue
$
Capital
Earnings
Equity
Expenses
Opening Balance
$
$
$
Wages Expense
$
Shares Issued
Miscellaneous Expense
Net Income
Insurance Expense
Ending Balance
$
$
$
Office Supplies Expense
Net Income
$
EDW Inc.
Balance Sheet
March 31, 2015
Assets
Liabili es
Cash
$
Accounts Payable
$
Accounts Receivable
Equipment
Equity
Share Capital
$
Retained Earnings
Total Equity
Total Assets
$
Total Liabili es and Equity
$

30
Introduc on to Financial Accoun ng
EXERCISE 1–9
(LO4)
Net Income, Dividends
Accounts Receivable
$17,000
Machinery
$14,000
Accounts Payable
3,000
Note Payable
18,000
Adver sing Expense
5,000
Retained Earnings
6,000
Cash
9,000
Salaries Expense
64,000
Dividends
2,000
Service Revenue
81,000
Insurance Expense
7,000
Share Capital
10,000
Required: Algonquin Inc. began opera ons on August 1, 2013. A er its second year, Algonquin
Inc.’s accoun ng system showed the informa on above. During the second year, no addi onal
shares were issued. Complete the income statement, statement of changes in equity, and balance
sheet using the templates provided below.
Algonquin Inc.
Algonquin Inc.
Income Statement
Statement of Changes in Equity
Year Ended July 31, 2015
Year Ended July 31, 2015
Revenues
Share
Retained
Total
Service Revenue
$
Capital
Earnings
Equity
Expenses
Opening Balance
$ 10,000
$ 6,000
$ 16,000
Adver sing Expense
$
Net Income
Insurance Expense
Dividends
Salaries Expense
Ending Balance
$
$
$
Net Income
$
Algonquin Inc.
Balance Sheet
July 31, 2015
Assets
Liabili es
Cash
$
Accounts Payable
$
Accounts Receivable
Note Payable
Machinery
Total Liabili es
$
Equity
Share Capital
$
Retained Earnings
Total Equity
Total Assets
$
Total Liabili es and Equity
$
EXERCISE 1–10
(LO4)
Net Income, Dividends, Shares Issued

Exercises
31
Required: Refer to EXERCISE
. Use the same informa on EXCEPT assume that during the sec-
ond year, addi onal shares were issued for cash of $3,000. Complete the income statement, state-
ment of changes in equity, and balance sheet using the templates provided below.
Algonquin Inc.
Algonquin Inc.
Income Statement
Statement of Changes in Equity
Year Ended July 31, 2015
Year Ended July 31, 2015
Revenues
Share
Retained
Total
Service Revenue
$
Capital
Earnings
Equity
Expenses
Opening Balance
$
$
$
Adver sing Expense
$
Shares Issued
Insurance Expense
Net Income
Salaries Expense
Dividends
Net Income
$
Ending Balance
$
$
$
Algonquin Inc.
Balance Sheet
July 31, 2015
Assets
Liabili es
Cash
$
Accounts Payable
$
Accounts Receivable
Note Payable
Machinery
Total Liabili es
$
Equity
Share Capital
$
Retained Earnings
Total Equity
Total Assets
$
Total Liabili es and Equity
$
EXERCISE 1–11
(LO4)
Net Loss
Accounts Receivable
$1,600
Rent Payable
$2,500
Cash
6,000
Retained Earnings
4,000
Equipment Rental Expense
9,400
Share Capital
6,400
Fees Earned
12,000
Truck
22,000
Fuel Expense
500
Wages Expense
3,400
Note Payable
18,000
Required: Wallaby Inc. began opera ons on February 1, 2014. A er its second month, Wallaby
Inc.’s accoun ng system showed the informa on above. During the second month, no dividends
were declared and no addi onal shares were issued. Complete the income statement, statement
of changes in equity, and balance sheet using the templates provided below.

32
Introduc on to Financial Accoun ng
Wallaby Inc.
Wallaby Inc.
Income Statement
Statement of Changes in Equity
Month Ended March 31, 2015
Month Ended March 31, 2015
Revenues
Share
Retained
Total
Fees Earned
$
Capital
Earnings
Equity
Expenses
Opening Balance
$ 6,400
$ 4,000
$ 10,400
Equipment Rental Expense
$
Net Loss
Wages Expense
Ending Balance
$
$
$
Fuel Expense
Net Loss
$
Wallaby Inc.
Balance Sheet
March 31, 2015
Assets
Liabili es
Cash
$
Rent Payable
$
Accounts Receivable
Note Payable
Truck
Total Liabili es
$
Equity
Share Capital
$
Retained Earnings
Total Equity
Total Assets
$
Total Liabili es and Equity
$
EXERCISE 1–12
(LO4)
Correc ng Financial Statements
A junior bookkeeper of Adams Ltd. prepared the following incorrect financial statements at the
end of its first month of opera ons.
Adams Ltd.
Income Statement
For the Month Ended January 31, 2015
Service Revenue
$3,335
Expenses
Accounts Payable
$300
Land
1,000
Miscellaneous Expenses
335
1,635
Net Income
$1,700

Exercises
33
Balance Sheet
Assets
Liabili es and Equity
Cash
$1,000
Rent Expense
$300
Repairs Expense
500
Share Capital
3,000
Salaries Expense
1,000
Retained Earnings
1,700
Building
2,500
$5,000
$5,000
Required: Prepare a corrected income statement, statement of changes in equity, and balance
sheet.
EXERCISE 1–13
(LO4)
Income Statement
Below are the December 31, 2015, year-end accounts balances for Mitch’s Architects Ltd. This is
the business’s second year of opera ons.
Cash
$23,000
Share capital
$ 30,400
Accounts receivable
24,000
Retained earnings
5,000
Office supplies inventory
2,000
Consul ng fees earned
150,000
Prepaid insurance
7,000
Office rent expense
60,000
Truck
40,000
Salaries and benefits expense
40,000
Office equipment
15,000
U li es expense
12,000
Accounts payable
30,000
Insurance expense
5,000
Unearned consul ng fees
15,000
Supplies and postage expense
2,400
Addi onal informa on:
a. Included in the share capital account balance was an addi onal $10,000 of shares issued
during the current year just ended.
b. Included in the retained earnings account balance was dividends paid to the shareholders
of $1,000 during the current year just ended.
Required: Use these accounts to prepare an income statement similar to the example illustrated
in Sec on
EXERCISE 1–14
(LO4)
Statement of Changes in Equity

34
Introduc on to Financial Accoun ng
Required: Using the data in EXERCISE
, prepare a statement of changes in equity similar to
the example illustrated in Sec on
EXERCISE 1–15
(LO4)
Balance Sheet
Required: Using the data in EXERCISE
, prepare a balance sheet similar to the example illus-
trated in Sec on
.
EXERCISE 1–16
(LO4)
Financial Statements with Errors
Below are the May 31, 2015, year-end financial statements for Gillespie Corp., prepared by a sum-
mer student. There were no share capital transac ons in the year just ended.
Gillespie Corp.
Income Statement
For the Year Ended May 31, 2015
Revenues
Service revenue
$382,000
Unearned service revenue
25,000
Rent revenue
90,000
Expenses
Warehouse rent expense
100,000
Prepaid adver sing
17,000
Salaries and benefits expense
110,000
Dividends
10,000
U li es expense
42,000
Insurance expense
15,000
Shop supplies expense
6,000
Net income
$197,000

Exercises
35
Gillespie Corp.
Statement of Changes in Equity
At May 31, 2015
Share
Retained
Total
Capital
Earnings
Equity
Opening balance
$5,000
$140,000
$145,000
Net income
197,000
197,000
Ending balance
$5,000
$337,000
$342,000
Gillespie Corp.
Balance Sheet
For the Year Ended May 31, 2015
Assets
Liabili es
Cash
$ 50,000
Accounts payable
$130,000
Accounts receivable
85,000
Office equipment
45,000
Total liabili es
$130,000
Building
240,000
Equity
Shop supplies
52,000
Share capital
$
5,000
Retained earnings
337,000
Total equity
342,000
Total assets
$472,000
Total liabili es and equity
$472,000
Required: Using the data above, prepare a corrected set of financial statements similar to the
examples illustrated in Sec on
EXERCISE 1–17
(LO4)
Determining Missing Financial Informa on
Required: Complete the following calcula ons for each individual company:
a. If ColourMePink Ltd. has a retained earnings opening balance of $50,000 at the beginning
of the year, and an ending balance of $40,000 at the end of the year, what would be the net
income/loss, if dividends paid were $20,000?
b. If ForksAndSpoons Ltd. has net income of $150,000, dividends paid of $40,000 and a re-
tained earnings ending balance of $130,000, what would be the retained earnings opening
balance?
c. If CupsAndSaucers Ltd. has a retained earnings opening balance of $75,000 at the beginning
of the year, and an ending balance of $40,000 at the end of the year, what would be the
dividends paid, if the net loss was $35,000?

36
Introduc on to Financial Accoun ng
EXERCISE 1–18
(LO4,5)
Equity – What Causes it to Change
Assets
=
Liabili es
+
Equity
Balances at April 1, 2015
$100,000
$60,000
$40,000
?
Shares issued in April
?
April net income(loss)
?
Dividends paid in April
Balances at April 30, 2015
$180,000
=
$130,000
+
?
Required: Using the informa on provided above, calculate the net income or net loss realized
during April under each of the following independent assump ons.
a. No shares were issued in April and no dividends were paid.
b. $50,000 of shares were issued in April and no dividends were paid.
c. No shares were issued in April and $4,000 of dividends were paid in April.

Exercises
37
EXERCISE 1–19
(LO4,5)
Equity – What Causes it to Change
Assets
=
Liabili es
+
Equity
Balances at June 1, 2015
$160,000
$100,000
$60,000
?
Shares issued in June
?
June net income(loss)
?
Dividends paid in June
Balances at June 30, 2015
$200,000
=
$90,000
+
?
Required: Using the informa on provided above, calculate the dividends paid in June under each
of the following independent assump ons.
a. In June no shares were issued and a $70,000 net income was earned.
b. $40,000 of shares were issued in June and a $90,000 net income was earned.
c. In June $130,000 of shares were issued and an $80,000 net loss was realized.
EXERCISE 1–20
(LO5)
Impact of Transac ons on the Accoun ng Equa on
The following list shows the various ways in which the accoun ng equa on might be affected by
financial transac ons.
Assets =
Liabili es
+
Equity
1.
(+)
(+)
2.
(+)
(+)
3.
(+)(-)
4.
(-)
(-)
5.
(-)
(-)
6.
(+)
(-)
7.
(-)
(+)
8.
(+)(-)
9.
(+)(-)
Required: Match one of the above to each of the following financial transac ons. If the descrip on
below does not represent a financial transac on, indicate ‘NT’ for ‘No Transac on’. The first one
is done as an example.

38
Introduc on to Financial Accoun ng
a.
3
Purchased a truck for cash.
b.
Issued share capital for cash.
c.
Incurred a bank loan as payment for equipment.
d.
Made a deposit for electricity service to be provided to the company in the
future.
e.
Paid rent expense.
f.
Signed a new union contract that provides for increased wages in the future.
g.
Wrote a le er of complaint to the prime minister about a mail strike and hired
a messenger service to deliver le ers
h.
Received a collect telegram from the prime minister; paid the messenger.
i.
Billed customers for services performed.
j.
Made a cash payment to sa sfy an outstanding obliga on.
k.
Received a payment of cash in sa sfac on of an amount owed by a customer.
l.
Collected cash from a customer for services rendered.
m.
Paid cash for truck opera on expenses.
n.
Made a monthly payment on the bank loan; this payment included a payment
on part of the loan and also an amount of interest expense. (Hint: This
transac on affects more than two parts of the accoun ng equa on.)
o.
Issued shares in the company to pay off a loan.
Problems
PROBLEM 1–1
(LO4,5)
Preparing Financial Statements
Following are the asset, liability, and equity items of Dumont Inc. at January 31, 2015, a er its
first month of opera ons.
ASSETS
=
LIABILITIES
+
EQUITY
Cash
$1,300
Bank Loan
$8,000
Share Capital
$2,000
Accounts Receivable
2,400
Accounts Payable
1,000
Service Revenue
7,500
Prepaid Expenses
550
Adver sing Expense
500
Unused Supplies
750
Commissions Expense
720
Truck
9,000
Insurance Expense
50
Interest Expense
80
Rent Expense
400
Supplies Expense
100
Telephone Expense
150
Wages Expense
2,500
Required:

Problems
39
1. Prepare an income statement and statement of changes in equity for Dumont’s first month
ended January 31, 2015.
2. Prepare a balance sheet at January 31, 2015.
PROBLEM 1–2
(LO4)
Preparing Financial Statements
Laberge Sheathing Inc. began opera ons on January 1, 2015. The office manager, inexperienced in
accoun ng, prepared the following statement for the business’s most recent month ended August
31, 2015.
Laberge Sheathing Inc.
Financial Statement
Month Ended August 31, 2015
Cash
$400
Accounts Payable
$7,800
Accounts Receivable
3,800
Share Capital
3,200
Unused Supplies
100
Service Revenue
2,000
Equipment
8,700
Retained Earnings
4,000
Adver sing Expense
300
Interest Expense
500
Maintenance Expense
475
Supplies Used
125
Wages Expense
2,600
$17,000
$17,000
Required:
1. Prepare an income statement and statement of changes in equity for the month ended Au-
gust 31, 2015, and a balance sheet at August 31, 2015. No shares were issued in August.
2. Using the informa on from the balance sheet completed in Part 1, calculate the percentage
of assets financed by equity.
PROBLEM 1–3
(LO5)
Transac on Analysis
The following transac ons of Larson Services Inc. occurred during August 2015, its first month of
opera ons.

40
Introduc on to Financial Accoun ng
Aug.
1 Issued share capital for $3,000 cash
1 Borrowed $10,000 cash from the bank
1 Paid $8,000 cash for a used truck
3 Signed a contract with a customer to do a $15,000 job beginning in November
4 Paid $600 for a one-year truck insurance policy effec ve August 1
5 Collected fees of $2,000 for work to be performed in September
7 Billed a client $5,000 for services performed today
9 Paid $250 for supplies purchased and used today
12 Purchased $500 of supplies on credit
15 Collected $1,000 of the amount billed August 7
16 Paid $200 for adver sing in The News that ran the first two weeks of August
20 Paid $250 of the amount owing regarding the credit purchase of August 12
25 Paid the following expenses: rent for August, $350; salaries, $2,150; telephone, $50;
truck opera on, $250
28 Called clients for payment of the balances owing from August 7
31 Billed a client $6,000 for services performed today
31 $500 of the amount collected on August 5 has been earned as of today
Required:
1. Create a table like the one below by copying the headings shown.
ASSETS
=
LIABILITIES
+
EQUITY
Acct.
Ppd.
Unused
Bank
Acct.
Unearned
Share
Retained
Cash + Rec. + Exp. + Supplies + Truck = Loan + Pay. + Revenue + Capital + Earnings
2. Use addi ons and subtrac ons in the table created in Part 1 to show the effects of the August
transac ons. For non-transac ons that do not impact the accoun ng equa on items (such
as August 3), indicate ‘NE’ for ‘No Effect’.
3. Total each column and prove the accoun ng equa on balances.
PROBLEM 1–4
(LO4)
Preparing Financial Statements
Required: Refer to your answer for Problem
. Prepare an income statement and a statement
of changes in equity for the month ended August 31, 2015. Label the revenue earned as Fees
Earned. Prepare a balance sheet at August 31, 2015.
PROBLEM 1–5
(LO5)
Transac on Analysis and Table

Problems
41
The following transac ons occurred for Olivier Bondar Ltd., an restaurant management consul ng
service, during May, 2016:
May 1
Received a cheque in the amount of $5,000 from TUV Restaurant Ltd., for a restaurant
food cleanliness assessment to be conducted in June.
May 1
Paid $5,000 for office rent for the month of May.
May 2
Purchased office supplies for $3,000 on account.
May 3
Completed a consulta on project for McDanny’s Restaurant and billed them $27,000
for the work.
May 4
Purchased a laptop computer for $3,000 in exchange for a note payable due in 45
days.
May 5
Olivier Bondar was a li le short on cash, so the manager made an applica on for
a bank loan in the amount of $20,000. It is expected that the bank will make their
decision regarding the loan next week.
May 6
Received an invoice from the u li es company for electricity in the amount of $300.
May 10
Bank approved the loan and deposited $20,000 into Olivier Bondar’s bank account.
First loan payment is due on June 10.
May 11
Paid for several invoices outstanding from April for goods and services received for
a total of $8,000. The breakdown of the invoice costs are: telephone expense $500;
adver sing expense $3,000; office furniture $2,000; office supplies $2,500.
May 13
Paid employee salaries owing from May 1 to May 13 in the amount of $3,000.
May 14
Completed consul ng work for a U.S. client and invoiced $18,000 US (US funds). The
Canadian equivalent is $25,000 CAD.
May 15
Received $25,000 cash for work done and invoiced in April.
May 18
Hired a new employee who will begin work on May 25. Salary will be $2,500 every
two weeks.
May 21
Placed an order request for new shelving for the office. Catalogue price is $2,500.
May 27
Paid employee salaries owing from May 14 to May 27 in the amount of $3,500.
May 29
The bookkeeper was going to be away for two weeks, so the June rent of $5,000 was
paid.
May 31
Reimbursed $50 in cash to an employee for use of his personal vehicle for company
business on May 20.
May 31
Shelving unit ordered on May 21 was delivered and installed. Total cost was $3,000,
including labour.
Required: Create a table with the following column headings and opening balances. Below the
opening balance, number each row from 1 to 18:
42
In
tr
oducon
to
Financial
Acc
oun
ng
Cash
Accounts
Office
Prepaid
Equipment
Office
Accounts
Note/Loan
Unearned
Share
Retained
receivable
supplies
expenses
furniture
payable
payable
revenue
capital
earnings
Open
+10,000
+25,000
+2,000
0
+25,000
+15,000
+35,000
0
0
+8,000
+34,000
Bal
1
2
3
4
5
6
7
8
9
10
11
12
13
14
15
16
17
18
Bal
Using the table as shown in Figure
of the text, complete the table for the 18 items listed in May and total each column. If any of the
items are not to be recorded, leave the row blank.

Problems
43
PROBLEM 1–6
(LO5)
Transac on Analysis and Table
Required: Using the data from the table in PROBLEM
, prepare the balance sheet as at May
31, 2016.


Chapter 2
The Accoun ng Process
Chapter
looks more closely at asset, liability, and equity accounts and how they are affected by
double-entry accoun ng, namely, debits and credits. The transac ons introduced in Chapter
for Big Dog Carworks Corp. are used to explain debit and credit analysis. The prepara on of a
trial balance will be introduced. Addi onally, this chapter will demonstrate how transac ons are
recorded in a general journal and posted to a general ledger. Finally, the concept of the accoun ng
cycle is presented.
Chapter 2 Learning Objec ves
LO1 – Describe asset, liability, and equity accounts, iden fying the effect of debits and cred-
its on each.
LO2 – Analyze transac ons using double-entry accoun ng.
LO3 – Prepare a trial balance and explain its use.
LO4 – Record transac ons in a general journal and post in a general ledger.
LO5 – Define the accoun ng cycle.
Concept Self-Check
Use the following as a self-check while working through Chapter
1. What is an asset?
2. What is a liability?
3. What are the different types of equity accounts?
4. What is retained earnings?
5. How are retained earnings and revenues related?
6. Why are T-accounts used in accoun ng?
7. How do debits and credits impact the T-account?
8. What is a chart of accounts?
45

46
The Accoun ng Process
9. Are increases in equity recorded as a debit or credit?
10. Are decreases in equity recorded as a debit or credit?
11. Does issuing shares and revenues cause equity to increase or decrease?
12. Are increases in the share capital account recorded as a debit or credit?
13. Are increases in revenue accounts recorded as debits or credits?
14. Do dividends and expenses cause equity to increase or decrease?
15. Are increases in the dividend account recorded as a debit or credit?
16. Are increases in expense accounts recorded as debits or credits?
17. How is a trial balance useful?
18. What is the difference between a general journal and a general ledger?
19. Explain the pos ng process.
20. What is the accoun ng cycle?
NOTE: The purpose of these ques ons is to prepare you for the concepts introduced in the chap-
ter. Your goal should be to answer each of these ques ons as you read through the chapter. If,
when you complete the chapter, you are unable to answer one or more the Concept Self-Check
ques ons, go back through the content to find the answer(s). Solu ons are not provided to these
ques ons.
2.1 Accounts
LO1 – Describe
asset,
liabil-
ity, and equity
accounts, iden -
fying the effect
of
debits
and
credits on each.
Chapter
reviewed the analysis of financial transac ons and the resul ng
impact on the accoun ng equa on. We now expand that discussion by
introducing the way transac on is recorded in an account. An account
accumulates detailed informa on regarding the increases and decreases
in a specific asset, liability, or equity item. Accounts are maintained in
a ledger also referred to as the books. We now review and expand our
understanding of asset, liability, and equity accounts.
Asset Accounts
Recall that assets are resources that have future economic benefits for the business. The primary
purpose of assets is that they be used in day-to-day opera ng ac vi es in order to generate rev-
enue either directly or indirectly. A separate account is established for each asset. Examples of
asset accounts are reviewed below.

2.1. Accounts
47
• Cash has future purchasing power. Coins, currency, cheques, and bank account balances
are examples of cash.
• Accounts receivable occur when products or services are sold on account or on credit.
When a sale occurs on account or on credit, the customer has not paid cash but promises
to pay in the future.
• Notes receivable are a promise to pay an amount on a specific future date plus a predeter-
mined amount of interest.
• Office supplies are supplies to be used in the future. If the supplies are used before the end
of the accoun ng period, they are an expense instead of an asset.
• Merchandise inventory are items to be sold in the future.
• Prepaid insurance represents an amount paid in advance for insurance. The prepaid insur-
ance will be used in the future.
• Prepaid rent represents an amount paid in advance for rent. The prepaid rent will be used
in the future.
• Land cost must be in a separate account from any building that might be on the land. Land
is used over future periods.
• Buildings indirectly help a business generate revenue over future accoun ng periods since
they provide space for day-to-day opera ng ac vi es.
Liability Accounts
As explained in Chapter
, a liability is an obliga on to pay for an asset in the future. The primary
purpose of liabili es is to finance inves ng ac vi es that include the purchase of assets like land,
buildings, and equipment. Liabili es are also used to finance opera ng ac vi es involving, for
example, accounts payable, unearned revenues, and wages payable. A separate account is created
for each liability. Examples of liability accounts are reviewed below.
• Accounts payable are debts owed to creditors for goods purchased or services received as
a result of day-to-day opera ng ac vi es. An example of a service received on credit might
be a plumber billing the business for a repair.
• Wages payable are wages owed to employees for work performed.
• Short-term notes payable are a debt owed to a bank or other creditor that is normally paid
within one year. Notes payable are different than accounts payable in that notes involve
interest.
• Long-term notes payable are a debt owed to a bank or other creditor that is normally paid
beyond one year. Like short-term notes, long-term notes involve interest.
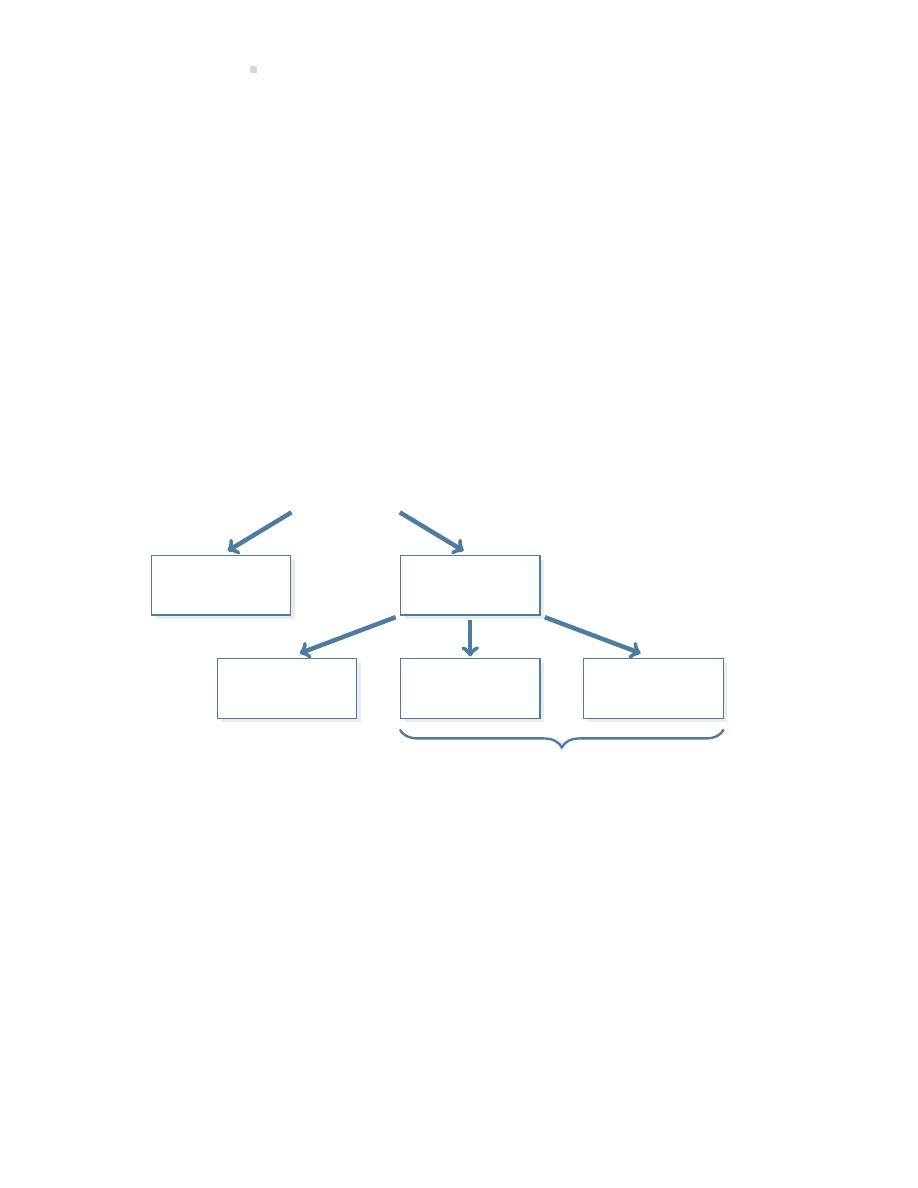
48
The Accoun ng Process
• Unearned revenues are payments received in advance of the product or service being pro-
vided. In other words, the business owes a customer the product/service.
Equity Accounts
Chapter
explained that equity represents the net assets owned by the owners of a business. In a
corpora on, the owners are called shareholders. Equity is tradi onally one of the more challeng-
ing concepts to understand in introductory financial accoun ng. The difficulty stems from there
being different types of equity accounts: share capital, retained earnings, dividends, revenues,
and expenses. Share capital represents the investments made by owners into the business and
causes equity to increase. Retained earnings is the sum of all net incomes earned over the life
of the corpora on to date, less any dividends distributed to shareholders over the same me pe-
riod. Therefore, the Retained Earnings account includes revenues, which cause equity to increase,
along with expenses and dividends, which cause equity to decrease. Figure
summarizes equity
accounts.
EQUITY
Share Capital
Retained
Earnings
Dividends
Revenues
Expenses
Recall that revenues less expenses equals net in-
come/net loss. Net income/net loss is not an ac-
count but is the result of subtrac ng expenses
from revenues.
Figure 2.1: Composi on of Equity Accounts
T-accounts
A simplified account, called a T-account, is o en used as a teaching/learning tool to show increases
and decreases in an account. It is called a T-account because it resembles the le er T. As shown
in the T-account below, the le side records debit entries and the right side records credit entries.
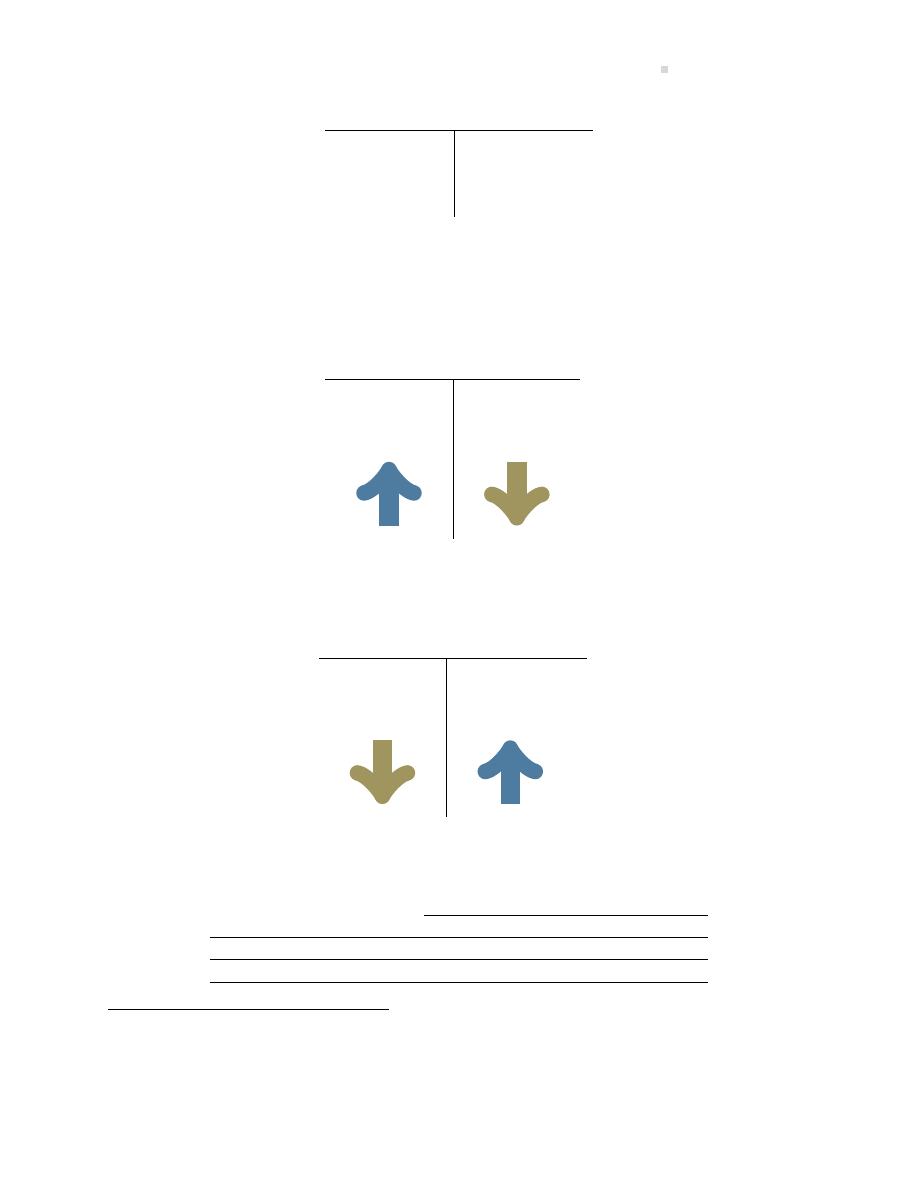
2.1. Accounts
49
Account Name
Debit
Credit
(always on le )
(always on right)
The type of account determines whether an increase or a decrease in a par cular transac on
is represented by a debit or credit. For financial transac ons that affect assets, dividends, and
expenses, increases are recorded by debits and decreases by credits. This guideline is shown in
the following T-account.
Assets, Dividends, Expenses
Debits are
always
increases
Credits are
always
decreases
For financial transac ons that affect liabili es, share capital, and revenues, increases are recorded
by credits and decreases by debits, as follows:
Liabili es, Revenues, Share Capital
Debits are
always
decreases
Credits are
always
increases
Another way to illustrate the debit and credit rules is based on the accoun ng equa on. Remem-
ber that dividends, expenses, revenues, and share capital are equity accounts.
Assets
=
Liabili es
+
Equity
Increases are recorded as:
Debits
Credits
Credits
Decreases are recorded as:
Credits
Debits
Debits
1
Revenues and the issuance of Share Capital are equity accounts. They cause equity to increase so increases in
these account types are recorded as credits.
2
Expenses, and Dividends are equity accounts. They cause equity to decrease. Decreases in equity are always
recorded as debits so as expenses and dividends are realized, they are debited.
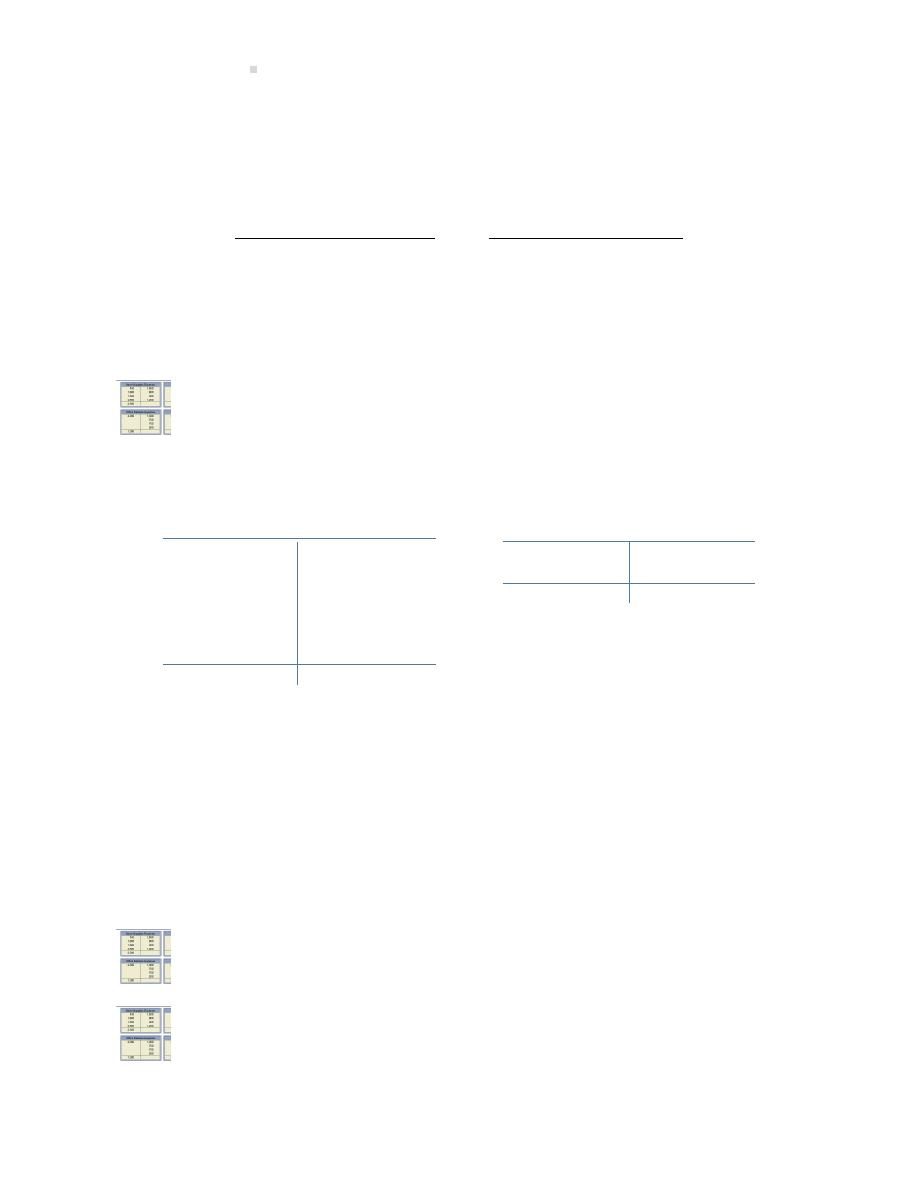
50
The Accoun ng Process
The following summary shows how debits and credits are used to record increases and decreases
in various types of accounts.
ASSETS
LIABILITIES
DIVIDENDS
SHARE CAPITAL
EXPENSES
REVENUE
Increases are DEBITED.
Increases are CREDITED.
Decreases are CREDITED.
Decreases are DEBITED.
This summary will be used in a later sec on to illustrate the recording of debits and credits regard-
ing the transac ons of Big Dog Carworks Corp. introduced in Chapter
An explora on is available on the Lyryx site. Log into your Lyryx course to run
The account balance is determined by adding and subtrac ng the increases and decreases in an
account. Two assumed examples are presented below.
Cash
Accounts Payable
10,000
3,000
700
5,000
3,000
3,000
400
2,400
4,300
Balance
8,000
2,000
7,100
200
Balance
3,700
The $3,700 debit balance in the Cash account was calculated by adding all the debits and subtract-
ing the sum of the credits. The $3,700 is recorded on the debit side of the T-account because the
debits are greater than the credits. In Accounts Payable, the balance is a $4,300 credit calculated
by subtrac ng the debits from the credits.
No ce that Cash shows a debit balance while Accounts Payable shows a credit balance. The Cash
account is an asset so its normal balance is a debit. A normal balance is the side on which increases
occur. Accounts Payable is a liability and because liabili es increase with credits, the normal bal-
ance in Accounts Payable is a credit as shown in the T-account above.
An explora on is available on the Lyryx site. Log into your Lyryx course to run
.
An explora on is available on the Lyryx site. Log into your Lyryx course to run
.
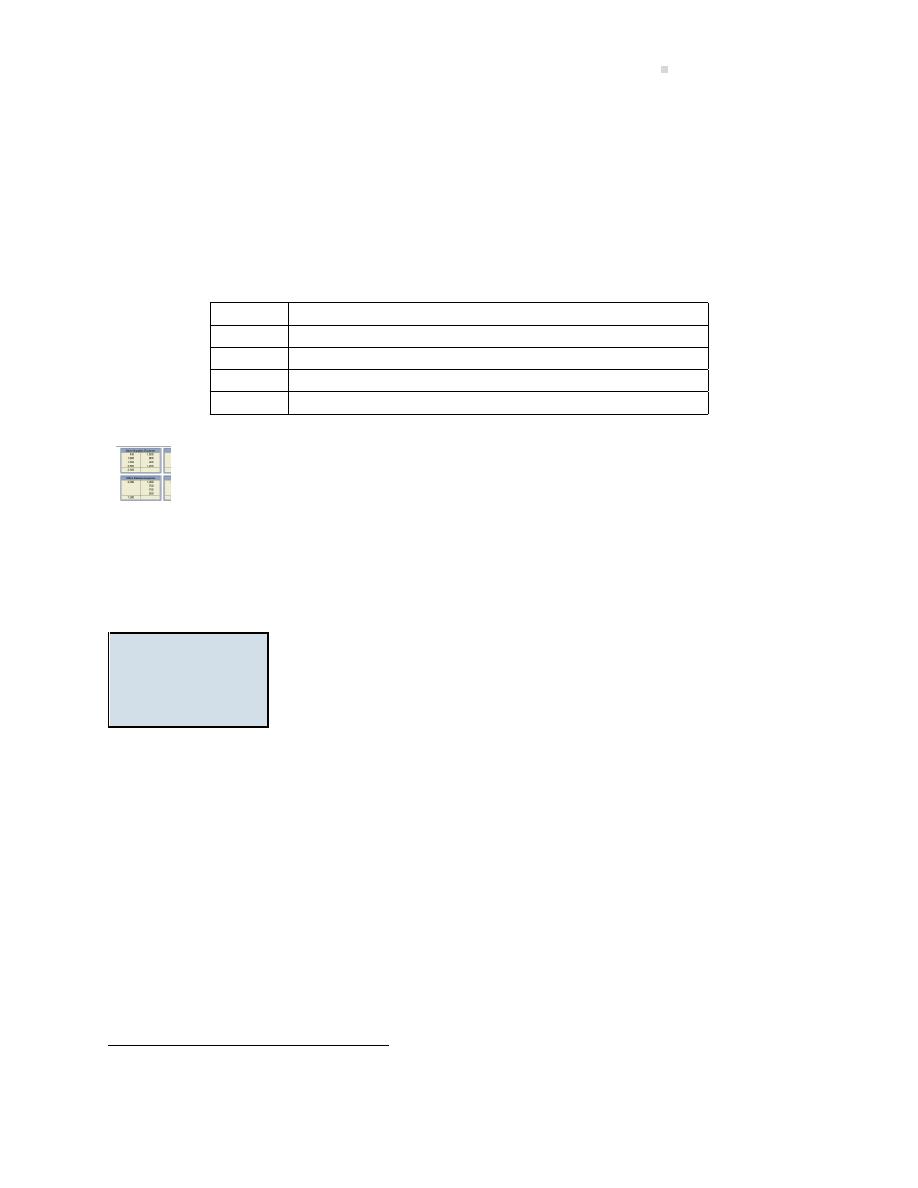
2.2. Transac on Analysis Using Accounts
51
Chart of Accounts
A business will create a list of accounts called a chart of accounts where each account is assigned
both a name and a number. A common prac ce is to have the accounts arranged in a manner
that is compa ble with the order of their use in financial statements. For instance, Asset accounts
begin with the digit ‘1’, Liability accounts with the digit ‘2’. Each business will have a unique chart
of accounts that corresponds to its specific needs. Big Dog Carworks Corp. uses the following
numbering system for its accounts:
100-199
Asset accounts
200-299
Liability accounts
300-399
Share capital, retained earnings, and dividend accounts
500-599
Revenue accounts
600-699
Expense accounts
An explora on is available on the Lyryx site. Log into your Lyryx course to run
.
2.2 Transac on Analysis Using Accounts
LO2 – Analyze
transac ons us-
ing double-entry
accoun ng.
In Chapter
, transac ons for Big Dog Carworks Corp. were analyzed to de-
termine the change in each item of the accoun ng equa on. In this next
sec on, these same transac ons will be used to demonstrate double-entry
accoun ng. Double-entry accoun ng means each transac on is recorded
in at least two accounts where the total debits ALWAYS equal the total
credits. As a result of double-entry accoun ng, the sum of all the debit
balance accounts in the ledger must equal the sum of all the credit bal-
ance accounts. The rule that debits = credits is rooted in the accoun ng
equa on:
ASSETS =
LIABILITIES +
EQUITY
Increases are:
Debits
Credits
Credits
Decreases are: Credits
Debits
Debits
Illustra ve Problem—Double-Entry Accoun ng and the Use of Accounts
In this sec on, the following debit and credit summary will be used to record the transac ons of
Big Dog Carworks Corp. into T-accounts.
3
The issuance of share capital and revenues cause equity to increase; as indicated above, increases in equity are
recorded as credits. Dividends and expenses cause equity to decrease; decreases in equity are recorded as debits.
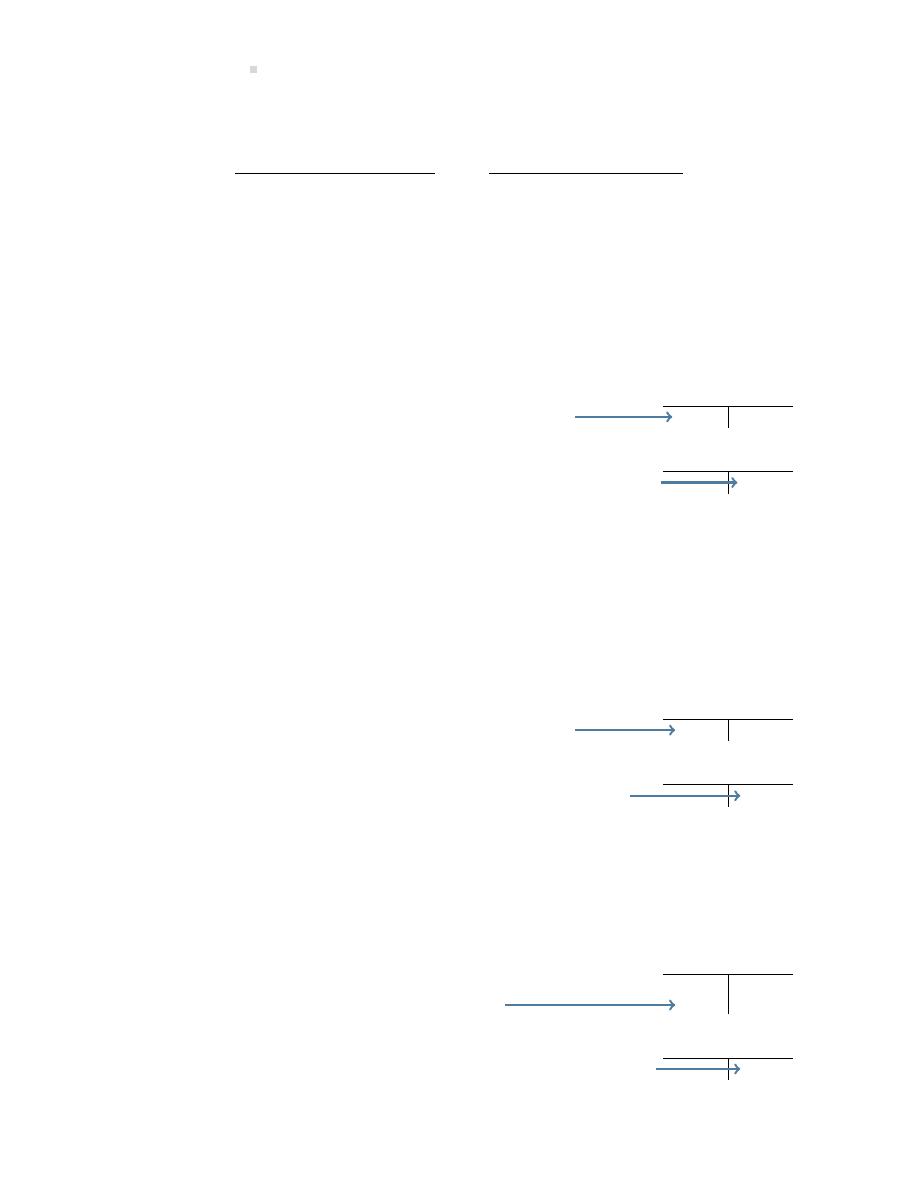
52
The Accoun ng Process
ASSETS
LIABILITIES
DIVIDENDS
SHARE CAPITAL
EXPENSES
REVENUE
Increases are DEBITED.
Increases are CREDITED.
Decreases are CREDITED.
Decreases are DEBITED.
Transac on 1
Jan. 1 – Big Dog Carworks Corp. issued 1,000 shares to Bob Baldwin, a shareholder, for a total of
$10,000 cash.
Analysis:
Cash
Debit: An asset account, Cash, is increased resul ng in a debit.
10,000
Share Capital
Credit: Share Capital, an equity account, is increased resul ng in a credit.*
10,000
*Note: An alternate analysis would be that the issuance of shares causes equity to increase and
increases in equity are always recorded as a credit.
Transac on 2
Jan. 2 – Borrowed $3,000 from the bank.
Analysis:
Cash
Debit: An asset account, Cash, is increased resul ng in a debit.
3,000
Bank Loan
Credit: A liability account, Bank Loan, is increased resul ng in a credit.
3,000
Transac on 3
Jan. 3 – Equipment is purchased for $3,000 cash.
Analysis:
Equipment
Debit: One asset is acquired in exchange for another asset. An asset
account, Equipment, is increased resul ng in a debit.
3,000
Cash
Credit: The account, Cash, also an asset, is decreased resul ng in a credit.
3,000
2.2. Transac on Analysis Using Accounts
53
Transac on 4
Jan. 3 – A truck was purchased for $8,000; Big Dog paid $3,000 cash and incurred a $5,000 bank
loan for the balance.
Analysis:
Truck
Debit: An asset account, Truck, is increased resul ng in a debit.
8,000
Cash
Credit: An asset account, Cash, is decreased resul ng in a credit.
3,000
Bank Loan
Credit: A liability account, Bank Loan, is increased resul ng in a credit.
5,000
Note: Transac on 4 involves one debit and two credits. No ce that the total debit of $8,000 equals
the total credits of $8,000 which sa sfies the double-entry accoun ng rule requiring that debits
ALWAYS equal credits.
Transac on 5
Jan. 5 – Big Dog Carworks Corp. paid $2,400 cash for a one-year insurance policy, effec ve January
1.
Analysis:
Prepaid Insurance
Debit: An asset account, Prepaid Insurance, is increased resul ng in a
debit. Because the insurance provides future benefit, it is recorded as an
asset un l it is used.
2,400
Cash
Credit: Payment of the insurance results in a decrease in the asset
account, Cash, resul ng in a credit.
2,400
Transac on 6
Jan. 10 – The corpora on paid $2,000 cash to reduce the bank loan.
Analysis:
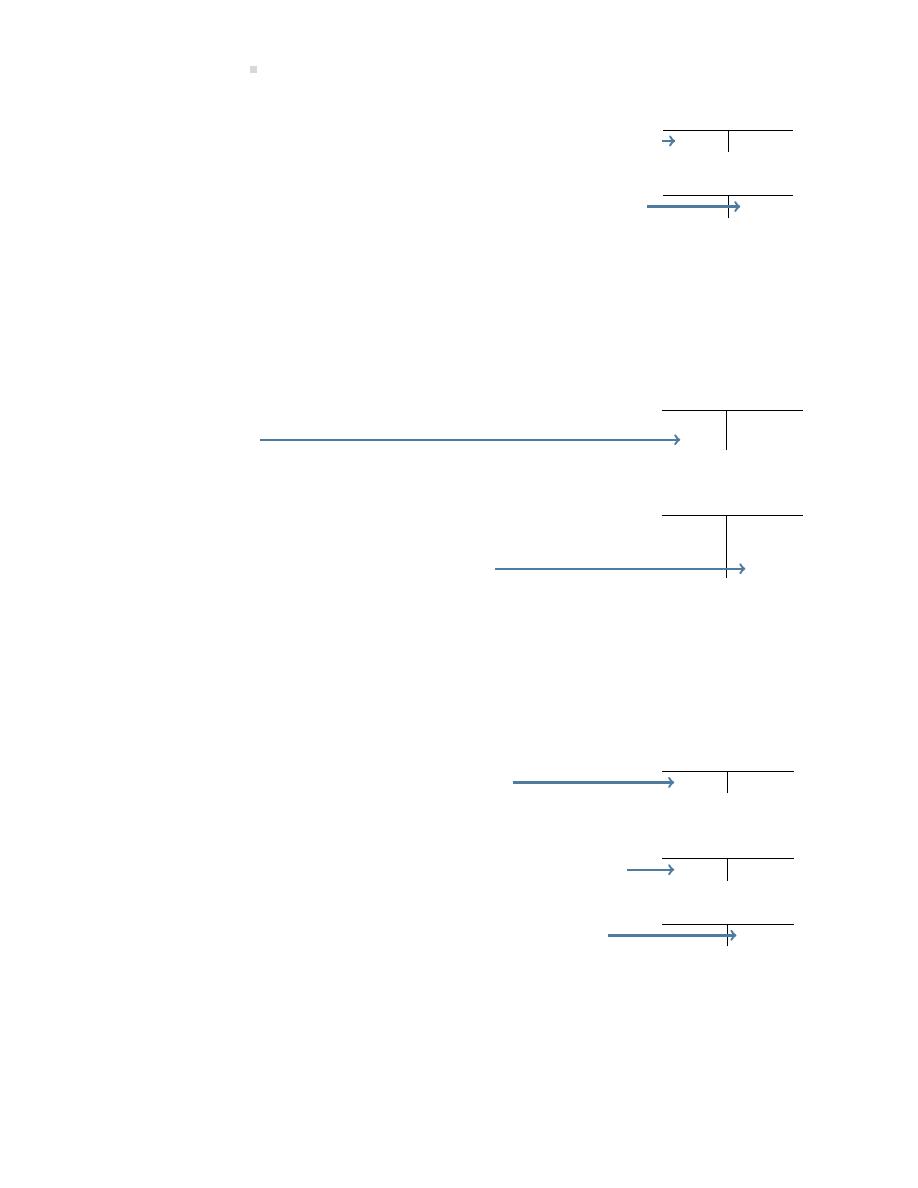
54
The Accoun ng Process
Bank Loan
Debit: This payment decreases the liability, Bank Loan, resul ng in a debit.
2,000
Cash
Credit: The payment also decreases the asset, Cash, resul ng in a credit.
2,000
Transac on 7
Jan. 15 – The corpora on received an advance payment of $400 for repair services to be per-
formed as follows: $300 in February and $100 in March.
Analysis:
Cash
Debit: An asset, Cash, is increased at the me the cash is received
resul ng in a debit.
400
Unearned Repair
Revenue
Credit: Since the revenue rela ng to this cash receipt is not earned as of
this date, a liability account, Unearned Repair Revenue, is credited
because Big Dog ‘owes’ the customer $400 of work.
400
Transac on 8
Jan. 31 – A total of $10,000 of automo ve repair services is performed for a customer who paid
$8,000 cash. The remaining $2,000 will be paid in 30 days.
Analysis:
Cash
Debit: An asset, Cash, is increased resul ng in a debit.
8,000
Accounts
Receivable
Debit: An asset, Accounts Receivable, is increased resul ng in a debit.
2,000
Repair Revenue
Credit: An equity, Repair Revenue, is increased resul ng in a credit.
10,000
Transac on 9
Jan. 31 – Opera ng expenses of $7,100 were paid in cash: Rent expense, $1,600; salaries expense,
$3,500; and supplies expense of $2,000. $700 for truck opera ng expenses (e.g., oil, gas) were
incurred on credit.
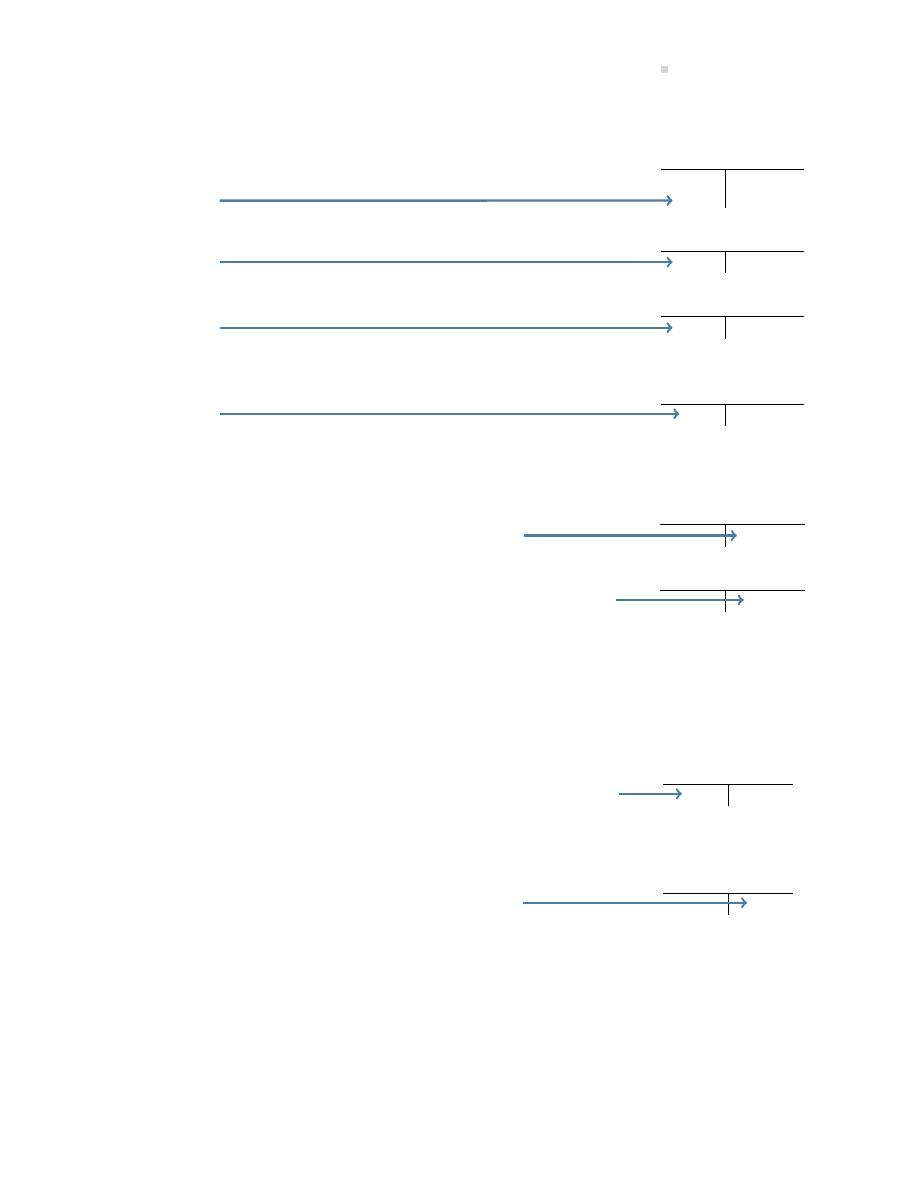
2.2. Transac on Analysis Using Accounts
55
Analysis:
Rent Expense
Debit: This transac on increases four expense accounts resul ng in a
debit to each.
1,600
Salaries Expense
3,500
Supplies Expense
2,000
Truck Opera ng
Expense
700
Note: Each expense is recorded in an individual account.
Cash
Credit: An asset, Cash, is decreased resul ng in a credit.
7,100
Accounts Payable
Credit: A liability, Accounts Payable, is increased resul ng in a credit.
700
Transac on 10
Jan. 31 – Dividends of $200 were paid in cash to the only shareholder, Bob Baldwin.
Analysis:
Dividends
Debit: Dividends, an equity account, is increased resul ng in a debit.
200
Note: An alternate analysis would be that dividends cause equity to decrease and that
decreases in equity are always recorded as a debit.
Cash
Credit: An asset, Cash is decreased resul ng in a credit.
200
A er the January transac ons of Big Dog Carworks Corp. have been recorded in the T-accounts,
each account is totalled and the difference between the debit balance and the credit balance is
calculated, as shown in the following diagram. The numbers in parentheses refer to the transac-
on numbers used in the preceding sec on. To prove that the accoun ng equa on is in balance,
the account balances for each of assets, liabili es, and equity are added. No ce that total assets
of $19,100 equal the sum of total liabili es of $7,100 plus equity of $12,000.
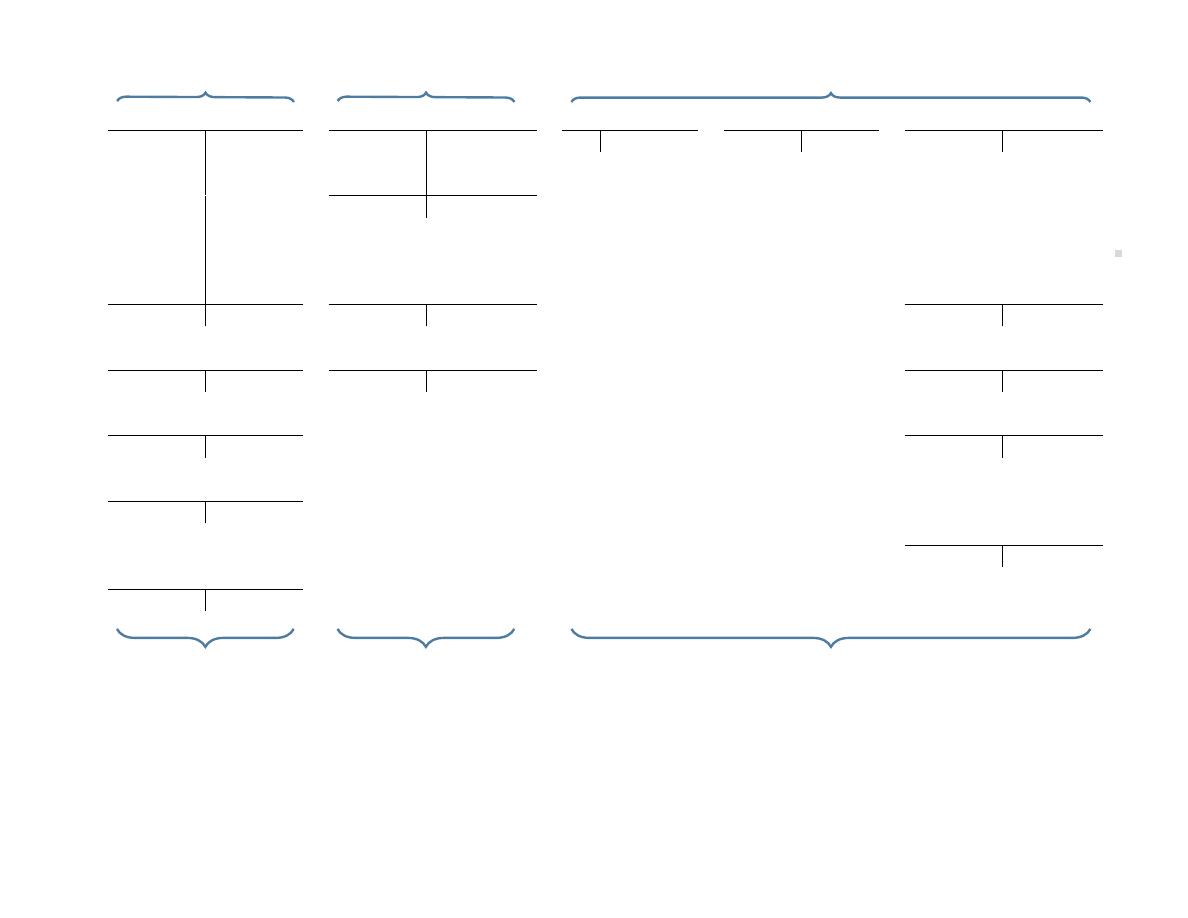
56
The
Acc
oun
ng
Pr
ocess
Cash
Bank Loan
Share Capital
Dividends
Repair Revenue
(1) 10,000
(3)
3,000
(6)
2,000
(2)
3,000
(1) 10,000
(10) 200
(8) 10,000
(2)
3,000
(4)
3,000
(4)
5,000
(7)
400
(5)
2,400
(8)
8,000
(6)
2,000
Bal. 6,000
(9)
7,100
(10)
200
Accounts Payable
Rent Expense
Bal. 3,700
(9)
700
(9)
1,600
Accounts Receivable
Unearned Repair Revenue
Salaries Expense
(8)
2,000
(7)
400
(9)
3,500
Prepaid Insurance
Supplies Expense
(5)
2,400
(9)
2,000
Equipment
(3)
3,000
Truck Opera on Expense
(9)
700
Truck
(4)
8,000
19,100
1
=
7,100
2
+
12,000
3
1. 3,700 + 2,000 + 2,400 + 3,000 + 8,000 = 19,100
2. 6,000 + 700 + 400 = 7,100
3. 10,000 - 200 + 10,000 - 1,600 - 3,500 - 2,000 - 700 = 12,000
ASSETS
LIABILITIES
EQUITY
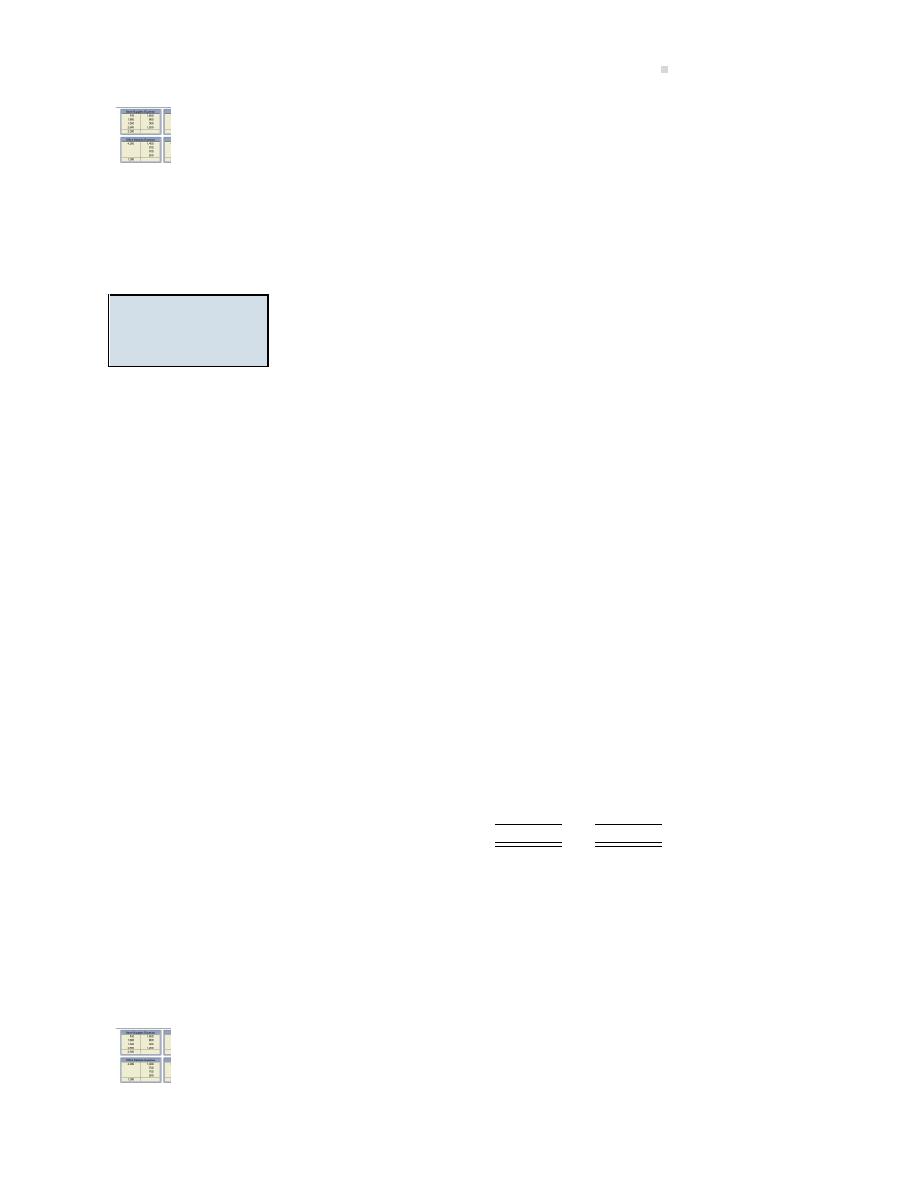
2.3. The Trial Balance
57
An explora on is available on the Lyryx site. Log into your Lyryx course to run
.
2.3 The Trial Balance
LO3 – Prepare a
trial balance and
explain its use.
To help prove that the accoun ng equa on is in balance, a trial balance is
normally prepared instead of the T-account lis ng shown in the previous
sec on. A trial balance is an internal document that lists all the account
balances at a point in me. The total debits must equal total credits on
the trial balance. The form and content of a trial balance is illustrated
below, using the account numbers, account names, and account balances
of Big Dog Carworks Corp. at January 31, 2015. Assume that the account
numbers are those assigned by the business.
Big Dog Carworks Corp.
Trial Balance
At January 31, 2015
Acct. No.
Account
Debit
Credit
101
Cash
$3,700
110
Accounts receivable
2,000
161
Prepaid insurance
2,400
183
Equipment
3,000
184
Truck
8,000
201
Bank loan
$6,000
210
Accounts payable
700
247
Unearned revenue
400
320
Share capital
10,000
330
Dividends
200
450
Repair revenue
10,000
654
Rent expense
1,600
656
Salaries expense
3,500
668
Supplies expense
2,000
670
Truck opera on expense
700
$27,100
$27,100
Double-entry accoun ng requires that debits equal credits. The trial balance establishes that this
equality exists for Big Dog but it does not ensure that each item has been recorded in the proper
account. Neither does the trial balance ensure that all items that should have been entered have
been entered. In addi on, a transac on may be recorded twice. Any or all of these errors could
occur and the trial balance would s ll balance. Nevertheless, a trial balance provides a useful
mathema cal check before preparing financial statements.
An explora on is available on the Lyryx site. Log into your Lyryx course to run

58
The Accoun ng Process
Prepara on of Financial Statements
Financial statements for the one-month period ended January 31, 2015 can now be prepared from
the trial balance figures. First, an income statement is prepared.
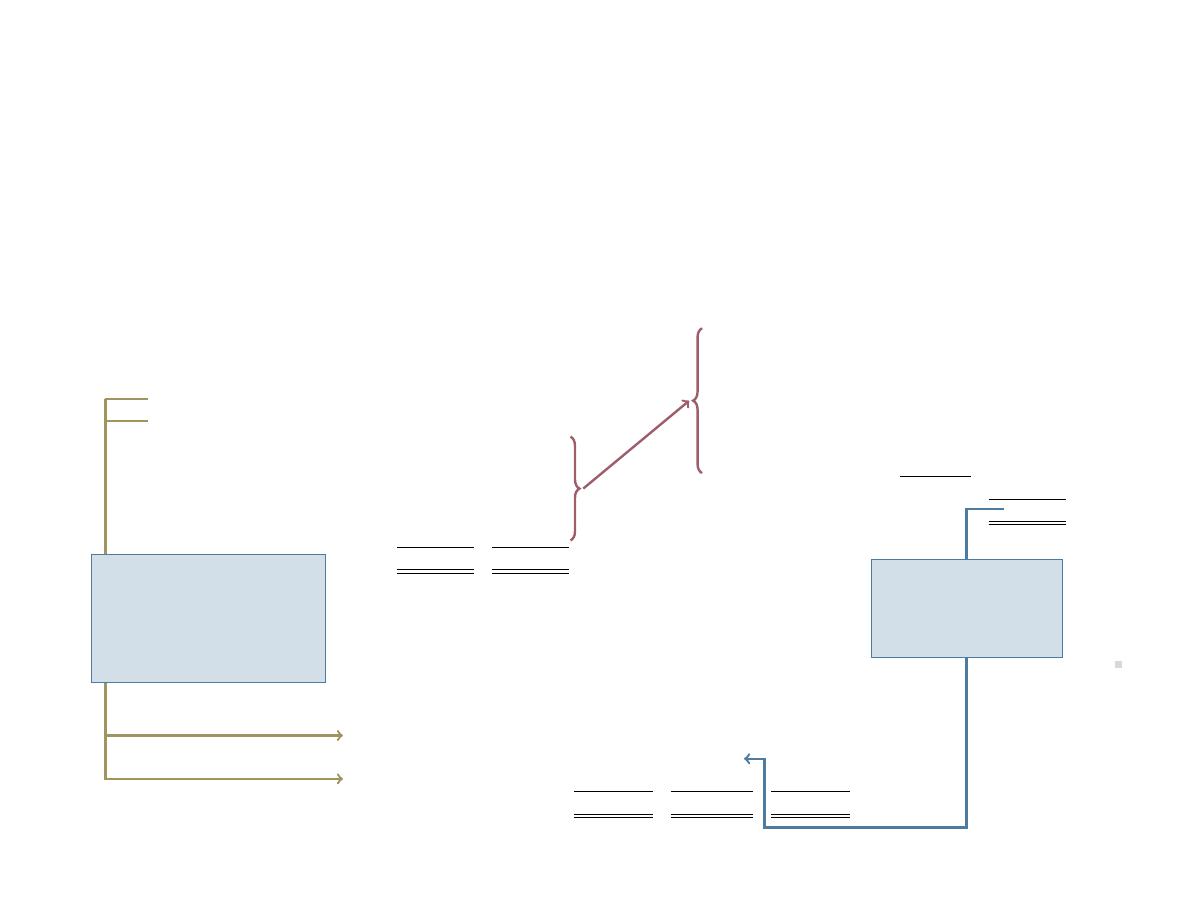
2.3.
The
Trial
Balance
59
Big Dog Carworks Corp.
Trial Balance
At January 31, 2015
Acct. No.
Account
Debit
Credit
101
Cash
$ 3,700
Big Dog Carworks Corp.
110
Accounts receivable
2,000
Income Statement
161
Prepaid insurance
2,400
For the Month Ended January 31, 2015
183
Equipment
3,000
184
Truck
8,000
Revenues
201
Bank loan
$ 6,000
Repair revenue
$10,000
210
Accounts payable
700
247
Unearned revenue
400
Expenses
320
Share capital
10,000
Salaries expense
$ 3,500
330
Dividends
200
Supplies expense
2,000
450
Repair revenue
10,000
Rent expense
1,600
654
Rent expense
1,600
Truck opera on expense
700
656
Salaries expense
3,500
Total expenses
7,800
668
Supplies expense
2,000
Net income
$ 2,200
670
Truck opera on expense
700
$27,100
$27,100
Big Dog Carworks Corp.
Statement of Changes in Equity
For the Month Ended January 31, 2015
Share
Retained
Total
Capital
Earnings
Equity
Balance at beginning of period
$
-0-
$
-0-
$
-0-
Shares issued
10,000
10,000
Net income
2,200
2,200
Dividends
(200)
(200)
Ending balance
$10,000
$2,000
$12,000
Share Capital and Dividends
are transferred to the State-
ment of Changes in Equity.
Dividends is part of Re-
tained Earnings because
it is a distribu on of net
income.
Net Income is trans-
ferred to the State-
ment of Changes in
Equity as part of Re-
tained Earnings.
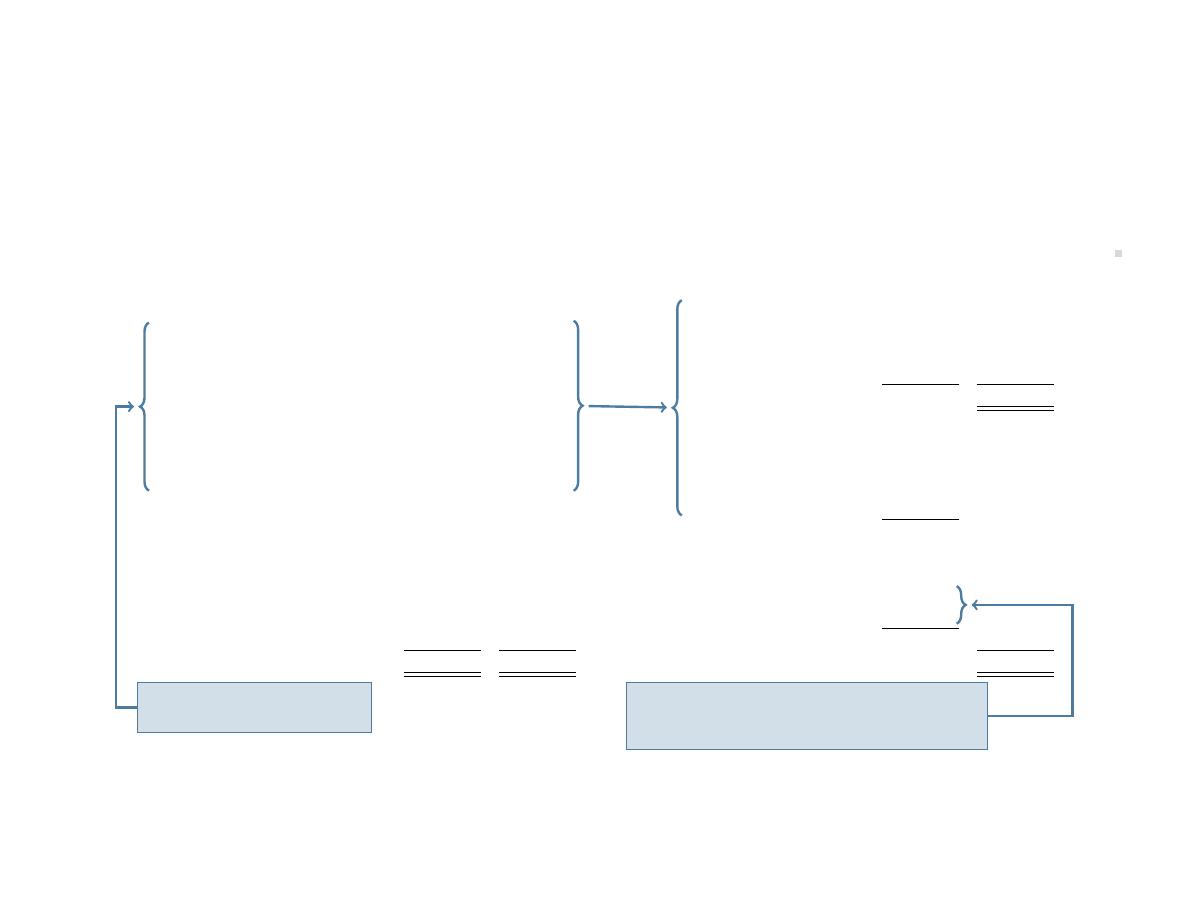
60
The
Acc
oun
ng
Pr
ocess
The asset and liability accounts from the trial balance and the ending balances for share capital and retained earnings on the statement
of changes in equity are used to prepare the balance sheet.
Big Dog Carworks Corp.
Balance Sheet
Big Dog Carworks Corp.
At January 31, 2015
Trial Balance
At January 31, 2015
Assets
Cash
$ 3,700
Acct. No.
Account
Debit
Credit
Accounts receivable
2,000
101
Cash
$ 3,700
Prepaid insurance
2,400
110
Accounts receivable
2,000
Equipment
3,000
161
Prepaid insurance
2,400
Truck
8,000
183
Equipment
3,000
Total assets
$19,100
184
Truck
8,000
201
Bank loan
$ 6,000
Liabili es
210
Accounts payable
700
Bank loan
$ 6,000
247
Unearned revenue
400
Accounts payable
700
320
Share capital
10,000
Unearned repair revenue
400
330
Dividends
200
Total liabili es
$ 7,100
450
Repair revenue
10,000
654
Rent expense
1,600
Equity
656
Salaries expense
3,500
Share capital
$10,000
668
Supplies expense
2,000
Retained earnings
2,000
670
Truck opera on expense
700
Total equity
12,000
$27,100
$27,100
Total liabili es and equity
$19,100
These accounts are used to
prepare the Balance Sheet.
The Share Capital and Retained Earnings bal-
ances are transferred to the Balance Sheet
from the Statement of Changes in Equity

2.3. The Trial Balance
61
NOTE: Pay a en on to the links between financial statements.
The income statement is linked to the statement of changes in equity: Revenues and expenses
are reported on the income statement to show the details of net income. Because net income
causes equity to change, it is then reported on the statement of changes in equity.
The statement of changes in equity is linked to the balance sheet: The statement of changes
in equity shows the details of how equity changed during the accoun ng period. The balances
for share capital and retained earnings that appear on the statement of changes in equity are
transferred to the equity sec on of the balance sheet.
The balance sheet SUMMARIZES equity by showing only account balances for share capital and
retained earnings. To obtain the details regarding these equity accounts, we must look at the
income statement and the statement of changes in equity.

62
The Accoun ng Process
2.4 Using Formal Accoun ng Records
LO4
–
Record
transac ons in a
general
journal
and post in a
general ledger.
The preceding analysis of financial transac ons used T-accounts to record
debits and credits. T-accounts will con nue to be used for illustra ve pur-
poses throughout this book. In actual prac ce, financial transac ons are
recorded in a general journal.
A general journal, or just journal, is a document that is used to chronolog-
ically record a business’s debit and credit transac ons (see Figure
). It is
o en referred to as the book of original entry. Journalizing is the process
of recording a financial transac on in the journal. The resul ng debit and
credit entry recorded in the journal is called a journal entry.
A general ledger, or just ledger, is a record that contains all of a business’s accounts. Pos ng is
the process of transferring amounts from the journal to the matching ledger accounts. Because
amounts recorded in the journal eventually end up in a ledger account, the ledger is some mes
referred to as a book of final entry.
Recording Transac ons in the General Journal
Each transac on is first recorded in the journal. The January transac ons of Big Dog Carworks
Corp. are recorded in its journal as shown in Figure
. The journalizing procedure follows these
steps (refer to Figure
for corresponding numbers):
1. The year is recorded at the top and the month is entered on the first line of page 1. This
informa on is repeated only on each new journal page used to record transac ons.
2. The date of the first transac on is entered in the second column, on the first line. The day
of each transac on is always recorded in this second column.
3. The name of the account to be debited is entered in the descrip on column on the first
line. By conven on, accounts to be debited are usually recorded before accounts to be
credited. The column tled ‘F’ (for Folio) indicates the number given to the account in the
General Ledger. For example, the account number for Cash is 101. The amount of the debit
is recorded in the debit column. A dash is o en used by accountants in place of .00.
4. The name of the account to be credited is on the second line of the descrip on column
and is indented about one cen metre into the column. Accounts to be credited are always
indented in this way in the journal. The amount of the credit is recorded in the credit column.
Again, a dash may be used in place of .00.
5. An explana on of the transac on is entered in the descrip on column on the next line. It is
not indented.

2.4. Using Formal Accoun ng Records
63
6. A line is usually skipped a er each journal entry to separate individual journal entries and
the date of the next entry recorded. It is unnecessary to repeat the month if it is unchanged
from that recorded at the top of the page.
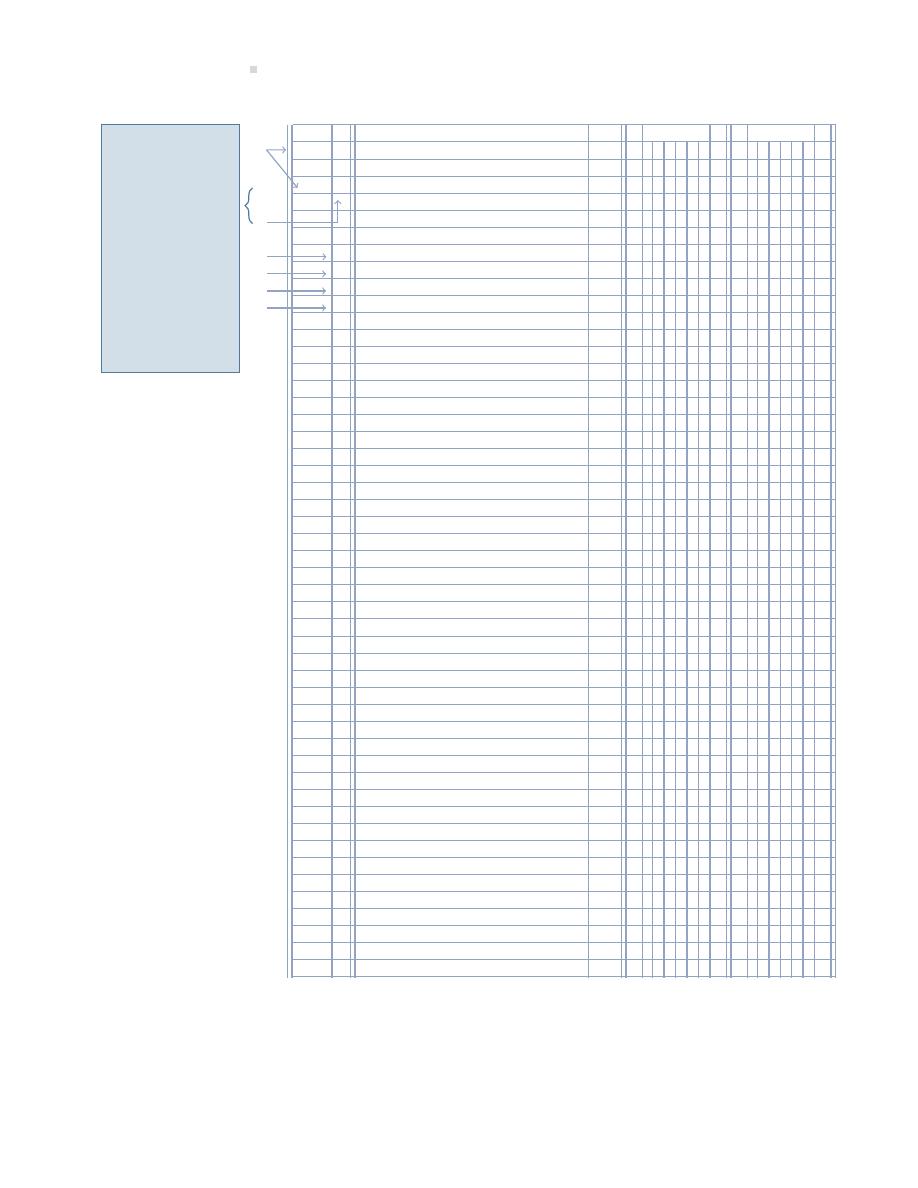
64
The Accoun ng Process
GENERAL JOURNAL
Page 1
Date
Descrip on
F
Debit
Credit
1
2015
Jan. 1
Cash
101
1 0 0 0 0 -
Share Capital
320
1 0 0 0 0 -
To record the issuance of share capital.
2
Cash
101
3 0 0 0 -
Bank Loan
201
3 0 0 0 -
To record receipt of a bank loan.
2
Equipment
183
3 0 0 0 -
Cash
101
3 0 0 0 -
To record the purchase of equipment for cash.
3
Truck
184
8 0 0 0 -
Bank Loan
201
5 0 0 0 -
Cash
101
3 0 0 0 -
To record the purchase of a tow truck; paid
cash and incurred addi onal bank loan.
5
Prepaid Insurance
161
2 4 0 0 -
Cash
101
2 4 0 0 -
To record payment for a one-year insurance policy.
10
Bank Loan
201
2 0 0 0 -
Cash
101
2 0 0 0 -
To record payment on bank loan.
15
Cash
101
4 0 0 -
Unearned Repair Revenue
247
4 0 0 -
To record receipt of payment for services not performed:
$300 for February, $100 for March.
31
Cash
101
8 0 0 0 -
Accounts Receivable
110
2 0 0 0 -
Repair Revenue
450
1 0 0 0 0 -
To record repaid revenue earned in January.
31
Rent Expense
654
1 6 0 0 -
Salaries Expense
656
3 5 0 0 -
Supplies Expense
668
2 0 0 0 -
Truck Opera on Expense
670
7 0 0 -
Cash
101
7 1 0 0 -
Accounts Payable
210
7 0 0 -
To record cash payment of expenses for the month.
31
Dividends
330
2 0 0 -
Cash
101
2 0 0 -
To record distribu on of dividends.
2
3
4
5
6
This entry tells us
to:
- Post $10,000 to
the debit side of
the Cash account
(increasing Cash
by $10,000), and
- Post $10,000 to
the credit side of
the Share Capital
account (increas-
ing this account
by $10,000).
Figure 2.2: General Journal Transac ons for BDCC in January
Most of Big Dog’s entries have one debit and credit. An entry can also have more than one debit
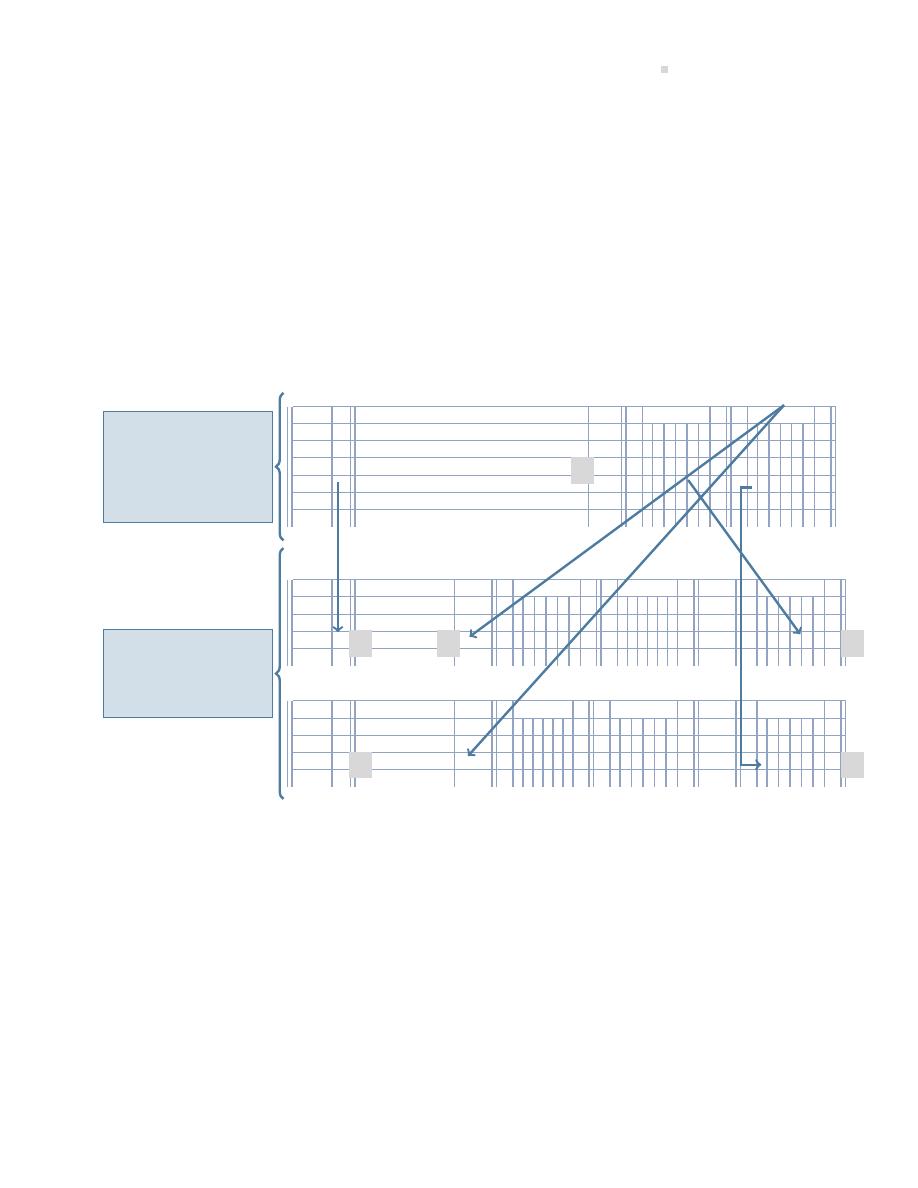
2.4. Using Formal Accoun ng Records
65
or credit, in which case it is referred to as a compound entry. The entry dated January 3 is an
example of a compound entry.
Pos ng Transac ons to the General Ledger
The ledger account is a formal varia on of the T-account. The ledger accounts shown in Figure
are similar to what is used in electronic/digital accoun ng programs. Ledger accounts are kept in
the general ledger. Debits and credits recorded in the journal are posted to appropriate ledger
accounts so that the details and balance for each account can be found easily. Figure
uses the
first transac on of Big Dog Carworks Corp. to illustrate how to post amounts and record other
informa on.
GENERAL JOURNAL
Page 1
Date
Descrip on
F
Debit
Credit
2015
GENERAL LEDGER
Cash
Acct. No. 101
Date
Descrip on
F
Debit
Credit
DR/CR
Balance
2015
Share Capital
Acct. No. 320
Date
Descrip on
F
Debit
Credit
DR/CR
Balance
2015
Jan. 1
Cash
101
1 0 0 0 0 -
Share Capital
320
1 0 0 0 0 -
To record the issuance of share capital.
Jan. 1
GJ1
1 0 0 0 0 -
DR
1 0 0 0 0 -
Jan. 1
GJ1
1 0 0 0 0 -
CR
1 0 0 0 0 -
The journal records
each financial trans-
ac on in double-entry
form. Each side of the
entry is transferred to
a separate ledger ac-
count.
The ledger stores trans-
ac ons according to
account and keeps a
running total of each
account balance.
3
1
1
2
4
4
Figure 2.3: Illustra on of a Transac on Posted to Two Accounts in the General Ledger
1. The date and amount are posted to the appropriate ledger account. Here the entry debi ng
Cash is posted from the journal to the Cash ledger account. The entry credi ng Share Capital
is then posted from the journal to the Share Capital ledger account.
2. The journal page number is recorded in the folio (F) column of each ledger account as a
cross reference. In this case, the pos ng has been made from general journal page 1; the
reference is recorded as GJ1.
3. The appropriate ledger account number is recorded in the folio (F) column of the journal to
indicate the pos ng has been made to that par cular account. Here the entry debi ng Cash

66
The Accoun ng Process
has been posted to Account No. 101. The entry credi ng Share Capital has been posted to
Account No. 320.
4. A er pos ng the entry, a balance is calculated in the Balance column. A nota on is recorded
in the column to the le of the Balance column indica ng whether the balance is a debit or
credit. A brief descrip on can be entered in the Descrip on column but this is generally not
necessary since the journal includes a detailed descrip on for each journal entry.
This manual process of recording, pos ng, summarizing, and preparing financial statements is
cumbersome and me-consuming. In virtually all businesses, the use of accoun ng so ware au-
tomates much of the process. In this and subsequent chapters, either the T-account or the ledger
account can be used in working through exercises and problems. Both formats are used to explain
and illustrate concepts in subsequent chapters.
An explora on is available on the Lyryx site. Log into your Lyryx course to run
Special Journals and Subledgers
The general journal and the general ledger each act as a single all-purpose document where all
the company’s transac ons are recorded and posted over the life of the company.
As was shown in Figure
, various transac ons are recorded to a general journal chronologi-
cally by date as they occurred. When companies engage in certain same-type, high-frequency
transac ons such as credit purchases and sales on account, special journals are o en created in
order to separately track informa on about these types of transac ons. Typical special journals
that companies o en use are a sales journal, cash receipts journal, purchases journal and a cash
disbursements journal. There can be others, depending on the business a company is involved
in. The general journal con nues to be used to record any transac ons not posted to any of the
special journals, such as:
• correc ng entries
• adjus ng entries
• closing entries
An example of a special journal for credit sales is shown below.
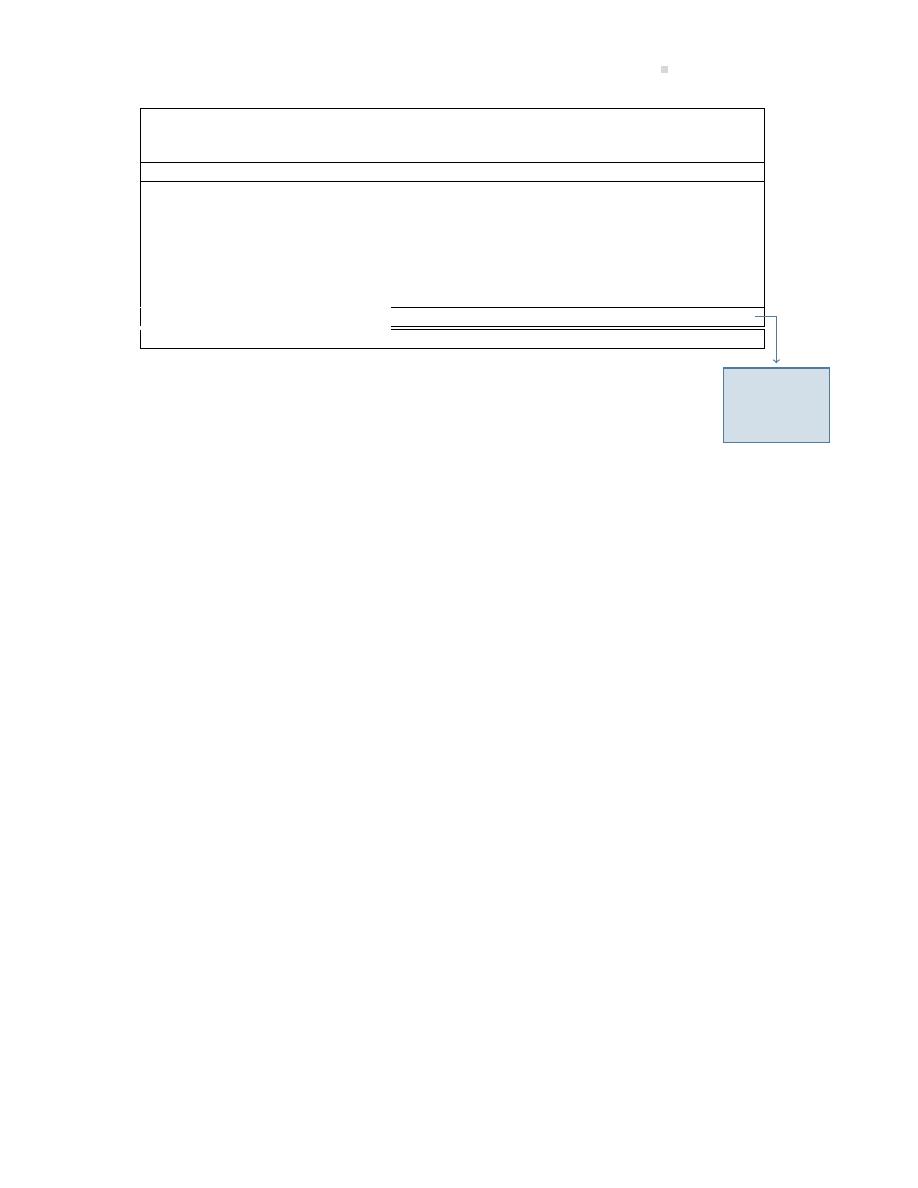
2.4. Using Formal Accoun ng Records
67
Credit Sales Journal
S1
Accounts
Hardware
Ligh ng
Plumbing
GST
Date
Billing #
Customer
Ref
Receivable
Sales
Sales
Sales
Payable
Debit
Credit
Credit
Credit
Credit
2017
Sept 1
17001
Hardy
AR5
$
25,000
$
1,500
$ 22,250
$ 1,250
Sept 5
17002
Smith
AR1
2,260
$ 2,147
113
Sept 6
17003
Bergeron
AR4
8,000
5,000
1,000
1,600
400
Sept 7
17004
Douglas
AR3
16,000
15,200
800
Sept 8
17005
Hardy
AR5
115,000
16,000
45,000
48,250
5,750
Sept 11
17006
White
AR2
10,000
5,000
4,500
500
Totals
$ 176,260
$ 22,500
$53,147
$ 91,800
$ 8,813
GL account
110
410
414
418
280
Posted
monthly to
the general
ledger
Figure 2.4: Sales Journal – records credit sales
For simplicity, the cost of goods sold is excluded from this sales journal and will be covered in
chapter five of this course. The sales journal provides a quick overview of the total credit sales
for the month as well as various sub-groupings of credit sales such as by product sold, GST, and
customers.
The sales journal can also be expanded to include credit sales returns, and the purchases jour-
nal to include purchases returns and allowances for each accoun ng month. Note that purchase
discounts would be recorded in the cash disbursements journal because the discount is usually
claimed at the me of the cash payment to the supplier/creditor. This is also the case with sales
discounts from customers which would be recorded in the cash receipts journal at the me the
cash, net of the sales discount, is received. Any cash sales returns would be recorded in the cash
disbursements journal.
Recall from Figure
that with accoun ng records that comprise only a general journal and gen-
eral ledger, each transac on recorded in the general journal was posted to the general ledger.
With special journals, such as the sales journal, their monthly totals are posted to the general
ledger instead. For larger companies, these journals can be summarized and posted more fre-
quently, such as weekly or daily, if needed.
Below are examples of other typical special journals such as a purchases journal, cash receipts
journal, cash disbursements journal and the general journal. Note the different sub-groupings in
each one and consider how these would be useful for managing the company’s business.

68
The Accoun ng Process
Credit Purchases Journal
P1
Accounts
Hardware
Ligh ng
Plumbing
GST
Date
Invoice #
Creditor
Ref
Payable
Purchases
Purchases
Purchases
Recv
Credit
Debit
Debit
Debit
Debit
2017
Sept 1
B253
Be er and Sons
AP6
$ 60,000
$ 57,000
$ 3,000
Sept 5
2008
Northward Suppliers
AP2
160,000
$ 152,000
8,000
Sept 6
15043
Ligh ng Always
AP4
18,000
$ 17,100
900
Sept 7
RC18
VeriSure Mfg
AP1
24,000
22,800
1,200
Sept 8
1102
Pearl Ligh ng
AP3
5,000
2,000
2,750
250
Sept 11
EF-1603
Arnold Consolidated
AP5
1,600
1,520
80
Totals
$268,600
$ 154,000
$ 19,850
$ 81,320
$13,430
GL account
210
510
514
518
180
Figure 2.5: Purchases Journal – records credit purchases
Cash Receipts Journal
CR1
Sales
Accounts
Cash
GST
Date
Billing #
Customer
Ref
Cash
Discount
Receivable
Sales
Payable
Debit
Debit
Credit
Credit
Credit
2017
Sept 1
17001
Hardy
AR5
$12,000
$
120
$
12,120
Sept 6
CS1
Cash sale
CS1
1,500
$1,425
$
75
Sept 8
17003
Bergeron
AR4
2,000
2,000
Sept 11
17004
Douglas
AR3
20,000
20,000
Sept 12
17005
Cash sale
CS2
3,250
3,088
163
Sept 13
17006
White
AR2
5,000
5,000
Totals
$43,750
$
120
$
39,120
$4,513
$
238
GL account
102
402
110
410
280
Figure 2.6: Cash Receipts Journal – records all cash receipts
Cash Disbursements Journal
CD1
Purchase
Discount
Accounts
Other
Date
Chq #
Payee
Ref
Cash
(Inventory)
Payable
Disb…
Desc
Credit
Credit
Debit
Debit
2017
Sept 1
101
General Ligh ng Ltd.
AP22
$14,775
$
225
$ 15,000
Sept 2
102
John Bremner
SAL1
1,600
$ 1,600
Salary exp.
Sept 11
103
Ligh ng Always
AP4
4,200
4,200
Sept 12
104
VeriSure Mfg
AP1
22,500
225
22,725
Sept 13
105
Receiver General
AP 14
14,000
14,000
GST Aug
Sept 14
106
City of Edmonton
AP18
5,500
5,500
Property Tax
Totals
$62,575
$
450
$ 41,925
$ 21,100
GL account
102
104
210
various
Figure 2.7: Cash Disbursements Journal – records all cash disbursements

2.4. Using Formal Accoun ng Records
69
General Journal
GJ1
Date
Account/Explana on
PR
Debit
Credit
Sept 30, 2017
Bank service charges expense . . . . . . . . . . .
520
25
Cash . . . . . . . . . . . . . . . . . . . . . . . . . . . . . . .
102
25
Bank reconcilia on for August
Sept 30, 2017
Deprecia on expense . . . . . . . . . . . . . . . . . .
530
3,500
Accumulated deprecia on . . . . . . . . . . .
118
3,500
Deprecia on for September
Totals
3,525
3,525
Figure 2.8: General Journal – records all other entries including adjustments, correc ons, and
closing entries
Each account that exists in the general journal must be represented by a corresponding account in
the general ledger. As previously stated, each entry from the general journal is posted directly to
the general ledger, if no other special journals or subledgers exist. If there are several hundreds or
thousands of accounts receivable transac ons for many different customers during a month, this
detail cannot be easily summarized in meaningful ways. This may be fine for very small companies,
but most companies need certain types of transac ons sub-groupings, such as for accounts receiv-
able, accounts payable and inventory. For this reason, subsidiary ledgers or subledgers are used
to accomplish this. Subledgers typically include accounts receivable sub-grouped by customer,
accounts payable by supplier, and inventory by inventory item. Monthly totals from the special
journals con nue to be posted to the general ledger, which now acts as a control account to its
related subledger. It is cri cal that the subledgers always balance to their respec ve general
ledger control account, hence the name control account.
Below is an example of how a special journal, such as a sales journal is posted to the subledgers
and general ledger.
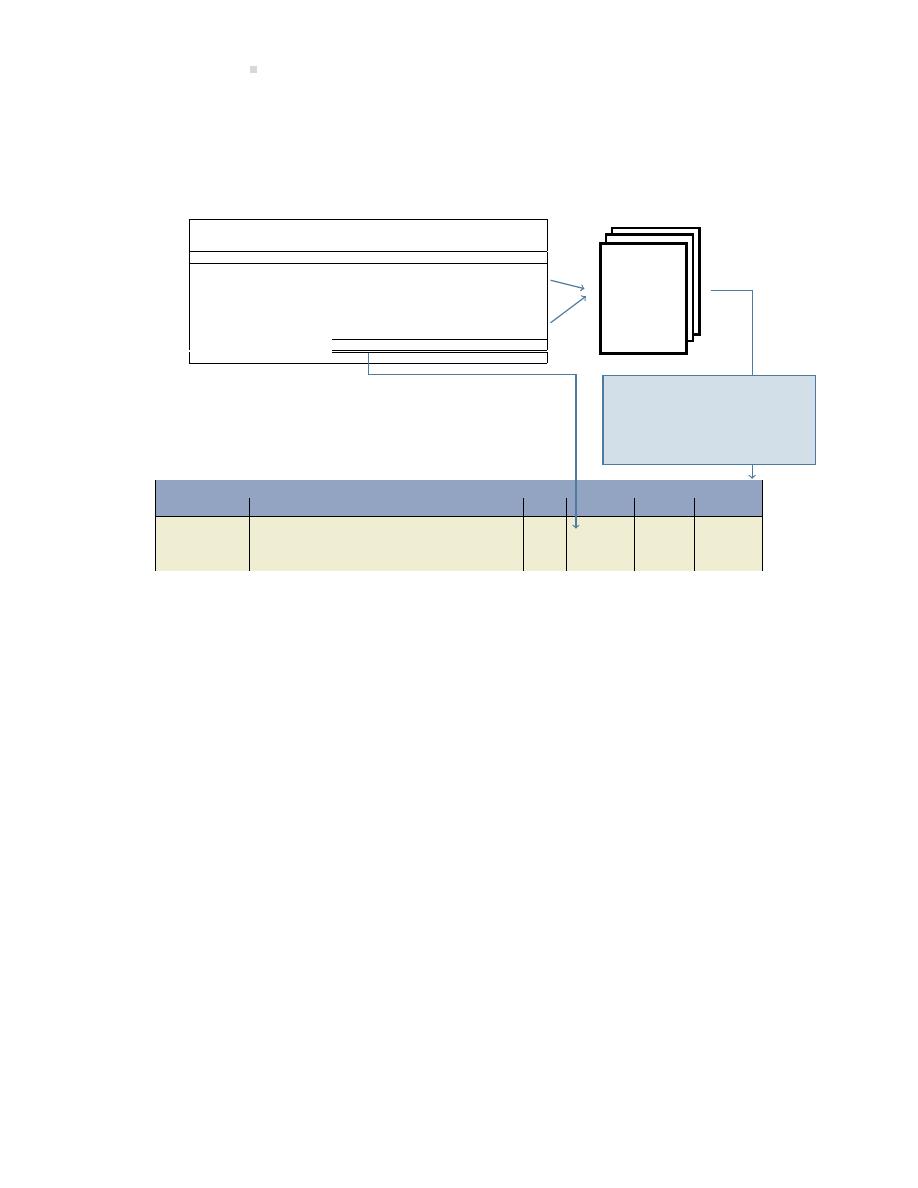
70
The Accoun ng Process
Credit Sales Journal
S1
Accounts
Hardware
Ligh ng
Plumbing
GST
Date
Billing #
Customer
Ref
Receivable
Sales
Sales
Sales
Payable
Debit
Credit
Credit
Credit
Credit
2017
Sept 1
17001
Hardy
AR5
$
25,000
$
1,500
$ 22,250
$ 1,250
Sept 5
17002
Smith
AR1
2,260
$ 2,147
113
Sept 6
17003
Bergeron
AR4
8,000
5,000
1,000
1,600
400
Sept 7
17004
Douglas
AR3
16,000
15,200
800
Sept 8
17005
Hardy
AR5
115,000
16,000
45,000
48,250
5,750
Sept 11
17006
White
AR2
10,000
5,000
4,500
500
Totals
$ 176,260
$ 22,500 $53,147
$ 91,800
$ 8,813
GL account
110
410
414
418
280
Hardy AR5
Bal fwd.
$2,100
17001 …
$25,000
17005 … $115,000
Sales Journal – records credit sales
SUBLEDGERS
Accounts Receivable
by Customer
Posted Daily
Accounts Receivable # 110
Date
Account/Explana on
PR
Debit
Credit
Balance
Sept 1, 2017
Opening balance
216,000
Credit Sales Journal . . . . . . . . . . . . . . . . . . . .
S1
176,260
Cash Distrib. Journal . . . . . . . . . . . . . . . . . .
CD1
39,120
353,140
Posted Monthly
The sum of all the records
within each subledger must
be equal to the ending bal-
ance of its respec ve control
account in the general ledger.
GENERAL JOURNAL
Note how the general ledger can now be posted using the monthly totals from the sales journal
instead of by individual transac on. Each line item within the sales journal is now posted on a
daily basis directly to the subledger by customer instead, and balanced to the accounts receivable
control balance in the general ledger. The subledger enables the company to quickly determine
which customers owe money and details about those amounts.
At one me, recording transac ons to the various journals and ledgers was all done manually as
illustrated above. Today, accoun ng so ware makes this process easy and efficient. Data for each
transac on is entered into the various data fields within the so ware transac on record. Once
the transac on entry has been input and saved, the so ware automa cally posts the data to any
special journals, subledgers and general ledger. At any me, the accountant can easily obtain
summary or detailed reports including a trial balance, accounts receivable by customer, accounts
payable by creditor, inventory by inventory item, and so on.
Below is a flowchart that illustrates the flow of the informa on for a manual system from the
source documents to the special journals, the subledgers and to the general ledger. This illustra-
on also helps to give a sense of how the data would flow using accoun ng so ware.
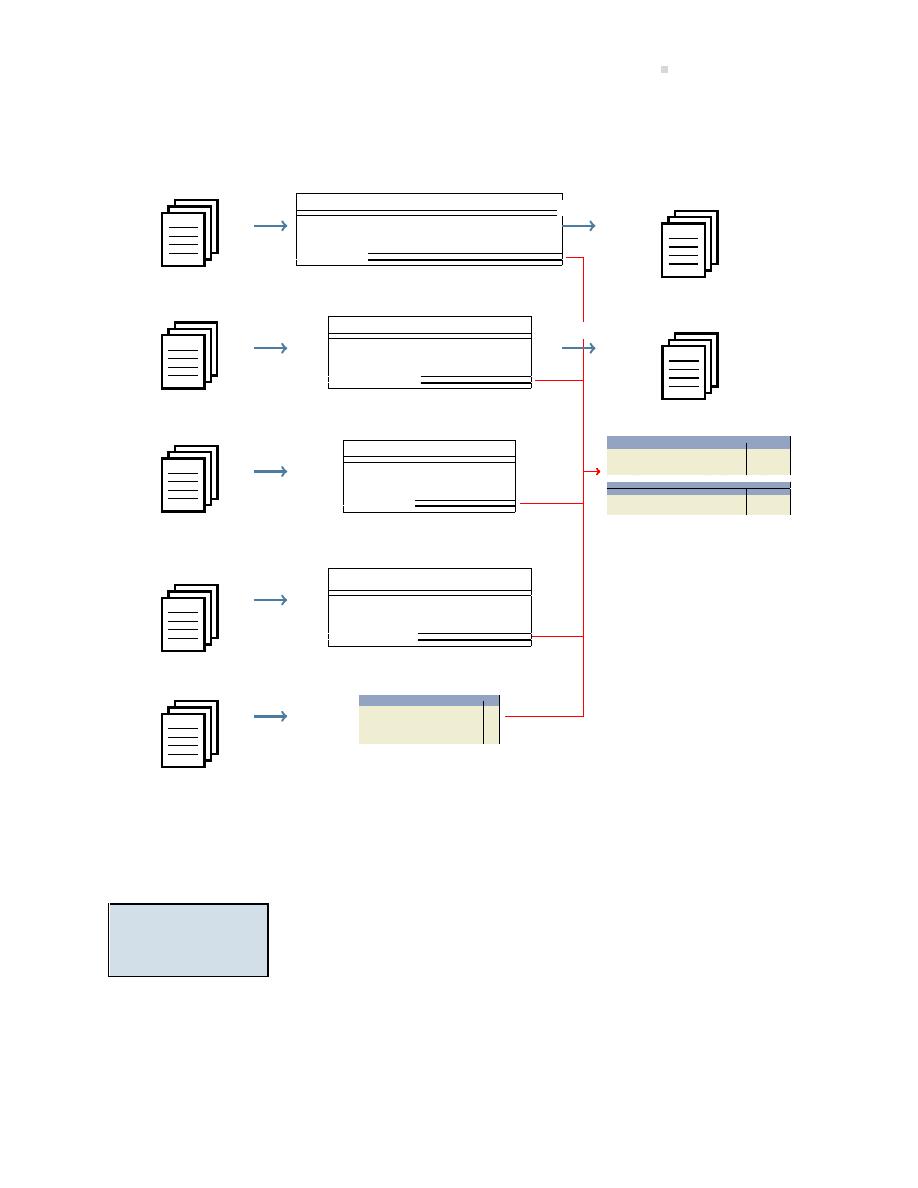
2.5. The Accoun ng Cycle
71
SPECIAL JOURNALS
SOURCE
DOCUMENTS
SUBLEDGERS
Customer Billings
Sales Journal – records credit sales
Credit Sales Journal
S1
Accounts
Hardware
Ligh ng
Plumbing
GST
Date
Billing # Customer
Ref
Receivable
Sales
Sales
Sales
Payable
Debit
Credit
Credit
Credit
Credit
2017
Sept 1
17001
Hardy
AR5 $
25,000 $
1,500
$ 22,250 $
1,250
Sept 5
17002
Smith
AR1
2,260
$ 2,147
113
Sept 6
17003
Bergeron
AR4
8,000
5,000
1,000
1,600
400
Sept 7
17004
Douglas
AR3
16,000
15,200
800
Sept 8
17005
Hardy
AR5
115,000
16,000
45,000
48,250
5,750
Sept 11
17006
White
AR2
10,000
5,000
4,500
500
Totals
$ 176,260 $ 22,500 $53,147
$ 91,800
$
8,813
GL account
110
410
414
418
280
Accounts Receivable
by Customer
Posted daily
Purchases Journal – records credit purchases
Credit Purchases Journal
P1
Accounts
Hardware
Ligh ng
Plumbing
GST
Date
Invoice #
Creditor
Ref
Payable
Purchases Purchases Purchases
Recv
Credit
Debit
Debit
Debit
Debit
2017
Sept 1
B253
Be er and Sons
AP6
$ 60,000
$ 57,000
$ 3,000
Sept 5
2008
Northward Suppliers AP2
160,000
$ 152,000
8,000
Sept 6
15043
Ligh ng Always
AP4
18,000
$ 17,100
900
Sept 7
RC18
VeriSure Mfg
AP1
24,000
22,800
1,200
Sept 8
1102
Pearl Ligh ng
AP3
5,000
2,000
2,750
250
Sept 11
EF-1603
Arnold Consolidated
AP5
1,600
1,520
80
Totals
$268,600
$ 154,000
$ 19,850
$ 81,320
$13,430
GL account
210
510
514
518
180
Supplier Invoices
Accounts Payable
by Creditor
Cash Receipts Journal – records all cash receipts
Cash Receipts Journal
CR1
Sales
Accounts
Cash
GST
Date
Billing #
Customer
Ref
Cash
Discount Receivable
Sales
Payable
Debit
Debit
Credit
Credit
Credit
2017
Sept 1
17001
Hardy
AR5
$12,000
$
120
$
12,120
Sept 6
CS1
Cash sale
CS1
1,500
$1,425 $
75
Sept 8
17003
Bergeron
AR4
2,000
2,000
Sept 11
17004
Douglas
AR3
20,000
20,000
Sept 12
17005
Cash sale
CS2
3,250
3,088
163
Sept 13
17006
White
AR2
5,000
5,000
Totals
$43,750 $
120
$
39,120
$4,513
$
238
GL account
102
402
110
410
280
Cash Receipts
GENERAL LEDGER
CASH # 101
Date
Account/Explana on
PR
Debit
Credit
Balance
Sept 1, 2017
Opening balance
150,000
Cash Receipts Journal . . . . . .
CR1
43,750
Cash Distb. Journal . . . . . . .
CD1
62,575
General Journal . . . . . . . . . .
GJ1
25
131,150
ACCOUNTS RECEIVABLE # 110
Date
Account/Explana on
PR
Debit
Credit
Balance
Sept 1, 2017
Opening balance
216,000
Credit Sales Journal . . . . . . . .
S1
176,260
Cash Distb. Journal . . . . . . .
CD1
39,120
353,140
Cash Disbursements Journal –
records all cash disbursements
Cash Disbursements Journal
CD1
Purchase
Discount
Accounts
Other
Date
Chq #
Payee
Ref
Cash
(Inventory)
Payable
Disb…
Desc
Credit
Credit
Debit
Debit
2017
Sept 1
101
General Ligh ng Ltd. AP22
$14,775 $
225 $ 15,000
Sept 2
102
John Bremner
SAL1
1,600
$ 1,600
Salary exp.
Sept 11 103
Ligh ng Always
AP4
4,200
4,200
Sept 12 104
VeriSure Mfg
AP1
22,500
225
22,725
Sept 13 105
Receiver General
AP 14
14,000
14,000
GST Aug
Sept 14 106
City of Edmonton
AP18
5,500
5,500 Property Tax
Totals
$62,575 $
450 $ 41,925 $ 21,100
GL account
102
104
210
various
Cheque Book Stubs
or Register
General Journal – all other entries
General Journal
GJ1
Date
Account/Explana on
PR
Debit
Credit
Sept 30, 2017
Bank service charges expense . . . . .
520
25
Cash . . . . . . . . . . . . . . . . . . . . . . . . .
102
25
Bank reconcilia on for August
Sept 30, 2017
Deprecia on expense . . . . . . . . . . . .
530
3,500
Accumulated deprecia on . . . . .
118
3,500
Deprecia on for September
Totals
3,525
3,525
Bank Statements
emails, other docs
Posted
Monthly
Posted daily
2.5 The Accoun ng Cycle
LO5
–
Define
the
accoun ng
cycle.
In the preceding sec ons, the January transac ons of Big Dog Carworks
Corp. were used to demonstrate the steps performed to convert eco-
nomic data into financial informa on. This conversion was carried out in
accordance with the basic double-entry accoun ng model. These steps
are summarized in Figure
.
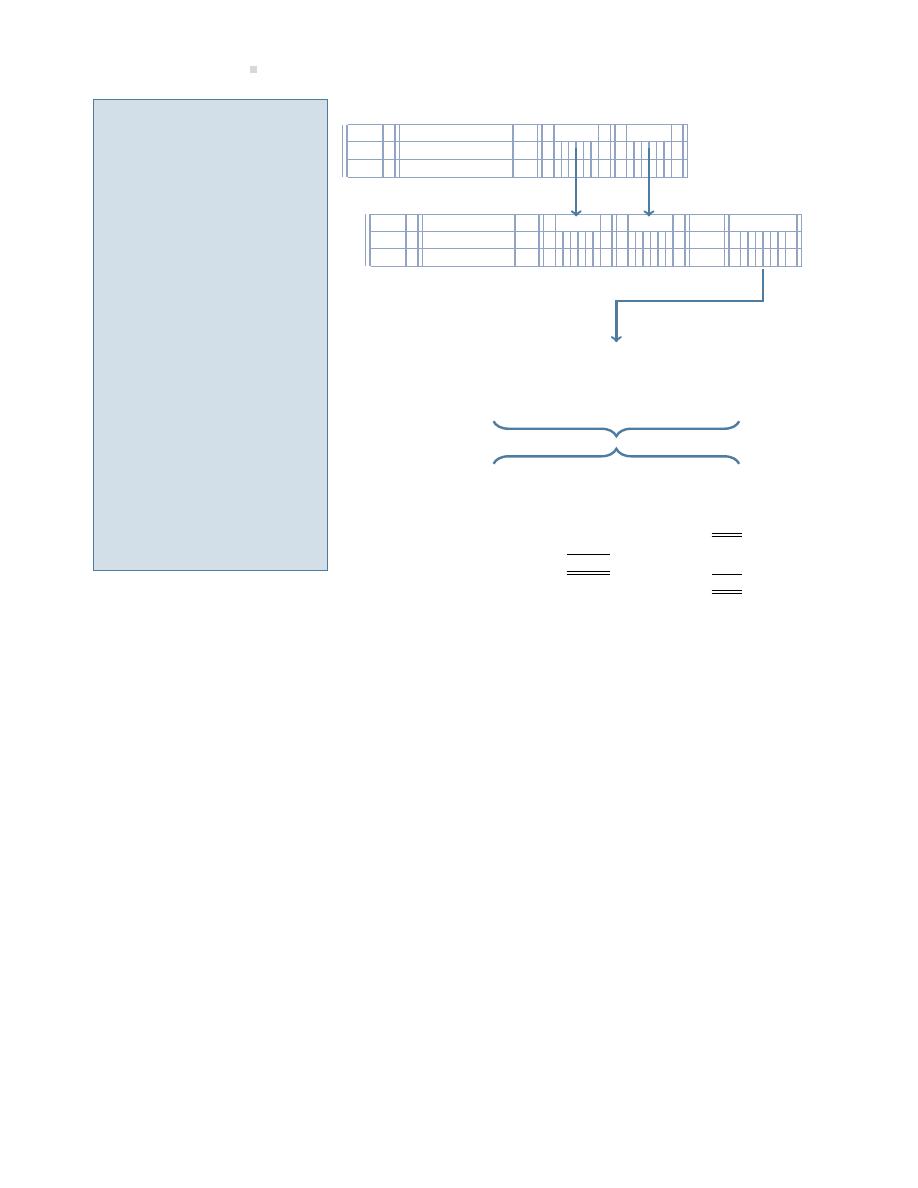
72
The Accoun ng Process
GENERAL JOURNAL
Page
Date
Descrip on
F
Debit
Credit
LEDGER ACCOUNT
Acct. No.
Date
Descrip on
F
Debit
Credit
DR/CR
Balance
TRIAL BALANCE
At…
Account Names
Account Balances
Debit Credit
Income Statement
Balance Sheet
For the…Ended…
At…
Revenue
$xxx
Assets
$xx
Expenses
xx
Liabili es
x
Net income
$ x
Equity
x
$xx
Step 1: Transac ons are ana-
lyzed and journalized.
Journalizing consists of analyzing
transac ons as they occur to see
how they affect the accoun ng
equa on. Then, the transac ons
are recorded chronologically in
the general journal.
Step 2: Transac ons are summa-
rized by account.
Pos ng consists of transferring
debits and credits from the gen-
eral journal to the appropriate
general ledger accounts.
Step 3: The equality of debits
and credits is proved.
A trial balance is prepared, list-
ing account numbers and names
along with account balances to
prove the equality of the debits
and credits.
Step 4: The summarized transac-
ons are communicated.
Preparing the financial state-
ments consists of using the bal-
ances listed in the columns of
the trial balance to prepare the
income statement, statement of
changes in equity, and balance
sheet.
Step 1
Step 2
Step 3
Step 4
Figure 2.9: Illustra ng the Steps in the Accoun ng Cycle
The sequence just described, beginning with the journalising of the transac ons and ending with
the communica on of financial informa on in financial statements, is commonly referred to as
the accoun ng cycle. There are addi onal steps involved in the accoun ng cycle and these will
be introduced in Chapter
Summary of Chapter 2 Learning Objec ves
LO1 – Describe asset, liability, and equity accounts, iden fying the effect of deb-
its and credits on each.
Assets are resources that have future economic benefits such as cash, receivables, prepaids, and
machinery. Increases in assets are recorded as debits and decreases as credits. Liabili es rep-
resent an obliga on to pay an asset in the future and include payables and unearned revenues.
Inrceases in liabili es are recorded as credits and decreases as debits. Equity represents the net
assets owned by the owners and includes share capital, dividends, revenues, and expenses. In-
creases in equity, caused by the issuance of shares and revenues, are recorded as credits, and

Discussion Ques ons
73
decreases in equity, caused by dividends and expenses, are recorded as debits. The following
summary can be used to show how debits and credits impact the types of accounts.
LO2 – Analyze transac ons using double-entry accoun ng.
Double-entry accoun ng requires that each transac on be recorded in at least two accounts where
the total debits always equal the total credits. The double-entry accoun ng rule is rooted in the
accoun ng equa on: Assets = Liabili es + Equity.
LO3 – Prepare a trial balance and explain its use.
To help prove the accoun ng equa on is in balance, a trial balance is prepared. The trial balance
is an internal document that lists all the account balances at a point in me. The total debits must
equal total credits on the trial balance. The trial balance is used in the prepara on of financial
statements.
LO4 – Record transac ons in a general journal and post in a general ledger.
The recording of financial transac ons was introduced in this chapter using T-accounts, an illustra-
ve tool. A business actually records transac ons in a general journal, a document which chrono-
logically lists each debit and credit journal entry. To summarize the debit and credit entries by
account, the entries in the general journal are posted (or transferred) to the general ledger. The
account balances in the general ledger are used to prepare the trial balance.
LO5 – Define the accoun ng cycle.
Analyzing transac ons, journalizing them in the general journal, pos ng from the general journal
into the general ledger, preparing the trial balance, and genera ng financial statements are steps
followed each accoun ng period. These steps form the core of the accoun ng cycle. Addi onal
steps involved in the accoun ng cycle will be introduced in Chapter
Discussion Ques ons
1. Why is the use of a transac ons worksheet imprac cal in actual prac ce?
2. What is an ‘account’? How are debits and credits used to record transac ons?
3. Some tend to associate “good” and “bad” or “increase” and “decrease” with credits and
debits. Is this a valid associa on? Explain.

74
The Accoun ng Process
4. The pa ern of recording increases as debits and decreases as credits is common to asset
and expense accounts. Provide an example.
5. The pa ern of recording increases and credits and decreases as debits is common to liabil-
i es, equity, and revenue accounts. Provide an example.
6. Summarise the rules for using debits and credits to record assets, expenses, liabili es, eq-
uity, and revenues.
7. What is a Trial Balance? Why is it prepared?
8. How is a Trial Balance used to prepare financial statements?
9. A General Journal is o en called a book of original entry. Why?
10. The posi oning of a debit-credit entry in the General Journal is similar in some respects to
instruc ons wri en in a computer program. Explain, using an example.
11. What is a General Ledger? Why is it prepared?
12. What is a Chart of Accounts? How are the accounts generally arranged and why?
13. List the steps in the accoun ng cycle.
Exercises
EXERCISE 2–1
(LO1)
Accounts
Below is a list of various accounts:
Exercises
75
a.
b.
Unearned consul ng fees
Vehicles
Prepaid insurance
Deprecia on expense
Office supplies
Interest income
Notes receivable
Interest expense
Insurance fee revenue
Furniture
Unearned insurance fee revenue
U li es payable
Salary and benefits expense
Unearned rent revenue
Small tools and supplies
Retained earnings
Service fees earned
Salaries and benefits payable
Service fees revenue
Compensa on expense
Notes payable
Interest earned
Buildings
Meals and mileage expense
Rent payable
Unearned service fees
Share capital
Equipment
Required:
a. Iden fy each account as either an asset (A), liability (L), equity (E), revenue (R), or expense
(E).
b. Iden fy whether the normal balance of each account is a debit (DR) or credit (CR).
EXERCISE 2–2
(LO1)
Accounts
Required: Using the list from EXERCISE
, iden fy if a debit or credit is needed to decrease the
normal balance of each account.
EXERCISE 2–3
(LO2)
Required: Record the debit and credit for each of the following transac ons (transac on 1 is done
for you):

76
The Accoun ng Process
Assets
Liabili es
Equity
Debit Credit
Debit Credit
Debit Credit
(increase) (decrease)
(decrease) (increase)
(decrease) (increase)
1. Purchased a $10,000 truck on credit.
10,000
10,000
2. Borrowed $5,000 cash from the bank.
3. Paid $2,000 of the bank loan in cash.
4. Paid $600 in advance for a one-year
insurance policy.
5. Received $500 in advance from a
renter for next month’s rental of
office space.
EXERCISE 2–4
(LO2)
Required: Record the debit and credit in the appropriate account for each of the following trans-
ac ons (transac on 1 is done for you):
Debit
Credit
1. Issued share capital for cash.
Cash Share Capital
2. Purchased equipment on credit.
3. Paid for a one-year insurance policy.
4. Billed a customer for repairs completed today.
5. Paid this month’s rent.
6. Collected the amount billed in transac on 4 above.
7. Collected cash for repairs completed today.
8. Paid for the equipment purchased in transac on 2 above.
9. Signed a union contract.
10. Collected cash for repairs to be made for customers next month.
11. Transferred this month’s por on of prepaid insurance that was
used to Insurance Expense.
EXERCISE 2–5
(LO2)
Using T-accounts
Below are various transac ons for the month of August, 2016, for BOLA Co. This is their first month
of opera ons.
1. Issued share capital in exchange for $3,000 cash.
2. Received an invoice from the u li es company for electricity in the amount of $200.
3. Bank approved a loan and deposited $10,000 into the company’s bank account.

Exercises
77
4. Paid employee salaries in the amount of $2,000.
5. Received repair services worth $5,000 from a supplier in exchange for a note due in thirty days.
6. Completed service work for a European customer. Invoiced $8,000 EURO (European funds).
The Canadian currency equivalent is $12,000 CAD. (hint: Recall the monetary unit principle.)
7. Completed $7,000 of service work for a customer on account.
8. Purchased $1,000 of equipment, paying cash.
9. Received $8,000 EURO ($12,000 CAD) cash for service work done regarding item (6).
10. Rent of $5,000 cash was paid for the current month’s rent.
11. Made a payment of $1,500 cash as a loan payment regarding item (3). The payment covered
$150 for interest expense and the balance of the cash payment was to reduce the loan balance
owing.
12. Reimbursed $25 in cash to an employee for use of his personal vehicle for company business
for a business trip earlier that day.
13. Received a cash of $5,000 regarding the service work for item (7).
14. Vehicle worth $30,000 purchased in exchange for $10,000 cash and $20,000 note due in six
months.
15. Paid the full amount of the u li es invoice regarding item (2).
16. Purchased $3,000 of furniture on account.
17. Completed $2,000 of service work for a customer and collected cash.
18. Received a cheque in the amount of $2,000 from a customer for service work to be done in
two months.
19. Purchased office supplies for $3,000 on account.
20. Completed a project for a customer and billed them $8,000 for the service work.
21. Purchased a laptop computer for $2,500 in exchange for a note payable.
22. September rent of $5,000 was paid two weeks in advance, on August 15.
Required: Create a separate T-account for each asset, liability, equity, revenue and expense ac-
count affected by the transac ons above. Record the various transac ons debits and credits into
the applicable T-account (similar to the two T-accounts shown in Sec on
, under the heading
T-accounts, for Cash and Accounts payable). Calculate and record the ending balance for each T-
account. (Hint: Include the reference to the transac on number for each item in the T-accounts,
to make it easier to review later, if the accounts contain any errors.)
78
The Accoun ng Process
EXERCISE 2–6
(LO3)
Preparing a Trial Balance
Required: Using the T-accounts prepared in EXERCISE
, prepare an August 31, 2016, trial bal-
ance for the company based on the balances in the T-accounts.
EXERCISE 2–7
(LO3)
Preparing Financial Statements
Required: Using the trial balance in EXERCISE
, prepare the August 31, 2016, income state-
ment, statement of changes in equity and the balance sheet for the company based on the bal-
ances in the T-accounts.
EXERCISE 2–8
(LO2)
Required: Post the following transac ons to the appropriate accounts:
(1) Issued share capital for $5,000 cash (posted as an example).
(2) Paid $900 in advance for three months’ rent, $300 for each month.
(3) Billed $1,500 to customers for repairs completed today.
(4) Purchased on credit $2,000 of supplies to be used next month.
(5) Borrowed $7,500 from the bank.
(6) Collected $500 for the amount billed in transac on (3).
(7) Received a $200 bill for electricity used to date (the bill will be paid next month).
(8) Repaid $2,500 of the bank loan.
(9) Used $800 of the supplies purchased in transac on (4).
(10) Paid $2,000 for the supplies purchased in transac on (4).
(11) Recorded the use of one month of the rent paid for in transac on (2).

Exercises
79
Cash
Bank Loan
Share Capital
Repair Revenue
(1)
5,000
(1)
5,000
Accounts Receivable
Accounts Payable
Electricity Expense
Prepaid Expense
Rent Expense
Unused Supplies
Supplies Expense
EXERCISE 2–9
(LO3)
The following Trial Balance was prepared from the books of Cross Corpora on at its year-end,
December 31, 2015. A er the company’s bookkeeper le , the office staff was unable to balance
the accounts or place them in their proper order. Individual account balances are correct, but
debits may be incorrectly recorded as credits and vice-versa.
Account Title
Account Balances
Debits
Credits
Cash
$120,400
Commissions Earned
5,000
Share Capital
$170,000
Accounts Payable
30,000
Insurance Expense
100
Land
8,000
Building
120,000
Rent Expense
1,000
Accounts Receivable
26,000
Unused Supplies
6,000
Supplies Expense
300
Loan Payable
80,000
Salaries Expense
3,000
Telephone Expense
200
Totals
$161,700
$408,300
80
The Accoun ng Process
Required: Prepare a corrected Trial Balance showing the accounts in proper order and balances in
the correct column. List expenses in alphabe cal order. Total the columns and ensure total debits
equal total credits.
EXERCISE 2–10
(LO4)
Required: Prepare journal entries for each of the following transac ons:
(a) Issued share capital for $3,000 cash.
(b) Purchased $2,000 of equipment on credit.
(c) Paid $400 cash for this month’s rent.
(d) Purchased on credit $4,000 of supplies to be used next month.
(e) Billed $2,500 to customers for repairs made to date.
(f) Paid cash for one-half of the amount owing in transac on (d).
(g) Collected $500 of the amount billed in transac on (e).
(h) Sold one-half of the equipment purchased in transac on 2 above for $1,000 in cash.
EXERCISE 2–11
(LO2,4)
Required: Prepare the journal entries and likely descrip ons of the eleven transac ons that were
posted to the following General Ledger accounts for the month ended January 31, 2015. Do not
include amounts. For instance, the first entry would be:
General Journal
Date
Account/Explana on
PR
Debit
Credit
Cash . . . . . . . . . . . . . . . . . . . . . . . . . . . . . . . . . .
XX
Share Capital . . . . . . . . . . . . . . . . . . . . . . .
XX
(1) To record issuance of share capital
Exercises
81
Cash
Bank Loan
Share Capital
Repair Revenue
1
2
11
1
3
3
5
4
8
10
11
Accounts Receivable
Accounts Payable
Electricity Expense
4
10
2
9
6
7
Prepaid Expense
Rent Expense
5
9
7
Unused Supplies
Supplies Expense
2
8
6
EXERCISE 2–12
(LO2,3,4)
The following journal entries were prepared for Elgert Corpora on for its first month of opera on,
January 2015.
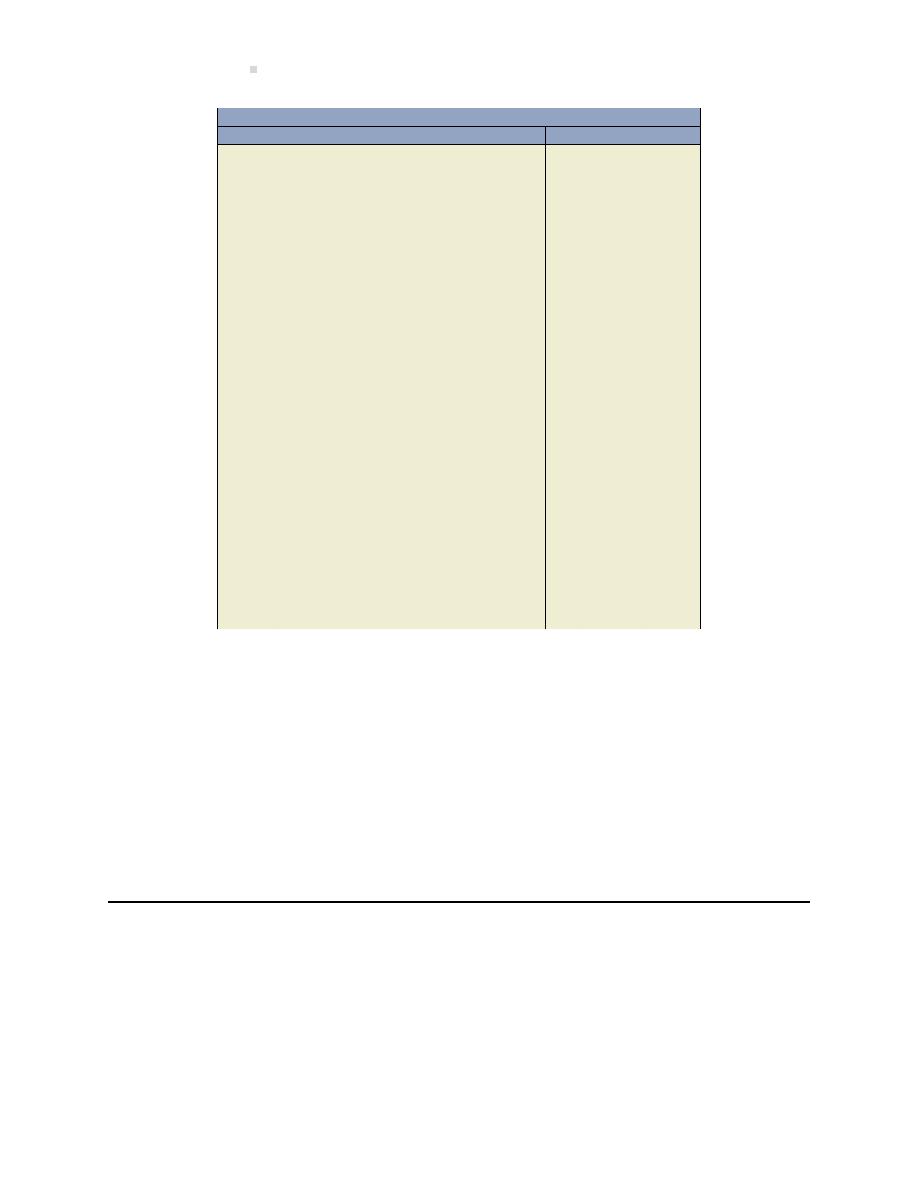
82
The Accoun ng Process
General Journal
Date
Account/Explana on
PR
Debit
Credit
Jan. 1
Cash . . . . . . . . . . . . . . . . . . . . . . . . . . . . . . . . . .
10,000
Share Capital . . . . . . . . . . . . . . . . . . . . . . .
10,000
To record the issuance of shares.
5
Rent Expense . . . . . . . . . . . . . . . . . . . . . . . . . .
200
Cash . . . . . . . . . . . . . . . . . . . . . . . . . . . . . . .
200
To record the payment of rent for the
month.
9
Unused Supplies . . . . . . . . . . . . . . . . . . . . . . .
4,000
Cash . . . . . . . . . . . . . . . . . . . . . . . . . . . . . . .
4,000
To record the purchase of supplies.
11
Cash . . . . . . . . . . . . . . . . . . . . . . . . . . . . . . . . . .
1,300
Service Revenue . . . . . . . . . . . . . . . . . . . .
1,300
To record service revenue earned.
28
Truck Opera on Expense . . . . . . . . . . . . . . .
450
Accounts Payable . . . . . . . . . . . . . . . . . . .
450
To record truck repairs.
30
Salaries Expense . . . . . . . . . . . . . . . . . . . . . . .
1,800
Cash . . . . . . . . . . . . . . . . . . . . . . . . . . . . . . .
1,800
To record payment of salaries for the
month.
31
Accounts Receivable . . . . . . . . . . . . . . . . . . .
1,600
Service Revenue . . . . . . . . . . . . . . . . . . . .
1,600
To record service revenue earned during
the month.
31
Supplies Expense . . . . . . . . . . . . . . . . . . . . . .
200
Unused Supplies . . . . . . . . . . . . . . . . . . . .
200
To record supplies used during the month.
Required:
a. Prepare necessary General Ledger T-accounts and post the transac ons.
b. Prepare a Trial Balance at January 31, 2015.
c. Prepare an Income Statement and Statement of Changes in Equity for the month ended
January 31, 2015 and a Balance Sheet at January 31, 2015.
EXERCISE 2–13
(LO4)
Correc ng Errors in Journal Entries
Below are transac ons that contain errors in the journal entry.
1. Received an invoice from a supplier for adver sing in the amount of $150.
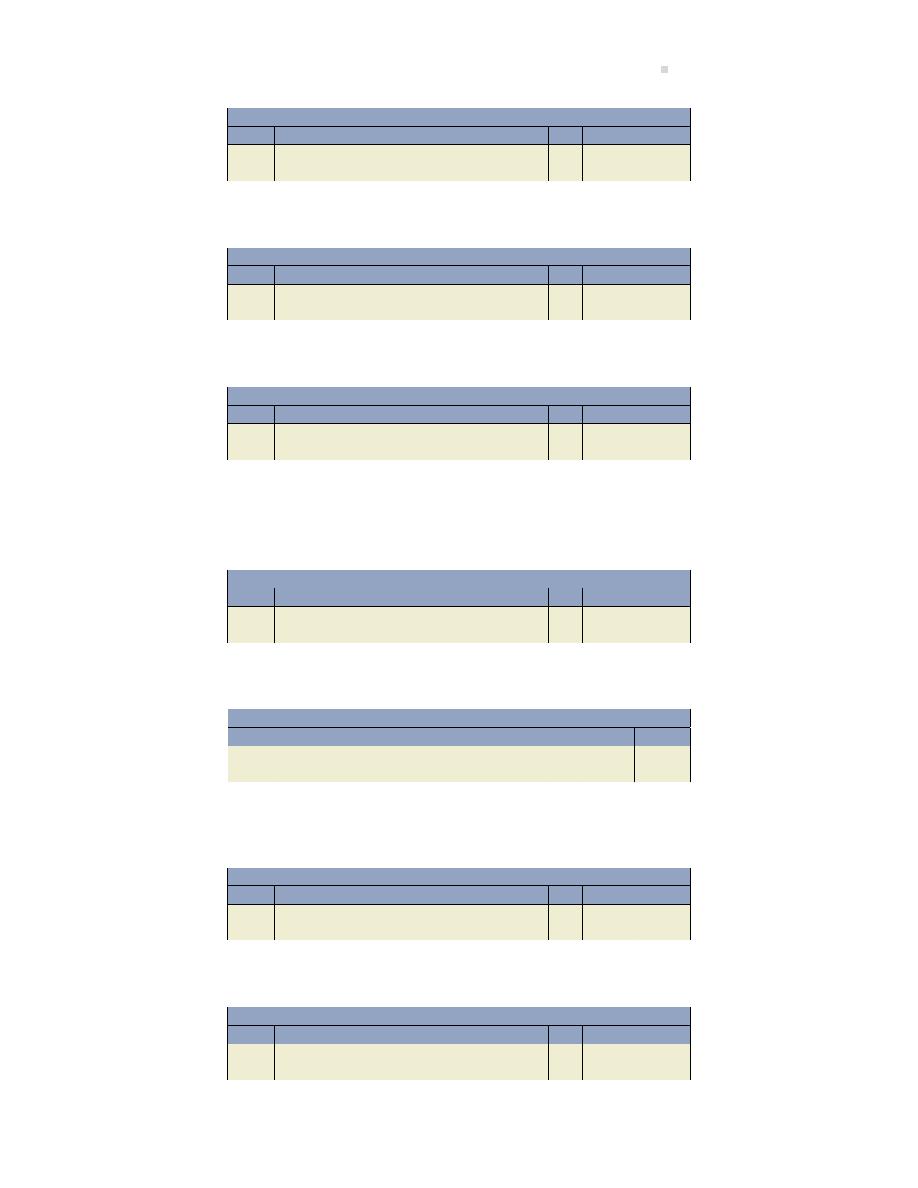
Exercises
83
General Journal
Date
Account/Explana on
PR
Debit
Credit
Adver sing expense . . . . . . . . . . . . . . . . . . . .
1,500
Cash . . . . . . . . . . . . . . . . . . . . . . . . . . . . . . .
1,500
2. Paid employee salaries in the amount of $2,200.
General Journal
Date
Account/Explana on
PR
Debit
Credit
Cash . . . . . . . . . . . . . . . . . . . . . . . . . . . . . . . . . .
2,200
Salaries expense . . . . . . . . . . . . . . . . . . . .
2,200
3. Received repair services worth $1,500 from a supplier in exchange for a note due in sixty days.
General Journal
Date
Account/Explana on
PR
Debit
Credit
Prepaid repairs . . . . . . . . . . . . . . . . . . . . . . . .
1,500
Note payable . . . . . . . . . . . . . . . . . . . . . . .
1,500
4. Completed service work for a Bri sh customer. Invoiced $5,000 GBP (Bri sh pounds Sterling
funds). The Canadian currency equivalent is $8,400 CAD. (Hint: Recall the monetary unit prin-
ciple.)
General Journal
Date
Account/Explana on
PR
Debit
Credit
Accounts receivable . . . . . . . . . . . . . . . . . . . .
5,000
Revenue . . . . . . . . . . . . . . . . . . . . . . . . . . .
5,000
5. Rent of $5,000 cash was paid for the current month’s rent.
General Journal
Date
Account/Explana on
PR
Debit
Credit
Cash . . . . . . . . . . . . . . . . . . . . . . . . . . . . . . . . . .
500
Rent expense . . . . . . . . . . . . . . . . . . . . . . .
500
6. Received a cheque in the amount of $4,000 from a customer for service work to be started in
three months.
General Journal
Date
Account/Explana on
PR
Debit
Credit
Cash . . . . . . . . . . . . . . . . . . . . . . . . . . . . . . . . . .
4,000
Revenue . . . . . . . . . . . . . . . . . . . . . . . . . . .
4,000
7. Completed a project for a customer and billed them $8,000 for the service work.
General Journal
Date
Account/Explana on
PR
Debit
Credit
Accounts payable . . . . . . . . . . . . . . . . . . . . . .
8,000
Revenue . . . . . . . . . . . . . . . . . . . . . . . . . . .
8,000

84
The Accoun ng Process
8. Rent of $10,000 for the next six months was paid in advance.
General Journal
Date
Account/Explana on
PR
Debit
Credit
Rent expense . . . . . . . . . . . . . . . . . . . . . . . . . .
10,000
Cash . . . . . . . . . . . . . . . . . . . . . . . . . . . . . . .
10,000
Required: Record the correc ng journal entries. (Hint: One method is to reverse the incorrect
entry and record the correct entry and a second method is to record the correc ng amounts to
the applicable accounts only.)

Problems
85
Problems
PROBLEM 2–1
(LO3)
The following account balances are taken from the records of Fox Creek Service Limited at October
31, 2015 a er its first year of opera on:
Accounts Payable
$9,000
Insurance Expense
$ 500
Accounts Receivable
6,000
Repair Revenue
19,000
Adver sing Expense
2,200
Supplies Expense
800
Bank Loan
5,000
Telephone Expense
250
Cash
1,000
Truck
9,000
Share Capital
2,000
Truck Opera on
Commissions Expense
4,500
Expense
1,250
Equipment
7,000
Wages Expense
4,000
Wages Payable
1,500
Required:
1. Prepare a Trial Balance at October 31, 2015.
2. Prepare an Income Statement and Statement of Changes in Equity for the year ended Octo-
ber 31, 2015.
3. Prepare a Balance Sheet at October 31, 2015.
PROBLEM 2–2
(LO1,2,3,4)
The following ledger accounts were prepared for Davidson Tool Rentals Corpora on during the
first month of opera on ending May 31, 2015. No journal entries were prepared in support of the
amounts recorded in the ledger accounts.

86
The
Acc
oun
ng
Pr
ocess
Cash
101
Accounts Payable
210
Share Capital
320
Service Revenue
470
May 1 5,000 May 11 1,000
May 22 600 May 11 1,000
May 1 5,000
May 5 3,000
6 2,000
16
500
23
150
6 2,000
10 1,500
20
300
24
1,100
18 2,500
15 1,200
22
600
21
800
28
400
Adver sing Expense
610
29 3,500
May 31
250
Accounts Receivable
110
Commissions Expense
615
May 5 3,000 May 10 1,500
May 24 1,100
18 2,500
15 1,200
Rent Expense
654
Prepaid Adver sing
160
May 28
400
May 16
500 May 31
250
Salaries Expense
656
Unused Supplies
173
May 29 3,500
May 20
300 May 30
100
Supplies Expense
668
Equipment
183
May 30
100
May 11 2,000 May 21
800
Telephone Expense
669
May 23
150
Required:
1. Reconstruct the transac ons that occurred during the month and prepare journal entries to record these transac ons, including
appropriate descrip ons. Include accounts numbers (Folio) using the Chart of Accounts provided. Calculate the balance in each
account.
2. Total the transac ons in each T-account above. Prepare a Trial Balance in proper order (list assets, liabili es, equity, revenue,
then expenses) at May 31, 2015.

Problems
87
PROBLEM 2–3
(LO1,2,4)
The following balances appeared in the General Ledger of Fenton Table Rentals Corpora on at
April 1, 2015.
Cash
$1,400
Accounts Payable
$2,000
Accounts Receivable
3,600
Share Capital
4,350
Prepaid Rent
1,000
Unused Supplies
350
The following transac ons occurred during April:
(a) Collected $2,000 cash owed by a customer.
(b) Billed $3,000 to customers for tables rented to date.
(c) Paid the following expenses: adver sing, $300; salaries, $2,000; telephone, $100.
(d) Paid half of the accounts payable owing at April 1.
(e) Received a $500 bill for April truck repair expenses.
(f) Collected $2,500 owed by a customer.
(g) Billed $1,500 to customers for tables rented to date.
(h) Transferred $500 of prepaid rent to rent expense.
(i) Counted $200 of supplies on hand at April 30; recorded the amount used as an expense.
Required: Prepare journal entries to record the April transac ons.
PROBLEM 2–4
(LO1,2,4)
The following transac ons occurred in Thorn Accoun ng Services Inc. during August 2015, its first
month of opera on.

88
The Accoun ng Process
Aug. 1
Issued share capital for $3,000 cash.
1 Borrowed $10,000 cash from the bank.
1 Paid $8,000 cash for a used truck.
4 Paid $600 for a one-year truck insurance policy effec ve August 1.
5 Collected $2,000 fees in cash from a client for work performed today
(recorded as Fees Earned).
7 Billed $5,000 fees to clients for services performed to date (recorded as
Fees Earned).
9 Paid $250 for supplies used to date.
12 Purchased $500 of supplies on credit (recorded as Unused Supplies).
15 Collected $1,000 of the amount billed on August 7.
16 Paid $200 for adver sing in The News during the first two weeks of August.
20 Paid half of the amount owing for the supplies purchased on August 12.
25 Paid cash for the following expenses: rent for August, $350; salaries,
$2,150; telephone, $50; truck repairs, $250.
28 Called clients for payment of the balance owing from August 7.
29 Billed $6,000 of fees to clients for services performed to date
(recorded as Fees Earned).
31 Transferred the amount of August’s truck insurance ($50) to
Insurance Expense.
31 Counted $100 of supplies s ll on hand (recorded the amount used
as Supplies Expense).
Required: Prepare journal entries to record the August transac ons.
PROBLEM 2–5
(LO4)
Challenge Ques on – Errors in the Trial Balance
Below is the trial balance for Cushio Corp. which contains a number of errors:

Problems
89
Cushio Corp.
Trial Balance
At August 31, 2016
Incorrect
Debit
Credit
Cash
$102,000
Accounts receivable
59,730
Prepaid expenses
2,000
Office supplies inventory
5,500
Equipment
115,000
Accounts payable
$ 74,500
Unearned revenue
50,000
Share capital
25,000
Retained earnings
50,500
Revenue
245,000
Repairs expense
1,000
Rent expense
25,000
Adver sing expense
24,500
Salaries expense
115,000
$449,730
$445,000
The following errors were discovered:
1. Cushio collected $5,000 from a customer and posted a debit to Cash but did not post a credit
entry to accounts receivable.
2. Cushio completed service work for a customer for $5,000 and debited accounts receivable
but credited unearned revenue.
3. Cushio received cash of $583 from a customer as payment on account and debited cash for
$583, but incorrectly credited accounts receivable for $853.
4. Cushio did not post an invoice of $500 received for repairs.
5. Cushio purchased equipment for $5,000 on account and posted the transac on as a debit
to accounts payable and a credit to equipment.
6. Cushio purchased adver sing services for cash of $6,000 that will be published in the news-
papers over the next six months. This transac on was posted as a debit to adver sing ex-
pense and a credit to cash for $6,000.
Required: Prepare a corrected trial balance. (Hint: Using T-accounts would be helpful.)

90
The Accoun ng Process
PROBLEM 2–6
(LO4)
Challenge Ques on – Transac ons, Trial Balance, and Financial State-
ments
Stellar Services Ltd. is an engineering firm that provides electrical engineering consul ng services
to various clients. Below are the account balances in its General Ledger as at December 31, 2015
which is its first month of opera ons. All accounts have normal balances as explained in the text.
Stellar Services Ltd.
Trial Balance
At December 31, 2015
Accounts payable
$115,000
Accounts receivable
85,000
Cash
150,000
Building/warehouse
–
Equipment
45,000
Furniture
15,000
Land
–
Notes payable
20,000
Office equipment
–
Office supplies
7,000
Prepaid expenses
–
Repairs expense
500
Retained earnings
90,000
Salaries expense
32,000
Service revenue
25,000
Share capital
108,000
Unearned service revenue
–
U li es expense
4,500
Vehicle
19,000
Listed below are ac vi es for Stellar Services Ltd. for the month of January, 2016:
a. Stellar ordered $3,500 in new so ware from a so ware supplier. It will be paid when it is ready
to install in three weeks.
b. Paid $12,000 for a two-year insurance policy to begin February 1, 2016.
c. Paid one half of the outstanding accounts payable.
d. Hired a new employee who will start up February 1, 2016. His salary will be $2,500 every two
weeks.

Problems
91
e. Received cash of $200,000 from a client for a $1,000,000 consul ng contract. Work will com-
mence in April.
f. Booked a conference room at a hotel for a presenta on to poten al customers scheduled for
February 15. The $600 rental fee will be paid February 1.
g. Met with a client’s lawyer about a fire that destroyed a por on of the client’s building. The
client is planning to sue Stellar for $300,000 based on some previous consul ng services Stellar
provided to the client.
h. Completed four electrical inspec ons today on credit for $3,000 each.
i. Collected from two of the credit customers from item 8.
j. Received $20,000 from a client in par al payment for services to be provided next year.
k. Borrowed $150,000 from their bank by signing a note payable due on August 31, 2017.
l. John Stellar invested $30,000 cash and engineering equipment with a fair value of $10,000 in
exchange for capital shares.
m. Stellar rented some addi onal office space and paid $18,000 for the next six month’s rent.
n. Purchased land and a small warehouse for $50,000 cash and a long-term note payable for the
balance. The land was valued at $250,000 and the warehouse at $60,000.
o. Signed an agreement with a supplier for equipment rental for a special project to begin on
February 23, 2016. A deposit for $300 is to be paid on February 1.
p. Completed $30,000 of services for a client which is payable in 30 days.
q. Purchased $8,000 of equipment for $5,000 cash and a trade-in of some old equipment that
originally was recorded at $3,000.
r. Paid $1,000 in cash dividends.
s. Refunded the client $2,000 due to a complaint about the consul ng services provided in item
16.
t. Paid salaries of $35,000.
u. Received a bill for water and electricity in the amount of $1,800 for January, which will be paid
on February 15.
v. Purchased some office equipment for $5,000 and office supplies for $2,000 on account.
w. Placed an order with a supplier for $10,000 of dra ing supplies to be delivered February 10.
This must be paid by February 25.
Required:

92
The Accoun ng Process
1. Prepare all required journal entries for January.
2. Prepare the income statement, the statement of changes in equity and the balance sheet
as at January 31, 2016. (Hint: Using T-accounts would be helpful.)
PROBLEM 2–7
(LO4)
Special Journals and Subledgers
The following are selected transac ons from December, 2017 for Readem & Weep Sad Books Co.
Ltd., who purchases and sells books for a profit.
Required: Complete the schedule based on the informa on in Sec on
, Special Journals and
Subledgers from this chapter. If a transac on has no applicable subledger, leave answer blank.
Journals
Sales
S
Purchases
P
Cash Receipts
CR
Cash Disbursements
CD
General Journal
GJ
Subledgers
Accounts Receivable
AR
Accounts Payable
AP
Merchandise Inventory
MI
Date
Transac on
Journal
Subledger
Dec 1
Issued shares to the company’s founder for cash
1
Issued a cheque for rent to the building owner
2
Purchased 100 books on credit from the publisher
4
Borrowed money from bank (i.e. a note payable)
5
Purchased office furniture on account
6
Return 5 books to the publisher due to missing pages
12
Sold 20 books to Fred’s Cigar Store on account (credit)
13
Paid cash for a two-year insurance policy effec ve immediately
15
Paid cash for some office supplies
19
Issued a cheque to the bank for the note payable interest
20
Hired an employee and paid her first week’s salary in cash
22
Sold 10 books for cash
27
Fred’s Cigar Store returned five of the books purchased earlier and the amount
owing was adjusted (accounts receivable)
27
Received cash from Fred’s Cigar Store for amount owing
28
Found an error in the accoun ng records and recorded a correc ng entry
29
Received cash from a customer for 100 books. 50% of the books will be sent im-
mediately and the remained to be sent in January
30
A cheque was issued for rent for January, 2018
30
Dividends were paid in cash to the company founder
PROBLEM 2–8
(LO4)
Special Journals and Subledgers
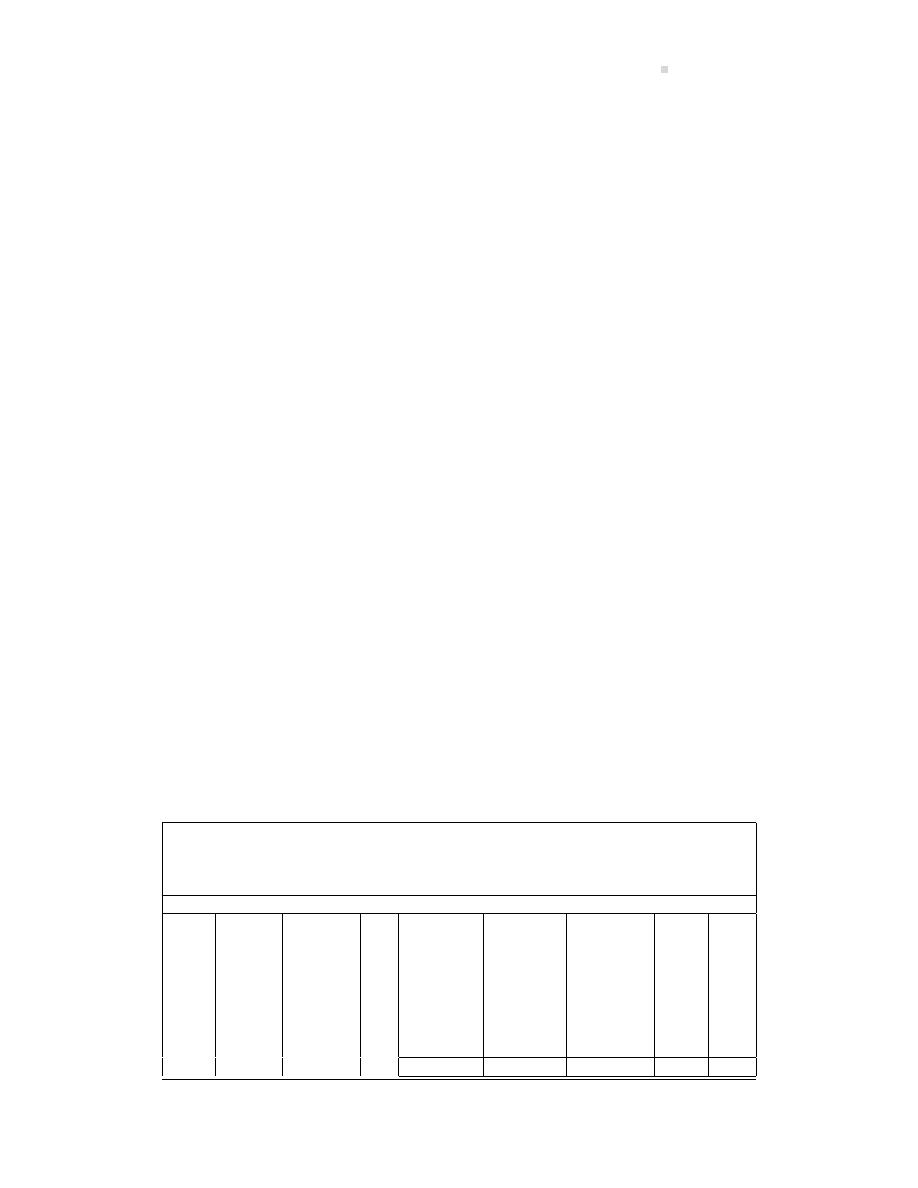
Problems
93
Listed below are transac ons for the first month of opera ons for Harmand Ltd., a consul ng
company who provides engineering consul ng services and also sells vintage model airplanes (cost
of goods sold ignored for simplicity).
June 1
Purchased equipment on credit from Bradley & Co., $12,000.
2
Billed consul ng services completed for Cooper Co., Invoice #17001 for $8,000.
3
Issued cheque #601 to LRS Proper es Ltd., for office rent for June, $3,500.
4
Purchased office supplies from Office Supplies Ltd., cheque #602 for $1,240.
6
Sold five vintage model airplanes to Mr. F. Sco on account, Invoice #17002 for $2,500 each.
7
Sold one vintage model airplane as a cash sale, $2,000.
8
Received cash from Cooper Co., for Invoice #17001 for $7,920. Cooper was en tled to an early payment
discount of $80 because they paid their account within 10 days of being billed.
9
Paid salary for one employee, cheque #603 for $1,400.
10
Received an invoice from the Daily Gaze e for adver sing, payable in 30 days; $1,200.
10
Paid 20% of the June 1 equipment purchase; cheque #604.
11
Received a cheque for $5,000 from Fort Robbins Bridge Builders Ltd., for consul ng work that will begin
July 1;
14
Borrowed $10,000 from the bank as a loan.
18
Issued a receipt for $5,000 for cash payment from F. Sco as a par al payment of their account.
22
Issued 500 addi onal shares to owner and shareholder for $5,000 cash.
23
Paid u li es bill from last month to HTC Power Corp., cheque #605 for $350.
25
Billed $35,000 of consul ng services rendered to Boyzee Villages Corp. Invoice #17003.
28
Paid Daily Gaze e amount owing early and received a discount of $12, reducing payment to $1,188,
cheque #606.
29
Paid $200 in dividends to Bill Sloan, owner and sole shareholder, cheque #607.
30
Paid $1,000 to pay the interest owing to date of $30 (interest expense) and reduce the bank loan for the
balance, cheque #608.
30
Paid salary for employee up to date, cheque #609 for $1,600.
30
Corrected an error in the payment to the bank. Interest expense should be $35 and $965 to reduce the
bank loan.
Required:
1. Prepare a sales journal, purchases journal, cash receipts journal, cash disbursements jour-
nal, and general journal as shown below. Record the June transac ons into these journals.
(Ignore GST and account codes for simplicity.)
Credit Sales Journal
S1
Consul ng
Vintage
Accounts
Services
Model
Date
Billing #
Customer
Ref
Receivable
Revenue
Plane Sales
Other
Desc
Debit
Credit
Credit
Totals
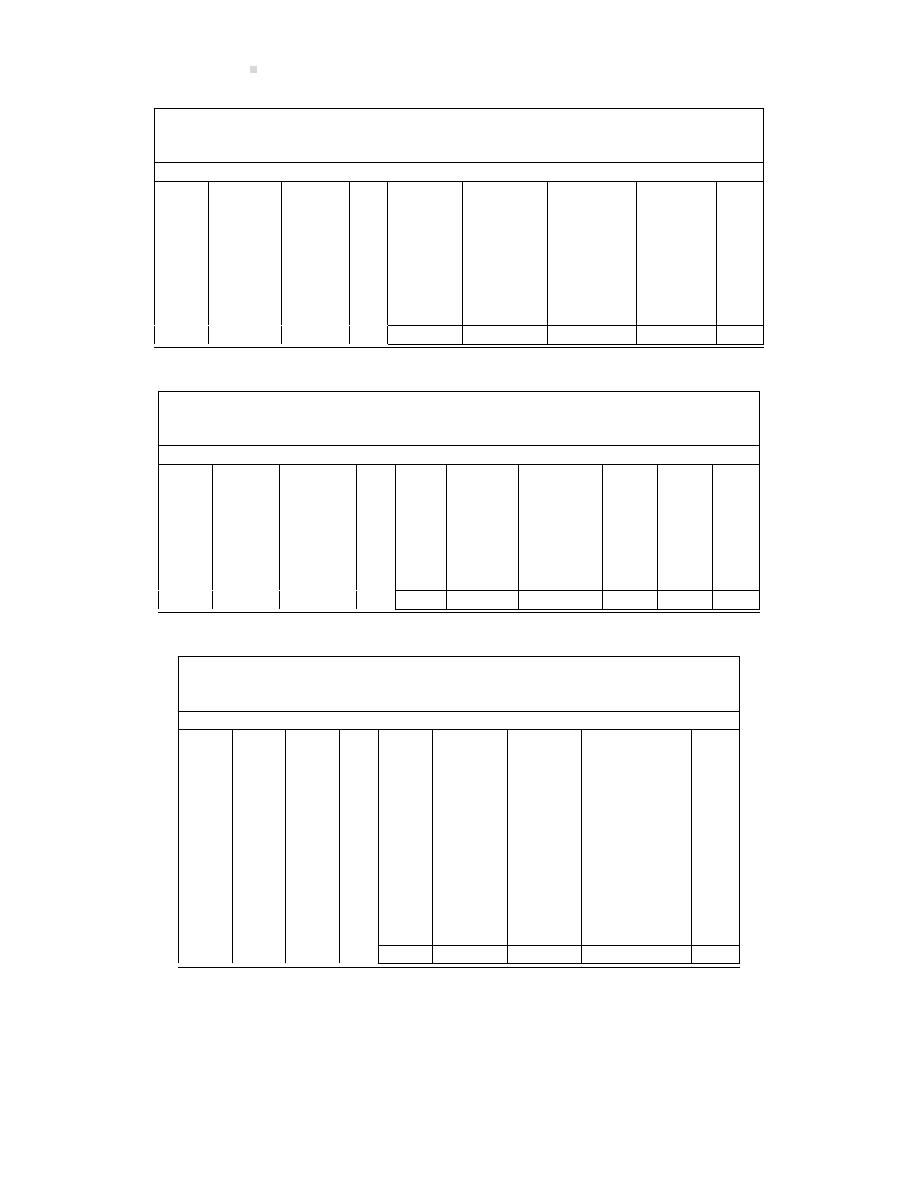
94
The Accoun ng Process
Credit Purchases Journal
P1
Accounts
Equipment
Adver sing
Other
Date
Invoice #
Creditor
Ref
Payable
Purchases
Expense
Purchases
Desc
Credit
Debit
Debit
Debit
Totals
Cash Receipts Journal
CR1
Sales
Accounts
Cash
Date
Billing #
Customer
Ref
Cash
Discount
Receivable
Sales
Other
Desc
Debit
Debit
Credit
Credit
Credit
Totals
Cash Disbursements Journal
CD1
Purchase
Accounts
Other
Date
Chq #
Payee
Ref
Cash
Discount
Payable
Disbursements
Desc
Credit
Credit
Debit
Debit
Totals
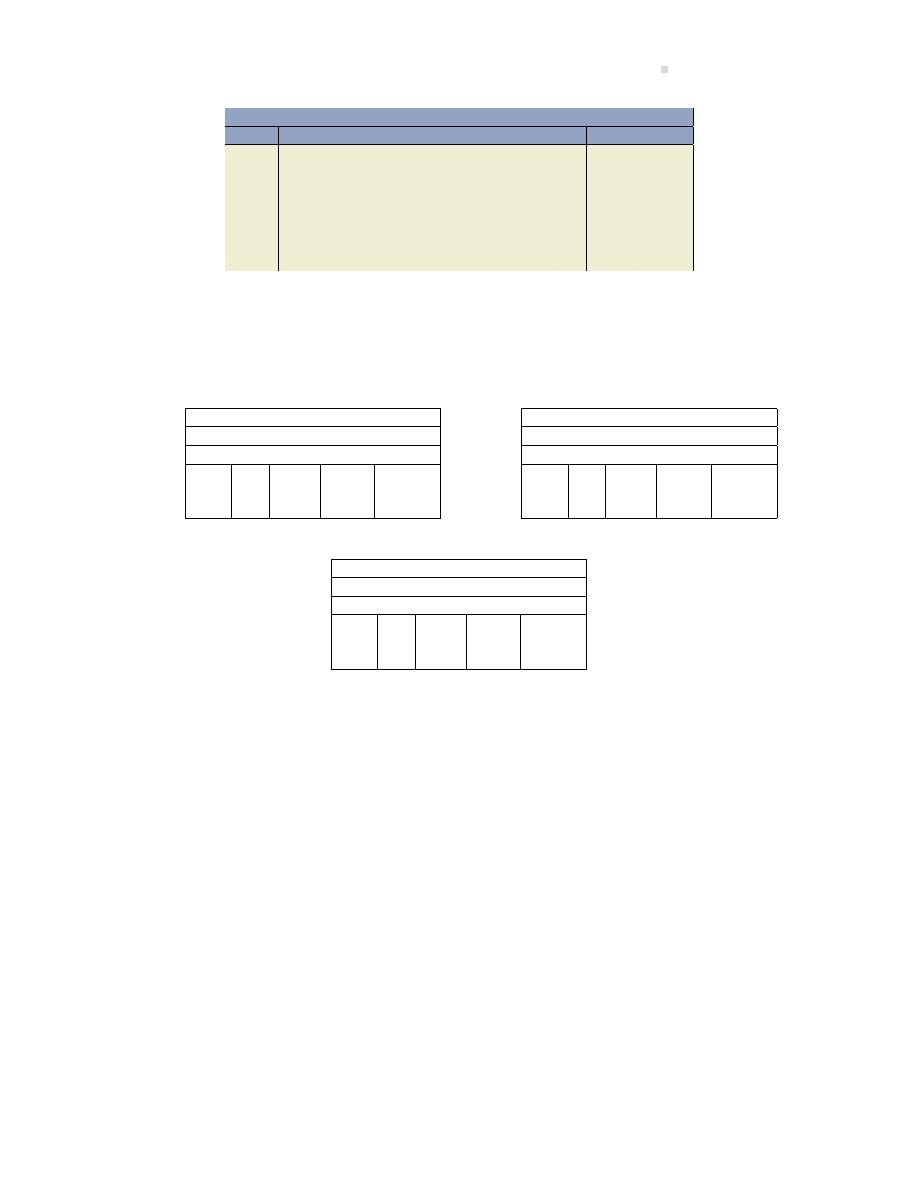
Problems
95
General Journal
GJ1
Date
Account/Explana on
PR
Debit
Credit
Totals
2. Prepare an accounts receivable subledger, accounts payable subledger, and a general ledger
as shown below. Post the journals from part 1 to the subledgers and general ledger as shown
in Sec on
of this chapter. You will need to create mul ple Accounts Receivable and
Accounts Payable subledgers, as well as general ledgers.
Accounts Receivable Subledger
Name:
Date
Ref
Debit
Credit
Balance
Accounts Payable Subledger
Name:
Date
Ref
Debit
Credit
Balance
General Ledger
Name:
Date
Ref
Debit
Credit
Balance
3. Prepare a trial balance from the general ledger accounts. Use the format shown in Sec-
on
of this chapter. Ensure that the trial balance debits equal the credits and that the
subledgers balance to their respec ve accounts receivable and accounts payable control
accounts.
4. Prepare an income statement, statement of changes in equity and a balance sheet as at June
30, 20XX. Use the format shown in Sec on
of this chapter.


Chapter 3
Financial Accoun ng and Adjus ng Entries
Chapters
and
described the recording and repor ng of economic transac ons in detail. How-
ever, the account balances used to prepare the financial statements in these previous chapters
did not necessarily reflect correct amounts. Chapter
introduces the concept of adjus ng entries
and how these sa sfy the matching principle, ensuring revenues and expenses are reported in
the correct accoun ng period. The prepara on of an adjusted trial balance is discussed, as well
as its use in comple ng financial statements. At the end of the accoun ng period, a er financial
statements have been prepared, it is necessary to close temporary accounts to retained earnings.
This process is introduced in this chapter, as is the prepara on of a post-closing trial balance. The
accoun ng cycle, the steps performed each accoun ng period that result in financial statements,
is also reviewed.
Chapter 3 Learning Objec ves
LO1 – Explain how the meliness, matching, and recogni on GAAP require the recording of
adjus ng entries.
LO2 – Explain the use of and prepare the adjus ng entries required for prepaid expenses,
deprecia on, unearned revenues, accrued revenues, and accrued expenses.
LO3 – Prepare an adjusted trial balance and explain its use.
LO4 – Use an adjusted trial balance to prepare financial statements.
LO5 – Iden fy and explain the steps in the accoun ng cycle.
LO6 – Explain the use of and prepare closing entries and a post-closing trial balance.
Concept Self-Check
Use the following as a self-check while working through Chapter
1. What is the GAAP principle of meliness?
2. What is the GAAP principle of matching?
3. What is the GAAP principle of revenue recogni on?
4. What are adjus ng entries and when are they journalized?
97

98
Financial Accoun ng and Adjus ng Entries
5. What are the five types of adjustments?
6. Why is an adjusted trial balance prepared?
7. How is the unadjusted trial balance different from the adjusted trial balance?
8. What are the four closing entries and why are they journalized?
9. Why is the Dividends account not closed to the income summary?
10. When is a post-closing trial balance prepared?
11. How is a post-closing trial balance different from an adjusted trial balance?
NOTE: The purpose of these ques ons is to prepare you for the concepts introduced in the chap-
ter. Your goal should be to answer each of these ques ons as you read through the chapter. If,
when you complete the chapter, you are unable to answer one or more the Concept Self-Check
ques ons, go back through the content to find the answer(s). Solu ons are not provided to these
ques ons.
3.1 The Opera ng Cycle
LO1
–
Explain
how the
meli-
ness,
matching,
and recogni on
GAAP
require
the
recording
of
adjus ng
entries.
Financial transac ons occur con nuously during an accoun ng period as
part of a sequence of opera ng ac vi es. For Big Dog Carworks Corp., this
sequence of opera ng ac vi es takes the following form:
1. Opera ons begin with some cash on hand.
2. Cash is used to purchase supplies and to pay expenses.
3. Revenue is earned as repair services are completed for customers.
4. Cash is collected from customers.
This cash-to-cash sequence of transac ons is commonly referred to as an
opera ng cycle and is illustrated in Figure
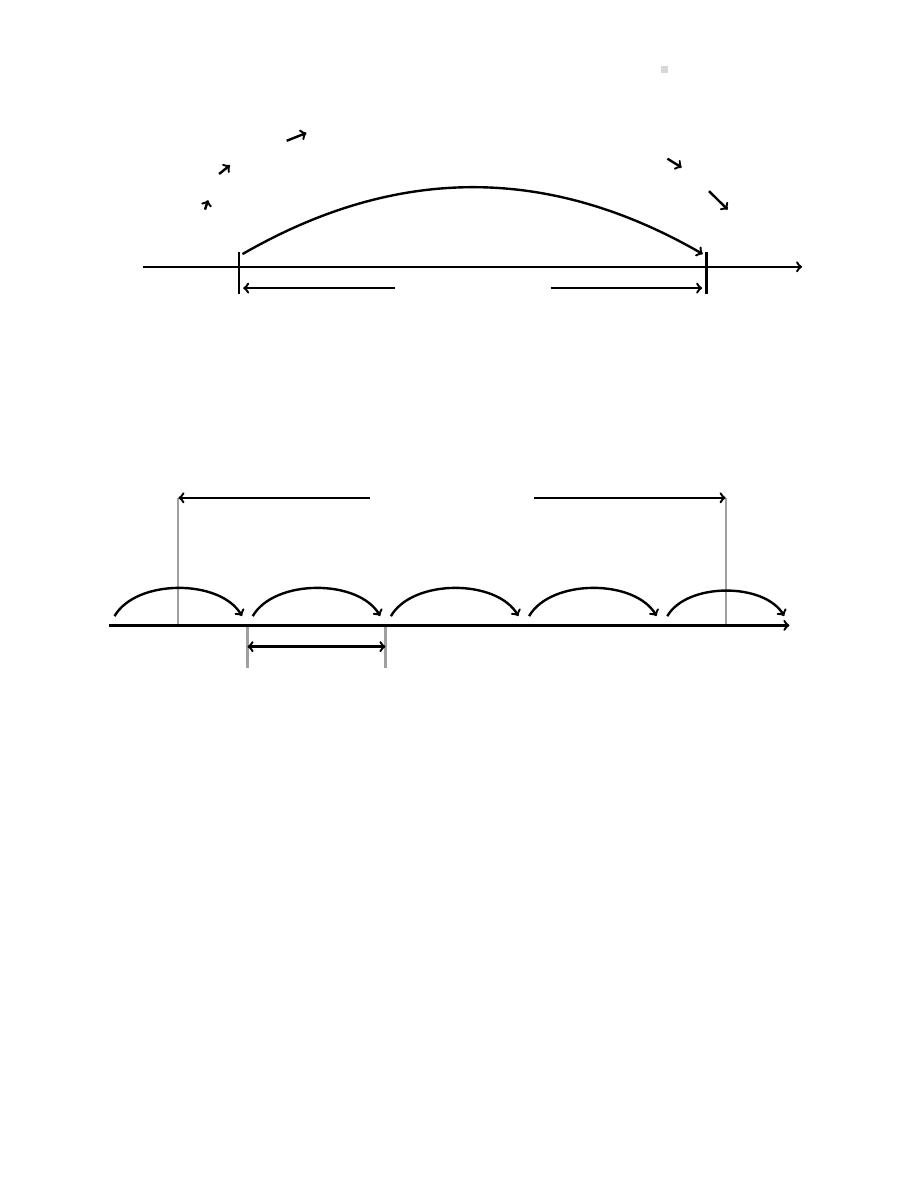
3.1. The Opera ng Cycle
99
Cash is
on hand.
Repair supplies are purchased.
Expenses are paid.
Cash payment to supplier is made.
Repair services are performed.
Accounts receivable result.
Cash is collected
from customer.
One Opera ng Cycle
Time
Figure 3.1: One Opera ng Cycle
Depending on the type of business, an opera ng cycle can vary in dura on from short, such as one
week (e.g., a grocery store) to much longer, such as one year (e.g., a car dealership). Therefore,
an annual accoun ng period could involve mul ple opera ng cycles as shown in Figure
.
One Accoun ng Period
Jan.1,
2015
Dec. 31,
2015
One
Opera ng
Cycle
Time
Figure 3.2: Opera ng Cycles Within an Annual Accoun ng Period
No ce that not all of the opera ng cycles in Figure
are completed within the accoun ng pe-
riod. Since financial statements are prepared at specific me intervals to meet the GAAP require-
ment of meliness, it is necessary to consider how to record and report transac ons related to
the accoun ng period’s incomplete opera ng cycles. Two GAAP requirements — recogni on and
matching — provide guidance in this area, and are the topic of the next sec ons.
Recogni on Principle in More Detail
GAAP provide guidance about when an economic ac vity should be recognized in financial state-
ments. An economic ac vity is recognized when it meets two criteria:
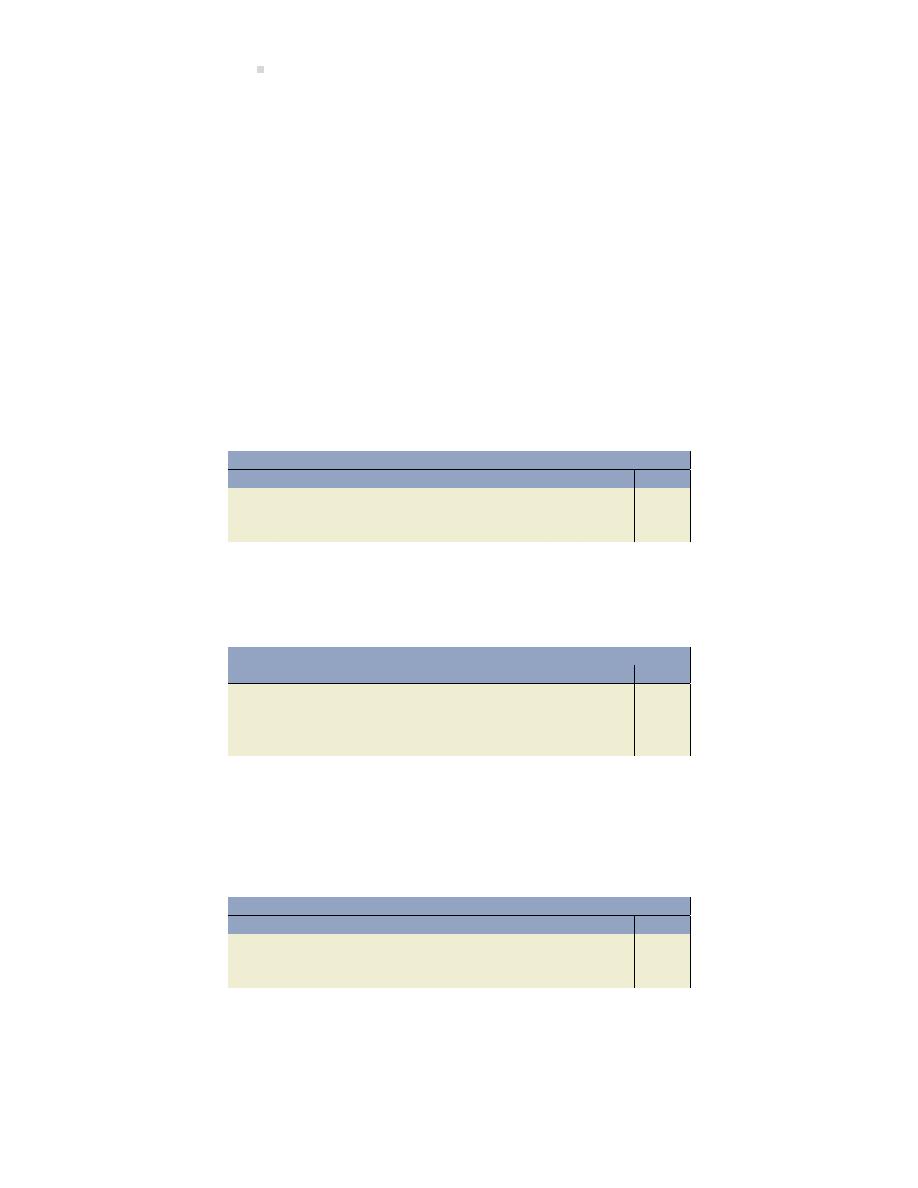
100
Financial Accoun ng and Adjus ng Entries
1. it is probable that any future economic benefit associated with the item will flow to the
business; and
2. it has a value that can be measured with reliability.
Revenue Recogni on Illustrated
Revenue recogni on is the process of recording revenue in the accoun ng period in which it was
earned; this is not necessarily when cash is received. Most corpora ons assume that revenue has
been earned at an objec vely-determined point in the accoun ng cycle. For instance, it is o en
convenient to recognize revenue at the point when a sales invoice has been sent to a customer
and the related goods have been received or services performed. This point can occur before
receipt of cash from a customer, crea ng an asset called Accounts Receivable and resul ng in the
following entry:
General Journal
Date
Account/Explana on
PR
Debit
Credit
Accounts Receivable . . . . . . . . . . . . . . . . . . .
XX
Revenue . . . . . . . . . . . . . . . . . . . . . . . . . . .
XX
To record revenue earned on account.
When cash payment is later received, the asset Accounts Receivable is exchanged for the asset
Cash and the following entry is made:
General Journal
Date
Account/Explana on
PR
Debit
Credit
Cash . . . . . . . . . . . . . . . . . . . . . . . . . . . . . . . . . .
XX
Accounts Receivable . . . . . . . . . . . . . . . .
XX
To record cash received from credit cus-
tomer.
Revenue is recognized in the first entry (the credit to revenue), prior to the receipt of cash. The
second entry has no effect on revenue.
When cash is received at the same me that revenue is recognized, the following entry is made:
General Journal
Date
Account/Explana on
PR
Debit
Credit
Cash . . . . . . . . . . . . . . . . . . . . . . . . . . . . . . . . . .
XX
Revenue . . . . . . . . . . . . . . . . . . . . . . . . . . .
XX
To record cash received from customer.
When a cash deposit or advance payment is obtained before revenue is earned, a liability called
Unearned Revenue is recorded as follows:
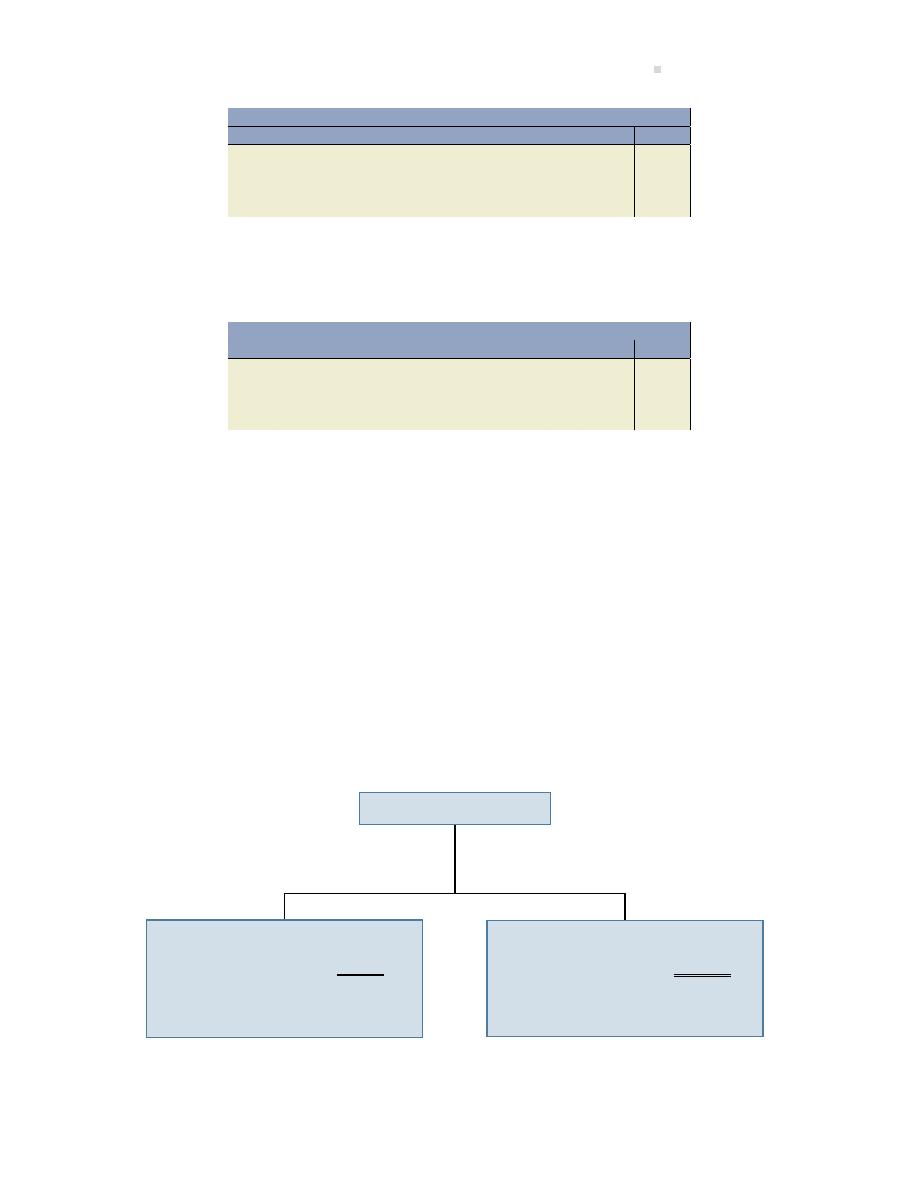
3.1. The Opera ng Cycle
101
General Journal
Date
Account/Explana on
PR
Debit
Credit
Cash . . . . . . . . . . . . . . . . . . . . . . . . . . . . . . . . . .
XX
Unearned Revenue . . . . . . . . . . . . . . . . .
XX
To record cash received from customer for
work to be done in the future.
Revenue is not recognized un l the services have been performed. At that me, the following
entry is made:
General Journal
Date
Account/Explana on
PR
Debit
Credit
Unearned Revenue . . . . . . . . . . . . . . . . . . . . .
XX
Revenue . . . . . . . . . . . . . . . . . . . . . . . . . . .
XX
To record the earned por on of Unearned
Revenue.
The preceding entry reduces the unearned revenue account by the amount of revenue earned.
The matching of revenue to a par cular me period, regardless of when cash is received, is an
example of accrual accoun ng. Accrual accoun ng is the process of recognizing revenues when
earned and expenses when incurred regardless of when cash is exchanged; it forms the basis of
GAAP. Recogni on of expenses is discussed in the next sec on.
Expense Recogni on Illustrated
In a business, costs are incurred con nuously. To review, a cost is recorded as an asset if it will be
incurred in producing revenue in future accoun ng periods. A cost is recorded as an expense if
it will be used or consumed during the current period to earn revenue. This dis nc on between
types of cost outlays is illustrated in Figure
.
COST OUTLAYS
Recorded as ASSETS
When costs are incurred to
produce revenue in future
accoun ng periods, for ex-
ample: prepaid rent, prepaid
insurance, and unused supplies.
Recorded as EXPENSES
When costs are incurred to
earn revenue in the present
accoun ng period, for example:
rent expense, insurance expense,
and office supplies expense.
Figure 3.3: The Interrela onship Between Assets and Expense
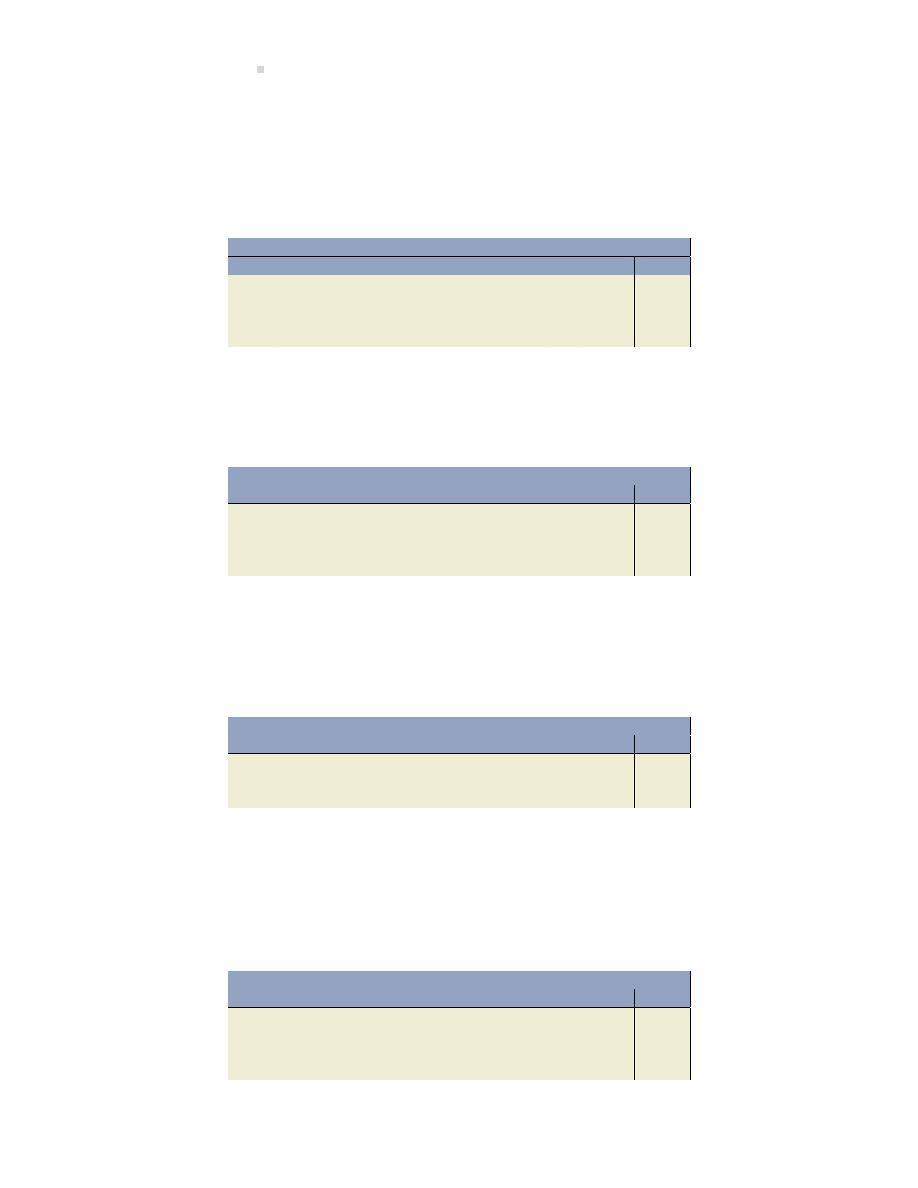
102
Financial Accoun ng and Adjus ng Entries
In the previous sec on regarding revenue recogni on, journal entries illustrated three scenarios
where revenue was recognized before, at the same me as, and a er cash was received. Similarly,
expenses can be incurred before, at the same me as, or a er cash is paid out. An example of
when expenses are incurred before cash is paid occurs when the u li es expense for January is
not paid un l February. In this case, an account payable is created in January as follows:
General Journal
Date
Account/Explana on
PR
Debit
Credit
U li es Expense . . . . . . . . . . . . . . . . . . . . . . .
XX
Accounts Payable (or U li es Payable)
XX
To record January u li es expense to be
paid in February.
The u li es expense is reported in the January income statement.
When the January u li es are paid in February, the following is recorded:
General Journal
Date
Account/Explana on
PR
Debit
Credit
Accounts Payable (or U li es Payable) . . .
XX
Cash . . . . . . . . . . . . . . . . . . . . . . . . . . . . . . .
XX
To record payment in February of u li es
used in January.
The preceding entry has no effect on expenses reported on the February income statement.
Expenses can also be recorded at the same me that cash is paid. For example, if salaries for
January are paid on January 31, the entry on January 31 is:
General Journal
Date
Account/Explana on
PR
Debit
Credit
Salaries Expense . . . . . . . . . . . . . . . . . . . . . . .
XX
Cash . . . . . . . . . . . . . . . . . . . . . . . . . . . . . . .
XX
To record payment of January salaries.
As a result of this entry, salaries expense is reported on the January income statement when cash
is paid.
Finally, a cash payment can be made before the expense is incurred, such as insurance paid in
advance. A prepayment of insurance creates an asset Prepaid Insurance and is recorded as:
General Journal
Date
Account/Explana on
PR
Debit
Credit
Prepaid Insurance . . . . . . . . . . . . . . . . . . . . . .
XX
Cash . . . . . . . . . . . . . . . . . . . . . . . . . . . . . . .
XX
To record payment of insurance in ad-
vance.

3.1. The Opera ng Cycle
103
As the prepaid insurance is used, it is appropriate to report an expense on the income statement
by recording the following entry:
General Journal
Date
Account/Explana on
PR
Debit
Credit
Insurance Expense . . . . . . . . . . . . . . . . . . . . .
XX
Prepaid Insurance. . . . . . . . . . . . . . . . . . .
XX
To record the use of Prepaid Insurance.
The preceding examples illustrate how to match expenses to the appropriate accoun ng period.
The matching principle requires that expenses be reported in the same period as the revenues
they helped generate. That is, expenses are reported on the income statement: a) when related
revenue is recognized, or b) during the appropriate me period, regardless of when cash is paid.
To ensure the recogni on and matching of revenues and expenses to the correct accoun ng pe-
riod, account balances must be reviewed and adjusted prior to the prepara on of financial state-
ments. This is the topic of the next sec on.

104
Financial Accoun ng and Adjus ng Entries
3.2 Adjus ng Entries
LO2
–
Explain
the use of and
prepare
the
adjus ng entries
required for pre-
paid
expenses,
deprecia on,
unearned
rev-
enues,
accrued
revenues, and ac-
crued expenses.
At the end of an accoun ng period, before financial statements can be
prepared, the accounts must be reviewed for poten al adjustments. This
review is done by using the unadjusted trial balance. The unadjusted trial
balance is a trial balance where the accounts have not yet been adjusted.
The trial balance of Big Dog Carworks Corp. at January 31 was prepared in
Chapter
and appears in Figure
below. It is an unadjusted trial balance
because the accounts have not yet been updated for adjustments. We
will use this trial balance to illustrate how adjustments are iden fied and
recorded.
Big Dog Carworks Corp.
Unadjusted Trial Balance
At January 31, 2015
Acct.
Account
Debit
Credit
101
Cash
$3,700
110
Accounts receivable
2,000
161
Prepaid insurance
2,400
183
Equipment
3,000
184
Truck
8,000
201
Bank loan
$6,000
210
Accounts payable
700
247
Unearned revenue
400
320
Share capital
10,000
330
Dividends
200
450
Repair revenue
10,000
654
Rent expense
1,600
656
Salaries expense
3,500
668
Supplies expense
2,000
670
Truck opera on expense
700
$27,100
$27,100
Figure 3.4: Unadjusted Trial Balance of Big Dog Carworks Corp. at January 31, 2015
Adjustments are recorded with adjus ng entries. The purpose of adjus ng entries is to ensure
both the balance sheet and the income statement faithfully represent the account balances for
the accoun ng period. Adjus ng entries help sa sfy the matching principle. There are five types of
adjus ng entries as shown in Figure
, each of which will be discussed in the following sec ons.
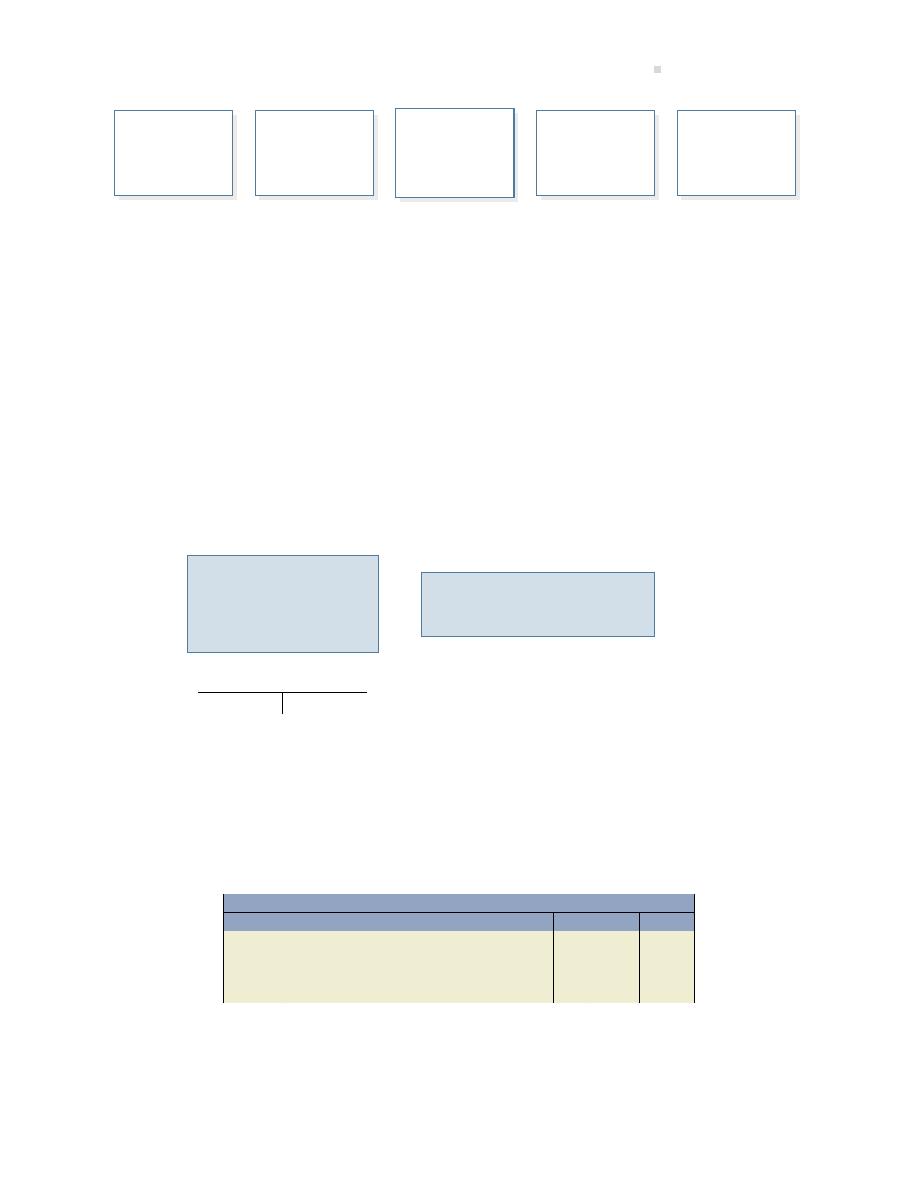
3.2. Adjus ng Entries
105
Adjust
prepaid
assets
Adjust
unearned
liabili es
Adjust
plant and
equipment
assets
Adjust for
accrued
revenues
1
Adjust for
accrued
expenses
2
1. An accrued revenue is a revenue that has been earned but has not been collected or recorded.
2. An accrued expense is an expense that has been incurred but has not yet been paid or recorded.
Figure 3.5: Five Types of Adjus ng Entries
Adjus ng Prepaid Asset Accounts
An asset or liability account requiring adjustment at the end of an accoun ng period is referred
to as a mixed account because it includes both a balance sheet por on and an income statement
por on. The income statement por on must be removed from the account by an adjus ng entry.
Refer to Figure
which shows an unadjusted balance in prepaid insurance of $2,400. Recall
from Chapter
that Big Dog paid for a 12-month insurance policy that went into effect on January
1 (transac on 5).
Prepaid Insurance
2,400
Prepaid Insurance
2,400
Cash
2,400
The unadjusted trial
balance shows the
following balance in
the Prepaid Insurance
account:
The balance resulted when
the journal entry below was
recorded:
At January 31, one month or $200 of the policy has expired (been used up) calculated as $2,400/12
months = $200.
The adjus ng entry on January 31 to transfer $200 out of prepaid insurance and into insurance
expense is:
General Journal
Date
Account/Explana on
PR
Debit
Credit
Jan 31
Insurance Expense . . . . . . . . . . . . . . . . . . . . .
200
Prepaid Insurance. . . . . . . . . . . . . . . . . . .
200
To adjust for the use of one month of Pre-
paid Insurance.
As shown below, the balance remaining in the Prepaid Insurance account is $2,200 a er the ad-
jus ng entry is posted. The $2,200 balance represents the unexpired asset that will benefit future
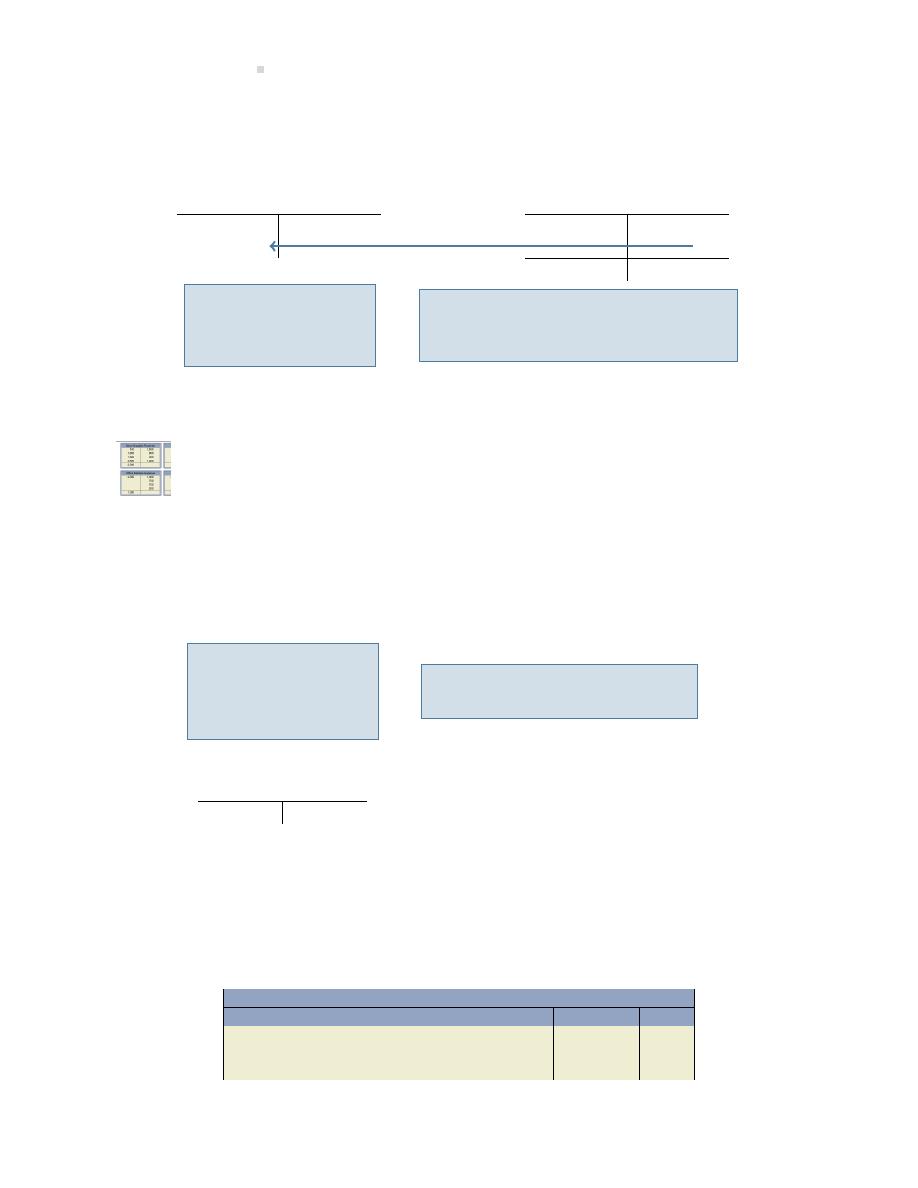
106
Financial Accoun ng and Adjus ng Entries
periods, namely, the 11 months from February to December, 2015. The $200 transferred out
of prepaid insurance is posted as a debit to the Insurance Expense account to show how much
insurance has been used during January.
Insurance Expense
Prepaid Insurance
2,400
200
200
Bal. 2,200
An expense account,
Insurance Expense,
is increased by the
amount used.
An asset account, Prepaid Insurance,
is decreased by the $200 of insurance
coverage that was used during January.
If the adjustment was not recorded, assets on the balance sheet would be overstated by $200 and
expenses would be understated by the same amount on the income statement.
An explora on is available on the Lyryx site. Log into your Lyryx course to run
Adjus ng Unearned Liability Accounts
On January 15, Big Dog received a $400 cash payment in advance of services being performed:
$300 for January and $100 for February.
Unearned Repair
Revenue
400
Cash
400
Unearned Repair Rev.
400
The unadjusted trial
balance shows the
following in the Un-
earned Repair Rev-
enue account:
The receipt of the $400 advance
payment was recorded as follows:
This advance payment was originally recorded as unearned, since the cash was received before
repair services were performed. At January 31, $300 of the $400 unearned amount has been
earned. Therefore, $300 must be transferred from unearned repair revenue into repair revenue.
The adjus ng entry at January 31 is:
General Journal
Date
Account/Explana on
PR
Debit
Credit
Jan 31
Unearned Repair Revenue . . . . . . . . . . . . . .
300
Repair Revenue . . . . . . . . . . . . . . . . . . . . .
300
To adjust for repair revenue earned.
3.2. Adjus ng Entries
107
A er pos ng the adjustment, the $100 remaining balance in unearned repair revenue ($400 –
$300) represents the amount at the end of January that will be earned in February.
Unearned Repair
Revenue
Repair Revenue
400
10,000
300
300
Bal. 100
Bal. 10,300
A liability account,
Unearned Repair Rev-
enue, is decreased by
the $300 adjustment.
A revenue account,
Repair Revenue, is
increased by the $300
adjustment.
If the adjustment was not recorded, unearned repair revenue would be overstated (too high) by
$300 causing liabili es on the balance sheet to be overstated. Addi onally, revenue would be
understated (too low) by $300 on the income statement if the adjustment was not recorded.
An explora on is available on the Lyryx site. Log into your Lyryx course to run
.
Adjus ng Plant and Equipment Accounts
Plant and equipment assets, also known as long-lived assets, are expected to help generate rev-
enues over the current and future accoun ng periods because they are used to produce goods,
supply services, or used for administra ve purposes. The truck and equipment purchased by Big
Dog Carworks Corp. in January are examples of plant and equipment assets that provide economic
benefits for more than one accoun ng period. Because plant and equipment assets are useful for
more than one accoun ng period, their cost must be spread over the me they are used. This
is done to sa sfy the matching principle. For example, the $100,000 cost of a machine expected
to be used over five years is not expensed en rely in the year of purchase because this would
cause expenses to be overstated in Year 1 and understated in Years 2, 3, 4, and 5. Therefore, the
$100,000 cost must be spread over the asset’s five-year life.
The process of alloca ng the cost of a plant and equipment asset over the period of me it is
expected to be used is called deprecia on. The amount of deprecia on is calculated using the
actual cost and an es mate of the asset’s useful life and residual value. The useful life of a plant
and equipment asset is an es mate of how long it will actually be used by the business regardless
of how long the asset is expected to last. For example, a car might have a manufacturer’s suggested
life of 10 years but a business may have a policy of keeping cars for only 2 years. The useful life
for deprecia on purposes would therefore be 2 years and not 10 years. The residual value is an
es mate of what the plant and equipment asset will be sold for when it is no longer used by a
business. Residual value can be zero. There are different formulas for calcula ng deprecia on.
We will use the straight-line method of deprecia on:
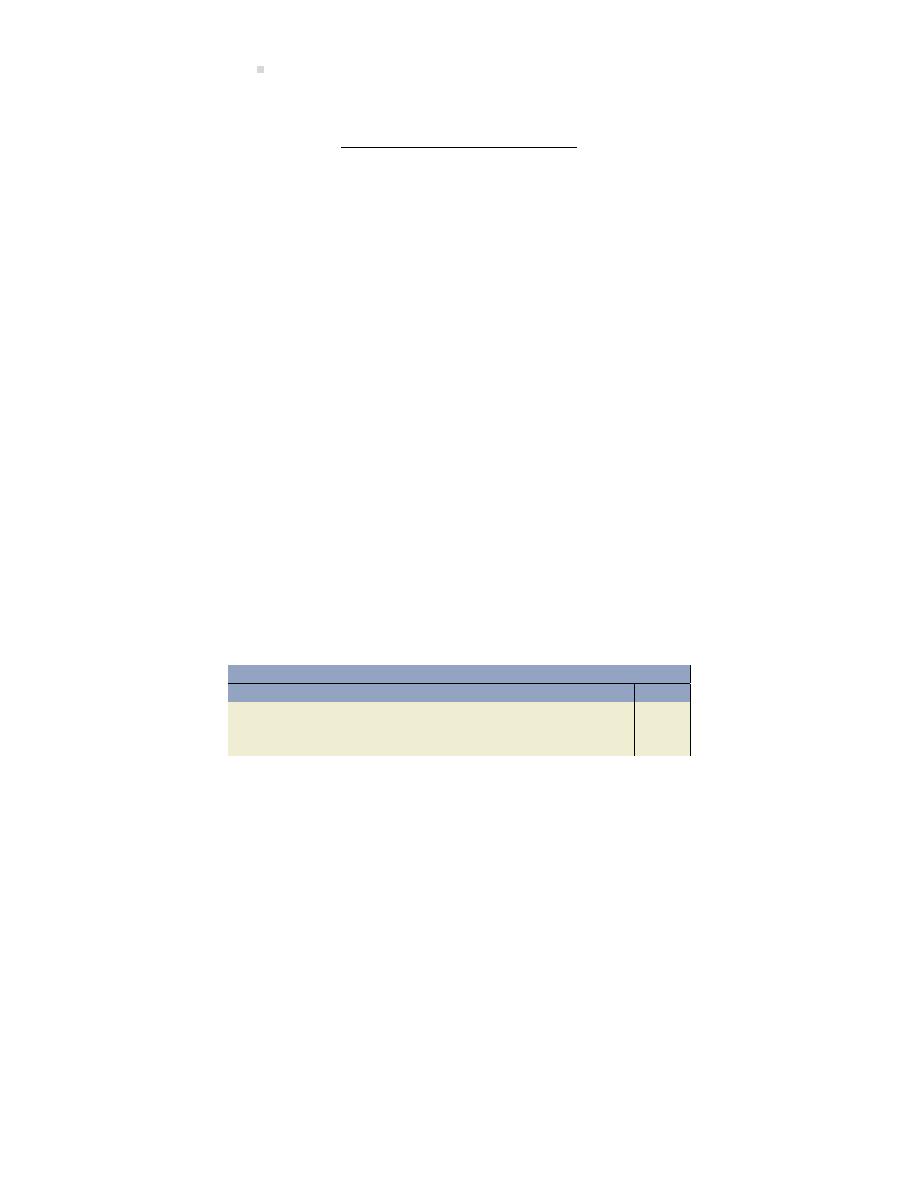
108
Financial Accoun ng and Adjus ng Entries
Cost
− Es mated Residual Value
Es mated Useful Life
The cost less es mated residual value is the total depreciable cost of the asset. The straight-line
method allocates the depreciable cost equally over the asset’s es mated useful life. When record-
ing deprecia on expense, our ini al ins nct is to debit deprecia on expense and credit the Plant
and Equipment asset account in the same way prepaids were adjusted with a debit to an expense
and a credit to the Prepaid asset account. However, credi ng the Plant and Equipment asset ac-
count is incorrect. Instead, a contra account called accumulated deprecia on must be credited. A
contra account is an account that is related to another account and typically has an opposite nor-
mal balance that is subtracted from the balance of its related account on the financial statements.
Accumulated deprecia on records the amount of the asset’s cost that has been expensed since it
was put into use. Accumulated deprecia on has a normal credit balance that is subtracted from
a Plant and Equipment asset account on the balance sheet.
Ini ally, the concept of credi ng Accumulated Deprecia on may be confusing because of how we
learned to adjust prepaids (debit an expense and credit the prepaid). Remember that prepaids
actually get used up and disappear over me. The Plant and Equipment asset account is not cred-
ited because, unlike a prepaid, a truck or building does not get used up and disappear. The goal
in recording deprecia on is to match the cost of the asset to the revenues it helped generate. For
example, a $50,000 truck that is expected to be used by a business for 4 years will have its cost
spread over 4 years. A er 4 years, the asset will likely be sold (journal entries related to the sale
of plant and equipment assets are discussed in Chapter
The adjus ng journal entry to record deprecia on is:
General Journal
Date
Account/Explana on
PR
Debit
Credit
Deprecia on Expense . . . . . . . . . . . . . . . . . .
XX
Accumulated Deprecia on . . . . . . . . . . .
XX
To adjust for deprecia on.
Subtrac ng the accumulated deprecia on account balance from the Plant and Equipment asset
account balance equals the carrying amount or net book value of the plant and equipment asset
that is reported on the balance sheet.
Let’s work through two examples to demonstrate deprecia on adjustments. Big Dog Carworks
Corp.’s January 31, 2015 unadjusted trial balance showed the following two plant and equipment
assets:
Big Dog Carworks Corp.
Unadjusted Trial Balance
At January 31, 2015
Acct.
Account
Debit
Credit
183
Equipment
3,000
184
Truck
8,000
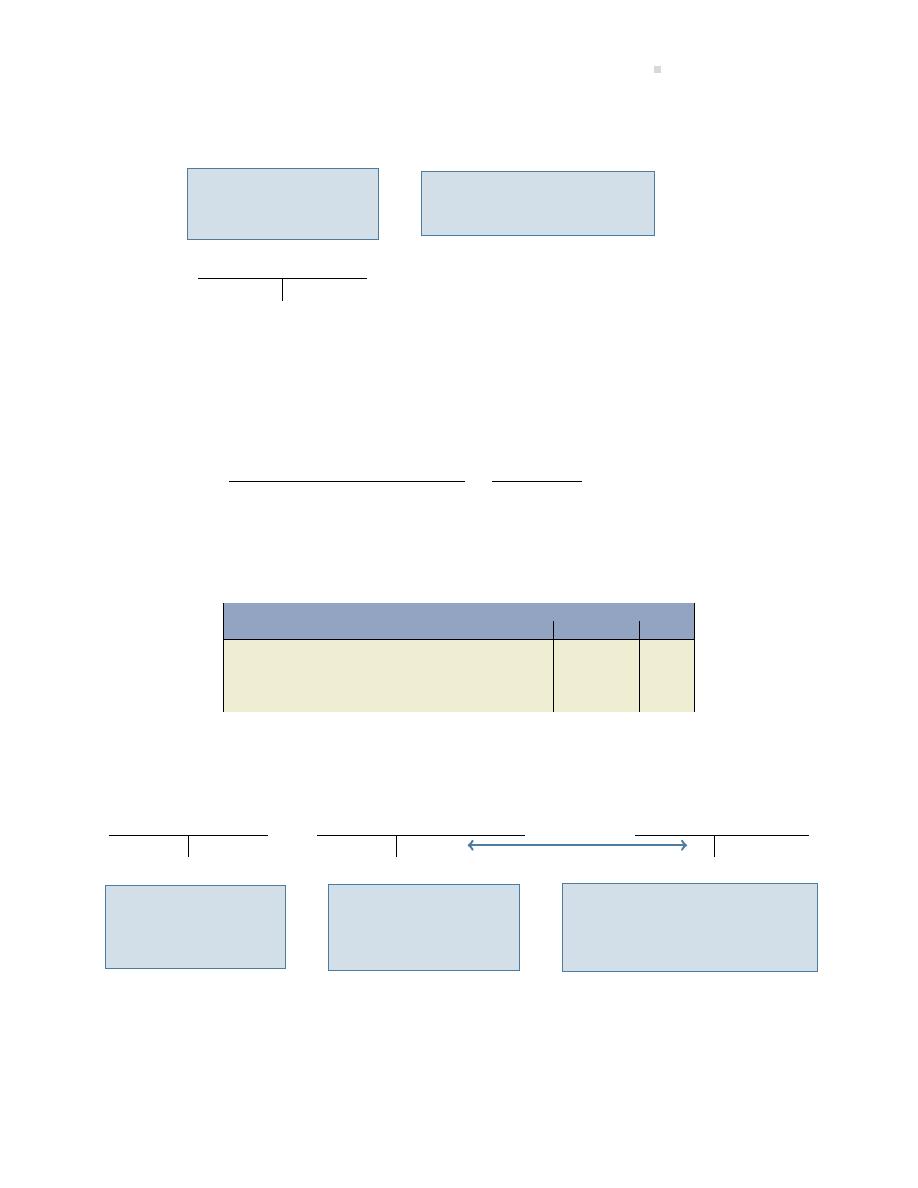
3.2. Adjus ng Entries
109
The equipment was purchased for $3,000.
Equipment
3,000
Equipment
3,000
Cash
3,000
The Equipment gen-
eral ledger account
appears as follows:
The balance resulted when
this journal entry was
recorded:
The equipment was recorded as a plant and equipment asset because it has an es mated useful
life greater than 1 year. Assume its actual useful life is 10 years (120 months) and the equipment
is es mated to be worth $0 at the end of its useful life (residual value of $0).
Cost
− Es mated Residual Value
Es mated Useful Life
=
$3,000
− $0
120 months
=
$25/month
Note that deprecia on is always rounded to the nearest whole dollar. This is because depreci-
a on is based on es mates — an es mated residual value and an es mated useful life; it is not
exact. The following adjus ng journal entry is made on January 31:
General Journal
Date
Account/Explana on
PR
Debit
Credit
Jan 31
Deprecia on Expense, Equipment . . . . . . .
25
Accumulated Deprecia on, Equipment
25
To adjust for one month of deprecia on
on the equipment.
When the adjus ng entry is posted, the accounts appear as follows:
Accumulated
Deprecia on
Equipment
Deprecia on – Equipment
Expense – Equipment
3,000
25
25
The Equipment ac-
count remains un-
changed by the ad-
jus ng entry.
A contra account, Ac-
cumulated Deprecia-
on, is increased by
$25.
Deprecia on Expense is in-
creased by $25, the amount of
the equipment’s cost that has
been allocated to expense.
For financial statement repor ng, the asset and contra asset accounts are combined. The net book
value of the equipment on the balance sheet is shown as $2,975 ($3,000 – $25).
BDCC also shows a truck for $8,000 on the January 31, 2015 unadjusted trial balance.
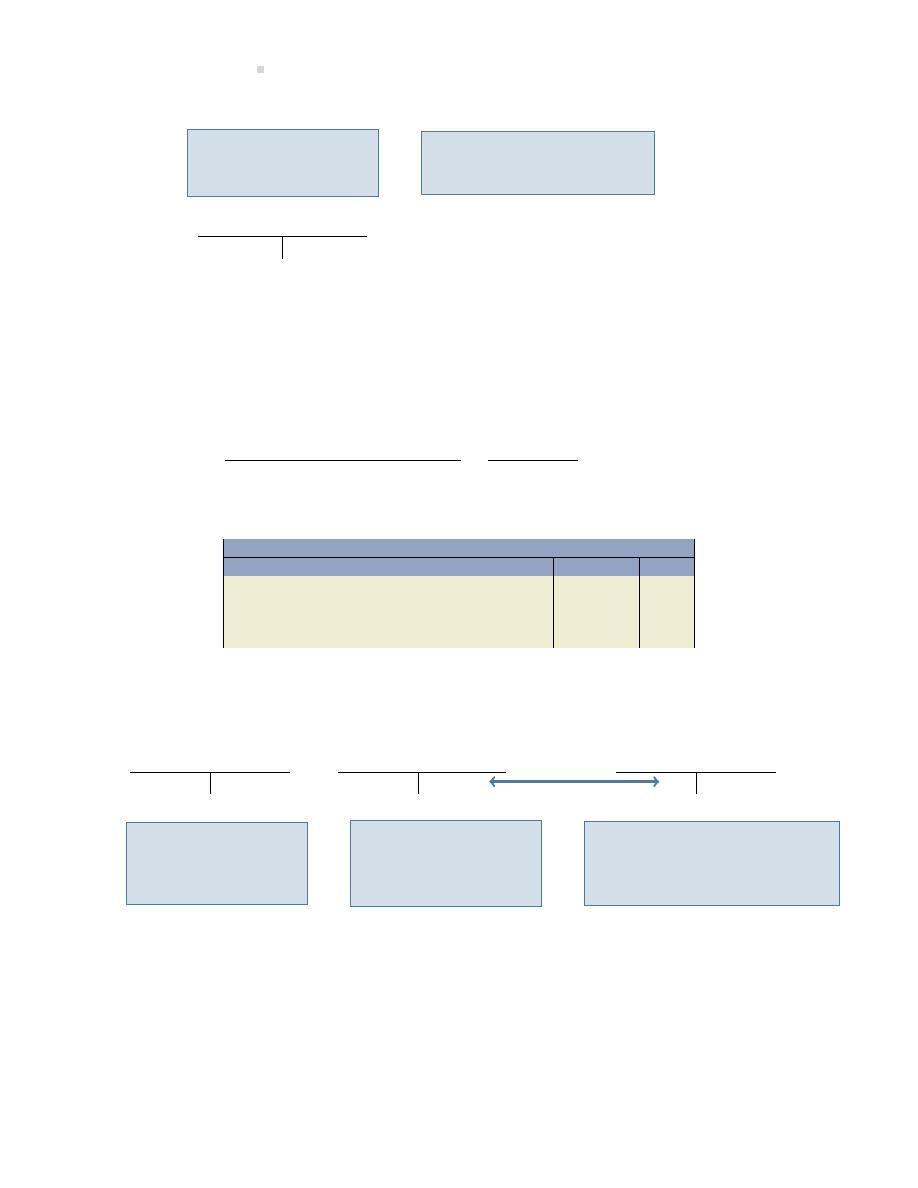
110
Financial Accoun ng and Adjus ng Entries
Truck
8,000
Truck
8,000
Bank Loan
5,000
Cash
3,000
The Truck general
ledger accounts ap-
pears as:
The journal entry to record
the purchase of the truck
was:
Assume the truck has an es mated useful life of 80 months and a zero es mated residual value.
At January 31, one month of the truck cost has expired since it was put into opera on in January.
Using the straight-line method, deprecia on is calculated as:
Cost
− Es mated Residual Value
Es mated Useful Life
=
$8,000
− $0
80 months
=
$100/month
The adjus ng entry recorded on January 31 is:
General Journal
Date
Account/Explana on
PR
Debit
Credit
Jan 31
Deprecia on Expense, Truck . . . . . . . . . . . .
100
Accumulated Deprecia on, Truck . . . . .
100
To adjust for one month of deprecia on
on the truck.
When the adjus ng entry is posted, the accounts appear as follows:
Accumulated
Deprecia on
Truck
Deprecia on – Truck
Expense – Truck
8,000
100
100
The Truck account
remains unchanged
by the adjus ng en-
try.
A contra account, Ac-
cumulated Deprecia-
on, is increased by
$100.
Deprecia on Expense is in-
creased by $100, the amount
of the truck’s cost that has
been allocated to expense.
For financial statement repor ng, the asset and contra asset accounts are combined. The net book
value of the truck on the balance sheet is shown as $7,900 ($8,000 – $100).
If deprecia on adjustments are not recorded, assets on the balance sheet would be overstated.
Addi onally, expenses would be understated on the income statement causing net income to be
overstated. If net income is overstated, retained earnings on the balance sheet would also be
overstated.
3.2. Adjus ng Entries
111
It is important to note that land is a long-lived asset. However, it is not depreciated because it
does not get used up over me. Therefore, land is o en referred to as a non-depreciable asset.
An explora on is available on the Lyryx site. Log into your Lyryx course to run
.
Adjus ng for Accrued Revenues
Accrued revenues are revenues that have been earned but not yet collected or recorded. For
example, a bank has numerous notes receivable. Interest is earned on the notes receivable as
me passes. At the end of an accoun ng period, there would be notes receivable where the
interest has been earned but not collected or recorded. The adjus ng entry for accrued revenues
is:
General Journal
Date
Account/Explana on
PR
Debit
Credit
Receivable . . . . . . . . . . . . . . . . . . . . . . . . . . . .
XXX
Revenue . . . . . . . . . . . . . . . . . . . . . . . . . . .
XXX
To adjust for accrued revenue.
For Big Dog Carworks Corp., assume that on January 31, $400 of repair work was completed for
a client but it had not yet been collected or recorded. BDCC must record the following adjus ng
entry:
General Journal
Date
Account/Explana on
PR
Debit
Credit
Jan 31
Accounts Receivable . . . . . . . . . . . . . . . . . . .
400
Repair Revenue . . . . . . . . . . . . . . . . . . . . .
400
To adjust for accrued revenue.
Accounts Receivable
Repair Revenue
2,000
10,300
400
400
Bal. 2,400
Bal. 10,700
An asset account, Ac-
counts Receivable, is
increased by the ac-
crued amount.
An income statement
account, Repair Revenue,
is increased by the $400
of accrued revenue.
If the adjustment was not recorded, assets on the balance sheet would be understated by $400
and revenues would be understated by the same amount on the income statement.
An explora on is available on the Lyryx site. Log into your Lyryx course to run
.
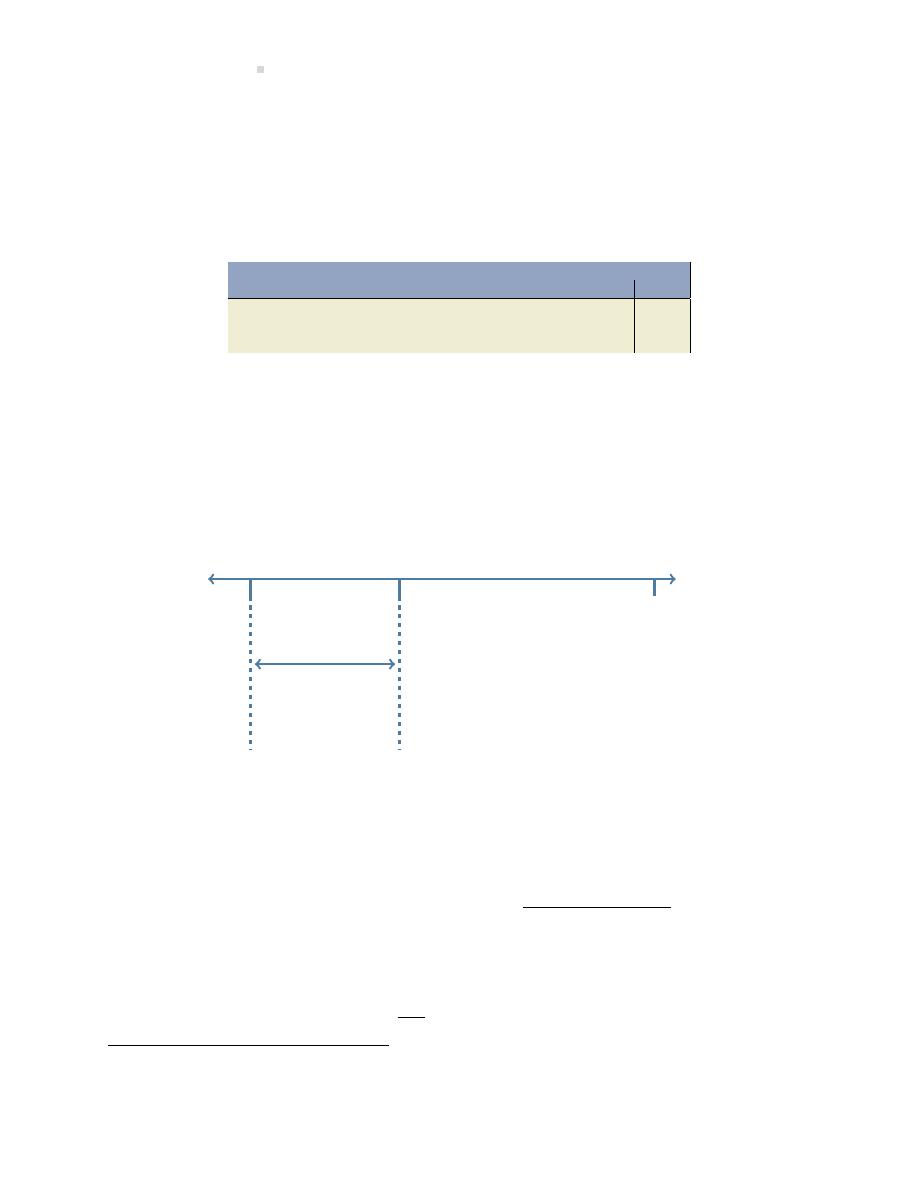
112
Financial Accoun ng and Adjus ng Entries
Adjus ng for Accrued Expenses
Accrued expenses are expenses that have been incurred but not yet paid or recorded. For exam-
ple, a u lity bill received at the end of the accoun ng period is likely not payable for 2–3 weeks.
U li es for the period have been used but have not yet been paid or recorded. The adjus ng
entry for accrued expenses is:
General Journal
Date
Account/Explana on
PR
Debit
Credit
Expense . . . . . . . . . . . . . . . . . . . . . . . . . . . . . . .
XXX
Payable . . . . . . . . . . . . . . . . . . . . . . . . . . . .
XXX
To adjust for accrued expense.
Accruing Interest Expense
For Big Dog Carworks Corp., the January 31, 2015 unadjusted trial balance shows a $6,000 bank
loan balance. Assume it is a 4%, 60-day bank loan
. It was dated January 3 which means that on
January 31, 28 days of interest have accrued (January 31 less January 3 = 28 days) as shown in
Figure
28 days of
interest has
been incurred
at January 31
60–day Note
January 3
January 31
March 4
(Maturity
date)
Figure 3.6: Interest Incurred During an Accoun ng Period
The formula for calcula ng interest when the term is expressed in days is:
Interest = Principal
× Interest rate ×
Elapsed me in days
365
The interest expense accrued at January 31 is calculated as:
Interest = $6,000
× 0.04 ×
28
365
=
$18 (rounded to nearest whole dollar)
1
The maturity date is March 4, 2015 calculated as: January 31 less January 3 = 28 days + 28 days in February = 56
days + 4 days = March 4.
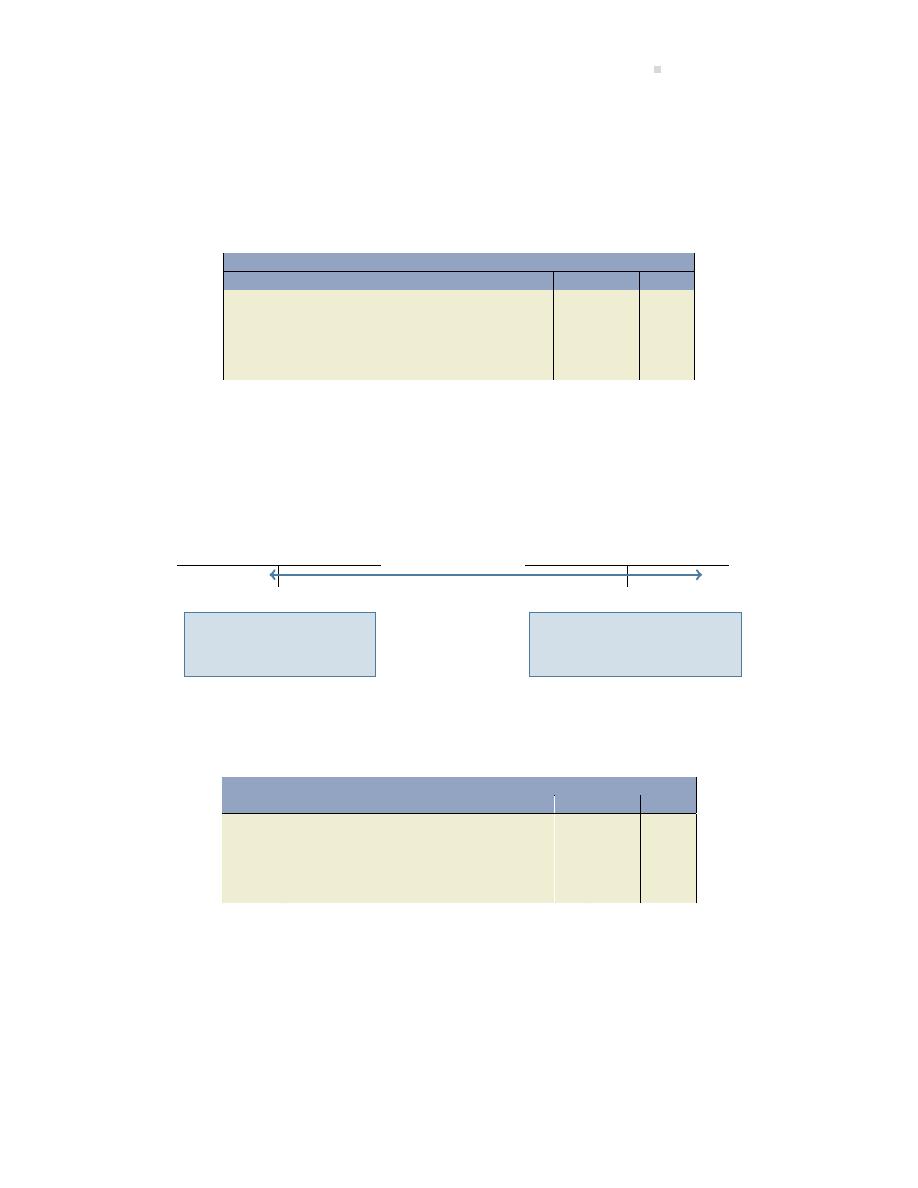
3.2. Adjus ng Entries
113
Interest is normally expressed as an annual rate. Therefore, the 28 days must be divided by the
365 days in a year. Normally all interest calcula ons in this textbook are rounded to two decimal
places. However, for simplicity of demonstra ons in this chapter, we will round to the nearest
whole dollar.
BDCC’s adjus ng entry on January 31 is:
General Journal
Date
Account/Explana on
PR
Debit
Credit
Jan 31
Interest Expense . . . . . . . . . . . . . . . . . . . . . . .
18
Interest Payable . . . . . . . . . . . . . . . . . . . .
18
To adjust for accrued interest; $6,000 X
4% X 28/365 = $18.41 (rounded to $18 for
illustra ve purposes in this chapter).
This adjus ng entry enables BDCC to include the interest expense on the January income state-
ment even though the payment has not yet been made. The entry creates a payable that will be
reported as a liability on the balance sheet at January 31.
When the adjus ng entry is posted, the accounts appear as:
Interest Expense
Interest Payable
18
18
An expense account is
established to record
the debit.
Interest payable is es-
tablished to record the
credit.
On February 28, interest will again be accrued and recorded as:
General Journal
Date
Account/Explana on
PR
Debit
Credit
Feb 28
Interest Expense . . . . . . . . . . . . . . . . . . . . . . .
18
Interest Payable . . . . . . . . . . . . . . . . . . . .
18
To adjust for accrued interest; $6,000 X
4% X 28/365 = $18.41 (rounded to $18 for
illustra ve purposes in this chapter).
On March 4 when the bank loan matures, Big Dog will pay the interest and principal and record
the following entry:
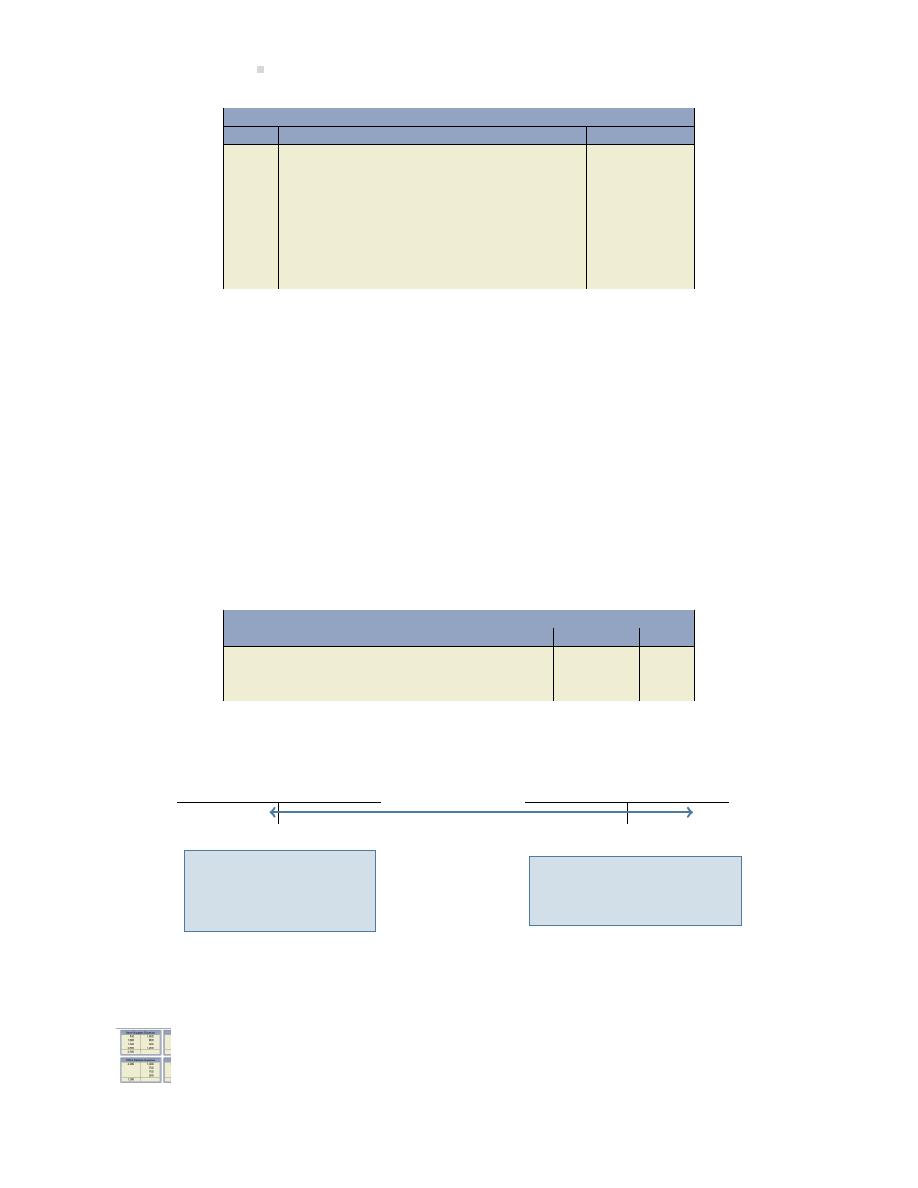
114
Financial Accoun ng and Adjus ng Entries
General Journal
Date
Account/Explana on
PR
Debit
Credit
Mar 4
Interest Expense . . . . . . . . . . . . . . . . . . . . . . .
3
Interest Payable . . . . . . . . . . . . . . . . . . . . . . . .
36
Bank Loan . . . . . . . . . . . . . . . . . . . . . . . . . . . . .
6,000
Cash . . . . . . . . . . . . . . . . . . . . . . . . . . . . . . .
6039
To record payment of the bank loan and
interest; interest expense for March is
$6,000 X 4% X 4/365 = $2.63 (rounded to
$3 for illustra ve purposes in this chapter).
The $36 debit to interest payable will cause the Interest Payable account to go to zero since the
liability no longer exists once the cash is paid. No ce that the total interest expense recorded on
the bank loan was $39
− $18 expensed in January, $18 expensed in February, and $3 expensed in
March. The interest expense was matched to the life of the bank loan.
Accruing Income Tax Expense
Another adjustment that is required for Big Dog Carworks Corp. involves the recording of cor-
porate income taxes. In most jurisdic ons, a corpora on is taxed as an en ty separate from its
shareholders. For simplicity, assume BDCC’s income tax due for January 2015 is $500. The adjust-
ing entry is at January 31:
General Journal
Date
Account/Explana on
PR
Debit
Credit
Jan 31
Income Tax Expense . . . . . . . . . . . . . . . . . . . .
500
Income Tax Payable . . . . . . . . . . . . . . . . .
500
To adjust for January accrued income tax.
When the adjus ng entry is posted, the accounts appear as follows:
Income Tax Expense
Income Tax Payable
500
500
Income Tax Expense,
an income statement
account, is created at
January 31.
A liability, Income Tax
Payable, is created at
January 31.
The above adjus ng entry enables the company to match the income tax expense accrued in Jan-
uary to the income earned during the same month.
An explora on is available on the Lyryx site. Log into your Lyryx course to run
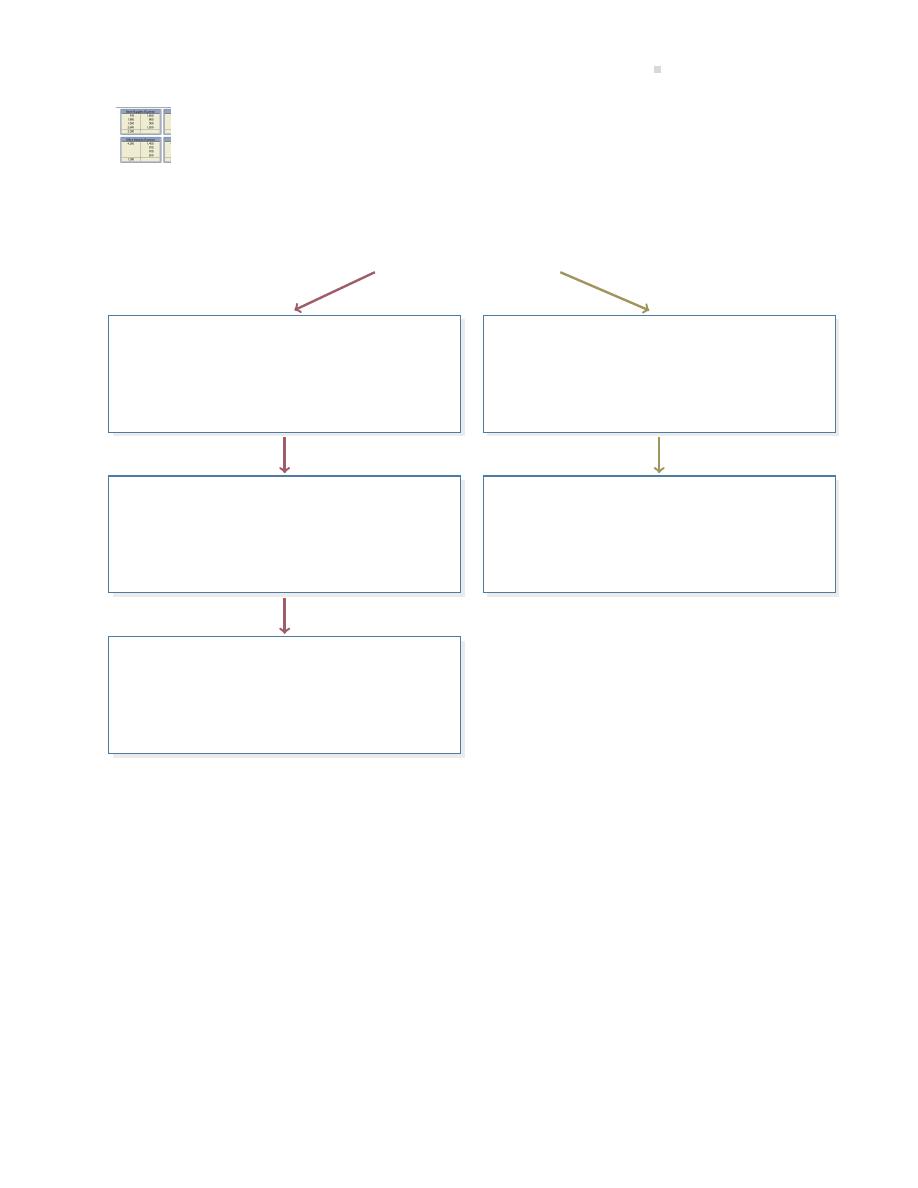
3.2. Adjus ng Entries
115
An explora on is available on the Lyryx site. Log into your Lyryx course to run
Collec on/Payment of Accrual Adjustments in the Next Accoun ng Period
The five types of adjustments discussed in the previous paragraphs are summarized in Figure
.
Each of the five steps of adjus ng entries either
debits an expense
or
credits a revenue
.
Adjust Prepaid assets by recording:
Expense . . . . . . . . . . . . . . . . . . . . . . . .
XX
Prepaid . . . . . . . . . . . . . . . . . . . .
XX
To adjust a Prepaid for the amount used.
Adjust Plant and Equipment assets by recording:
Deprecia on Expense . . . . . . . . . . .
XX
Accumulated Deprecia on . .
XX
To adjust Plant and Equipment assets for
deprecia on.
Adjust for Accrued Expenses by recording:
Expense . . . . . . . . . . . . . . . . . . . . . . . .
XX
Liability . . . . . . . . . . . . . . . . . . . .
XX
To accrue an expense.
Adjust Unearned liabili es by recording:
Unearned Liability . . . . . . . . . . . . . .
XX
Revenue . . . . . . . . . . . . . . . . . . .
XX
To adjust an Unearned Liability for the amount
earned.
Adjust for Accrued Revenues by recording:
Receivable . . . . . . . . . . . . . . . . . . . . .
XX
Revenue . . . . . . . . . . . . . . . . . . .
XX
To accrue a revenue.
1. An accrued revenue is a revenue that has been earned but has not yet been collected or recorded.
2. An accrued expense is an expense that has been incurred but has not yet been paid or recorded.
Figure 3.7: Summary of the Five Types of Adjus ng Entries

116
Financial Accoun ng and Adjus ng Entries
3.3 The Adjusted Trial Balance
LO3 – Prepare an
adjusted trial bal-
ance and explain
its use.
In the last sec on, adjus ng entries were recorded and posted. As a result,
some account balances reported on the January 31, 2015 unadjusted trial
balance in Figure
have changed. Recall that an unadjusted trial balance
reports account balances before adjus ng entries have been recorded and
posted. An adjusted trial balance reports account balances a er adjus ng
entries have been recorded and posted. Figure
shows the adjusted trial
balance for BDCC at January 31, 2015.
In Chapters
and
, the prepara on of financial statements was demonstrated using BDCC’s unad-
justed trial balance. We now know that an adjusted trial balance must be used to prepare financial
statements.
Big Dog Carworks Corp.
Adjusted Trial Balance
At January 31, 2015
Account Balance
Account
Debit
Credit
Cash
$3,700
Accounts receivable
2,400
Prepaid insurance
2,200
Equipment
3,000
Accumulated deprecia on – equipment
$
25
Truck
8,000
Accumulated deprecia on – truck
100
Bank loan
6,000
Accounts payable
700
Interest payable
18
Unearned repair revenue
100
Income tax payable
500
Share capital
10,000
Dividends
200
Repair revenue
10,700
Deprecia on expense – equipment
25
Deprecia on expense – truck
100
Rent expense
1,600
Insurance expense
200
Interest expense
18
Salaries expense
3,500
Supplies expense
2,000
Truck opera on expense
700
Income tax expense
500
Total debits and credits
$28,143
$28,143
Figure 3.8: BDCC’s January 31, 2015 Adjusted Trial Balance
An explora on is available on the Lyryx site. Log into your Lyryx course to run
.

3.4. Using the Adjusted Trial Balance to Prepare Financial Statements
117
3.4 Using the Adjusted Trial Balance to Prepare Financial State-
ments
LO4 – Use an
adjusted
trial
balance to pre-
pare
financial
statements.
In the last sec on, we saw that the adjusted trial balance is prepared af-
ter journalizing and pos ng the adjus ng entries. This sec on shows how
financial statements are prepared using the adjusted trial balance.

118
Financial Accoun ng and Adjus ng Entries
Big Dog Carworks Corp.
Adjusted Trial Balance
January 31, 2015
Account Balance
Account
Debit
Credit
Cash
$ 3,700
Accounts receivable
2,400
Prepaid insurance
2,200
Equipment
3,000
Accumulated deprecia on – equipment
$
25
Truck
8,000
Accumulated deprecia on – truck
100
Bank loan
6,000
Accounts payable
700
Interest payable
18
Unearned repair revenue
100
Income tax payable
500
Share capital
10,000
Dividends
200
Repair revenue
10,700
Deprecia on expense – equipment
25
Deprecia on expense – truck
100
Rent expense
1,600
Insurance expense
200
Interest expense
18
Salaries expense
3,500
Supplies expense
2,000
Truck opera on expense
700
Income tax expense
500
Total debits and credits
$28,143
$28,143
Asset accounts, liability ac-
counts, and the
equity ac-
counts from the statement
of changes in equity
are
used to prepare the balance
sheet.
Share capital, dividends,
and the
net income/loss
from the income statement
are used to prepare the
statement of changes in
equity.
Revenue and expense ac-
counts are used to prepare
the income statement.
Figure 3.9: BDCC’s January 31, 2015 Adjusted Trial Balance and Links Among Financial State-
ments
The income statement is prepared first, followed by the statement of changes in equity as shown
below.
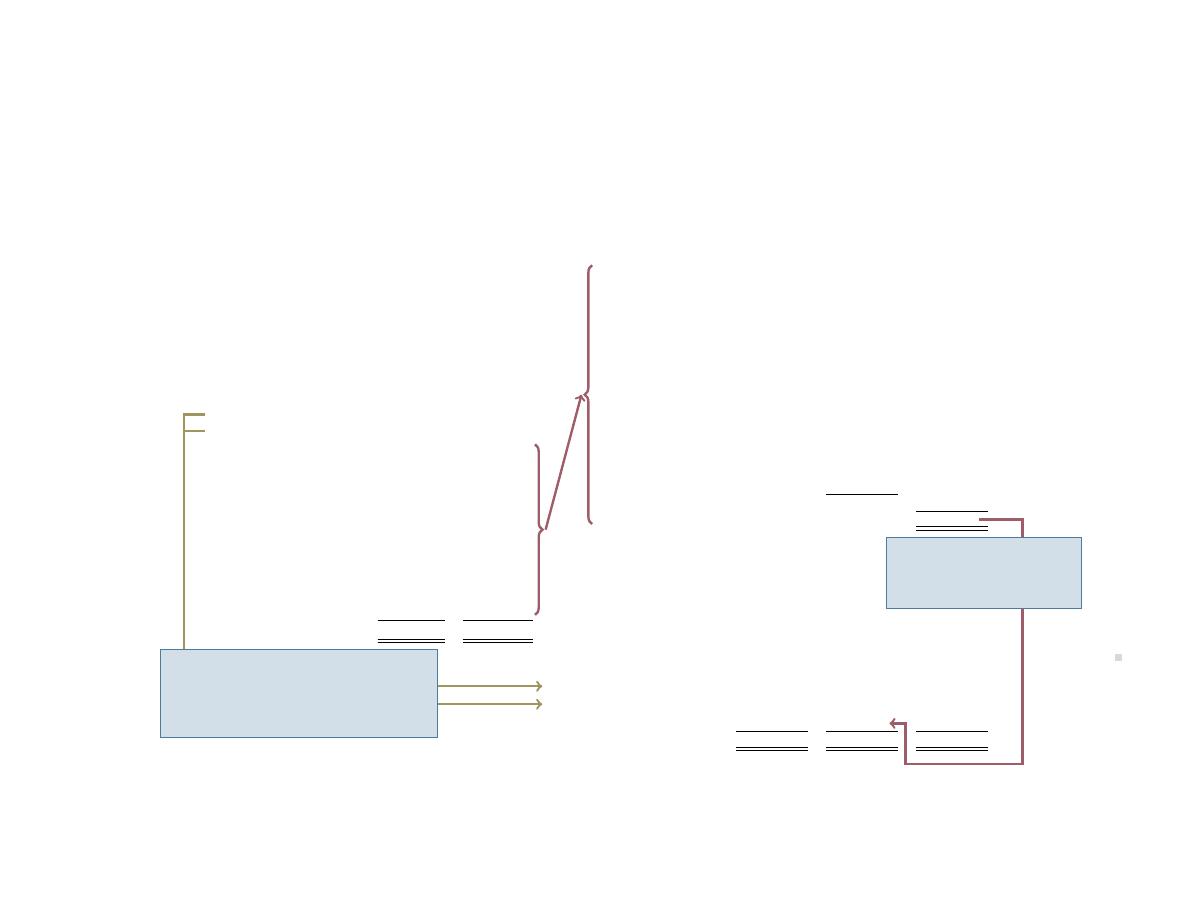
3.4.
Using
the
Adjus
ted
Trial
Balance
to
Pr
epar
e
Financial
St
at
emen
ts
119
Big Dog Carworks Corp.
Adjusted Trial Balance
At January 31, 2015
Account
Debit
Credit
Cash
$ 3,700
Big Dog Carworks Corp.
Accounts receivable
2,400
Income Statement
Prepaid insurance
2,200
For the Month Ended January 31, 2015
Equipment
3,000
Accum. dep. – equipment
$
25
Revenues
Truck
8,000
Repair revenue
$10,700
Accum. dep. – truck
100
Bank loan
6,000
Expenses
Accounts payable
700
Salaries expense
$ 3,500
Interest payable
18
Supplies expense
2,000
Unearned revenue
100
Rent expense
1,600
Income tax payable
500
Truck opera on expense
700
Share capital
10,000
Income tax expense
500
Dividends
200
Insurance expense
200
Repair revenue
10,700
Dep. expense – truck
100
Dep. expense – equipment
25
Dep. expense – equipment
25
Dep. expense – truck
100
Interest expense
18
Rent expense
1,600
Total expenses
8,643
Insurance expense
200
Net income
$2,057
Interest expense
18
Salaries expense
3,500
Big Dog Carworks Corp.
Supplies expense
2,000
Statement of Changes in Equity
Truck opera on expense
700
For the Month Ended January 31, 2015
Income tax expense
500
$28,143
$28,143
Share
Retained
Total
capital
earnings
equity
Balance at beginning of period
$
-0-
$
-0-
$
-0-
Shares issued
10,000
10,000
Dividends
(200)
(200)
Net income
2,057
2,057
Balance at end of period
$10,000
$1,857
$11,857
Share capital and dividends are trans-
ferred to the Statement of Changes in
Equity. Dividends is part of retained
earnings because it is a distribu on of
net income.
Net income is trans-
ferred to the Statement of
Changes in Equity as part
of retained earnings.
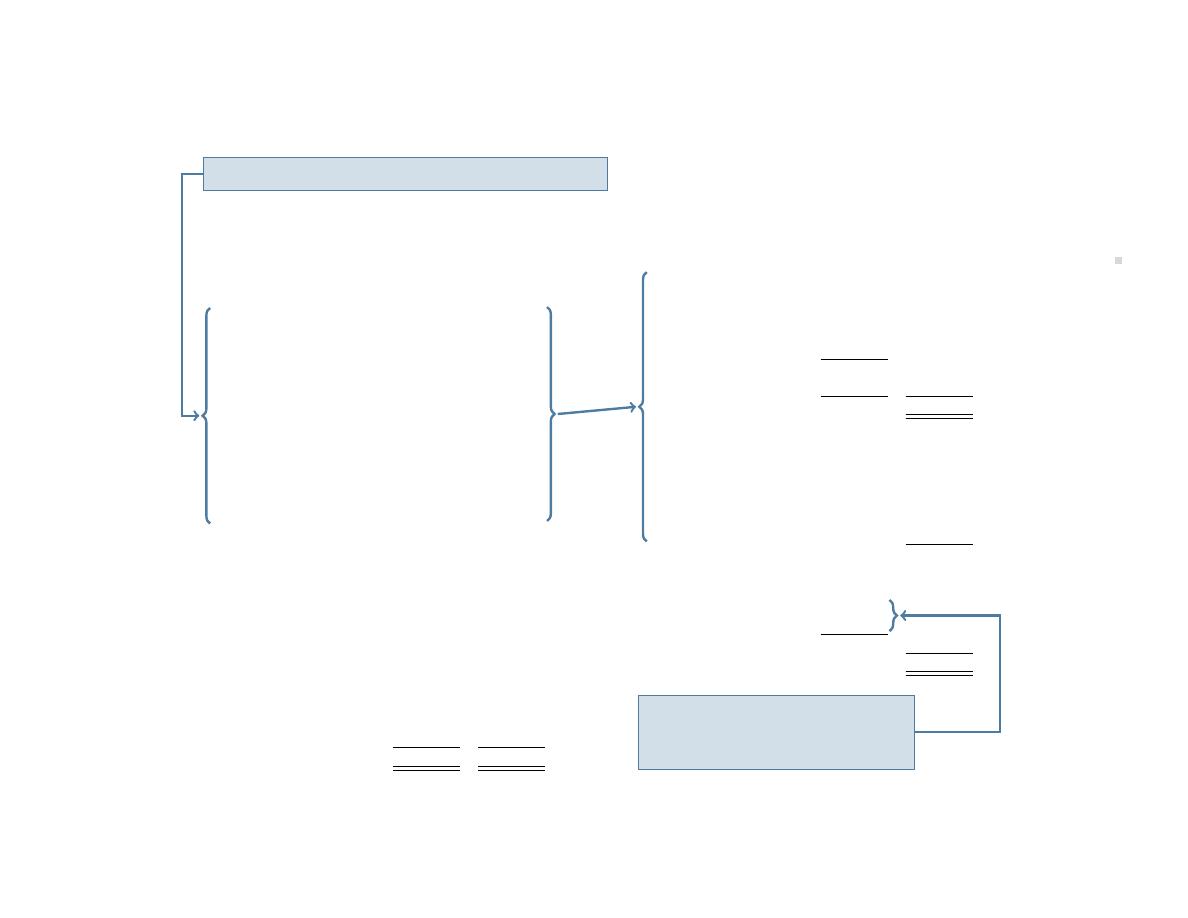
120
Financial
Acc
oun
ng
and
Adjus
ng
En
tries
The balance sheet can be prepared once the statement of changes in equity is complete.
Big Dog Carworks Corp.
Balance Sheet
Big Dog Carworks Corp.
At January 31, 2015
Trial Balance
At January 31, 2015
Assets
Cash
$ 3,700
Account
Debit
Credit
Accounts receivable
2,400
Cash
$ 3,700
Prepaid insurance
2,200
Accounts receivable
2,400
Equipment
$3,000
Prepaid insurance
2,200
Less: Accum. dep.
25
2,975
Equipment
3,000
Truck
$8,000
Accum. dep. – equipment
$ 25
Less: Accum. dep.
100
7,900
Truck
8,000
Total assets
$19,175
Accum. dep. – truck
100
Bank loan
6,000
Liabili es
Accounts payable
700
Bank loan
$ 6,000
Interest payable
18
Accounts payable
700
Unearned revenue
100
Interest payable
18
Income tax payable
500
Unearned repair revenue
100
Share capital
10,000
Income tax payable
500
Dividends
200
Total liabili es
$7,318
Repair revenue
10,700
Dep. expense – equipment
25
Equity
Dep. expense – truck
100
Share capital
$10,000
Rent expense
1,600
Retained earnings
1,857
Insurance expense
200
Total equity
11,857
Interest expense
18
Total liabili es and equity
$19,175
Salaries expense
3,500
Supplies expense
2,000
Truck opera on expense
700
Income tax expense
500
$28,143
$28,143
These accounts are used to prepare the Balance Sheet.
The share capital and retained earnings
balances are transferred to the balance
sheet from the statement of changes in
equity.

3.5. The Accoun ng Cycle
121
No ce how accumulated deprecia on is shown on the balance sheet.
An explora on is available on the Lyryx site. Log into your Lyryx course to run
Adjustments and Financial Statements
.
3.5 The Accoun ng Cycle
LO5 – Iden fy
and
explain
the
steps
in
the
accoun ng
cycle.
The concept of the accoun ng cycle was introduced in Chapter
. The
accoun ng cycle consists of the steps followed each accoun ng period to
prepare financial statements. These eight steps are:
Step 1: Transac ons are analyzed and recorded in the general journal
Step 2: The journal entries in the general journal are posted to accounts in
the general ledger
Step 3: An unadjusted trial balance is prepared to ensure total debits equal total credits
Step 4: The unadjusted account balances are analyzed and adjus ng entries are journalized in the
general journal and posted to the general ledger
Step 5: An adjusted trial balance is prepared to prove the equality of debits and credits
Step 6: The adjusted trial balance is used to prepare financial statements
Step 7: Closing entries are journalized and posted
Step 8: Prepare a post-closing trial balance
Steps 1 through 6 were introduced in this and the preceding chapters. Steps 7 and 8 are discussed
in the next sec on.
An explora on is available on the Lyryx site. Log into your Lyryx course to run

122
Financial Accoun ng and Adjus ng Entries
3.6 The Closing Process
LO6 – Explain the
use of and pre-
pare closing en-
tries and a post-
closing trial bal-
ance.
At the end of a fiscal year, a er financial statements have been prepared,
the revenue, expense, and dividend account balances must be zeroed so
that they can begin to accumulate amounts belonging to the new fiscal
year. To accomplish this, closing entries are journalized and posted. Clos-
ing entries transfer each revenue and expense account balance, as well as
any balance in the Dividend account, into retained earnings. Revenues, ex-
penses, and dividends are therefore referred to as temporary accounts be-
cause their balances are zeroed at the end of each accoun ng period. Bal-
ance sheet accounts, such as retained earnings, are permanent accounts
because they have a con nuing balance from one fiscal year to the next.
The closing process transfers temporary account balances into a perma-
nent account, namely retained earnings. The four entries in the closing
process are detailed below.
Entry 1: Close the revenue accounts to the income summary account
A single compound closing entry is used to transfer revenue account balances to the income sum-
mary account. The income summary is a checkpoint: once all revenue and expense account bal-
ances are transferred/closed to the income summary, the balance in the Income Summary account
must be equal to the net income/loss reported on the income statement. If not, the revenues and
expenses were not closed correctly.
Entry 2: Close the expense accounts to the Income Summary account
The expense accounts are closed in one compound closing journal entry to the Income Summary
account. All expense accounts with a debit balance are credited to bring them to zero. Their
balances are transferred to the Income Summary account as an offse ng debit.
A er entries 1 and 2 above are posted to the Income Summary account, the balance in the income
summary must be compared to the net income/loss reported on the income statement. If the
income summary balance does not match the net income/loss reported on the income statement,
the revenues and/or expenses were not closed correctly.
Entry 3: Close the income summary to retained earnings
The Income Summary account is closed to the Retained Earnings account. This procedure transfers
the balance in the income summary to retained earnings. Again, the amount closed from the
income summary to retained earnings must always equal the net income/loss as reported on the
income statement.
Note that the Dividend account is not closed to the Income Summary account because dividends
is not an income statement account. The dividend account is closed in Entry 4.
Entry 4: Close dividends to retained earnings

3.6. The Closing Process
123
The Dividend account is closed to the Retained Earnings account. This results in transferring the
balance in dividends, a temporary account, to retained earnings, a permanent account.
The balance in the Income Summary account is transferred to retained earnings because the net
income (or net loss) belongs to the shareholders. The closing entries for Big Dog Carworks Corp.
are shown in Figure
.
GENERAL JOURNAL
Page 1
Date
Descrip on
F
Debit
Credit
2015
Closing Entries
Jan. 31
Repair Revenue
1 0 7 0 0 -
Income Summary
1 0 7 0 0 -
To close the revenue account balance.
Income Summary
8 6 4 3 -
Deprecia on expense – equipment
2 5 -
Deprecia on expense – truck
1 0 0 -
Income tax expense
5 0 0 -
Insurance expense
2 0 0 -
Interest expense
1 8 -
Rent expense
1 6 0 0 -
Salaries expense
3 5 0 0 -
Supplies expense
2 0 0 0 -
Truck opera on expense
7 0 0 -
To close expense account balances.
Income Summary
2 0 5 7 -
Retained earnings
2 0 5 7 -
To close income summary to retained earnings.
Retained Earnings
2 0 0 -
Dividends
2 0 0 -
To close dividends to retained earnings.
Figure 3.10: Closing Entries
Pos ng the Closing Entries to the General Ledger
When entries 1 and 2 are posted to the general ledger, the balances in all revenue and expense
accounts are transferred to the Income Summary account. The transfer of these balances is shown
in Figure
. No ce that a zero balance results for each revenue and expense account a er
the closing entries are posted, and there is a $2,057 credit balance in the income summary. The
income summary balance agrees to the net income reported on the income statement.
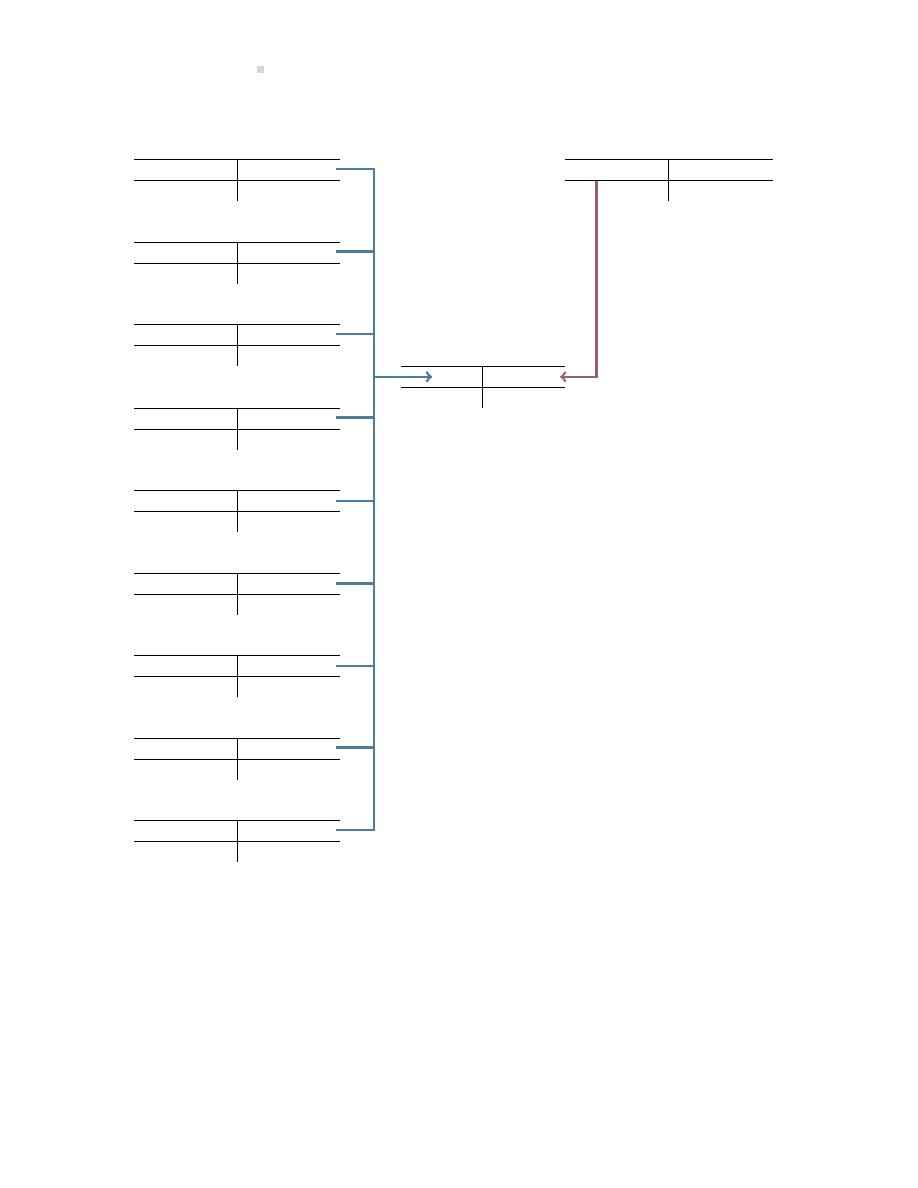
124
Financial Accoun ng and Adjus ng Entries
1. Closing Expense Accounts
2. Closing Revenue Accounts
Dep. Expense – Equipment
Repair Revenue
Bal.
25
25
10,700
10,700
Bal.
-0-
-0-
Bal.
Dep. Expense – Truck
Bal.
100
100
Bal.
-0-
Insurance Expense
Bal.
200
200
Bal.
-0-
Income Summary
8,643
10,700
Interest Expense
2,057 Bal.
Bal.
18
18
Bal.
-0-
Rent Expense
Bal.
1,600
1,600
Bal.
-0-
Salaries Expense
Bal.
3,500
3,500
Bal.
-0-
Supplies Expense
Bal.
2,000
2,000
Bal.
-0-
Truck Opera on Expense
Bal.
700
700
Bal.
-0-
Income Taxes Expense
Bal.
500
500
Bal.
-0-
Figure 3.11: Closing Revenue and Expense Accounts
When the income summary is closed to retained earnings in the third closing entry, the $2,057
credit balance in the income summary account is transferred into retained earnings as shown in
Figure
. As a result, the income summary is le with a zero balance.
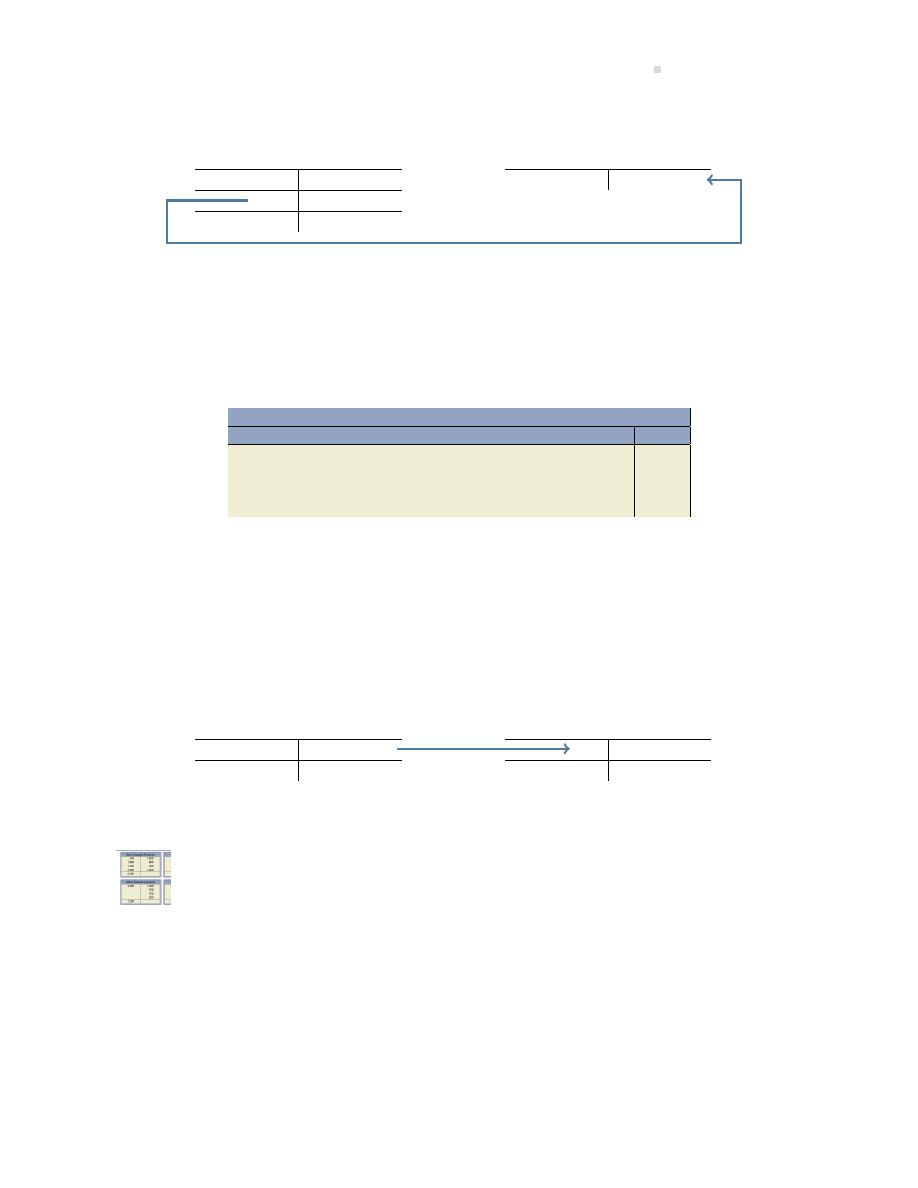
3.6. The Closing Process
125
3. Closing the Income Summary Account
Income Summary
Retained Earnings
8,643
10,700
2,057
2,057
2,057 Bal.
Bal.
-0-
Figure 3.12: Closing the Income Summary Account
This example demonstrated closing entries when there was a net income. When there is a net
loss, the Income Summary account will have a debit balance a er revenues and expenses have
been closed. To close the Income Summary account when there is a net loss, the following closing
entry is required:
General Journal
Date
Account/Explana on
PR
Debit
Credit
Retained Earnings . . . . . . . . . . . . . . . . . . . . . .
XX
Income Summary . . . . . . . . . . . . . . . . . . .
XX
To close the net loss, a debit balance in the
income summary, to retained earnings.
Finally, when dividends is closed to retained earnings in the fourth closing entry, the $200 debit
balance in the Dividends account is transferred into retained earnings as shown in Figure
.
A er the closing entry is posted, the Dividends account is le with a zero balance and retained
earnings is le with a credit balance of $1,857. No ce that the $1,857 must agree to the retained
earnings balance calculated on the statement of changes in equity.
4. Closing the Dividends Account
Dividends
Retained Earnings
200
200
200
2,057
Bal.
-0-
1,857
Bal.
Figure 3.13: Closing the Dividends Account
An explora on is available on the Lyryx site. Log into your Lyryx course to run
.
The Post–Closing Trial Balance
A post-closing trial balance is prepared immediately following the pos ng of closing entries. The
purpose is to ensure that the debits and credits in the general ledger are equal and that all tempo-
rary accounts have been closed. The post-closing trial balance for Big Dog Carworks Corp. appears
below.
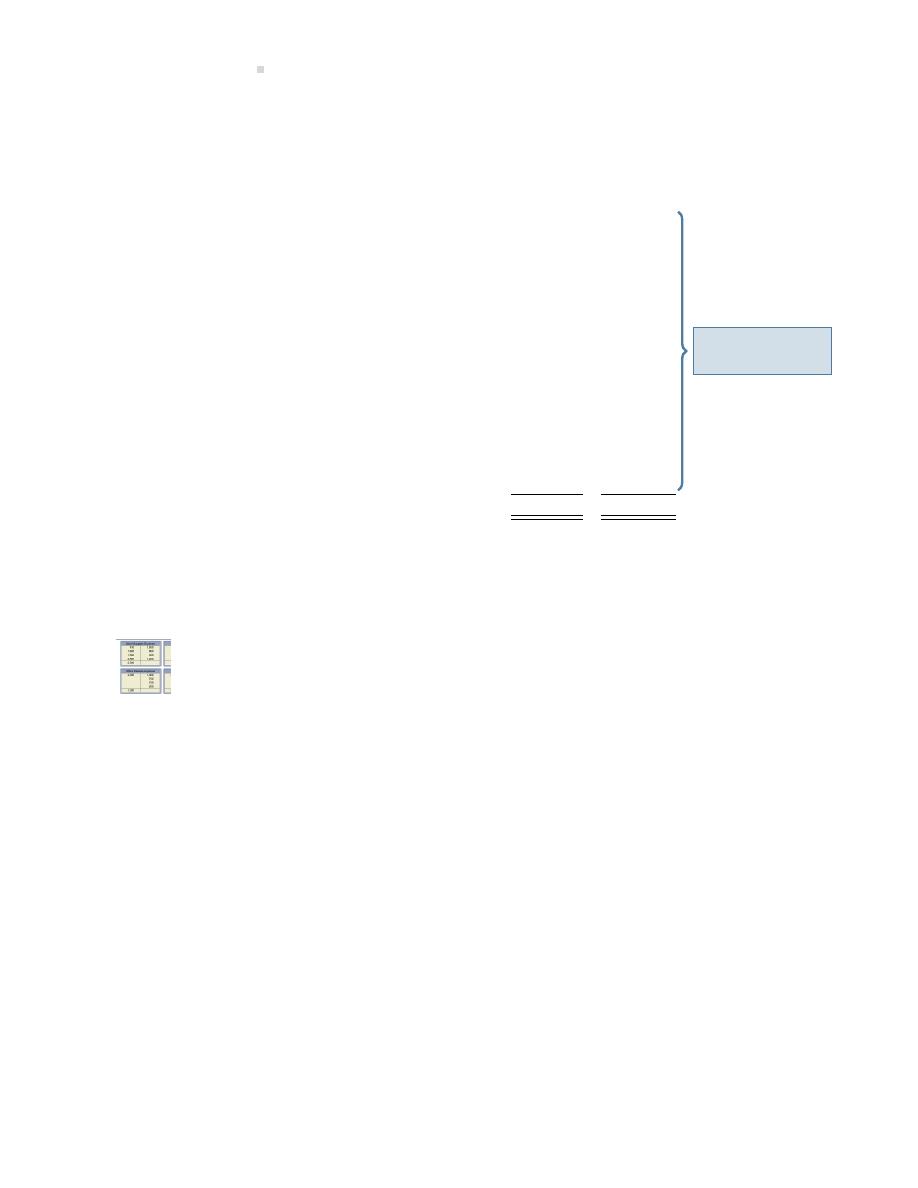
126
Financial Accoun ng and Adjus ng Entries
Big Dog Carworks Corp.
Post-Closing Trial Balance
January 31, 2015
Account Balance
Account
Debit
Credit
Cash
$ 3,700
Accounts receivable
2,400
Prepaid insurance
2,200
Equipment
3,000
Accumulated deprecia on – equipment
$
25
Truck
8,000
Accumulated deprecia on – truck
100
Bank loan
6,000
Accounts payable
700
Interest payable
18
Unearned repair revenue
100
Income taxes payable
500
Share capital
10,000
Retained earnings
1,857
Total debits and credits
$19,300
$19,300
Only permanent
accounts remain.
Note that only balance sheet accounts, the permanent accounts, have balances and are carried
forward to the next accoun ng year. All temporary accounts begin the new fiscal year with a zero
balance, so they can be used to accumulate amounts belonging to the new me period.
An explora on is available on the Lyryx site. Log into your Lyryx course to run
.
Summary of Chapter 3 Learning Objec ves
LO1 – Explain how the meliness, matching, and recogni on GAAP require the
recording of adjus ng entries.
Financial statements must be prepared in a mely manner, at minimum, once per fiscal year.
For statements to reflect ac vi es accurately, revenues and expenses must be recognized and re-
ported in the appropriate accoun ng period. In order to achieve this type of matching, adjus ng
entries need to be prepared.

Summary of Chapter
Learning Objec ves
127
LO2 – Explain the use of and prepare the adjus ng entries required for prepaid
expenses, deprecia on, unearned revenues, accrued revenues, and accrued ex-
penses.
Adjus ng entries are prepared at the end of an accoun ng period. They allocate revenues and
expenses to the appropriate accoun ng period regardless of when cash was received/paid. The
five types of adjustments are:
Expense . . . . . . . . . . . . . . . . . . . . . . . . . . . . . .
XX
Receivable . . . . . . . . . . . . . . . . . . . . . .
XX
Prepaid . . . . . . . . . . . . . . . . . . . . . . . . . . . .
XX
Revenue . . . . . . . . . . . . . . . . . . . . .
XX
To adjust prepaid for the amount used/expired.
To adjust for accrued revenue.
Deprecia on Expense . . . . . . . . . . . . . . . . . .
XX
Expense . . . . . . . . . . . . . . . . . . . . . . . .
XX
Accumulated Deprecia on. . . . . . . . . . .
XX
Payable . . . . . . . . . . . . . . . . . . . . . .
XX
To allocate the cost of a plan or equipment
To adjust for accrued expense.
asset over its useful life.
Unearned Revenue . . . . . . . . . . . . . . . . . . . .
XX
Revenue . . . . . . . . . . . . . . . . . . . . . . . . . . .
XX
To adjust unearned amounts for amount earned.
LO3 – Prepare an adjusted trial balance and explain its use.
The adjusted trial balance is prepared using the account balances in the general ledger a er ad-
jus ng entries have been posted. Debits must equal credits. The adjusted trial balance is used to
prepare the financial statements.
LO4 – Use an adjusted trial balance to prepare financial statements.
Financial statements are prepared based on adjusted account balances.
LO5 – Iden fy and explain the steps in the accoun ng cycle.
The steps in the accoun ng cycle are followed each accoun ng period in the recording and report-
ing of financial transac ons. The steps are:
1. Transac ons are analyzed and recorded in the general journal.
2. The journal entries in the general journal are posted to accounts in the general ledger.
3. An unadjusted trial balance is prepared to ensure total debits equal total credits.

128
Financial Accoun ng and Adjus ng Entries
4. The unadjusted account balances are analyzed, and adjus ng entries are journalized in the
general journal and posted to the general ledger.
5. An adjusted trial balance is prepared to prove the equality of debits and credits.
6. The adjusted trial balance is used to prepare financial statements.
7. Closing entries are journalized and posted.
8. Prepare a post-closing trial balance.
LO6 – Explain the use of and prepare closing entries and a post-closing trial bal-
ance.
A er the financial statements have been prepared, the temporary account balances (revenues,
expenses, and dividends) are transferred to retained earnings, a permanent account, via closing
entries. The result is that the temporary accounts will have a zero balance and will be ready to
accumulate transac ons for the next accoun ng period. The four closing entries are:
Revenue . . . . . . . . . . . . . . . . . . . . . . . . . . .
XX
Income Summary . . . . . . . . . . . . . . . .
XX
To close each revenue to the income summary.
Income Summary . . . . . . . . . . . . . . . . . . .
XX
Expense . . . . . . . . . . . . . . . . . . . . . . . .
XX
To close each expense to the income summary.
Income Summary . . . . . . . . . . . . . . . . . . .
XX
OR
Retained Earnings . . . . . . . . . . . . . . . . . .
XX
Retained Earnings . . . . . . . . . . . . . . .
XX
Income Summary . . . . . . . . . . . . . . . .
XX
To close a net income in income summary to
To close a net loss in income summary to
retained earnings.
retained earnings.
Retained Earnings . . . . . . . . . . . . . . . . . .
XX
Dividends . . . . . . . . . . . . . . . . . . . . . . .
XX
To close dividends to retained earnings.
The post-closing trial balance is prepared a er the closing entries have been posted to the gen-
eral ledger. The post-closing trial balance will contain only permanent accounts because all the
temporary accounts have been closed.
Discussion Ques ons
1. Explain the sequence of financial transac ons that occur con nuously during an accoun ng
me period. What is this sequence of ac vi es called?

Discussion Ques ons
129
2. Do you have to wait un l the opera ng cycle is complete before you can measure income
using the accrual basis of accoun ng?
3. What is the rela onship between the matching concept and accrual accoun ng? Are rev-
enues matched to expenses, or are expenses matched to revenues? Does it ma er one way
or the other?
4. What is the impact of the going concern concept on accrual accoun ng?
5. Iden fy three different categories of expenses.
6. What are adjus ng entries and why are they required?
7. Why are asset accounts like Prepaid Insurance adjusted? How are they adjusted?
8. How are plant and equipment asset accounts adjusted? Is the procedure similar to the
adjustment of other asset and liability accounts at the end of an accoun ng period?
9. What is a contra account and why is it used?
10. How are liability accounts like Unearned Repair Revenue adjusted?
11. Explain the term accruals. Give examples of items that accrue.
12. Why is an adjusted trial balance prepared?
13. How is the adjusted trial balance used to prepare financial statements?
14. List the eight steps in the accoun ng cycle.
15. Which steps in the accoun ng cycle occur con nuously throughout the accoun ng period?
16. Which steps in the accoun ng cycle occur only at the end of the accoun ng period? Explain
how they differ from the other steps.
17. Give examples of revenue, expense, asset, and liability adjustments.
18. In general, income statement accounts accumulate amounts for a me period not exceeding
one year. Why is this done?
19. Iden fy which types of general ledger accounts are temporary and which are permanent.
20. What is the income summary account and what is its purpose?
21. What is a post-closing trial balance and why is it prepared?

130
Financial Accoun ng and Adjus ng Entries
Exercises
EXERCISE 3–1
(LO1,2)
Adjus ng Entries
The following are account balances of Graham Corpora on:
Account Title
Amount in
Balance
Unadjusted
a er
Trial Balance
Adjustment
Interest Receivable
$ -0-
$110
Prepaid Insurance
1,800
600
Interest Payable
-0-
90
Salaries Payable
-0-
450
Unearned Rent
700
200
Required:
a. Enter the unadjusted balance for each account in the following T-accounts: Interest Receiv-
able, Prepaid Insurance, Interest Payable, Salaries Payable, Unearned Rent, Interest Earned,
Rent Earned, Insurance Expense, Interest Expense, and Salaries Expense.
b. Reconstruct the adjus ng entry that must have been recorded for each account.
c. Post these adjus ng entries and agree ending balances in each T-account to the adjusted
balances above.
d. List revenue and expense amounts for the period.
EXERCISE 3–2
(LO1,2)
Adjus ng Entries
The trial balance of Lauer Corpora on at December 31, 2015 follows, before and a er the pos ng
of adjus ng entries.

Exercises
131
Trial Balance
Adjustments
Adjusted
Trial Balance
Dr.
Cr.
Dr.
Cr.
Dr.
Cr.
Cash
$4,000
$4,000
Accounts Receivable
5,000
5,000
Prepaid Insurance
3,600
3,300
Prepaid Rent
1,000
500
Truck
6,000
6,000
Accumulated Deprecia on
$
-0-
$1,500
Accounts Payable
7,000
7,400
Salaries Payable
1,000
Unearned Rent
1,200
600
Share Capital
2,700
2,700
Revenue
25,000
25,000
Rent Earned
600
Adver sing Expense
700
700
Commissions Expense
2,000
2,000
Deprecia on Expense
1,500
Insurance Expense
300
Interest Expense
100
500
Rent Expense
5,500
6,000
Salaries Expense
8,000
9,000
Totals
$35,900
$35,900
$38,800
$38,800
Required:
a. Indicate in the “Adjustments” column the debit or credit difference between the unadjusted
trial balance and the adjusted trial balance.
b. Prepare in general journal format the adjus ng entries that have been recorded. Include
descrip ons.
EXERCISE 3–3
(LO1,2)
Adjus ng Entries
The following data are taken from an unadjusted trial balance at December 31, 2015:
Prepaid Rent
$ 600
Office Supplies
700
Income Taxes Payable
-0-
Unearned Commissions
1,500
Salaries Expense
5,000

132
Financial Accoun ng and Adjus ng Entries
Addi onal Informa on:
(a) The prepaid rent consisted of a payment for three months’ rent at $200 per month for Decem-
ber 2015, January 2016, and February 2016.
(b) Office supplies on hand at December 31, 2015 amounted to $300.
(c) The es mated income taxes for 2015 are $5,000.
(d) All but $500 in the Unearned Commissions account has been earned in 2015.
(e) Salaries for the last three days of December amoun ng to $300 have not yet been recorded.
Required:
a. Prepare all necessary adjus ng entries in general journal format.
b. Calculate the cumula ve financial impact on assets, liabili es, equity, revenue and expense
if these adjus ng entries are not made.
EXERCISE 3–4
(LO1,2)
Adjus ng Entries
The following are general ledger accounts extracted from the records of Bernard Inc. at December
31, 2015, its year-end (‘Bal’ = unadjusted balance):
Exercises
133
Prepaid Adver sing
Accounts Payable
Share Capital
Bal.
1,000
500
Bal.
15,000
Bal.
8,000
200
100
Subscrip on Revenue
Unused Supplies
400
5,000
Bal.
750
400
800
Adver sing Expense
Salaries Payable
500
Equipment
700
Bal.
21,750
Unearned Subscrip ons
Commissions Expense
Acc. Dep’n – Equipment
5,000
Bal.
10,000
800
Bal.
1,500
250
Dep’n Expense – Equipment
250
Maintenance Expense
200
Salaries Expense
Bal. 9,500
700
Supplies Expense
Bal. 2,500
400
Telephone Expense
100
U li es Expense
400
Required: Prepare in general journal format the adjus ng entries that were posted. Include plau-
sible descrip ons/narra ves for each adjustment.
EXERCISE 3–5
(LO1,2)
Adjus ng Entries
The following unadjusted accounts are extracted from the general ledger of A Corp. at December
31, 2015:

134
Financial Accoun ng and Adjus ng Entries
Truck
Deprecia on Expense – Truck
Acc. Dep’n – Truck
10,000
1,300
1,300
Addi onal Informa on: The truck was purchased January 1, 2015. It has an es mated useful life
of 4 years.
Required: Prepare the needed adjus ng entry at December 31, 2015.
EXERCISE 3–6
(LO1,2)
Adjus ng Entries
The following unadjusted accounts are taken from the records of B Corp. at December 31, 2015:
Bank Loan
Interest Expense
Interest Payable
12,000
1,100
100
Addi onal Informa on: The bank loan was received on January 1, 2015. It bears interest at 10 per
cent.
Required: Prepare the adjus ng entry at December 31, 2015.
EXERCISE 3–7
(LO1,2)
Adjus ng Entries
The following general ledger accounts and addi onal informa on are taken from the records of
Wolfe Corpora on at the end of its fiscal year, December 31, 2015.
Cash
101
Unused Supplies
173
Adver sing Exp.
610
Bal. 2,700
Bal.
700
Bal.
200
Accounts Receivable 110
Share Capital
320
Salaries Expense
656
Bal. 2,000
Bal.
3,800
Bal. 4,500
Prepaid Insurance
161
Repair Revenue
450
Telephone Expense
669
Bal. 1,200
Bal.
7,750
Bal.
250
Addi onal Informa on:
(a) The prepaid insurance is for a one-year policy, effec ve July 1, 2015.
(b) A physical count indicated that $500 of supplies is s ll on hand.

Exercises
135
(c) A $50 December telephone bill has been received but not yet recorded.
Required: Record all necessary adjus ng entries in general journal format.
EXERCISE 3–8
(LO2)
Adjus ng Entries
Below are descrip ons of various monthly adjus ng entries:
1. Adjus ng entry for revenue earned but not yet billed to the customer.
2. Adjus ng entry for cash received from a customer for revenue not yet earned.
3. Adjus ng entry for revenue earned that was originally received as cash in advance in the pre-
vious month.
4. Adjus ng entry for services received from a supplier, but not yet paid.
5. Adjus ng entry for cash paid to a supplier for repair services not yet received.
6. Adjus ng entry for repair services received that was originally paid as cash in advance to the
supplier in the previous month.
7. Adjus ng entry for salaries earned by employees, but not yet paid.
8. Adjus ng entry for annual deprecia on expense for equipment.
Required: For each descrip on above, iden fy the likely journal entry debit and credit account.
EXERCISE 3–9
(LO2)
Adjus ng Entries
Turner Empire Co. employs 65 employees. The employees are paid every Monday for work done
from the previous Monday to the end-of-business on Friday, or a 5-day work week. Each employee
earns $80 per day.
Required:
1. Calculate the total weekly payroll cost and the salary adjustment at March 31, 2016.
2. Prepare the adjus ng entry at March 31, 2016.
3. Prepare the subsequent cash entry on April 4, 2016.

136
Financial Accoun ng and Adjus ng Entries
EXERCISE 3–10
(LO1,2,3)
Adjus ng Entries
Below is a trial balance for Quer n Quick Fix Ltd. at October 31, 2016 with three sets of debit/credit
columns. The first set is before the October month-end adjus ng entries, and the third column is
a er the October month-end adjus ng entries.
Quer n Quick Fix Ltd.
Trial Balance
At October 31, 2016
Unadjusted Trial Balance
Adjustments
Adjusted Trial Balance
Debit
Credit
Debit
Credit
Debit
Credit
Accounts payable
$225,000
$225,500
Accounts receivable
$325,000
$395,000
Accrued salaries payable
5,000
9,500
Accumulated deprecia on, equipment
1,500
2,500
Adver sing expense
1,500
1,500
Cash
80,000
118,700
Deprecia on expense
800
1,800
Equipment
150,000
150,000
Land
150,000
150,000
Maintenance service expenses
1,000
1,000
Notes payable
210,000
210,000
Office supplies
5,000
5,000
Prepaid adver sing expenses
15,000
16,300
Rent expense
14,000
14,000
Retained earnings
37,800
37,800
Salaries expense
45,000
49,500
Service revenue
300,000
370,000
Share capital
10,000
10,000
Unearned service revenue
10,000
50,000
U li es expense
12,000
12,500
$799,300
$799,300
$915,300
$915,300
Required: Determine the differences for all the account balances and iden fy the most likely ad-
jus ng entries that would have been recorded in October to correspond to these differences.
EXERCISE 3–11
(LO3)
Prepare an Adjusted Trial Balance
A er Bernard Inc. completed its first year of opera ons on December 31, 2015, the following
adjusted account balances appeared in the general ledger.
Exercises
137
Prepaid Adver sing
Accounts Payable
Share Capital
1,000
13,250
8,000
Supplies
Subscrip on Revenue
750
5,000
Equipment
Salaries Payable
Adver sing Expense
21,750
700
500
Acc. Dep’n – Equipment
Unearned Subscrip ons
Commissions Expense
1,500
10,000
800
Dep’n Expense – Equipment
250
Maintenance Expense
200
Salaries Expense
10,200
Supplies Expense
2,500
Telephone Expense
100
U li es Expense
400
Required:Prepare an adjusted trial balance at December 31, 2015.
EXERCISE 3–12
(LO6)
Closing Entries
Below is the adjusted trial balance for Quefort Ltd. as at September 30, 2016:

138
Financial Accoun ng and Adjus ng Entries
Debit
Credit
Accounts payable
$ 23,250
Accounts receivable
$106,800
Accrued salaries payable
8,700
Accumulated deprecia on, building
200
Accumulated deprecia on, equipment
3,200
Adver sing expense
4,050
Building
111,000
Cash
87,300
Cash dividends
5,000
Deprecia on expense
2,380
Equipment
15,000
Income tax expense
4,500
Income taxes payable
4,500
Insurance expense
3,700
Interest expense
150
Interest payable
150
Repair expense
7,800
Notes payable
30,000
Office supplies
1,800
Prepaid insurance expense
12,790
Rent expense
22,500
Retained earnings
65,470
Salaries expense
41,700
Service revenue
276,000
Share capital
1,500
Shop supplies expense
750
Unearned service revenue
37,500
U li es expense
23,250
$450,470
$450,470
Required: Prepare the closing entries.
EXERCISE 3–13
(LO6)
Prepare Closing Entries and a Post-Closing Trial Balance
The following alphabe zed adjusted trial balance informa on is available for Willis Inc. at Decem-
ber 31, 2015. Assume all accounts have normal balances.

Exercises
139
Accounts Payable
$ 4,400
Accounts Receivable
3,600
Accumulated Deprecia on – Machinery
2,800
Accumulated Deprecia on – Warehouse
8,000
Bank Loan
47,600
Cash
12,000
Commissions Earned
20,000
Deprecia on Expense – Machinery
900
Deprecia on Expense – Warehouse
1,200
Dividends
14,000
Insurance Expense
1,800
Interest Expense
2,365
Interest Payable
1,200
Land
15,000
Machinery
20,000
Retained Earnings
36,000
Salaries Expense
33,475
Salaries Payable
1,970
Share Capital
52,100
Subscrip ons Revenue
17,630
Supplies
2,500
Supplies Expense
15,800
Unearned Fees
800
U li es Expense
2,860
Warehouse
67,000
Required: Prepare closing entries and a post-closing trial balance.

140
Financial Accoun ng and Adjus ng Entries
Problems
PROBLEM 3–1
(LO1,2)
Adjus ng Entries
The following unrelated accounts are extracted from the records of Meekins Limited at December
31, its fiscal year-end:
Balance
Unadjusted
Adjusted
(a)
Prepaid Rent
$
900
$
600
(b) Wages Payable
500
700
(c)
Income Taxes Payable
-0-
1,000
(d) Unearned Commissions Revenue
4,000
3,000
(e)
Other Unearned Revenue
25,000
20,000
(f)
Adver sing Expense
5,000
3,500
(g)
Deprecia on Expense – Equipment
-0-
500
(h) Supplies Expense
850
625
(i)
Truck Opera on Expense
4,000
4,500
Required: For each of the above unrelated accounts, prepare the most likely adjus ng entry in-
cluding plausible descrip on/narra ve.
PROBLEM 3–2
(LO1,2)
Adjus ng Entries
The unadjusted trial balance of Lukas Films Corpora on includes the following account balances at
December 31, 2015, its fiscal year-end. Assume all accounts have normal debit or credit balances
as applicable.
Prepaid Rent
$ 1,500
Unused Supplies
-0-
Equipment
2,400
Unearned Adver sing Revenue
1,000
Insurance Expense
900
Supplies Expense
600
Telephone Expense
825
Wages Expense
15,000
The following informa on applies at December 31:

Problems
141
a. A physical count of supplies indicates that $100 of supplies have not yet been used at December
31.
b. A $75 telephone bill for December has been received but not recorded.
c. One day of wages amoun ng to $125 remains unpaid and unrecorded at December 31; the
amount will be included with the first Friday payment in January.
d. The equipment was purchased December 1; it is expected to last 2 years. No deprecia on has
yet been recorded.
e. The prepaid rent is for three months: December 2015, January 2016, and February 2016.
f. Half of the unearned adver sing has been earned at December 31.
g. The $900 balance in Insurance Expense is for a one-year policy, effec ve August 1, 2015.
Required: Prepare all necessary adjus ng entries at December 31, 2015. Descrip ons are not
needed.
PROBLEM 3–3
(LO1,2)
Adjus ng Entries
The unadjusted trial balance of Mighty Fine Services Inc. includes the following account balances
at December 31, 2015, its fiscal year-end. No adjustments have been recorded. Assume all ac-
counts have normal debit or credit balances.
Notes Receivable
$10,000
Prepaid Rent
-0-
Prepaid Insurance
600
Unused Supplies
500
Bank Loan
5,000
Subscrip on Revenue
9,000
Rent Expense
3,900
Truck Opera on Expense
4,000
The following informa on applies to the fiscal year-end:
(a) Accrued interest of $250 has not yet been recorded on the Notes Receivable.
(b) The $600 prepaid insurance is for a one-year policy, effec ve September 1, 2015.
(c) A physical count indicates that $300 of supplies is s ll on hand at December 31.
(d) Interest on the bank loan is paid on the fi eenth day of each month; the unrecorded interest
for the last 15 days of December amounts to $25.

142
Financial Accoun ng and Adjus ng Entries
(e) The Subscrip on Revenue account consists of one $9,000 cash receipt for a 6-month subscrip-
on to the corpora on’s Computer Trends report; the subscrip on period began December 1,
2015.
(f) Three days of salary amoun ng to $300 remain unpaid and unrecorded at December 31.
(g) The rent expense account should reflect 12 months of rent. The monthly rent expense is $300.
(h) A bill for December truck opera on expense has not yet been received; an amount of $400 is
owed.
Required: Prepare all necessary adjus ng entries at December 31, 2015. Descrip ons are not
needed.
PROBLEM 3–4
(LO1,2)
Adjus ng Entries
The following accounts are taken from the records of Bill Pi Corp. at the end of its first 12 months
of opera ons ended December 31, 2015, prior to any adjustments.
In addi on to the balances in each set of accounts, addi onal data are provided for adjustment
purposes if applicable. Treat each set of accounts independently of the others.
Deprecia on
Truck
Expense – Truck
Acc. Dep’n – Truck
6,000
600
600
(a) Addi onal informa on: The truck was purchased July 1; it has an es mated useful life of 4
years.
Cash
Unearned Rent
Rent Earned
600
-0-
600
(b) Addi onal informa on: A part of the office was sublet during the en re 12 months for $50
per month.
Unused Supplies
Supplies Expense
1,250
(c) Addi onal informa on: A physical inventory indicated $300 of supplies s ll on hand at De-
cember 31.

Problems
143
Prepaid Rent
Rent Expense
1,200
4,400
(d) Addi onal informa on: The monthly rent is $400.
Wages Expense
Wages Payable
6,000
-0-
(e) Addi onal informa on: Unrecorded wages at December 31 amount to $250.
Bank Loan
Interest Expense
Interest Payable
8,000
600
100
(f) Addi onal informa on: The bank loan bears interest at 10 per cent. The money was borrowed
on January 1, 2015.
Cash
U li es Expense
U li es Payable
1,000
1,200
200
(g) Addi onal informa on: The December bill has not yet been received or any accrual made; the
amount owing at December 31 is es mated to be another $150.
Cash
Prepaid Insurance
Insurance Expense
1,200
600
600
(h) Addi onal informa on: A $1,200 one-year insurance policy had been purchased effec ve
February 1, 2015; there is no other insurance policy in effect.
Unearned Rent Revenue
Rent Earned
900
-0-
(i) Addi onal informa on: The Unearned Rent Revenue balance applies to three months: Novem-
ber 2015, December 2015, and January 2016. $600 of the $900 has been earned as at Decem-
ber 31, 2015.
Cash
Other Unearned Revenue
Commissions Earned
25,200
-0-
25,200
(j) Addi onal informa on: $2,000 of the total $25,200 balance in commission revenue has not
been earned at December 31, 2015.

144
Financial Accoun ng and Adjus ng Entries
Required: Prepare all necessary adjus ng entries. Include descrip ons/narra ves.
PROBLEM 3–5
(LO1,2,3)
Adjus ng Accounts
Roth Contractors Corpora on was incorporated on December 1, 2015 and had the following trans-
ac ons during December:
Part A
(a) Issued share capital for $5,000 cash.
(b) Paid $1,200 for three months’ rent: December 2015; January and February 2016.
(c) Purchased a used truck for $10,000 on credit (recorded as an account payable).
(d) Purchased $1,000 of supplies on credit. These are expected to be used during the month
(recorded as expense).
(e) Paid $1,800 for a one-year truck insurance policy, effec ve December 1.
(f) Billed a customer $4,500 for work completed to date.
(g) Collected $800 for work completed to date.
(h) Paid the following expenses: adver sing, $350; interest, $100; telephone, $75; truck opera-
on, $425; wages, $2,500.
(i) Collected $2,000 of the amount billed in (f) above.
(j) Billed customers $6,500 for work completed to date.
(k) Signed a $9,000 contract for work to be performed in January.
(l) Paid the following expenses: adver sing, $200; interest, $150; truck opera on, $375; wages,
$2,500.
(m) Collected a $2,000 advance on work to be done in January (the policy of the corpora on is to
record such advances as revenue at the me they are received).
(n) Received a bill for $100 for electricity used during the month (recorded as u li es expense).
Required:
1. Open general ledger T-accounts for the following: Cash (101), Accounts Receivable (110),
Prepaid Insurance (161), Prepaid Rent (162), Truck (184), Accounts Payable (210), Share Cap-
ital (320), Repair Revenue (450), Adver sing Expense (610), Interest Expense (632), Supplies
Expense (668), Telephone Expense (669), Truck Opera on Expense (670), U li es Expense
(676), and Wages Expense (677).

Problems
145
2. Prepare journal entries to record the December transac ons. Descrip ons are not needed.
3. Post the entries to general ledger T-accounts.
Part B
At December 31, the following informa on is made available for the prepara on of adjus ng en-
tries.
(o) One month of the Prepaid Insurance has expired.
(p) The December por on of the December 1 rent payment has expired.
(q) A physical count indicates that $350 of supplies is s ll on hand.
(r) The amount collected in transac on (m) is unearned at December 31.
(s) Three days of wages for December 29, 30, and 31 are unpaid; the unpaid amount of $1,500
will be included in the first Friday wages payment in January.
(t) The truck has an es mated useful life of 4 years.
Required:
4. Open addi onal general ledger T-accounts for the following: Supplies (173), Accumulated
Deprecia on – Truck (194), Wages Payable (237), Unearned Revenue (249), Deprecia on
Expense – Truck (624), Insurance Expense (631), and Rent Expense (654).
5. Prepare all necessary adjus ng entries. Omit descrip ons.
6. Post the entries to general ledger T-accounts and calculate balances.
7. Prepare an adjusted trial balance at December 31, 2015.
PROBLEM 3–6
(LO6)
Closing Accounts
Required:
1. Using the adjusted trial balance answer from Problem
, journalize the appropriate clos-
ing entries (create addi onal accounts if required).
2. Prepare a post-closing trial balance.

146
Financial Accoun ng and Adjus ng Entries
PROBLEM 3–7
(LO1,2,3,4,5,6)
Comprehensive Accoun ng Cycle Review Problem
The unadjusted trial balance of Packer Corpora on showed the following balances at the end of
its first 12-month fiscal year ended August 31, 2015:
Balance
Debits
Credits
Cash
$12,000
Accounts Receivable
3,600
Prepaid Insurance
-0-
Supplies
2,500
Land
15,000
Building
60,000
Furniture
3,000
Equipment
20,000
Accumulated Deprecia on – Building
$
-0-
Accumulated Deprecia on – Equipment
-0-
Accumulated Deprecia on – Furniture
-0-
Accounts Payable
4,400
Salaries Payable
-0-
Interest Payable
-0-
Unearned Commissions Revenue
1,200
Unearned Subscrip ons Revenue
800
Bank Loan
47,600
Share Capital
52,100
Retained Earnings
-0-
Income Summary
-0-
Commissions Earned
37,900
Subscrip ons Revenue
32,700
Adver sing Expense
4,300
Deprecia on Expense – Building
-0-
Deprecia on Expense – Equipment
-0-
Deprecia on Expense – Furniture
-0-
Insurance Expense
1,800
Interest Expense
2,365
Salaries Expense
33,475
Supplies Expense
15,800
U li es Expense
2,860
Totals
$176,700
$176,700
At the end of August, the following addi onal informa on is available:
(a) The company’s insurance coverage is provided by a single comprehensive 12-month policy

Problems
147
that began on March 1, 2015.
(b) Supplies on hand total $2,850.
(c) The building has an es mated useful life of 50 years.
(d) The furniture has an es mated useful life of ten years.
(e) The equipment has an es mated useful life of 20 years.
(f) Interest of $208 on the bank loan for the month of August will be paid on September 1, when
the regular $350 payment is made.
(g) A review of the unadjusted balance in the unearned commissions revenue account indicates
the unearned balance should be $450.
(h) A review of the unadjusted balance in the subscrip on revenue account reveals that $2,000
has not been earned.
(i) Salaries that have been earned by employees in August but are not due to be paid to them
un l the next payday (in September) amount to $325.
Required:
1. Set up necessary general ledger T-accounts and record their unadjusted balances. Create
and assign account numbers that you deem appropriate.
2. Prepare the adjus ng entries. Descrip ons are not needed.
3. Post the adjus ng entries to the general ledger T-accounts and calculate balances.
4. Prepare an adjusted trial balance at August 31, 2015.
5. Prepare an income statement and balance sheet.
6. Prepare and post the closing entries.
7. Prepare a post-closing trial balance.
PROBLEM 3–8
(LO1,2,3)
Challenge Ques on – Adjus ng Entries
Below is an unadjusted trial balance for Smith and Smith Co., at June 30, 2016.

148
Financial Accoun ng and Adjus ng Entries
Smith and Smith Co.
Unadjusted Trial Balance
At June 30, 2016
Debit
Credit
Cash
$ 50,400
Accounts receivable
25,000
Shop supplies
1,500
Prepaid insurance expense
4,500
Prepaid adver sing expense
2,000
Prepaid rent expense
–
Building
74,000
Accumulated deprecia on, building
$
–
Equipment
10,000
Accumulated deprecia on, equipment
2,000
Accounts payable
12,000
Accrued salaries payable
15,500
Interest payable
–
Income taxes payable
–
Notes payable
20,000
Unearned service revenue
30,000
Share capital
1,000
Retained earnings
24,900
Service revenue
125,000
Salaries expense
22,000
Insurance expense
–
Interest expense
–
Shop supplies expense
200
Adver sing expense
2,200
Deprecia on expense
1,400
Maintenance service expense
5,200
Rent expense
20,000
Income tax expense
–
U li es expense
12,000
$230,400
$230,400
Addi onal informa on for June not yet recorded:
a. Unbilled and uncollected work to June 30 totals $45,000.
b. An analysis of prepaid adver sing shows that $500 of the balance was consumed.
c. A shop supplies count on June 30 shows that $1,200 are on hand.
d. Equipment has an es mated useful life of ten years and an es mated residual value of $500.

Problems
149
e. The records show that fi y percent of the work, for a $10,000 fee received in advance from a
customer and recorded last month, is now completed.
f. Salaries of $5,800 for employees for work done to the end of June has not been paid.
g. U li es invoice for services to June 22 totals $3,500.
h. Accrued revenues of $7,800 previously recorded to accounts receivable were collected.
i. A building was purchased at the end of May. Its es mated useful life is fi y years and has an
es mated residual value of $10,000.
j. Rent expense of $5,000 cash for July has been paid and recorded directly to rent expense.
k. Interest for the 6% note payable has not yet been recorded for June.
l. Income taxes of $3,000 is owing but not yet paid.
m. Unrecorded and uncollected service revenue of $9,000 has been earned.
n. A two year, $1,800 insurance policy was purchased on June 1 and recorded to prepaid insurance
expense.
o. The prior balance in the unadjusted prepaid insurance account (excluding the insurance in item
n. above), shows that $300 of that balance is not yet used.
Required:
1. Prepare the adjus ng and correc ng entries for June.
2. Prepare an adjusted trial balance at June 30, 2016.
PROBLEM 3–9
(LO4)
Challenge Ques on – Prepara on of Financial Statements
Using the adjusted trial balance in PROBLEM
above:
Required: Prepare an income statement, statement of changes in equity and a balance sheet as
at June 30, 2016. (Hint: For the balance sheet, also include a subtotal for each asset’s book value).
PROBLEM 3–10
(LO6)
Closing Entries and Post-Closing Trial Balance
Required: Using the adjusted trial balance in PROBLEM
above:

150
Financial Accoun ng and Adjus ng Entries
a. Assuming that June 30, 2016, is the year-end, prepare the closing journal entries.
b. Prepare a post-closing trial balance at June 30, 2016.

Chapter 4
The Classified Balance Sheet and Related Disclosures
Chapters
through
discussed and illustrated the steps in the accoun ng cycle. They also dis-
cussed the concepts, assump ons, and procedures that provide a framework for financial account-
ing as a whole. Chapter
expands upon the content and presenta on of financial statements. It
reinforces what has been learned in previous chapters and introduces the classifica on or group-
ing of accounts on the balance sheet. Chapter
expands on notes to the financial statements,
the auditor’s report, and the management’s responsibility report which are all integral to mee ng
disclosure requirements.
Chapter 4 Learning Objec ves
LO1 – Explain the importance of and challenges related to basic financial statement disclo-
sure.
LO2 – Explain and prepare a classified balance sheet.
LO3 – Explain the purpose and content of notes to financial statements.
LO4 – Explain the purpose and content of the auditor’s report.
LO5 – Explain the purpose and content of the report that describes management’s respon-
sibility for financial statements.
Concept Self-Check
Use the following as a self-check while working through Chapter
1. What shapes and limits an accountant’s measurement of wealth?
2. Are financial statements primarily intended for internal or external users?
3. What is a classified balance sheet?
4. What are the classifica ons within a classified balance sheet?
5. What are current assets?
6. What are non-current assets?
7. What are current liabili es?
151

152
The Classified Balance Sheet and Related Disclosures
8. What are long-term liabili es?
9. What is the current-por on of a long-term liability?
10. What is the purpose and content of the notes to the financial statements?
11. What is the purpose and content of the auditor’s report?
12. What is the purpose and content of the report that describes management’s responsibility
for financial statements?
NOTE: The purpose of these ques ons is to prepare you for the concepts introduced in the chap-
ter. Your goal should be to answer each of these ques ons as you read through the chapter. If,
when you complete the chapter, you are unable to answer one or more the Concept Self-Check
ques ons, go back through the content to find the answer(s). Solu ons are not provided to these
ques ons.
4.1 Financial Statement Disclosure Decisions
LO1 – Explain the
importance
of
and
challenges
related to basic
financial
state-
ment disclosure.
Financial statements communicate informa on, with a focus on the needs
of financial statement users such as a company’s investors and creditors.
Accoun ng informa on should make it easier for management to allocate
resources and for shareholders to evaluate management. A key objec ve
of financial statements is to fairly present the en ty’s economic resources,
obliga ons, equity, and financial performance.
Fulfilling these objec ves is challenging. Accountants must make a number of subjec ve decisions
about how to apply generally accepted accoun ng principles. For example, they must decide how
to measure wealth and how to apply recogni on criteria. They must also make prac cal cost-
benefit decisions about how much informa on is useful to disclose. Some of these decisions are
discussed in the following sec on.
Making Accoun ng Measurements
Economists o en define wealth as an increase or decrease in the en ty’s ability to purchase goods
and services. Accountants use a more specific measurement — they consider only increases and
decreases resul ng from actual transac ons. If a transac on has not taken place, they do not
record a change in wealth.
The accountant’s measurement of wealth is shaped and limited by the generally accepted account-
ing principles introduced and discussed in Chapter
, including cost, the monetary unit, the busi-
ness en ty, meliness, recogni on, and going concern. These principles mean that accountants

4.1. Financial Statement Disclosure Decisions
153
record transac ons in one currency (for example, dollars). They assume the monetary currency
retains its purchasing power. Changes in market values of assets are generally not recorded. The
en ty is expected to con nue opera ng into the foreseeable future.
Economists, on the other hand, do recognize changes in market value. For example, if an en ty
purchased land for $100,000 that subsequently increased in value to $125,000, economists would
recognize a $25,000 increase in wealth. Interna onal Financial Repor ng Standards generally do
not recognize this increase un l the en ty actually disposes of the asset; accountants would con-
nue to value the land at its $100,000 purchase cost. This prac ce is based on the applica on of
the cost principle, which is a part of GAAP.
Economic wealth is also affected by changes in the purchasing power of the dollar. For example,
if the en ty has cash of $50,000 at the beginning of a me period and purchasing power drops
by 10% because of infla on, the en ty has lost wealth because the $50,000 can purchase only
$45,000 of goods and services. Conversely, the en ty gains wealth if purchasing power increases
by 10%. In this case, the same $50,000 can purchase $55,000 worth of goods and services. How-
ever, accountants do not record any changes because the monetary unit principle assumes that
the currency unit is a stable measure.
Quali es of Accoun ng Informa on
Financial statements are focused primarily on the needs of external users. To provide informa on
to these users, accountants make cost-benefit judgments. They use materiality considera ons
to decide how par cular items of informa on should be recorded and disclosed. For example,
if the costs associated with financial informa on prepara on are too high or if an amount is not
sufficiently large or important, a business might implement a materiality policy for various types of
asset purchases to guide how such costs are to be recorded. For example, a business might have
a materiality policy for the purchase of office equipment whereby anything cos ng $100 or less
is expensed immediately instead of recorded as an asset. In this type of situa on, purchases of
$100 or less are recorded as an expense instead of an asset to avoid having to record deprecia on
expense, a cost-benefit considera on that will not impact decisions made by external users of the
business’s financial statements.
Accountants must also make decisions based on whether informa on is useful. Is it comparable to
prior periods? Is it verifiable? Is it presented with clarity and conciseness to make it understand-
able? Readers’ percep on of the usefulness of accoun ng informa on is determined by how well
those who prepare financial statements address these qualita ve considera ons.

154
The Classified Balance Sheet and Related Disclosures
4.2 Classified Balance Sheet
LO2
–
Explain
and prepare a
classified balance
sheet.
The accoun ng cycle and double-entry accoun ng have been the focus
of the preceding chapters. This chapter focuses on the presenta on of
financial statements, including how financial informa on is classified (the
way accounts are grouped) and what is disclosed.
A common order for the presenta on of financial statements is:
1. Income statement
2. Statement of changes in equity
3. Balance sheet
4. Statement of cash flows
5. Notes to the financial statements
In addi on, the financial statements are o en accompanied by an auditor’s report and a state-
ment en tled “Management’s Responsibility for Financial Statements.” Each of these items will
be discussed below. Financial statement informa on must be disclosed for the most recent year
with the prior year for comparison.
Because external users of financial statements have no access to the en ty’s accoun ng records, it
is important that financial statements be organized in a manner that is easy to understand. Thus,
financial data are grouped into useful, similar categories within classified financial statements, as
discussed below.
The Classified Balance Sheet
A classified balance sheet organizes the asset and liability accounts into categories. The previous
chapters used an unclassified balance sheet which included only three broad account groupings:
assets, liabili es, and equity. The classifica on of asset and liability accounts into meaningful
categories is designed to facilitate the analysis of balance sheet informa on by external users.
Assets and liabili es are classified as either current or non-current. Another common term for
non-current is long-term. Non-current assets, also referred to as long-term assets, can be classified
further into long-term investments; property, plant and equipment; and intangible assets. The
asset and liability classifica ons are summarized below:

4.2. Classified Balance Sheet
155
Assets
Liabili es
Non-current or long-term assets:
Non-current or long-term liabili es
Long-term investments
Property, plant and equipment (PPE)
Intangible assets
Current Assets
Current assets are those resources that the en ty expects to convert to cash, or to consume during
the next year or within the opera ng cycle of the en ty, whichever is longer. Examples of current
assets include:
• cash, comprising paper currency and coins, deposits at banks, cheques, and money orders.
• short-term investments, the investment of cash that will not be needed immediately, in
short-term, interest-bearing notes that are easily conver ble into cash.
• accounts receivable that are due to be collected within one year.
• notes receivable, usually formalized account receivables — wri en promises to pay specified
amounts with interest, and due to be collected within one year.
• merchandise inventory that is expected to be sold within one year.
The current asset category also includes accounts whose future benefits are expected to expire in
a short period of me. These are not expected to be converted into cash, and include:
• prepaid expenses that will expire within the next year, usually consis ng of advance pay-
ments for insurance, rent, and other similar items.
• supplies on hand at the end of an accoun ng year that will be used during the next year.
On the balance sheet, current assets are normally reported before non-current assets. They are
listed by decreasing levels of liquidity — their ability to be converted into cash. Therefore, cash
appears first under the current asset heading since it is already liquid.

156
The Classified Balance Sheet and Related Disclosures
Non-current Assets
Non-current assets are assets that will be useful for more than one year; they are some mes
referred to as long-lived assets. Non-current assets include property, plant, and equipment (PPE)
items used in the opera ons of the business. Some examples of PPE are: a) land, b) buildings, c)
equipment, and d) motor vehicles such as trucks.
Other types of non-current assets include long-term investments and intangible assets. Long-term
investments are held for more than one year or the opera ng cycle and include long-term notes
receivable and investments in shares and bonds. Intangible assets are resources that do not have
a physical form and whose value comes from the rights held by the owner. They are used over the
long term to produce or sell products and services and include copyrights, patents, trademarks,
and franchises.
Current Liabili es
Current liabili es are obliga ons that must be paid within the next 12 months or within the en ty’s
next opera ng cycle, whichever is longer. They are shown first in the liabili es sec on of the
balance sheet and listed in order of their due dates, with any bank loans shown first. Examples of
current liabili es include:
• bank loans (or notes payable) that are payable on demand or due within the next 12 months
• accounts payable
• accrued liabili es such as interest payable and wages payable
• unearned revenue
• the current por on of long-term liabili es
• income taxes payable.
The current por on of a long-term liability is the principal amount of a long-term liability that
is to be paid within the next 12 months. For example, assume a $24,000 note payable issued on
January 1, 2015 where principal is repaid at the rate of $1,000 per month over two years. The
current por on of this note on the January 31, 2015 balance sheet would be $12,000 (calculated
as 12 months X $1,000/month). The remaining principal would be reported on the balance sheet
as a long-term liability.
Non-Current or Long-Term Liabili es
Non-current liabili es, also referred to as long-term liabili es, are borrowings that do not require
repayment for more than one year, such as the long-term por on of a bank loan or a mortgage. A
mortgage is a liability that is secured by real estate.
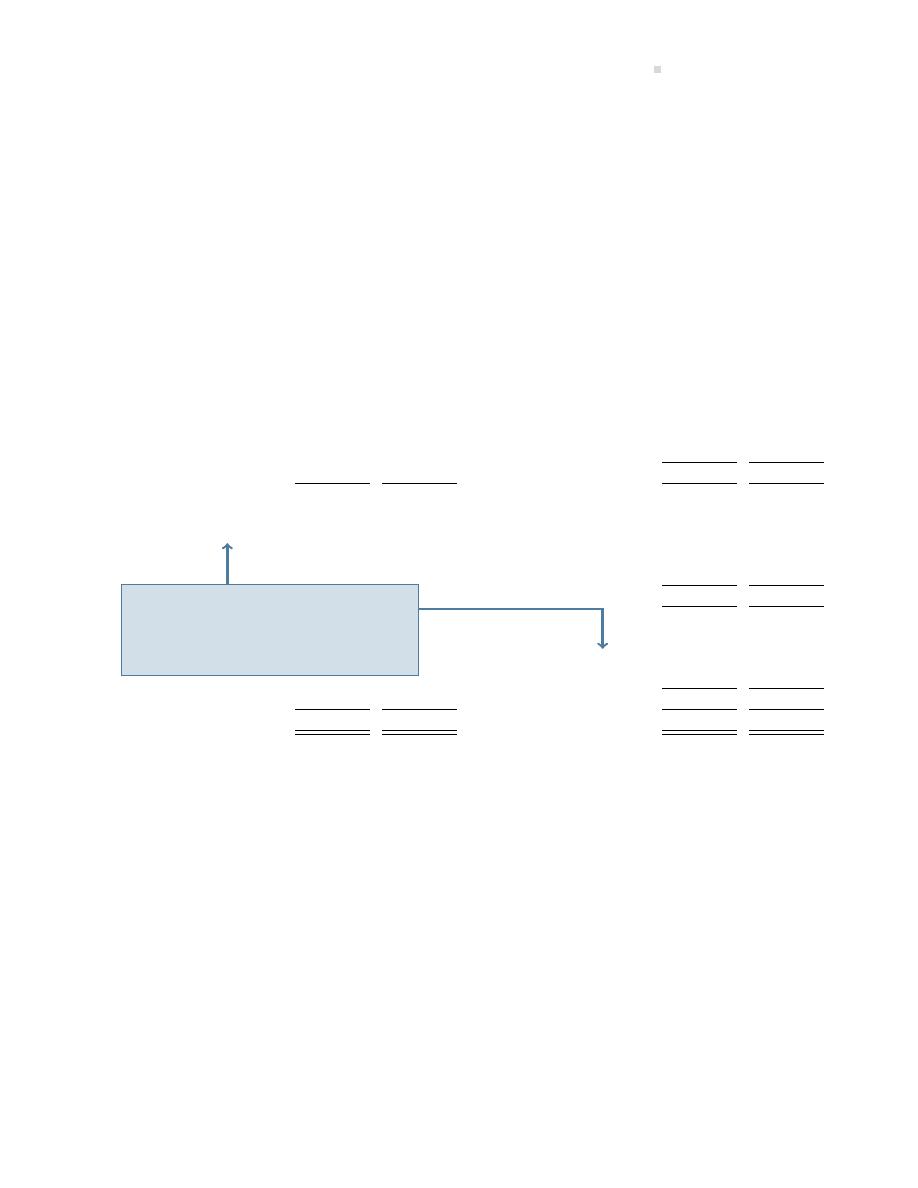
4.2. Classified Balance Sheet
157
Equity
The equity sec on of the classified balance sheet consists of two major accounts: share capital
and retained earnings.
The following illustrates the presenta on of Big Dog Carworks Corp.’s classified balance sheet a er
several years of opera on.
Big Dog Carworks Corp.
Balance Sheet
At December 31, 2018
Assets
Liabili es
2018
2017
2018
2017
Current assets
Current liabili es
Cash
$ 10,800
$ 12,000
Borrowings (Note 5)
$ 39,000
$ 82,250
Accounts receivable
26,000
24,000
Accounts payable
24,000
22,000
Merchandise inventories
120,000
100,000
Income taxes payable
15,000
10,000
Prepaid expenses
1,200
570
Total current liabili es
$ 78,000
$114,250
Total current assets
$158,000
$136,570
Property, plant, and
equipment (Note 4)
126,645
10,430
Long-term liabili es
Borrowings (Note 5)
163,145
-0-
Total liabili es
$241,145
$114,250
Equity
Share capital (Note 6)
$ 11,000
$ 11,000
Retained earnings
32,500
21,750
Total equity
43,500
32,750
Total assets
$284,645
$147,000
Total liabili es and equity $284,645
$147,000
Notes are included at the end of the
financial statements. Among other pur-
poses, they provide details about a par-
cular category on the balance sheet or
income statement.
The balance sheet can be presented in the account form balance sheet, as shown above where
liabili es and equi es are presented to the right of the assets. An alterna ve is the report form
balance sheet where liabili es and equity are presented below the assets.
The Classified Income Statement
Recall that the income statement summarizes a company’s revenues less expenses over a period
of me. An income statement for BDCC was presented in Chapter
as copied below.
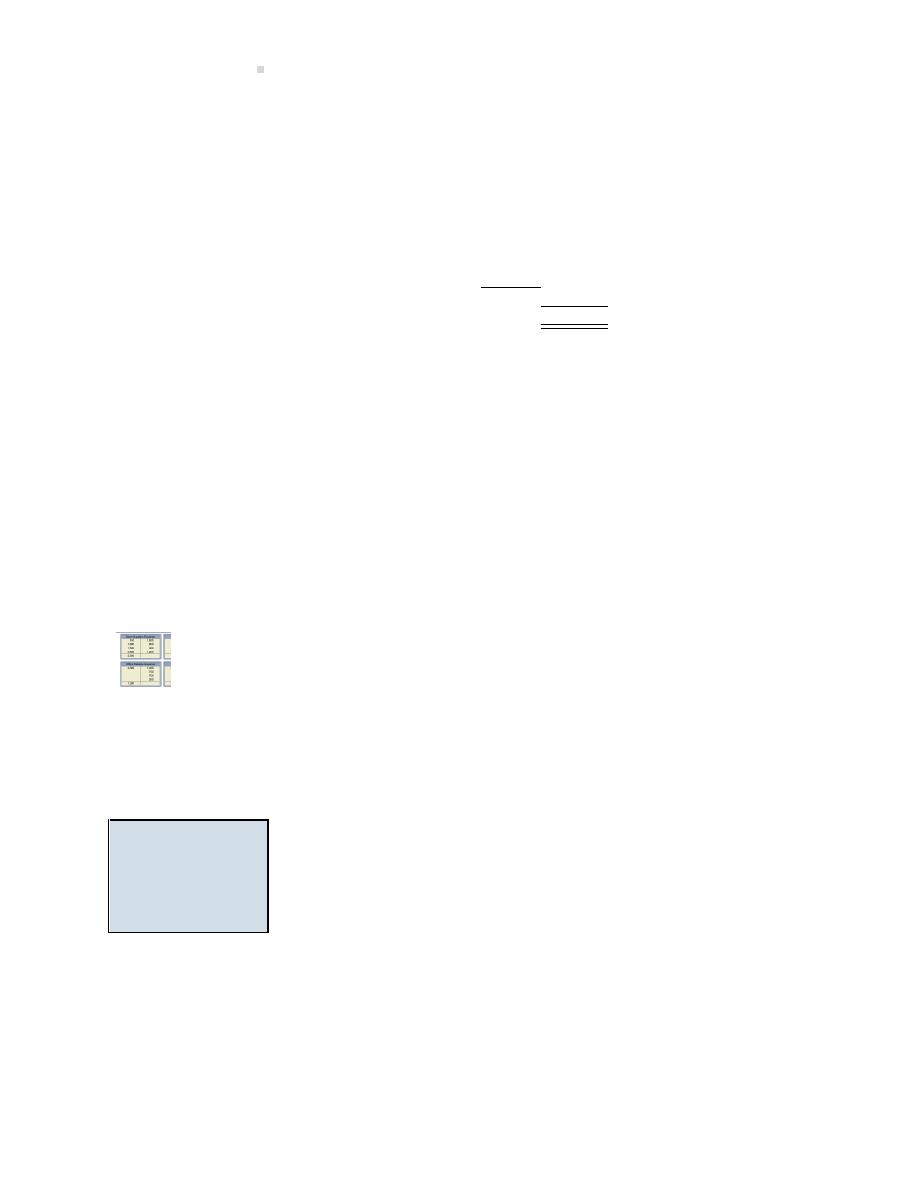
158
The Classified Balance Sheet and Related Disclosures
Big Dog Carworks Corp.
Income Statement
For the Month Ended January 31, 2015
Revenues
Repair revenues
$10,000
Expenses
Rent expense
$1,600
Salaries expense
3,500
Supplies expense
2,000
Fuel expense
700
Total expenses
7,800
Net income
$2,200
The format used above was sufficient to disclose relevant financial informa on for Big Dog’s simple
start-up opera ons. Like the classified balance sheet, an income statement can be classified as well
as prepared with compara ve informa on. The classified income statement will be discussed in
detail in Chapter
Regardless of the type of financial statement, any items that are material must be disclosed sepa-
rately so users will not otherwise be misled. Materiality is a ma er for judgment. Office supplies
of $2,000 per month used by BDCC in January 2015 might be a material amount and therefore
disclosed as a separate item on the income statement for the month ended January 31, 2015. If
annual revenues grew to $1 million, $2,000 per month for supplies might be considered immate-
rial. These expenditures would then be grouped with other similar items and disclosed as a single
amount.
An explora on is available on the Lyryx site. Log into your Lyryx course to run
4.3 Notes to Financial Statements
LO3
–
Explain
the
purpose
and content of
notes to financial
statements.
As an integral part of its financial statements, a company provides notes
to the financial statements. In accordance with the disclosure principle,
notes to the financial statements provide relevant details that are not in-
cluded in the body of the financial statements. For instance, details about
property, plant, and equipment are shown in Note 4 in the following sam-
ple notes to the financial statements. The notes help external users un-
derstand and analyze the financial statements.
Although a detailed discussion of disclosures that might be included as part of the notes is beyond
the scope of an introductory financial accoun ng course, a simplified example of note disclosure
is shown below for Big Dog Carworks Corp.
Big Dog Carworks Corp.

4.3. Notes to Financial Statements
159
Notes to the Financial Statements
For the Year Ended December 31, 2018
1. Nature of opera ons
The principal ac vity of Big Dog Carworks Corp. is the servicing and repair of vehicles.
2. General informa on and statement of compliance with IFRS
Big Dog Carworks Corp. is a limited liability company incorporated and domiciled in Canada.
Its registered office and principal place of business is 123 Fox Street, Owlseye, Alberta, T1K
0L1, Canada. Big Dog Carworks Corp.’s shares are listed on the Toronto Stock Exchange.
The financial statements of Big Dog Carworks Inc. have been prepared in accordance with
Interna onal Financial Repor ng Standards (IFRS) as issued the Interna onal Accoun ng
Standards Boards (IASB).
The financial statements for the year ended December 31, 2018 were approved and autho-
rised for issue by the board of directors on March 17, 2019.
3. Summary of accoun ng policies
The financial statements have been prepared using the significant accoun ng policies and
measurement bases summarized below.
(a) Revenue
Revenue arises from the rendering of service. It is measured by reference to the fair
value of considera on received or receivable.
(b) Opera ng expenses
Opera ng expenses are recognized in the income statement upon u liza on of the
service or at the date of their origin.
(c) Borrowing costs
Borrowing costs directly a ributable to the acquisi on, construc on, or produc on of
property, plant, and equipment are capitalized during the period of me that is neces-
sary to complete and prepare the asset for its intended use or sale. Other borrowing
costs are expensed in the period in which they are incurred and reported as interest
expense.
(d) Property, plant, and equipment
Land held for use in produc on or administra on is stated at cost. Other property,
plant, and equipment are ini ally recognized at acquisi on cost plus any costs directly
a ributable to bringing the assets to the loca ons and condi ons necessary to be em-
ployed in opera ons. They are subsequently measured using the cost model: cost less
subsequent deprecia on.
Deprecia on is recognized on a straight-line basis to write down the cost, net of es -
mated residual value. The following useful lives are applied:
Buildings: 25 years
Equipment: 10 years
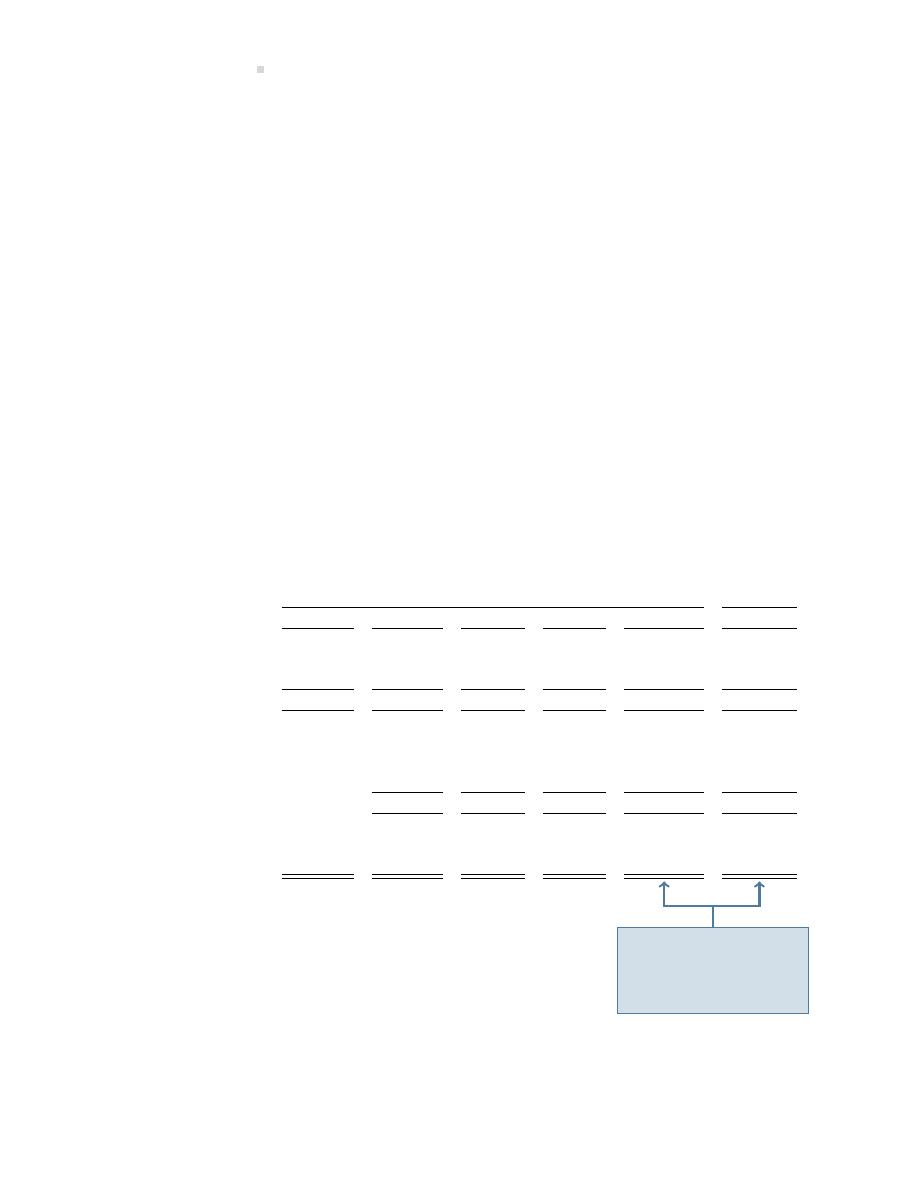
160
The Classified Balance Sheet and Related Disclosures
Truck: 5 years
Residual value es mates and es mates of useful life are updated at least annually.
(e) Income taxes
Current income tax liabili es comprise those obliga ons to fiscal authori es rela ng
to the current or prior repor ng periods that are unpaid at the repor ng date. Calcu-
la on of current taxes is based on tax rates and tax laws that have been enacted or
substan vely enacted by the end of the repor ng period.
(f) Share capital
Share capital represents the nominal value of shares that have been issued.
(g) Es ma on uncertainty
When preparing the financial statements, management undertakes a number of judg-
ments, es mates, and assump ons about the recogni on and measurement of assets,
liabili es, income, and expenses. Informa on about es mates and assump ons that
have the most significant effect on recogni on and measurement of assets, liabili es,
income, and expenses is provided below. Actual results may be substan ally different.
4. Property, plant, and equipment
Details of the company’s property, plant, and equipment and their carrying amounts at De-
cember 31 are as follows:
2018
2017
Land
Building
Equip.
Truck
Total
Total
Gross Carrying Amount
Balance, January 1
$
-0-
$
-0-
$3,000
$8,000
$ 11,000
$11,000
Addi ons
30,000
90,000
120,000
Balance, January 31
30,000
90,000
3,000
8,000
131,000
11,000
Deprecia on
Balance, January 1
-0-
90
480
570
285
Deprecia on for year
3,500
45
240
3,785
285
Balance, December 31
3,500
135
720
4,355
570
Carrying Amount
December 31
$30,000
$86,500
$2,865
$7,280
$126,645
$ 10,430
These amounts agree
to the amount of PPE
shown in the assets sec-
on of BDCC’s balance
sheet.
5. Borrowings
Borrowings include the following financial liabili es measured at cost:

4.4. Auditor’s Report
161
Current
Non-Current
2018
2017
2018
2017
Demand bank loan
$ 20,000
$ 52,250
$ -0-
$ -0-
Subordinated shareholder loan
13,762
30,000
-0-
-0-
Mortgage
5,238
-0-
163,145
-0-
Total carrying amount
$39,000
$82,250
$163,145
$ -0-
The bank loan is due on demand and bears interest at 6% per year. It is secured by accounts
receivable and inventories of the company.
The shareholder loan is due on demand, non-interest bearing, and unsecured.
The mortgage is payable to First Bank of Capitalville. It bears interest at 5% per year and
is amor zed over 25 years. Monthly payments including interest are $960. It is secured by
land and buildings owned by the company. The terms of the mortgage will be re-nego ated
in 2021.
6. Share capital
The share capital of Big Dog Carworks Corp. consists of fully-paid common shares with a
stated value of $1 each. All shares are eligible to receive dividends, have their capital repaid,
and represent one vote at the annual shareholders’ mee ng. There were no shares issued
during 2017 or 2018.
4.4 Auditor’s Report
LO4 – Explain the
purpose and con-
tent of the audi-
tor’s report.
Financial statements are o en accompanied by an auditor’s report. An
audit is an external examina on of a company’s financial statement infor-
ma on and its system of internal controls.
Internal controls are the processes ins tuted by management of a com-
pany to direct, monitor, and measure the accomplishment of its objec-
ves. This includes the preven on and detec on of fraud and error. An au-
dit seeks not certainty, but reasonable assurance that the financial state-
ment informa on is not materially misstated.
The auditor’s report is a structured statement issued by an independent examiner, usually a pro-
fessional accountant, who is contracted by the company to report the audit’s findings to the com-
pany’s board of directors. An audit report provides some assurance to present and poten al in-
vestors and creditors that the company’s financial statements are trustworthy. Therefore, it is a
useful means to reduce the risk of their financial decisions.
An example of an unqualified auditor’s report for BDCC is shown below, along with a brief descrip-
on of each component. Put in simple terms, an unqualified auditor’s report indicates that the
financial statements are truthful and a qualified auditor’s report is one that indicates the financial
statements are not or may not be truthful.

162
The Classified Balance Sheet and Related Disclosures
INDEPENDENT AUDITOR’S REPORT
The Board of Directors of Big Dog Carworks Corp.
Owiseye, Alberta
I have audited the accompanying financial statements of Big Dog Carworks
Corp., which comprise the balance sheet as at December 31, 2018, the in-
come statement, statement of changes in equity, and statement of cash
flows for the year then ended, and a summary of significant accoun ng
policies and other explanatory informa on.
Management Responsibility for the Financial Statements
Management is responsible for the prepara on and fair presenta on of
these financial statements in accordance with Canadian generally accepted
accoun ng principles, and for such internal control as management deter-
mines is necessary to enable the prepara on of financial statements that
are free from material misstatement, whether due to fraud or error.
Auditor’s Responsibility
My responsibility is to express an opinion on the financial statements based
on my audit. I conducted my audit in accordance with Canadian generally
accepted audi ng standards. Those standards require that I comply with
ethical requirements, and plan and perform the audit to obtain reasonable
assurance about whether the financial statements are free from material
misstatement.
An audit involves performing procedures to obtain audit evidence about
the amounts and disclosures in the financial statements. The procedures
selected depend on the auditor’s judgement, including assessment of the
risks of material misstatement of the financial statements, whether due to
fraud or error. In making those risk assessments, the auditor considers in-
ternal control relevant to the en ty’s prepara on and fair presenta on of
the financial statements in order to design audit procedures that are ap-
propriate in the circumstances, but not for the purpose of expressing an
opinion on the effec veness of the en ty’s internal control. An audit also
includes evalua on of the appropriateness of accoun ng policies used and
the reasonableness of accoun ng es mates made by management, as well
as evalua ng the overall presenta on of the financial statement.
I believe that the audit evidence I have obtained is sufficient and appropriate
to provide a basis for my audit opinion.
Opinion
In my opinion, the financial statements present fairly, in all material aspects,
the financial posi on of Big Dog Carworks Corp. as at December 31, 2018,
and its financial performance and its cash flows for the year then ended in
accordance with Canadian generally accepted accoun ng principles.
(signed)
H. K. Walker, CPA
March 15, 2019
Anywhereville, AB
The audit report is addressed to
the board.
The audited informa on is de-
scribed.
Management’s responsibili es are
described.
The auditor’s responsibili es
and the audit standards are de-
scribed.
The audit procedures are de-
scribed in general terms.
A conclusion about the adequacy
of audit evidence is stated.
An opinion is expressed about
the financial statement informa-
on.
The report is signed by the audi-
tor and dated.
The auditor’s independence from
the company is stated.

4.5. Management’s Responsibility for Financial Statements
163
4.5 Management’s Responsibility for Financial Statements
LO5 – Explain the
purpose and con-
tent of the report
that
describes
management’s
responsibility
for
financial
statements.
The final piece of informa on o en included with the annual financial
statements is a statement describing management’s responsibility for the
accurate prepara on and presenta on of financial statements. This state-
ment underscores the division of du es involved with the publica on of fi-
nancial statements. Management is responsible for preparing the financial
statements, including es mates that underlie the accoun ng numbers. An
example of an es mate is the useful life of long-lived assets in calcula ng
deprecia on.
The independent auditor is responsible for examining the financial statement informa on as pre-
pared by management, including the reasonableness of es mates, and then expressing an opin-
ion on their accuracy. In some cases, the auditor may assist management with aspects of financial
statement prepara on. For instance, the auditor may provide guidance on how a new accoun ng
standard will affect financial statement presenta on or other informa on disclosure. Ul mately,
however, the prepara on of financial statements is management’s responsibility.
An example of a statement describing management’s responsibility for the prepara on and pre-
senta on of annual financial statements is shown below.
MANAGEMENT’S RESPONSIBILITY FOR FINANCIAL STATEMENTS
The accompanying financial statements of the company are the responsi-
bility of management. The financial statements were prepared by man-
agement in accordance with accoun ng principles generally accepted in
Canada, applied on a consistent basis, and conform in all material respects
with Interna onal Accoun ng Standards. The significant accoun ng poli-
cies, which management believes are appropriate for the company, are
described in Note 3 to the financial statements.
Management is responsible for the integrity and objec vity of the finan-
cial statements. Es mates are necessary in the prepara on of these state-
ments and, based on careful judgements, have been properly reflected.
Management has established systems of internal control that are designed
to provide reasonable assurance that assets are safeguarded from loss
or unauthorized use, and to produce reliable accoun ng records for the
prepara on of financial informa on.
Management’s responsibility for
all aspects of financial statement
presenta on and disclosure is
expressly stated.
Management’s responsibility for
es mates used and maintenance
of internal controls is acknowl-
edged.

164
The Classified Balance Sheet and Related Disclosures
The board of directors is responsible for ensuring that management fulfills
its responsibili es for financial repor ng and internal control. The audit
commi ee of the board, which is comprised solely of directors who are not
employees of the company, is appointed by the board of directors annually.
The audit commi ee of the board meets regularly with financial manage-
ment of the company and with the shareholders’ independent auditor to
discuss internal controls, audit ma ers, including audit scope and auditor
remunera on, and financial repor ng issues. The independent sharehold-
ers’ auditor has unrestricted access to the audit commi ee. The audit com-
mi ee reviews the annual financial statements and repor ng to the board,
and makes recommenda ons with respect to their acceptance. The audit
commi ee also makes recommenda ons to the board with respect to the
appointment and remunera on of the company’s auditor.
Management recognizes its responsibility for conduc ng the company’s af-
fairs in compliance with established financial standards and applicable laws,
and maintains proper standards of conduct for its ac vi es.
(signed)
Bill Brown II, Chief Financial Officer
March 3, 2019
The board of directors’ and audit
commi ee’s respec ve roles are
explained.
Management acknowledges its
obliga on to oversee all aspects
of the company’s opera ons in a
legal and ethical manner.
The officer responsible for the
financial affairs of the company
signs and dates the statement.
Summary of Chapter 4 Learning Objec ves
LO1 – Explain the importance of and challenges related to basic financial state-
ment disclosure.
The objec ve of financial statements is to communicate informa on to meet the needs of external
users. In addi on to recording and repor ng verifiable financial informa on, accountants make
decisions regarding how to measure transac ons. Applying GAAP can present challenges when
judgment must be applied as in the case of cost-benefit decisions and materiality.
LO2 – Explain and prepare a classified balance sheet.
A classified balance sheet groups assets and liabili es as follows:

Summary of Chapter
Learning Objec ves
165
Assets:
Liabili es:
Current assets
Current liabili es
Non-current assets:
• Property, plant, and equipment
• Long-term investments
• Intangible assets
Non-current or long-term liabili es
Current assets are those that are used within one year or one opera ng cycle, whichever is longer,
and include cash, accounts receivables, and supplies. Non-current assets are used beyond one
year or one opera ng cycle. There are three types of non-current assets: property, plant, and
equipment (PPE), long-term investments, and intangible assets. Long-term investments include
investments in shares and bonds. Intangible assets are rights held by the owner and do not have
a physical substance; they include copyrights, patents, franchises, and trademarks. Current liabili-
es must be paid within one year or one opera ng cycle, whichever is longer. Long-term liabili es
are paid beyond one year or one opera ng cycle. Income statements are also classified (discussed
in Chapter
LO3 – Explain the purpose and content of notes to financial statements.
In accordance with the GAAP principle of full disclosure, relevant details not contained in the body
of financial statements are included in the accompanying notes to financial statements. Notes
would include a summary of accoun ng policies, details regarding property, plant, and equipment
assets, and specifics about liabili es such as the interest rates and repayment terms.
LO4 – Explain the purpose and content of the auditor’s report.
An audit as it relates to the auditor’s report is an external examina on of a company’s financial
statement informa on and its system of internal controls. Internal controls are the processes in-
s tuted by management of a company to direct, monitor, and measure the accomplishment of its
objec ves including the preven on and detec on of fraud and error. The auditor’s report provides
some assurance that the financial statements are trustworthy. In simple terms, an unqualified au-
ditor’s report indicates that the financial statements are truthful and a qualified auditor’s report
is one that indicates the financial statements are not or may not be truthful.

166
The Classified Balance Sheet and Related Disclosures
LO5 – Explain the purpose and content of the report that describes manage-
ment’s responsibility for financial statements.
This report makes a statement describing management’s responsibility for the accurate prepara-
on and presenta on of financial statements.
Discussion Ques ons
Refer to the Big Dog Carworks Corp. financial statements for the year ended December 31, 2018
and other informa on included in this chapter to answer the following ques ons.
1. Iden fy the economic resources of Big Dog Carworks Corp. in its financial statements.
2. What comprise the financial statements of BDCC?
3. Why does BDCC prepare financial statements?
4. From the balance sheet at December 31, 2018 extract the appropriate amounts to complete
the following accoun ng equa on:
ASSETS = LIABILITIES + EQUITY
5. If ASSETS
− LIABILITIES = NET ASSETS, how much is net assets at December 31, 2018? Is
net assets synonymous with equity?
6. What types of assets are reported by Big Dog Carworks Corp.? What types of liabili es?
7. What kind of assump ons is made by Big Dog Carworks Corp. about asset capitalisa on?
Over what periods of me are assets being amor zed?
8. What adjustments might management make to the financial informa on when preparing
the annual financial statements? Consider the following categories:
a. Current asset accounts.
b. Non-current asset accounts.
c. Current liability accounts.
d. Non-current liability accounts.
Indicate several examples in each category. Use the BDCC balance sheet and notes 3 and 5
for ideas.
9. What are the advantages of using a classified balance sheet? Why are current accounts
shown before non-current ones on BDCC’s balance sheet?

Exercises
167
10. How does Big Dog Carworks Corp. make it easier to compare informa on from one me
period to another?
11. Who is the auditor of BDCC? What does the auditor’s report tell you about BDCC’s financial
statements? Does it raise any concerns?
12. What does the auditor’s report indicate about the applica on of generally accepted account-
ing principles in BDCC’s financial statements?
13. What is BDCC management’s responsibility with respect to the company’s financial state-
ments? Do the financial statements belong to management? the auditor? the board of
directors? shareholders?
Exercises
EXERCISE 4–1
(LO2)
Classified Balance Sheet
The following accounts and account balances are taken from the records of Joyes Enterprises Ltd.
at December 31, 2016, its fiscal year-end.
Dr.
Cr.
Accounts Receivable
$8,000
Accounts Payable
$7,000
Accumulated Deprecia on – Buildings
1,000
Accumulated Deprecia on – Equipment
4,000
Bank Loan (due 2017)
5000
Buildings
25,000
Cash
2,000
Dividends Declared
1,000
Equipment
20,000
Income Tax Payable
3,000
Land
5,000
Merchandise Inventory
19,000
Mortgage Payable (due 2019)
5,000
Prepaid Insurance
1,000
Share Capital
48,000
Retained Earnings, Jan. 1 2016
-0-
2,000
Totals
$81,000
$75,000
Net Income
-0-
6,000
Totals
-0-
-0-

168
The Classified Balance Sheet and Related Disclosures
Required:
a. Using the above informa on, prepare a classified balance sheet.
b. Does Joyes Enterprises Ltd. have sufficient resources to meet its obliga ons in the upcoming
year?
c. Calculate the propor on of shareholders’ to creditors’ claims on the assets of Joyes.
EXERCISE 4–2
(LO2,3)
Classified Balance Sheet
The following balance sheet was prepared for Abbey Limited:
Abbey Limited
Balance Sheet
As at November 30, 2015
Assets
Liabili es
Current
Current
Cash
$1,000
Accounts Payable
$5,600
Accounts Receivable
6,000
Notes Payable (due 2016)
2,000
Building
12,000
Bank Loan (due 2022)
1,000
Merchandise Inventory
3,000
Total Current Liabili es
$8,600
Total Current Assets
$22,000
Non-current
Non-current
Short-Term Investments
3,000
Mortgage Payable (due 2023)
7,000
Equipment
1,500
Retained Earnings
1,000
Unused Office Supplies
100
Salaries Payable
250
Truck
1,350
Total Non-current Liabili es
8,250
Total Non-current Assets
5,950
Total Liabili es
16,850
Equity
Share Capital
11,100
Total Assets
$27,950
Total Liabili es and Assets
$27,950
Required:
a. Iden fy the errors that exist in the balance sheet of Abbey Limited and why you consider
this informa on incorrect.
b. Prepare a corrected, classified balance sheet.
c. Based on the balance sheet categories, what addi onal informa on should be disclosed in
the notes to the financial statements?
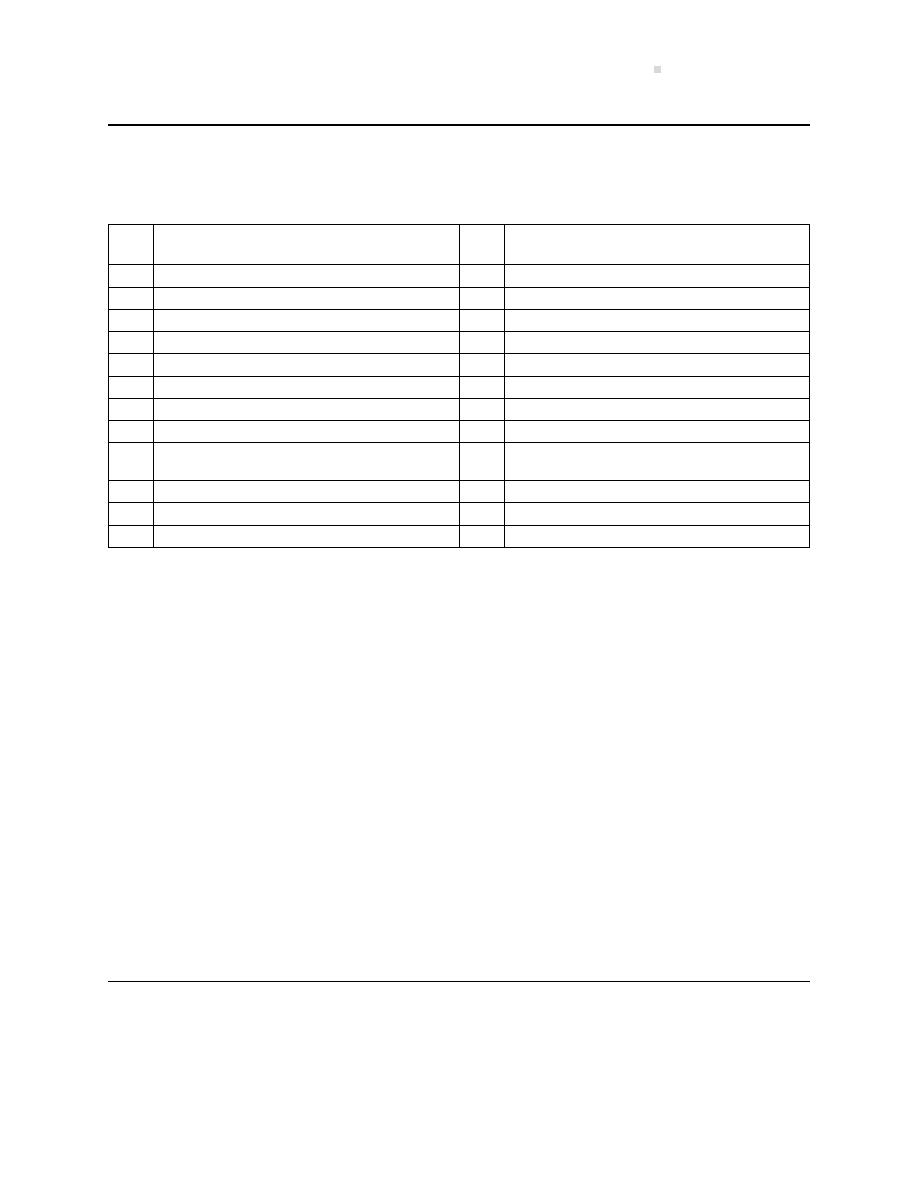
Exercises
169
EXERCISE 4–3
(LO2,3)
Accounts Classifica ons
Below are various accounts:
Land used in the normal course of
business opera ons
Accrued salaries payable
Notes payable, due in four months
Prepaid adver sing
Truck
Adver sing expense
Land held for investment
Unearned revenue
Copyright
Service revenue
Accounts payable
Cash
Cash dividends
Mortgage payable, due in fi een years
Building
Mortgage payable, due in six months
Furniture
Share capital
Accounts receivable, from customer
sales
Shop supplies
Franchise
Accumulated deprecia on, building
U li es expense
Deprecia on expense
U li es payable
Office supplies
Required: Classify each account as one of the following:
1. current asset
2. long-term investment
3. property, plant and equipment
4. intangible asset
5. current liability
6. long-term liability
7. equity
8. not reported on the balance sheet
EXERCISE 4–4
(LO2)
Preparing Closing Entries, Balance Sheet and Post-closing Trial balance
Below are the December 31, 2016, year-end accounts balances for Abled Appliance Repair Ltd.
This is the business’s third year of opera ons.

170
The Classified Balance Sheet and Related Disclosures
Cash . . . . . . . . . . . . . . . . . . . . . . . . . . . . . . . . . .
$80,000
Share capital . . . . . . . . . . . . . . . . . . . . . . . . . .
$1,000
Accounts receivable . . . . . . . . . . . . . . . . . . . .
66,000
Retained earnings . . . . . . . . . . . . . . . . . . . . . .
116,600
Office supplies inventory . . . . . . . . . . . . . . . .
2,000
Revenue . . . . . . . . . . . . . . . . . . . . . . . . . . . . . .
35,000
Prepaid insurance . . . . . . . . . . . . . . . . . . . . . .
5,000
Rent expense . . . . . . . . . . . . . . . . . . . . . . . . . .
3,000
Land . . . . . . . . . . . . . . . . . . . . . . . . . . . . . . . . . .
20,000
Salaries expense . . . . . . . . . . . . . . . . . . . . . . .
8,000
Office equipment . . . . . . . . . . . . . . . . . . . . . .
10,000
U li es expense . . . . . . . . . . . . . . . . . . . . . . .
500
Accumulated deprecia on, office equip-
ment . . . . . . . . . . . . . . . . . . . . . . . . . . . . . . . . .
2,000
Travel expense . . . . . . . . . . . . . . . . . . . . . . . . .
1,500
Accounts payable . . . . . . . . . . . . . . . . . . . . . .
35,000
Insurance expense
600
Unearned consul ng fees . . . . . . . . . . . . . . .
10,000
Supplies and postage expense . . . . . . . . . . .
3,000
Required:
a. Prepare the closing entries.
b. Prepare a classified balance sheet.
c. Prepare a post-closing trial balance.
EXERCISE 4–5
(LO2)
Classified Balance Sheet
Below is the post-closing trial balance for Mystery Company Ltd. All accounts have normal bal-
ances.

Exercises
171
Mystery Company Ltd.
Trial Balance
November 30, 2016
Accounts payable
$ 95,960
Accounts receivable
99,520
Accrued salaries payable
58,580
Accumulated deprecia on, building
43,530
Accumulated deprecia on, vehicle
8,650
Building
270,000
Cash
150,650
Copyright
51,600
Current por on of long-term debt
72,000
Income taxes payable
32,500
Interest payable
12,000
Notes payable, due 2025
145,000
Office supplies
1,300
Prepaid insurance expense
10,000
Prepaid rent expense
12,000
Retained earnings
74,850
Share capital
??
Unearned revenue
150,000
Vehicle
108,000
Required: Prepare a classified balance sheet.
EXERCISE 4–6
(LO2)
Classified Balance Sheet
Below is the adjusted trial balance for Hitalle Heights Corp. All accounts have normal balances.

172
The Classified Balance Sheet and Related Disclosures
Hitalle Heights Corp.
Trial Balance
May 31, 2016
Accounts payable
$ 13,020
Accounts receivable
59,808
Accrued salaries and benefits payable
4,872
Accumulated deprecia on, furniture
1,792
Cash
8,888
Cash dividends
2,800
Deprecia on expense
1,333
Furniture
8,400
Income tax expense
2,520
Income taxes payable
3,320
Insurance expense
2,072
Interest expense
84
Interest payable
224
Land
58,048
Bank loan payable (long-term)
16,800
Shop supplies
1,008
Prepaid insurance expense
7,162
Rent expense
12,600
Travel expense
840
Retained earnings
192,355
Revenue
94,000
Salaries expense
23,352
Share capital
840
Shop supplies expense
420
Franchise
155,868
Unearned revenue
21,000
U li es expense
3,020
Addi onal informa on:
The bank loan will be reduced by $5,200 next year.
There were 200 addi onal shares issued during the year for $200.
Required: Prepare a classified balance sheet and a statement of changes in equity for May 31,
2016.

Problems
173
Problems
PROBLEM 4–1
(LO2)
Classified Balance Sheet
The following list of accounts is taken from the records of the Norman Company Ltd. at December
31, 2015:
Account Title
Balance
Accounts Payable
$125
Accounts Receivable
138
Building
400
Cash
250
Share Capital
400
Equipment
140
Land
115
Mortgage Payable (due 2022)
280
Bank Loan, due within 90 days
110
Notes Receivable, due within 90 days
18
Prepaid Insurance
12
Retained Earnings
214
Salaries Payable
14
Unused Office Supplies
70
Required: Prepare a classified balance sheet.
PROBLEM 4–2
(LO2)
Classified Balance Sheet
The following adjusted trial balance has been extracted from the records of Dark Edge Sports Inc.
at December 31, 2015, its second fiscal year-end.

174
The Classified Balance Sheet and Related Disclosures
Account Balances
Dr.
Cr.
Accounts Payable
$8,350
Accounts Receivable
$18,700
Accumulated Deprecia on – Equipment
2,000
Adver sing Expense
7,200
Bank Loan, due May 31, 2016
10,000
Cash
1,500
Deprecia on Expense
1,100
Dividends
600
Equipment
12,500
Income Taxes Expense
2,300
Income Taxes Payable
4,600
Insurance Expense
1,200
Interest and Bank Charges Expense
1,300
Prepaid Insurance
1,300
Prepaid Rent
600
Retained Earnings
2,000
Rent Expense
17,950
Revenue
80,000
Salaries Expense
39,000
Share Capital
3,000
Telephone Expense
1,100
U li es Expense
3,600
Totals
$109,950
$109,950
Note: No shares were issued during 2015.
Required:
1. Calculate net income for year ended December 31, 2015.
2. Prepare a statement of changes in equity for the year ended December 31, 2015.
3. Prepare a classified balance sheet at December 31, 2015.
4. By what amounts do total current liabili es exceed total current assets at December 31,
2015?
5. Assume a $5,000 bank loan is received, payable in six months. Will this improve the nega ve
working capital situa on calculated in (4) above? Calculate the effect on your answer to (4)
above?
6. As the bank manager, what ques ons might you raise regarding the loan?

Problems
175
PROBLEM 4–3
(LO2)
Closing Entries and Financial Statements
Below is the adjusted trial balance with accounts in alphabe cal order for MayBee Services Ltd.
All accounts have normal balances.
MayBee Services Ltd.
Trial Balance
At June 30, 2016
Accounts payable
$ 32,550
Accounts receivable
149,520
Accrued salaries payable
12,180
Accumulated deprecia on, building
280
Accumulated deprecia on, equipment
4,480
Adver sing expense
5,670
Building
145,400
Cash
122,220
Cash dividends
7,000
Deprecia on expense
3,332
Equipment
21,000
Income tax expense
6,300
Income taxes payable
6,300
Insurance expense
5,180
Interest expense
210
Interest payable
210
Notes payable, due 2018
42,000
Office supplies
2,520
Prepaid insurance expense
17,906
Rent expense
31,500
Repairs expense
10,920
Retained earnings
343,058
Revenue
135,000
Salaries expense
58,380
Share capital
2,100
Shop supplies expense
1,050
Trademark
10,000
Unearned revenue
52,500
U li es expense
32,550
Addi onal Informa on: For the note payable, its account balance will be reduced by $14,000 as
at June 30, 2017.
Required:

176
The Classified Balance Sheet and Related Disclosures
1. Prepare the closing entries.
2. Prepare a classified balance sheet.
3. Prepare a post-closing trial balance.
PROBLEM 4–4
(LO2)
Challenge Ques on – Closing Entries and Financial Statements
Below is the unadjusted trial balance with accounts in alphabe cal order for Jenne e Ltd. All
accounts have normal balances.

Problems
177
Jenne e Ltd.
Unadjusted Trial Balance
At September 30, 2016
Accounts payable
$ 39,983
Accounts receivable
321,468
Accrued salaries payable
21,909
Accumulated deprecia on, building
9,632
Accumulated deprecia on, vehicle
602
Adver sing expense
12,191
Building
312,610
Cash
262,773
Cash dividends
15,050
Copyright
21,500
Deprecia on expense
7,164
Income tax expense
13,545
Income taxes payable
13,545
Insurance expense
11,137
Interest expense
452
Interest payable
4,730
Mortgage payable, due 2019
90,300
Office supplies
5,418
Prepaid insurance expense
8,498
Rent expense
67,725
Repairs expense
23,478
Retained earnings
737,575
Revenue
290,250
Salaries expense
155,517
Share capital
4,515
Shop supplies expense
2,259
Unearned revenue
112,875
U li es expense
39,981
Vehicle
45,150
Addi onal informa on:
Adjustments not yet recorded are:
1. Revenue earned but not yet billed is $20,000.
2. Deprecia on expense for the vehicle is $3,000.
3. The building’s es mated residual value is $100,000 and its es mated useful life is 25 years.
4. Salaries not yet paid are $2,500.

178
The Classified Balance Sheet and Related Disclosures
5. Revenue that was paid in cash as an advance of $50,000 is now earned.
6. Rent for October 2016 of $5,150 was paid and recorded to rent expense.
7. One-half of the prepaid insurance is has now been used.
Mortgage payments for the next fiscal year will total $36,000, which includes interest expense of
$6,000.
Required:
1. Update all the account balances with appropriate adjus ng entries based on the six missing
adjustments above. (Hint: Use a trial balance format with adjus ng entry columns.)
2. Prepare an adjusted trial balance.
3. Prepare a classified balance sheet.

Chapter 5
Accoun ng for the Sale of Goods
To this point, examples of business opera ons have involved the sale of services. This chapter in-
troduces business opera ons based on the purchase and resale of goods. For example, Canadian
Tire and Walmart each purchase and resell goods — such businesses are known as merchandis-
ers. The accoun ng transac ons for merchandising companies differ from those of service-based
businesses. Chapter
covers accoun ng for transac ons of sales of goods on credit and related
cash collec ons by merchandising firms, and transac ons involving purchases and payments for
goods sold in the normal course of business ac vi es.
Chapter 5 Learning Objec ves
LO1 – Describe merchandising and explain the financial statement components of sales, cost
of goods sold, merchandise inventory, and gross profit; differen ate between the perpetual
and periodic inventory systems.
LO2 – Analyze and record purchase transac ons for a merchandiser.
LO3 – Analyze and record sales transac ons for a merchandiser.
LO4 – Record adjustments to merchandise inventory.
LO5 – Explain and prepare a classified mul ple-step income statement for a merchandiser.
LO6 – Explain the closing process for a merchandiser.
LO7 – Explain and iden fy the entries regarding purchase and sales transac ons in a periodic
inventory system.
Concept Self-Check
Use the following ques ons as a self-check while working through Chapter
.
1. What is gross profit and how is it calculated?
2. How is a merchandiser different from a service company?
3. What is a perpetual inventory system?
4. How is the purchase of merchandise inventory on credit recorded in a perpetual system?
179

180
Accoun ng for the Sale of Goods
5. How is a purchase return recorded in a perpetual system?
6. What does the credit term of “1/15, n30” mean?
7. How is a purchase discount recorded in a perpetual system?
8. How is the sale of merchandise inventory on credit recorded in a perpetual system?
9. How is a sales return that is restored to inventory recorded versus a sales return that is not
restored to inventory (assuming a perpetual inventory system)?
10. What is a sales discount and how is it recorded in a perpetual inventory system?
11. Why does merchandise inventory need to be adjusted at the end of the accoun ng period
and how is this done in a perpetual inventory system?
12. What types of transac ons affect merchandise inventory in a perpetual inventory system?
13. How are the closing entries for a merchandiser using a perpetual inventory system different
than for a service company?
14. When repor ng expenses on an income statement, how is the func on of an expense re-
ported versus the nature of an expense?
15. On a classified mul ple-step income statement, what is reported under the heading ‘Other
revenues and expenses’ and why?
16. What is the periodic inventory system?
17. How is cost of goods sold calculated under the periodic inventory system?
NOTE: The purpose of these ques ons is to prepare you for the concepts introduced in the chap-
ter. Your goal should be to answer each of these ques ons as you read through the chapter. If,
when you complete the chapter, you are unable to answer one or more the Concept Self-Check
ques ons, go back through the content to find the answer(s). Solu ons are not provided to these
ques ons.
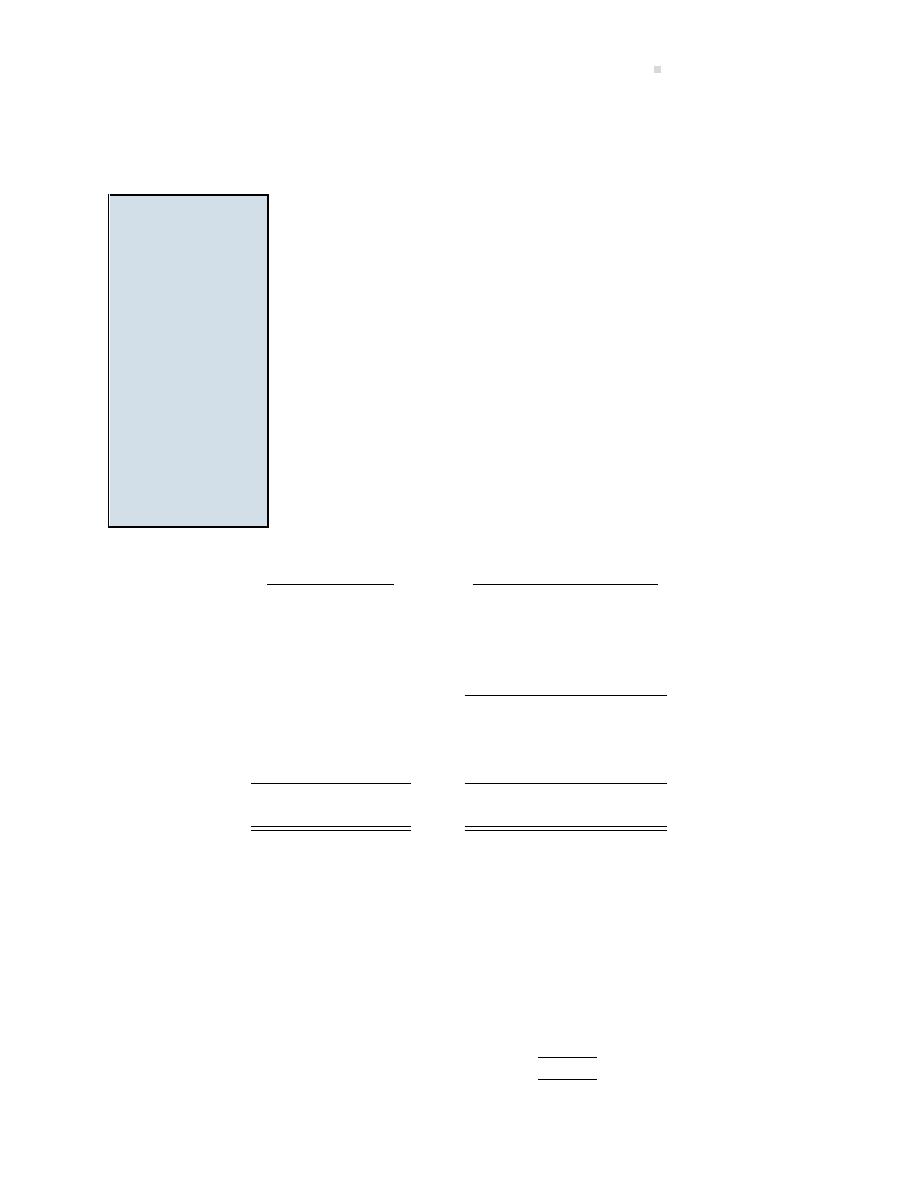
5.1. The Basics of Merchandising
181
5.1 The Basics of Merchandising
LO1 – Describe
merchandising
and
explain
the
financial
statement com-
ponents of sales,
cost
of
goods
sold,
merchan-
dise
inventory,
and gross profit;
differen ate
between
the
perpetual
and
periodic
inven-
tory systems.
A merchandising company, or merchandiser, differs in several basic ways
from a company that provides services. First, a merchandiser purchases
and then sells goods whereas a service company sells services. For exam-
ple, a car dealership is a merchandiser that sells cars while an airline is a
service company that sells air travel. Because merchandising involves the
purchase and then the resale of goods, an expense called cost of goods
sold results. Cost of goods sold is the cost of the actual goods sold. For
example, the cost of goods sold for a car dealership would be the cost of
the cars purchased from manufacturers and then resold to customers. A
service company does not have an expense called cost of goods sold since
it does not sell goods. Because a merchandiser has cost of goods sold
expense and a service business does not, the income statement for a mer-
chandiser includes different details. A merchandising income statement
highlights cost of goods sold by showing the difference between sales rev-
enue and cost of goods sold called gross profit or gross margin. The basic
income statement differences between a service business and a merchan-
diser are illustrated in Figure
.
Service Company
Merchandising Company
Revenues
Sales
Less: Cost of Goods Sold
Equals: Gross Profit
Less: Expenses
Less: Expenses
Equals: Net Income
Equals: Net Income
Figure 5.1: Differences Between the Income Statements of Service and Merchandising Compa-
nies
Assume that Excel Cars Corpora on decides to go into the business of buying used vehicles from
a supplier and reselling these to customers. If Excel purchases a vehicle for $3,000 and then sells
it for $4,000, the gross profit would be $1,000, as follows:
Sales . . . . . . . . . . . . . . . . .
$ 4,000
Cost of Goods Sold . . . .
3,000
Gross Profit . . . . . . . .
$
1,000

182
Accoun ng for the Sale of Goods
The word “gross” is used by accountants to indicate that other expenses incurred in running the
business must s ll be deducted from this amount before net income is calculated. In other words,
gross profit represents the amount of sales revenue that remains to pay expenses a er the cost
of the goods sold is deducted.
A gross profit percentage can be calculated to express the rela onship of gross profit to sales.
The sale of the vehicle that cost $3,000 results in a 25% gross profit percentage ($1,000/4,000).
That is, for every $1 of sales, the company has $.25 le to cover other expenses a er deduc ng
cost of goods sold. Readers of financial statements use this percentage as a means to evaluate
the performance of one company against other companies in the same industry, or in the same
company from year to year. Small fluctua ons in the gross profit percentage can have significant
effects on the financial performance of a company because the amount of sales and cost of goods
sold are o en very large in comparison to other income statement items.
Another difference between a service company and a merchandiser relates to the balance sheet.
A merchandiser purchases goods for resale. Goods held for resale by a merchandiser are called
merchandise inventory and are reported as an asset on the balance sheet. A service company
would not normally have merchandise inventory.
Inventory Systems
There are two types of ways in which inventory is managed: perpetual inventory system or periodic
inventory system. In a perpetual inventory system, the merchandise inventory account and cost
of goods sold account are updated immediately when transac ons occur. In a perpetual system,
as merchandise inventory is purchased, it is debited to the merchandise inventory account. As
inventory is sold to customers, the cost of the inventory sold is removed from the merchandise
inventory account and debited to the cost of goods sold account. A perpetual system means that
account balances are known on a real- me basis. This chapter focuses on the perpetual system.
Some businesses s ll use a periodic inventory system in which the purchase of merchandise in-
ventory is debited to a temporary account called Purchases. At the end of the accoun ng period,
inventory is counted (known as a physical count) and the merchandise inventory account is up-
dated and cost of goods sold is calculated. In a periodic inventory system, the real- me balances
in merchandise inventory and cost of goods sold are not known. It should be noted that even in
a perpetual system a physical count must be performed at the end of the accoun ng period to
record differences between the actual inventory on hand and the account balance. The entry to
record this difference is discussed later in this chapter. The periodic system is discussed in greater
detail in the appendix to this chapter.
An explora on is available on the Lyryx site. Log into your Lyryx course to run
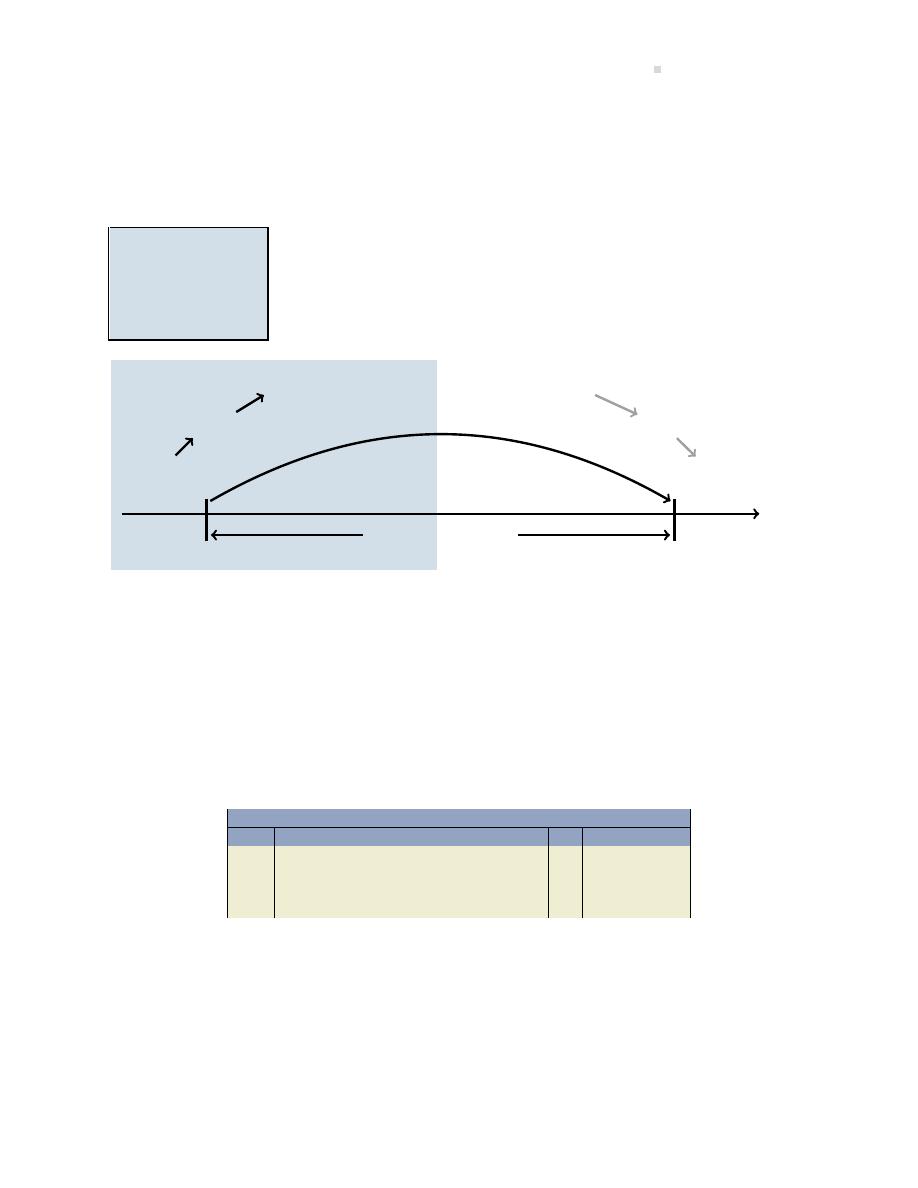
5.2. The Purchase and Payment of Merchandise Inventory (Perpetual)
183
5.2 The Purchase and Payment of Merchandise Inventory (Per-
petual)
LO2 – Analyze
and
record
purchase
trans-
ac ons
for
a
merchandiser.
As introduced in Chapter
, a company’s opera ng cycle includes purchases
on account or on credit and is highlighted in Figure
Inventory is
purchased.
A liability is incurred.
Cash payment to supplier is made.
Inventory sold to customer.
Accounts receivable result.
Cash is collected
from customer.
One Opera ng Cycle
Time
Figure 5.2: Purchase and Payment Por on of the Opera ng Cycle
Recording the Purchase of Merchandise Inventory (Perpetual)
When merchandise inventory is purchased, the cost is recorded in a Merchandise Inventory gen-
eral ledger account. An account payable results when the merchandise inventory is acquired but
will not be paid in cash un l a later date. For example, recall the vehicle purchased on account by
Excel for $3,000. The journal entry and general ledger T-account effects would be as follows.
General Journal
Date
Account/Explana on
PR
Debit
Credit
Merchandise Inventory . . . . . . . . . . . . . . . . .
3,000
Accounts Payable . . . . . . . . . . . . . . . . . . .
3,000
To record the purchase of merchandise in-
ventory on account.
In addi on to the purchase of merchandise inventory, there are other ac vi es that affect the
Merchandise Inventory account. For instance, merchandise may occasionally be returned to a
supplier or damaged in transit, or discounts may be earned for prompt cash payment. These
transac ons result in the reduc on of amounts due to the supplier and the costs of inventory. The
purchase of merchandise inventory may also involve the payment of transporta on and handling
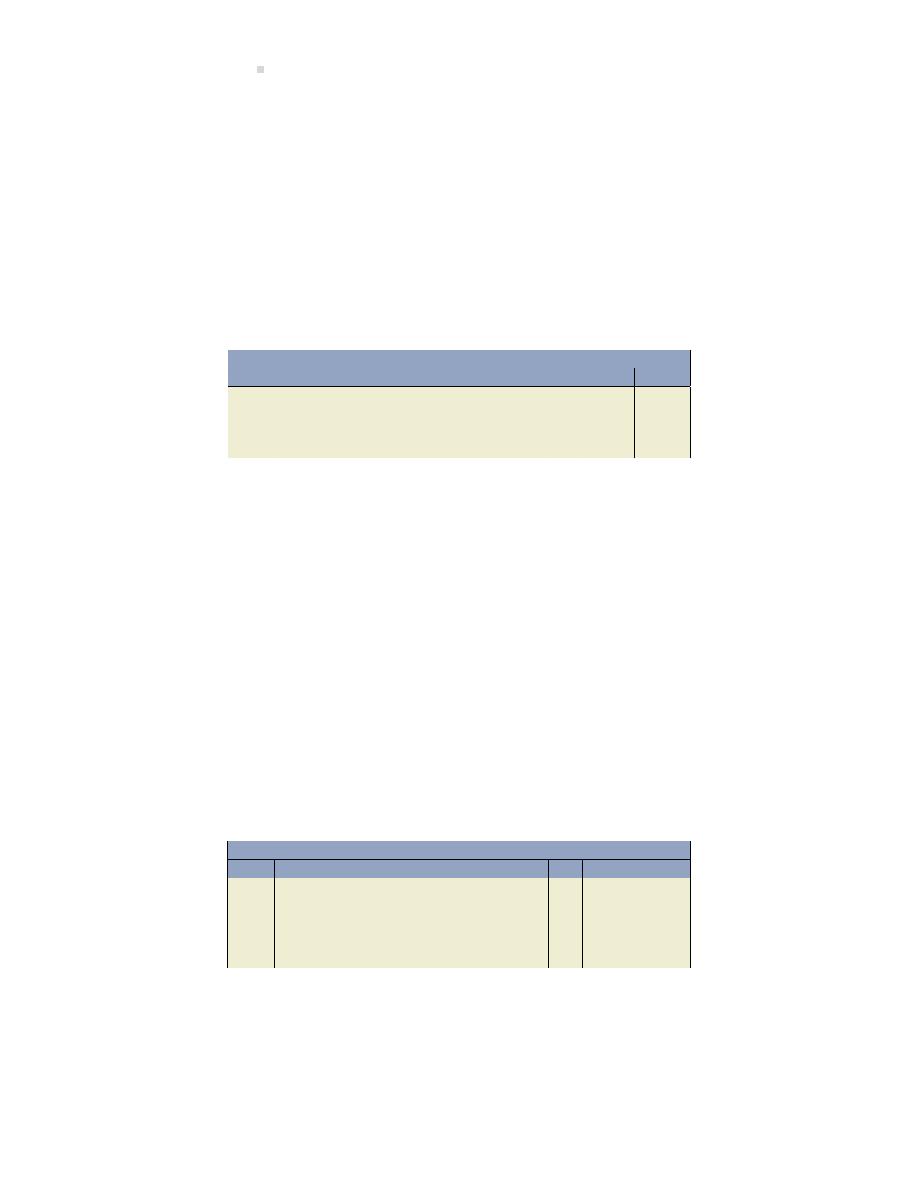
184
Accoun ng for the Sale of Goods
costs. These are all costs necessary to prepare inventory for sale, and all such costs are included
in the Merchandise Inventory account. These costs are discussed in the following sec ons.
Purchase Returns and Allowances (Perpetual)
Assume that the vehicle purchased by Excel turned out to be the wrong colour. The supplier was
contacted and agreed to reduce the price by $300 to $2,700. This is an example of a purchase
returns and allowances adjustment. The amount of the allowance, or reduc on, is recorded as a
credit to the Merchandise Inventory account, as follows:
General Journal
Date
Account/Explana on
PR
Debit
Credit
Accounts Payable . . . . . . . . . . . . . . . . . . . . . .
300
Merchandise Inventory . . . . . . . . . . . . . .
300
To record purchase allowance; incorrect
colour.
Note that the cost of the vehicle has been reduced to $2,700 ($3,000 – 300) as has the amount
owing to the supplier. Again, the perpetual inventory system records changes in the Merchandise
Inventory account each me a relevant transac on occurs.
Purchase Discounts (Perpetual)
Purchase discounts affect the purchase price of merchandise if payment is made within a me
period specified in the supplier’s invoice. For example, if the terms on the $3,000 invoice for one
vehicle received by Excel indicates “1/15, n45”, this means that the $3,000 must be paid within 45
days (‘n’ = net). However, if cash payment is made by Excel within 15 days, the purchase price will
be reduced by 1%.
Assuming the amount is paid within 15 days, the supplier’s terms en tle Excel to deduct $27
[($3,000 - $300) = $2,700 x 1% = $27]. The payment to the supplier would be recorded as:
General Journal
Date
Account/Explana on
PR
Debit
Credit
Accounts Payable . . . . . . . . . . . . . . . . . . . . . .
2,700
Merchandise Inventory . . . . . . . . . . . . . .
27
Cash . . . . . . . . . . . . . . . . . . . . . . . . . . . . . . .
2,673
To record payment on account within the
discount period.
The cost of the vehicle in Excel’s inventory records is now $2,673 ($3,000 – 300 – 27). If payment
is made a er the discount period, $2,700 of cash is paid and the entry would be:
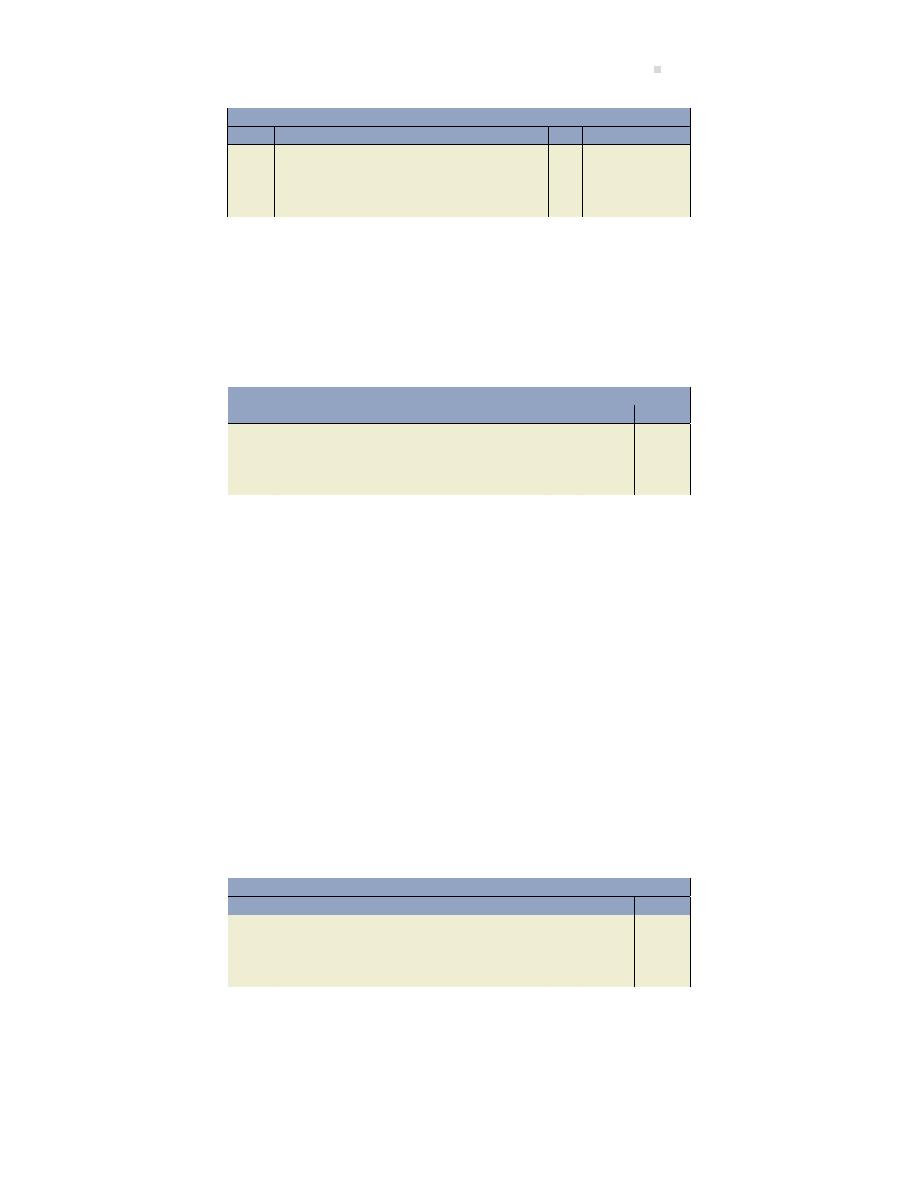
5.2. The Purchase and Payment of Merchandise Inventory (Perpetual)
185
General Journal
Date
Account/Explana on
PR
Debit
Credit
Accounts Payable . . . . . . . . . . . . . . . . . . . . . .
2,700
Cash . . . . . . . . . . . . . . . . . . . . . . . . . . . . . . .
2,700
To record payment of account; no pur-
chase discount applied.
Trade discounts are similar to purchase discounts. A supplier adver ses a list price which is the
normal selling price of its goods to merchandisers. Trade discounts are given by suppliers to mer-
chandisers that buy a large quan ty of goods. For instance, assume a supplier offers a 10% trade
discount on purchases of 1,000 units or more where the list price is $1/unit. If Beta Merchandiser
Corp. buys 1,000 units on account, the entry in Beta’s records would be:
General Journal
Date
Account/Explana on
PR
Debit
Credit
Merchandise Inventory . . . . . . . . . . . . . . . . .
900
Accounts Payable . . . . . . . . . . . . . . . . . . .
900
To record purchase on account; 10% trade
discount ($1,000 – 10% = $900).
Note that the net amount (list price less trade discount) is recorded.
Transporta on
Costs to transport goods from the supplier to the seller must also be considered when recording
the cost of merchandise inventory. The shipping terms on the invoice iden fy the point at which
ownership of the inventory transfers from the supplier to the purchaser. When the terms are
FOB shipping point, ownership transfers at the ‘shipping point’ so the purchaser is responsible for
transporta on costs. FOB des na on indicates that ownership transfers at the ‘des na on point’
so the seller is responsible for transporta on costs. FOB is the abbrevia on for “free on board.”
Assume that Excel’s supplier sells with terms of FOB shipping point indica ng that transporta on
costs are Excel’s responsibility. If the cost of shipping is $125 and this amount was paid in cash to
the truck driver at me of delivery, the entry would be:
General Journal
Date
Account/Explana on
PR
Debit
Credit
Merchandise Inventory . . . . . . . . . . . . . . . . .
125
Cash . . . . . . . . . . . . . . . . . . . . . . . . . . . . . . .
125
To record shipping costs on inventory pur-
chased.
The cost of the vehicle in the Excel Merchandise Inventory account is now $2,798 (calculated as
$3,000 original cost - $300 allowance - $27 discount + $125 shipping). It is important to note that
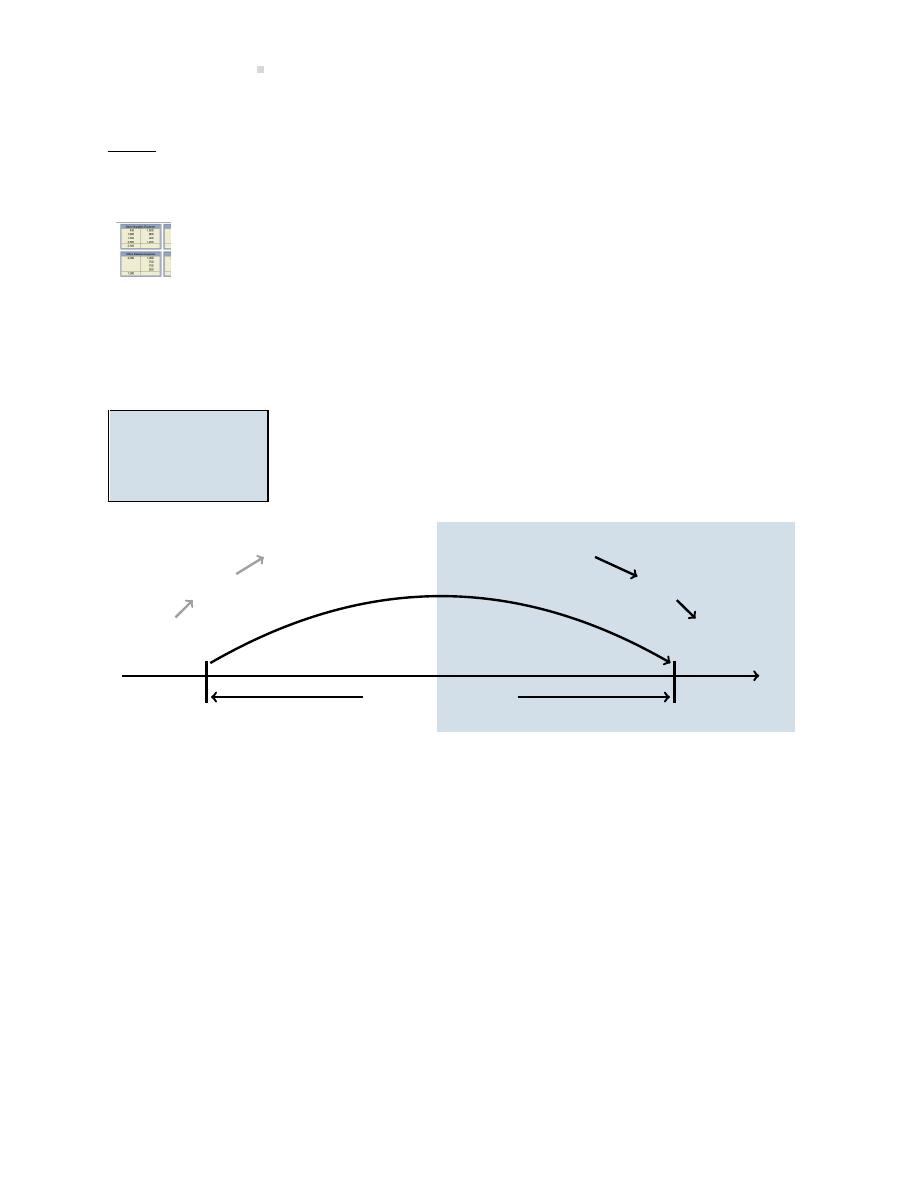
186
Accoun ng for the Sale of Goods
Excel’s transporta on costs to deliver goods to customers are recorded as delivery expenses and
do not affect the Merchandise Inventory account.
The next sec on describes how the sale of merchandise is recorded as well as the related costs of
items sold.
An explora on is available on the Lyryx site. Log into your Lyryx course to run
.
5.3 Merchandise Inventory: Sales and Collec on (Perpetual)
LO3 – Analyze
and record sales
transac ons for a
merchandiser.
In addi on to purchases on account, a merchandising company’s opera ng
cycle includes the sale of merchandise inventory on account or on credit
as highlighted in Figure
Inventory is
purchased.
A liability is incurred.
Cash payment to supplier is made.
Inventory sold to customer.
Accounts receivable result.
Cash is collected
from customer.
One Opera ng Cycle
Time
Figure 5.3: Sales and Collec on Por on of the Opera ng Cycle
There are some slight recording differences when revenue is earned in a merchandising company.
These are discussed below.
Recording the Sale of Merchandise Inventory (Perpetual)
The sale of merchandise inventory is recorded with two entries:
1. recording the sale by debi ng Cash or Accounts Receivable and credi ng Sales, and
2. recording the cost of the sale by debi ng Cost of Goods Sold and credi ng Merchandise
Inventory.
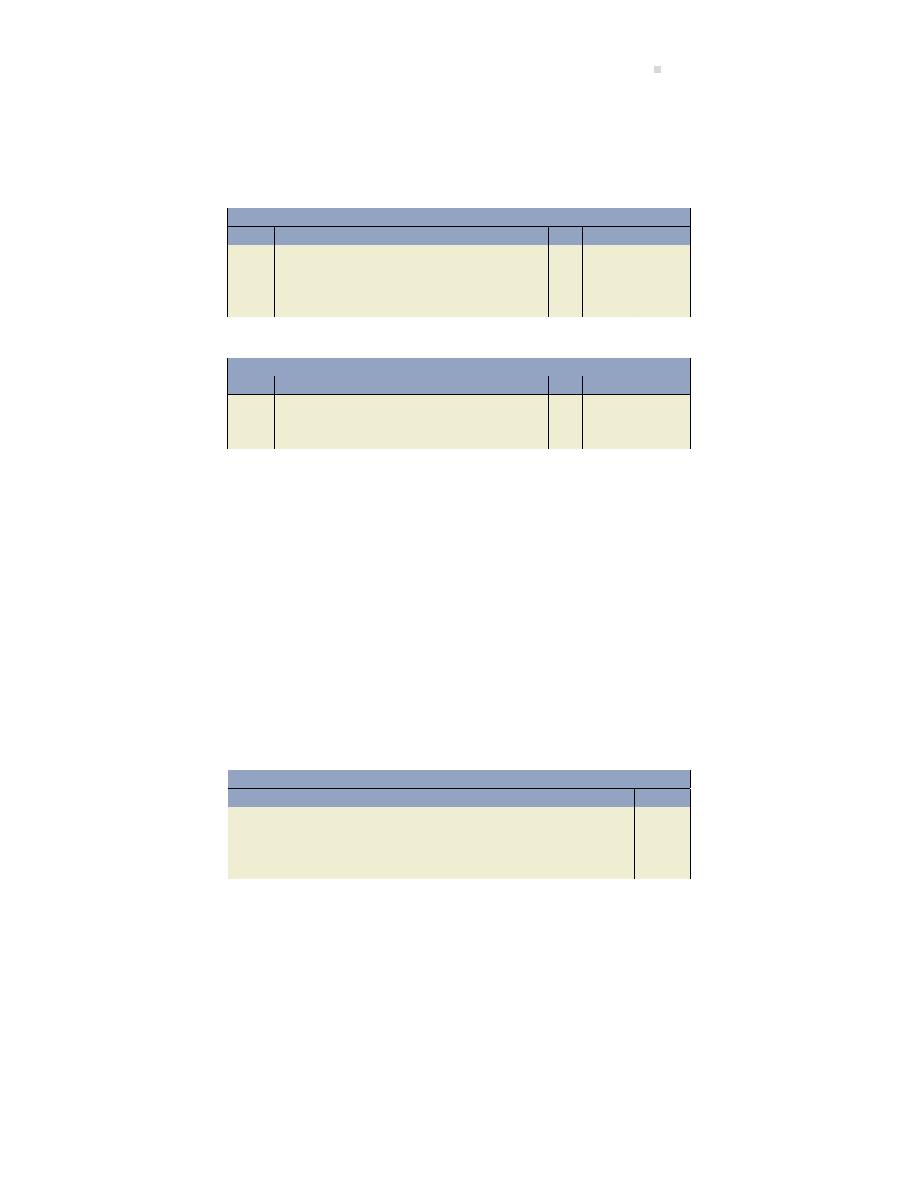
5.3. Merchandise Inventory: Sales and Collec on (Perpetual)
187
Assume the vehicle purchased by Excel is sold for $4,000 on account. Recall that the cost of this
vehicle in the Excel Merchandise Inventory account is $2,798, as shown below.
The entries to record the sale of the merchandise inventory are:
General Journal
Date
Account/Explana on
PR
Debit
Credit
Accounts Receivable . . . . . . . . . . . . . . . . . . .
4,000
Sales . . . . . . . . . . . . . . . . . . . . . . . . . . . . . .
4,000
To record the sale of merchandise on ac-
count.
General Journal
Date
Account/Explana on
PR
Debit
Credit
Cost of Goods Sold . . . . . . . . . . . . . . . . . . . . .
2,798
Merchandise Inventory . . . . . . . . . . . . . .
2,798
To record the cost of the sale.
The first entry records the sales revenue. The second entry is required to reduce the Merchandise
Inventory account and transfer the cost of the inventory sold to the Cost of Goods Sold account.
The second entry ensures that both the Merchandise Inventory account and Cost of Goods Sold
account are up to date.
Sales Returns and Allowances
When merchandise inventory that has been sold is returned to the merchandiser by the customer,
a sales return and allowance is recorded. For example, assume some damage occurs to the mer-
chandise inventory sold by Excel while it is being delivered to the customer. Excel gives the cus-
tomer a sales allowance by agreeing to reduce the amount owing by $100. The entry is:
General Journal
Date
Account/Explana on
PR
Debit
Credit
Sales Returns and Allowances . . . . . . . . . . .
100
Accounts Receivable . . . . . . . . . . . . . . . .
100
To record allowance for damage to mer-
chandise inventory during delivery.
Accounts receivable is credited because the original sale was made on account and has not yet
been paid. The amount owing from the customer is reduced to $3,900. If the $3,900 had already
been paid, a credit would be made to Cash and $100 refunded to the customer. The Sales Returns
and Allowances account is a contra revenue account and is therefore deducted from Sales when
preparing the income statement.
If goods are returned by a customer, a sales return occurs. The related sales and cost of goods
sold recorded on the income statement are reversed and the goods are returned to inventory. For
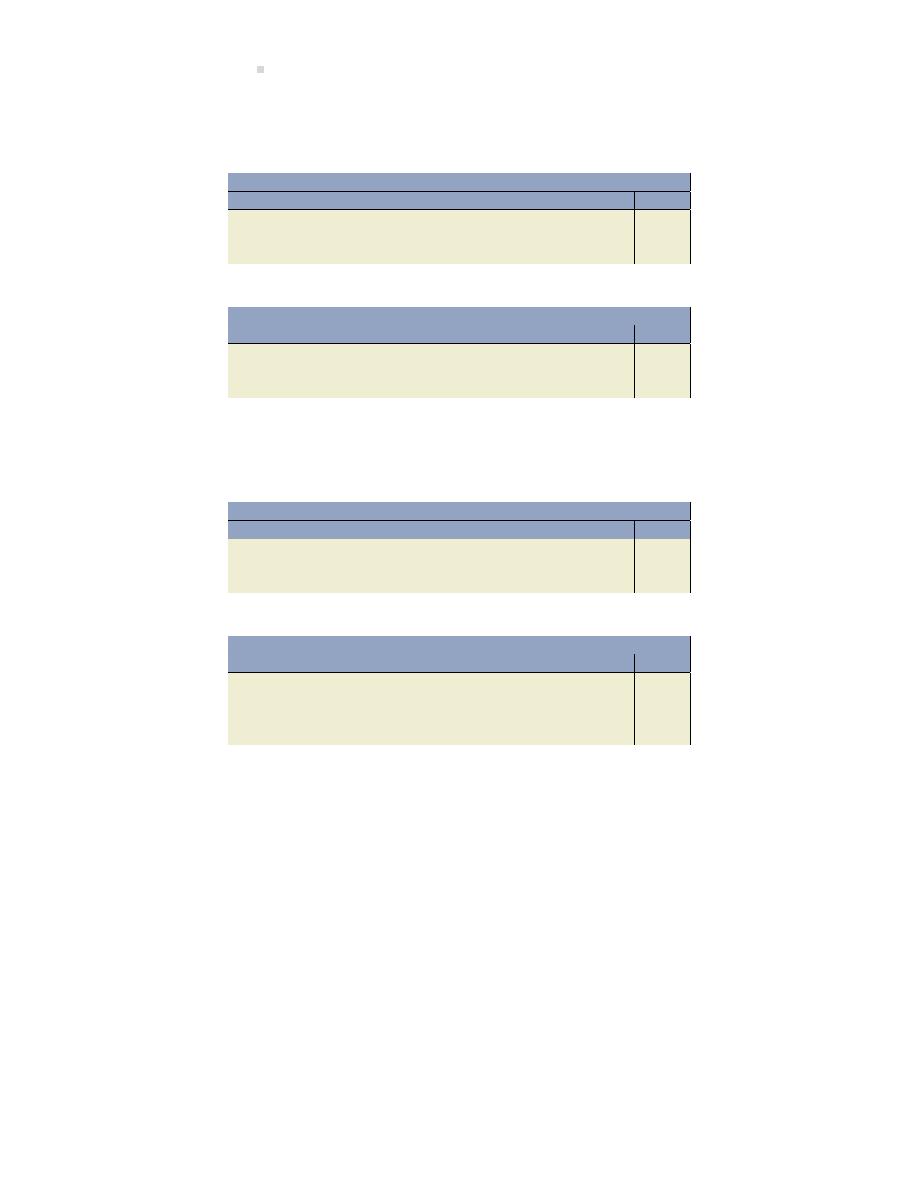
188
Accoun ng for the Sale of Goods
example, assume Max Corpora on sells a plas c container for $3 that it purchased for $1. The
dual entry at the me of sale would be:
General Journal
Date
Account/Explana on
PR
Debit
Credit
Accounts Receivable . . . . . . . . . . . . . . . . . . .
3
Sales . . . . . . . . . . . . . . . . . . . . . . . . . . . . . .
3
To record sale on credit.
General Journal
Date
Account/Explana on
PR
Debit
Credit
Cost of Goods Sold . . . . . . . . . . . . . . . . . . . . .
1
Merchandise Inventory . . . . . . . . . . . . . .
1
To record the cost of the sale.
If the customer returns the container and the merchandise is restored to inventory, the dual jour-
nal entry would be:
General Journal
Date
Account/Explana on
PR
Debit
Credit
Sales Returns and Allowances . . . . . . . . . . .
3
Accounts Receivable . . . . . . . . . . . . . . . .
3
To record sales return.
General Journal
Date
Account/Explana on
PR
Debit
Credit
Merchandise Inventory . . . . . . . . . . . . . . . . .
1
Cost of Goods Sold . . . . . . . . . . . . . . . . . .
1
To record sales return being restored to in-
ventory.
The use of a contra account to record sales returns and allowances permits management to track
the amount of returned and damaged items.
Sales Discounts
Another contra revenue account, Sales Discounts, records reduc ons in sales amounts when a
customer pays within a certain me period. For example, assume Excel Cars Corpora on offers
sales terms of “2/10, n30.” This means that the amount owed must be paid by the customer within
30 days (‘n’ = net); however, if the customer chooses to pay within 10 days, a 2% discount may be
deducted from the amount owing.
Consider the sale of the vehicle for $3,900 ($4,000 less the $100 allowance for damage). Payment
within 10 days en tles the customer to a $78 discount ($3,900 x 2% = $78). If payment is made
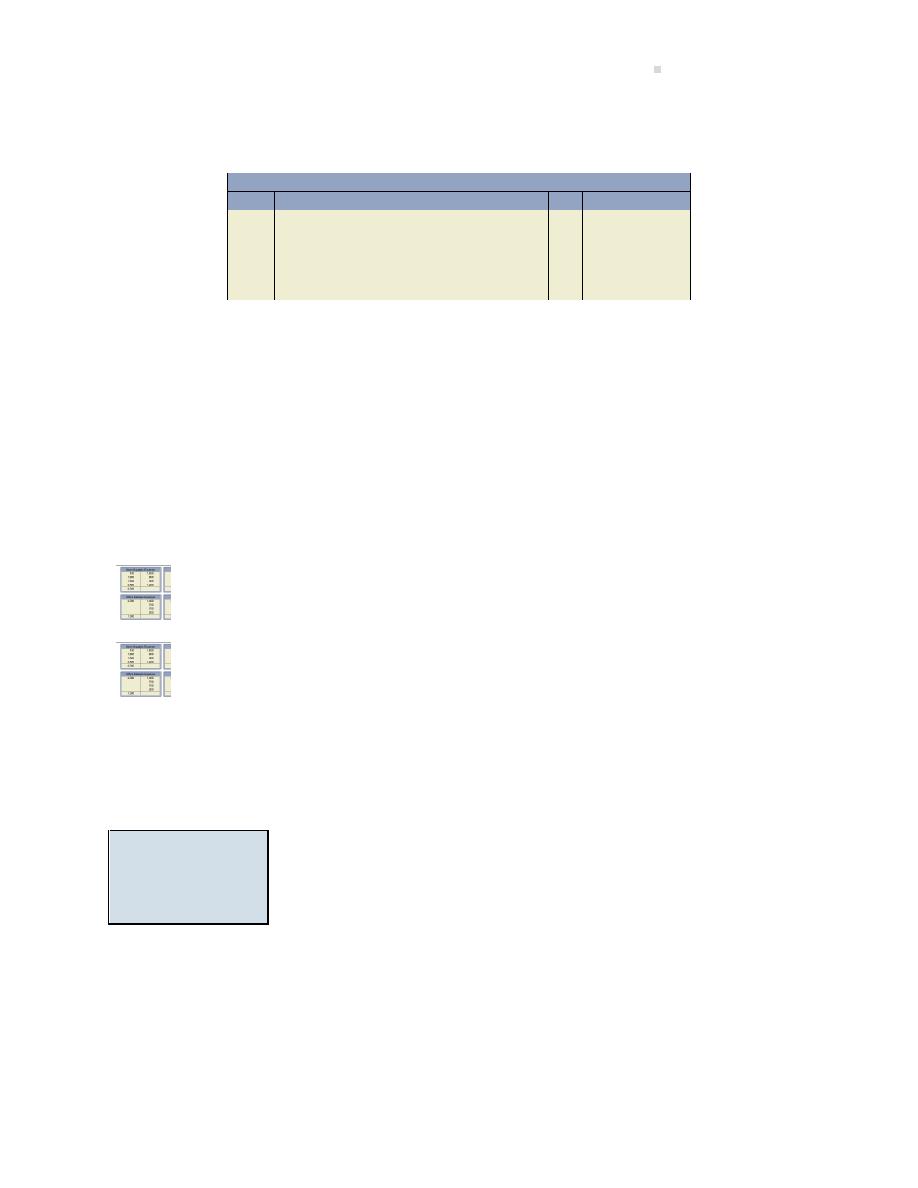
5.4. Adjustments to Merchandise Inventory (Perpetual)
189
within the discount period, Excel receives $3,822 cash ($3,900 - 78) and prepares the following
entry:
General Journal
Date
Account/Explana on
PR
Debit
Credit
Cash . . . . . . . . . . . . . . . . . . . . . . . . . . . . . . . . . .
3,822
Sales Discounts . . . . . . . . . . . . . . . . . . . . . . . .
78
Accounts Receivable . . . . . . . . . . . . . . . .
3,900
To record payment on account and sales
discount applied.
This entry reduces the accounts receivable amount to zero which is the desired result. If payment
is not made within the discount period, the customer pays the full amount owing of $3,900.
As was the case for Sales Returns and Allowances, the balance in the Sales Discounts account is
deducted from Sales on the income statement to arrive at Net Sales. Merchandisers o en report
only the net sales amount on the income statement. Details from sales returns and allowances,
and sales discounts, are o en omi ed because they are immaterial in amount rela ve to total
sales. However, as already stated, separate general ledger accounts for each of sales returns and
allowances, and sales discounts, are useful in helping management iden fy poten al problems
that require inves ga on.
An explora on is available on the Lyryx site. Log into your Lyryx course to run
An explora on is available on the Lyryx site. Log into your Lyryx course to run
5.4 Adjustments to Merchandise Inventory (Perpetual)
LO4
–
Record
adjustments
to
merchandise
inventory.
To verify that the actual amount of merchandise inventory on hand is con-
sistent with the balance recorded in the accoun ng records, a physical in-
ventory count must be performed at the end of the accoun ng period.
When a physical count of inventory is conducted, the costs a ached to
these inventory items are totalled. This total is compared to the Merchan-
dise Inventory account balance in the general ledger. Any discrepancy is
called shrinkage. The and deteriora on of merchandise inventory are
the most common causes of shrinkage.
The adjus ng entry to record shrinkage is:
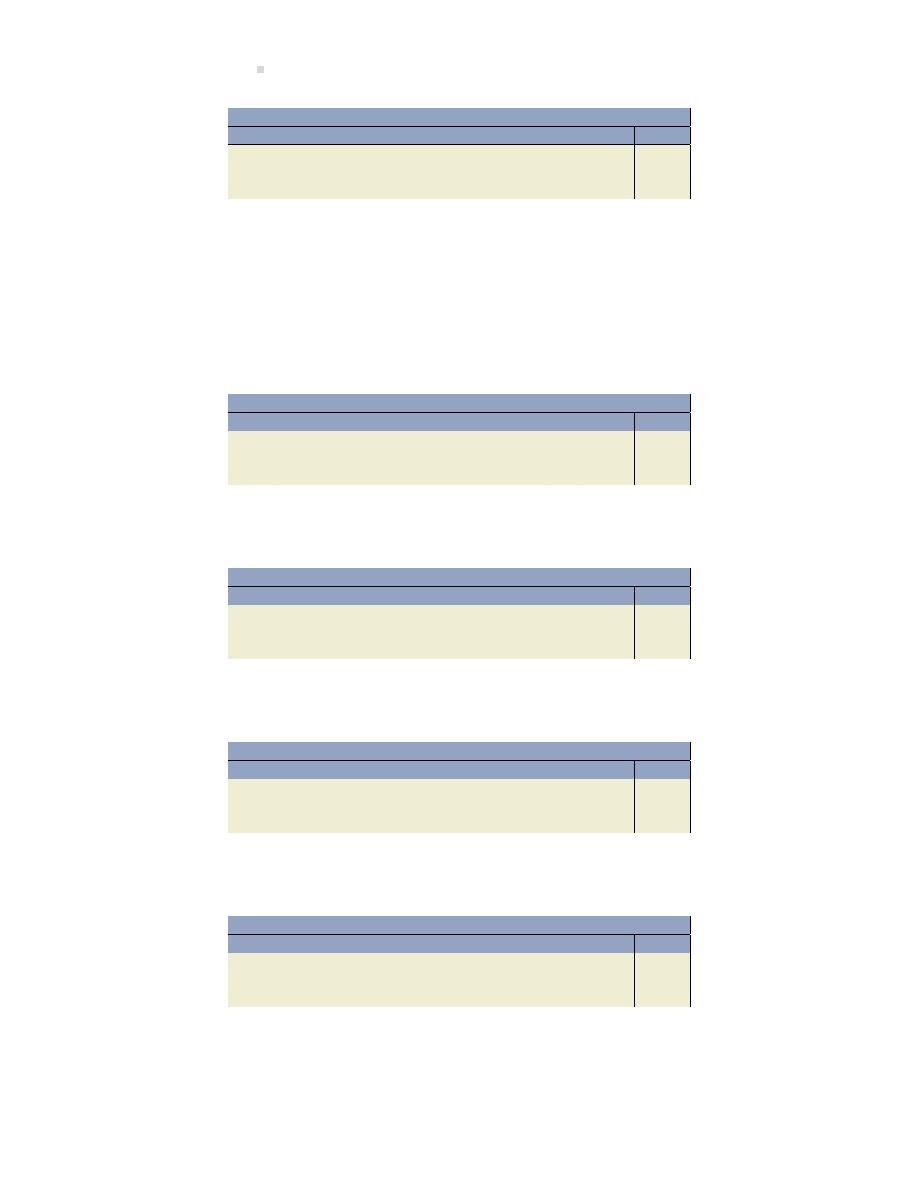
190
Accoun ng for the Sale of Goods
General Journal
Date
Account/Explana on
PR
Debit
Credit
Cost of Goods Sold . . . . . . . . . . . . . . . . . . . . .
XX
Merchandise Inventory . . . . . . . . . . . . . .
XX
To adjust for shrinkage.
Summary of Merchandising Transac ons
As the preceding sec ons have illustrated, there are a number of entries which are unique to a
merchandiser. These are summarized below (assume all transac ons were on account):
(a) To record the purchase of merchandise inventory from a supplier:
General Journal
Date
Account/Explana on
PR
Debit
Credit
Merchandise Inventory . . . . . . . . . . . . . . . . .
XX
Accounts Payable . . . . . . . . . . . . . . . . . . .
XX
(b) To record purchase return and allowances:
General Journal
Date
Account/Explana on
PR
Debit
Credit
Accounts Payable . . . . . . . . . . . . . . . . . . . . . .
XX
Merchandise Inventory . . . . . . . . . . . . . .
XX
(c) To record purchase discounts:
General Journal
Date
Account/Explana on
PR
Debit
Credit
Accounts Payable . . . . . . . . . . . . . . . . . . . . . .
XX
Merchandise Inventory . . . . . . . . . . . . . .
XX
(d) To record shipping costs from supplier to merchandiser:
General Journal
Date
Account/Explana on
PR
Debit
Credit
Merchandise Inventory . . . . . . . . . . . . . . . . .
XX
Accounts Payable . . . . . . . . . . . . . . . . . . .
XX
(e) To record sale of merchandise inventory and cost of the sale:
5.4. Adjustments to Merchandise Inventory (Perpetual)
191
General Journal
Date
Account/Explana on
PR
Debit
Credit
Accounts Receivable . . . . . . . . . . . . . . . . . . .
XX
Sales . . . . . . . . . . . . . . . . . . . . . . . . . . . . . .
XX
AND
General Journal
Date
Account/Explana on
PR
Debit
Credit
Cost of Goods Sold . . . . . . . . . . . . . . . . . . . . .
XX
Merchandise Inventory . . . . . . . . . . . . . .
XX
(f) To record sales returns restored to inventory:
General Journal
Date
Account/Explana on
PR
Debit
Credit
Sales Returns and Allowances . . . . . . . . . . .
XX
Accounts Receivable . . . . . . . . . . . . . . . .
XX
AND
General Journal
Date
Account/Explana on
PR
Debit
Credit
Merchandise Inventory . . . . . . . . . . . . . . . . .
XX
Cost of Goods Sold . . . . . . . . . . . . . . . . . .
XX
(g) To record sales returns and allowances (where returns are not restored to inventory):
General Journal
Date
Account/Explana on
PR
Debit
Credit
Sales Returns and Allowances . . . . . . . . . . .
XX
Accounts Receivable . . . . . . . . . . . . . . . .
XX
(h) To record discounts:
General Journal
Date
Account/Explana on
PR
Debit
Credit
Sales Discounts . . . . . . . . . . . . . . . . . . . . . . . .
XX
Cash . . . . . . . . . . . . . . . . . . . . . . . . . . . . . . . . . .
XX
Accounts Receivable . . . . . . . . . . . . . . . .
XX
192
Accoun ng for the Sale of Goods
(i) To record adjustment for shrinkage at the end of the accoun ng period:
General Journal
Date
Account/Explana on
PR
Debit
Credit
Cost of Goods Sold . . . . . . . . . . . . . . . . . . . . .
XX
Merchandise Inventory . . . . . . . . . . . . . .
XX
The effect of these transac ons on each of merchandise inventory and cost of goods sold is de-
picted below:
Merchandise Inventory (MI)
Cost of Goods Sold (COGS)
(a) Purchase of MI
(b) Purchase Ret. & Allow.
(e) Cost of MI Sold
(f) Cost of sales
returns restored to
(d) Shipping Costs
(c) Purchase Discounts
(i) Shrinkage Adjustment
inventory
(f) Sales Return (when
(e) Sale of MI
restored to inventory)
(i) Shrinkage Adjustment
Adjusted Balance Reported
Adjusted Balance Reported
on the Balance Sheet
on the Income Statement
An explora on is available on the Lyryx site. Log into your Lyryx course to run
.

5.5. Merchandising Income Statement
193
5.5 Merchandising Income Statement
LO5 – Explain and
prepare a clas-
sified
mul ple-
step
income
statement for a
merchandiser.
Businesses are required to show expenses on the income statement based
on either the nature or the func on of the expense. The nature of an ex-
pense is determined by its basic characteris cs (what it is). For example,
when expenses are listed on the income statement as interest, deprecia-
on, income tax, or wages, this iden fies the nature of each expense. In
contrast, the func on of an expense describes the grouping of expenses
based on their purpose (what they relate to). For example, an income
statement that shows cost of goods sold, selling expenses, and general and
administra ve expenses has grouped expenses by their func on. When
expenses are grouped by func on, addi onal informa on must be dis-
closed to show the nature of expenses within each group. The full disclo-
sure principle is the generally accepted accoun ng principle that requires
financial statements to report all relevant informa on about the opera-
ons and financial posi on of the en ty. Informa on that is relevant but
not included in the body of the statements is provided in the notes to the
financial statements.
A merchandising income statement can be prepared in different formats. For this course, only
one format will be introduced — the classified mul ple-step format. This format is generally used
for internal repor ng because of the detail it includes. An example of a classified mul ple-step
income statement is shown below using assumed data for XYZ Inc. for its month ended December
31, 2015.

194
Accoun ng for the Sale of Goods
XYZ Inc.
Income Statement
Month Ended December 31, 2015
Sales
$100,000
Less: Sales discounts
$1,000
Sales returns and allowances
500
1,500
Net sales
$98,500
Cost of goods sold
50,000
Gross profit from sales
$48,500
Opera ng expenses:
Selling expenses:
Sales salaries expense
$11,000
Rent expense, selling space
9,000
Adver sing expense
5,000
Deprecia on expense, store equipment
3,000
Total selling expenses
$28,000
General and administra ve expenses:
Office salaries expense
$9,000
Rent expense, office space
3,000
Office supplies expense
1,500
Deprecia on expense, office equipment
1,000
Insurance expense
1,000
Total general and administra ve expenses
15,500
Total opera ng expenses
43,500
Income from opera ons
$5,000
Other revenues and expenses:
Rent revenue
$12,000
Interest expense
1,500
10,500
Income before tax
$15,500
Income tax expense
3,000
Net income
$12,500
No ce that the classified mul ple-step income statement shows expenses by both func on and
nature. The broad categories that show expenses by func on include opera ng expenses, selling
expenses, and general and administra ve expenses. Within each category, the nature of expenses
is disclosed including sales salaries, adver sing, deprecia on, supplies, and insurance. No ce
that Rent Expense has been divided between two groupings because it applies to more than one
category or func on.
The normal opera ng ac vity for XYZ Inc. is merchandising. Revenues and expenses that are not
part of normal opera ng ac vi es are listed under Other Revenues and Expenses. XYZ Inc. shows
Rent Revenue under Other Revenues and Expenses because this type of revenue is not part of its
merchandising opera ons. Interest earned, dividends earned, and gains on the sale of property,
plant, and equipment are other examples of revenues not related to merchandising opera ons.
XYZ Inc. deducts Interest Expense under Other Revenues and Expenses. Interest expense does not
result from opera ng ac vi es; it is a financing ac vity because it is associated with the borrowing
of money. Another example of a non-opera ng expense is losses on the sale of property, plant, and
equipment. Income tax expense is a government requirement so it is shown separately. No ce
that income tax expense follows the subtotal ‘Income before tax’.
5.6. Closing Entries for a Merchandiser
195
5.6 Closing Entries for a Merchandiser
LO6
–
Explain
the
closing
process
for
a
merchandiser.
The process of recording closing entries for service companies was illus-
trated in Chapter
. The closing procedure for merchandising companies
is the same as for service companies — all income statement accounts
are transferred to the Income Summary account, the Income Summary is
closed to Retained Earnings, and Dividends are closed to Retained Earn-
ings.
When preparing closing entries for a merchandiser, the income statement accounts unique for
merchandisers need to be considered — Sales, Sales Discounts, Sales Returns and Allowances,
and Cost of Goods Sold. Sales is a revenue account so has a normal credit balance. To close Sales,
it must be debited with a corresponding credit to the income summary. Sales Discounts and Sales
Returns and Allowances are both contra revenue accounts so each has a normal debit balance.
Cost of Goods Sold has a normal debit balance because it is an expense. To close these debit
balance accounts, a credit is required with a corresponding debit to the income summary.
An explora on is available on the Lyryx site. Log into your Lyryx course to run
.
5.7 Appendix A: The Periodic Inventory System
LO7
–
Explain
and iden fy the
entries regarding
purchase
and
sales
transac-
ons in a periodic
inventory
sys-
tem.
The perpetual inventory system maintains a con nuous, real- me balance
in both Merchandise Inventory, a balance sheet account, and Cost of Goods
Sold, an income statement account. As a result, the Merchandise inven-
tory general ledger account balance should always equal the value of phys-
ical inventory on hand at any point in me. Addi onally, the Cost of Goods
Sold general ledger account balance should always equal the total cost
of merchandise inventory sold for the accoun ng period. The accounts
should perpetually agree; hence the name. An alternate system is consid-
ered below, called the periodic inventory system.
Descrip on of the Periodic Inventory System
The periodic inventory system does not maintain a constantly-updated merchandise inventory
balance. Instead, ending inventory is determined by a physical count and valued at the end of an
accoun ng period. The change in inventory is recorded only periodically. Addi onally, a Cost of
Goods Sold account is not maintained in a periodic system. Instead, cost of goods sold is calculated
at the end of the accoun ng period.
When goods are purchased using the periodic inventory system, the cost of merchandise is recorded
196
Accoun ng for the Sale of Goods
in a Purchases account in the general ledger, rather than in the Merchandise Inventory account
as is done under the perpetual inventory system. The Purchases account is an income statement
account that accumulates the cost of merchandise acquired for resale.
The journal entry, assuming a purchase of merchandise on credit, is:
General Journal
Date
Account/Explana on
PR
Debit
Credit
Purchases . . . . . . . . . . . . . . . . . . . . . . . . . . . . .
XX
Accounts Payable . . . . . . . . . . . . . . . . . . .
XX
Purchase Returns and Allowances (Periodic)
Under the periodic inventory system, any purchase returns or purchase allowances are accumu-
lated in a separate account called Purchase Returns and Allowances, an income statement ac-
count, and recorded as:
General Journal
Date
Account/Explana on
PR
Debit
Credit
Accounts Payable . . . . . . . . . . . . . . . . . . . . . .
XX
Purchase Returns and Allowances . . . .
XX
Purchase Returns and Allowances is a contra expense account and the balance is deducted from
Purchases when calcula ng cost of goods sold on the income statement.
Purchase Discounts (Periodic)
Another contra expense account, Purchase Discounts, accumulates reduc ons in the purchase
price of merchandise if payment is made within a me period specified in the supplier’s invoice
and recorded as:
General Journal
Date
Account/Explana on
PR
Debit
Credit
Accounts Payable . . . . . . . . . . . . . . . . . . . . . .
XX
Purchase Discounts . . . . . . . . . . . . . . . . .
XX
Transporta on (Periodic)
Under the periodic inventory system, an income statement account called Transporta on-in is
used to accumulate transporta on or freight charges on merchandise purchased for resale. The

5.7. Appendix A: The Periodic Inventory System
197
Transporta on-in account is used in calcula ng the cost of goods sold on the income statement.
It is recorded as:
General Journal
Date
Account/Explana on
PR
Debit
Credit
Transporta on-In . . . . . . . . . . . . . . . . . . . . . .
XX
Cash or Accounts Payable . . . . . . . . . . . .
XX
At the end of the accoun ng period, cost of goods sold must be calculated which requires that the
balance in Merchandise Inventory be determined. To determine the end of the period balance in
Merchandise Inventory, a physical count of inventory is performed. The total value of the inventory
as iden fied by the physical count becomes the ending balance in Merchandise Inventory. Cost of
goods sold can then be calculated as follows:
Beginning Balance of Merchandise Inventory . . . . . .
XX
Plus: Net Cost of Goods Purchased* . . . . . . . . . . . . . .
XX
Less: Ending Balance of Merchandise Inventory . . . .
XX
Equals: Cost of Goods Sold . . . . . . . . . . . . . . . . . . . . . . .
XX
*Net Cost of Goods Purchased is calculated as:
Purchases . . . . . . . . . . . . . . . . . . . . . . . . . . . . . . . . . .
XX
Less: Purchase Returns and Allowances . . . . . . .
XX
Less: Purchase Discounts . . . . . . . . . . . . . . . . . . . .
XX
Equals: Net Purchases. . . . . . . . . . . . . . . . . . . . . . .
XX
Add: Transporta on-In . . . . . . . . . . . . . . . . . . . . . .
XX
Equals: Net Cost of Goods Purchased . . . . . . . . .
XX
Closing Entries (Periodic)
In the perpetual inventory system, the Merchandise Inventory account is con nuously updated
and is adjusted at the end of the accoun ng period based on a physical inventory count. In the
periodic inventory system, the balance in Merchandise Inventory does not change during the ac-
coun ng period. As a result, at the end of the accoun ng period, the balance in Merchandise
Inventory in a periodic system is the beginning balance. In order for the Merchandise Inventory
account to reflect the ending balance as determined by the physical inventory count, the beginning
inventory balance must be removed by credi ng Merchandise Inventory, and the ending inven-
tory balance entered by debi ng it. This is accomplished as part of the closing process. Closing
entries for a merchandiser that uses a periodic inventory system are illustrated below using the
adjusted trial balance informa on for Norva Inc.

198
Accoun ng for the Sale of Goods
Step 1: Close debit balance income statement
Norva Inc.
accounts plus beginning merchandise inventory:
Adjusted Trial Balance
Income Summary
15,200
At December 31, 2015
Merchandise Inventory
1,000
Debits Credits
Sales Discounts
200
Cash
$15,000
Purchases
5,000
Merchandise inventory
1,000
Salaries Expense
7,000
Accounts payable
$ 5,000
Adver sing Expense
2,000
Common shares
8,000
Dividends
500
Step 2: Close credit balance income statement
Retained earnings
3,500
accounts plus ending merchandise inventory:
Sales
13,400
Merchandise Inventory
2,000
Sales discounts
200
Sales
13,400
Purchases
5,000
Purchase Returns & Allowances
800
Purchase returns & allowances
800
Income Summary
16,200
Salaries expense
7,000
Adver sing expense
2,000
Step 3: Close income summary to retained earnings:
Totals
$30,700 $30,700
Income Summary
1,000
Retained Earnings
1,000
Other informa on: The ending balance in
merchandise inventory is $2,000 based on a
Step 4: Close dividends to retained earnings:
physical count.
Retained Earnings
500
Dividends
500
When the closing entries above are posted and a post-closing trial balance prepared as shown
below, no ce that the Merchandise Inventory account reflects the correct balance based on the
physical inventory count.
Norva Inc.
Adjusted Trial Balance
At December 31, 2015
Debits Credits
Cash
$15,000
Merchandise inventory
2,000
Accounts payable
$ 5,000
Common shares
8,000
Retained earnings
4,000
Totals
$17,000 $17,000
An explora on is available on the Lyryx site. Log into your Lyryx course to run
Journalizing Merchandise Transac ons
.
An explora on is available on the Lyryx site. Log into your Lyryx course to run

Summary of Chapter
Learning Objec ves
199
Summary of Chapter 5 Learning Objec ves
LO1 – Describe merchandising and explain the financial statement components
of sales, cost of goods sold, merchandise inventory, and gross profit; differen -
ate between the perpetual and periodic inventory systems.
Merchandisers buy and resell products. Merchandise inventory, an asset, is purchased from sup-
pliers and resold to customers to generate sales revenue. The cost of the merchandise inventory
sold is an expense called cost of goods sold. The profit realized on the sale of merchandise inven-
tory before considering any other expenses is called gross profit. Gross profit may be expressed
as a dollar amount or as a percentage. To track merchandise inventory and cost of goods sold in
real me, a perpetual inventory system is used; the balance in each of Merchandise Inventory and
Cost of Goods Sold is always up-to-date. In a periodic inventory system, a physical count of the
inventory must be performed in order to determine the balance in Merchandise Inventory and
Cost of Goods Sold.
LO2 – Analyze and record purchase transac ons for a merchandiser.
In a perpetual inventory system, a merchandiser debits Merchandise Inventory regarding the pur-
chase of merchandise for resale from a supplier. Any purchase returns and allowances or purchase
discounts are credited to Merchandise Inventory as they occur to keep the accounts up-to-date.
LO3 – Analyze and record sales transac ons for a merchandiser.
In a perpetual inventory system, a merchandiser records two entries at the me of sale: one to
record the sale and a second to record the cost of the sale. Sales returns that are returned to
inventory also require two entries: one to reverse the sale by debi ng a sales returns and al-
lowances account and a second to restore the merchandise to inventory by debi ng Merchandise
Inventory and credi ng Cost of Goods Sold. Sales returns not restored to inventory as well as sales
allowances are recorded with one entry: debit sales returns and allowances and credit cash or ac-
counts receivable. Sales discounts are recorded when a credit customer submits their payment
within the discount period specified.
LO4 – Record adjustments to merchandise inventory.
A physical count of merchandise inventory is performed and the total compared to the general
ledger balance of Merchandise Inventory. Discrepancies are recorded as an adjus ng entry that
debits cost of goods sold and credits Merchandise Inventory.

200
Accoun ng for the Sale of Goods
LO5 – Explain and prepare a classified mul ple-step income statement for a mer-
chandiser.
A classified mul ple-step income statement for a merchandiser is for internal use because of the
detail provided. Sales, less sales returns and allowances and sales discounts, results in net sales.
Net sales less cost of goods sold equals gross profit. Expenses are shown based on both their
func on and nature. The func onal or group headings are: opera ng expenses, selling expenses,
and general and administra ve expenses. Within each grouping, the nature of expenses is detailed
including: deprecia on, salaries, adver sing, wages, and insurance. A specific expense can be
divided between groupings.
LO6 – Explain the closing process for a merchandiser.
The steps in preparing closing entries for a merchandiser are the same as for a service company.
The difference is that a merchandiser will need to close income statement accounts unique to
merchandising such as: Sales, Sales Returns and Allowances, Sales Discounts, and Cost of Goods
Sold.
LO7 – Explain and iden fy the entries regarding purchase and sales transac ons
in a periodic inventory system.
A periodic inventory system maintains a Merchandise Inventory account but does not have a Cost
of Goods Sold account. The Merchandise Inventory account is updated at the end of the account-
ing period as a result of a physical inventory count. Because a merchandiser using a period system
does not use a Merchandise Inventory account to record purchase or sales transac ons during the
accoun ng period, it maintains accounts that are different than under a perpetual system, namely,
Purchases, Purchase Returns and Allowances, Purchase Discounts, and Transporta on-in.
Discussion Ques ons
1. How does the income statement prepared for a company that sells goods differ from that
prepared for a service business?
2. How is gross profit calculated? What rela onships do the gross profit and gross profit per-
centage calcula ons express? Explain, using an example.
3. What are some common types of transac ons that are recorded in the merchandise Inven-
tory account?
4. Contrast and explain the sales and collec on cycle and the purchase and payment cycle.

Exercises
201
5. What contra accounts are used in conjunc on with sales? What are their func ons?
6. (Appendix) Compare the perpetual and periodic inventory systems. What are some advan-
tages of each?
Exercises
EXERCISE 5–1
(LO1)
Consider the following informa on of Jones Corpora on over four years:
2014
2013
2012
2011
Sales
$10,000
$9,000
$
?
$7,000
Cost of Goods Sold
?
6,840
6,160
?
Gross Profit
2,500
?
1,840
?
Gross Profit Percentage
?
?
?
22%
Required:
a. Calculate the missing amounts for each year.
b. What does this informa on indicate about the company?
EXERCISE 5–2
(LO2)
Reber Corp. uses the perpetual inventory system. Its transac ons during July 2015 are as follows:
July 6
Purchased $600 of merchandise on account from Hobson Corpora on for terms 1/10,
net 30.
9
Returned $200 of defec ve merchandise.
15 Paid the amount owing to Hobson.
Required: Prepare journal entries to record the above transac ons for Reber Corp.
EXERCISE 5–3
(LO2,3,4)

202
Accoun ng for the Sale of Goods
Horne Inc. and Sperling Renova ons Ltd. both sell goods and use the perpetual inventory system.
Horne Inc. had $3,000 of merchandise inventory at the start of its fiscal year, January 1, 2015.
During the 2015, Horne Inc. had the following transac ons:
May 5
Horne sold $4,000 of merchandise on account to Sperling Renova ons Ltd., terms 2/10,
net 30. Cost of merchandise to Horne from its supplier was $2,500.
7 Sperling returned $500 of merchandise received in error which Horne returned to
inventory; Horne issued a credit memo. Cost of merchandise to Horne was $300.
15 Horne received the amount due from Sperling Renova ons Ltd.
A physical count and valua on of Horne’s Merchandise Inventory at May 31, the fiscal year-end,
showed $700 of goods on hand.
Required: Prepare journal entries to record the above transac ons and adjustment:
a. In the records of Horne Inc.
b. In the records of Sperling Renova ons Ltd.
EXERCISE 5–4
(LO2,3)
Recording Purchase and Sales Transac ons
Below are transac ons for March, 2016 for AngieJ Ltd.:
March 1
Purchased $25,000 of merchandise on account for terms 2/10, n30.
March 3
Sold merchandise to a customer for $5,000 for terms 1/10, n30. (Cost $2,600)
March 4
Customer from March 3 returned $200 of some unsuitable goods which were re-
turned to inventory. (Cost $100)
March 5
Purchased $15,000 of merchandise from a supplier for cash and arranged for ship-
ping, fob shipping point.
March 6
Paid $200 for shipping on the March 5 purchase.
March 7
Contacted the supplier from March 5 regarding $2,000 of merchandise with some
minor damages. Supplier agreed to reduce the price and offered an allowance of
$500 cash, which was accepted.
March 8
Sold $25,000 of merchandise for terms 1.5/10, n30. (Cost $13,000). Agreed to pay
shipping costs for the goods sold to the customer.
March 9
Shipped the goods sold on March 8 to customer, fob des na on for $500 cash.
(Hint: Shipping costs paid to ship merchandise sold to a customer is an opera ng
expense.)
March 11
Paid for fi y percent of the March 1 purchase to the supplier.
March 13
Collected the account owing from the customer from March 3.
March 15
Purchased office supplies on account for $540 for terms 1/10, n30.
March 18
Ordered merchandise inventory from a supplier totalling $15,000. Goods to be
shipped on April 10, fob shipping point.
March 20
Collected $6,010 cash from an account owing from two months ago. The early pay-
ment discount had expired.

Exercises
203
March 25
Paid for the March 15 purchase.
March 27
Sold $12,500 of merchandise inventory for cash (Cost $5,000).
March 31
Paid the remaining of the amount owing from the March 1 purchase.
Required: Prepare the journal entries, if any, for AngieJ Ltd.
EXERCISE 5–5
(LO2,3)
Recording Purchase and Sales Transac ons
Below are the April, 2016 sales for Beautort Corp.
April 1
Purchased $15,000 of merchandise for cash.
April 3
Sold merchandise to a customer for $8,000 cash. (Cost $4,600)
April 5
Purchased $10,000 of merchandise from a supplier for terms 1/10, n30.
April 7
Returned $2,000 of damaged merchandise inventory from April 5 back to the supplier.
Supplier will repair the items and return them to their own inventory.
April 8
Sold $8,000 of merchandise for terms 2/10, n30. (Cost $4,000). Agreed to pay ship-
ping costs for the goods sold to the customer.
April 9
Shipped the goods sold on April 8 to customer, fob shipping point for $500 cash. (Hint:
Shipping costs paid to ship merchandise sold to a customer is not an inventory cost.)
April 10
Customer from April 3 returned $1,000 of unsuitable goods which were returned to
inventory. (Cost $400). Amount paid was refunded.
April 10
Agreed to give customer from April 8 sale a sales allowance of $200.
April 12
Purchased inventory on account for $22,000 for terms 1/10, n30.
April 15
Paid amount owing for purchases on April 5.
April 16
Paid $600 for shipping on the April 12 purchase.
April 18
Collected $5,000 cash, net of discount, for the customer account owing from April 8.
April 27
Paid for the April 12 purchase.
April 27
Sold $20,000 of merchandise inventory for cash (Cost $10,000).
Required: Prepare the journal entries, if any, for Beautort Corp. Round final entry amounts to the
nearest whole dollar.
EXERCISE 5–6
(LO5)
The following informa on is taken from the records of Smith Corp. for the year ended June 30,
2015:
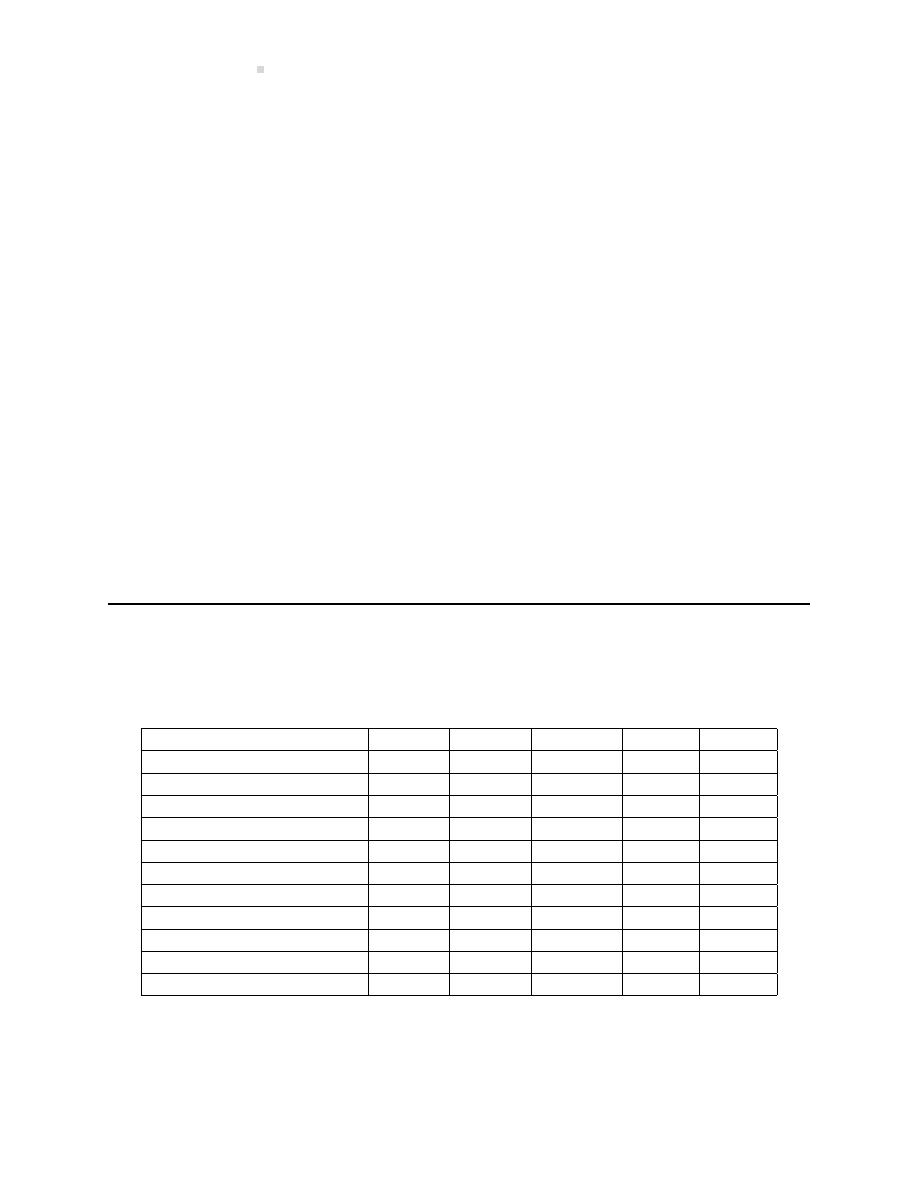
204
Accoun ng for the Sale of Goods
Adver sing Expense
$
1,500
Commissions Expense
4,000
Cost of Goods Sold
50,000
Delivery Expense
500
Deprecia on Expense – Equipment
500
Insurance Expense
1,000
Office Salaries Expense
3,000
Rent Expense – Office
1,000
Rent Expense – Store
1,500
Sales Salaries Expense
2,000
Sales
72,000
Sales Returns and Allowances
2,000
Required:
a. Prepare a classified mul -step income statement for the year ended June 30, 2015. Assume
an income tax rate of 20%.
b. Compute the gross profit percentage, rounding to two decimal places.
EXERCISE 5–7
(LO4)
Calcula ng Inventory and Cost of Goods Sold
Below is a table that contains two important calcula ons that link together to determine net in-
come/(loss):
Inventory, opening balance
$ 10,000
$ 53,000
?
168,540
50,562
Plus: purchases
30,000
?
1,685,400
?
?
Total goods available for sale
?
212,000
2,247,200
?
657,306
Less: ending inventory
15,000
?
842,700
556,180
100,000
Cost of goods sold
?
132,500
?
?
?
Sales
?
240,000
1,600,000
900,000
?
Less: cost of goods sold
?
?
?
?
?
Gross profit
30,000
?
?
276,400
142,694
Less: opera ng expenses
12,000
?
275,000
?
?
Net income/(loss)
?
43,900
?
26,400
(2,306)
Gross profit/sales (%)
?
?
?
?
?
Required: Calculate the missing account balances using the rela onships between these accounts.
Percentage can be rounded to the nearest two decimal places.

Exercises
205
EXERCISE 5–8
(LO6)
Refer to the informa on in EXERCISE
.
Required:
a. Prepare all closing entries. Assume cash dividends totalling $2,000 were declared during
the year and recorded as a debit to Dividends Declared and a credit to Cash.
b. Calculate the June 30, 2015 post-closing balance in Retained Earnings assuming a beginning
balance of $18,000.
EXERCISE 5–9
(LO7 Appendix)
Consider the informa on for each of the following four companies.
A
B
C
D
Opening Inventory
$
?
$ 184
$ 112
$ 750
Purchases
1415
?
840
5,860
Transporta on-In
25
6
15
?
Cost of Goods Available for Sale
1,940
534
?
6,620
Ending Inventory
340
200
135
?
Cost of Goods Sold
?
?
?
5,740
Required: Calculate the missing amounts.
EXERCISE 5–10
(LO7 Appendix)
The following data pertain to Pauling Inc.
Opening Inventory
$ 375
Purchases
2930
Purchases Discounts
5
Purchases Returns and Allowances
20
Transporta on-In
105
Ending inventory amounts to $440.

206
Accoun ng for the Sale of Goods
Required: Calculate cost of goods sold.
EXERCISE 5–11
(LO7 Appendix)
The following informa on is taken from the records of four different companies in the same in-
dustry:
A
B
C
D
Sales
$300
$150
$
?
$
90
Opening Inventory
?
40
40
12
Purchases
240
?
?
63
Cost of Goods Available for Sale
320
?
190
?
Ending Inventory
?
(60)
(60)
(15)
Cost of Goods Sold
?
100
130
60
Gross Profit
$100
$
?
$
65
$
?
Gross Profit percentage
?
?
?
?
Required:
a. Calculate the missing amounts.
b. Which company seems to be performing best? Why?
Problems
PROBLEM 5–1
(LO1,2,3,4)
Salem Corp. was incorporated on July 2, 2015 to operate a merchandising business. It uses the
perpetual inventory system. All its sales are on account with terms: 2/10, n30. Its transac ons
during July 2015 are as follows:
July 2
Issued share capital for $5,000 cash.
2 Purchased $3,500 merchandise on account from Blic Pens Ltd. for terms 2/10, n30.
2 Sold $2,000 of merchandise on account to Spellman Chair Rentals Inc. (Cost to Salem:
$1,200).
3 Paid Sayer Holdings Corp. $500 for July rent.
5 Paid Easton Furniture Ltd. $1,000 for equipment.
8 Collected $200 for a cash sale made today to Ethan Ma hews Furniture Ltd. (Cost:
$120).

Problems
207
8 Purchased $2,000 merchandise on account from Shaw Distributors Inc. for terms 2/15,
n30.
9 Received the amount due from Spellman Chair Rentals Inc. for the July 2 sale.
10 Paid Blic Pens Ltd. for the July 2 purchase.
10 Purchased $200 of merchandise on account from Peel Products Inc. for terms n30.
15 Sold $2,000 of merchandise on account to Eagle Products Corp. (Cost: $1,300).
15 Purchased $1,500 of merchandise on account from Bevan Door Inc. for terms 2/10,
n30.
15 Received a memo from Shaw Distributors Inc. to reduce accounts payable by $100 for
defec ve merchandise included in the July 8 purchase.
16 Eagle Products Corp. returned $200 of defec ve merchandise which was scrapped (Cost
to Salem: $150).
20 Sold $3,500 of merchandise on account to Aspen Promo ons Ltd. (Cost: $2,700).
20 Paid Shaw Distributors Inc. for half the purchase made July 8.
24 Received half the amount due from Eagle Products Corp. in par al payment for the July
15 sale.
24 Paid Bevan Doors Ltd. for the purchase made July 15.
26 Sold $600 merchandise on account to Longbeach Sales Ltd. (Cost: $400).
26 Purchased $800 of merchandise on account from Silverman Co. for terms 2/10, n30.
31 Paid Speedy Transport Co. $350 for transporta on to Salem’s warehouse during the
month (all purchases are fob shipping point).
Required:
1. Prepare journal entries to record the July transac ons. Include general ledger account num-
bers and a brief descrip on.
2. Calculate the unadjusted ending balance in merchandise inventory.
3. Assume the merchandise inventory is counted at July 31 and assigned a total cost of $2,400.
Prepare the July 31 adjus ng entry.
PROBLEM 5–2
(LO1,5,6)
The following closing entries were prepared for Whirlybird Products Inc. at December 31, 2015,
the end of its fiscal year.
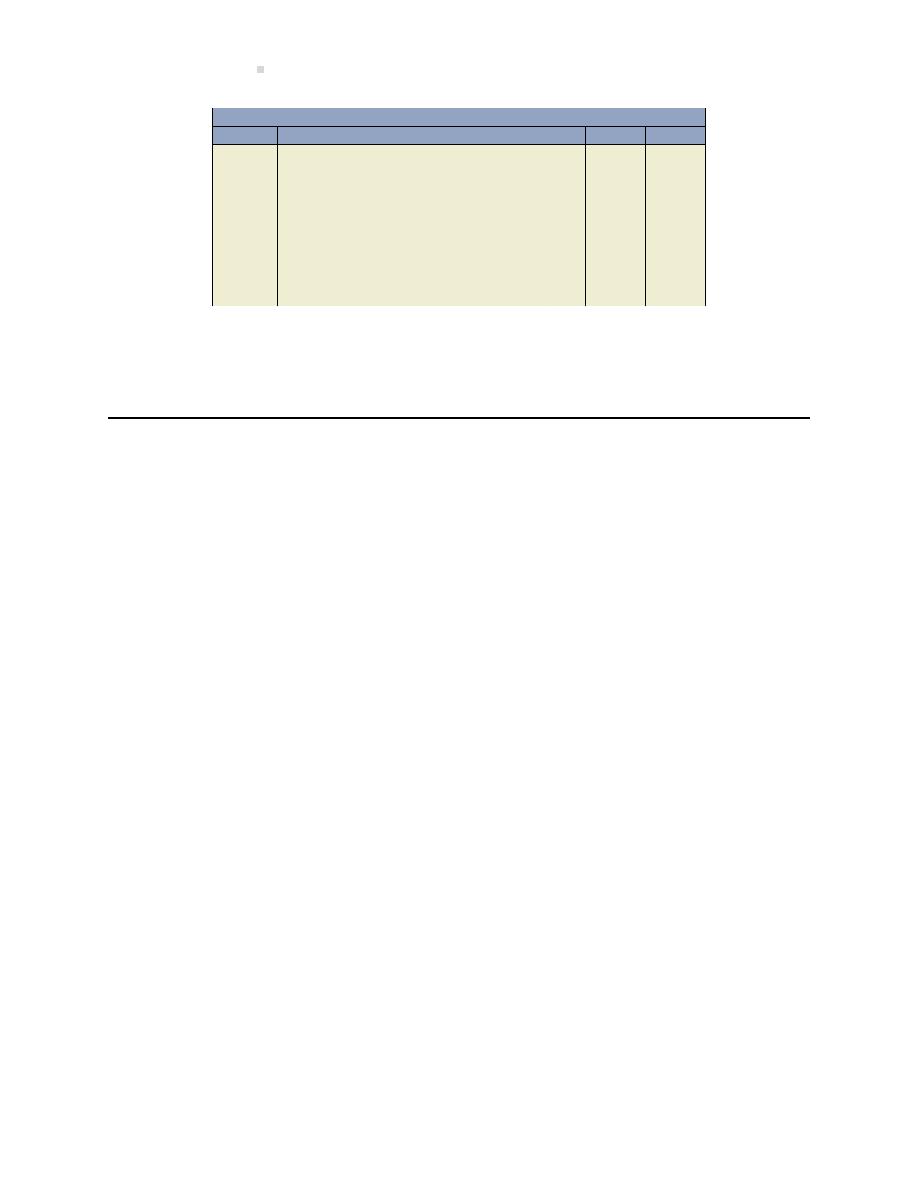
208
Accoun ng for the Sale of Goods
General Journal
Date
Account/Explana on
PR
Debit
Credit
Dec. 31
Sales . . . . . . . . . . . . . . . . . . . . . . . . . . . . . . . . . .
37,800
Income Summary . . . . . . . . . . . . . . . . . . .
37,800
31
Income Summary . . . . . . . . . . . . . . . . . . . . . .
32,800
Cost of Goods Sold . . . . . . . . . . . . . . . . . .
26,800
Sales Returns and Allowances . . . . . . . .
690
Sales Discounts . . . . . . . . . . . . . . . . . . . . .
310
Salaries Expenses . . . . . . . . . . . . . . . . . . .
5,000
31
Income Summary . . . . . . . . . . . . . . . . . . . . . .
5,000
Retained Earnings . . . . . . . . . . . . . . . . . . .
5,000
Required: Calculate gross profit.
PROBLEM 5–3
(LO1,5,6)
The following alphabe zed adjusted trial balance has been extracted from the records of Acme
Automo ve Inc. at December 31, 2015, its third fiscal year-end. All accounts have a normal bal-
ance.
Accounts Payable
9,000
Accounts Receivable
15,000
Accumulated Deprecia on – Equipment
36,000
Adver sing Expense
14,000
Bank Loan
14,000
Cash
2,000
Commissions Expense
29,000
Cost of Goods Sold
126,000
Delivery Expense
14,800
Deprecia on Expense
12,000
Dividends
11,000
Equipment
120,000
Income Taxes Expense
4,200
Income Taxes Payable
4,200
Insurance Expense
10,400
Interest Expense
840
Merchandise Inventory
26,000
Office Supplies Expense
3,100
Rent Expense
32,400
Rent Revenue
19,200
Retained Earnings
12,440
Sales
310,000
Sales Discounts
1,300
Sales Returns and Allowances
2,900

Problems
209
Sales Salaries Expense
26,400
Share Capital
70,000
Supplies
3,200
Telephone Expense
1,800
U li es Expense
4,200
Wages Expense – Office
14,300
Required:
1. Prepare a classified mul -step income statement and statement of changes in equity for the
year ended December 31, 2015. Assume 40% of the Rent Expense is allocated to general
and administra ve expenses with the remainder allocated to selling expenses. Addi onally,
assume that $20,000 of shares were issued during the year ended December 31, 2015.
2. Prepare closing entries.
PROBLEM 5–4
(LO1,2,3,4)
Challenge Ques on – Pulling It All Together
Calcula ng Purchases, Inventory Shrinkage, Net Sales, Cost Goods Sold, Gross Profit, and Net In-
come/(Loss)
The informa on below is a summary of the merchandise inventory and sales transac ons for 2016.
Total cost of purchases
$250,000
Total sales
580,000
Purchases shipping costs
500
Merchandise inventory, opening balance
55,000
Purchase discounts
3,500
Sales discounts
200
Total sales returns to inventory
100
Merchandise inventory, closing GL balance
90,000
Merchandise inventory, physical inventory count
88,500
Sales allowances
600
Opera ng expenses
250,000
Sales returns
200
Purchase returns and allowances
200
Net purchases
?
Inventory shrinkage adjustment amount
?
Cost of goods sold
?
Net sales
?
Gross profit
?
Net income/(loss)
?
Gross profit ra o
?

210
Accoun ng for the Sale of Goods
Required: Calculate and fill in the blanks. (Hint: Refer to the merchandising company illustra on
in Sec on
and the T-account summary illustra ons for inventory and cost of goods sold at the
end of Sec on
.)
PROBLEM 5–5
(LO1,2,3,5,6)
Preparing a Classified Mul ple-step Income Statement and Clos-
ing Entries
Below is the adjusted trial balance presented in alphabe cal order for Turret Retail Ltd., for 2016.
Their year-end is December 31.

Problems
211
Turret Retail Ltd.
Trial Balance
At December 31, 2016
Accounts payable
$ 31,250
Accounts receivable
$140,000
Accrued salaries and benefits payable
12,000
Accumulated deprecia on, furniture
4,300
Cash
21,000
Cash dividends
10,000
Cost of goods sold
240,000
Bank loan payable (long-term)
40,320
Deprecia on expense
3,200
Copyright
20,000
Furniture
20,000
Income tax expense
2,028
Income taxes payable
8,000
Insurance expense
5,000
Interest expense
200
Interest payable
550
Land
140,000
Merchandise inventory
120,000
Prepaid insurance expense
6,000
Rent expense
30,240
Rental income
6,000
Retained earnings
307,748
Salaries expense
57,000
Sales
360,000
Sales discounts
3,600
Sales returns and allowances
9,600
Share capital
20,000
Shop supplies expense
2,400
Shop supplies expense
1,000
Travel expense
2,100
Unearned revenue
50,500
U li es expense
7,300
$840,668
$840,668
Required:
1. Prepare a classified mul ple-step income statement in good form, repor ng opera ng ex-
penses by nature, for the year ended December 31, 2016.

212
Accoun ng for the Sale of Goods
2. Prepare the closing entries for the year-ended December 31, 2016.
3. Calculate the gross profit ra o to two decimal places and comment on what this ra o means.
PROBLEM 5–6
(LO1,2,3,4,5)
Challenge Ques on – Preparing Adjus ng Entries and a Classi-
fied Mul ple-step Income Statement
Below are the unadjusted accounts balances for Yuba Yabi Enterprises Ltd., for the year ended
March 31, 2017. All account balances are normal. Yuba Yabi’s business involves selling frozen
food to restaurants as well as providing consul ng services to assist restaurant businesses with
their daily opera ons.

Problems
213
Yuba Yabi Enterprises Ltd.
Unadjusted Trial Balance
March 31, 2017
Accounts payable
68,750
Accounts receivable
308,000
Accrued salaries and benefits payable
26,400
Accumulated deprecia on, furniture
9,460
Cash
46,200
Cash dividends
22,000
Cost of goods sold
528,000
Adver sing expense
9,900
Bank loan payable (long-term)
88,704
Deprecia on expense
7,040
Copyright
44,000
Franchise
66,000
Furniture
44,000
Income tax expense
-
Income taxes payable
17,600
Insurance expense
11,000
Interest expense
440
Interest payable
1,210
Land
308,000
Merchandise inventory
264,000
Prepaid insurance expense
13,200
Prepaid adver sing expense
8,800
Rent expense
66,528
Rental income
13,200
Retained earnings
265,364
Salaries expense
125,400
Sales
792,000
Sales discounts
7,920
Sales returns and allowances
21,120
Service revenue
495,000
Share capital
44,000
Shop supplies
8,360
Shop supplies expense
2,200
Travel expense
4,620
Unearned service revenue
111,100
U li es expense
16,060
Addi onal informa on:
The following are adjus ng entries that have not yet been recorded:

214
Accoun ng for the Sale of Goods
Accrued salaries
$12,000
Accrued interest on the bank loan
5,600
Inventory shrinkage
7,800
Prepaid insurance expense
5,000 has expired
Prepaid adver sing expense
no change
Unearned revenue
30,000 has been earned
Income tax rate
30%
Required:
1. Update the affected accounts by the adjustments, if any. Round all adjustments to the near-
est whole dollar.
2. Prepare a classified mul ple-step income statement in good form for the year ended March
31, 2017.

Chapter 6
Assigning Costs to Merchandise
Recording transac ons related to the purchase and sale of merchandise inventory was introduced
and discussed in Chapter
. This chapter reviews how the cost of goods sold is calculated using
various inventory cost flow assump ons. Addi onally, issues related to merchandise inventory
that remains on hand at the end of an accoun ng period are also explored.
Chapter 6 Learning Objec ves
LO1 – Calculate cost of goods sold and merchandise inventory using specific iden fica on,
first-in first-out (FIFO), and weighted average cost flow assump ons — perpetual.
LO2 – Explain the impact on financial statements of inventory cost flows and errors.
LO3 – Explain and calculate lower of cost and net realizable value inventory adjustments.
LO4 – Es mate merchandise inventory using the gross profit method and the retail inventory
method.
LO5 – Explain and calculate merchandise inventory turnover.
LO6 – Calculate cost of goods sold and merchandise inventory using specific iden fica on,
first-in first-out (FIFO), and weighted average cost flow assump ons — periodic.
Concept Self-Check
Use the following as a self-check while working through Chapter
1. What three inventory cost flow assump ons can be used in perpetual inventory systems?
2. What impact does the use of different inventory cost flow assump ons have on financial
statements?
3. What is the meaning of the term lower of cost and net realizable value, and how is it calcu-
lated?
4. What is the effect on net income of an error in ending inventory values?
5. What methods are used to es mate ending inventory?
6. What ra o can be used to evaluate the liquidity of merchandise inventory?
215

216
Assigning Costs to Merchandise
7. What inventory cost flow assump ons can be used in a periodic inventory system?
NOTE: The purpose of these ques ons is to prepare you for the concepts introduced in the chap-
ter. Your goal should be to answer each of these ques ons as you read through the chapter. If,
when you complete the chapter, you are unable to answer one or more the Concept Self-Check
ques ons, go back through the content to find the answer(s). Solu ons are not provided to these
ques ons.
6.1 Inventory Cost Flow Assump ons
LO1 – Calculate
cost of goods sold
and merchandise
inventory
using
specific
iden -
fica on, first in
first-out
(FIFO),
and
weighted
average cost flow
assump ons
—
perpetual.
Determining the cost of each unit of inventory, and thus the total cost
of ending inventory on the balance sheet, can be challenging. Why? We
know from Chapter
that the cost of inventory can be affected by dis-
counts, returns, transporta on costs, and shrinkage. Addi onally, the pur-
chase cost of an inventory item can be different from one purchase to the
next. For example, the cost of coffee beans could be $5.00 a kilo in Octo-
ber and $7.00 a kilo in November. Finally, some types of inventory flow
into and out of the warehouse in a specific sequence, while others do not.
For example, milk would need to be managed so that the oldest milk is
sold first. In contrast, a car dealership has no control over which vehicles
are sold because customers make specific choices based on what is avail-
able. So how is the cost of a unit in merchandise inventory determined?
There are several methods that can be used. Each method may result in a
different cost, as described in the following sec ons.
Assume a company sells only one product and uses the perpetual inventory system. It has no
beginning inventory at June 1, 2015. The company purchased five units during June as shown in
Figure
Purchase Transac on
Date
Number of units
Price per unit
June 1
1
$1
5
1
2
7
1
3
21
1
4
28
1
5
5
$15
Figure 6.1: June Purchases and Purchase Price per Unit
At June 28, there are 5 units in inventory with a total cost of $15 ($1 + $2 + $3 + $4 + $5). Assume
four units are sold June 30 for $10 each on account. The cost of the four units sold could be
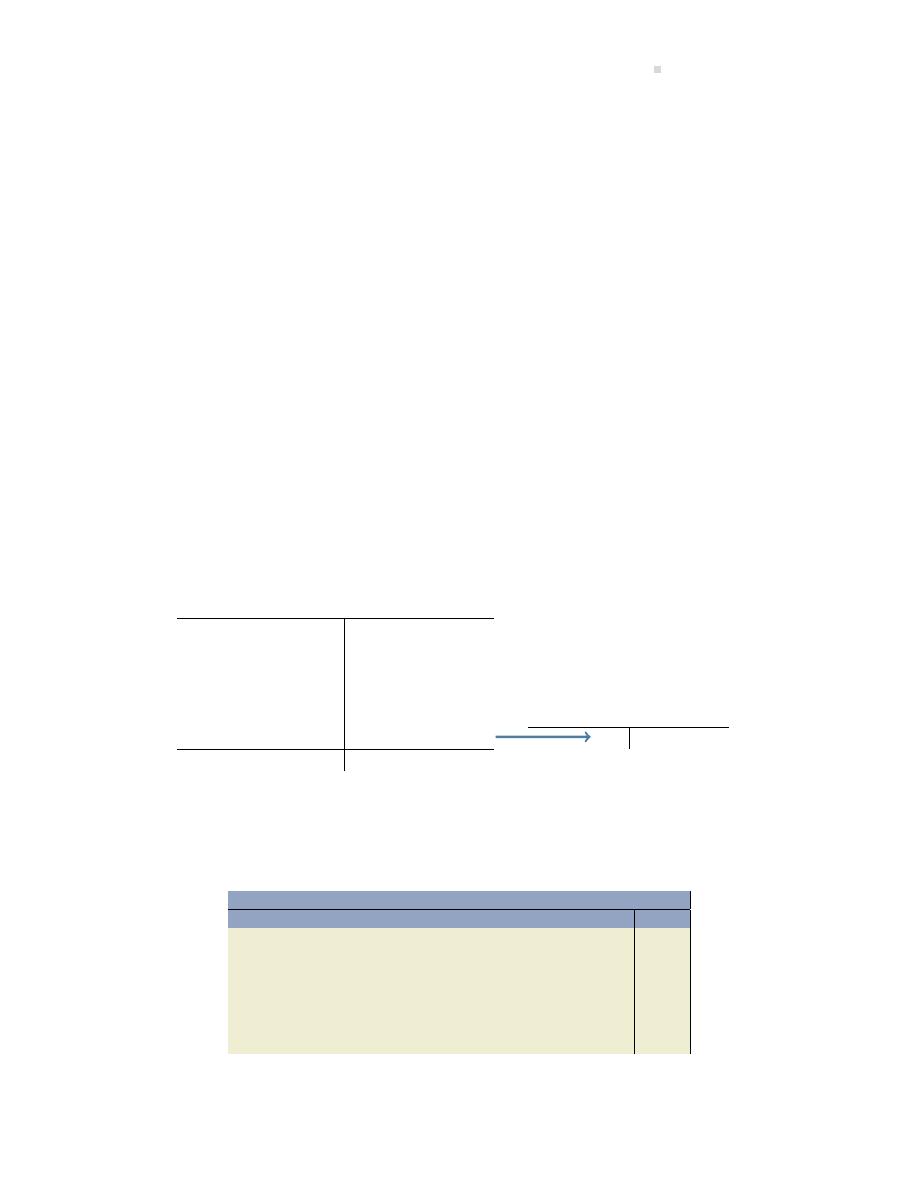
6.1. Inventory Cost Flow Assump ons
217
determined based on iden fying the cost associated with the specific units sold. For example, a car
dealership tracks the cost of each vehicle purchased and sold. Alterna vely, a business that sells
perishable items would want the oldest units to move out of inventory first to minimize spoilage.
Finally, if large quan
es of low dollar value items are in inventory, such as pencils or hammers,
an average cost might be used to calculate cost of goods sold. A business may choose one of three
methods to calculate cost of goods and the resul ng ending inventory based on an assumed flow.
These methods are: specific iden fica on, FIFO, and weighted average, and are discussed in the
next sec ons.
Specific Iden fica on
Under specific iden fica on, each inventory item that is sold is matched with its purchase cost.
This method is most prac cal when inventory consists of rela vely few, expensive items, par cu-
larly when individual units can be iden fied with serial numbers — for example, motor vehicles.
Assume the four units sold on June 30 are those purchased on June 1, 5, 7, and 28. The fourth
unit purchased on June 21 remains in ending inventory. Cost of goods sold would total $11 ($1 +
$2 + $3 + $5). Sales would total $40 (4 @ $10). As a result, gross profit would be $29 ($40 – 11).
Ending inventory would be $4, the cost of the unit purchased on June 21.
The general ledger T-accounts for Merchandise Inventory and Cost of Goods Sold would show:
Merchandise Inventory
Jun. 1
$1
5
2
7
3
21
4
28
5
Cost of Goods Sold
11
Jun.
30
11
End. Bal.
4
Figure 6.2: Cost of Goods Sold using Specific Iden fica on
The entry to record the June 30 sale on account would be:
General Journal
Date
Account/Explana on
PR
Debit
Credit
Accounts Receivable . . . . . . . . . . . . . . . . . . .
40
Sales . . . . . . . . . . . . . . . . . . . . . . . . . . . . . .
40
To record the sale of merchandise on ac-
count.
Cost of Goods Sold . . . . . . . . . . . . . . . . . . . . .
11
Merchandise Inventory . . . . . . . . . . . . . .
11
To record the cost of the sale.
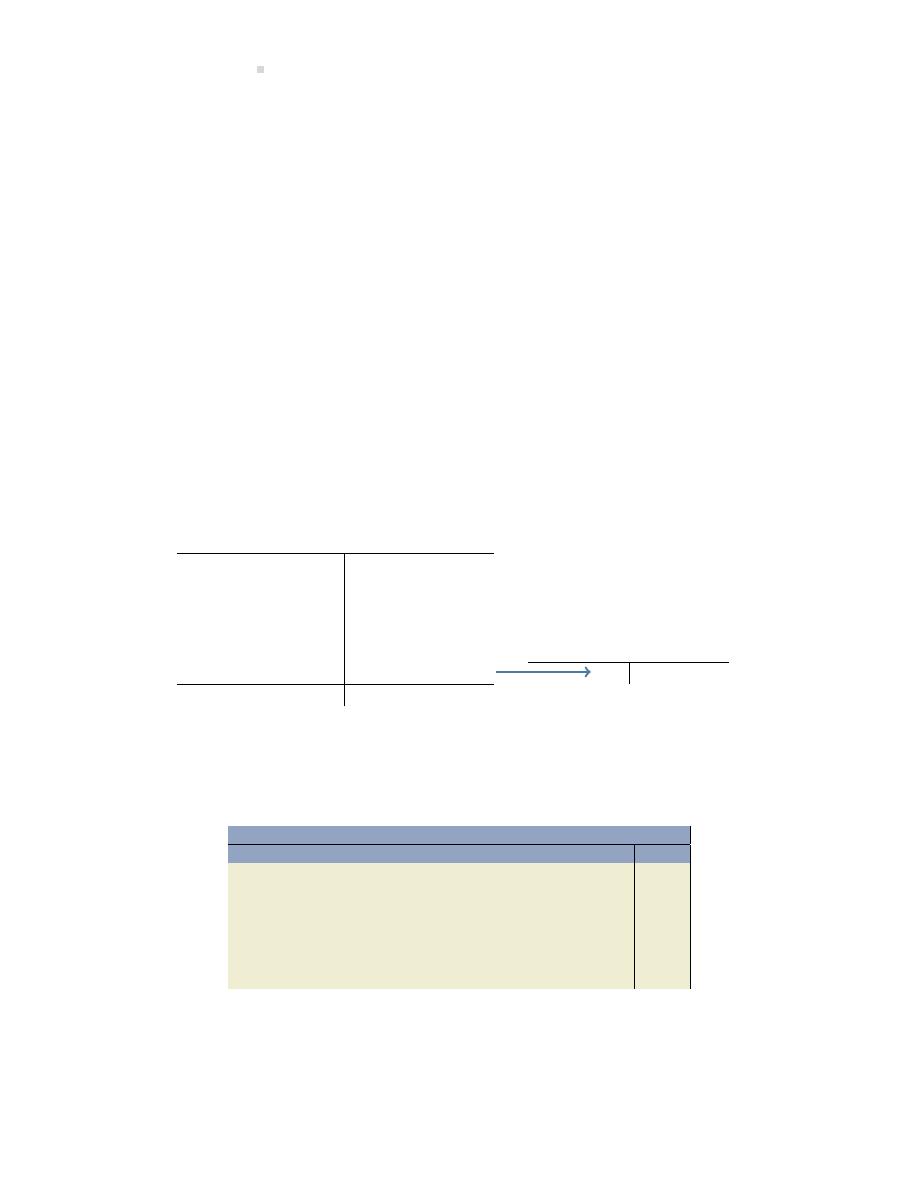
218
Assigning Costs to Merchandise
It is not possible to use specific iden fica on when inventory consists of a large number of simi-
lar, inexpensive items that cannot be easily differen ated. Consequently, a method of assigning
costs to inventory items based on an assumed flow of goods can be adopted. Two such generally
accepted methods, known as cost flow assump ons, are discussed next.
The First-in, First-out (FIFO) Cost Flow Assump on
First-in, first-out (FIFO) assumes that the first goods purchased are the first ones sold. A FIFO cost
flow assump on makes sense when inventory consists of perishable items such as groceries and
other me-sensi ve goods.
Using the informa on from the previous example, the first four units purchased are assumed to
be the first four units sold under FIFO. The cost of the four units sold is $10 ($1 + $2 + $3 + $4).
Sales s ll equal $40, so gross profit under FIFO is $30 ($40 – $10). The cost of the one remaining
unit in ending inventory would be the cost of the fi h unit purchased ($5).
The general ledger T-accounts for Merchandise Inventory and Cost of Goods Sold as illustrated in
Figure
would show:
Merchandise Inventory
Jun. 1
$1
5
2
7
3
21
4
28
5
Cost of Goods Sold
10
Jun. 30
10
End. Bal.
5
Figure 6.3: Cost of Goods Sold using FIFO
The entry to record the sale would be:
General Journal
Date
Account/Explana on
PR
Debit
Credit
Accounts Receivable . . . . . . . . . . . . . . . . . . .
40
Sales . . . . . . . . . . . . . . . . . . . . . . . . . . . . . .
40
To record the sale of merchandise on ac-
count.
Cost of Goods Sold . . . . . . . . . . . . . . . . . . . . .
10
Merchandise Inventory . . . . . . . . . . . . . .
10
To record the cost of the sale.
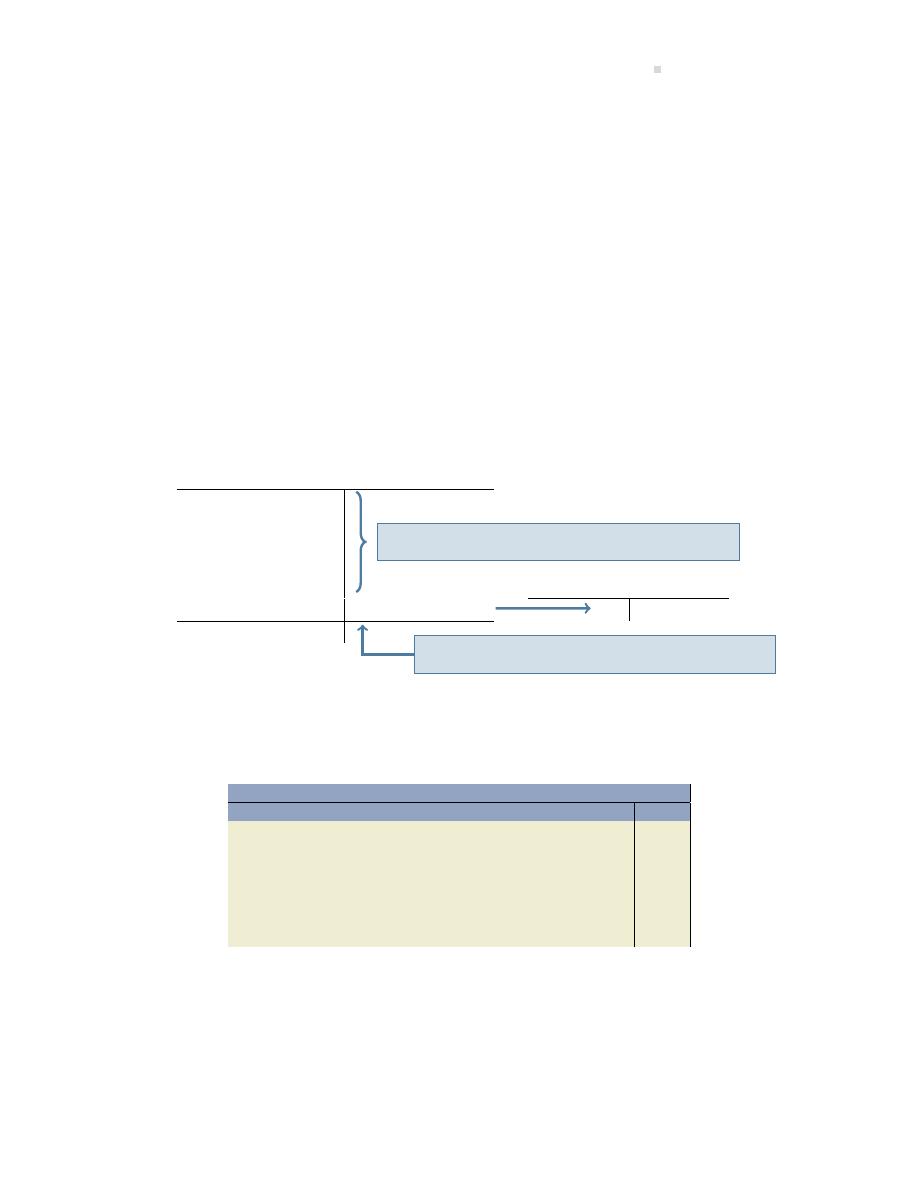
6.1. Inventory Cost Flow Assump ons
219
The Weighted Average Cost Flow Assump on
A weighted average cost flow is assumed when goods purchased on different dates are mixed
with each other. The weighted average cost assump on is popular in prac ce because it is easy
to calculate. It is also suitable when inventory is held in common storage facili es — for example,
when several crude oil shipments are stored in one large holding tank. To calculate a weighted
average, the total cost of all purchases of a par cular inventory type is divided by the number of
units purchased.
To calculate the weighted average cost in our example, the purchase prices for all five units are
totaled ($1 + $2 + $3 + $4 + $5 = $15) and divided by the total number of units purchased (5). The
weighted average cost for each unit is $3 ($15/5). The weighted average cost of goods sold would
be $12 (4 units @ $3). Sales s ll equal $40 resul ng in a gross profit under weighted average of
$28 ($40 – $12). The cost of the one remaining unit in ending inventory is $3.
The general ledger T-accounts for Merchandise Inventory and Cost of Goods Sold are:
Merchandise Inventory
Jun. 1
$1
5
2
7
3
21
4
28
5
Cost of Goods Sold
12
Jun. 30
12
End. Bal.
3
= $15 total cost/5 units = $3 avg. cost/unit
4 units sold @ $3 avg. cost/unit = $12 COGS
Figure 6.4: Cost of Goods Sold using Weighted Average
The entry to record the sale would be:
General Journal
Date
Account/Explana on
PR
Debit
Credit
Accounts Receivable . . . . . . . . . . . . . . . . . . .
40
Sales . . . . . . . . . . . . . . . . . . . . . . . . . . . . . .
40
To record the sale of merchandise on ac-
count.
Cost of Goods Sold . . . . . . . . . . . . . . . . . . . . .
12
Merchandise Inventory . . . . . . . . . . . . . .
12
To record the cost of the sale.
Cost Flow Assump ons: A Comprehensive Example
Recall that under the perpetual inventory system, cost of goods sold is calculated and recorded in
the accoun ng system at the me when sales are recorded. In our simplified example, all sales
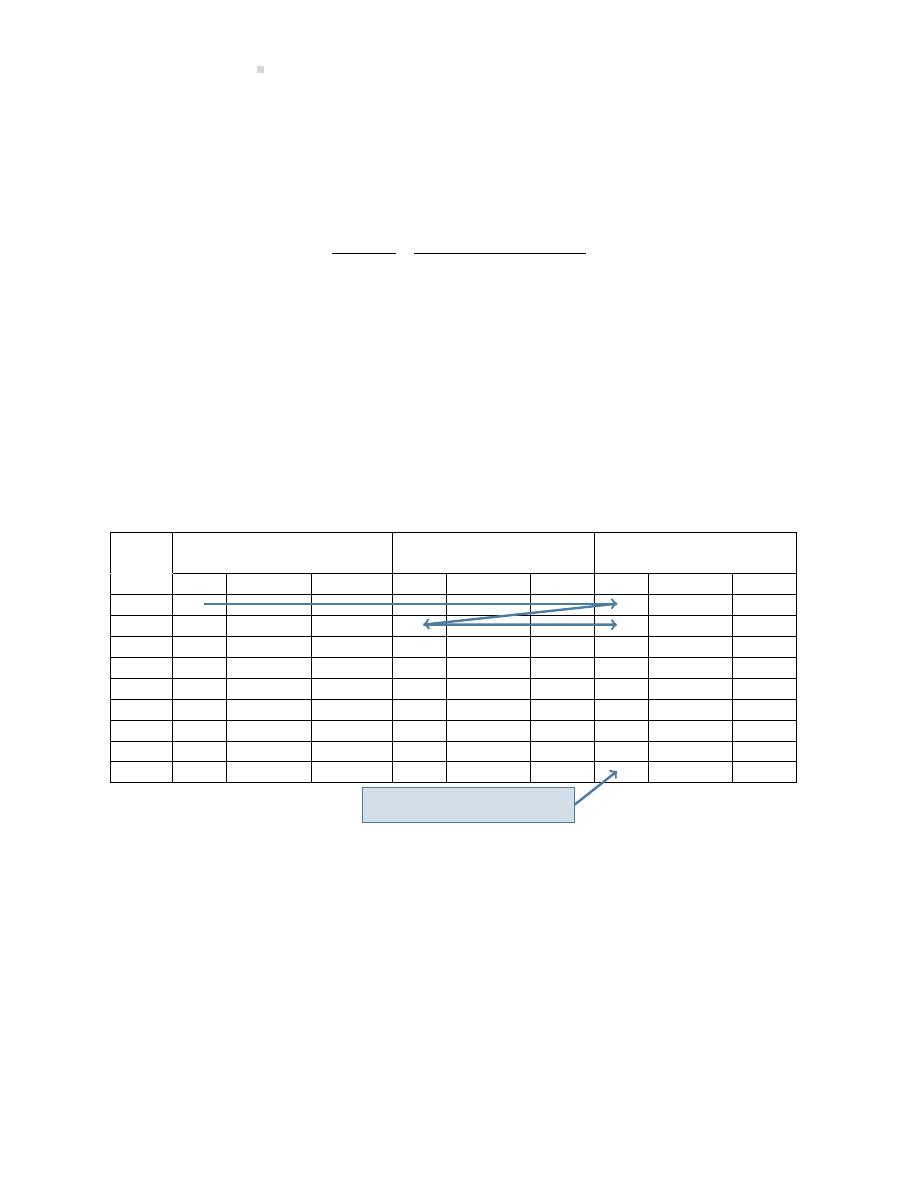
220
Assigning Costs to Merchandise
occurred on June 30 a er all inventory had been purchased. In reality, the purchase and sale
of merchandise is con nuous. To demonstrate the calcula ons when purchases and sales occur
con nuously throughout the accoun ng period, let’s review a more comprehensive example.
Assume the same example as above, except that sales of units occur as follows during June:
Date
Number of Units Sold
June 3
1
8
1
23
1
29
1
To help with the calcula on of cost of goods sold, an inventory record card will be used to track the
individual transac ons. This card records informa on about purchases such as the date, number
of units purchased, and purchase cost per unit. It also records cost of goods sold informa on: the
date of sale, number of units sold, and the cost of each unit sold. Finally, the card records the
balance of units on hand, the cost of each unit held, and the total cost of the units on hand. A
par ally-completed inventory record card is shown in Figure
below:
Purchases/Shipping Costs/
Cost of Goods Sold/
(Purchase Returns/Discounts)
(Returns to Inventory)
Balance in Inventory
Date
Units
Cost/Unit
Total $
Units
Cost/Unit
Total $
Units
Cost/Unit
Total $
June 1
1
1
3
1
0
5
1
1
7
1
2
8
1
1
21
1
2
23
1
1
28
1
2
29
1
1
Ending Inventory is 1 unit.
Figure 6.5: Inventory Record Card
In Figure
, the inventory at the end of the accoun ng period is one unit. This is the number of
units on hand according to the accoun ng records. A physical inventory count must s ll be done,
generally at the end of the fiscal year, to verify the quan
es actually on hand. As discussed in
Chapter
, any discrepancies iden fied by the physical inventory count are adjusted for as shrink-
age.
As purchases and sales are made, costs are assigned to the goods using the chosen cost flow
assump on. This informa on is used to calculate the cost of goods sold amount for each sales
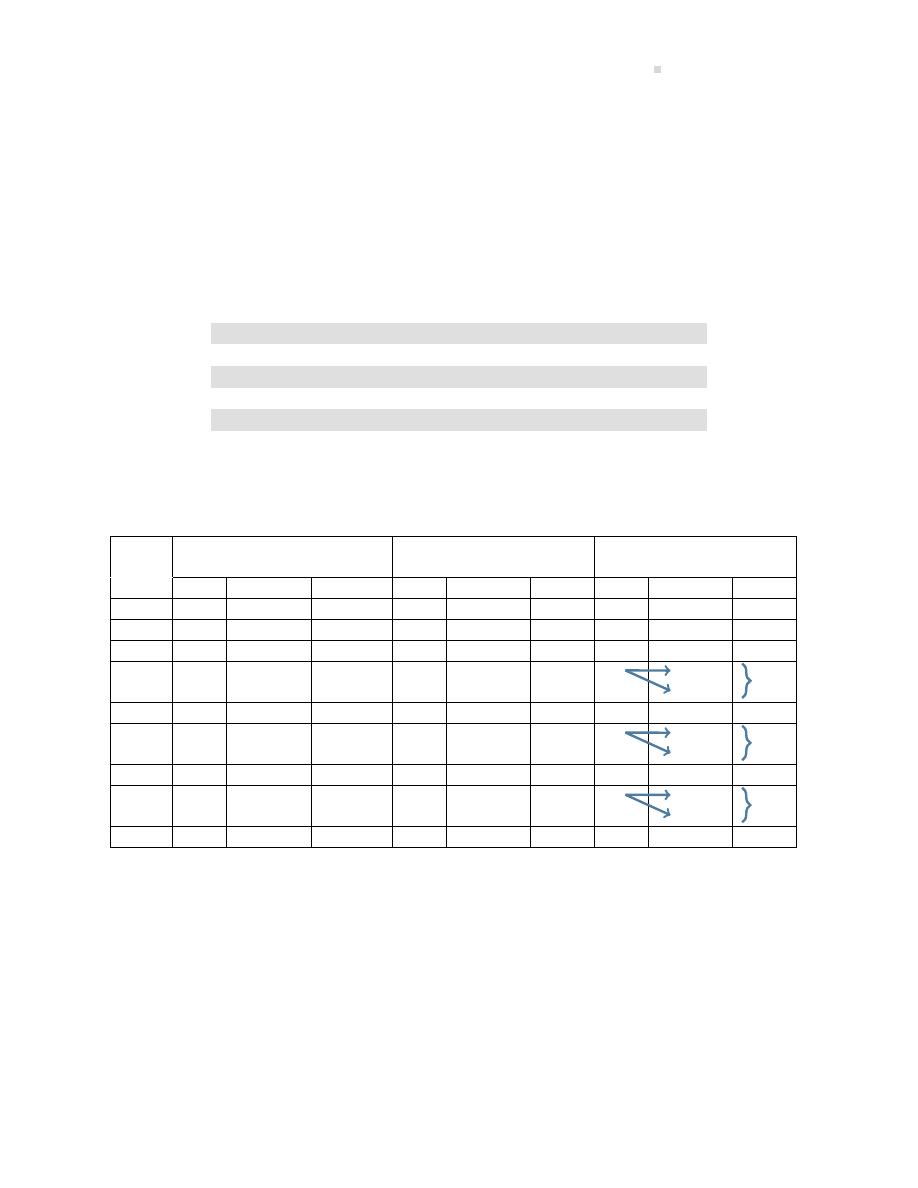
6.1. Inventory Cost Flow Assump ons
221
transac on at the me of sale. These costs will vary depending on the inventory cost flow as-
sump on used. As we will see in the next sec ons, the cost of sales may also vary depending on
when sales occur.
Comprehensive Example—Specific Iden fica on
To apply specific iden fica on, we need informa on about which units were sold on each date.
Assume that specific units were sold as detailed below.
Date of Sale Specific Units Sold
June 3
The unit sold on June 3 was purchased on June 1
8
The unit sold on June 8 was purchased on June 7
23
The unit sold on June 23 was purchased on June 5
29
The unit sold on June 29 was purchased on June 28
Using the informa on above to apply specific iden fica on, the resul ng inventory record card
appears in Figure
.
Purchases/Shipping Costs/
Cost of Goods Sold/
(Purchase Returns/Discounts)
(Returns to Inventory)
Balance in Inventory
Date
Units
Cost/Unit
Total $
Units
Cost/Unit
Total $
Units
Cost/Unit
Total $
June 1
1
$1
$1
1
$1
$1
3
1
$1
$1
0
$0
$0
5
1
$2
$2
1
$2
$2
7
1
$3
$3
2
1@$2
1@$3
8
1
$3
$3
1
$2
$2
21
1
$4
$4
2
1@$2
1@$4
23
1
$2
$2
1
$4
$4
28
1
$5
$5
2
1@$4
1@$5
29
1
$5
$5
1
$4
$4
$5
$6
$9
Figure 6.6: Inventory Record Card using Specific Iden fica on
No ce in Figure
that the number of units sold plus the units in ending inventory equals the
total units that were available for sale. This will always be true regardless of which inventory cost
flow method is used.
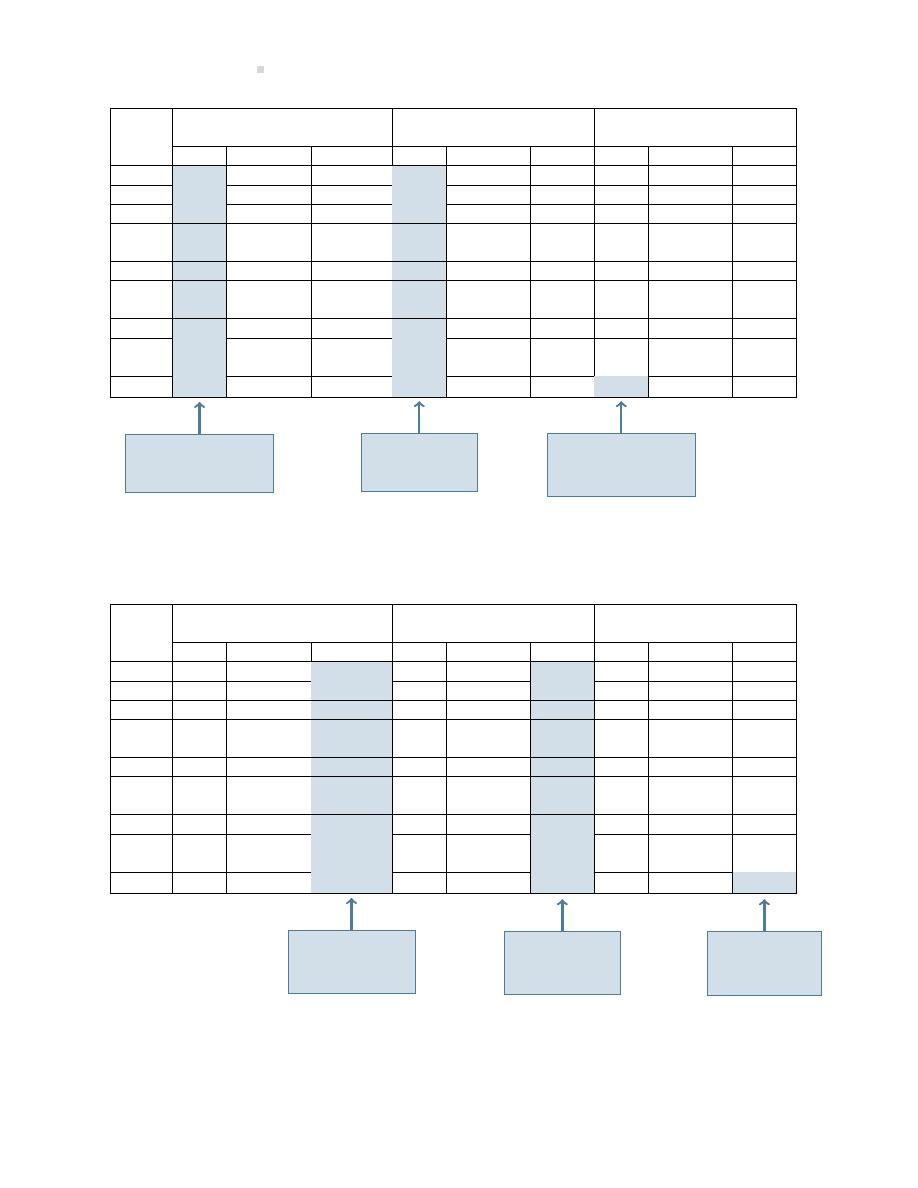
222
Assigning Costs to Merchandise
Purchases/Shipping Costs/
Cost of Goods Sold/
(Purchase Returns/Discounts)
(Returns to Inventory)
Balance in Inventory
Date
Units
Cost/Unit
Total $
Units
Cost/Unit
Total $
Units
Cost/Unit
Total $
June 1
1
$1
$1
1
$1
$1
3
1
$1
$1
0
$0
$0
5
1
$2
$2
1
$2
$2
7
1
$3
$3
2
1@$2
$5
1@$3
8
1
$3
$3
1
$2
$2
21
1
$4
$4
2
1@$2
$6
1@$4
23
1
$2
$2
1
$4
$4
28
1
$5
$5
2
1@$4
$9
1@$5
29
1
$5
$5
1
$4
$4
Total number of
units available
for sale: 5 units
Total number
of units
sold: 4 units
Total number of
units in ending
inventory: 1 unit
=
+
Figure 6.7: Total Units Sold plus Total Units in Ending Inventory equals Total Units Available for
Sale
Purchases/Shipping Costs/
Cost of Goods Sold/
(Purchase Returns/Discounts)
(Returns to Inventory)
Balance in Inventory
Date
Units
Cost/Unit
Total $
Units
Cost/Unit
Total $
Units
Cost/Unit
Total $
June 1
1
$1
$1
1
$1
$1
3
1
$1
$1
0
$0
$0
5
1
$2
$2
1
$2
$2
7
1
$3
$3
2
1@$2
$5
1@$3
8
1
$3
$3
1
$2
$2
21
1
$4
$4
2
1@$2
$6
1@$4
23
1
$2
$2
1
$4
$4
28
1
$5
$5
2
1@$4
$9
1@$5
29
1
$5
$5
1
$4
$4
Total cost of
goods available
for sale: $15
Total cost
of goods
sold: $11
Total cost
of ending
inventory: $4
=
+
Figure 6.8: Total Cost of Goods Sold plus Total Cost of Units in Ending Inventory equals Total Cost
of Goods Available for Sale (Specific Iden fica on)
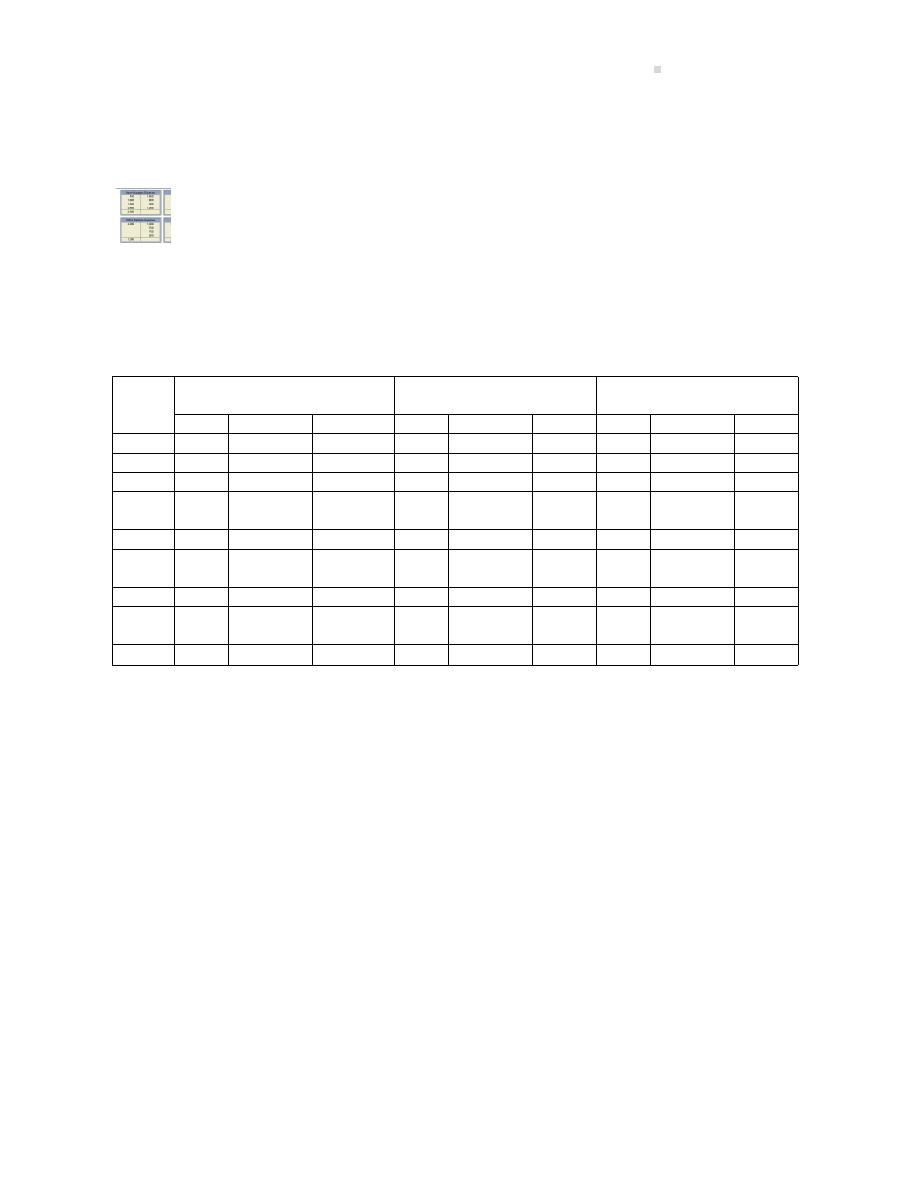
6.1. Inventory Cost Flow Assump ons
223
Figure
highlights the rela onship in which total cost of goods sold plus total cost of ending
inventory equals total cost of goods available for sale. This rela onship will always be true for
each of specific iden fica on, FIFO, and weighted average.
An explora on is available on the Lyryx site. Log into your Lyryx course to run
Comprehensive Example—FIFO (Perpetual)
Using the same informa on, we now apply the FIFO cost flow assump on as shown in Figure
.
Purchases/Shipping Costs/
Cost of Goods Sold/
(Purchase Returns/Discounts)
(Returns to Inventory)
Balance in Inventory
Date
Units
Cost/Unit
Total $
Units
Cost/Unit
Total $
Units
Cost/Unit
Total $
June 1
1
$1
$1
1
$1
$1
3
1
$1
$1
0
$0
$0
5
1
$2
$2
1
$2
$2
7
1
$3
$3
2
1@$2
$5
1@$3
8
1
$2
$2
1
$3
$3
21
1
$4
$4
2
1@$3
$7
1@$4
23
1
$3
$3
1
$4
$4
28
1
$5
$5
2
1@$4
$9
1@$5
29
1
$4
$4
1
$5
$5
Figure 6.9: Inventory Record Card using FIFO (Perpetual)
When calcula ng the cost of the units sold in FIFO, the oldest unit in inventory will always be
the first unit removed. For example, in Figure
, on June 8, one unit is sold when the previous
balance in inventory consisted of 2 units: 1 unit purchased on June 5 that cost $2 and 1 unit
purchased on June 7 that cost $3. Because the unit cos ng $2 was in inventory first (before the
June 7 unit cos ng $3), the cost assigned to the unit sold on June 8 is $2. Under FIFO, the first
units into inventory are assumed to be the first units removed from inventory when calcula ng
cost of goods sold. Therefore, under FIFO, ending inventory will always be the most recent units
purchased. In Figure
, there is one unit in ending inventory and it is assigned the $5 cost of the
most recent purchase which was made on June 28.
The informa on in Figure
is repeated in Figure
to reinforce that goods available for sale
equals the sum of goods sold and ending inventory.
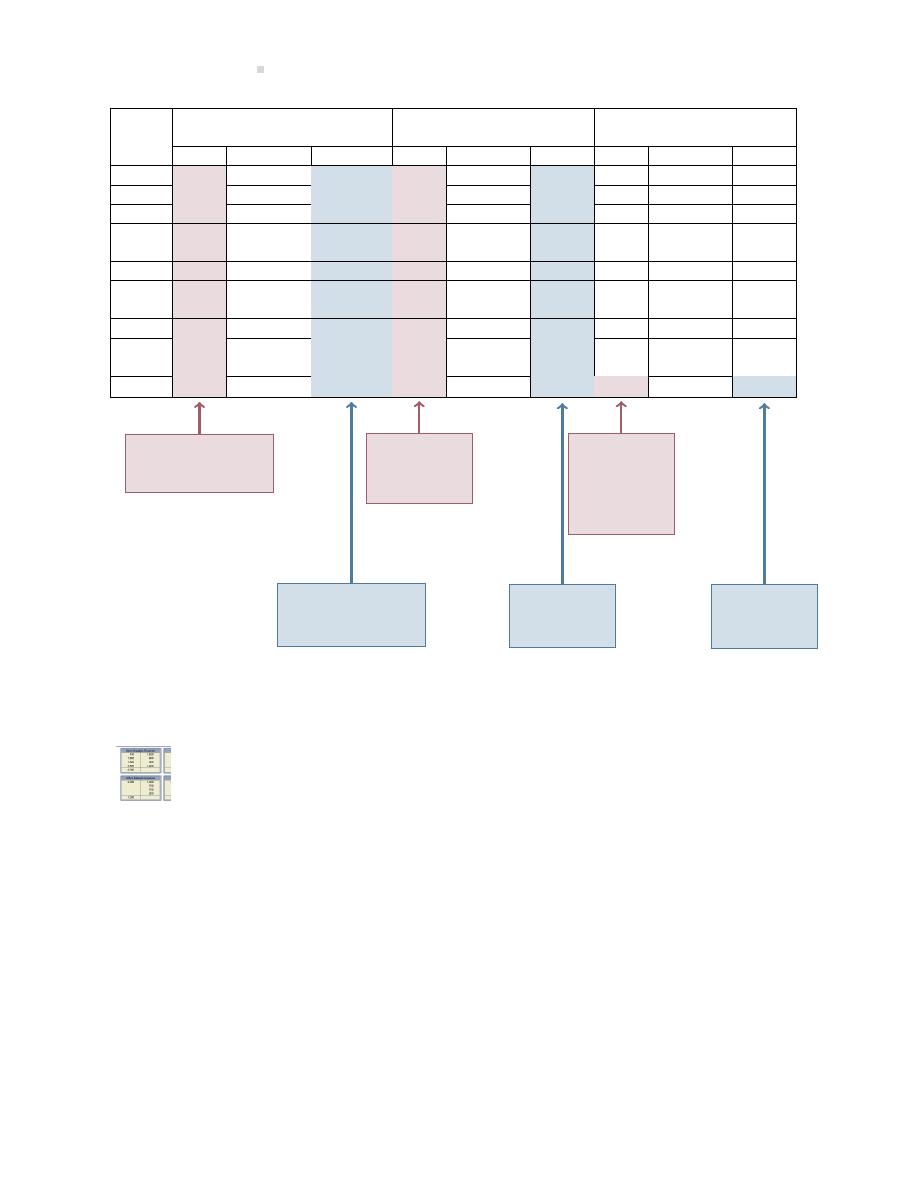
224
Assigning Costs to Merchandise
Purchases/Shipping Costs/
Cost of Goods Sold/
(Purchase Returns/Discounts)
(Returns to Inventory)
Balance in Inventory
Date
Units
Cost/Unit
Total $
Units
Cost/Unit
Total $
Units
Cost/Unit
Total $
June 1
1
$1
$1
1
$1
$1
3
1
$1
$1
0
$0
$0
5
1
$2
$2
1
$2
$2
7
1
$3
$3
2
1@$2
$5
1@$3
8
1
$2
$2
1
$3
$3
21
1
$4
$4
2
1@$3
$7
1@$4
23
1
$3
$3
1
$4
$4
28
1
$5
$5
2
1@$4
$9
1@$5
29
1
$4
$4
1
$5
$5
Total number of
units available
for sale: 5 units
Total
number of
units sold:
4 units
Total
number
of units
in ending
inventory:
1 unit
=
+
Total cost of
goods available
for sale: $15
Total cost
of goods
sold: $10
Total cost of
ending in-
ventory: $5
=
+
Figure 6.10: Total Goods Sold plus Ending Inventory equals Total Goods Available for Sale (FIFO
Perpetual)
An explora on is available on the Lyryx site. Log into your Lyryx course to run
.
Comprehensive Example—Weighted Average (Perpetual)
The inventory record card transac ons using weighted average cos ng are detailed in Figure
.
For consistency, all weighted average calcula ons will be rounded to two decimal places. When
a perpetual inventory system is used, the weighted average is calculated each me a purchase is
made. For example, a er the June 7 purchase, the balance in inventory is 2 units with a total cost
of $5.00 (1 unit at $2.00 + 1 unit at $3.00) resul ng in an average cost per unit of $2.50 ($5.00
÷
2 units = $2.50). When a sale occurs, the cost of the sale is based on the most recent average cost
per unit. For example, the cost of the sale on June 3 uses the $1.00 average cost per unit from
June 1 while the cost of the sale on June 8 uses the $2.50 average cost per unit from June 7.
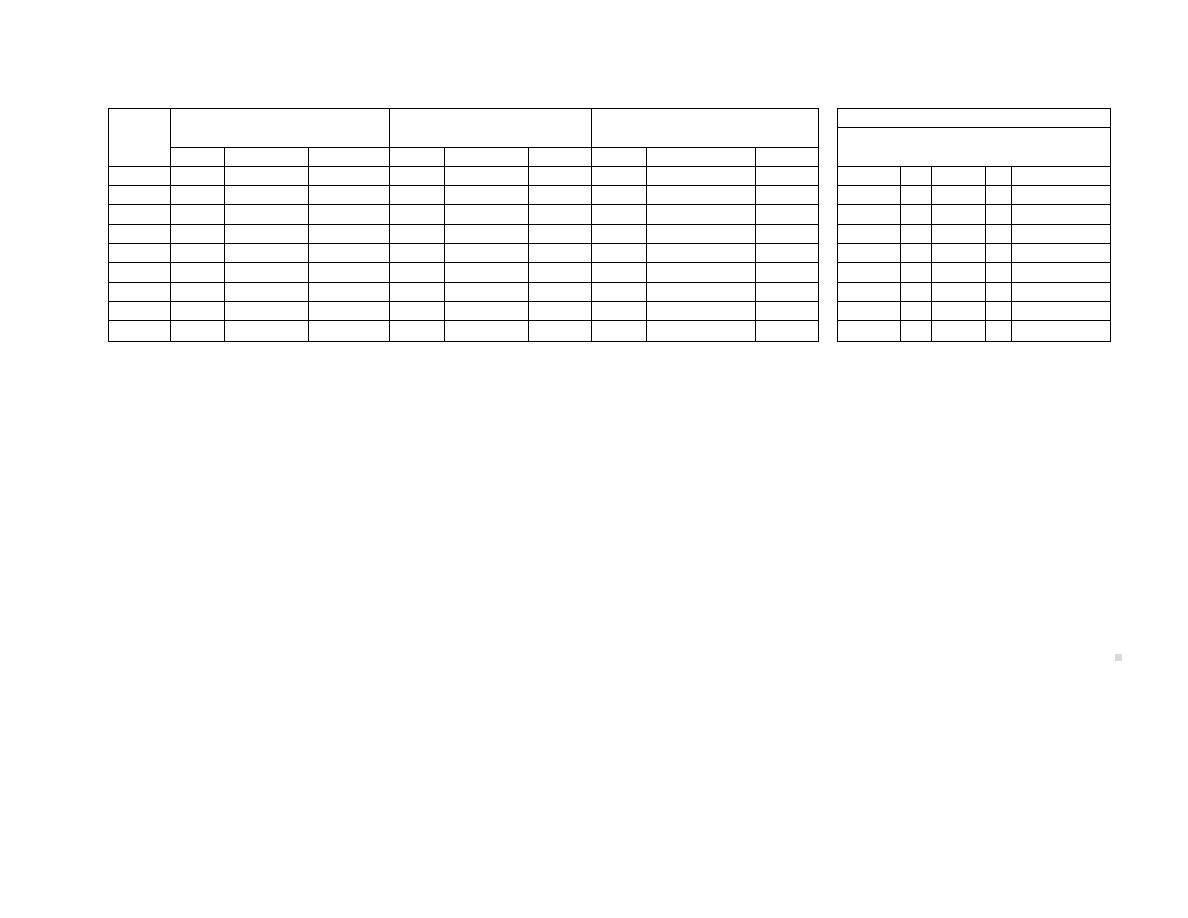
6.1.
In
ven
tor
y
Cos
t
Flo
w
Assump
ons
225
Purchases/Shipping Costs/
Cost of Goods Sold/
Calcula ng AvgCost/Unit
(Purchase Returns/Discounts)
(Returns to Inventory)
Balance in Inventory
Total
AvgCost/
Date
Units
Cost/Unit
Total $
Units
Cost/Unit
Total $
Units
AvgCost/Unit
Total $
Total $
÷ Units =
Unit
June 1
1
$1
$1
1
$1.00
$1.00
$1.00
÷
1
=
$1.00/unit
3
1
$1.00
$1.00
0
$0.00
$0.00
$0.00
÷
0
=
$0.00/unit
5
1
$2
$2
1
$2.00
$2.00
$2.00
÷
1
=
$2.00/unit
7
1
$3
$3
2
$2.50
$5.00
$5.00
÷
2
=
$2.50/unit
8
1
$2.50
$2.50
1
$2.50
$2.50
$2.50
÷
1
=
$2.50/unit
21
1
$4
$4
2
$3.25
$6.50
$6.50
÷
2
=
$3.25/unit
23
1
$3.25
$3.25
1
$3.25
$3.25
$3.25
÷
1
=
$3.25/unit
28
1
$5
$5
2
$4.13*
$8.25
$8.25
÷
2
=
$4.13*/unit
29
1
$4.13
$4.13
1
$4.12
$4.12
$4.12
÷
1
=
$4.12/unit
* Rounded
Figure 6.11: Inventory Record Card using Weighted Average Cos ng (Perpetual)

226
Assigning Costs to Merchandise
A common error made by students when applying weighted average occurs when the unit costs are
rounded. For example, on June 28, the average cost per unit is rounded to $4.13 ($8.25
÷ 2 units =
$4.125/unit rounded to $4.13). On June 29, the cost of the unit sold is $4.13, the June 28 average
cost per unit. Care must be taken to recognize that the total remaining balance in inventory a er
the June 29 sale is $4.12, calculated as the June 28 ending inventory total dollar amount of $8.25
less the June 29 total cost of goods sold of $4.13. Students will o en incorrectly use the average
cost per unit, in this case $4.13, to calculate the ending inventory balance. Remember that the cost
of goods sold plus the balance in inventory must equal the goods available for sale as highlighted
in Figure
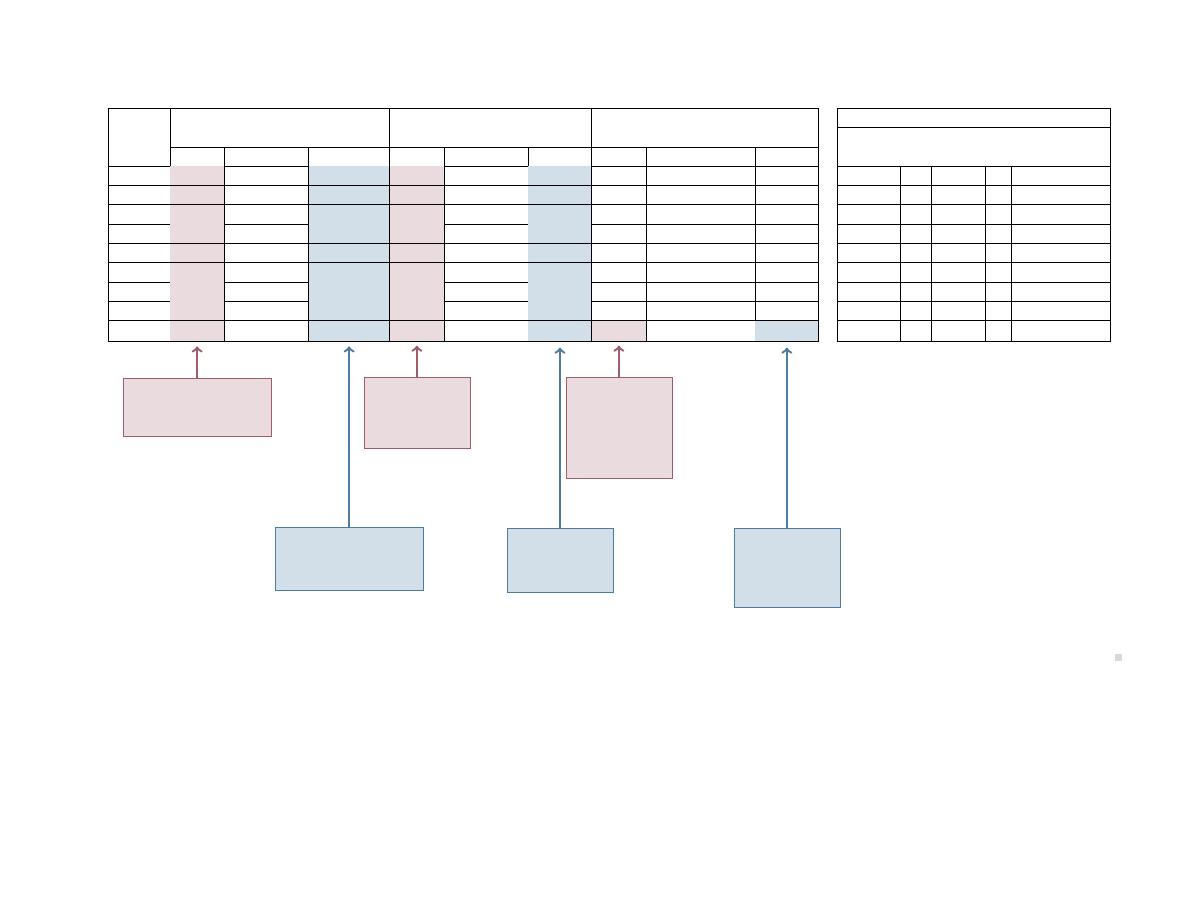
6.1.
In
ven
tor
y
Cos
t
Flo
w
Assump
ons
227
Purchases/Shipping Costs/
Cost of Goods Sold/
Calcula ng AvgCost/Unit
(Purchase Returns/Discounts)
(Returns to Inventory)
Balance in Inventory
Total
AvgCost/
Date
Units
Cost/Unit
Total $
Units
Cost/Unit
Total $
Units
AvgCost/Unit
Total $
Total $
÷ Units =
Unit
June 1
1
$1
$1
1
$1.00
$1.00
$1.00
÷
1
=
$1.00/unit
3
1
$1.00
$1.00
0
$0.00
$0.00
$0.00
÷
0
=
$0.00/unit
5
1
$2
$2
1
$2.00
$2.00
$2.00
÷
1
=
$2.00/unit
7
1
$3
$3
2
$2.50
$5.00
$5.00
÷
2
=
$2.50/unit
8
1
$2.50
$2.50
1
$2.50
$2.50
$2.50
÷
1
=
$2.50/unit
21
1
$4
$4
2
$3.25
$6.50
$6.50
÷
2
=
$3.25/unit
23
1
$3.25
$3.25
1
$3.25
$3.25
$3.25
÷
1
=
$3.25/unit
28
1
$5
$5
2
$4.13*
$8.25
$8.25
÷
2
=
$4.13*/unit
29
1
$4.13
$4.13
1
$4.12
$4.12
$4.12
÷
1
=
$4.12/unit
* Rounded
Total number of
units available
for sale: 5 units
Total
number of
units sold:
4 units
Total
number
of units
in ending
inventory:
1 unit
=
+
Total cost of
goods available
for sale: $15
Total cost of
goods sold:
$10.88
Total cost
of ending
inventory:
$4.12
=
+
Figure 6.12: Total Goods Sold plus Ending Inventory equals Total Goods Available for Sale (Weighted Average Perpetual)
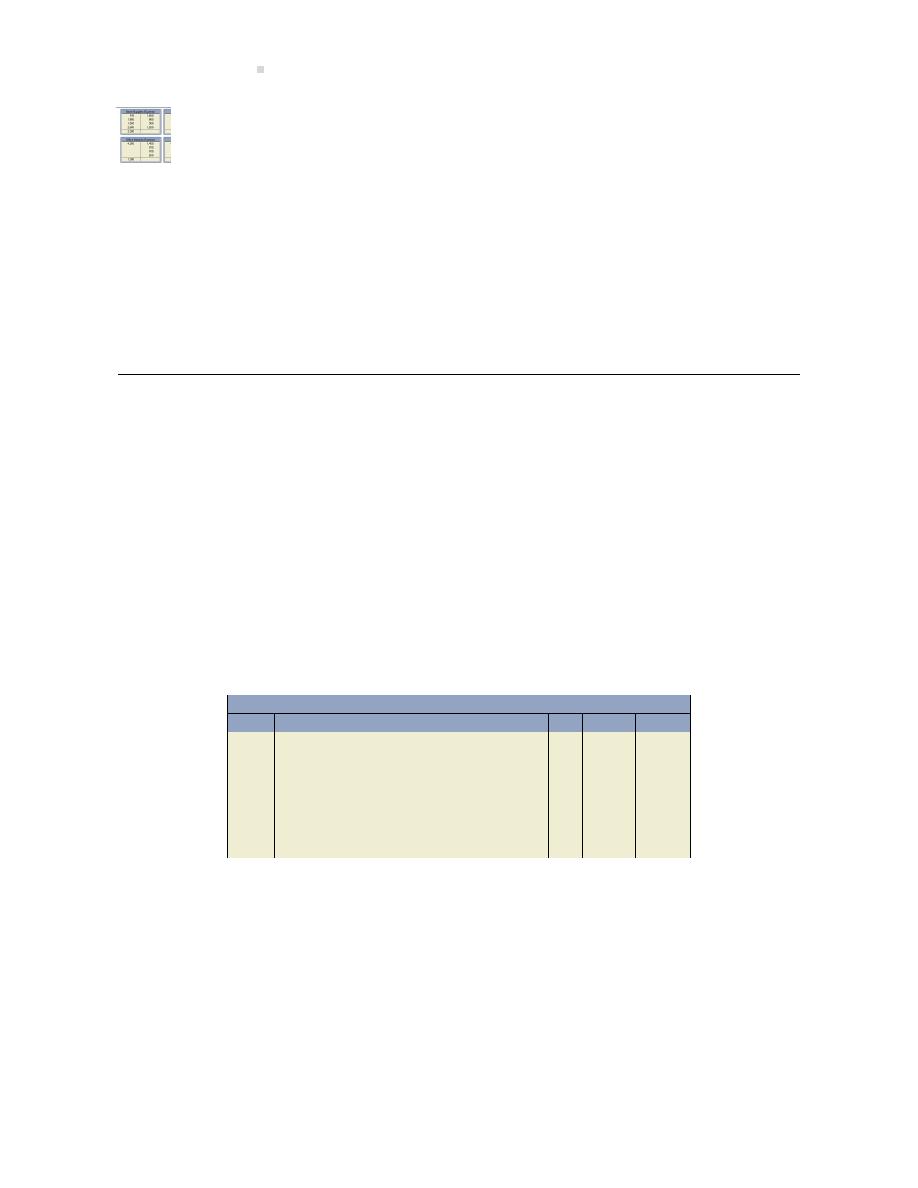
228
Assigning Costs to Merchandise
An explora on is available on the Lyryx site. Log into your Lyryx course to run
.
Figure
compares the results of the three cost flow methods. Goods available for sale, units
sold, and units in ending inventory are the same regardless of which method is used. Because
each cost flow method allocates the cost of goods available for sale in a par cular way, the cost of
goods sold and ending inventory values are different for each method.
Total Cost
Total
Total
of Goods
Units
Total Cost
Total
Total Cost
Units in
Cost Flow
Available
Available
of Goods
Units
of Ending
Ending
Assump on
for Sale
for Sale
Sold
Sold
Inventory
Inventory
Specific Iden fica on
$15.00
5
11.00
4
4.00
1
FIFO
15.00
5
10.00
4
5.00
1
Weighted Average
15.00
5
10.88
4
4.12
1
Figure 6.13: Comparing Specific Iden fica on, FIFO, and Weighted Average
Journal Entries
In Chapter
the journal entries to record the sale of merchandise were introduced. Chapter
showed how the dollar value included in these journal entries is determined. We now know that
the informa on in the inventory record is used to prepare the journal entries in the general journal.
For example, the credit sale on June 23 using weighted average cos ng would be recorded as
follows (refer to Figure
General Journal
Date
Account/Explana on
PR
Debit
Credit
Accounts Receivable . . . . . . . . . . . . . . . . . . .
10.00
Sales . . . . . . . . . . . . . . . . . . . . . . . . . . . . . .
10.00
To record credit sale at a selling price of
$10 per unit.
Cost of Goods Sold . . . . . . . . . . . . . . . . . . . . .
3.25
Merchandise Inventory . . . . . . . . . . . . . .
3.25
To record the cost of the sale.
Perpetual inventory incorporates an internal control feature that is lost under the periodic inven-
tory method. Losses resul ng from the and error can easily be determined when the actual
quan ty of goods on hand is counted and compared with the quan
es shown in the inventory
records as being on hand. It may seem that this advantage is offset by the me and expense
required to con nuously update inventory records, par cularly where there are thousands of dif-
ferent items of various sizes on hand. However, computeriza on makes this record keeping easier
and less expensive because the inventory accoun ng system can be ed in to the sales system so
that inventory is updated whenever a sale is recorded.

6.2. Financial Statement Impact of Different Inventory Cost Flows
229
Inventory Record Card
In a company such as a large drugstore or hardware chain, inventory consists of thousands of dif-
ferent products. For businesses that carry large volumes of many inventory types, the general
ledger merchandise inventory account contains only summarized transac ons of the purchases
and sales. The detailed transac ons for each type of inventory would be recorded in the underly-
ing inventory record cards. The inventory record card is an example of a subsidiary ledger, more
commonly called a subledger. The merchandise inventory subledger provides a detailed lis ng
of type, amount, and total cost of all types of inventory held at a par cular point in me. The sum
of the balances on each inventory record card in the subledger would always equal the ending
amount recorded in the Merchandise Inventory general ledger account. So a subledger contains
the detail for each product in inventory while the general ledger account shows only a summary.
In this way, the general ledger informa on is streamlined while allowing for detail to be available
through the subledger. There are other types of subledgers: the accounts receivable subledger
and the accounts payable subledger. These will be introduced in a subsequent chapter.
6.2 Financial Statement Impact of Different Inventory Cost Flows
LO2
–
Explain
the
impact
of
inventory
cost
flows and errors.
When purchase costs are increasing, as in a period of infla on (or decreas-
ing, as in a period of defla on), each cost flow assump on results in a
different value for cost of goods sold and the resul ng ending inventory,
gross profit, and net income.
Using informa on from the preceding comprehensive example, the ef-
fects of each cost flow assump on on net income and ending inventory
are shown in Figure
.
Spec.
Wtd.
Ident.
FIFO
Avg.
Sales
$
40.00
$
40.00
$ 40.00
Cost of goods sold
11.00
10.00
10.88
Gross profit and net income
$
29.00
$
30.00
$ 29.12
Ending inventory (on the balance sheet) $
4.00
$
5.00
$
4.12
Figure 6.14: Effects of Different Cost Flow Assump ons
FIFO maximizes net income and ending inventory amounts when costs are rising. FIFO minimizes
net income and ending inventory amounts when purchase costs are decreasing.
Because different cost flow assump ons can affect the financial statements, GAAP requires that
the assump on adopted by a company be disclosed in its financial statements (full disclosure prin-
ciple). Addi onally, GAAP requires that once a method is adopted, it be used every accoun ng
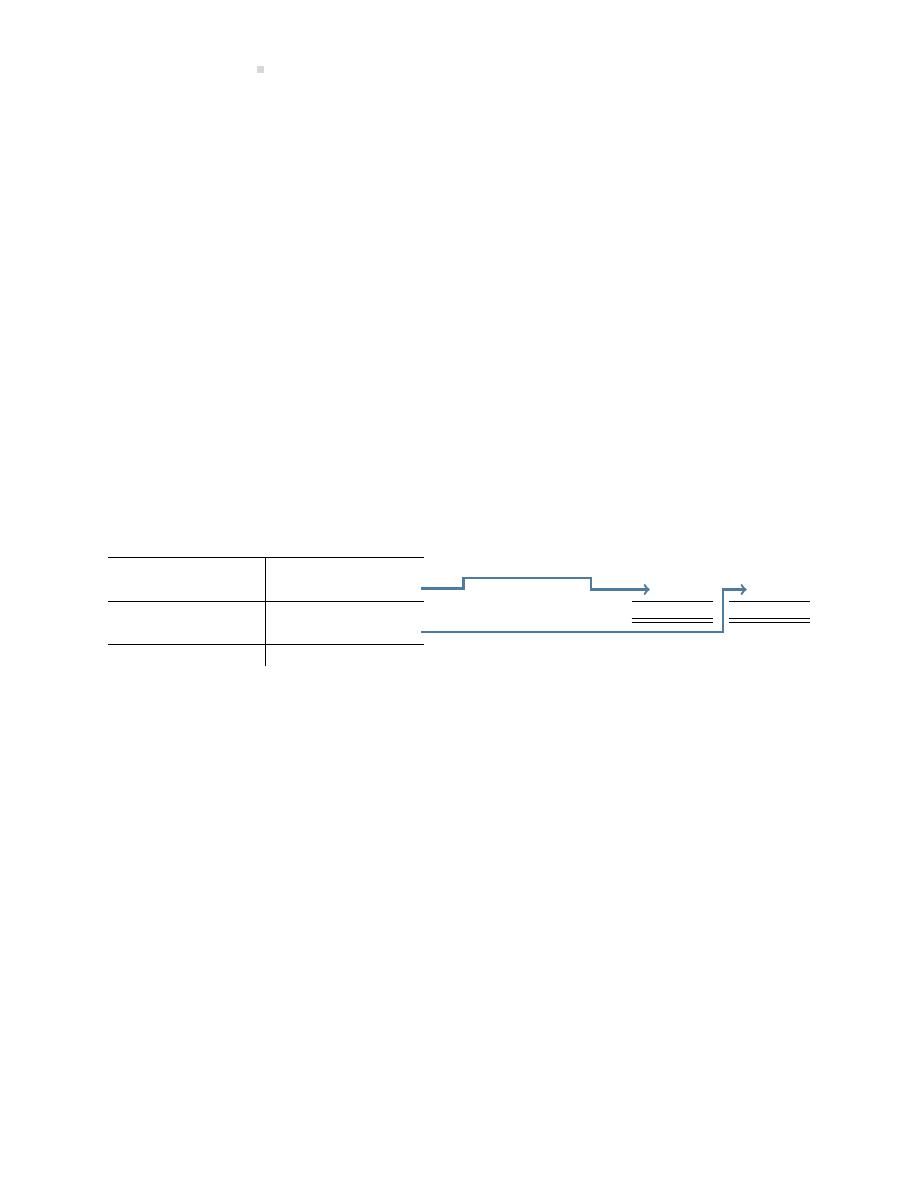
230
Assigning Costs to Merchandise
period therea er (consistency principle) unless there is a jus fiable reason to change. A business
that has a variety of inventory items may choose a different cost flow assump on for each item.
For example, Walmart might use weighted average to account for its spor ng goods items and
specific iden fica on for each of its various major appliances.
Effect of Inventory Errors on the Financial Statements
There are two components necessary to determine the inventory value disclosed on a corpora-
on’s balance sheet. The first component involves calcula ng the quan ty of inventory on hand
at the end of an accoun ng period by performing a physical inventory count. The second require-
ment involves assigning the most appropriate cost to this quan ty of inventory.
An error in calcula ng either the quan ty or the cost of ending inventory will misstate reported
income for two me periods. Assume merchandise inventory at December 31, 2019, 2020, and
2021 was reported as $2,000 and that merchandise purchases during each of 2020 and 2021 were
$20,000. There were no other expenditures. Assume further that sales each year amounted to
$30,000 with cost of goods sold of $20,000 resul ng in gross profit of $10,000. These transac ons
are summarized below.
Merchandise Inventory
2020
2021
Beg. Bal.
2,000
Sales
$30,000
$30,000
2020 Purch. 20,000 20,000 2020 COGS
COGS
20,000
20,000
2020 Bal.
2,000
Gross profit
$10,000
$10,000
2021 Purch. 20,000 20,000 2021 COGS
2021 Bal.
2,000
Assume now that ending inventory was misstated at December 31, 2020. Instead of the $2,000
that was reported, the correct value should have been $1,000. The effect of this error was to
understate cost of goods sold on the income statement — cost of goods sold should have been
$21,000 in 2020 as shown below instead of $20,000 as originally reported above. Because of the
2020 error, the 2021 beginning inventory was incorrectly reported above as $2,000 and should
have been $1,000 as shown below. This caused the 2021 gross profit to be understated by $1,000
— cost of goods sold in 2021 should have been $19,000 as illustrated below but was originally
reported above as $20,000.
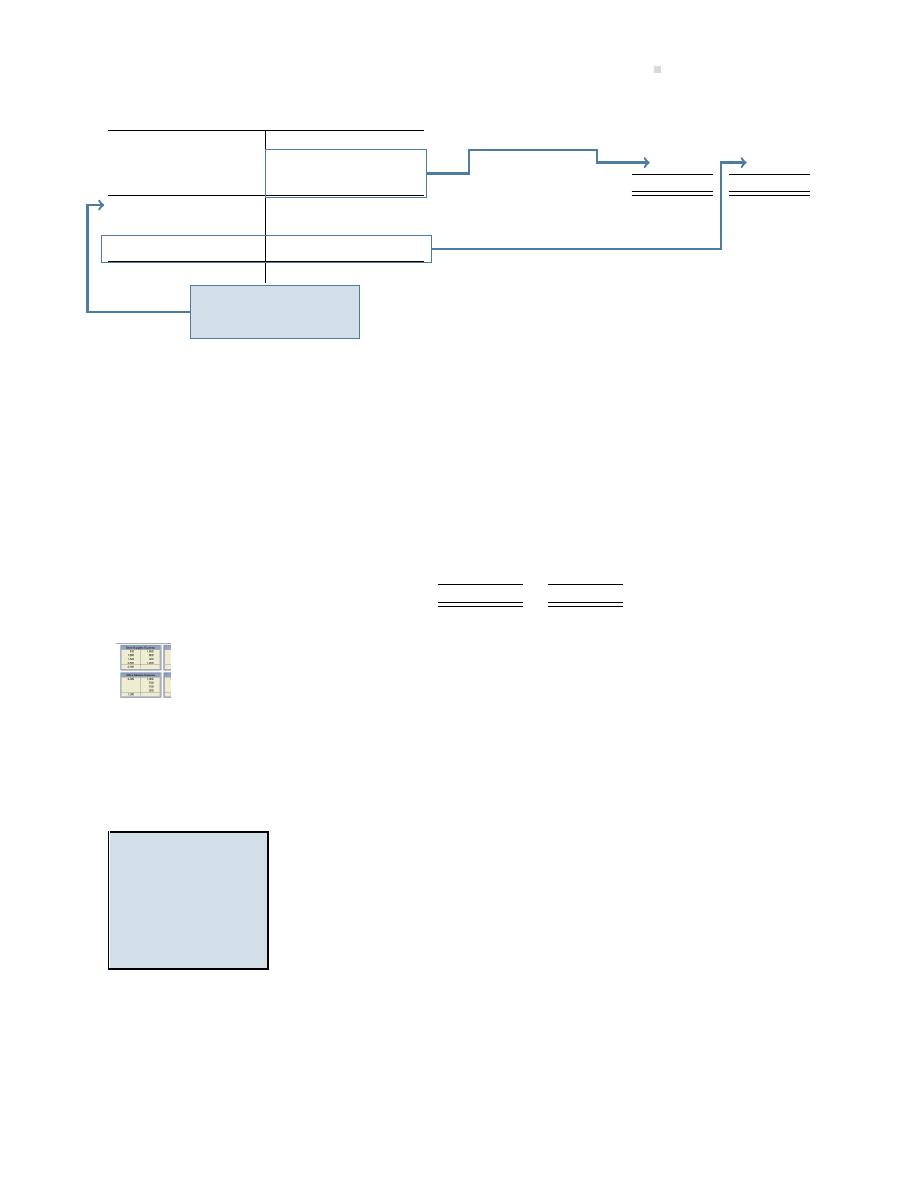
6.3. Lower of Cost and Net Realizable Value (LCNRV)
231
Merchandise Inventory
2020
2021
Op. Bal.
2,000
Sales
$30,000
$30,000
2020 Purch. 20,000
COGS
21,000
19,000
Gross Profit
$ 9,000
$11,000
2020 Bal.
1,000
2021 Purch. 20,000
2021 Bal.
2,000
20,000 2020 COGS
1,000
Inv. Adj.
Inv. Adj.
1,000 20,000
2021 COGS
Ending inventory is
incorrectly stated.
As can be seen, income is misstated in both 2020 and 2021 because cost of goods sold in both
years is affected by the adjustment to ending inventory needed at the end of 2020 and 2021. The
opposite effects occur when inventory is understated at the end of an accoun ng period.
An error in ending inventory is offset in the next year because one year’s ending inventory becomes
the next year’s opening inventory. This process can be illustrated by comparing gross profits for
2020 and 2021 in the above example. The sum of both years’ gross profits is the same.
Overstated
Correct
Inventory
Inventory
Gross profit for 2020
$10,000
$ 9,000
Gross profit for 2021
10,000
11,000
Total
$20,000
$20,000
An explora on is available on the Lyryx site. Log into your Lyryx course to run
6.3 Lower of Cost and Net Realizable Value (LCNRV)
LO3
–
Explain
and
calculate
lower of cost and
net
realizable
value
inventory
adjustments.
In addi on to the adjus ng entry to record the shrinkage of merchandise
inventory (discussed in Chapter
), there is an addi onal adjus ng entry to
be considered at the end of the accoun ng period when calcula ng cost of
goods sold and ending inventory values for the financial statements. Gen-
erally accepted accoun ng principles require that inventory be valued at
the lesser amount of its laid-down cost and the amount for which it can
likely be sold — its net realizable value (NRV). This concept is known as
the lower of cost and net realizable value, or LCNRV. Note that the laid-
down cost includes the invoice price of the goods (less any purchase dis-
counts) plus transporta on in, insurance while in transit, and any other
expenditure made by the purchaser to get the merchandise to the place
of business and ready for sale.
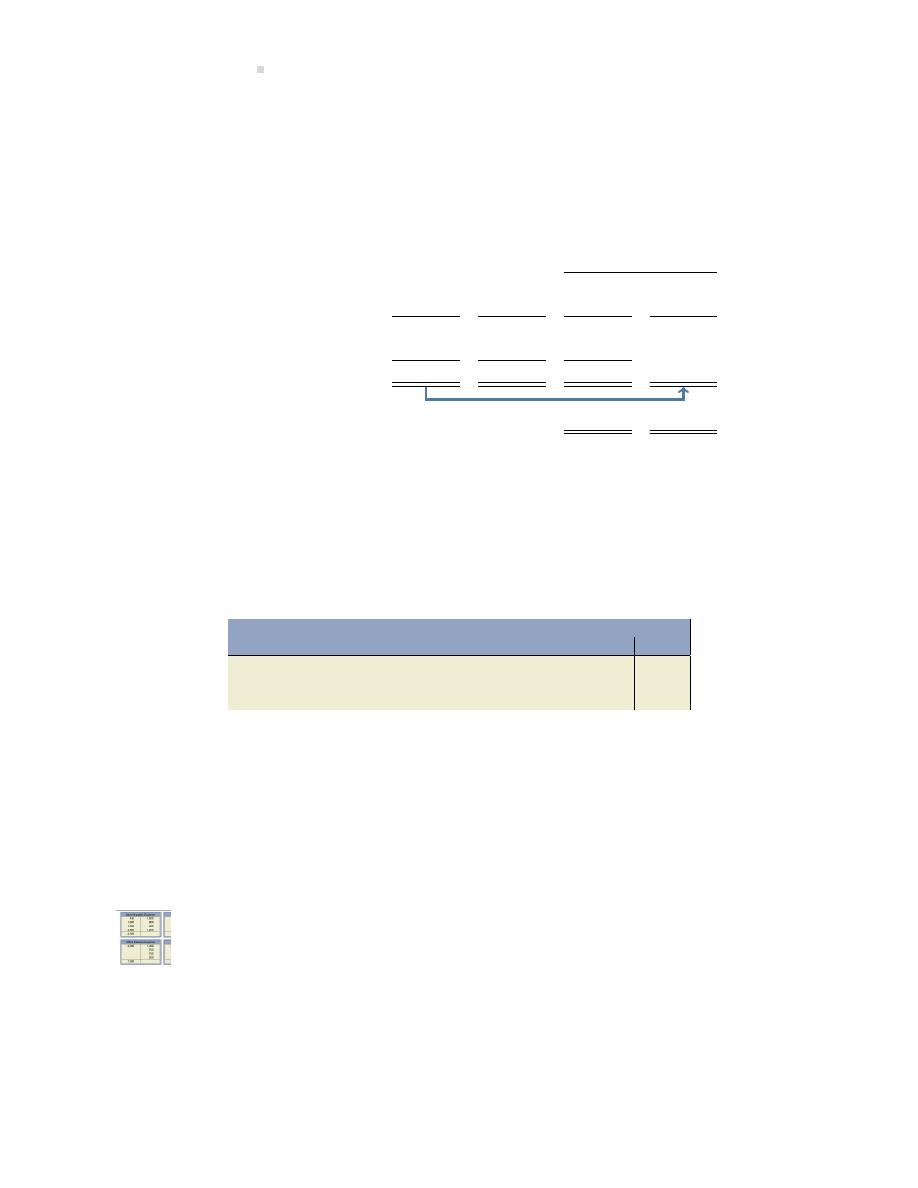
232
Assigning Costs to Merchandise
As an example, a change in consumer demand may mean that inventories become obsolete and
need to be reduced in value below the purchase cost. This o en occurs in the electronics industry
as new and more popular products are introduced.
The lower of cost and net realizable value can be applied to individual inventory items or groups
of similar items, as shown in Figure
below.
LCNRV
Total
Total
Unit
Group
Cost
NRV
Basis
Basis
White paper
$1,250
$1,200
$1,200
Coloured paper
1,400
1,500
1,400
Total
$2,650
$2,700
$2,600
$2,650
Ending inventory (LCNRV)
$2,600
$2,650
Figure 6.15: LCNRV Calcula ons
Depending on the calcula on used, the valua on of ending inventory will be either $2,600 or
$2,650. Under the unit basis, the lower of cost and net realizable value is selected for each item:
$1,200 for white paper and $1,400 for coloured paper, for a total LCNRV of $2,600. Because the
LCNRV is lower than cost, an adjus ng entry must be recorded as follows.
General Journal
Date
Account/Explana on
PR
Debit
Credit
Cost of Goods Sold . . . . . . . . . . . . . . . . . . . . .
50
Merchandise Inventory . . . . . . . . . . . . . .
50
To adjust inventory to reflect its LCNRV.
The purpose of the adjus ng entry is to ensure that inventory is not overstated on the balance
sheet and that income is not overstated on the income statement.
If white paper and coloured paper are considered a similar group, the calcula ons in Figure
above show they have a combined cost of $2,650 and a combined net realizable value of $2,700.
LCNRV would therefore be $2,650. In this case, the cost is equal to the LCNRV so no adjus ng
entry would be required if applying LCNRV on a group basis.
An explora on is available on the Lyryx site. Log into your Lyryx course to run
Lower of Cost or Net Realizable Value
.
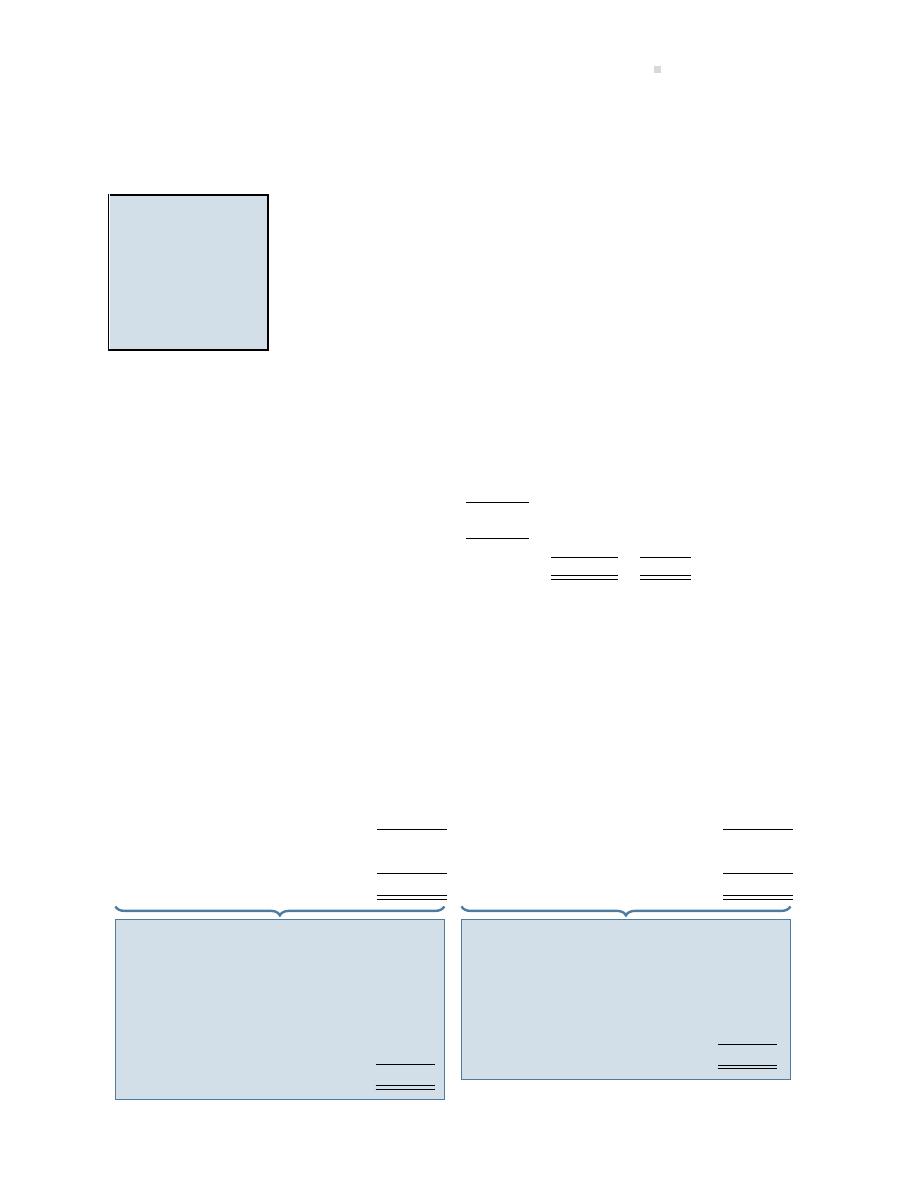
6.4. Es ma ng the Balance in Merchandise Inventory
233
6.4 Es ma ng the Balance in Merchandise Inventory
LO4 – Es mate
merchandise
inventory
using
the gross profit
method and the
retail
inventory
method.
A physical inventory count determines the quan ty of items on hand. When
costs are assigned to these items and these individual costs are added, a
total inventory amount is calculated. Is this dollar amount correct? Should
it be larger? How can one tell if the physical count is accurate? Being able
to es mate this amount provides a check on the reasonableness of the
physical count and valua on.
The two methods used to es mate the inventory dollar amount are the
gross profit method and the retail inventory method. Both methods are
based on a calcula on of the gross profit percentage in the income state-
ment. Assume the following informa on:
Sales
$15,000
100%
Cost of Goods Sold:
Opening Inventory
$ 4,000
Purchases
12,000
Cost of Goods Available for Sale
16,000
Less: Ending Inventory
(6,000)
Cost of Goods Sold
10,000
67%
Gross Profit
$ 5,000
33%
The gross profit percentage, rounded to the nearest whole percent, is 33% ($5,000/15,000). This
means that for each dollar of sales, an average of $.33 is le to cover other expenses a er deduct-
ing cost of goods sold.
Es ma ng ending inventory requires an understanding of the rela onship of ending inventory
with cost of goods sold. Review the following cost of goods sold calcula ons.
Cost of Goods Sold:
Cost of Goods Sold:
Opening Inventory
$ 4,000 Opening Inventory
$ 4,000
Purchases
12,000 Purchases
12,000
Cost of Goods Available for Sale
$16,000 Cost of Goods Available for Sale
$16,000
Less: Es mated Ending Inventory
? Less: Es mated Ending Inventory
6,000
Cost of Goods Sold
$10,000
Cost of Goods Sold
?
How much of the $16,000 of goods
that the company had available to
sell is s ll not sold at December
31 (in other words, what is ending
inventory)? You can calculate this as:
Available for sale
$16,000
Less inventory that was sold
10,000
Equals what must s ll be on hand $ 6,000
How much of the $16,000 of goods that
were available to be sold have been
sold? You use the dollar amount of
ending inventory to calculate this, as:
Available for sale
$16,000
Less inventory on hand
6,000
Equals what must have been sold $10,000
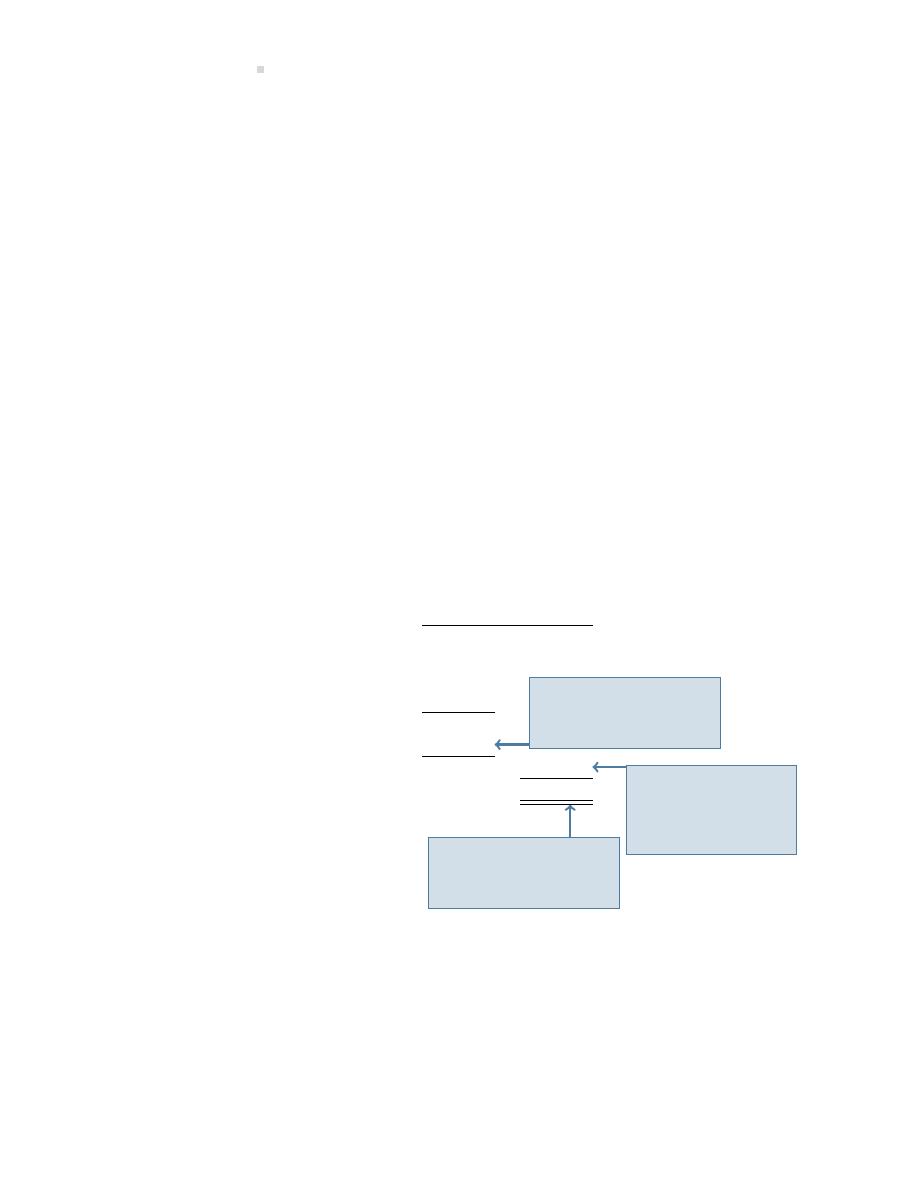
234
Assigning Costs to Merchandise
The sum of cost of goods sold and ending inventory is always equal to cost of goods available
for sale. Knowing any two of these amounts enables the third amount to be calculated. Under-
standing this rela onship is the key to es ma ng inventory using either the gross profit or retail
inventory methods, discussed below.
Gross Profit Method
The gross profit method of es ma ng ending inventory assumes that the percentage of gross
profit on sales remains approximately the same from period to period. Therefore, if the gross
profit percentage is known, the dollar amount of ending inventory can be es mated. First, gross
profit is es mated by applying the gross profit percentage to sales. From this, cost of goods sold
can be derived, namely the difference between sales and gross profit. Cost of goods available
for sale can be determined from the accoun ng records (opening inventory + purchases). The
difference between cost of goods available for sale and cost of goods sold is the es mated value
of ending inventory.
To demonstrate, assume that Pete’s Products Ltd. has an average gross profit percentage of 40%.
If opening inventory at January 1, 2019 was $200, sales for the six months ended June 30, 2019
were $2,000, and inventory purchased during the six months ended June 30, 2019 was $1,100,
the cost of goods sold and ending inventory can be es mated as follows.
Six Months Ended
June 30, 2019
Sales (given)
$2,000
Cost of Goods Sold:
Opening Inventory (given)
$ 200
Purchases (given)
1,100
Cost of Goods Available for Sale
1,300
Less: Es mated Ending Inventory
(100)
Cost of Goods Sold
1,200
Gross Profit
$
800
Step 3: Ending inven-
tory can be es mated
($1,300-1,200=100).
Step 2: Cost of
goods sold can be
derived ($2,000-
800=$1,200).
Step 1: Gross profit
is es mated at $800
($2,000 x 40%).
The es mated ending inventory at June 30 must be $100—the difference between the cost of
goods available for sale and cost of goods sold.
The gross profit method of es ma ng inventory is useful in situa ons when goods have been
stolen or destroyed by fire or when it is not cost-effec ve to make a physical inventory count.

6.4. Es ma ng the Balance in Merchandise Inventory
235
An explora on is available on the Lyryx site. Log into your Lyryx course to run
.
Retail Inventory Method
The retail inventory method is another way to es mate cost of goods sold and ending inventory. It
can be used when items are consistently valued at a known percentage of cost, known as a mark-
up. A mark-up is the ra o of retail value (or selling price) to cost. For example, if an inventory
item had a retail value of $12 and a cost of $10, then it was marked up to 120% (12/10 x 100).
Mark-ups are commonly used in clothing stores.
To apply the retail inventory method using the mark-up percentage, the cost of goods available for
sale is first converted to its retail value (the selling price). To do this, the mark-up (ra o of retail
to cost) must be known. Assume the same informa on as above for Pete’s Products Ltd., except
that now every item in the store is marked up to 160% of its purchase price. That is, if an item is
purchased for $100, it is sold for $160. Based on this, opening inventory, purchases, and cost of
goods available can be restated at retail. Cost of goods sold can then be valued at retail, meaning
that it will equal sales for the period. From this, ending inventory at retail can be determined and
then converted back to cost using the mark-up. These steps are illustrated below.
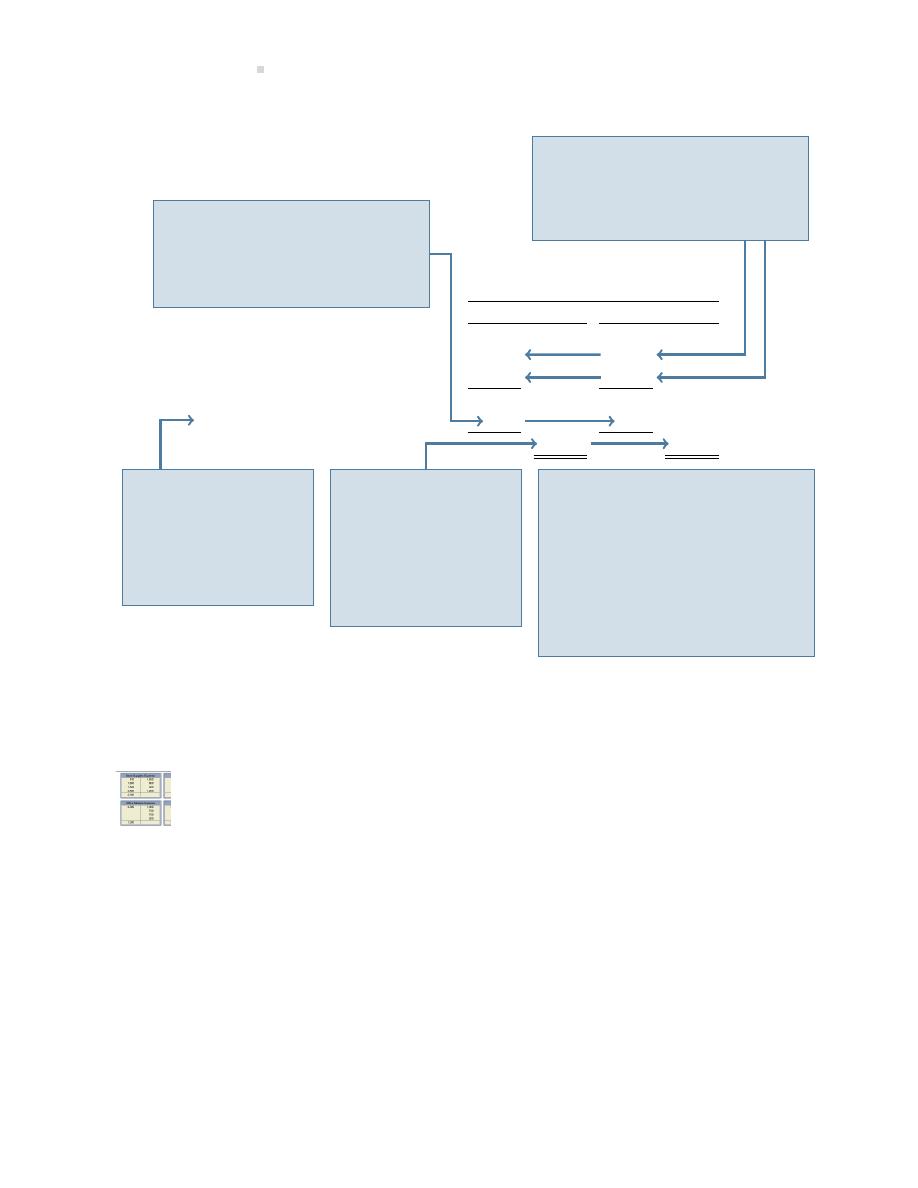
236
Assigning Costs to Merchandise
Six Months Ended
June 30, 2019
At Retail
At Cost
Cost of Goods Sold:
Opening Inventory (from records)
$
320
$ 200
Purchases (from records)
1,760
1,100
Cost of Goods Available for Sale
2,080
1,300
Less: Es mated Ending Inventory
(80)
(50)
Cost of Goods Sold
2,000
1,250
Step 4: Ending inventory is re-
stated at cost by dividing by
160%. Ending inventory of $80
at retail is divided by 160% to get
ending inventory at cost of $50.
Step 3: Ending inven-
tory can be derived by
taking cost of goods
available for sale at
retail and subtrac ng
sales at retail ($2,080-
2,000=$80).
Step 2a: Cost of
goods sold at retail
is Sales of $2,000
which was given.
Resta ng sales to
cost requires divid-
ing $2,000 by 160%
($2,000
÷160%=$1,250).
Step 2b: Instead of con nuing to
Steps 3 and 4, ending inventory
at cost could be calculated at
this point by taking cost of goods
available for sale of $1,300 and
subtrac ng cost of goods sold
of $1,250. Ending inventory at
retail could then be calculated by
mul plying ending inventory at
cost of $50 x 160%.
Step 1: Opening inventory and
purchases are restated at retail
by mul plying the cost x 160%.
$200 x 160% = $320
$1,100 x 160% = $1,760
The retail inventory method of es ma ng ending inventory is easy to calculate and produces a
rela vely accurate cost of ending inventory, provided that no change in the average mark-up has
occurred during the period.
An explora on is available on the Lyryx site. Log into your Lyryx course to run

6.5. Appendix A: Ra o Analysis—Merchandise Inventory Turnover
237
6.5 Appendix A: Ra o Analysis—Merchandise Inventory Turnover
LO5 – Explain and
calculate
mer-
chandise
inven-
tory turnover.
To help determine how quickly a company is able to sell its inventory, the
merchandise inventory turnover can be calculated as:
Cost of Goods Sold
÷ Average Merchandise Inventory
The average merchandise inventory is the beginning inventory plus the ending inventory divided
by two. For example, assume Company A had cost of goods sold of $3,000; beginning merchandise
inventory of $500; and ending inventory of $700. The merchandise inventory turnover would be
5, calculated as:
Cost of Goods Sold
÷ Average Merchandise Inventory
$3,000
÷
(($500+$700)/2)
The ‘5’ means that Company A sold its inventory 5 mes during the year. In contrast, assume
Company B had cost of goods sold of $3,000; beginning merchandise inventory of $1,000; and
ending inventory of $1,400. The merchandise inventory turnover would be 2.50 calculated as:
Cost of Goods Sold
÷ Average Merchandise Inventory
$3,000
÷
(($1,000+$1,400)/2)
The ‘2.5’ means that Company B sold its inventory 2.5 mes during the year which is much slower
than Company A. The faster a business sells its inventory, the be er, because high turnover pos-
i vely affects liquidity. Liquidity is the ability to convert assets, such as merchandise inventory,
into cash. Therefore, Company A’s merchandise turnover is more favourable than Company B’s.
An explora on is available on the Lyryx site. Log into your Lyryx course to run
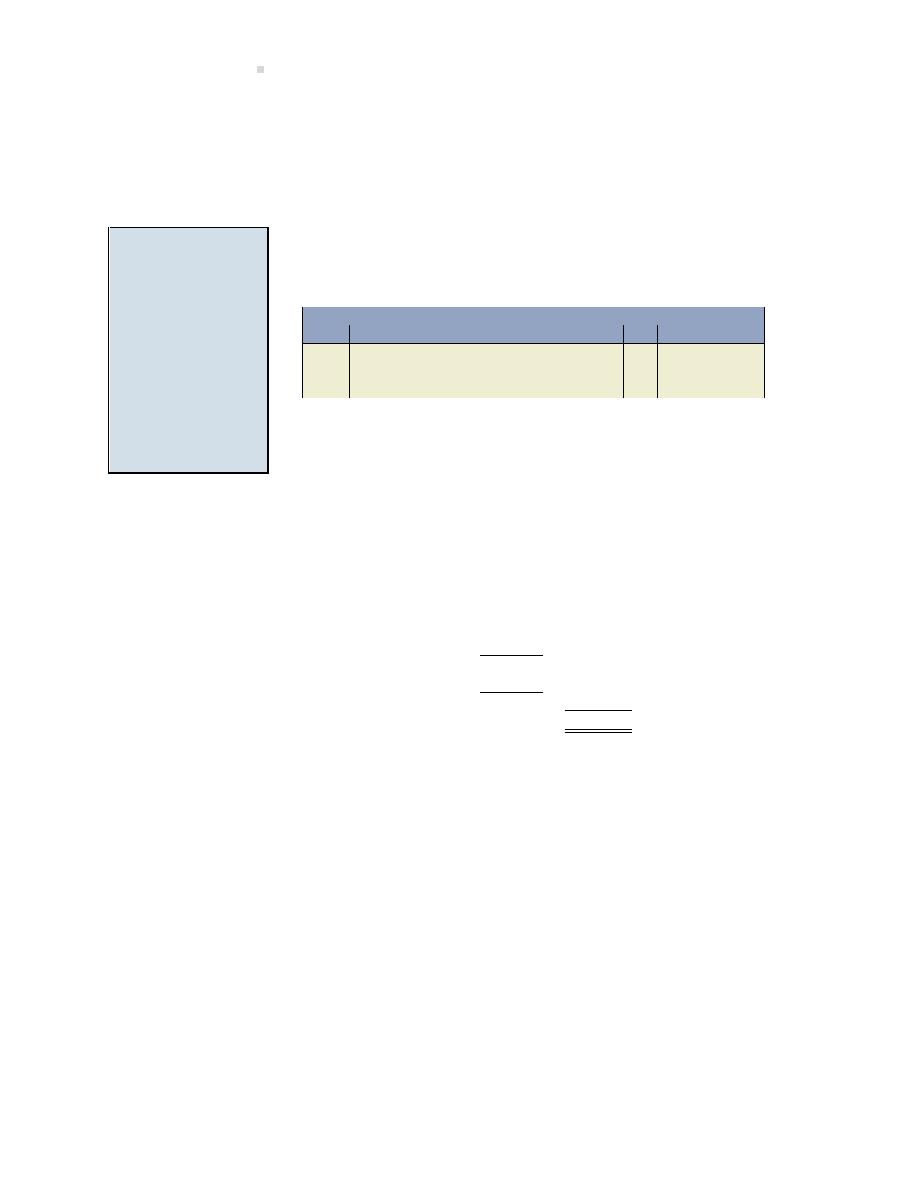
238
Assigning Costs to Merchandise
6.6 Appendix B: Inventory Cost Flow Assump ons Under the Pe-
riodic System
LO6 – Calculate
cost of goods sold
and merchandise
inventory
using
specific
iden -
fica on,
first-in
first-out
(FIFO),
and
weighted
average
cost
flow assump ons
periodic.
Recall from Chapter
that the periodic inventory system does not maintain
detailed records to calculate cost of goods sold each me a sale is made.
Rather, when a sale is made, the following entry is made:
General Journal
Date
Account/Explana on
PR
Debit
Credit
Accounts Receivable . . . . . . . . . . . . . . . . . . .
XX
Sales . . . . . . . . . . . . . . . . . . . . . . . . . . . . . .
XX
To record a credit sale.
No entry is made to record cost of goods sold and to reduce Merchandise
Inventory, as is done under the perpetual inventory system. Instead, all
purchases are expenses and recorded in the general ledger account “Pur-
chases.” A physical inventory count is conducted at year-end. An amount
for ending inventory is calculated based on this count and the valua on of
the items in inventory, and cost of goods sold is calculated in the income
statement based on this total amount. The income statement format is:
Sales
$10,000
Cost of Goods Sold:
Opening Inventory
$ 1,000
Purchases
5,000
Goods Available for Sale
6,000
Less: Ending Inventory
(2,000)
Cost of Goods Sold
4,000
Gross Profit
$6,000
Even under the periodic inventory system, however, inventory cost flow assump ons need to be
made (specific iden fica on, FIFO, weighted average) when purchase prices change over me, as
in a period of infla on. Further, different inventory cost flow assump ons produce different cost
of goods sold and ending inventory values, just as they did under the perpetual inventory system.
These effects have been explained earlier in this chapter. Under the periodic inventory system,
cost of goods sold and ending inventory values are determined as if the sales for the period all take
place at the end of the period. These calcula ons were demonstrated in our earliest example in
this chapter.
Our original example using units assumed there was no opening inventory at June 1, 2015 and
that purchases were made as follows.

6.6. Appendix B: Inventory Cost Flow Assump ons Under the Periodic System
239
Purchase Transac on
Date
Number of units
Price per unit
June 1
1
$1
5
1
2
7
1
3
21
1
4
28
1
5
5
$15
When recorded in the general ledger T-account “Purchases” (an income statement account), these
transac ons would be recorded as follows.
Purchases
No. 570
Jun. 1
$1
5
2
7
3
21
4
28
5
Sales of four units are all assumed to take place on June 30. Ending inventory would then be
counted at the end of the day on June 30. One unit should be on hand. It would be valued as
follows under the various inventory cost flow assump ons, as discussed in the first part of the
chapter:
Specific iden fica on $4
FIFO
5
Weighted average
3
These values would be used to calculate cost of goods sold and gross profit on the income state-
ment, as shown in Figure
below:
Spec.
Wtd.
Ident.
FIFO
Avg.
Sales
$40
$40
$40
Cost of Goods Sold:
Opening Inventory
-0-
-0-
-0-
Purchases
15
15
15
Goods Available for Sale
15
15
15
Less: Ending Inventory
(4)
(5)
(3)
Cost of Goods Sold
11
10
12
Gross Profit and Net Income
$29
$30
$28
Ending Inventory (Balance Sheet)
$ 4
$ 5
$ 3
Figure 6.16: Effects of Different Cost Flow Assump ons: Periodic Inventory System
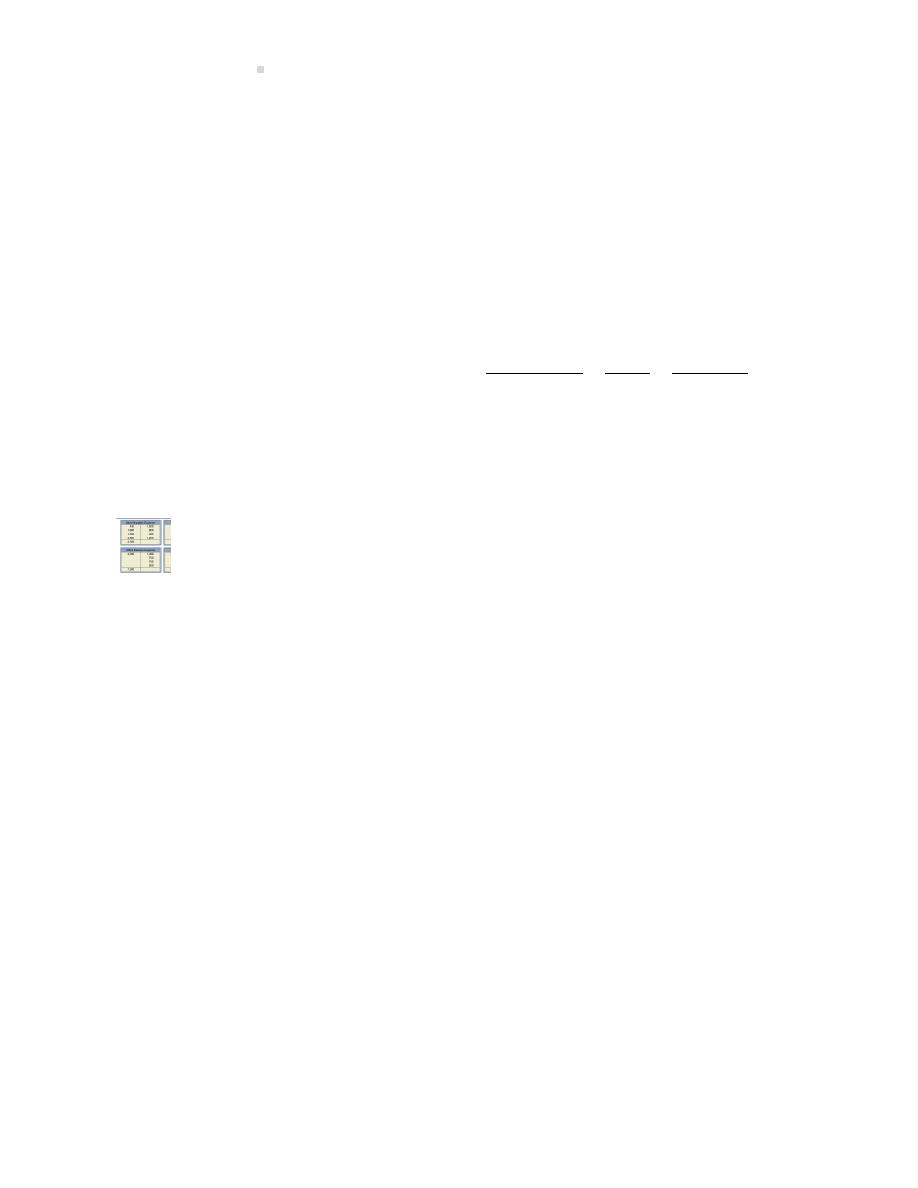
240
Assigning Costs to Merchandise
Note that these results are the same as those calculated using the perpetual inventory method and
assuming all sales take place on June 30 using specific iden fica on (Figure
), FIFO (Figure
),
and weighted average (Figure
) cost flow assump ons, respec vely.
As discussed in the appendix to Chapter
, the ending inventory amount will be recorded in the
accoun ng records when the income statement accounts are closed to the Income Summary at
the end of the year. The amount of the closing entry for ending inventory is obtained from the
income statement. Using the example above and assuming no other revenue or expense items,
the closing entry to adjust ending inventory to actual under each inventory cost flow assump on
would be as follows.
Specific
Weighted
Iden fica on
FIFO
Average
Merchandise Inventory (ending)
4
5
3
Sales
40
40
40
Income Summary
44
45
43
To close all income statement accounts with credit
balances to the Income Summary and record
ending inventory balance.
An explora on is available on the Lyryx site. Log into your Lyryx course to run
Assigning Costs to Inventory - Periodic System
.
Summary of Chapter 6 Learning Objec ves
LO1 – Calculate cost of goods sold and merchandise inventory using specific
iden fica on, first-in first-out (FIFO), and weighted average cost flow assump ons—
perpetual.
Cost of goods available for sale must be allocated between cost of goods sold and ending inventory
using a cost flow assump on. Specific iden fica on allocates cost to units sold by using the actual
cost of the specific unit sold. FIFO (first-in first-out) allocates cost to units sold by assuming the
units sold were the oldest units in inventory. Weighted average allocates cost to units sold by
calcula ng a weighted average cost per unit at the me of sale.
LO2 – Explain the impact on financial statements of inventory cost flows and
errors.
As purchase prices change, par cular inventory methods will assign different cost of goods sold
and resul ng ending inventory to the financial statements. Specific iden fica on achieves the
exact matching of revenues and costs while weighted average accomplishes an averaging of price

Summary of Chapter
Learning Objec ves
241
changes, or smoothing. The use of FIFO results in the current cost of inventory appearing on
the balance sheet in ending inventory. The cost flow method in use must be disclosed in the
notes to the financial statements and be applied consistently from period to period. An error in
ending inventory in one period impacts the balance sheet (inventory and equity) and the income
statement (COGS and net income) for that accoun ng period and the next. However, inventory
errors in one period reverse themselves in the next.
LO3 – Explain and calculate lower of cost and net realizable value inventory ad-
justments.
Inventory must be evaluated, at minimum, each accoun ng period to determine whether the net
realizable value (NRV) is lower than cost, known as the lower of cost and net realizable value
(LCNRV) of inventory. An adjustment is made if the NRV is lower than cost. LCNRV can be applied
to groups of similar items or by item.
LO4 – Es mate merchandise inventory using the gross profit method and the
retail inventory method.
Es ma ng inventory using the gross profit method requires that es mated cost of goods sold be
calculated by, first, mul plying net sales by the gross profit ra o. Es mated ending inventory at
cost is then arrived at by taking goods available for sale at cost less the es mated cost of goods
sold. To apply the retail inventory method, three calcula ons are required:
• retail value of goods available for sale less retail value of net sales equals retail value of
ending inventory,
• goods available for sale at cost divided by retail value of goods available for sale equals cost
to retail ra o, and
• retail value of ending inventory mul plied by the cost to retail ra o equals es mated cost
of ending inventory.
LO5 – Explain and calculate merchandise inventory turnover.
The merchandise turnover is a liquidity ra o that measures how quickly inventory is sold. It is
calculated as: COGS/Average Merchandise Inventory. Average merchandise inventory is the be-
ginning inventory balance plus the ending inventory balance divided by two.

242
Assigning Costs to Merchandise
LO6 – Calculate cost of goods sold and merchandise inventory using specific
iden fica on, first-in first-out (FIFO), and weighted average cost flow assump ons—
periodic.
Periodic systems assign cost of goods available for sale to cost of goods sold and ending inventory
at the end of the accoun ng period. Specific iden fica on and FIFO give iden cal results in each
of periodic and perpetual. The weighted average cost, periodic, will differ from its perpetual coun-
terpart because in periodic, the average cost per unit is calculated at the end of the accoun ng
period based on total goods that were available for sale.
Discussion Ques ons
1. Explain the importance of maintaining appropriate inventory levels for
a. management; and
b. investors and creditors.
2. What aspects of accoun ng for inventory on financial statements would be of interest to
accountants?
3. What is meant by the laid-down cost of inventory?
4. How does a flow of goods differ from a flow of costs? Do generally accepted accoun ng
principles require that the flow of costs be similar to the movement of goods? Explain.
5. What two factors are considered when cos ng merchandise for financial statement pur-
poses? Which of these factors is most difficult to determine? Why?
6. Why is consistency in inventory valua on necessary? Does the applica on of the consistency
principle preclude a change from weighted average to FIFO? Explain.
7. The ending inventory of CBCA Inc. is overstated by $5,000 at December 31, 2018. What is
the effect on 2018 net income? What is the effect on 2019 net income assuming that no
other inventory errors have occurred during 2019?
8. When should inventory be valued at less than cost?
9. What is the primary reason for the use of the LCNRV method of inventory valua on? What
does the term net realisable value mean?
10. When inventory is valued at LCNRV, what does cost refer to?
11. What inventory cost flow assump ons are permissible under GAAP?
12. Why is es ma ng inventory useful?

Exercises
243
13. How does the es ma on of ending inventory differ between the gross profit method and
the retail inventory method? Use examples to illustrate.
14. When is the use of the gross profit method par cularly useful?
15. Does the retail inventory method assume any par cular inventory cost flow assump on?
Exercises
EXERCISE 6–1
(LO1)
Laplante Inc. uses the perpetual inventory system. The following transac ons took place during
January 2021.
Unit
Date
Units
Cost
Jan. 1
Opening Inventory
100
$1
7 Purchase #1
10
2
9 Sale #1
80
21 Purchase #2
20
3
24 Sale #2
40
Required: Using the table below, calculate cost of goods sold for the January 9 and 24 sales, and
ending inventory using the FIFO cost flow assump on.
Purchased (Sold)
Balance
Unit
Unit
Total
Date
Units
Cost
COGS
Units
Cost
Cost
Jan. 1 Opening Inventory
100
×
$1
=
$100
7
Purchase #1
9
Sale #1
21
Purchase #2
24
Sale #2
EXERCISE 6–2
(LO1)
Using the informa on from EXERCISE
, calculate the cost of goods sold for the January 9 and 24
sales, and ending inventory using the Specific Iden fica on cost flow assump on. Assume that:

244
Assigning Costs to Merchandise
i. on January 9, the specific units sold were 72 units from opening inventory and 8 units from
the January 7 purchase and
ii. the specific units sold on January 24 were 23 units from opening inventory and 17 units from
the January 21 purchase.
EXERCISE 6–3
(LO1)
ABBA uses the weighted average inventory cost flow assump on under the perpetual inventory
system. The following transac ons took place in January 2018.
Unit
Selling
Price/
Date
Units
Cost
Jan. 1
Opening Inventory
2,000
$0.50
5
Sale #1
1,200
5.00
6
Purchase #1
1,000
2.00
10 Purchase #2
500
1.00
16 Sale #2
2,000
6.00
21 Purchase #3
1,000
2.50
All sales are made on account. Round all per unit costs to two decimal places.
Required:
a. Record the journal entry for the January 5 sale. Show calcula ons for cost of goods sold.
b. Record the journal entry for the January 16 sale. Show calcula ons for cost of goods sold.
c. Calculate ending inventory in units, cost per unit, and total cost.
EXERCISE 6–4
(LO2)
Listed below are four common accoun ng errors.

Exercises
245
2016 Statements
2017 Statements
2016
2016
2017
2017
Opening
Ending
Total
Net
Opening
Ending
Total
Net
Errors
Invent.
Invent.
Assets
Income
Invent.
Invent.
Assets
Income
1. Goods purchased in 2016
were included in the
December 31, 2016
N/E
inventory, but the
transac on was not
recorded un l early 2017.
2. Goods purchased in 2017
were included in December
31, 2016 inventory, and the
N/E
transac on was recorded in
2016.
Required: Use N/E (No Effect), O (Overstated), or U (Understated) to indicate the effect of each er-
ror on the company’s financial statements for the years ended December 31, 2016 and December
31, 2017. The opening inventory for the 2016 statements is done.
EXERCISE 6–5
(LO2)
Par al income statements of Lilydale Products Inc. are reproduced below:
2021
2022
2023
Sales
$30,000
$40,000
$50,000
Cost of Goods Sold
20,000
23,000
25,000
Gross Profit
$10,000
$17,000
$25,000
Required:
a. Calculate the impact of the two errors listed below on the gross profit calculated for the
three years:
i. The 2021 ending inventory was understated by $2,000.
ii. The 2023 ending inventory was overstated by $5,000.
b. What is the impact of these errors on Total Assets?

246
Assigning Costs to Merchandise
EXERCISE 6–6
(LO3)
Erndale Products Ltd. has the following items in inventory at year-end:
Item
Units
Cost/Unit
NRV/Unit
X
2
$50
$60
Y
3
150
75
Z
4
25
20
Required: Calculate the cost of ending inventory using LCNRV on
a. A unit-by-unit basis
b. A group inventory basis.
EXERCISE 6–7
(LO4)
Windy City Insurance Ltd. has received a fire-loss claim of $45,000 from Balton Corp. A fire de-
stroyed Balton’s inventory on May 25, 2015. Balton has an average gross profit of 35%. You have
obtained the following informa on:
Inventory, May 1, 2015
$ 80,000
Purchases, May 1 - May 25
150,000
Sales, May 1 - May 25
300,000
Required:
a. Calculate the es mated amount of inventory lost in the fire.
b. How reasonable is Balton’s claim?
EXERCISE 6–8
(LO5)
The following account balances for Cost of Goods Sold and Merchandise Inventory were extracted
from Able Corp.’s accoun ng records:

Problems
247
2025
2024
2023
2022
2021
Cost of Goods Sold
370,000
400,000
420,000
440,000
450,000
Merchandise Inventory
120,000
111,250
88,750
111,250
88,750
Required:
a. Calculate the Merchandise Inventory Turnover for each of the years 2022 to 2025.
b. Is the change in Able Corp.’s Merchandise Inventory Turnover ra o favourable or unfavourable?
Explain.
Problems
PROBLEM 6–1
(LO1)
Southern Cross Company Limited made the following purchases and sales of Products A and B
during the year ended December 31, 2020:
Product A
Unit Cost/
Units
Selling Price
Jan. 07
Purchase #1
8,000
$12.00
Mar. 30
Sale #1
9,000
16.00
May 10
Purchase #2
12,000
12.10
Jul. 04
Sale #2
14,000
17.00
Product B
Unit Cost/
Units
Selling Price
Jan. 13
Purchase #1
5,000
$13.81
Jul. 15
Sale #1
1,000
20.00
Oct. 23
Purchase #2
7,000
14.21
Dec. 14
Sale #2
8,000
21.00
Opening inventory at January 1 amounted to 4,000 units at $11.90 per unit for Product A and
2,000 units at $13.26 per unit for Product B.
Required:

248
Assigning Costs to Merchandise
1. Prepare inventory record cards for Products A and B for the year using the weighted average
inventory cost flow assump on.
2. Calculate total cost of ending inventory at December 31, 2020.
3. Calculate the gross profit percentage earned on the sale of
i. Product A in 2020 and
ii. Product B in 2020.
PROBLEM 6–2
(LO1)
Challenge Ques on – Assigning Costs to Inventory
Below are various inventory related transac ons:
Jan 1
Inventory, opening
500 units
@
$10 =
$5,000
4 Sale
100 units
@
$20 =
2,000
6 Purchase
200 units
@
$11 =
2,200
8 Purchase return (from Jan 6 purchase)
(10) units
@ $11
=
(110)
9 Sale
200 units
@
$22 =
4,400
10
Sales return from customer from Jan 4 sale
(returned to inventory)
(15) units
@
$22
=
(330)
15 Sale
150 units @
$23
=
3,450
17 Purchase
300 units @
$9
=
2,700
19 Sales return from customer from Jan 15 sale
(beyond repair, disposed)
(2) units
$23 =
(46)
20
Sale
400 units @
$21
=
2,100
Required:
1. Complete an inventory record card (schedule) the same as the example shown in Figure
of the text and with totals at the bo om. Assume that the FIFO method was used.
2. Calculate the gross profit and the gross profit percentage.
3. What is the ending inventory balance at January 20, 2016?
PROBLEM 6–3
(LO1)
Assigning Costs to Inventory
Below are various inventory related transac ons:

Problems
249
Purchases:
Feb 1
Opening inventory
75 units @ $12
Feb 7
Purchase
300 units @ $11
Feb 14
Purchase return from Feb 7
10 units @ $11
Feb 19
Purchase
400 units @ $9
Sales Price: $24.00
Units Sold:
Feb 5
70 units
Feb 12
180 units
Feb 17
100 units
Feb 23
80 units
Required:
1. Complete an inventory record card (schedule) the same as the example shown in Figure
of the text and with totals at the bo om. Assume that a weighted average cost method was
used. Round unit costs to the nearest two decimals.
2. Calculate the gross profit and the gross profit percentage.
3. What is the ending inventory balance at February 23, 2016?
PROBLEM 6–4
(LO2)
Inventory Errors
The following table shows the following financial data for AAA Ltd. for the year ended December
31, 2016:
Financial Data
For the year ended December 31, 2016
2015
2016
Cost of goods sold
$ 500,000
$ 660,000
Net income
250,000
350,000
Total assets
1,500,000
1,400,000
Equity
1,400,000
1,300,000
The following errors were made:

250
Assigning Costs to Merchandise
The inventory count for 2015 was overstated by $45,000.
Required: Calculate the corrected cost of goods sold, net income, total assets and equity for 2015
and 2016.
PROBLEM 6–5
(LO2)
Inventory Errors
Using the data from PROBLEM
, the following table shows the following financial data for AAA
Ltd. for the year ended December 31, 2016:
Financial Data
For the year ended December 31, 2016
2015
2016
Cost of goods sold
$ 500,000
$ 660,000
Net income
250,000
350,000
Total assets
1,500,000
1,400,000
Equity
1,400,000
1,300,000
The following errors were made:
The inventory count for 2015 was understated by $30,000.
Required: Calculate the corrected cost of goods sold, net income, total assets and equity for 2015
and 2016.
PROBLEM 6–6
(LO3)
Lower of Cost and Net Realizable Value
Below are the inventory details for Almac Flooring Ltd.:

Problems
251
Ceramic Wall Tiles:
# of Units Cost/Unit NRV/Unit
White
1,025
5.00
6.00
Black
875
4.50
4.25
Slate
645
7.00
7.11
Beige
325
2.00
2.25
Marble Flooring:
Cordoba
10,000
9.25
9.35
Carrerra
12,000
10.50
10.50
Maricha
8,000
11.50
11.45
Shower Waterproofing:
Novo
10,035
9.85
9.50
Deetra
9.86
6.75
7.15
Required:
1. Calculate the LCNRV for each group.
2. Calculate the LCNRV for each individual product.
3. Prepare the adjus ng entries if any for parts (1) and (2).
PROBLEM 6–7
(LO4)
Es ma ng Inventory and Valua on – Gross Profit Method
Varane Ltd. is required to submit an interim financial statement to their bank as part of the line-
of-credit monitoring process. Below is informa on regarding their first quarter business for 2017:
Ending inventory from the previous year
$420,364
Purchases
1,323,280
Purchase returns
18,270
Transporta on-in
9,660
Freight-out
2,300
Sales
1,667,610
Sales returns
13,230
Opera ng expenses
130,500
3-year rolling average gross profit
34%
Income tax rate
30%
Required:

252
Assigning Costs to Merchandise
1. Prepare a schedule of calcula ons to es mate the company’s ending inventory at the end
of the quarter using the gross profit method.
2. Prepare a mul ple-step income statement for the first quarter ending March 31, 2017.
PROBLEM 6–8
(LO4)
Es ma ng Inventory and Valua on – Retail Inventory Method
Ceabane Ltd. is required to submit an interim financial statement to their creditors. Below is in-
forma on regarding their first six months for 2017:
At Cost
At Retail
Ending inventory from the previous year
$659,890
$1,298,010
Purchases
4,660,362
8,958,180
Purchase returns
73,920
167,090
Sales
7,693,980
Sales returns
62,440
Addi onal informa on:
Opera ng expenses
$1,500,000
Income tax rate
30%
Required:
1. Prepare a schedule of calcula ons to es mate the company’s ending inventory at the end
of the quarter using the retail inventory method.
2. Prepare a mul ple-step income statement for the first six months ending June 30, 2017.
PROBLEM 6–9
(LO2)
Par al income statements of Schneider Products Inc. are reproduced below:
2016
2017
Sales
$50,000
$50,000
Cost of Goods Sold
20,000
23,000
Gross Profit
$30,000
$27,000
The 2016 ending inventory was overstated by $2,000 during the physical count. The 2017 physical
inventory count was done properly.
Required:

Problems
253
1. Calculate the impact of this error on the gross profit calculated for 2016 and 2017.
2. What is the impact of this error on total assets at the end of 2016 and 2017? Net assets?
PROBLEM 6–10
(LO3)
Reflex Corpora on sells three products. The inventory valua on of these products is shown below
for years 2017 and 2018.
2017
2018
Unit Basis
Unit Basis
Cost
Market
(LCNRV)
Cost
Market
(LCNRV)
Product X
$14,000
$15,000
?
$15,000
$16,000
?
Product Y
12,500
12,000
?
12,000
11,500
?
Product Z
11,000
11,500
?
10,500
10,000
?
Total
?
?
?
?
?
?
Required: If Reflex values its inventory using LCNRV/unit basis, complete the 2017 and 2018 cost,
net realizable value, and LCNRV calcula ons.


Chapter 7
Cash and Receivables
This chapter focuses on the current assets of cash and receivables. Internal control over cash
involves processes and procedures that include the use of a pe y cash fund and the prepara on
of a bank reconcilia on. Receivables can be determined to be uncollec ble. To match the cost of
uncollec ble accounts and the related revenue, uncollec ble accounts, more commonly referred
to as bad debts, must be es mated. Bad debts are accounted for using the allowance approach,
applied using either the income statement method or balance sheet method. When uncollec ble
accounts are specifically iden fied, they are wri en off. Write-offs can be subsequently recovered.
The journalizing of short-term notes receivable and related interest revenue is also discussed in
this chapter. To help in the analysis of cash and receivables, two ra os are introduced: the acid-
test and accounts receivable turnover.
Chapter 7 Learning Objec ves
LO1 – Define internal control and explain how it is applied to cash.
LO2 – Explain and journalize pe y cash transac ons.
LO3 – Explain the purpose of and prepare a bank reconcilia on, and record related adjust-
ments.
LO4 – Explain, calculate, and record es mated uncollec ble accounts receivable and subse-
quent write-offs and recoveries.
LO5 – Explain and record a short-term notes receivable as well as calculate related interest.
LO6 – Explain and calculate the acid-test ra o.
LO7 – Explain and calculate the accounts receivable turnover.
Concept Self-Check
Use the following as a self-check while working through Chapter
1. What cons tutes a good system of control over cash?
2. What is a pe y cash system and how is it used to control cash?
3. How is pe y cash reported on the balance sheet?
255

256
Cash and Receivables
4. How does the prepara on of a bank reconcilia on facilitate control over cash?
5. What are the steps in preparing a bank reconcilia on?
6. How does the es ma on of uncollec ble accounts receivable address the GAAP of match-
ing?
7. How are uncollec ble accounts disclosed on financial statements?
8. What are the different methods used for es ma ng uncollec ble accounts receivable?
9. How is aging of accounts receivable used in es ma ng uncollec ble accounts?
10. How are notes receivable recorded?
11. What is the acid-test ra o and how is it calculated?
12. How is the accounts receivable turnover calculated and what does it mean?
NOTE: The purpose of these ques ons is to prepare you for the concepts introduced in the chap-
ter. Your goal should be to answer each of these ques ons as you read through the chapter. If,
when you complete the chapter, you are unable to answer one or more the Concept Self-Check
ques ons, go back through the content to find the answer(s). Solu ons are not provided to these
ques ons.
7.1 Internal Control
LO1
–
Define
internal
control
and explain how
it is applied to
cash.
Assets are the lifeblood of a company. As such, they must be protected.
This duty falls to managers of a company. The policies and procedures im-
plemented by management to protect assets are collec vely referred to as
internal controls. An effec ve internal control program not only protects
assets, but also aids in accurate recordkeeping, produces financial state-
ment informa on in a mely manner, ensures compliance with laws and
regula ons, and promotes efficient opera ons. Effec ve internal control
procedures ensure that adequate records are maintained, transac ons are
authorized, du es among employees are divided between recordkeeping
func ons and control of assets, and employees’ work is checked by others.
The use of electronic recordkeeping systems does not decrease the need
for good internal controls.
The effec veness of internal controls is limited by human error and fraud. Human error can occur
because of negligence or mistakes. Fraud is the inten onal decision to circumvent internal control
systems for personal gain. Some mes, employees cooperate in order to avoid internal controls.
This collusion is o en difficult to detect, but fortunately, it is not a common occurrence when
adequate controls are in place.

7.1. Internal Control
257
Internal controls take many forms. Some are broadly based, like mandatory employee drug test-
ing, video surveillance, and scru ny of company email systems. Others are specific to a par cular
type of asset or process. For instance, internal controls need to be applied to a company’s account-
ing system to ensure that transac ons are processed efficiently and correctly to produce reliable
records in a mely manner. Procedures should be documented to promote good recordkeeping,
and employees need to be trained in the applica on of internal control procedures.
Financial statements prepared according to generally accepted accoun ng principles are useful
not only to external users in evalua ng the financial performance and financial posi on of the
company, but also for internal decision making. There are various internal control mechanisms
that aid in the produc on of mely and useful financial informa on. For instance, using a chart
of accounts is necessary to ensure transac ons are recorded in the appropriate account. As an
example, expenses are classified and recorded in applicable expense accounts, then summarized
and evaluated against those of a prior year.
The design of accoun ng records and documents is another important means to provide financial
informa on. Financial data is entered and summarized in records and transmi ed by documents.
A good system of internal control requires that these records and documents be prepared at the
me a transac on takes place or as soon as possible a erward, since they become less credible
and the possibility of error increases with the passage of me. The documents should also be
consecu vely pre-numbered, to indicate whether there may be missing documents.
Internal control also promotes the protec on of assets. Cash is par cularly vulnerable to misuse.
A good system of internal control for cash should provide adequate procedures for protec ng cash
receipts and cash payments (commonly referred to as cash disbursements). Procedures to achieve
control over cash vary from company to company and depend upon such variables as company
size, number of employees, and cash sources. However, effec ve cash control generally requires
the following:
• Separa on of du es: People responsible for handling cash should not be responsible for
maintaining cash records. By separa ng the custodial and record-keeping du es, the of
cash is less likely.
• Same-day deposits: All cash receipts should be deposited daily in the company’s bank ac-
count. This prevents the and personal use of the money before deposit.
• Payments made using non-cash means: Cheques or electronic funds transfer (EFT) provide
a separate external record to verify cash disbursements. For example, many businesses pay
their employees using electronic funds transfer because it is more secure and efficient than
using cash or even cheques.
Two forms of internal control over cash will be discussed in this chapter: the use of a pe y cash
account and the prepara on of bank reconcilia ons.
258
Cash and Receivables
7.2 Pe y Cash
LO2
–
Explain
and
journal-
ize
pe y
cash
transac ons.
The payment of small amounts by cheque may be inconvenient and costly.
For example, using cash to pay for postage on an incoming package might
be less than the total processing cost of a cheque. A small amount of cash
kept on hand to pay for small, infrequent expenses is referred to as a pe y
cash fund.
Establishing and Reimbursing the Pe y Cash Fund
To set up the pe y cash fund, a cheque is prepared for the amount of the fund. The custodian
of the fund cashes the cheque and places the coins and currency in a locked box. Responsibility
for the pe y cash fund should be delegated to only one person, who should be held accountable
for its contents. Cash payments are made by this pe y cash custodian out of the fund as required
when supported by receipts. When the amount of cash has been reduced to a pre-determined
level, the receipts are compiled and submi ed for entry into the accoun ng system. A cheque is
then issued to reimburse the pe y cash fund. At any given me, the pe y cash amount should
consist of cash and suppor ng receipts, all totalling the pe y cash fund amount. To demonstrate
the management of a pe y cash fund, assume that a $200 cheque is issued for the purpose of
establishing a pe y cash fund.
The journal entry is:
General Journal
Date
Account/Explana on
PR
Debit
Credit
Pe y Cash . . . . . . . . . . . . . . . . . . . . . . . . . . . . .
200
Cash . . . . . . . . . . . . . . . . . . . . . . . . . . . . . . .
200
To establish the $200 pe y cash fund.
Pe y Cash is a current asset account. When repor ng Cash on the financial statements, the bal-
ances in Pe y Cash and Cash are added together and reported as one amount.
Assume the pe y cash custodian has receipts totalling $190 and $10 in coin and currency remain-
ing in the pe y cash box. The receipts consist of the following: delivery charges $100, $35 for
postage, and office supplies of $55. The pe y cash custodian submits the receipts to the accoun-
tant who records the following entry and issues a cheque for $190.
General Journal
Date
Account/Explana on
PR
Debit
Credit
Delivery Expense . . . . . . . . . . . . . . . . . . . . . . .
100
Postage Expense . . . . . . . . . . . . . . . . . . . . . . .
35
Office Supplies Expense
. . . . . . . . . . . . . . . .
55
Cash . . . . . . . . . . . . . . . . . . . . . . . . . . . . . . .
190
To reimburse the pe y cash fund.
7.2. Pe y Cash
259
The pe y cash receipts should be cancelled at the me of reimbursement in order to prevent their
reuse for duplicate reimbursements. The pe y cash custodian cashes the $190 cheque. The $190
plus the $10 of coin and currency in the locked box immediately prior to reimbursement equals
the $200 total required in the pe y cash fund.
Some mes, the receipts plus the coin and currency in the pe y cash locked box do not equal the
required pe y cash balance. To demonstrate, assume the same informa on above except that the
coin and currency remaining in the pe y cash locked box was $8. This amount plus the receipts
for $190 equals $198 and not $200, indica ng a shortage in the pe y cash box. The entry at the
me of reimbursement reflects the shortage and is recorded as:
General Journal
Date
Account/Explana on
PR
Debit
Credit
Delivery Expense . . . . . . . . . . . . . . . . . . . . . . .
100
Postage Expense . . . . . . . . . . . . . . . . . . . . . . .
35
Office Supplies Expense. . . . . . . . . . . . . . . . .
55
Cash Over/Short Expense . . . . . . . . . . . . . . .
2
Cash . . . . . . . . . . . . . . . . . . . . . . . . . . . . . . .
192
To reimburse the pe y cash fund and ac-
count for the $2.00 shortage.
No ce that the $192 credit to Cash plus the $8 of coin and currency remaining in the pe y cash
box immediately prior to reimbursement equals the $200 required total in the pe y cash fund.
Assume, instead, that the coin and currency in the pe y cash locked box was $14. This amount
plus the receipts for $190 equals $204 and not $200, indica ng an overage in the pe y cash box.
The entry at the me of reimbursement reflects the overage and is recorded as:
General Journal
Date
Account/Explana on
PR
Debit
Credit
Delivery Expense . . . . . . . . . . . . . . . . . . . . . . .
100
Postage Expense . . . . . . . . . . . . . . . . . . . . . . .
35
Office Supplies Expense. . . . . . . . . . . . . . . . .
55
Cash Over/Short Expense . . . . . . . . . . . .
4
Cash . . . . . . . . . . . . . . . . . . . . . . . . . . . . . . .
186
To reimburse the pe y cash fund and ac-
count for the $4.00 overage.
Again, no ce that the $186 credit to Cash plus the $14 of coin and currency remaining in the pe y
cash box immediately prior to reimbursement equals the $200 required total in the pe y cash
fund.
What happens if the pe y cash custodian finds that the fund is rarely used? In such a case, the
size of the fund should be decreased to reduce the risk of the . To demonstrate, assume the
pe y cash custodian has receipts totalling $110 and $90 in coin and currency remaining in the
1
An expense is debited instead of Office Supplies, an asset, because the need to purchase supplies through pe y
cash assumes the immediate use of the items.
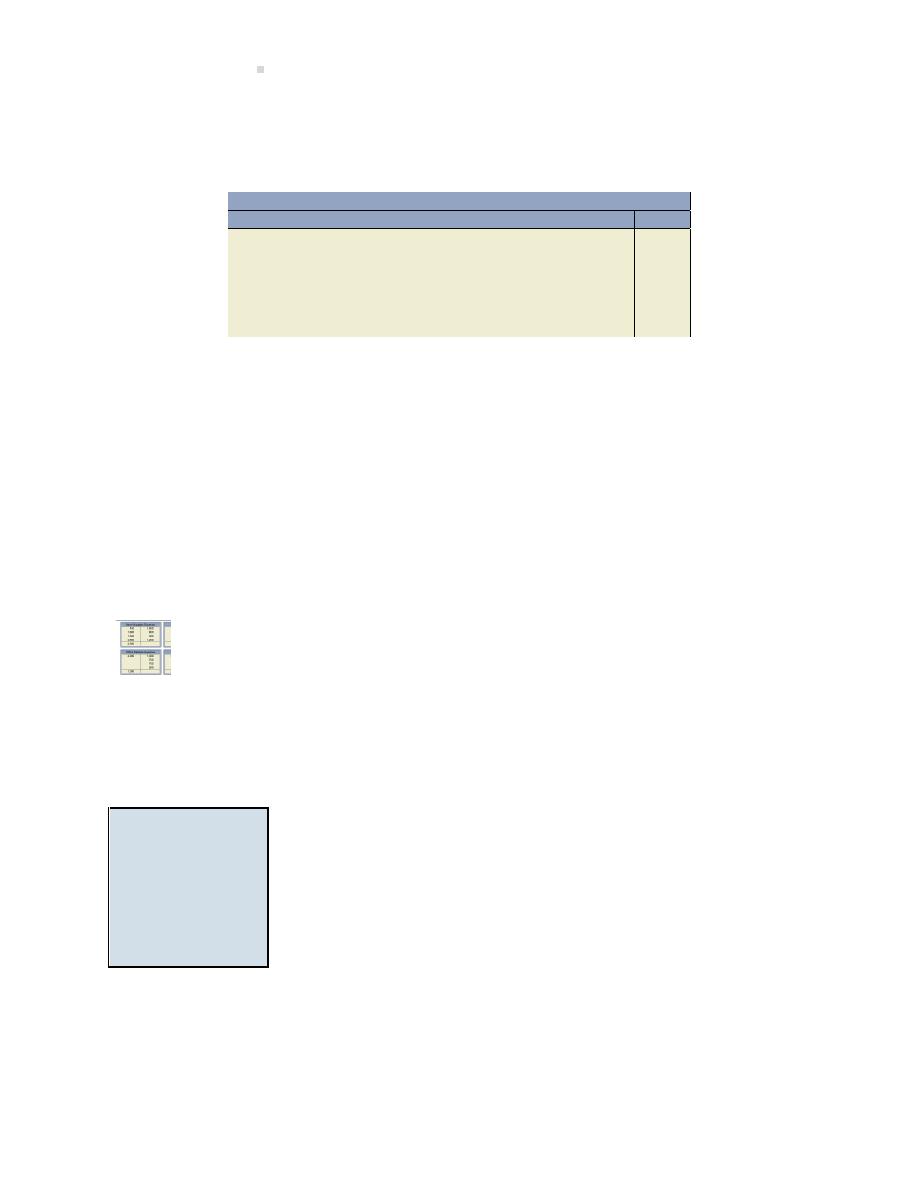
260
Cash and Receivables
pe y cash box. The receipts consist of the following: delivery charges $80 and postage $30. The
pe y cash custodian submits the receipts to the accountant and requests that the pe y cash fund
be reduced by $75. The following entry is recorded and a cheque for $35 is issued.
General Journal
Date
Account/Explana on
PR
Debit
Credit
Delivery Expense . . . . . . . . . . . . . . . . . . . . . . .
80
Postage Expense . . . . . . . . . . . . . . . . . . . . . . .
30
Pe y Cash . . . . . . . . . . . . . . . . . . . . . . . . .
75
Cash . . . . . . . . . . . . . . . . . . . . . . . . . . . . . . .
35
To reimburse the pe y cash fund and re-
duce it by $75.
The $35 credit to Cash plus the $90 of coin and currency remaining in the pe y cash box immedi-
ately prior to reimbursement equals the $125 new balance in the pe y cash fund ($200 original
balance less the $75 reduc on).
In cases when the size of the pe y cash fund is too small, the pe y cash custodian could request
an increase in the size of the pe y cash fund at the me of reimbursement. Care should be taken
to ensure that the size of the pe y cash fund is not so large as to become a poten al the issue.
Addi onally, if a pe y cash fund is too large, it may be an indicator that transac ons that should
be paid by cheque are not being processed in accordance with company policy. Remember that
the purpose of the pe y cash fund is to pay for infrequent expenses; day-to-day items should not
go through pe y cash.
An explora on is available on the Lyryx site. Log into your Lyryx course to run
7.3 Cash Collec ons and Payments
LO3
–
Explain
the purpose of
and
prepare
a
bank
recon-
cilia on,
and
record
related
adjustments.
The widespread use of banks facilitates cash transac ons between en -
es and provides a safeguard for the cash assets being exchanged. This
involvement of banks as intermediaries between en
es has accoun ng
implica ons. At any point in me, the cash balance in the accoun ng
records of a par cular company usually differs from the bank cash bal-
ance of that company. The difference is usually because some cash trans-
ac ons recorded in the accoun ng records have not yet been recorded by
the bank and, conversely, some cash transac ons recorded by the bank
have not yet been recorded in the company’s accoun ng records.
The use of a bank reconcilia on is one method of internal control over cash. The reconcilia on
process brings into agreement the company’s accoun ng records for cash and the bank statement
issued by the company’s bank. A bank reconcilia on explains the difference between the balances
reported by the company and by the bank on a given date.

7.3. Cash Collec ons and Payments
261
A bank reconcilia on proves the accuracy of both the company’s and the bank’s records, and re-
veals any errors made by either party. The bank reconcilia on is a tool that can help detect at-
tempts at the and manipula on of records. The prepara on of a bank reconcilia on is discussed
in the following sec on.
The Bank Reconcilia on
The bank reconcilia on is a report prepared by a company at a point in me. It iden fies discrep-
ancies between the cash balance reported on the bank statement and the cash balance reported
in a business’s Cash account in the general ledger, more commonly referred to as the books. These
discrepancies are known as reconciling items and are added or subtracted to either the book bal-
ance or bank balance of cash. Each of the reconciling items is added or subtracted to the business’s
cash balance. The business’s cash balance will change as a result of the reconciling items. The cash
balance prior to reconcilia on is called the unreconciled cash balance. The balance a er adding
and subtrac ng the reconciling items is called the reconciled cash balance. The following is a list
of poten al reconciling items and their impact on the bank reconcilia on.
Book reconciling items
Bank reconciling items
Collec on of notes receivable (added)
Outstanding deposits (added)
NSF cheques (subtracted)
Outstanding cheques (subtracted)
Bank charges (subtracted)
Book errors (added or subtracted,
Bank errors (added or subtracted,
depending on the nature of the error)
depending on the nature of the error)
Book Reconciling Items
The collec on of notes receivable may be made by a bank on behalf of the company. These collec-
ons are o en unknown to the company un l they appear as an addi on on the bank statement,
and so cause the general ledger cash account to be understated. As a result, the collec on of a
notes receivable is added to the unreconciled book balance of cash on the bank reconcilia on.
Cheques returned to the bank because there were not sufficient funds (NSF) to cover them appear
on the bank statement as a reduc on of cash. The company must then request that the customer
pay the amount again. As a result, the general ledger cash account is overstated by the amount of
the NSF cheque. NSF cheques must therefore be subtracted from the unreconciled book balance
of cash on the bank reconcilia on to reconcile cash.
Cheques received by a company and deposited into its bank account may be returned by the cus-
tomer’s bank for a number of reasons (e.g., the cheque was issued too long ago, known as a stale-
dated cheque, an unsigned or illegible cheque, or the cheque shows the wrong account number).
Returned cheques cause the general ledger cash account to be overstated. These cheques are
therefore subtracted on the bank statement, and must be deducted from the unreconciled book
balance of cash on the bank reconcilia on.

262
Cash and Receivables
Bank service charges are deducted from the customer’s bank account. Since the service charges
have not yet been recorded by the company, the general ledger cash account is overstated. There-
fore, service charges are subtracted from the unreconciled book balance of cash on the bank rec-
oncilia on.
A business may incorrectly record journal entries involving cash. For instance, a deposit or cheque
may be recorded for the wrong amount in the company records. These errors are o en detected
when amounts recorded by the company are compared to the bank statement. Depending on the
nature of the error, it will be either added to or subtracted from the unreconciled book balance of
cash on the bank reconcilia on. For example, if the company recorded a cheque as $520 when the
correct amount of the cheque was $250, the $270 difference would be added to the unreconciled
book balance of cash on the bank reconcilia on. Why? Because the cash balance reported on the
books is understated by $270 as a result of the error. As another example, if the company recorded
a deposit as $520 when the correct amount of the deposit was $250, the $270 difference would be
subtracted from the unreconciled book balance of cash on the bank reconcilia on. Why? Because
the cash balance reported on the books is overstated by $270 as a result of the error. Each error
requires careful analysis to determine whether it will be added or subtracted in the unreconciled
book balance of cash on the bank reconcilia on.
Bank Reconciling Items
Cash receipts are recorded as an increase of cash in the company’s accoun ng records when they
are received. These cash receipts are deposited by the company into its bank. The bank records an
increase in cash only when these amounts are actually deposited with the bank. Since not all cash
receipts recorded by the company will have been recorded by the bank when the bank statement
is prepared, there will be outstanding deposits, also known as deposits in transit. Outstanding
deposits cause the bank statement cash balance to be understated. Therefore, outstanding de-
posits are a reconciling item that must be added to the unreconciled bank balance of cash on the
bank reconcilia on.
On the date that a cheque is prepared by a company, it is recorded as a reduc on of cash in a
company’s books. A bank statement will not record a cash reduc on un l a cheque is presented
and accepted for payment (or clears the bank). Cheques that are recorded in the company’s books
but are not paid out of its bank account when the bank statement is prepared are referred to
as outstanding cheques. Outstanding cheques mean that the bank statement cash balance is
overstated. Therefore, outstanding cheques are a reconciling item that must be subtracted from
the unreconciled bank balance of cash on the bank reconcilia on.
Bank errors some mes occur and are not revealed un l the transac ons on the bank statement
are compared to the company’s accoun ng records. When an error is iden fied, the company
no fies the bank to have it corrected. Depending on the nature of the error, it is either added to
or subtracted from the unreconciled bank balance of cash on the bank reconcilia on. For example,
if the bank cleared a cheque as $520 that was correctly wri en for $250, the $270 difference would
be added to the unreconciled bank balance of cash on the bank reconcilia on. Why? Because the
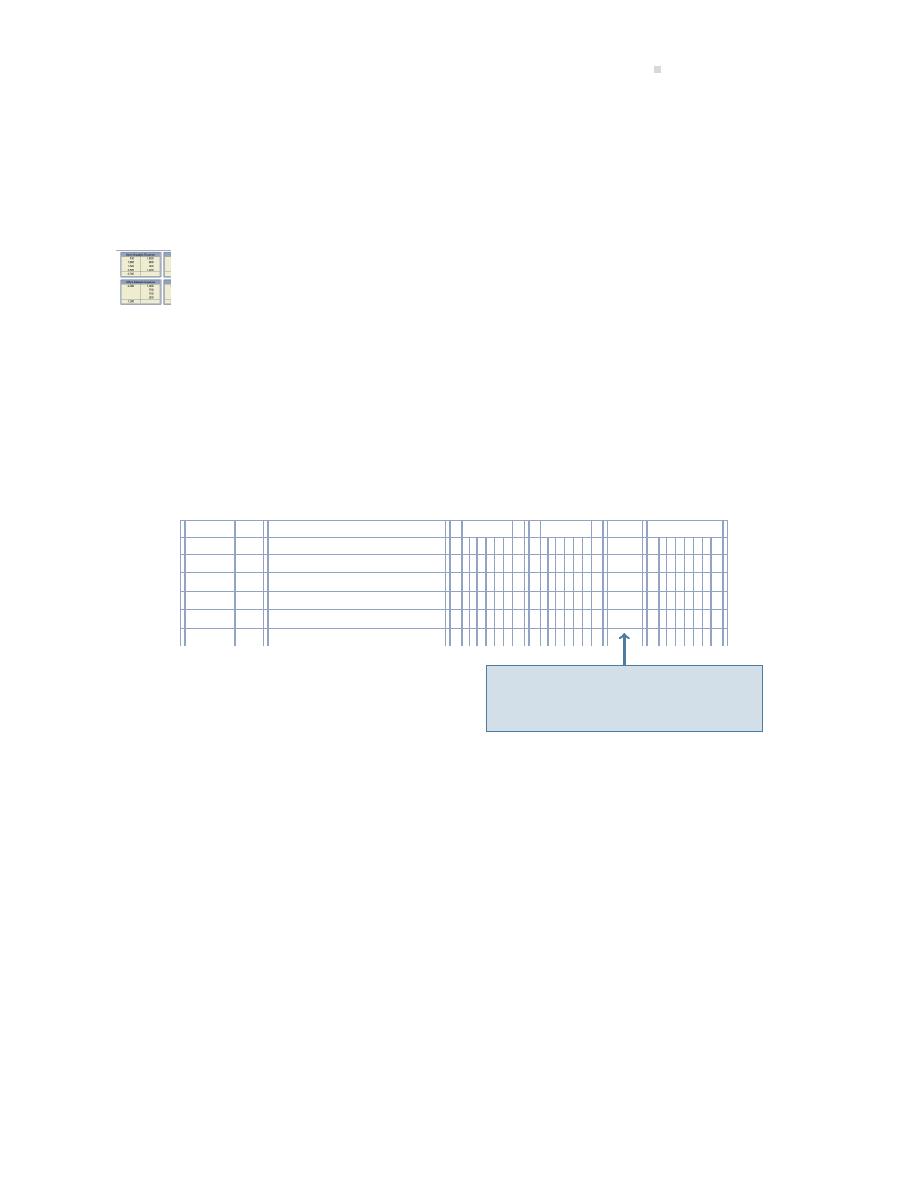
7.3. Cash Collec ons and Payments
263
cash balance reported on the bank statement is understated by $270 as a result of this error. As
another example, if the bank recorded a deposit as $520 when the correct amount was actually
$250, the $270 difference would be subtracted from the unreconciled bank balance of cash on the
bank reconcilia on. Why? Because the cash balance reported on the bank statement is overstated
by $270 as a result of this specific error. Each error must be carefully analyzed to determine how
it will be treated on the bank reconcilia on.
An explora on is available on the Lyryx site. Log into your Lyryx course to run
Illustra ve Problem—Bank Reconcilia on
Assume that a bank reconcilia on is prepared by Big Dog Carworks Corp. (BDCC) at April 30. At
this date, the Cash account in the general ledger shows a balance of $21,929 and includes the cash
receipts and payments shown in Figure
.
Cash
Acct. No. 101
Date
Descrip on
Debit
Credit
DR/CR
Balance
2015
Mar.
31
Balance
DR
20673 -
Apr.
30
April cash receipts
9482 -
DR
30155 -
30
April cash payments
8226 -
DR
21929 -
Remember, ‘DR’ (debit) denotes a
posi ve cash balance in the far right-
hand column of the general ledger.
Figure 7.1: Big Dog’s General Ledger ‘Cash’ Account at April 30
Extracts from BDCC’s accoun ng records are reproduced with the bank statement for April in Fig-
ure
.
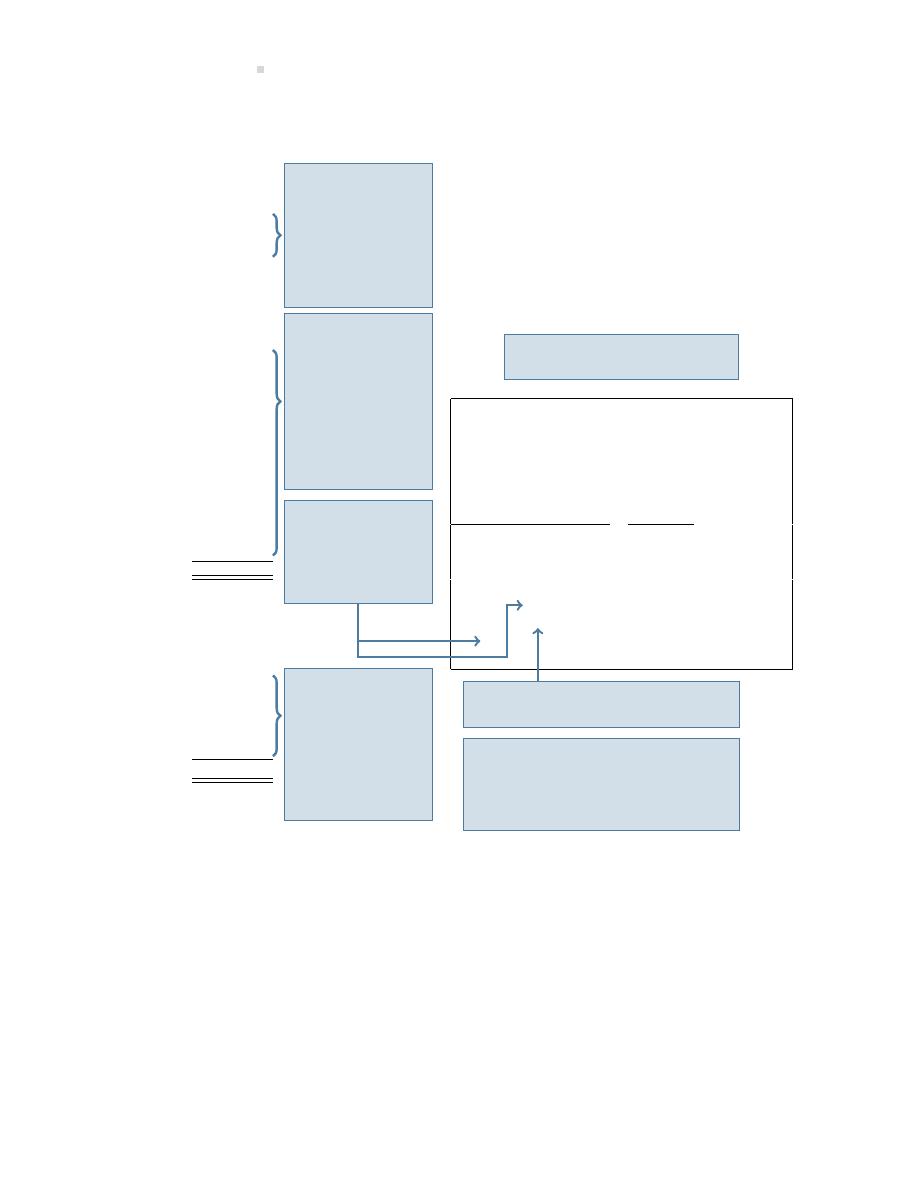
264
Cash and Receivables
PER COMPANY RECORDS
PER BANK RECORDS
Outstanding cheques
at March 31:
Cheque No.
Amount
580
$4,051
x
599
196 x
600
7 x
Cheques wri en
during month of April:
Cheque No.
Amount
601
$ 24 x
602
1,720 x
603
230 x
604
200 x
Second Chartered Bank
605
2,220 x
Bank Statement
606
287
for Big Dog Carworks Corp.
607
1,364
For the Month Ended April 30, 2015
608
100
609
40
Deposits/
Balance
610
1,520
Cheques/Charges/Debits
Credits
24,927
611
124 x
4,051 x
1,570
22,446
612
397 x
196 x
24 x
230 x
390
22,386
$8,226
200 x
22,186
124 x
397 x
7 x
21,658
2,220 x
180
NSF
5,000
24,258
Deposits made for
1,720 x
31
1,522
24,029
the month of April:
6
SC
24,023
Date
Amount
April 5
$1,570 x
10
390 x
23
5,000 x
28
1,522 x
30
1,000
$9,482
Step 1a: March
31 outstanding
cheques are com-
pared with cheques
cashed to see if any
are s ll outstanding
at April 30. Cleared
items are marked
with an ‘x’.
Step 1b: Cheques
wri en are com-
pared with the
cleared cheques
on the bank state-
ment to iden fy
which ones have
not cleared the
bank (outstanding
cheques). Cleared
items are marked
with an ‘x’.
Step 3: Deposits
made by the com-
pany are compared
with deposits on
the bank statement
to determine out-
standing deposits
at April 30. Cleared
items are marked
with an ‘x’.
Step 2: Other
charges made by
the bank are iden-
fied (SC=service
charge; NSF=not
sufficient funds).
Step 5: Remaining items are iden fied
and resolved with the bank.
Step 4: Outstanding deposits from
March 31 are compared with the bank
statement to see if they are s ll out-
standing at April 30. (There were no
outstanding deposits at March 31.)
The BDCC bank statement for the
month of April is as follows:
Figure 7.2: The Bank Reconcilia on Process
For each entry in BDCC’s general ledger Cash account, there should be a matching entry on its
bank statement. Items in the general ledger Cash account but not on the bank statement must be
reported as a reconciling item on the bank reconcilia on. For each entry on the bank statement,
there should be a matching entry in BDCC’s general ledger Cash account. Items on the bank state-
ment but not in the general ledger Cash account must be reported as a reconciling item on the
bank reconcilia on.
There are nine steps to follow in preparing a bank reconcilia on for BDCC at April 30, 2015:

7.3. Cash Collec ons and Payments
265
Step 1
Iden fy the ending general ledger cash balance ($21,929 from Figure
) and list it on the bank
reconcilia on as the book balance on April 30 as shown in Figure
. This represents the unrec-
onciled book balance.
Step 2
Iden fy the ending cash balance on the bank statement ($24,023 from Figure
) and list it on
the bank reconcilia on as the bank statement balance on April 30 as shown in Figure
. This
represents the unreconciled bank balance.
Step 3
Cheques wri en that have cleared the bank are returned with the bank statement. These cheques
are said to be cancelled because, once cleared, the bank marks them to prevent them from being
used again. Cancelled cheques are compared to the company’s list of cash payments. Outstanding
cheques are iden fied using two steps:
a. Any outstanding cheques listed on the BDCC’s March 31 bank reconcilia on are compared to
the cheques listed on the April 30 bank statement.
For BDCC, all of the March outstanding cheques (nos. 580, 599, and 600) were paid by the
bank in April. Therefore, there are no reconciling items to include in the April 30 bank rec-
oncilia on. If one of the March outstanding cheques had not been paid by the bank in April,
it would be subtracted as an outstanding cheque from the unreconciled bank balance on the
bank reconcilia on.
b. The cash payments listed in BDCC’s accoun ng records are compared to the cheques on the
bank statement. This comparison indicates that the following cheques are outstanding.
Cheque No.
Amount
606
$ 287
607
1,364
608
100
609
40
610
1,520
Outstanding cheques must be deducted from the bank statement’s unreconciled ending cash
balance of $24,023 as shown in Figure
Step 4
Other payments made by the bank are iden fied on the bank statement and subtracted from the
unreconciled book balance on the bank reconcilia on.
a. An examina on of the April bank statement shows that the bank had deducted the NSF cheque
of John Donne for $180. This is deducted from the unreconciled book balance on the bank
reconcilia on as shown in Figure

266
Cash and Receivables
b. An examina on of the April 30 bank statement shows that the bank had also deducted a service
charge of $6 during April. This amount is deducted from the unreconciled book balance on the
bank reconcilia on as shown in Figure
.
Step 5
Last month’s bank reconcilia on is reviewed for outstanding deposits at March 31. There were no
outstanding deposits at March 31. If there had been, the amount would have been added to the
unreconciled bank balance on the bank reconcilia on.
Step 6
The deposits shown on the bank statement are compared with the amounts recorded in the com-
pany records. This comparison indicates that the April 30 cash receipt amoun ng to $1,000 was
deposited but it is not included in the bank statement. The outstanding deposit is added to the
unreconciled bank balance on the bank reconcilia on as shown in Figure
.
Step 7
Any errors in the company’s records or in the bank statement must be iden fied and reported on
the bank reconcilia on.
An examina on of the April bank statement shows that the bank deducted a cheque issued by
another company for $31 from the BDCC bank account in error. Assume that when no fied, the
bank indicated it would make a correc on in May’s bank statement.
The cheque deducted in error must be added to the bank statement balance on the bank recon-
cilia on as shown in Figure
Step 8
Total both sides of the bank reconcilia on. The result must be that the book balance and the bank
statement balance are equal or reconciled. These balances represent the adjusted balance.
The bank reconcilia on in Figure
is the result of comple ng the preceding eight steps.

7.3. Cash Collec ons and Payments
267
Big Dog Carworks Corp.
Bank Reconcilia on
At April 30, 2015
Book balance at Apr. 30
$21,929 Bank statement balance at Apr. 30 $24,023
Add: Outstanding deposit
1,000
Cheque deducted in error
31
25,054
Less: Bank charges
$ 6
Less: Outstanding cheques
NSF Cheque – J. Donne
180
186
Cheque No.
Amount
606
$ 287
607
1,364
608
100
609
40
610
1,520
3,311
Adjusted book balance at Apr. 30
$21,743 Adjusted bank balance at Apr. 30
$21,743
Reconciling items in this sec on require
journal entries to be made in the general
journal to correct the unreconciled Cash
balance of $21,929 in the general ledger
to the reconciled balance of $21,743.
Reconciling items in this sec on do not
require journal entries because the out-
standing deposits and cheques should
clear the bank next month, in May. Addi-
onally, the other reconciling items (e.g.,
the $31 cheque deducted in error) must
be reported to the bank so it can make
the necessary correc ons to Big Dog’s ac-
count in the next month.
These balances must agree.
Figure 7.3: BDCC’s April Bank Reconcilia on
Step 9
For the adjusted balance calculated in the bank reconcilia on to appear in the accoun ng records,
an adjus ng entry(s) must be prepared.
The adjus ng entry(s) is based on the reconciling item(s) used to calculate the adjusted book bal-
ance. The book balance side of BDCC’s April 30 bank reconcilia on is copied to the le below to
clarify the source of the following April 30 adjustments.
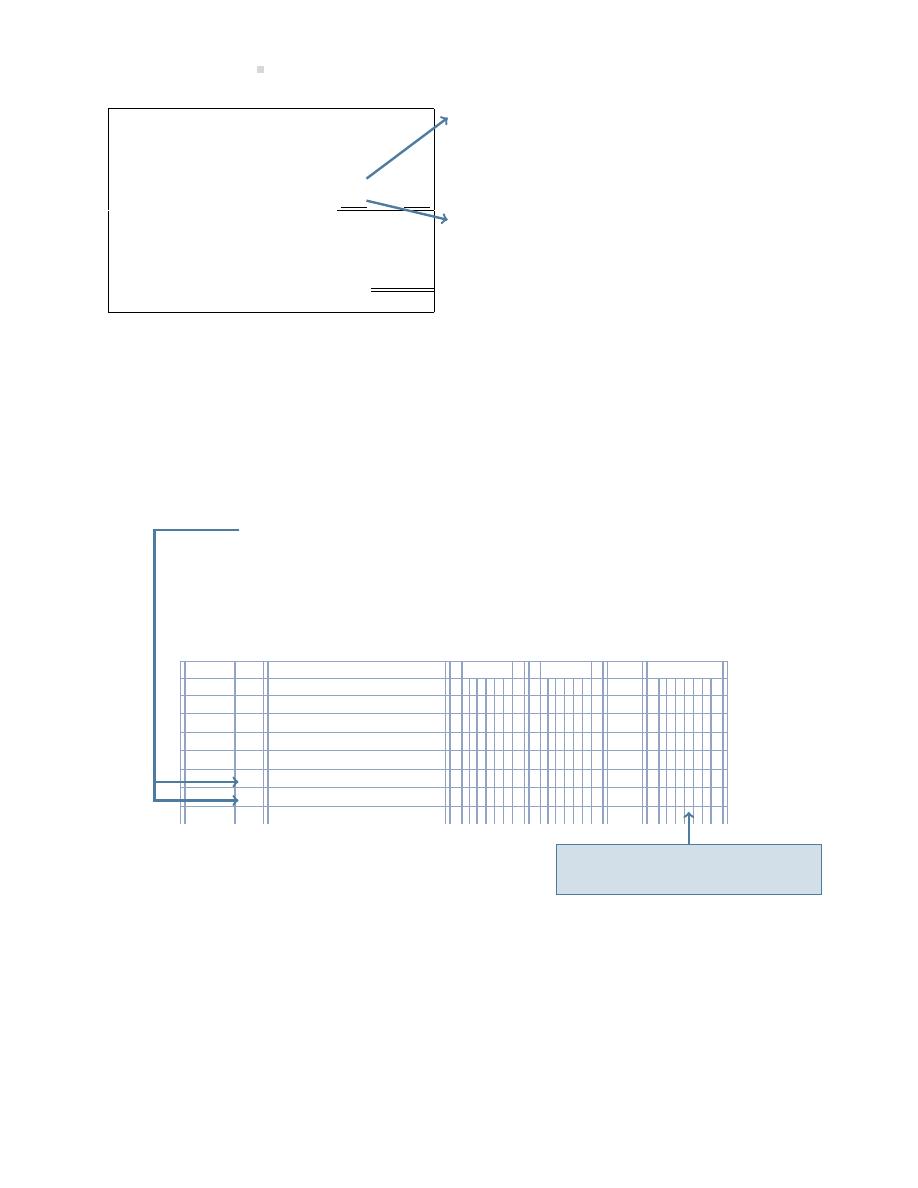
268
Cash and Receivables
Book balance at Apr. 30
$21,929
B
ank Service Charges Expense . . . . . . . . . . . . .
6
Cash. . . . . . . . . . . . . . . . . . . . . . . . . . . . . . . . . .
6
To record service charges from April 30 bank
Less: Bank charges
$ 6
reconcilia on.
NSF Cheque – J. Donne
180
186
A
ccounts Receivable – J. Donne . . . . . . . . . . . . 180
Cash. . . . . . . . . . . . . . . . . . . . . . . . . . . . . . . . . .
180
To record NSF cheque from April 30 bank reconcilia on.
Adjusted book balance at Apr. 30
$21,743
It is common prac ce to use one compound entry to record the adjustments resul ng from a bank
reconcilia on as shown below for BDCC.
Once the adjustment is posted, the Cash general ledger account is up to date, as illustrated in
Figure
Bank Service Charges Expense . . . . . . . . . . . . . . .
6
Accounts Receivable – J. Donne . . . . . . . . . . . . . .
180
Cash
. . . . . . . . . . . . . . . . . . . . . . . . . . . . . . . . . . . .
186
To record reconciling items from April 30 bank reconcilia on.
Cash
Acct. No. 101
Date
Descrip on
Debit
Credit
DR/CR
Balance
2015
Mar.
31
Balance
DR
20673 -
Apr.
30
April cash receipts
9482 -
DR
30155 -
30
April cash payments
8226 -
DR
21929 -
30
Bank charge expense
6 -
DR
21923 -
30
NSF cheque
180 -
DR
21743 -
This adjusted cash balance now
agrees with the bank reconcilia on.
Figure 7.4: Updated Cash Account in the General Ledger
Note that the balance of $21,743 in the general ledger Cash account is the same as the adjusted
book balance of $21,743 on the bank reconcilia on. Big Dog does not make any adjus ng entries
for the reconciling items on the bank side of the bank reconcilia on since these will eventually
clear the bank and appear on a later bank statement. Bank errors will be corrected by the bank.
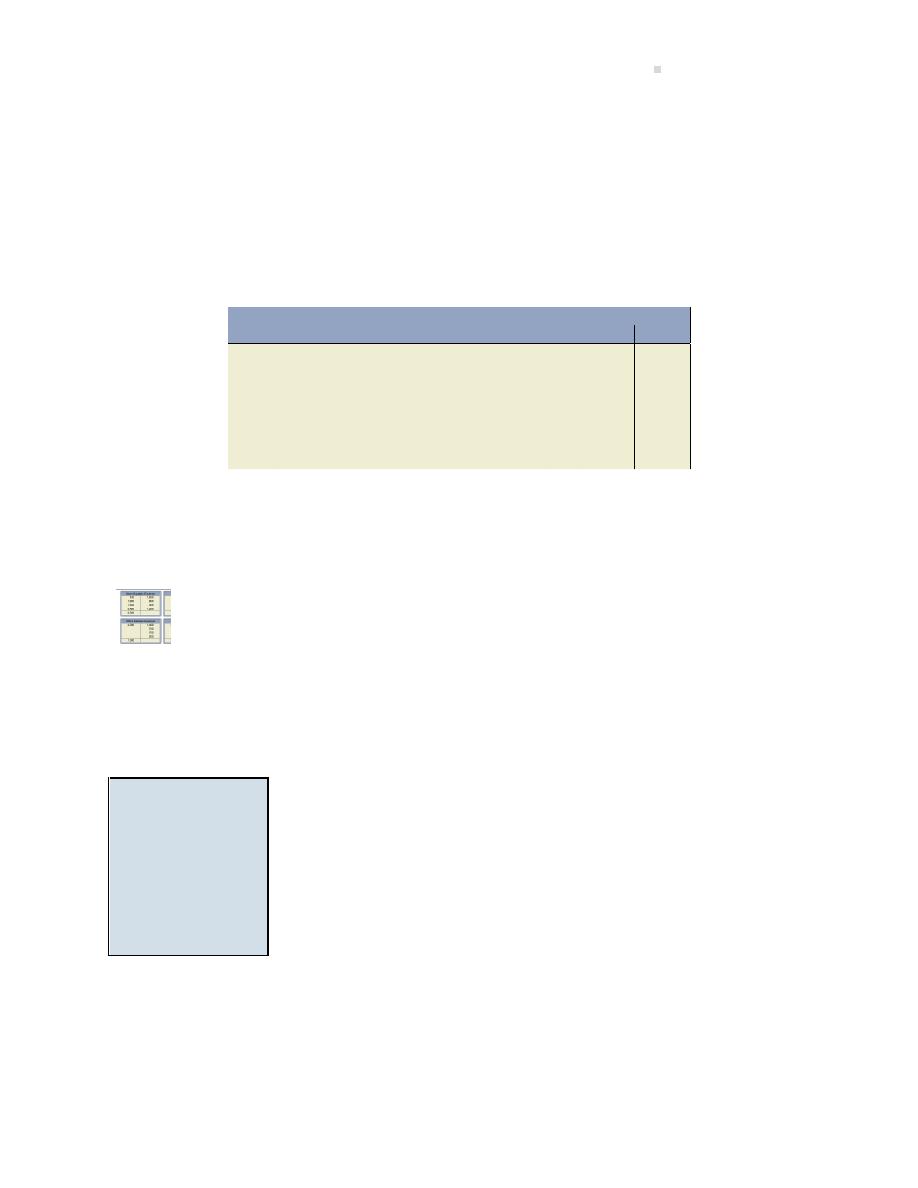
7.4. Accounts Receivable
269
Debit and Credit Card Transac ons
Debit and credit cards are commonly accepted by companies when customers make purchases.
Because the cash is efficiently and safely transferred directly into a company’s bank account by the
debit or credit card company, such transac ons enhance internal control over cash. However, the
seller is typically charged a fee for accep ng debit and credit cards. For example, assume BDCC
makes a $1,000 sale to a customer who uses a credit card that charges BDCC a fee of 2%; the cost
of the sale is $750. BDCC would record:
General Journal
Date
Account/Explana on
PR
Debit
Credit
Cash . . . . . . . . . . . . . . . . . . . . . . . . . . . . . . . . . .
980
Credit Card Expense . . . . . . . . . . . . . . . . . . . .
20
Sales . . . . . . . . . . . . . . . . . . . . . . . . . . . . . .
1,000
To record sale and related credit card fee.
Cost of Goods Sold . . . . . . . . . . . . . . . . . . . . .
750
Merchandise Inventory . . . . . . . . . . . . . .
750
To record cost of sales.
The credit card fee is calculated as the $1,000 sale
×2% = $20. This means that BDCC collects net
cash proceeds of $980 ($1,000
− $20). The use of debit cards also involves fees and these would
be journalized in the same manner.
An explora on is available on the Lyryx site. Log into your Lyryx course to run
7.4 Accounts Receivable
LO4 – Explain,
calculate,
and
record es mated
uncollec ble ac-
counts receivable
and subsequent
write-offs
and
recoveries.
Recall from Chapter
that the revenue por on of the opera ng cycle, as
copied in Figure
, begins with a sale on credit and is completed with
the collec on of cash. Unfortunately, not all receivables are collected. This
sec on discusses issues related to accounts receivable and their collec on.
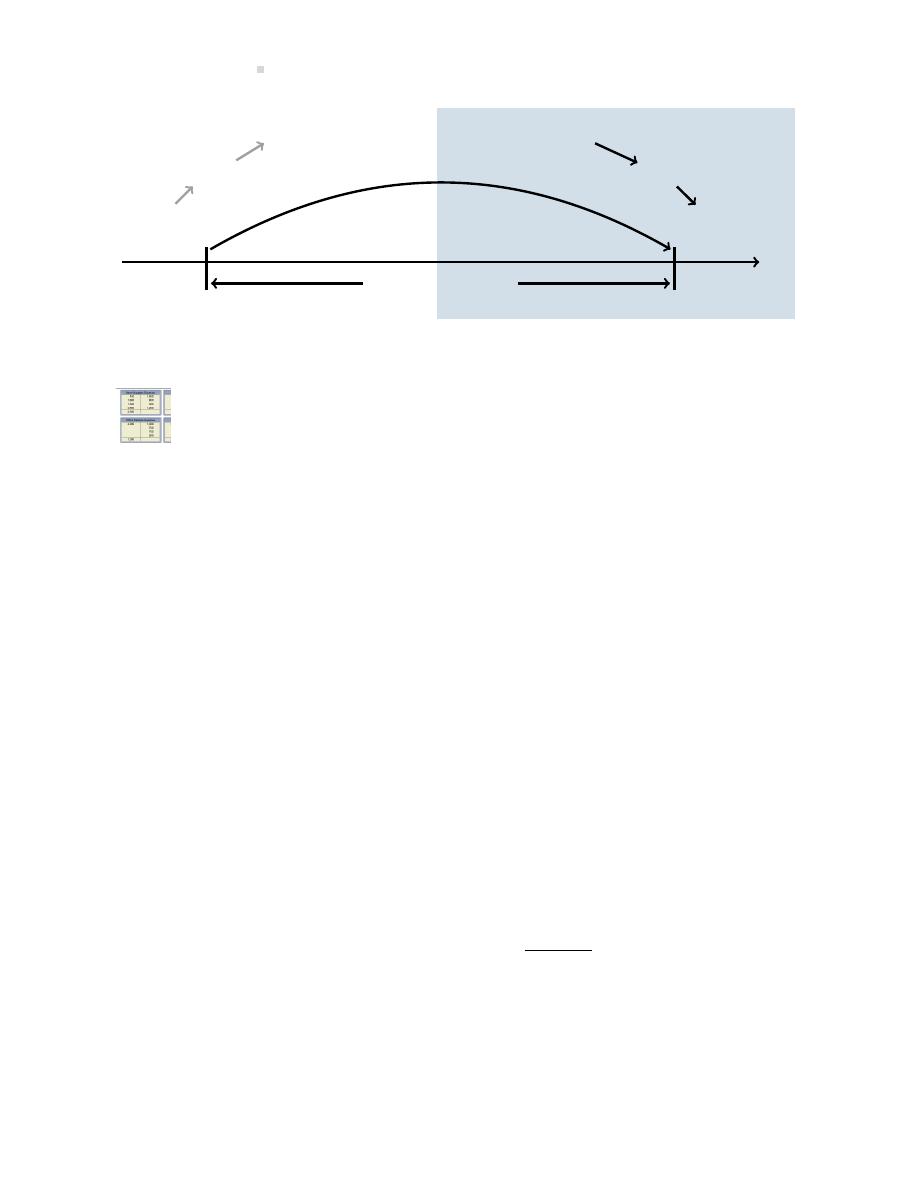
270
Cash and Receivables
Inventory is
purchased.
A liability is incurred.
Cash payment to supplier is made.
Inventory sold to customer.
Accounts receivable result.
Cash is collected
from customer
One Opera ng Cycle
Time
Figure 7.5: Revenue Por on of Opera ng Cycle
An explora on is available on the Lyryx site. Log into your Lyryx course to run
Accounts Receivable Transac ons
.
Uncollec ble Accounts Receivable
Extending credit to customers results in increased sales and therefore profits. However, there is a
risk that some accounts receivable will not be collected. A good internal control system is designed
to minimize bad debt losses. One such control is to permit sales on account only to credit-worthy
customers; this can be difficult to determine in advance. Companies with credit sales realize that
some of these amounts may never be collected. Uncollec ble accounts, commonly known as bad
debts, are an expense associated with selling on credit.
Bad debt expenses must be matched to the credit sales of the same period. For example, assume
BDCC recorded a $1,000 credit sale to XYA Company in April, 2015. Assume further that in 2016 it
was determined that the $1,000 receivable from XYA Company would never be collected. The bad
debt arising from the credit sale to XYA Company should be matched to the period in which the
sale occurred, namely, April, 2015. But how can that be done if it is not known which receivables
will become uncollec ble? A means of es ma ng and recording the amount of sales that will not
be collected in cash is needed. This is done by establishing a contra current asset account called
Allowance for Doub ul Accounts (AFDA) in the general ledger to record es mated uncollec ble
receivables. This account is a contra account to accounts receivable and is disclosed on the balance
sheet as shown below using assumed values.
Accounts receivable
$25,000
Less: Allowance for doub ul accounts
1,400
23,600
OR
Accounts receivable (net of $1,400 AFDA)
$ 23,600
The Allowance for Doub ul Accounts contra account reduces accounts receivable to the amount
that is expected to be collected — in this case, $23,600.
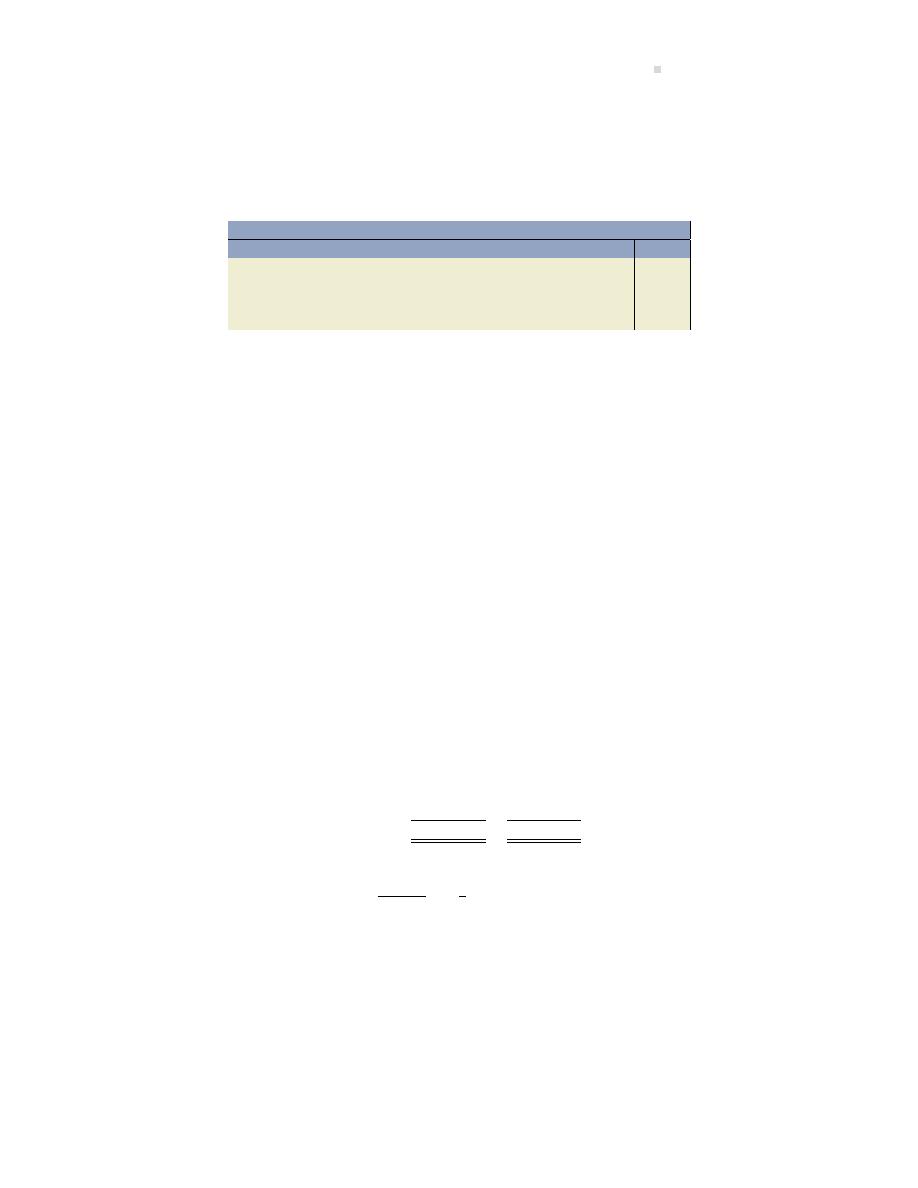
7.4. Accounts Receivable
271
Es ma ng Uncollec ble Accounts Receivable
The AFDA account is used to reflect how much of the total Accounts Receivable is es mated to be
uncollec ble. To record es mated uncollec ble accounts, the following adjus ng entry is made.
General Journal
Date
Account/Explana on
PR
Debit
Credit
Bad Debts Expense . . . . . . . . . . . . . . . . . . . . .
XXX
Allowance for Doub ul Accounts . . . . .
XXX
To record the adjustment es ma ng un-
collec ble accounts receivable.
The bad debt expense is shown on the income statement. AFDA appears on the balance sheet
and is subtracted from accounts receivable resul ng in the es mated net realizable accounts re-
ceivable.
Two different methods can be used to es mate uncollec ble accounts. One method focuses on
es ma ng Bad Debt Expense on the income statement, while the other focuses on es ma ng the
desired balance in AFDA on the balance sheet.
The Income Statement Method
The objec ve of the income statement method is to es mate bad debt expense based on credit
sales. Bad debt expense is calculated by applying an es mated loss percentage to credit sales
for the period. The percentage is typically based on actual losses experienced in prior years. For
instance, a company may have the following history of uncollected sales on account:
Amounts
Credit
Not
Year
Sales
Collected
2012
$150,000
$1,000
2013
200,000
1,200
2014
250,000
800
$600,000
$3,000
The average loss over these years is
$3,000
$600,000
, or
1
2
of 1%. If management an cipates that similar
losses can be expected in 2015 and credit sales for 2015 amount to $300,000, bad debts expense
would be es mated as $1,500 ($300,000 x 0.005). Under the income statement method, the
$1,500 represents es mated bad debt expense and is recorded as:
This es mated bad debt expense is calculated without considering any exis ng balance in the
AFDA account.
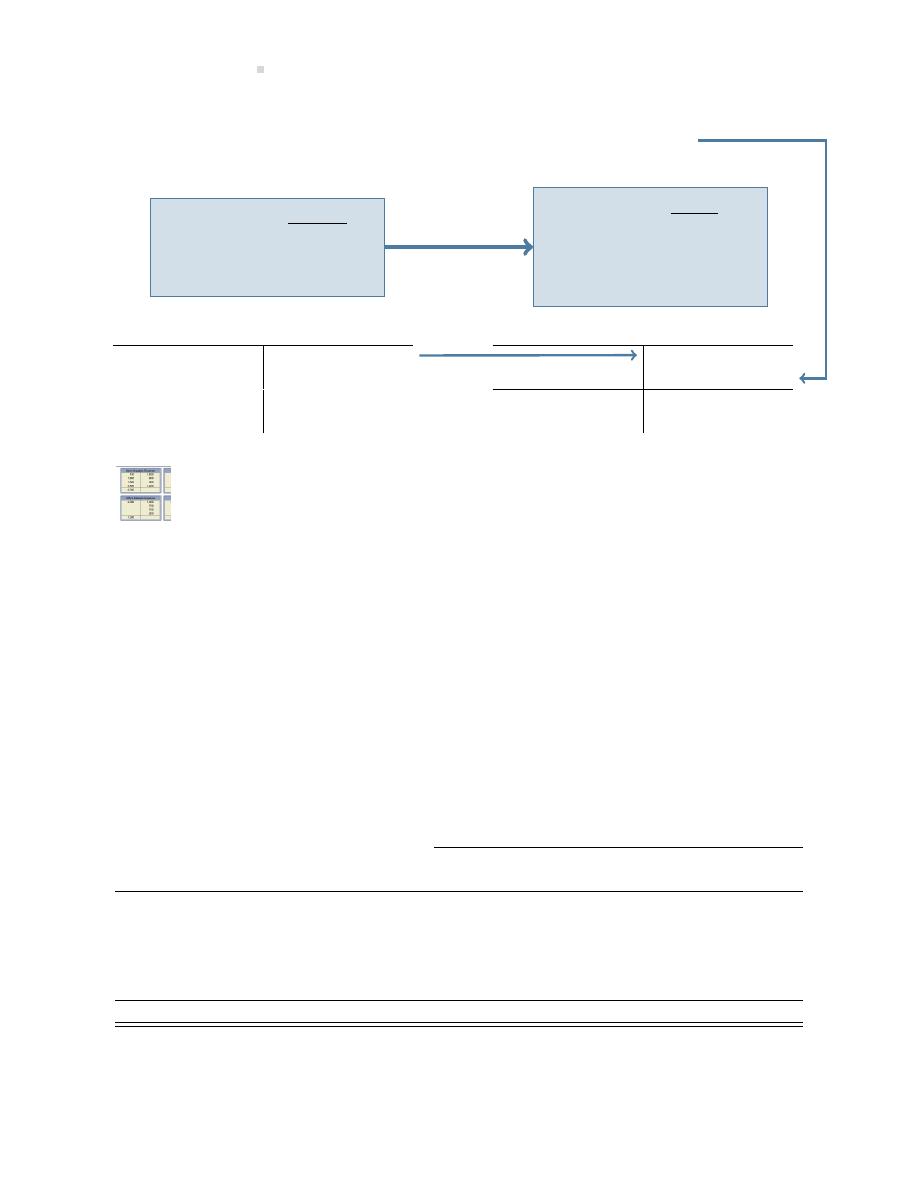
272
Cash and Receivables
Bad Debts Expense . . . . . . . . . . . . . . . . . . . . . . . . .
1,500
Allowance for Doub ul Accounts . . . . . . . . . .
1,500
To record the adjustment es ma ng bad debt expense.
Allowance for Doub ul Accounts
Allowance for Doub ul Accounts
Bal.
250
Bal.
250
Adjustment 1,500
Adjusted
!
Bal.
1,750
AFDA ACCOUNT BEFORE
POSTING ADJUSTMENT
Assume the balance re-
maining in AFDA from the
previous period is $250.
AFDA ACCOUNT AFTER
POSTING ADJUSTMENT
The adjustment es ma ng
bad debt expense of $1,500
is posted to AFDA to get an
adjusted balance of $1,750.
An explora on is available on the Lyryx site. Log into your Lyryx course to run
.
The Balance Sheet Method
Es mated uncollec ble accounts can also be calculated by using the balance sheet method where
a process called aging of accounts receivable is used. At the end of the period, the total of es-
mated uncollec ble accounts is calculated by analyzing accounts receivable according to how
long each account has been outstanding. An aging analysis approach assumes that the longer a
receivable is outstanding, the less chance there is of collec ng it. This process is illustrated in the
following schedule.
Aging of Accounts Receivable
December 31, 2015
Number of Days Past Due
Not Yet
Customer
Total
Due
1–30
31–60
61–90
91–120 Over 120
Bendix Inc.
$ 1,000
$ 1,000
Devco Marke ng Inc.
6,000
$ 1,000
$3,000
$2,000
Horngren Corp
4,000
2,000
1,000
$ 1,000
Perry Co. Ltd.
5,000
3,000
1,000
1,000
Others
9,000
4,000
5,000
Totals
$25,000 $
0
$10,000
$5,000
$2,000
$ 7,000
$ 1,000
In this example, accounts receivable total $25,000 at the end of the period. These are classified
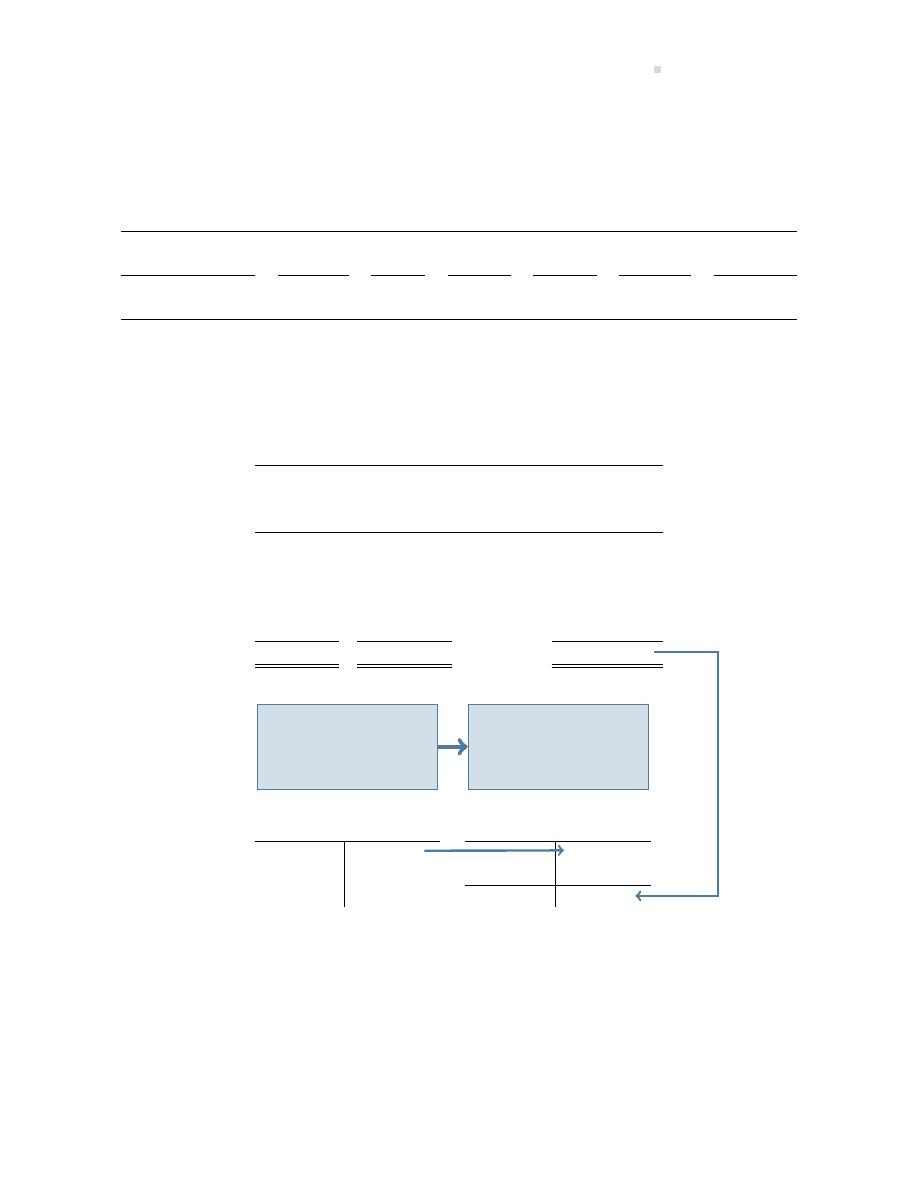
7.4. Accounts Receivable
273
into six me periods: those receivables that are not yet due; 1–30 days past due; 31–60 days past
due; 61–90 days past due; 91–120 days past due; and over 120 days past due.
Based on past experience, assume management es mates a bad debt percentage, or rate of un-
collec bility, for each me period as follows:
Number of Days
Not Yet
Outstanding
Due
1–30
31–60
61–90
91–120
Over 120
Rate of
Uncollec bility
0.5%
1%
3%
5%
10%
40%
The calcula on of expected uncollec ble accounts receivable at December 31, 2015 would be as
follows:
Calcula on of Uncollec ble Amounts
December 31, 2015
Es mated
Es mated
Age
Accounts
Bad Debt
Uncollec ble
(days)
Receivable Percentage
Amount
1–30
$10,000
1%
$ 100
31–60
5,000
3%
150
61–90
2,000
5%
100
91–120
7,000
10%
700
Over 120
1,000
40%
400
Totals
$25,000
$1,450
Allowance for Doub ul
Allowance for Doub ul
Accounts
Accounts
Bal. 250
Bal. 250
Bal. 1,450
The balance remain-
ing in the account is
$250 from the previ-
ous period.
The total es mated
uncollec ble receiv-
ables is $1,450.
A total of $1,450 of accounts receivable is es mated to be uncollec ble at December 31, 2015.
Under the balance sheet method, the es mated bad debt expense consists of the difference be-
tween the opening AFDA balance ($250, as in the prior example) and the es mated uncollec ble
receivables ($1,450) required at year-end.
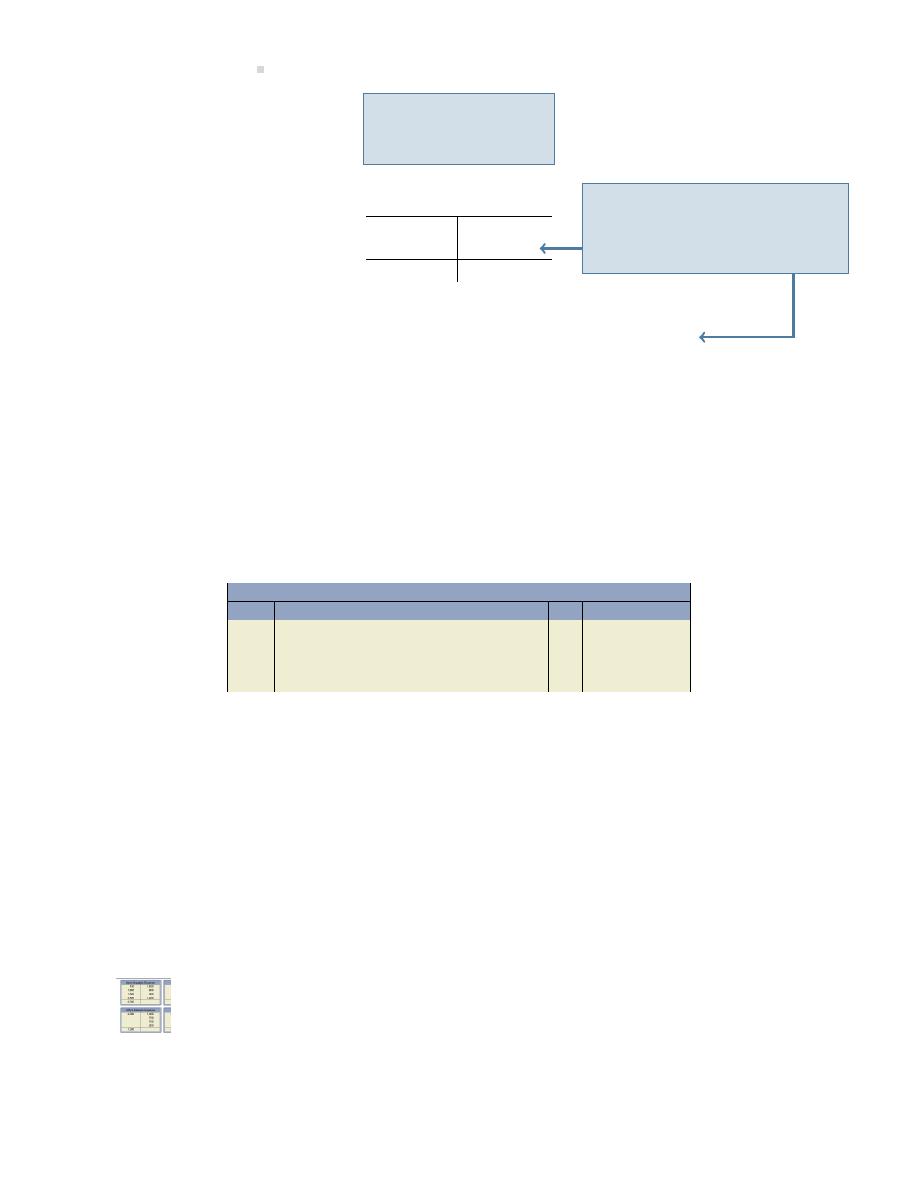
274
Cash and Receivables
Allowance for Doub ul
Accounts
Bal.
250
1,200
Bal. 1,450
The adjustment is recorded by the following journal entry:
Bad Debts Expense . . . . . . . . . . . . . . .
1,200
Allowance for Doub ul Accounts
1,200
To record the adjustment es ma ng bad debt expense.
$1,200 must be
recorded to bring the
account to $1,450.
$1,200 is the difference be-
tween the $250 unadjusted bal-
ance and the required $1,450
closing balance.
As an alterna ve to using an aging analysis to es mate uncollec ble accounts, a simplified balance
sheet method can be used. The simplified balance sheet method calculates the total es mated
uncollec ble accounts as a percentage of the outstanding accounts receivables balance. For ex-
ample, assume an unadjusted balance in AFDA of $250 as in the preceding example. Also assume
the accounts receivable balance at the end of the period was $25,000 as in the previous illustra-
on. If it was es mated that 6% of these would be uncollec ble based on historical data, the
adjustment would be:
General Journal
Date
Account/Explana on
PR
Debit
Credit
Bad Debts Expense . . . . . . . . . . . . . . . . . . . . .
1,250
Allowance for Doub ul Accounts . . . . .
1,250
To record the adjustment es ma ng bad
debt expense.
The total es mated uncollec ble accounts was $1,500 ($25,000
× 0.06). Given an unadjusted
balance in AFDA of $250, the adjustment to AFDA must be a credit of $1,250 ($1,500 – $250).
Regardless of whether the income statement method or balance sheet method is used, the amount
es mated as an allowance for doub ul accounts seldom agrees with the amounts that actually
prove uncollec ble. A credit balance remains in the allowance account if fewer bad debts occur
during the year than are es mated. There is a debit balance in the allowance account if more
bad debts occur during the year than are es mated. By monitoring the balance in the Allowance
for Doub ul Accounts general ledger account at each year-end, though, management can deter-
mine whether the es mates of uncollec ble amounts are accurate. If not, they can adjust these
es mates going forward.
An explora on is available on the Lyryx site. Log into your Lyryx course to run
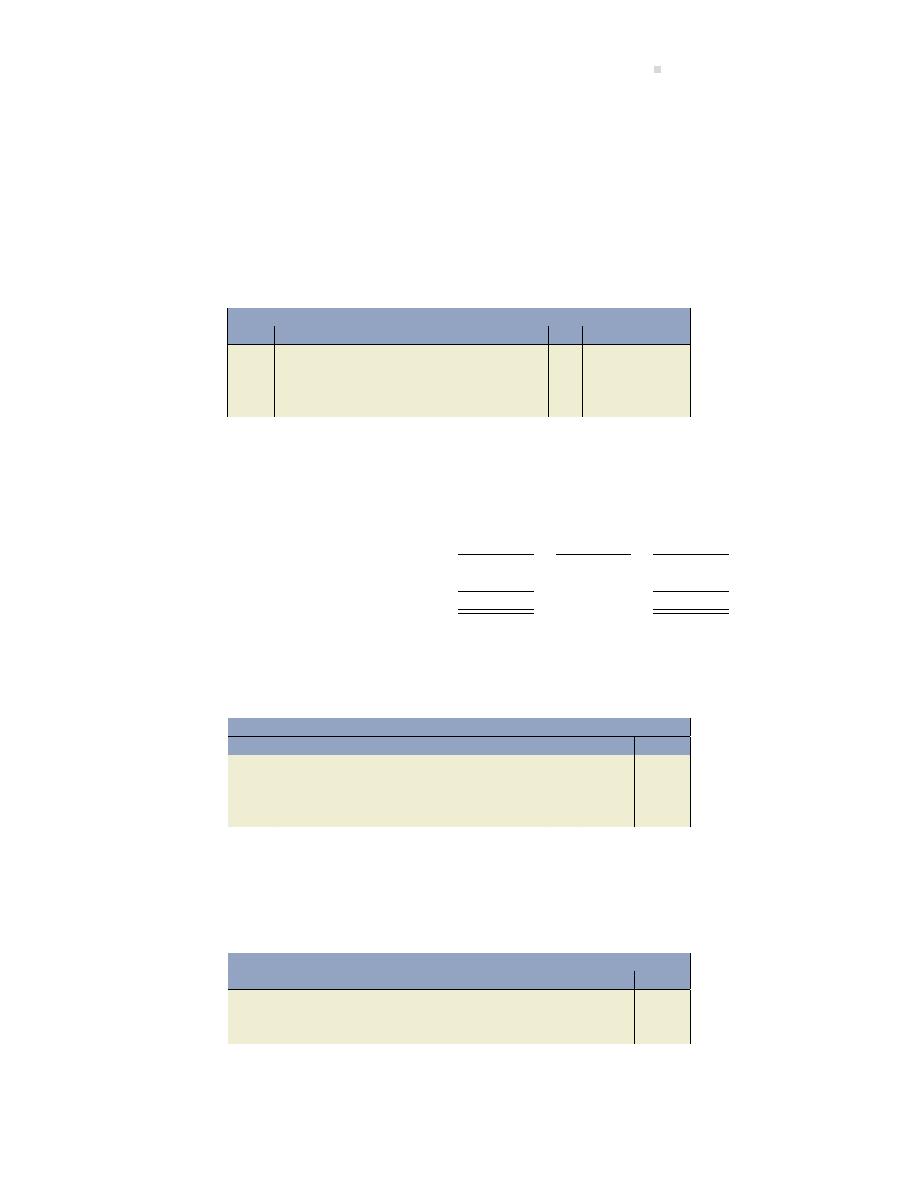
7.4. Accounts Receivable
275
Wri ng Off Accounts Receivable
When recording the adjus ng entry to es mate uncollec ble accounts receivable at the end of
the period, it is not known which specific receivables will become uncollec ble. When an account
is determined to be uncollec ble, it must be removed from the accounts receivable account. This
process is known as a write-off. To demonstrate the write-off of an account receivable, assume
that on January 15, 2016 the $1,000 credit account for customer Bendix Inc. is iden fied as un-
collec ble because of the company’s bankruptcy. The receivable is removed by:
General Journal
Date
Account/Explana on
PR
Debit
Credit
AFDA . . . . . . . . . . . . . . . . . . . . . . . . . . . . . . . . .
1,000
Accounts Receivable – Bendix Inc. . . . .
1,000
To record write-off of Bendix Inc.’s account
receivable.
The $1,000 write-off reduces both the accounts receivable and AFDA accounts. The write-off does
not affect net realizable accounts receivable as demonstrated below.
Before
A er
Write-Off
Write-Off
Write-Off
Accounts receivable
$25,000
Cr 1,000
$24,000
Less: Allowance for doub ul accounts
1,450
Dr 1,000
450
Net accounts receivable
$23,550
$23,550
Addi onally, a write-off does not affect bad debt expense. This can be a challenge to understand.
To help clarify, recall that the adjus ng entry to es mate uncollec bles was:
General Journal
Date
Account/Explana on
PR
Debit
Credit
Bad Debts Expense . . . . . . . . . . . . . . . . . . . . .
XXX
AFDA . . . . . . . . . . . . . . . . . . . . . . . . . . . . . .
XXX
To record the adjustment es ma ng bad
debt expense.
This adjustment was recorded because GAAP requires that the bad debt expense be matched to
the period in which the sales occurred even though it is not known which receivables will become
uncollec ble. Later, when an uncollec ble receivable is iden fied, it is wri en off as:
General Journal
Date
Account/Explana on
PR
Debit
Credit
AFDA . . . . . . . . . . . . . . . . . . . . . . . . . . . . . . . . .
XXX
Accounts Receivable . . . . . . . . . . . . . . . .
XXX
To record write-off of account receivable.
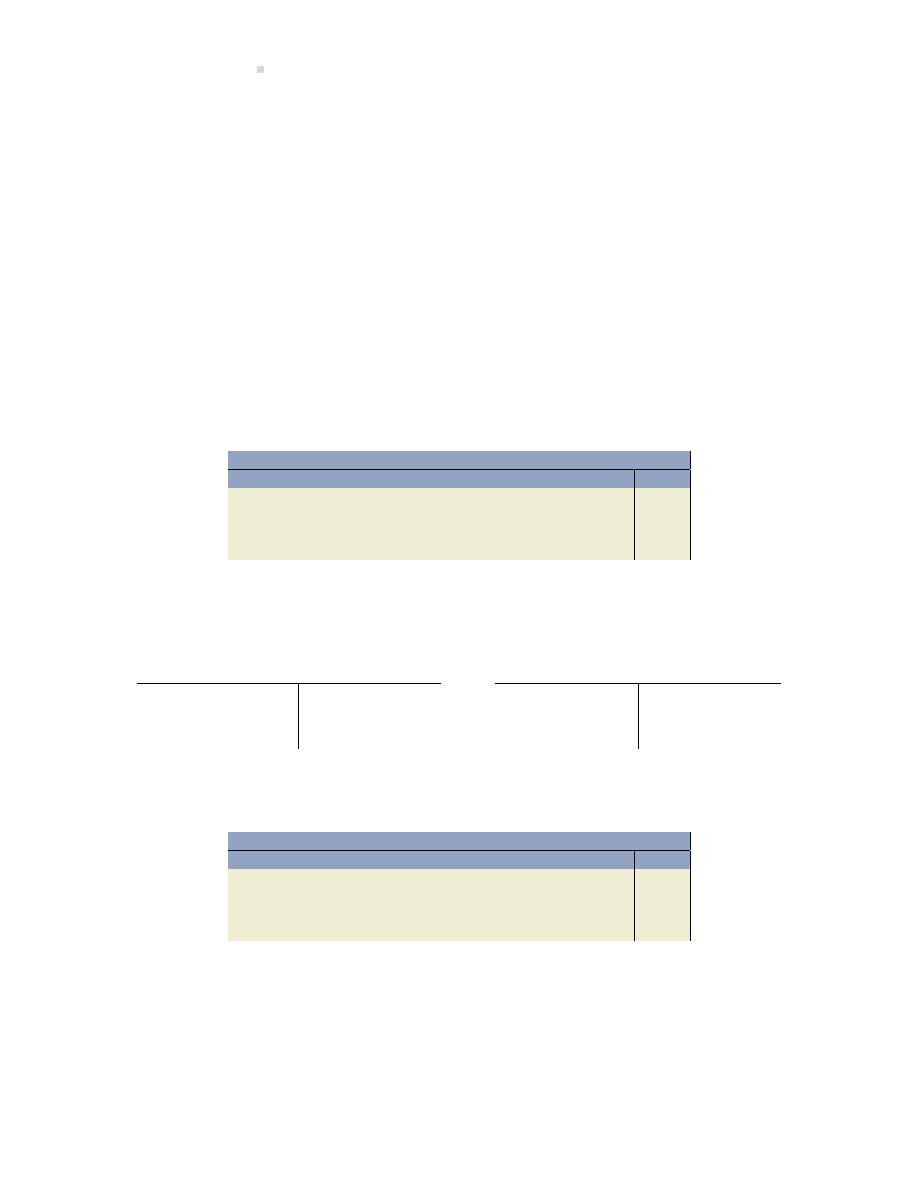
276
Cash and Receivables
No ce that the AFDA entries cancel each other out so that the net effect is a debit to bad debt
expense and a credit to accounts receivable. The use of the AFDA contra account allows us to
es mate uncollec ble accounts in one period and record the write-off of bad receivables as they
become known in a later period.
Recovery of a Write-Off
When Bendix Inc. went bankrupt, its debt to Big Dog Carworks Corp. was wri en off in an cipa on
that there would be no recovery of the amount owed. Assume that later, an announcement was
made that 25% of amounts owed by Bendix would be paid. This new informa on indicates that
BDCC will be able to recover a por on of the receivable previously wri en off. A recovery requires
two journal entries. The first entry reinstates the amount expected to be collected by BDCC—$250
($1,000
× 25%) in this case and is recorded as:
General Journal
Date
Account/Explana on
PR
Debit
Credit
Accounts Receivable – Bendix Inc. . . . . . . .
250
AFDA . . . . . . . . . . . . . . . . . . . . . . . . . . . . . .
250
To reverse write-off and reinstate col-
lec ble por on of account.
This entry reverses the collec ble part of the receivable previously wri en off. The effect of the
reversal is shown below.
Accounts Receivable
Allowance for Doub ul Accounts
Bal.
$25,000
Bal.
1,450
Write-off 1,000
Write-off 1,000
Recovery
250
Recovery
250
The second entry records the collec on of the reinstated amount as:
General Journal
Date
Account/Explana on
PR
Debit
Credit
Cash . . . . . . . . . . . . . . . . . . . . . . . . . . . . . . . . . .
250
Accounts Receivable – Bendix Inc. . . . .
250
To record recovery of collec ble por on
of account previously wri en off.
The various journal entries related to accounts receivable are summarized below.
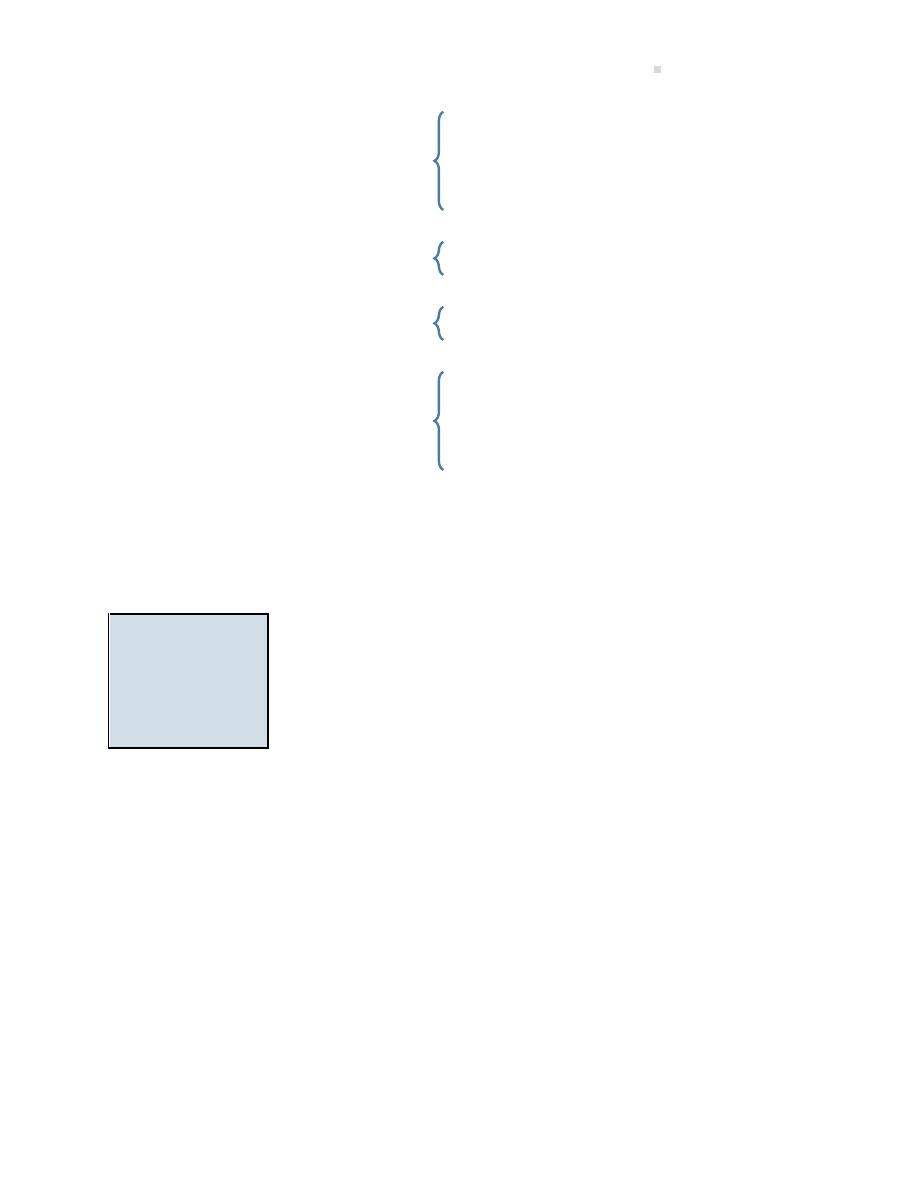
7.5. Short-Term Notes Receivable
277
A
ccounts Receivable . . . . . . . . . . . . .
XXX
Sales . . . . . . . . . . . . . . . . . . . . . . . .
XXX
COGS . . . . . . . . . . . . . . . . . . . . . . . . . . .
XXX
M
erchandise Inventory . . . . . . . .
XXX
B
ad Debts Expense . . . . . . . . . . . . . .
XXX
A
FDA . . . . . . . . . . . . . . . . . . . . . . . .
XXX
A
FDA . . . . . . . . . . . . . . . . . . . . . . . . . . .
XXX
A
ccounts Receivable . . . . . . . . . .
XXX
A
ccounts Receivable . . . . . . . . . . . . .
XXX
AFDA . . . . . . . . . . . . . . . . . . . . . . . .
XXX
Cash . . . . . . . . . . . . . . . . . . . . . . . . . . .
XXX
A
ccounts Receivable . . . . . . . . . .
XXX
Sale on account.
Adjus ng entry es ma ng uncollec ble accounts.
Write-off of uncollec ble account.
Recovery of account previously wri en off.
7.5 Short-Term Notes Receivable
LO5
–
Explain
and
record
a
short-term notes
receivable
as
well as calculate
related interest.
Short-term notes receivable are current assets, since they are due within
the greater of 12 months or the business’s opera ng cycle. A note receiv-
able is a promissory note. A promissory note is a signed document where
the debtor, the person who owes the money, promises to pay the creditor
the principal and interest on the due date. The principal is the amount
owed. The creditor, or payee, is the en ty owed the principal and inter-
est. Interest is the fee for using the principal and is calculated as: Principal
× Annual Interest Rate × Time. The me or term of the note is the period
from the date of the note to the due date. The due date, also known as
the maturity date, is the date on which the principal and interest must be
paid. The date of the note is the date the note begins accruing interest.
Short-term notes receivable can arise at the me of sale or when a customer’s account receiv-
able becomes overdue. To demonstrate the conversion of a customer’s account to a short-term
receivable, assume that BDCC’s customer Bendix Inc. is unable to pay its $5,000 account within
the normal 30-day period. The receivable is converted to a 5%, 60-day note dated December 5,
2015 with the following entry:
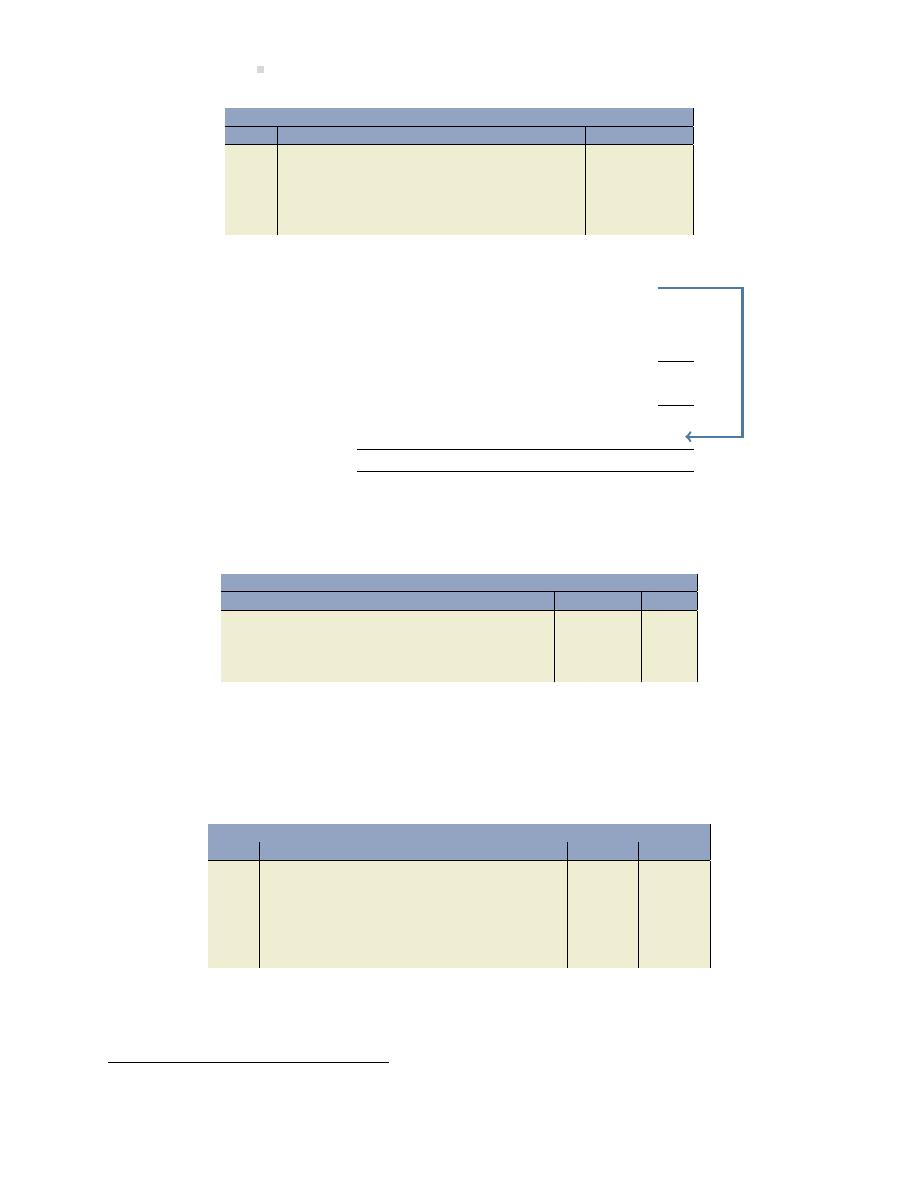
278
Cash and Receivables
General Journal
Date
Account/Explana on
PR
Debit
Credit
Dec 5
Notes Receivable - Bendix. . . . . . . . . . . . . . .
5,000
Accounts Receivable - Bendix . . . . . . . .
5,000
To record the conversion of a customer’s
account to a 5%, 60-day note dated De-
cember 5, 2015.
The note is due on February 3, 2016 calculated as:
Days in December
31
Less: December 5 date of the note
5
Subtotal number of days
26
Add: Days in January
31
Subtotal number of days
57
Add: Days in February to total 60 days
3
Total term of the note in days
60
Assuming a December 31, year-end for BDCC, the adjus ng entry to accrue interest on December
31 would be:
General Journal
Date
Account/Explana on
PR
Debit
Credit
Dec 31
Interest Receivable . . . . . . . . . . . . . . . . . . . . .
17.81
Interest Revenue . . . . . . . . . . . . . . . . . . .
17.81
To record the accrual of interest from De-
cember 5 to December 31.
The interest of $17.81 was calculated as: $5,000
× 5% × 26/365
= $17.80822 rounded to $17.81.
All interest calcula ons in this textbook are rounded to two decimal places.
At maturity, February 3, 2016, BDCC collects the note plus interest and records:
General Journal
Date
Account/Explana on
PR
Debit
Credit
Feb 3
Cash . . . . . . . . . . . . . . . . . . . . . . . . . . . . . . . . . .
5,041.10
Note Receivable - Bendix . . . . . . . . . . . .
5,000.00
Interest Receivable . . . . . . . . . . . . . . . . . .
17.81
Interest Revenue . . . . . . . . . . . . . . . . . . .
23.29
To record the collec on of the principal
and interest.
The total interest realized on the note was $41.10 ($5,000
× 5% × 60/365 = $41.0959 rounded
to $41.10). Part of the $41.10 total interest revenue was realized in 2015 ($17.81) and the rest in
2
When calcula ng interest based on days, use 365 days per year.
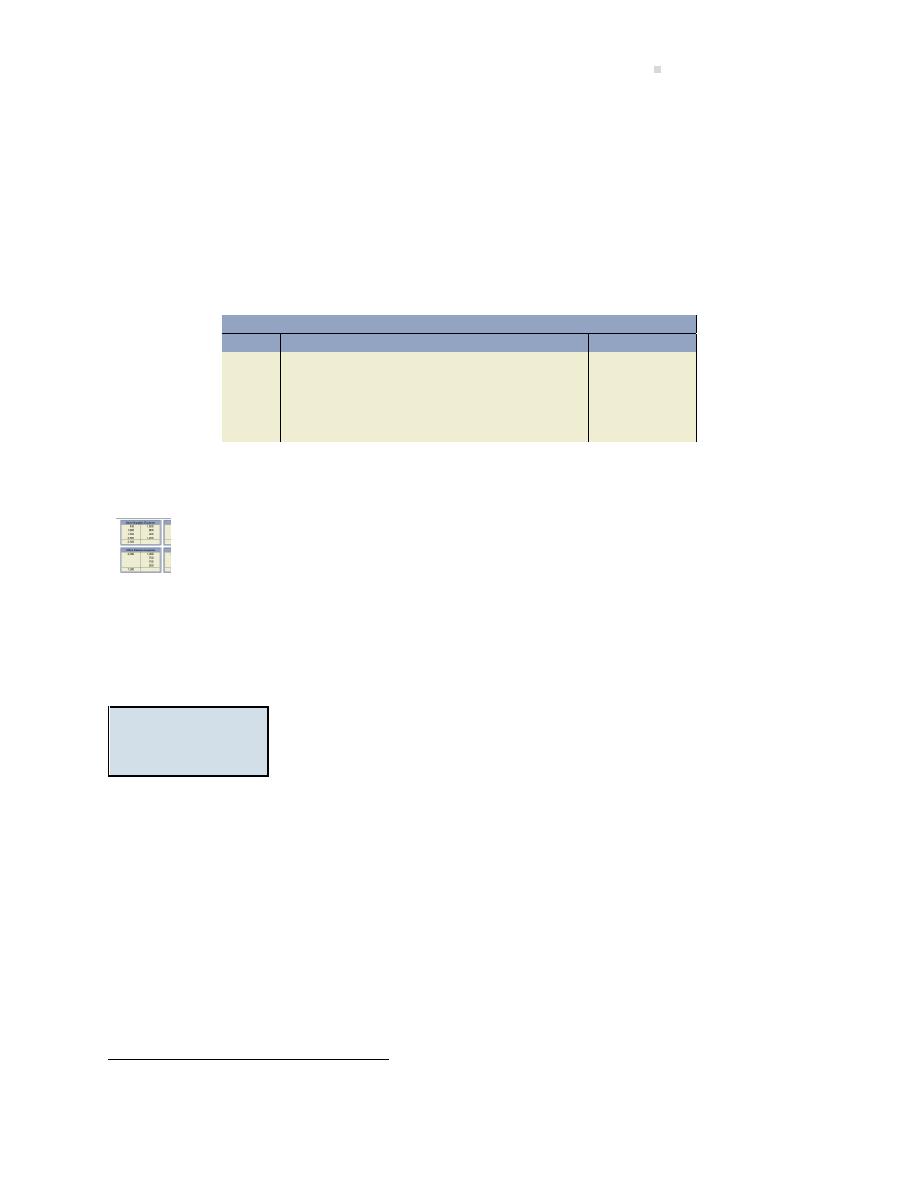
7.6. Appendix A: Ra o Analysis—Acid Test
279
2016 ($41.10 - $17.81 = $23.29). Therefore, care must be taken to correctly allocate the interest
between periods. The total cash received by BDCC on February 3 was the sum of the principal and
interest: $5,000.00 + $41.10 = $5,041.10.
When the term of a note is expressed in months, the calcula ons are less complex. For example,
assume that BDCC sold customer Woodlow a $4,000 service on August 1, 2015. On that date,
the customer signed a 4%, 3-month note. The term of the note is based on months and not days
therefore the maturity date is October 31, 2015. BDCC would record the collec on on October 31
as:
General Journal
Date
Account/Explana on
PR
Debit
Credit
Oct 31
Cash . . . . . . . . . . . . . . . . . . . . . . . . . . . . . . . . . .
4,040
Note Receivable - Woodlow . . . . . . . . . .
4,000
Interest Revenue . . . . . . . . . . . . . . . . . . .
40
To record the collec on of the principal
and interest.
The total interest realized on the note was $40 ($4,000
× 4% × 3/12
= $40.00)
An explora on is available on the Lyryx site. Log into your Lyryx course to run
7.6 Appendix A: Ra o Analysis—Acid Test
LO6
–
Explain
and calculate the
acid-test ra o.
The acid-test ra o, also known as the quick ra o, is a liquidity ra o that is a
strict measure of a business’s availability of cash to pay current liabili es as
they come due. It is considered a strict measure because it includes only
quick current assets. Quick current assets are those current assets that
are one step away from becoming cash. For example, accounts receivable
are a quick current asset because collec on of receivables results in cash.
However, inventory is not a quick current asset because it is two steps
from cash — it has to be sold which creates an account receivable and
the receivable then has to be collected. Prepaids are not a quick current
asset because the intent in holding prepaids is not to convert them into
cash but, instead, to use them (e.g., prepaid insurance becomes insurance
expense as it is used). Quick current assets include only cash, short-term
investments, and receivables.
The acid-test ra o is calculated as:
Quick current assets
÷ Current liabili es
3
When calcula ng interest based on months, use 12 months per year.
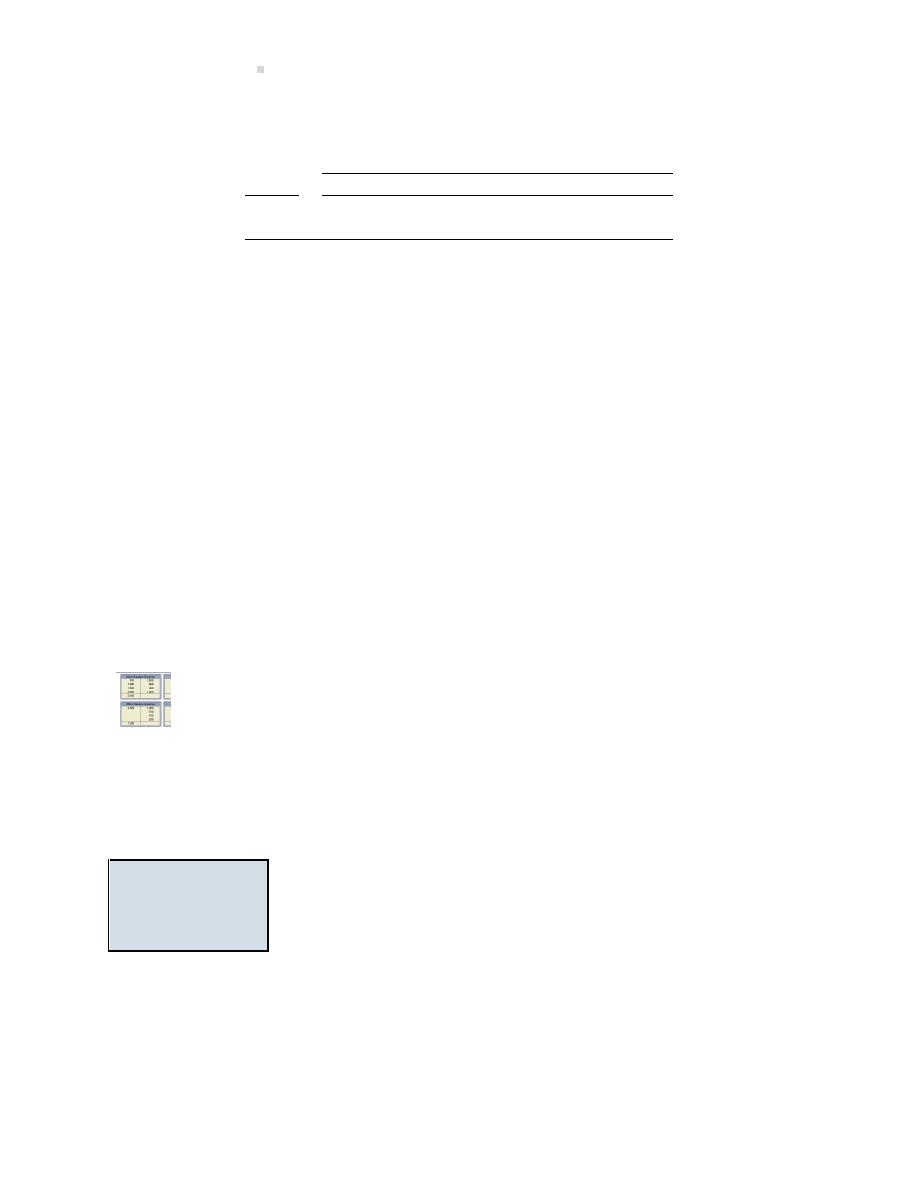
280
Cash and Receivables
The acid-test ra os for three companies opera ng in a similar industry are shown below:
Acid-Test Ra os
Year
Company A
Company B
Company C
2014
0.56
1.3
8.6
2015
0.72
1.2
8.7
In 2014, Company A’s acid-test ra o shows that it has only $0.56 to cover each $1.00 of current
liabili es as they come due. Company A therefore has a liquidity issue. Although Company A’s acid-
test ra o is s ll unfavourable in 2015, the change is favourable because the liquidity improved. So
a company can have an unfavourable acid-test ra o but show a favourable change.
Company B’s 2014 acid-test shows that it has favourable liquidity: $1.30 to cover each $1.00 of
current liabili es as they come due. However, the change from 2014 to 2015 shows a decrease
in the acid-test ra o which is unfavourable although Company B’s acid-test s ll shows favourable
liquidity. So a company can have a favourable acid-test ra o but an unfavourable change.
Company C’s 2014 acid-test ra o indicates that it has favourable liquidity: $8.60 to cover each
$1.00 of current liabili es as they come due. However, this is actually unfavourable because a
company can have an acid-test ra o that is too high. If the acid-test ra o is too high, it is a reflec on
that the company has idle assets. Idle assets do not typically generate the most op mum levels of
revenue. Remember that the purpose of holding assets is to generate revenue. In 2015, Company
C’s acid-test ra o increased a bit and it is s ll excessive which is unfavourable. So the change was
favourable but because the ra o is too high, it reflects an unfavourable liquidity posi on, though
for different reasons than Company A.
An explora on is available on the Lyryx site. Log into your Lyryx course to run
Using the Informa on - Acid-Test Ra o
.
7.7 Appendix B: Ra o Analysis—Accounts Receivable Turnover
LO7 – Explain and
calculate the ac-
counts receivable
turnover.
The accounts receivable turnover not only measures the liquidity of re-
ceivables but also the efficiency of collec on, referred to as turnover (i.e.,
accounts receivable turnover into cash). A low turnover indicates high lev-
els of accounts receivable which has an unfavourable impact on liquidity
since cash is ed up in receivables. A low turnover means management
might need to review credit gran ng policies and/or strengthen collec on
efforts.
The accounts receivable turnover is calculated as:
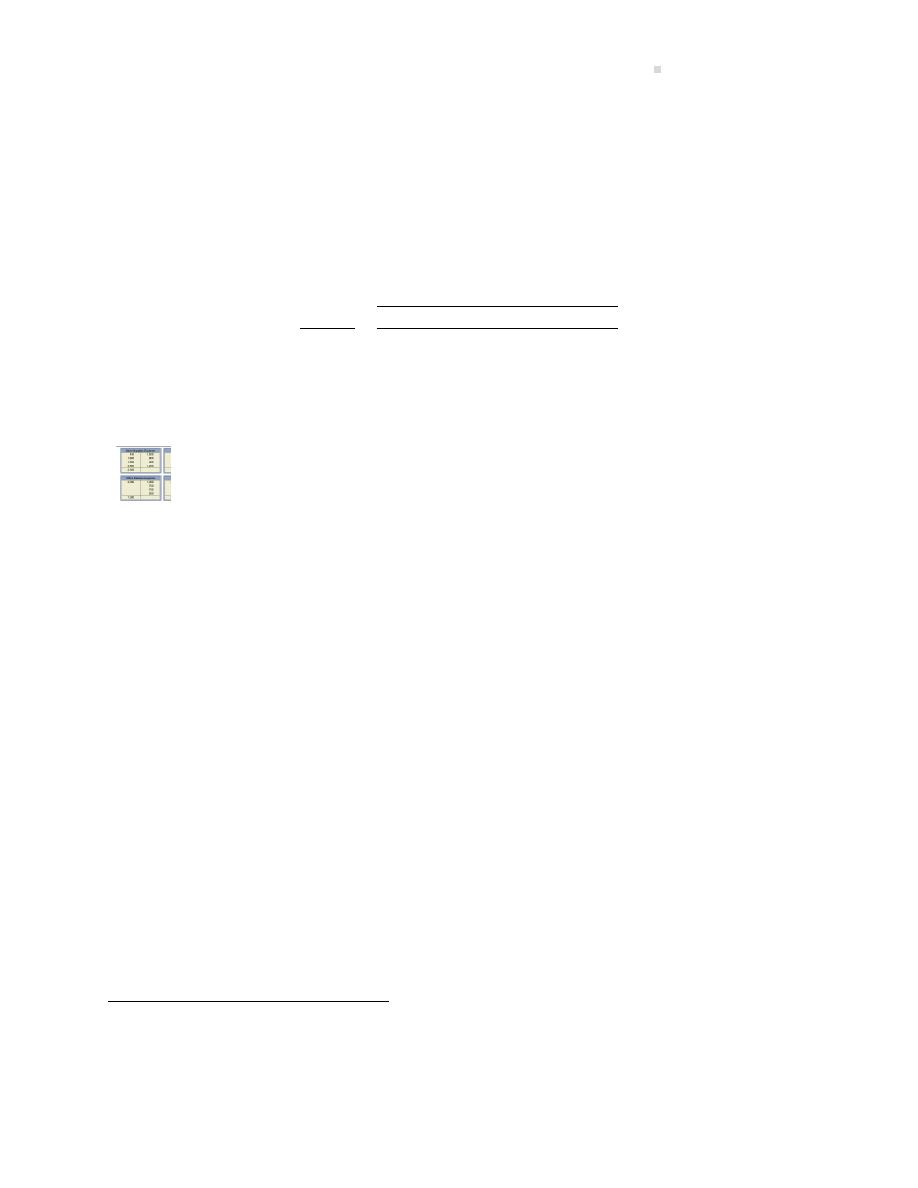
Summary of Chapter
Learning Objec ves
281
Net credit sales (or revenues)
÷ Average net accounts receivable
Average accounts receivable is calculated by taking the beginning of the period balance plus the
end of the period balance and dividing the sum by two.
The accounts receivable turnover ra os for two companies opera ng in a similar industry are
shown below:
Accounts Receivable Turnover
Year
Company A
Company B
2015
5.8
6.9
Company B is more efficient at collec ng receivables than is Company A. The higher the ra o, the
more favourable.
An explora on is available on the Lyryx site. Log into your Lyryx course to run
Accounts Receivable Turnover Ra o
.
Summary of Chapter 7 Learning Objec ves
LO1 – Define internal control and explain how it is applied to cash.
The purpose of internal controls is to safeguard the assets of a business. Since cash is a par cularly
vulnerable asset, policies and procedures specific to cash need to be implemented, such as the
use of cheques and electronic funds transfer for payments, daily cash deposits into a financial
ins tu on, and the prepara on of bank reconcilia ons.
LO2 – Explain and journalize pe y cash transac ons.
A pe y cash fund is used to pay small, irregular amounts for which issuing a cheque would be
inefficient. A pe y cash custodian administers the fund by obtaining a cheque from the cash
payments clerk. The cheque is cashed and the coin and currency placed in a locked box. The pe y
cash custodian collects receipts and reimburses individuals for the related amounts. When the
pe y cash fund is replenished, the receipts are compiled and submi ed for entry in the accoun ng
records so that a replacement cheque can be issued and cashed.
4
Short-term notes receivable from customers would be included in this amount.

282
Cash and Receivables
LO3 – Explain the purpose of and prepare a bank reconcilia on, and record re-
lated adjustments.
A bank reconcilia on is a form of internal control that reconciles the bank statement balance
to the general ledger cash account, also known as the book balance. Reconciling items that af-
fect the bank statement balance are outstanding deposits, outstanding cheques, and bank errors.
Reconciling items that affect the book balance are collec ons made by the bank on behalf of the
company, NSF cheques, bank service charges, and errors. Once the book and bank statement bal-
ances are reconciled, an adjus ng entry is prepared based on the reconciling items affec ng the
book balance.
LO4 – Explain, calculate, and record es mated uncollec ble accounts receivable
and subsequent write-offs and recoveries.
Not all accounts receivable are collected, resul ng in uncollec ble accounts. Because it is not
known which receivables will become uncollec ble, the allowance approach is used to match the
cost of es mated uncollec ble accounts to the period in which the related revenue was gener-
ated. The adjus ng entry to record es mated uncollec bles is a debit to Bad Debt Expense and
a credit to Allowance for Doub ul Accounts (AFDA). The income statement method and the bal-
ance sheet method are two ways to es mate and apply the allowance approach. The income
statement method calculates bad debt expense based on a percentage of credit sales while the
balance sheet method calculates total es mated uncollec ble accounts (aka the balance in AFDA)
using an aging analysis. When receivables are iden fied as being uncollec ble, they are wri en
off. If write-offs subsequently become collec ble, a recovery is recorded using two entries: by
reversing the write-off (or the por on that is recoverable) and then journalizing the collec on.
LO5 – Explain and record a short-term notes receivable as well as calculate re-
lated interest.
A short-term notes receivable is a promissory note that bears an interest rate calculated over the
term of the note. Short-term notes receivable are current assets that mature within 12 months
from the date of issue or within a business’s opera ng cycle, whichever is longer. Notes can be
issued to a customer at the me of sale, or a note receivable can replace an overdue receivable.
LO6 – Explain and calculate the acid-test ra o.
The acid-test ra o is a strict measure of liquidity. It is calculated as quick current assets divided by
current liabili es. Quick assets include cash, short-term investments, and accounts receivable.

Discussion Ques ons
283
LO7 – Explain and calculate the accounts receivable turnover.
The accounts receivable turnover is a measure of liquidity and demonstrates how efficiently re-
ceivables are being collected. It is calculated as net sales divided by average accounts receivable.
Average accounts receivable are the sum of the beginning accounts receivable, including short-
term notes receivable from customers, plus ending receivables, divided by two.
Discussion Ques ons
1. What is internal control?
2. How does the prepara on of a bank reconcilia on strengthen the internal control of cash?
3. What are some reconciling items that appear in a bank reconcilia on?
4. What are the steps in preparing a bank reconcilia on?
5. What is an NSF cheque?
6. What is a pe y cash system?
7. What is the difference between establishing and replenishing the pe y cash fund?
8. How does use of allowance for doub ul accounts match expenses with revenue?
9. How does the income statement method calculate the es mated amount of uncollec ble
accounts?
10. What is an ageing schedule for bad debts, and how is it used in calcula ng the es mated
amount of uncollec ble accounts?
11. How are credit balances in accounts receivable reported on the financial statements?
Exercises
EXERCISE 7–1
(LO2)
The following transac ons were made by Landers Corp. in March 2017.

284
Cash and Receivables
Mar. 1
Established a pe y cash fund of $200
12
Reimbursed the fund for the following:
Postage
$10
Office supplies
50
Maintenance
35
Meals (selling expenses)
25
$120
18
Increased the fund by an addi onal $200
25
Reimbursed the fund for the following:
Office supplies
$75
Delivery charges
30
$105
28
Reduced the amount of the fund to $350.
Required: Prepare journal entries to record the pe y cash transac ons.
EXERCISE 7–2
(LO3)
The following informa on pertains to Ferguson Corp. at December 31, 2016, its year-end:
Cash per company records
$5,005
Cash per bank statement
7,000
Bank service charges not yet recorded in company records
30
Note collected by bank not yet recorded in company records:
Amount of note receivable
$1,300
Amount of interest
25
1,325
Fluet inc. cheque deducted in error by bank
200
December cheques not yet paid by bank in December:
#631
$354
#642
746
#660
200
#661
300
1,600
December deposit recorded by the bank January 3, 2017
700
Required: Prepare a bank reconcilia on and all necessary adjus ng entries at December 31, 2016.
EXERCISE 7–3
(LO3)

Exercises
285
The Cash general ledger account balance of Gladstone Ltd. was $2,531 at March 31, 2018. On this
same date, the bank statement had a balance of $1,500. The following discrepancies were noted:
a. A deposit of $1,000 made on March 30, 2018 was not yet recorded by the bank on the March
statement.
b. A customer’s cheque amoun ng to $700 and deposited on March 15 was returned NSF with
the bank statement.
c. Cheque #4302 for office supplies expense, correctly made out for $125 and cleared the bank
for this amount, was recorded in the company records incorrectly as $152.
d. $20 for March service charges were recorded on the bank statement but not in the company
records.
e. A cancelled cheque for $250 belonging to Global Corp. but charged by the bank to Gladstone
Ltd. was included with the cancelled cheques returned by the bank.
f. There were $622 of outstanding cheques at March 31.
g. The bank collected a net amount of $290: $250 regarding a note receivable, interest revenue
of $50, and a $10 service charge that also is not included in the company records.
Required: Prepare a bank reconcilia on and record all necessary adjus ng entries at March 31,
2018.
EXERCISE 7–4
(LO4)
Sather Ltd. had the following unadjusted account balances at December 31, 2015 (assume normal
account balances):
Accounts Receivable
$147,000
Allowance for Doub ul Accounts
3,000
Sales
750,000
Required:
a. Assume that Sather Ltd. es mated its uncollec ble accounts at December 31, 2015 to be
two per cent of sales.
i. Prepare the appropriate adjus ng entry to record the es mated uncollec ble accounts
at December 31, 2015.

286
Cash and Receivables
ii. Calculate the balance in the Allowance for Doub ul Accounts account a er pos ng the
adjus ng entry.
b. Assume that Sather Ltd. es mated its uncollec ble accounts at December 31, 2015 to be
ten per cent of the unadjusted balance in accounts receivable.
i. Prepare the appropriate adjus ng entry to record the es mated uncollec ble accounts
at December 31, 2015.
ii. Calculate the balance in the Allowance for Doub ul Accounts account a er pos ng the
adjus ng entry.
c. Why is there a difference in the calculated es mates of doub ul accounts in parts (a) and
(b)?
d. Which calcula on provides be er matching: that made in part (a) or in part (b)? Why?
EXERCISE 7–5
(LO4)
The following informa on is taken from the records of Salzl Corp. at its December 31 year-end:
2019
2020
Accounts wri en off
During 2019
$2,400
During 2020
$1,000
Recovery of accounts wri en off
Recovered in 2020
300
Allowance for doub ul accounts
(adjusted balance)
At December 31, 2018
8,000
At December 31, 2019
9,000
Salzl had always es mated its uncollec ble accounts at two per cent of sales. However, because
of large discrepancies between the es mated and actual amounts, Hilroy decided to es mate its
December 31, 2020 uncollec ble accounts by preparing an ageing of its accounts receivable. An
amount of $10,000 was considered uncollec ble at December 31, 2020.
Required:
a. Calculate the amount of bad debt expense for 2019.
b. What adjus ng entry was recorded at December 31, 2019 to account for bad debts?
c. Calculate the amount of bad debt expense for 2020.

Exercises
287
d. What adjus ng entry was recorded at December 31, 2020 to account for bad debts?
EXERCISE 7–6
(LO5)
Following are notes receivable transac ons of Vilco Inc. whose year-end is March 31:
Mar. 1
Accepted a $40,000, 90-day, 3% note receivable dated today in gran ng a
me extension to West Corp. on its past-due accounts receivable.
Mar. 31
Made an adjus ng entry to record the accrued interest on West Corp.’s
note receivable.
May 30
Received West Corp.’s payment for the principal and interest on the note
receivable dated March 1.
Jun. 15
Accepted a $50,000, 45-day, 3% note receivable dated today in gran ng a
me extension to Jill Monte on her past-due accounts receivable.
???
Received Jill Monte’s payment for the principal and interest on her note
dated June 15.
Required:
a. Prepare journal entries to record Vilco Inc.’s transac ons (round all calcula ons to two dec-
imal places).
b. Assume instead that on May 30 West Corp. dishonoured (did not pay) its note when pre-
sented for payment. How would Vilco Inc. record this transac on on May 30?
EXERCISE 7–7
(LO6,7)
The following compara ve informa on is taken from the records of Salzl Corp. at its December 31
year-ends from 2016 to 2018:

288
Cash and Receivables
2018
2017
2016
Cash
$42,000
$30,000
$21,000
Accounts receivable
25,000
20,000
14,000
Merchandise inventory
36,000
25,000
17,500
Prepaid insurance
6,000
4,000
2,800
Plant and equipment
160,000
160,000
112,000
Accumulated deprecia on – plant and equipment
68,000
54,000
37,800
Accounts payable
14,000
12,000
8,400
Salaries payable
9,000
8,000
5,600
Income tax payable
11,000
9,000
6,300
Bank loan, due in 3 months
17,000
0
0
Bank loan, due in 24 months
48,000
0
0
Share capital
50,000
50,000
35,000
Retained earnings
15,000
12,000
8,400
Dividends
15,000
15,000
10,500
Sales
375,000
367,000
256,900
Cost of goods sold
190,000
152,000
106,400
Opera ng expenses
120,000
96,000
67,200
Income tax expense
13,000
10,000
7,000
Required:
a. Calculate the acid-test and accounts receivable turnover ra os for each of 2017 and 2018
(round final calcula ons to two decimal places).
b. Was the change in each ra o from 2017 to 2018 favourable or unfavourable? Explain.
Problems
PROBLEM 7–1
(LO3)
The reconcilia on of the cash balance per bank statement with the balance in the Cash account
in the general ledger usually results in one of five types of adjustments. These are
a. Addi ons to the reported general ledger cash balance.
b. Deduc ons from the reported general ledger cash balance.
c. Addi ons to the reported cash balance per the bank statement.
d. Deduc ons from the reported cash balance per the bank statement.

Problems
289
e. Informa on that has no effect on the current reconcilia on.
Required: Using the above le ers a to e from the list, indicate the appropriate adjustment for
each of the following items that apply to Goertzen Ltd. for December, 2019:
The company has received a $3,000 loan from the bank that was deposited
into its bank account but was not recorded in the company records.
A $250 cheque was not returned with the bank statement though it was
paid by the bank.
Cheques amoun ng to $4,290 shown as outstanding on the November
reconcilia on s ll have not been returned by the bank.
A collec on of a note receivable for $1,000 made by the bank has not been
previously reported to Goertzen. This includes interest earned of $50.
The bank has erroneously charged Goertzen with a $1,100 cheque, which
should have been charged to Gagetown Ltd.
A $350 cheque made out by Fynn Company and deposited by Goertzen has
been returned by the bank marked NSF; this is the first knowledge
Goertzen has of this ac on.
An $840 cheque from customer Abe Dobbs was incorrectly recorded as
$730 in the company records.
A $600 bank deposit of December 31 does not appear on the bank
statement.
Bank service charges amoun ng to $75 were deducted from the bank
statement but not yet from the company records.
PROBLEM 7–2
(LO2)
Pe y Cash
As of August 1, 2017, Bolchuk Buildings Ltd. decided that establishing a pe y cash fund would
be more efficient way to handle small day-to-day reimbursements. Below is a list of transac ons
during August:
August 2
Prepared and cashed a $500 cheque to establish the pe y cash fund for the first
me.
3
Purchased some office supplies for $35.00 for immediate use.
4
Paid $20.00 for delivery charges for some merchandise inventory purchased from a
supplier, fob shipping point.
6
Reimbursed an employee $139.60 for travel expenses to a end an out of town meet-
ing.
8
Paid a delivery charge of $32.00 regarding a sale to a customer.
10 Purchased a birthday cake for all the employees having a birthday in August as part
of their employee recogni on program. Cost was $80.00.
14
Paid $145.00 for postage to cover postage needs for the next 6 months.

290
Cash and Receivables
15
Checked the pe y cash and realized that it needed to be replenished so a cheque
was issued to replenish the fund and increase it to $800.00. Pe y cash currency was
counted and totalled $50.00.
17
Reimbursed an employee $75.80 for company-related travel expenses.
20
Purchased shop supplies for $300.00 to replenish shop inventory.
24
Paid $56.00 to a courier company to deliver documents to a customer.
28
Paid $345.00 to repair a broken window.
31
Cheque issued to replenish pe y cash. Pe y cash was counted and totalled $20.00.
Required: Prepare journal entries with dates as needed to record the items above.
PROBLEM 7–3
(LO3)
Bank Reconcilia on
It was me for Trevrini Co. to complete its bank reconcilia on for November 30, 2017. Below is
informa on that may relate to the task:
1. The cash balance as at November 30, 2017 was a debit balance of $23,500. The ending
balance shown on the bank statement was $30,000.
2. Cheques that were outstanding at November 30 were:
Chq 236
$230
Chq 240
15
3. It was noted that Cheque 230 was recorded as $50 in the accoun ng records but was posted
by the bank as $55 in error.
4. The bank statement showed a deposit of $180 for a $200 non-interest bearing note that
the bank had collected on behalf of the company, net of the $20 bank service charge for
collec on of the note. This was not yet recorded in the company’s books.
5. The bank statement showed a deduc on of $1,500 for a cheque from a customer for pay-
ment on account returned NSF. Included in this charge was a $25 NSF charge.
6. The bank statement also showed a deduc on of bank service charge fees of $18.
7. A deposit recorded by the company for $4,500 did not yet appear in the bank statement.
Required:
1. Prepare a bank reconcilia on for the company as at November 30, 2017.

Problems
291
2. Prepare any necessary journal entries as a result of the bank reconcilia on.
PROBLEM 7–4
(LO4)
Tarpon Inc. made $1,000,000 in sales during 2018. Thirty per cent of these were cash sales. During
2018, $25,000 of accounts receivable were wri en off as being uncollec ble. In addi on, $15,000
of the accounts that were wri en off in 2017 were unexpectedly collected in 2018. The December
31, 2017 adjusted balance in AFDA was a credit of $15,000. At its December 31, 2018 year-end,
Tarpon had the following accounts receivable:
Accounts
Age (days)
Receivable
1-30
$100,000
31-60
50,000
61-90
25,000
91-120
60,000
Over 120
15,000
Total
$250,000
Required:
1. Prepare journal entries to record the following 2018 transac ons:
(a) The write-off of $25,000.
(b) The recovery of $15,000.
2. Calculate the unadjusted balance in AFDA at December 31, 2018.
3. Prepare the adjus ng entry required at December 31, 2018 for each of the following sce-
narios:
(a) Bad debts at December 31, 2018 is based on three per cent of credit sales.
(b) Es mated uncollec ble accounts at December 31, 2018 is es mated at five per cent
of accounts receivable.
(c) Es mated uncollec ble accounts at December 31, 2018 is calculated using the follow-
ing aging analysis:

292
Cash and Receivables
Es mated
Loss
Age (days)
Percentage
2015-01-30
2%
31-60
4%
61-90
5%
91-120
10%
Over 120
50%
4. Calculate the December 31, 2018 adjusted balance in AFDA based on the adjustments pre-
pared in 3(a), 3(b), and 3(c) above.
PROBLEM 7–5
(LO4)
Recording Accounts Receivable Related Entries
Ripter Co. Ltd. began opera ons on January 1, 2017. It had the following transac ons during 2017,
2018, and 2019.
Dec 31, 2017 Es mated uncollec ble accounts as $5,000 (calculated as 2% of sales)
Apr 15, 2018
Wrote off the balance of Coulter, $700
Aug 8, 2018
Wrote off $3,000 of miscellaneous customer accounts as uncollec ble
Dec 31, 2018 Es mated uncollec ble accounts as $4,000 (1.5% of sales)
Mar 6, 2019
Recovered $200 from Coulter, whose account was wri en off in 2018; no further
recoveries are expected
Sep 4, 2019
Wrote off as uncollec ble $4,000 of miscellaneous customer accounts
Dec 31, 2019 Es mated uncollec ble accounts as $4,500 (1.5% of sales).
Required:
1. Prepare journal entries to record the above transac ons.
2. Assume that management is considering a switch to the balance sheet method of calculat-
ing the allowance for doub ul accounts. Under this method, the allowance at the end of
2019 is es mated to be $2,000. Comment on the discrepancy between the two methods of
es ma ng allowance for doub ul accounts.
PROBLEM 7–6
(LO4)
Recording Accounts Receivable Adjus ng Entries
The following balances are taken from the unadjusted trial balance of Cormrand Inc. at its year-
end, December 31, 2016:

Problems
293
Account Balances
Debit
Credit
Accounts Receivable
$100,000
Allowance for Doub ul Accounts
1,800
Sales (all on credit)
750,000
Sales Returns and Allowances
$22,000
The balance of a customer’s account in the amount of $1,000 is over 90 days past due and man-
agement has decided to write this account off.
Required:
1. Record the write-off of the uncollec ble account.
2. Record the adjus ng entry if the bad debts are es mated to be 2% of sales.
3. Record the adjus ng entry if instead, the bad debts are es mated to be 4% of the adjusted
accounts receivable balance as at December 31, 2016.
4. Show how Accounts Receivable and the Allowance for Doub ul Accounts would appear on
the December 31, 2011, balance sheet for parts (1) and (2).
PROBLEM 7–7
(LO5)
Recording Short-term Notes Receivables Transac ons
Below are transac ons for Regal Co.:
2016
Dec 12 Accepted a $20,500, 30-day, 5% note dated this date from a customer in exchange for
their past-due accounts receivable amount owing.
Dec 31 Made an adjus ng entry to record the accrued interest on the Dec 12 note.
Dec 31 Closed the Interest Revenue account as part of the closing process at year-end.
2017
Jan 12
Received payment for the principal and interest on the note dated December 12.
Jan 14
Accepted a $12,000, 6%, 60-day note dated this date for a sale to a customer with a
higher credit risk. Cost of goods was $7,500.
Jan 31
Made adjus ng entries to record the accrued interest for January, 2017 for all out-
standing notes receivable.
Feb 10
Accepted a $6,600, 90-day, 9% note receivable dated this day in exchange for his past-
due account.
Feb 28
Made adjus ng entries to record the accrued interest for January, 2017 regarding any
outstanding notes receivable.
?
Received payment for the principal and interest on the note dated January 14.
294
Cash and Receivables
Required:
1. Prepare the journal entries for the transac ons above. Determine the maturity date of the
January 14 note required for the journal entry. Round interest amounts to the nearest whole
dollar for simplicity.
2. Determine the maturity date of the February 10 note.
PROBLEM 7–8
(LO5)
Notes Receivables
Note Date
Face Value
Note Term
Interest Rate
Maturity Date
Accrued Interest
Dec 31, 2016
a)
Jan 1, 2017
$260,000
180 days
4.0%
b)
Jan 15, 2017
180,000
3 months
5.0%
c)
Jun 21, 2017
40,000
45 days
5.5%
d)
Dec 1, 2017
60,000
4 months
6.5%
Required:
1. Determine the maturity date for each note.
2. For each note, calculate the total amount of accrued interest from the note date to Decem-
ber 31, 2017 (the company year-end). Round interest to the nearest whole dollar.
3. What is the amount that would be collected for each note, assuming that both interest and
principal are collected at maturity?
PROBLEM 7–9
(LO6)
Ra o Calcula ons
The following informa on was taken from the December 31, 2017, financial statements of Stone-
hedge Cu ers Ltd.:
2017
2016
Sales
$250,000
$162,000
Sales discounts
52,000
2,300
Sales allowances
5,000
500
Accounts receivable
53,000
22,000
Required:

Problems
295
1. Calculate the accounts receivable turnover for 2017. Round answer to two decimal places.
2. If the ra o was 5.25 from 2016, has the company become more efficient or not?


Chapter 8
Long-lived Assets
Long-lived assets or property, plant, and equipment (PPE) assets are used in the normal operat-
ing ac vi es of the business and are expected to provide benefits for a period in excess of one
year. Long-lived assets covered in this chapter consist of three types: property, plant, and equip-
ment (PPE), intangible assets, and goodwill. Also discussed are deprecia on and amor za on,
techniques to allocate the cost of most long-lived assets over their es mated useful lives.
Chapter 8 Learning Objec ves
LO1 – Describe how the cost of property, plant, and equipment (PPE) is determined, and
calculate PPE.
LO2 – Explain, calculate, and record deprecia on using the units-of-produc on, straight-line,
and double-declining balance methods.
LO3 – Explain, calculate, and record deprecia on for par al years.
LO4 – Explain, calculate, and record revised deprecia on for subsequent capital expendi-
tures.
LO5 – Explain, calculate, and record the impairment of long-lived assets.
LO6 – Account for the derecogni on of PPE assets.
LO7 – Explain and record the acquisi on and amor za on of intangible assets.
LO8 – Explain goodwill and iden fy where on the balance sheet it is reported.
LO9 – Describe the disclosure requirements for long-lived assets in the notes to the financial
statements.
Concept Self-Check
Use the following as a self-check while working through Chapter
1. What is the dis nc on between capital expenditures and revenue expenditures?
2. How do generally accepted accoun ng principles prescribe what amount should be capital-
ized?
297

298
Long-lived Assets
3. How is par al period deprecia on recorded?
4. What is the formula for calcula ng revised deprecia on?
5. What is the difference between a tangible and intangible long-lived asset?
6. What different methods can be used to calculate deprecia on for property, plant, and equip-
ment?
7. How are disposals of property, plant, and equipment recorded in the accoun ng records?
8. How is the impairment of a long-lived asset accounted for?
9. How are intangible assets amor zed?
10. What is goodwill and what is its accoun ng treatment?
NOTE: The purpose of these ques ons is to prepare you for the concepts introduced in the chap-
ter. Your goal should be to answer each of these ques ons as you read through the chapter. If,
when you complete the chapter, you are unable to answer one or more the Concept Self-Check
ques ons, go back through the content to find the answer(s). Solu ons are not provided to these
ques ons.
8.1 Establishing the Cost of Property, Plant, and Equipment (PPE)
LO1 – Describe
how
the
cost
of
property,
plant, and equip-
ment
(PPE)
is
determined, and
calculate PPE.
Property, plant, and equipment (PPE) are tangible long-lived assets that
are acquired for the purpose of genera ng revenue either directly or in-
directly. They are held for use in the produc on or supply of goods and
services, have been acquired for use on a con nuing basis, and are not in-
tended for sale in the ordinary course of business. Because PPE assets are
long-lived or have a life greater than one year, they are non-current in na-
ture, also known as long-term assets. Examples of PPE assets include land,
office and manufacturing buildings, produc on machinery, trucks, ships or
aircra used to deliver goods or transport passengers, salespersons’ au-
tomobiles owned by a company, or a farmer’s produc on machinery like
tractors and field equipment. PPE assets are tangible assets because they
can be physically touched. There are other types of non-current assets
that are intangible – exis ng only as legal concepts – like copyrights and
patents. These will be discussed later in this chapter.
Capital Expenditures
Any cash disbursement is referred to as an expenditure. A capital expenditure results in the ac-
quisi on of a non-current asset, including any addi onal costs involved in preparing the asset for

8.1. Establishing the Cost of Property, Plant, and Equipment (PPE)
299
its intended use. Examples of various costs that may be incurred to prepare PPE for use are listed
below.
Capital Expenditures
Land
Building
Equipment
Purchase price
Purchase price
Invoice cost
Commission to real
Commission to real
Transporta on
estate agent
estate agent
Insurance (during
Legal fees
Legal fees
transporta on)
Costs of draining,
Repair and
Assembly
clearing, and
remodelling costs
Installa on
landscaping;
before use
(including wages
demoli on
Payments to tenants
paid to company
Assessments for
for premature
employees)
streets and
termina on of
Special floor
sewage system
lease
founda ons or
supports
Wiring
Inspec on
Test run costs
Costs to Acquire PPE
Costs to Pre-
pare PPE for
Use
To demonstrate, assume that equipment is purchased for $20,000. Addi onal costs include trans-
porta on costs $500, installa on costs $1,000, construc on costs for a cement founda on $2,500,
and test run(s) costs to debug the equipment $2,000. The total capitalized cost of the asset to put
it into use is $26,000.
Determining whether an outlay is a capital expenditure or a revenue expenditure is a ma er of
judgment. A revenue expenditure does not have a future benefit beyond one year. The concept
of materiality enters into the dis nc on between capital and revenue expenditures. As a ma er
of expediency, an expenditure of $20 that has all the characteris cs of a capital expenditure would
probably be expensed rather than capitalized, because the me and effort required by accoun ng
staff to capitalize and then depreciate the item over its es mated useful life is so much greater than
the benefits derived from doing so. Capitaliza on policies are established by many companies to
resolve the problem of dis nguishing between capital and revenue expenditures. For example,
one company’s capitaliza on policy may state that all capital expenditures equal to or greater
than $1,000 will capitalized, while all capital expenditures under $1,000 will be expensed when
incurred. Another company may have a capitaliza on policy limit of $500. Addi onally, a company
may have a different capitaliza on policy for different types of plant and equipment assets – hand
tools may have a capitaliza on policy limit of $200 while the limit might be $1,000 for furniture.
Not all asset-related expenditures incurred a er the purchase of an asset are capitalized. An
expenditure made to maintain PPE in sa sfactory working order is a revenue expenditure and
recorded as a debit to an expense account. Examples of these expenditures include: (a) the cost
of replacing small parts of an asset that normally wear out (in the case of a truck, for example:
new res, new muffler, new ba ery); (b) con nuing expenditures for maintaining the asset in

300
Long-lived Assets
good working order (for example, oil changes, an freeze, transmission fluid changes); and (c)
costs of renewing structural parts of an asset (for example, repairs of collision damage, repair or
replacement of rusted parts).
Although some expenditures for repair and maintenance may benefit more than one accoun ng
period, they may not be material in amount or they may have uncertain future benefits. They
are therefore treated as expenses. These three criteria must all be met for an expenditure to be
considered capital in nature.
1. Will it benefit more than one accoun ng period?
2. Will it enhance the service poten al of the asset, or make it more valuable or more adapt-
able?
3. Is the dollar amount material?
Regardless of when an expenditure is incurred, if it meets the three criteria above it will always be
a capital expenditure and debited to the appropriate asset account. If the expenditure does not
meet all three criteria, then it is a revenue expenditure and is expensed.
An explora on is available on the Lyryx site. Log into your Lyryx course to run
Revenue and Capital Expenditures
Land
The purchase of land is a capital expenditure when land is used in the opera on of a business. In
addi on to the costs listed in the schedule above, the cost of land should be increased by the cost
of removing any unwanted structures on it. This cost is reduced by the proceeds, if any, obtained
from the sale of the scrap. For example, assume that the purchase price of land is $100,000 before
an addi onal $15,000 cost to raze an old building: $1,000 is expected to be received for salvaged
materials. The cost of the land is $114,000 ($100,000 + $15,000 - $1,000).
Frequently, land and useful buildings are purchased for a lump sum. That is, one price is nego ated
for their en re purchase. A lump sum purchase price must be appor oned between the PPE
assets acquired on the basis of their respec ve market values, perhaps established by a municipal
assessment or a professional land appraiser. Assume that a lump sum of $150,000 cash is paid
for land and a building, and that the land is appraised at 25% of the total purchase price. The
Land account would be debited for $37,500 ($150,000 x 25%) and the Building account would be
debited for the remaining 75% or $112,500 ($150,000 x 75% = $112,500 or $150,000 - $37,500 =
$112,500) as shown in the following journal entry.
8.1. Establishing the Cost of Property, Plant, and Equipment (PPE)
301
General Journal
Date
Account/Explana on
PR
Debit
Credit
Land . . . . . . . . . . . . . . . . . . . . . . . . . . . . . . . . . .
37,500
Building . . . . . . . . . . . . . . . . . . . . . . . . . . . . . . .
112,500
Cash . . . . . . . . . . . . . . . . . . . . . . . . . . . . . . .
150,000
To record the purchase of land and build-
ing for a lump sum of $150,000; $150,000
x 25% = $37,500; $150,000 x 75% =
$112,500.
An explora on is available on the Lyryx site. Log into your Lyryx course to run
Building and Equipment
When a capital asset is purchased, its cost includes the purchase price plus all costs to prepare the
asset for its intended use. However, a company may construct its own building or equipment. In
the case of a building, for example, costs include those incurred for excava on, building permits,
insurance and property taxes during construc on, engineering fees, the cost of labour incurred by
having company employees supervise and work on the construc on of the building, and the cost
of any interest incurred to finance the construc on during the construc on period.
An explora on is available on the Lyryx site. Log into your Lyryx course to run
Cost of Property, Plant and Equipment (PPE)
Property, Plant, and Equipment (PPE) Subsidiary Ledger
The accounts receivable and accounts payable subsidiary ledgers (more commonly referred to as
subledgers) were introduced in Chapter
and the merchandise inventory subledger was intro-
duced in Chapter
. To review, a subledger lists individual accounts that fall under a common
account, also known as the controlling account. For example, the accounts receivable controlling
account for ABC Inc. shows a balance of $4,000 on the December 31, 2015 balance sheet. The
accounts receivable subledger shows that the $4,000 is made up of three receivables: $800 for
Ducker Inc.; $2,200 for Zest Inc.; and $1,000 for Frank Corpora on. Since the controlling account
is a summary of the subledger, their balances must be iden cal. Subledgers allow details to be
maintained in a separate record.
In a PPE subledger, an account would exist for each piece of land, each piece of machinery, each
vehicle, and so on. The subledger account would include informa on regarding the date of pur-
chase, cost, residual value, es mated useful life, deprecia on, and other relevant informa on.
An explora on is available on the Lyryx site. Log into your Lyryx course to run

302
Long-lived Assets
8.2 Deprecia on
LO2 – Explain,
calculate,
and
record
depre-
cia on
using
the
units-of-
produc on,
straight-line,
and
double-
declining balance
methods.
The role of deprecia on is to allocate the cost of a PPE asset (except land)
over the accoun ng periods expected to receive benefits from its use. De-
precia on begins when the asset is in the loca on and condi on necessary
for it to be put to use. Deprecia on con nues even if the asset becomes
idle or is re red from use, unless it is fully depreciated. Land is not depre-
ciated, as it is assumed to have an unlimited life.
Deprecia on is an applica on of the matching principle.
According to generally accepted accoun ng principles, a com-
pany should select a method of deprecia on that represents
the way in which the asset’s future economic benefits are es -
mated to be used up.
There are many different ways to calculate deprecia on. The most frequently used methods are
usage-based and me-based. Regardless of deprecia on method, there are three factors neces-
sary to calculate deprecia on:
• cost of the asset
• residual value
• es mated useful life or produc ve output.
Residual value is the es mated worth of the asset at the end of its es mated useful life.
Useful life is the length of me that a long-lived asset is es mated to be of benefit to the current
owner. This is not necessarily the same as the asset’s economic life. If a company has a policy of
replacing its delivery truck every two years, its useful life is two years even though it may be used
by the next owner for several more years.
Produc ve output is the amount of goods or services expected to be provided. For example, it
may be measured in units of output, hours used, or kilometres driven.
Usage-Based Deprecia on Method – Units-of-Produc on
Usage-based deprecia on methods, such as the Units-of-Produc on Method, are used when the
output of an asset varies from period to period.
Usage methods assume that the asset will contribute to the earning of revenues
in rela on to the amount of output during the accoun ng period. Therefore, the de-
precia on expense will vary from year to year.
8.2. Deprecia on
303
To demonstrate, assume that Big Dog Carworks Corp. purchased a $20,000 piece of equipment
on January 1, 2015 with a $2,000 residual value and es mated produc ve life of 10,000 units. If
1,500 units were produced during 2015, the deprecia on expense for the year ended December
31, 2015 would be calculated using the following formula:
Cost
− Residual value
Es mated units of output
=
Deprecia on
per unit
×
Number of units
produced
=
Deprecia on
expense
$20,000
− $2,000
10,000 units
=
$1.80 deprecia on
per unit
×
1,500 units
produced
=
$2,700 deprecia on
expense for 2015
The following adjus ng entry would be made on December 31, 2015:
General Journal
Date
Account/Explana on
PR
Debit
Credit
Dec 31
Deprecia on Expense . . . . . . . . . . . . . . . . . .
2,700
Accumulated Deprecia on . . . . . . . . . . .
2,700
To record deprecia on expense using the
Units-of-Produc on method;
($20,000
- $2,000)/10,000 units = $1.80/unit;
$1.80/unit x 1,500 units = $2,700.
The carrying amount or net book value of the asset (cost less accumulated deprecia on) on the
December 31, 2015 balance sheet would be $17,300 ($20,000 - 2,700).
Note that the residual value is only used to calculate deprecia on expense. It is not
recorded in the accounts of the company or included as part of the carrying amount
(net book value) on the balance sheet.
If 2,000 units were produced during 2016, deprecia on expense for that year would be $3,600
($1.80 per unit
× 2,000 units). At December 31, 2016, the following adjus ng entry would be
recorded:
General Journal
Date
Account/Explana on
PR
Debit
Credit
Dec 31
Deprecia on Expense . . . . . . . . . . . . . . . . . .
3,600
Accumulated Deprecia on . . . . . . . . . . .
3,600
To record deprecia on expense using the
Units-of-Produc on method;
($20,000
- $2,000)/10,000 units = $1.80/unit;
$1.80/unit x 2,000 units = $3,600.

304
Long-lived Assets
The carrying amount (or net book value) at December 31, 2016 would be $13,700 ($20,000 – 2,700
– 3,600). If the equipment produces 1,000 units in 2017, 2,500 units in 2018, and 3,000 units in
2019, deprecia on expense and carrying amounts would be as follows each year:
(a)
(b)
(c)
(d)
(e)
(f)
Carrying
amount at
Carrying
end of
amount at
Usage
Dep’n
year
Year
start of year
(units)
Rate
expense
(b) – (e)
2015
$20,000
1,500
$1.80
$2,700
$17,300
2016
17,300
2,000
1.80
3,600
13,700
2017
13,700
1,000
1.80
1,800
11,900
2018
11,900
2,500
1.80
4,500
7,400
2019
7,400
3,000
1.80
5,400
2,000
10,000
$18,000
If the equipment produces exactly 10,000 units over its useful life and is then re red, deprecia on
expense over all years will total $18,000 (10,000
× $1.80) and the carrying amount will equal
residual value of $2,000.
It is unlikely that the equipment will produce exactly 10,000 units over its useful life. Assume
instead that 4,800 units were produced in 2019. Deprecia on expense and carrying amounts
would be as follows each year:
(a)
(b)
(c)
(d)
(e)
(f)
Carrying
amount at
Carrying
end of
amount at
Usage
Dep’n
year
Year
start of year
(units)
Rate
expense
(b) – (e)
2015
$20,000
1,500
$1.80
$2,700
$17,300
2016
17,300
2,000
1.80
3,600
13,700
2017
13,700
1,000
1.80
1,800
11,900
2018
11,900
2,500
1.80
4,500
7,400
2019
7,400
4,800
1.80
5,400
2,000
11,800
$18,000
No ce that the deprecia on expense for 2019 is not
$8,640
(calculated as
the 4,800 units x $1.80/unit = $8,640). The deprecia on expense for 2019
cannot exceed $5,400 because the remaining carrying amount must be
equal to or greater than the residual value. In other words, the maximum
allowable accumulated deprecia on cannot exceed cost less residual. A
PPE asset cannot be deprecia on below its residual value.
Carrying
amount
(or net
book
value)
cannot
be less
than
residual
value

8.2. Deprecia on
305
An explora on is available on the Lyryx site. Log into your Lyryx course to run
Time-Based Deprecia on Method - Straight-Line
The straight-line method of deprecia on – introduced in Chapter
– assumes that the asset will
contribute to the earning of revenues equally each me period. Therefore, equal amounts of
deprecia on are recorded during each year of the asset’s useful life. Straight-line deprecia on is
based on me – the asset’s es mated useful life.
Straight-line deprecia on is calculated as:
Cost
− Es mated residual value
Es mated useful life in years
=
Deprecia on expense/year
To demonstrate, assume the same $20,000 piece of equipment used earlier, with an es mated
useful life of five years and an es mated residual value of $2,000. Straight-line deprecia on would
be $3,600 per year calculated as:
$20,000
− $2,000
5 years
=
$3,600 deprecia on expense/year
Over the five-year useful life of the equipment, deprecia on expense and carrying amounts will
be as follows:
(a)
(b)
(c)
(d)
Carrying
amount at
Carrying
end of
amount at
Dep’n
year
Year
start of year
expense
(b) – (c)
2015
$20,000
$3,600
$16,400
2016
16,400
3,600
12,800
2017
12,800
3,600
9,200
2018
9,200
3,600
5,600
2019
5,600
3,600
2,000
$18,000
The carrying amount at December 31, 2019 will be the residual value of $2,000 ($20,000 – 18,000).
Under the straight-line method, deprecia on expense for each accoun ng period
remains the same dollar amount over the useful life of the asset.

306
Long-lived Assets
An explora on is available on the Lyryx site. Log into your Lyryx course to run
Accelerated Time-Based Deprecia on Method – Double-Declining Balance (DDB)
An accelerated deprecia on method assumes that a plant and equipment asset will contribute
more to the earning of revenues in the earlier stages of its useful life than in the later stages.
This means that more deprecia on is recorded in earlier years with the deprecia on expense de-
creasing each year. This approach is most appropriate where assets experience a high degree of
obsolescence (such as computers) or where the value of the asset is highest in the first year when
it is new and efficient and declines significantly each year as it is used and becomes worn (such as
equipment).
Under an accelerated deprecia on method, deprecia on expense decreases each
year over the useful life of the asset.
One type of accelerated deprecia on is the double-declining balance (DDB) method. It is calcu-
lated as:
Carrying Amount (or Net Book Value)
× (2/n)
where n = es mated useful life. 2/n is the rate of deprecia on and it remains constant over the
asset’s es mated useful life (unless there is a change in the useful life which is discussed in a later
sec on of this chapter). The DDB rate of deprecia on can also be described as twice the straight-
line rate. For example, if the straight-line rate of deprecia on is 15%, the DDB rate will be 30%
(calculated as 2
× 15%).
To demonstrate DDB deprecia on calcula ons, assume the same $20,000 equipment with an es-
mated useful life of five years. The DDB rate of deprecia on is calculated as 2/n = 2/5 = 0.40 or
40%. Alterna vely, given that we know the straight-line rate is 20%, doubling it is 40%.
The declining balance rate is applied to the carrying amount of the asset without regard to resid-
ual value. Regardless of which deprecia on method is used, remember that the asset cannot be
depreciated below its carrying amount (or net book value) which in this case is $2,000. The DDB
deprecia on for the five years of the asset’s useful life follows.
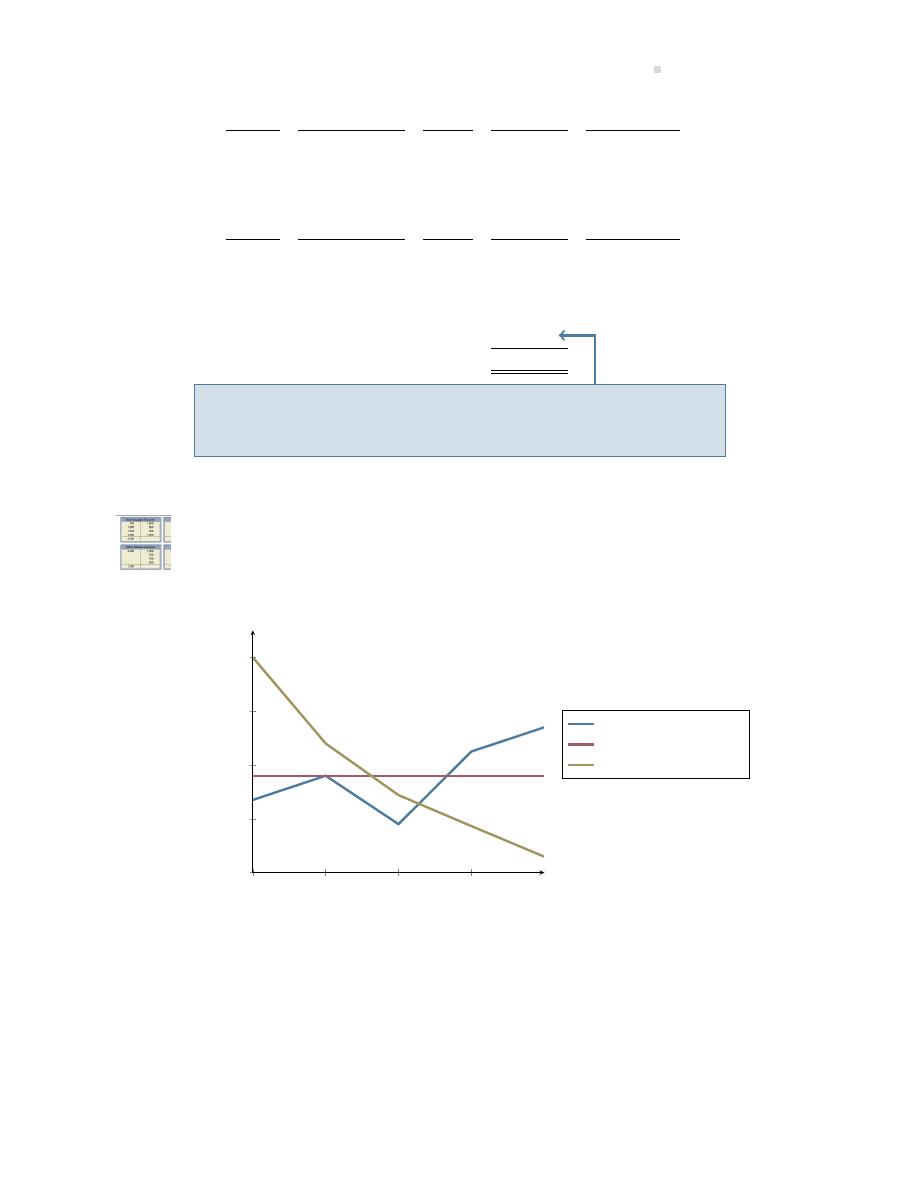
8.2. Deprecia on
307
(a)
(b)
(c)
(d)
(e)
Carrying
amount at
Carrying
Dep’n
end of
amount at
DDB
expense
year
Year
start of year
rate
(b) x (c)
(b) – (d)
2015
$20,000
40%
$8,000
$12,000
2016
12,000
40%
4,800
7,200
2017
7,200
40%
2,880
4,320
2018
4,320
40%
1,728
2,592
2019
2,592
40%
592
2,000
$18,000
Although for 2019 the deprecia on expense would be calculated as
$1,037 ($2,592 x 40%), only $592 is recorded to bring the carrying
amount of the asset down to its residual value of $2,000.
At the end of five years, the carrying amount is once again equal to the residual value of $2,000.
An explora on is available on the Lyryx site. Log into your Lyryx course to run
A comparison of the three deprecia on methods is shown in Figure
2015
2016
2017
2018
2019
$0
$2,000
$4,000
$6,000
$8,000
Year
Dollar
s
of
Depr
ecia
on
Units-of-Produc on
Straight-Line
DDB
Figure 8.1: Comparing Three Deprecia on Methods
308
Long-lived Assets
8.3 Par al Year Deprecia on
LO3 – Explain,
calculate,
and
record
depreci-
a on for par al
years.
Assets may be purchased or sold at any me during a fiscal year. Should
deprecia on be calculated for a whole year in such a case? The answer de-
pends on corporate accoun ng policy. There are many alterna ves. One
is to calculate deprecia on to the nearest whole month. Another, o en
called the half-year rule, records half a year’s deprecia on regardless of
when an asset purchase or disposal occurs during the year.
To demonstrate the half-year approach to calcula ng deprecia on for par al periods, assume
again that Big Dog Carworks Corp. purchases equipment for $20,000 with an es mated useful
life of five years and a residual value of $2,000. Recall that deprecia on expense for 2015 was
$3,600 using the straight-line method. Because of the half-year rule, deprecia on expense for
2015 would be $1,800 ($3,600 x .5) even though the asset was purchased on the first day of the
fiscal year. Using the double-declining balance method, deprecia on expense for 2015 under the
half-year rule would be $4,000 ($8,000
× .5). Applying the half-year rule to the units-of-produc on
deprecia on for 2015, would result in no change because the method is usage-based and not me-
based (presumably usage would be less if the asset is purchased partway through the year, so this
deprecia on method already takes this into account).
An explora on is available on the Lyryx site. Log into your Lyryx course to run
.
8.4 Revising Deprecia on
LO4 – Explain,
calculate,
and
record
revised
deprecia on for
subsequent capi-
tal expenditures.
Both the useful life and residual value of a depreciable asset are es mated
at the me it is purchased. As me goes by, these es mates may change
for a variety of reasons. In these cases, the deprecia on expense is recal-
culated from the date of the change in the accoun ng es mate and ap-
plied going forward. No change is made to deprecia on expense already
recorded.
Consider the example of the equipment purchased for $20,000 on January
1, 2015, with an es mated useful life of five years and residual value of
$2,000. If the straight-line deprecia on method is used, the yearly depre-
cia on expense is $3,600. A er two years, the carrying amount at the end
of 2016 is $12,800 ($20,000 - 3,600 - 3,600). Assume that on January 1,
2017, management es mates the remaining useful life of the equipment
to be six years, and the residual value to be $5,000.
Deprecia on expense for the remaining six years would be calculated as:
8.4. Revising Deprecia on
309
(
Remaining carrying amount
− Revised residual value)
Es mated remaining useful life
=
(
$12,800
− 5,000)
6 years
=
$1,300 per year
An explora on is available on the Lyryx site. Log into your Lyryx course to run
Revised Dep. - Change in Life/Residual
.
Subsequent Capital Expenditures
As noted earlier, normal, recurring expenditures that relate to day-to-day servicing of depreciable
assets are not capitalized, but rather are expensed when incurred. Oil changes and new res for
vehicles are examples of recurring expenditures that are expensed. Expenditures that are mate-
rial, can be reliably measured, and enhance the future economic benefit provided by the asset, are
added to the cost of the asset rather than being expensed when incurred. A subsequent capital
expenditure can take one of two forms:
1. Addi on (e.g., adding a garage to the back of an exis ng building or adding a skywalk in a
factory)
2. Replacement (e.g., replacing the refrigera on unit in a long-haul truck or replacing the win-
dows in a building).
To demonstrate the accoun ng for an addi on, recall our original example where equipment was
purchased on January 1, 2015 for $20,000; the es mated useful life and residual value were five
years and $2,000, respec vely. Assume that on January 4, 2016, a heat exchanger was added to
the equipment that allowed it to produce a new product in addi on to the exis ng product line.
This $12,000 addi on, paid in cash, had an es mated life of ten years with no residual value. The
useful life and residual value of the original equipment did not change as a result of the addi on.
The entry to record the addi on on January 4 is:
General Journal
Date
Account/Explana on
PR
Debit
Credit
Jan 4
Equipment – Heat Exchanger . . . . . . . . . . . .
12,000
Cash . . . . . . . . . . . . . . . . . . . . . . . . . . . . . . .
12,000
To record the addi on of a heat exchanger
to the equipment.
The entry to record revised deprecia on on December 31, 2016 is:
310
Long-lived Assets
General Journal
Date
Account/Explana on
PR
Debit
Credit
Dec 31
Deprecia on Expense - Equipment . . . . . . .
4,800
Accumulated Deprecia on - Equip-
ment . . . . . . . . . . . . . . . . . . . . . . . . . . . . . . . . .
4,800
To record revised straight-line depre-
cia on; ($20,000 - $2,000)/5 years =
$3,600/year; ($12,000 - $0)/10 years =
$1,200/year; $3,600 + $1,200 = $4,800.
An explora on is available on the Lyryx site. Log into your Lyryx course to run
The accoun ng for a replacement is more involved. The cost of the replaced item and its re-
lated accumulated deprecia on must be removed from the accoun ng records when the replace-
ment is capitalized recording any resul ng gain or loss as well as calcula ng revised deprecia on.
Let’s demonstrate, again using the $20,000 equipment purchased on January 1, 2015 with a five-
year life and $2,000 residual value. Assume that on January 5, 2018 the engine in the equipment
burned out and needed to be replaced. The PPE subledger showed that the engine had an original
cost of $8,000, useful life of five years, and residual value of $1,000 resul ng in a carrying amount
as at January 5, 2018 of $3,800 ($8,000 cost – $4,200 accumulated deprecia on). The entry to dis-
pose of the old engine and remove it from the accoun ng records is (the old engine was scrapped
and not sold because it was burned out):
General Journal
Date
Account/Explana on
PR
Debit
Credit
Jan 5
Accum. Dep. – Equip. – Engine . . . . . . . . . .
4,200
Loss on Disposal . . . . . . . . . . . . . . . . . . . . . . .
3,800
Equipment – Engine . . . . . . . . . . . . . . . . .
8,000
To record the scrapping of the burned
out equipment engine; ($8,000 - $1,000)/5
years = $1,400/year deprecia on X 3 years
= $4,200 accumulated deprecia on.
No ce in the entry above that the cost of the old engine and the accumulated deprecia on must
be individually removed from the accoun ng records. Since the asset is not completely depre-
ciated and was scrapped, the $3,800 carrying amount represents a loss. If the engine had been
sold, the gain or loss would have been calculated as the difference between its carrying value and
the cash proceeds. Losses (as well as gains) are reported on the income statement under Other
Revenues and Expenses. A common error made by students is to debit loss on disposal and credit
equipment–engine for the carrying amount; this is incorrect. A er pos ng the entry to dispose
of the old engine, the account balances in the Equipment account and its related Accumulated
Deprecia on account would be as follows.
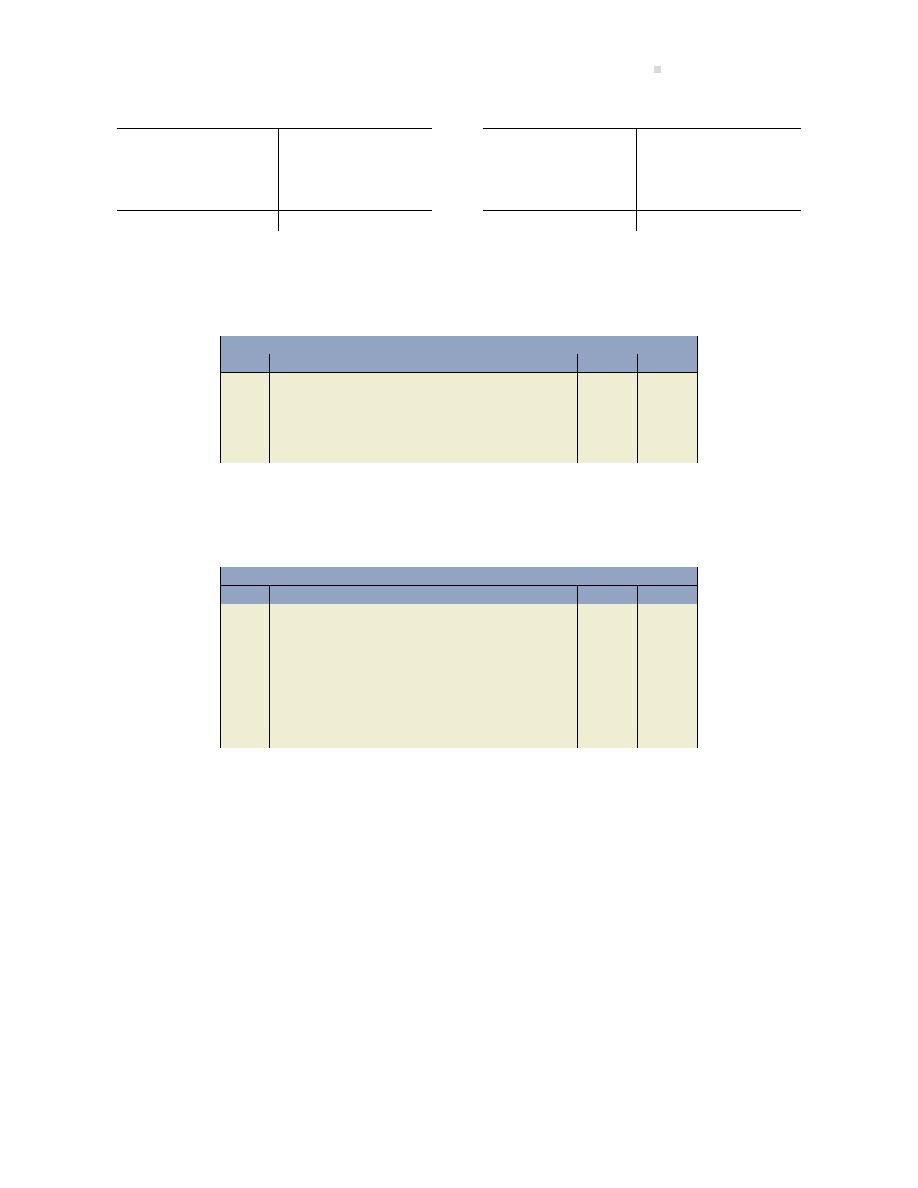
8.4. Revising Deprecia on
311
Equipment
Accumulated Deprecia on – Equipment
Jan. 1, 2015
20,000
8,000
Jan. 5, 2018
3,600
Dec. 31, 2015
3,600
Dec. 31, 2016
3,600
Dec. 31, 2017
Jan. 5, 2018
4,200
Balance
12,000
6,600
Balance
The entry to record the new engine purchased for $12,000 cash (es mated life 8 years; es mated
zero residual value) is:
General Journal
Date
Account/Explana on
PR
Debit
Credit
Jan 5
Equipment - Engine . . . . . . . . . . . . . . . . . . . .
12,000
Cash . . . . . . . . . . . . . . . . . . . . . . . . . . . . . . .
12,000
To record the new engine with es mated
useful life of 8 years and es mated residual
value of zero.
Alterna vely, the entries to dispose of the old engine and record the addi on of the new engine
can be combined into one compound entry as follows:
General Journal
Date
Account/Explana on
PR
Debit
Credit
Jan 5
Accum. Dep. – Equip. – Engine (old) . . . . .
4,200
Loss on Disposal . . . . . . . . . . . . . . . . . . . . . . .
3,800
Equipment – Engine (new) . . . . . . . . . . . . . .
12,000
Equipment – Engine (old) . . . . . . . . . . . .
8,000
Cash . . . . . . . . . . . . . . . . . . . . . . . . . . . . . . .
12,000
To record the scrapping of the burned
out equipment engine and its replacement
with a new engine.
Assuming the useful life and residual value of the equipment did not change and the new engine
had an es mated useful life of eight years and an es mated residual value of zero, the entry to
record revised deprecia on on December 31, 2018 is:
312
Long-lived Assets
General Journal
Date
Account/Explana on
PR
Debit
Credit
Dec 31
Deprecia on Expense - Equipment . . . . . . .
3,200
Accum. Dep. - Equipment . . . . . . . . . . .
3,200
To record revised straight-line deprecia-
on; Remaining carrying amount of equip-
ment = $12,000 remaining cost - $6,600
remaining balance in accumulated depre-
cia on = $5,400; Revised deprecia on on
equipment = ($5,400 remaining carrying
amount - $2,000 residual)/2 years remain-
ing useful life = $1,700 deprecia on/year;
Deprecia on on new engine = ($12,000 -
$0)/8 years = $1,500/year; Total deprecia-
on = $1,700 + $1,500 = $3,200.
The previous example emphasizes the importance of maintaining a PPE subledger in order to ap-
ply the concept of componen za on. Componen za on requires each major component that
has a different es mated useful life than the rest of an asset to be recorded and depreciated
separately. For instance, assume a commercial airliner is purchased for $100 million ($100M) on
January 1, 2015 with the following components: airframe, engines, landing gear, interior, and
other parts. Original cost, es mated residual value, es mated useful lives, deprecia on method
to be used, serial numbers where applicable, and other relevant informa on are recorded in the
PPE subledger.
An explora on is available on the Lyryx site. Log into your Lyryx course to run
.
8.5 Impairment of Long-lived Assets
LO5 – Explain,
calculate,
and
record
the
impairment
of
long-lived
assets.
Under generally accepted accoun ng principles, management must com-
pare the recoverable amount of a long-lived asset with its carrying amount
(cost less accumulated deprecia on) at the end of each repor ng period.
The recoverable amount is the fair value of the asset at the me less any
es mated costs to sell it. If the recoverable amount is lower than the car-
rying amount, an impairment loss must be recorded.
An impairment loss may occur because of a variety of reasons such as technological obsolescence,
an economic downturn, or a physical disaster. When an impairment is recorded, subsequent years’
deprecia on expense must also be revised.
Recall again our $20,000 equipment purchased January 1, 2015 with an es mated useful life of
five years and a residual value of $2,000. Assume straight-line deprecia on has been recorded for
8.6. Derecogni on of Property, Plant, and Equipment
313
2015 and 2016 at $3,600 per year. At December 31, 2016, the carrying amount of the equipment
is $12,800 ($20,000 – 3,600 – 3,600). At that point management determines that new equipment
with equivalent capabili es can be purchased for much less than the old equipment due to tech-
nological changes. As a result, the recoverable value of the original equipment at December 31,
2016 is es mated to be $7,000. Because the recoverable amount is less than its carrying amount
of $12,800, an impairment loss of $5,800 ($12,800 – 7,000) is recorded in the accoun ng records
of BDCC as follows:
General Journal
Date
Account/Explana on
PR
Debit
Credit
Dec 31
Impairment Loss . . . . . . . . . . . . . . . . . . . . . . .
5,800
Equipment . . . . . . . . . . . . . . . . . . . . . . . . .
5,800
To record impairment loss on equipment.
This reduces the carrying amount of the equipment to $7,000 so that revised deprecia on expense
of $1,667 per year would be recorded at the end of 2017, 2018, and 2019, calculated as follows
(assume no change to original useful life and residual value):
(
Revised carrying amount
− Revised residual value)
Remaining useful life
=
(
$7,000
− $2,000)
3 years remaining useful life
=
$1,667 per year
Impairment losses can be reversed in subsequent years if the recoverable amount of the asset
exceeds the carrying amount. Also, if the fair value of a PPE asset can be reliably measured, it
can be revalued to more than its original cost. However, the revalua on process needs to be
conducted therea er on a regular basis. These topics are not dealt with here, as they are beyond
the scope of introductory financial accoun ng.
An explora on is available on the Lyryx site. Log into your Lyryx course to run
8.6 Derecogni on of Property, Plant, and Equipment
LO6 – Account
for the derecog-
ni on
of
PPE
assets.
Property, Plant, and Equipment is derecognized (that is, the cost and any
related accumulated deprecia on are removed from the accoun ng records)
when it is sold or when no future economic benefit is expected. To account
for the disposal of a PPE asset, the following must occur:
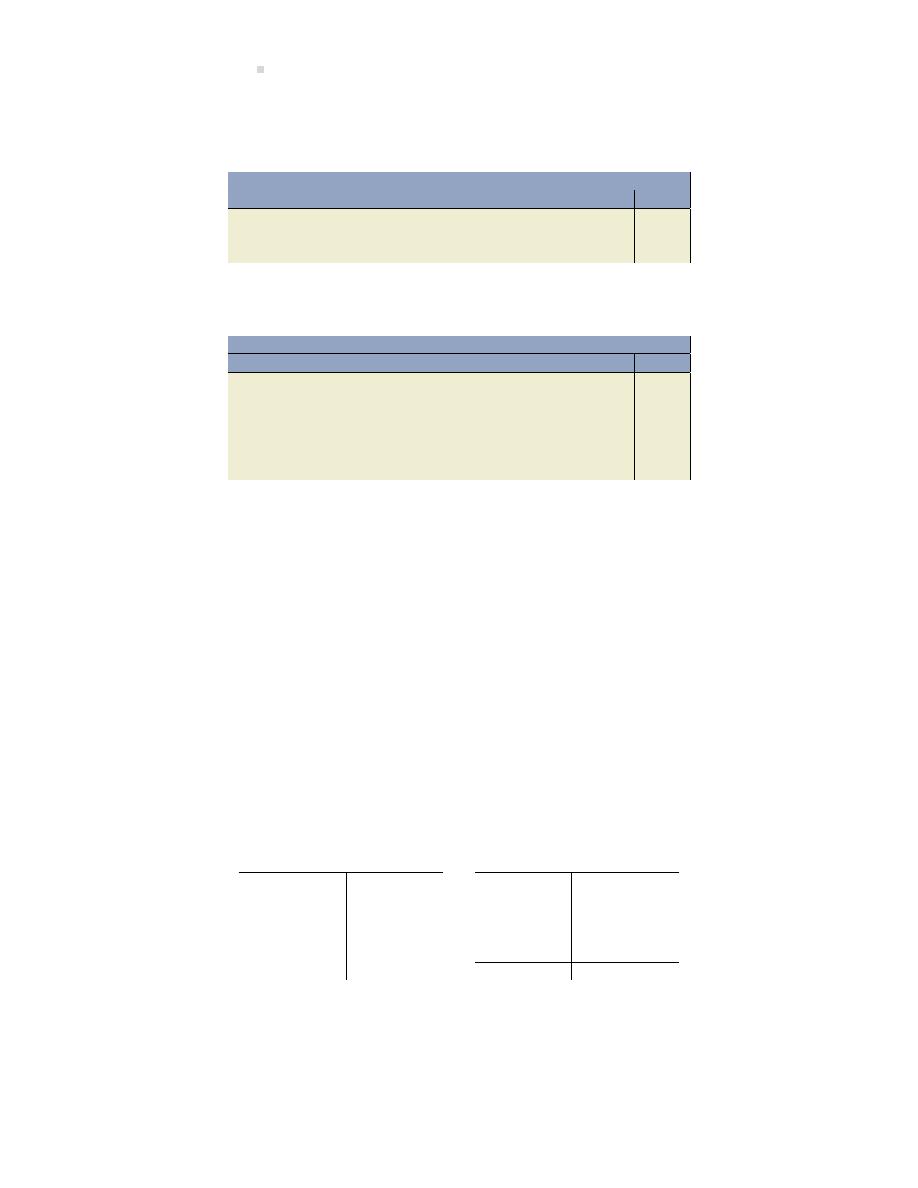
314
Long-lived Assets
1. If the disposal occurs part way through the accoun ng period, deprecia on must be updated
to the date of disposal by
General Journal
Date
Account/Explana on
PR
Debit
Credit
Deprecia on Expense . . . . . . . . . . . . . . . . . .
XXX
Accumulated Deprecia on . . . . . . . . . . .
XXX
To update deprecia on for par al period.
2. Record the disposal including any resul ng gain or loss by
General Journal
Date
Account/Explana on
PR
Debit
Credit
Cash (if any, or other assets received) . . . .
XXX
Accumulated Deprecia on . . . . . . . . . . . . . .
XXX
Loss on Disposal . . . . . . . . . . . . . . . . . . . . . . .
XXX
OR Gain on Disposal . . . . . . . . . . . . . . . .
XXX
PPE Asset (such as Equipment) . . . . . . .
XXX
To record disposal of PPE asset.
A loss results when the carrying amount of the asset is greater than the proceeds received, if any.
A gain results when the carrying amount is less than any proceeds received.
Sale or Re rement of PPE
When a PPE asset has reached the end of its useful life it can be either sold or re red. In either
case, the asset’s cost and accumulated deprecia on must be removed from the records, a er
deprecia on expense has been recorded up to the date of disposal or re rement.
Recall the calcula on of straight-line deprecia on for the equipment purchased for $20,000 with
an es mated useful life of five years and a residual value of $2,000. Assume that the general ledger
T-accounts of equipment and accumulated deprecia on contain the following entries for the last
five years:
Accumulated Deprecia on
Equipment
Equipment
2015
20,000
2015
3,600
2016
3,600
2017
3,600
2018
3,600
2019
3,600
18,000
Assume that the equipment is sold at the end of 2019, when accumulated deprecia on totals
$18,000. The carrying amount at this date is $2,000 ($20,000 cost – $18,000 accumulated depre-
cia on). Three different situa ons are possible.
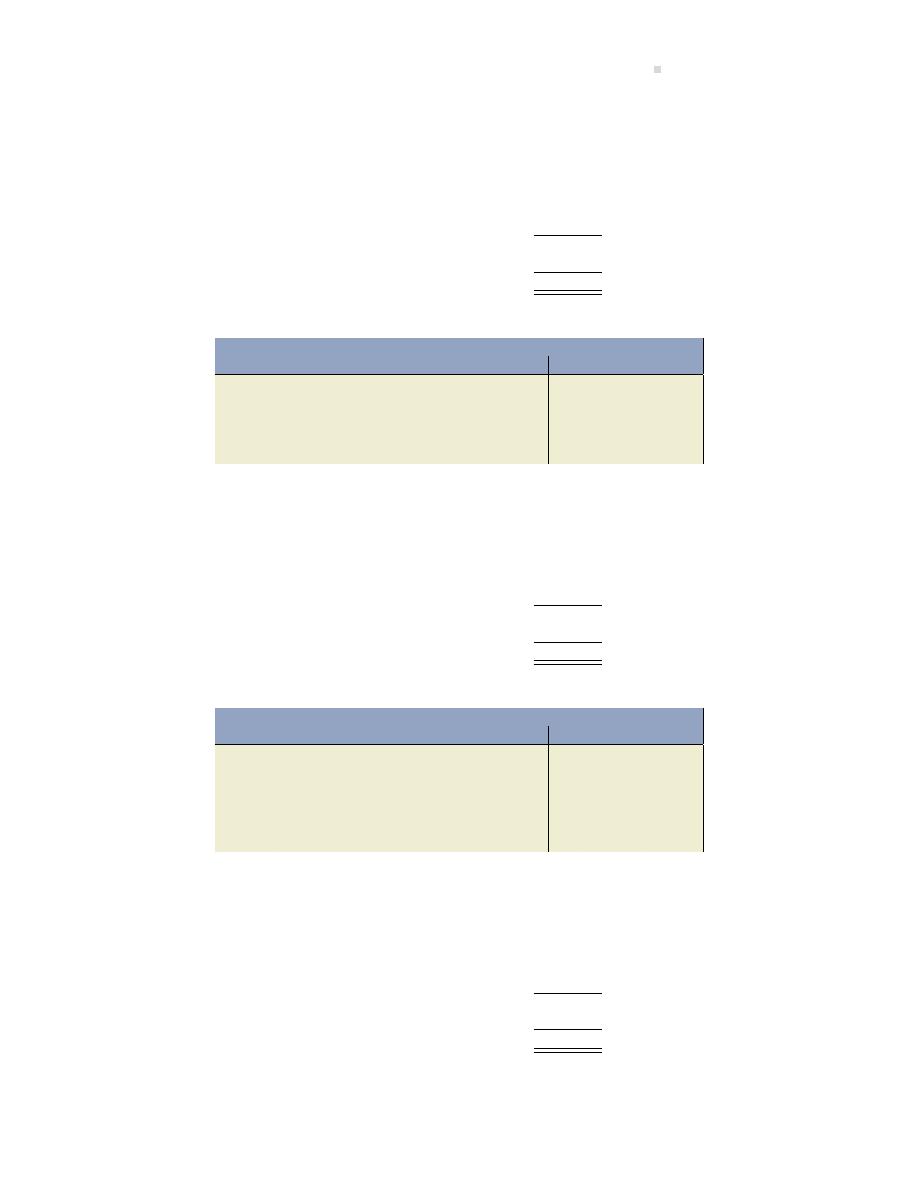
8.6. Derecogni on of Property, Plant, and Equipment
315
1. Sale at carrying amount
Assume the equipment is sold for its residual value of $2,000. No gain or loss on disposal
would occur.
Cost
$
20,000
Accumulated deprecia on
(18,000)
Carrying amount
2,000
Proceeds of disposi on
(2,000)
Gain on disposal
$
-0-
General Journal
Date
Account/Explana on
PR
Debit
Credit
Dec 31
Cash . . . . . . . . . . . . . . . . . . . . . . . . . . . . . . . . . .
2,000
Accumulated Dep. – Equipment . . . . . . . . .
18,000
Equipment . . . . . . . . . . . . . . . . . . . . . . . . .
20,000
To record the disposal of equipment sold
for $2,000 cash.
2. Sale above carrying amount
Assume the equipment is sold for $3,000. A gain of $1,000 would occur.
Cost
$
20,000
Accumulated deprecia on
(18,000)
Carrying amount
2,000
Proceeds of disposi on
(3,000)
Gain on disposal
$
(1,000)
General Journal
Date
Account/Explana on
PR
Debit
Credit
Dec 31
Cash . . . . . . . . . . . . . . . . . . . . . . . . . . . . . . . . . .
3,000
Accumulated Dep. – Equipment . . . . . . . . .
18,000
Gain on Disposal . . . . . . . . . . . . . . . . . . . .
1,000
Equipment . . . . . . . . . . . . . . . . . . . . . . . . .
20,000
To record the disposal of equipment sold
for $3,000 cash.
3. Sale below carrying amount
Assume the equipment is sold for $500. A loss on disposal of $1,500 would occur.
Cost
$
20,000
Accumulated deprecia on
(18,000)
Carrying amount
2,000
Proceeds of disposi on
(500)
Loss on disposal
$
1,500

316
Long-lived Assets
General Journal
Date
Account/Explana on
PR
Debit
Credit
Dec 31
Cash . . . . . . . . . . . . . . . . . . . . . . . . . . . . . . . . . .
500
Accumulated Dep. – Equipment . . . . . . . . .
18,000
Loss on Disposal . . . . . . . . . . . . . . . . . . . . . . .
1,500
Equipment . . . . . . . . . . . . . . . . . . . . . . . . .
20,000
To record the disposal of equipment sold
for $500 cash.
In each of these cases, the cash proceeds must be recorded (by a debit) and the cost and accumu-
lated deprecia on must be removed from the accounts. A credit difference represents a gain on
disposal while a debit difference represents a loss.
Disposal Involving Trade-In
It is a common prac ce to exchange a used PPE asset for a new one. This is known as a trade-in.
The value of the trade-in agreed by the purchaser and seller is called the trade-in allowance. This
amount is applied to the purchase price of the new asset, and the purchaser pays the difference.
For instance, if the cost of a new asset is $10,000 and a trade-in allowance of $6,000 is given for
the old asset, the purchaser will pay $4,000 ($10,000 – 6,000).
Some mes as an inducement to the purchaser, the trade-in allowance is higher than the fair value
of the used asset on the open market. Regardless, the cost of the new asset must be recorded at
its fair value, calculated as follows:
Cost of new asset = Cash paid + Fair value of asset traded
If there is a difference between the fair value of the old asset and its carrying value, a gain or
loss results. For example, assume again that equipment was purchased by BDCC for $20,000 and
has accumulated deprecia on of $18,000 at the end of 2019. It is traded on January 1, 2020
for new equipment with a list price of $25,000. A trade-in allowance of $2,500 is given on the
old equipment, which has a fair value of only $1,800. In this case, the cost of the new asset is
calculated as follows:
Cash paid +
Fair value of asset traded =
Cost of new asset
$22,500
+
1,800
=
$24,300
Cash paid will equal the difference between the selling price of the new equipment less the trade-
in allowance, or $22,500 ($25,000 - 2,500). The fair value of the asset traded-in is $1,800. The
cost of the new asset is therefore $24,300 ($22,500 + 1,800). There will be a loss on disposal of
$200 on the old equipment, calculated as follows:
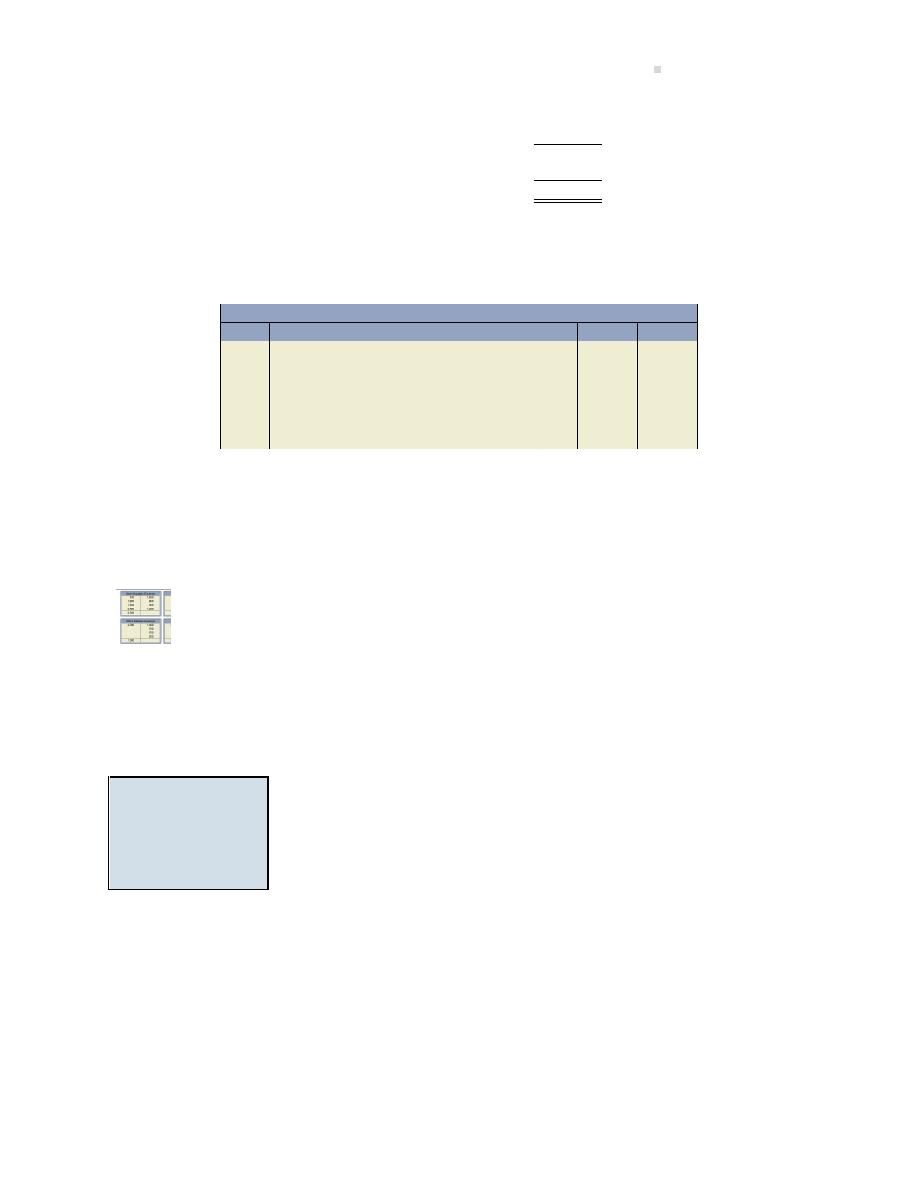
8.7. Intangible Assets
317
Cost
$
20,000
Accumulated deprecia on
(18,000)
Carrying amount
2,000
Fair value
(1,800)
Loss on disposal
$
200
The journal entry on January 1, 2020 to record the purchase of the new equipment and trade-in
of the old equipment is:
General Journal
Date
Account/Explana on
PR
Debit
Credit
Jan 1
Equipment (new) . . . . . . . . . . . . . . . . . . . . . .
24,300
Accumulated Dep. – Equipment (old) . . . .
18,000
Loss on Disposal . . . . . . . . . . . . . . . . . . . . . . .
200
Equipment (old) . . . . . . . . . . . . . . . . . . . .
20,000
Cash . . . . . . . . . . . . . . . . . . . . . . . . . . . . . . .
22,500
To record trade-in.
By this entry, the cost of the new equipment ($24,300) is entered into the accounts, the accumu-
lated deprecia on and cost of the old equipment is removed from the accounts, and the amount
of cash paid is recorded. The debit difference of $200 represents the loss on disposal of the old
equipment.
An explora on is available on the Lyryx site. Log into your Lyryx course to run
8.7 Intangible Assets
LO7 – Explain and
record the acqui-
si on and amor -
za on of intangi-
ble assets.
Another major category of long-lived assets that arises from legal rights
and does not have physical substance is that of intangible assets. The
characteris cs of various types of intangible assets are discussed below.
Patents
A patent is an intangible asset that is granted when a company has an exclusive legal privilege to
produce and sell a product or use a process for a specified period. This period varies depending
on the nature of the product or process patented, and on the legisla on in effect. Modifica ons
to the original product or process can result in a new patent being granted, in effect extending the
life of the original patent.

318
Long-lived Assets
Patents are recorded at cost. If purchased from an inventor, the patent’s cost is easily iden fied;
if developed internally, the patent’s cost includes all expenditures incurred in the development of
the product or process, including salaries and benefits of staff involved.
Copyrights
A copyright is another intangible asset that confers on the holder an exclusive legal privilege to
publish a literary or ar s c work. In this case, the state grants control over a published or ar s c
work for the life of the copyright holder (o en the original ar st) and for a specified period a er-
ward. This control extends to the reproduc on, sale, or other use of the copyrighted material.
Trademarks
A trademark is a symbol or a word used by a company to iden fy itself or one of its products in
the marketplace. Symbols are o en logos printed on company sta onery or displayed at company
offices, on vehicles, or in adver sing. A well-known example is Coke®. The right to use a trade-
mark can be protected by registering it with the appropriate agency. The symbol ‘®’ denotes that
a trademark is registered.
Franchises
A franchise is a legal right granted by one company (the franchisor) to another company (the
franchisee) to sell par cular products or to provide certain services in a given region using a specific
trademark or trade name. In return, the franchisee pays a fee to the franchisor. McDonald’s® is
an example of a franchised fast-food chain.
Another example of a franchise is one granted by government for the provision of certain services
within a given geographical loca on: for example, television sta ons and telephone services au-
thorized by the telecommunica ons branch of the state, or garbage collec on authorized within
a given community.
In addi on to the payment of an ini al franchise fee, which is capitalized, a franchise agreement
usually requires annual payments. These payments are considered opera ng expenses.
Computer So ware
Computer so ware programs may be developed by a company, patented, and then sold to cus-
tomers for use on their computers. Produc vity so ware like Microso Office® is an example.
The cost of acquiring and developing computer so ware programs is recorded as an intangible
asset, even if it is stored on a physical device like a computer. However, computer so ware that

8.7. Intangible Assets
319
is integral to machinery – for instance, so ware that is necessary to control a piece of produc on
equipment – is included as the cost of the equipment and classified as PPE.
Capitaliza on of Intangible Assets
Normally, intangible assets are measured at cost at the me of acquisi on and are reported in
the asset sec on of a company’s balance sheet under the heading “Intangible Assets.” The cost of
an acquired intangible asset includes its purchase price and any expenditures needed to directly
prepare it for its intended use.
There are special rules regarding intangible assets with a finite life and an indefinite life. Detailed
discussion of these topics is beyond the scope of this textbook. It will be assumed that all intangi-
bles being discussed in this textbook have a finite life.
Amor za on of Intangible Assets
Plant and equipment assets are depreciated. Intangible assets are also depreciated but the term
used is amor za on instead of deprecia on. Amor za on (of intangible assets) is the system-
a c process of alloca ng the cost of intangible assets over their es mated useful lives using the
straight-line, double-declining-balance, units-of-produc on or other method deemed appropri-
ate.
Like PPE considera ons, useful life and residual value of intangible assets are es mated by man-
agement and must be reviewed annually for reasonableness. Any effects on amor za on expense
because of changes in es mates are accounted for prospec vely. That is, prior accoun ng periods’
expenses are not changed.
To demonstrate the accoun ng for intangibles, assume a patent is purchased for $20,000 on July
1, 2015. The entry to record the purchase is:
General Journal
Date
Account/Explana on
PR
Debit
Credit
July 1
Patent . . . . . . . . . . . . . . . . . . . . . . . . . . . . . . . .
20,000
Cash . . . . . . . . . . . . . . . . . . . . . . . . . . . . . . .
20,000
To record the purchase of a patent, an in-
tangible asset.
Assuming the patent will last 40 years with no residual value, and amor za on is calculated to the
nearest whole month, amor za on expense will be recorded at the December 31, 2015 year end
as:
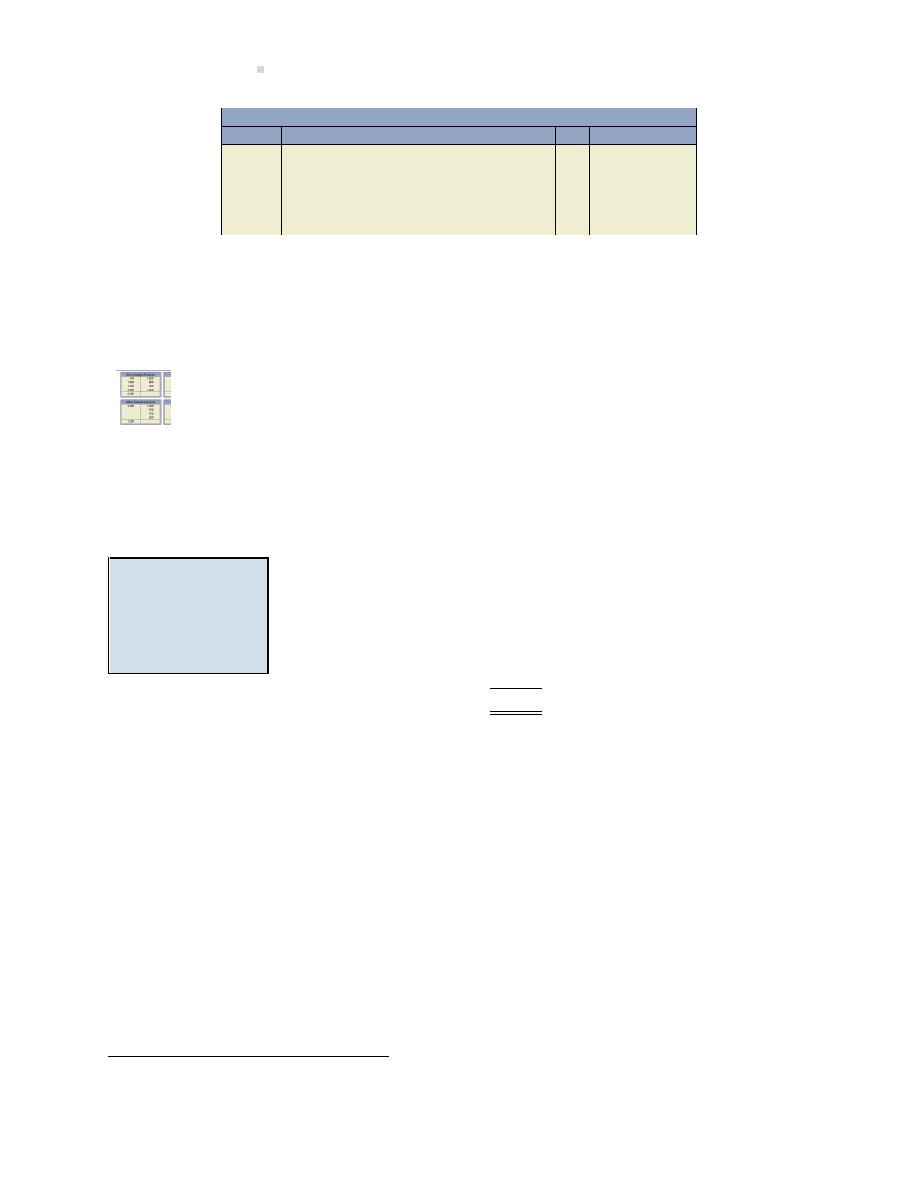
320
Long-lived Assets
General Journal
Date
Account/Explana on
PR
Debit
Credit
Dec 31
Amor za on Expense - Patent . . . . . . . . . .
250
Accumulated Amor za on - Patent . . .
250
To record amor za on on the patent;
($20,000 – 0)/40 years = $500/year; $500
x 6/12 = $250.
No ce that an accumulated amor za on account
is credited and not accumulated deprecia on.
Impairment losses, and gains and losses on disposal of intangible assets, are calculated and recorded
in the same manner as for property, plant, and equipment.
An explora on is available on the Lyryx site. Log into your Lyryx course to run
8.8 Goodwill
LO8
–
Explain
goodwill
and
iden fy where on
the balance sheet
it is reported.
Assume that Big Dog Carworks Corp. purchases another company for $10
million ($10M). BDCC takes over all opera ons, including management
and staff. There are no liabili es. The fair values of the purchased assets
consist of the following:
Patents
$2M
Machinery
$7M
Total
$9M
Why would BDCC pay $10M for assets with a fair value of only $9M? The extra $1M represents
goodwill. Goodwill is the excess paid over the fair value of the net assets when one company
buys another, and represents the value of the purchasee’s ability to generate superior earnings
compared to other companies in the same industry.
Goodwill is the combina on of a company’s assets which cannot be separately iden fied – such as
a well-trained workforce, be er retail loca ons, superior products, or excellent senior managers
– the value of which is recognized only when a significant por on of the business is purchased by
another company.
Recall that among other characteris cs, intangible assets must be separately iden fiable. Because
components of goodwill are not separately iden fiable, goodwill is not considered an intangible
asset. However, it does have future value and therefore is recorded as a long-lived asset under its
own heading of “Goodwill” on the balance sheet.
1
IFRS 2014, IAS 38, para. 98; effec ve January 1, 2016 but can be applied sooner.

8.8. Goodwill
321
The detailed discussion of goodwill is an advanced accoun ng topic and beyond the scope of this
textbook.

322
Long-lived Assets
8.9 Disclosure
LO9 – Describe
the
disclosure
requirements for
long-lived assets
in the notes to
the
financial
statements.
When long-lived assets are presented on the balance sheet, the notes to
the financial statements need to disclose the following:
• details of each class of assets (e.g., land; equipment including sepa-
rate parts; patents; goodwill)
• measurement basis (usually historical cost)
• type of deprecia on and amor za on methods used, including es -
mated useful lives
• cost and accumulated deprecia on at the beginning and end of the
period, including addi ons, disposals, and impairment losses
• whether the assets are constructed by the company for its own use
(if PPE) or internally developed (if intangible assets).
Examples of appropriate disclosure of long-lived assets were shown in notes 3(d) and 4 of BDCC’s
financial statements in Chapter
.
Summary of Chapter 8 Learning Objec ves
LO1 – Describe how the cost of property, plant, and equipment (PPE) is deter-
mined, and calculate PPE.
Property, plant and equipment (PPE) are tangible, long-lived assets that are acquired for the pur-
pose of genera ng revenue either directly or indirectly. A capital expditure is debited to a PPE
asset account because it results in the acquisi on of a non-current asset and includes any addi-
onal costs involved in preparing the asset for its intended use at or a er ini al acquisi on. A
revenue expenditure does not have a future benefit beyond one year so is expensed. The details
regarding a PPE asset are maintained in a PPE subsidiary ledger.
LO2 – Explain, calculate, and record deprecia on using the units-of-produc on,
straight-line, and double-declining balance methods.
Deprecia on, an applica on of matching, allocates the cost of a PPE asset (except land) over the
accoun ng periods expected to receive benefits from its use. A PPE asset’s cost, residual value,
and useful life or produc ve output are used to calculate deprecia on. There are different depre-
cia on methods. Units-of-produc on is a usage-based method. Straight-line and double-declining

Summary of Chapter
Learning Objec ves
323
balance are me-based methods. The formulas for calcula ng deprecia on using these methods
are:
Units-of-Produc on
Straight-Line
Double-Declining Balance
Cost
− Es mated Residual Value
Cost
− Es mated Residual Value
Carrying Amount
× 2/n
Es mated Total Units of Produc on
Es mated Total Useful Life
where n = es mated useful life
=
Deprecia on Expense/Unit
=
Deprecia on Expense/Period
=
Deprecia on Expense/Period
Maximum accumulated deprecia on is equal to cost less residual. The carrying amount of a PPE
asset, also known as the net book value, equals the cost less accumulated deprecia on.
LO3 – Explain, calculate, and record deprecia on for par al years.
When assets are acquired or derecognized partway through the accoun ng period, par al period
deprecia on is recorded. There are several ways to account for par al period deprecia on. Two
common approaches are to calculate deprecia on to the nearest whole month or to apply the
half-year rule. The half-year rule assumes six months of deprecia on in the year of acquisi on
and year of derecogni on regardless of the actual date these occurred.
LO4 – Explain, calculate, and record revised deprecia on for subsequent capital
expenditures.
When there is a change that impacts deprecia on (such as a change in the es mated useful life or
es mated residual value, or a subsequent capital expenditure) revised deprecia on is calculated
prospec vely. It is calculated as:
Remaining Carrying Amount
− Es mated Residual Value∗
Es mated Remaining Useful Life
∗
∗ where the residual value and/or useful life may have changed
LO5 – Explain, calculate, and record the impairment of long-lived assets.
The recoverable amount of a long-lived asset must be compared with its carrying amount (cost
less accumulated deprecia on) at the end of each repor ng period. The recoverable amount is
the fair value of the asset at the me less any es mated costs to sell it. If the recoverable amount
is lower than the carrying amount, an impairment loss must be recorded as:
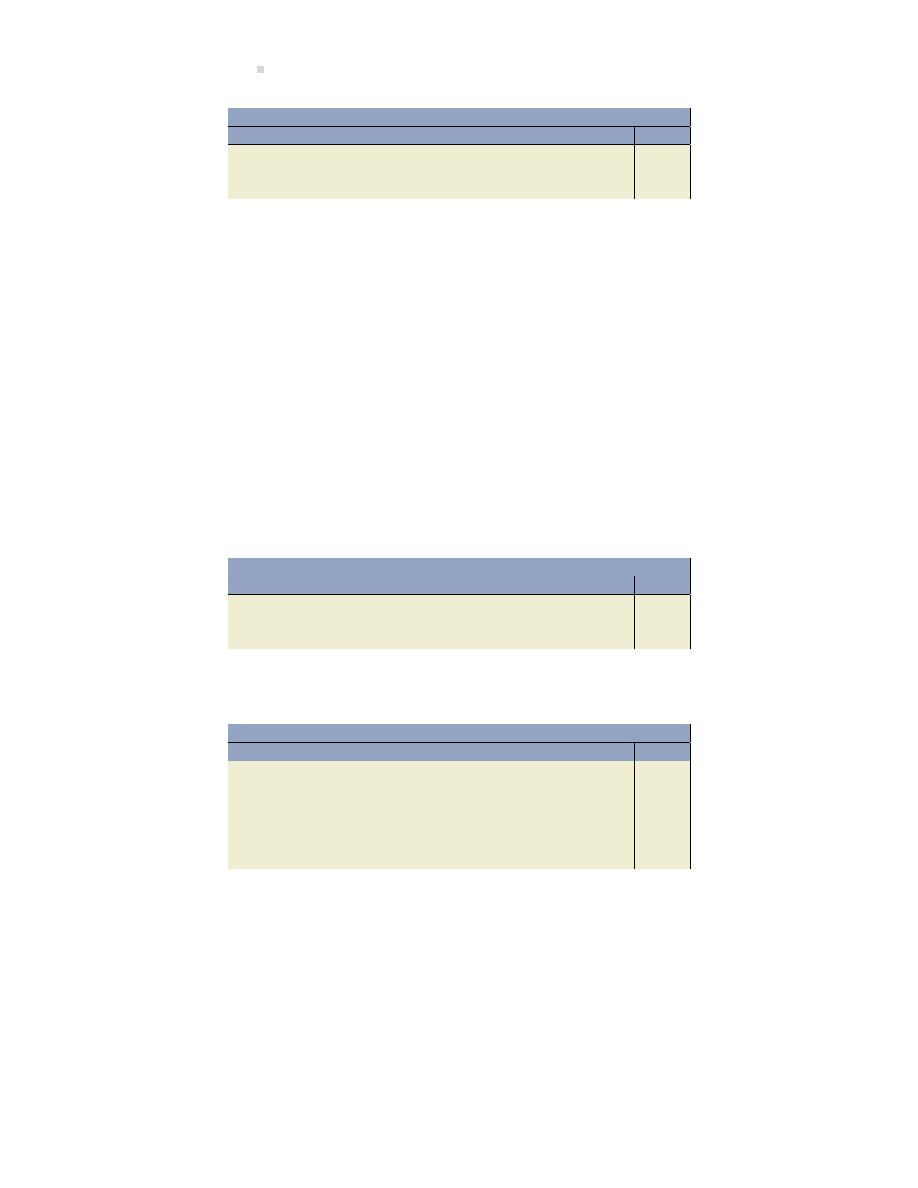
324
Long-lived Assets
General Journal
Date
Account/Explana on
PR
Debit
Credit
Impairment Loss . . . . . . . . . . . . . . . . . . . . . . .
XXX
Equipment . . . . . . . . . . . . . . . . . . . . . . . . .
XXX
To record impairment loss.
Impairment losses can be reversed in subsequent years if the recoverable amount of the asset
exceeds the carrying amount. Also, if the fair value of a PPE asset can be reliably measured, it can
be revalued to more than its original cost.
LO6 – Account for the derecogni on of PPE assets.
Property, plant, and equipment is derecognized (that is, the cost and any related accumulated de-
precia on are removed from the accoun ng records) when it is sold or when no future economic
benefit is expected. To account for the disposal of a PPE asset, the following must occur:
1. If the disposal occurs part way through the accoun ng period, deprecia on must be updated
to the date of disposal by
General Journal
Date
Account/Explana on
PR
Debit
Credit
Deprecia on Expense . . . . . . . . . . . . . . . . . .
XXX
Accumulated Deprecia on . . . . . . . . . . .
XXX
To update deprecia on for par al period.
2. Record the disposal including any resul ng gain or loss by
General Journal
Date
Account/Explana on
PR
Debit
Credit
Cash (if any, or other assets received) . . . .
XXX
Accumulated Deprecia on . . . . . . . . . . . . . .
XXX
Loss on Disposal . . . . . . . . . . . . . . . . . . . . . . .
XXX
OR Gain on Disposal . . . . . . . . . . . . . . . .
XXX
PPE Asset (such as Equipment) . . . . . . .
XXX
To record disposal of PPE asset.
A loss results when the carrying amount of the asset is greater than the proceeds received, if any.
A gain results when the carrying amount is less than any proceeds received.
It is a common prac ce to exchange a used PPE asset for a new one, known as a trade-in. The
value of the trade-in is called the trade-in allowance and is applied to the purchase price of the
new asset so that the purchaser pays the difference. Some mes the trade-in allowance is higher
than the fair value of the used asset. The cost of the new asset must be recorded at its fair value,
calculated as:

Summary of Chapter
Learning Objec ves
325
Cost of new asset = Cash paid + Fair value of asset traded
If there is a difference between the fair value of the old asset and its carrying value, a gain or loss
results.
LO7 – Explain and record the acquisi on and amor za on of intangible assets.
Intangible assets are long-lived assets that arise from legal rights and do not have physical sub-
stance. Examples include patents, copyrights, trademarks, and franchises. Intangibles are amor-
zed using various methods. The entry to record amor za on is a debit to amor za on expense
and a credit to either the intangible asset or to an accumulated amor za on account.
LO8 – Explain goodwill and iden fy where on the balance sheet it is reported.
Goodwill is a long-lived asset that does not have physical substance but it is NOT an intangible.
When one company buys another company, goodwill is the excess paid over the fair value of the
net assets purchased and represents the value of the purchasee’s ability to generate superior
earnings compared to other companies in the same industry. Goodwill appears in the asset sec on
of the balance sheet under its own heading of “Goodwill”.
LO9 – Describe the disclosure requirements for long-lived assets in the notes to
the financial statements.
When long-lived assets are presented on the balance sheet, the notes to the financial statements
need to disclose the following:
• details of each class of assets (e.g., land; equipment including separate parts; patents; good-
will)
• measurement basis (usually historical cost)
• type of deprecia on and amor za on methods used, including es mated useful lives
• cost and accumulated deprecia on at the beginning and end of the period, including addi-
ons, disposals, and impairment losses
whether the assets are constructed by the company for its own use (if PPE) or internally developed
(if intangible assets).

326
Long-lived Assets
Discussion Ques ons
1. The cost of a long-lived asset is said to be capitalized. What does this mean?
2. How does a capital expenditure differ from a revenue expenditure?
3. Assume that you have purchased a computer for business use. Illustrate, using examples,
capital and revenue expenditures associated with its purchase.
4. A company purchases land and buildings for a lump sum. What does this mean? What is
the acceptable manner of accoun ng for a lump sum purchase?
5. How does the concept of materiality affect the recording of an expenditure as a capital or
revenue item?
6. List the three criteria used to determine whether a replacement part for equipment is con-
sidered a capital or revenue expenditure.
7. When one long-lived asset is exchanged for another, how is the cost of the newly-acquired
asset determined?
8. What is deprecia on?
9. Long-lived assets can be considered future benefits to be used over a period of years. The
value of these benefits in the first years may not be the same as in later years. Using a car
as an example, indicate whether you agree or disagree.
10. Assume that you have recently purchased a new sports car. Is a usage or a me-based
method preferable for recording deprecia on? Why?
11. Why is residual value ignored when deprecia on is calculated using the declining balance
method but not the straight-line method? Is this inconsistent? Why or why not?
12. What is the formula for calcula ng the declining balance method of deprecia on? ...the
straight-line method?
13. What is the double-declining balance rate of deprecia on for an asset that is expected to
have a ten-year useful life?
14. Explain two types of par al-year deprecia on methods.
15. What changes in es mates affect calcula on of deprecia on expense using the straight-
line method? Explain the appropriate accoun ng treatment when there is a revision of an
es mate that affects the calcula on of deprecia on expense.
16. Explain the effect on the calcula on of deprecia on expense for capital expenditures made
subsequent to the ini al purchase of plant or equipment.
17. Explain the process for determining whether the value of a long-lived asset has been im-
paired, and the required adjustments to the accoun ng records.

Discussion Ques ons
327
18. Your friend is concerned that the calcula on of deprecia on and amor za on relies too
much on the use of es mates. Your friend believes that accoun ng should be precise. Do
you agree that the use of es mates makes accoun ng imprecise? Why or why not?
19. Why are the significant parts of property, plant, and equipment recorded separately?
20. When does the disposal of PPE not result in a gain or loss?
21. What is a trade-in? Explain whether a trade-in is the same as the sale of an asset.
22. Why might a trade-in allowance, par cularly in the case of a car, be unrealis c? Why would
a dealer give more trade-in allowance on a used car than it is worth?
23. How is the cost of a new capital asset calculated when a trade-in is involved?
24. How are intangible assets different from property, plant, and equipment? the same?
25. What is a patent? Assume a patent’s legal life is twenty years. Does a patent’s useful life
correspond to its legal life? Why or why not? Support your answer with an example.
26. How does a copyright differ from a trademark? Give an example of each.
27. What is goodwill? Why is a company’s internally-generated goodwill usually not recorded
in its accoun ng records?
28. How are intangible assets valued, and what are their financial statement disclosure require-
ments?

328
Long-lived Assets
Exercises
EXERCISE 8–1
(LO1)
For all expenditures, accountants iden fy them as either capital or revenue expenditures. The
entries for such transac ons can be made to any one of the following accounts:
Capital expenditures are recorded in an asset account on the balance sheet such as:
a. Land
b. Buildings
c. Equipment
d. Trucks
e. Automobiles
Revenue expenditures are recorded in an income statement account:
f. An expense account
Required: For each transac on below, indicate the account to be adjusted. Assume all expendi-
tures are material in amount. Explain your answers.
Example:
b
Architect fees to design building.
Ba ery purchased for truck.
Commission paid to real estate agent to purchase land.
Cost of equipment test runs.
Cost to remodel building.
Cost to replace manual elevator with automa c elevator.
Cost of sewage system.
Equipment assembly expenditure.
Expenditures for debugging new equipment and ge ng it ready for use.
Installa on of air-condi oner in automobile.
Insurance paid during construc on of building.
Legal fees associated with purchase of land.
Oil change for truck.
Payment for landscaping.

Exercises
329
Expenditures for removal of derelict structures.
Repair made to building a er moving in.
Repair of collision damage to truck.
Repair of torn seats in automobile.
Replacement of engine in automobile.
Special floor founda ons for installa on of new equipment.
Tires purchased for truck.
Transporta on expenditures to bring newly purchased equipment to plant.
EXERCISE 8–2
(LO1)
Glasgo Holdings Inc. purchased a property including land and a building for $300,000. The market
values of the land and building were $100,000 and $300,000, respec vely.
Required: Using these market values, prepare a journal entry to record the lump sum purchase.
EXERCISE 8–3
(LO1,2)
Ekman Corpora on purchased a new laser printer to be used in its business. The printer had a list
price of $4,000, but Ekman was able to purchase it for $3,575. The company expects it to have
a useful life of five years, with an es mated residual value of $250. Ekman is paying the delivery
costs of $100 along with the set-up and debugging costs of $350.
Required:
a. Calculate the total cost of the laser printer.
b. Ekman management asks you whether the straight-line or double-declining balance method
of deprecia on would be most appropriate for the printer. Provide calcula ons to support
your answer.
EXERCISE 8–4
(LO2)
Willow Inc. began a business on January 1, 2019. It purchased equipment for its factory on this
date for $240,000. The equipment is expected to have an es mated useful life of five years with
a residual value of $40,000. Willow’s year-end is December 31.
Required: Compute the deprecia on for 2019, 2020, 2021, 2022 and 2023 using

330
Long-lived Assets
a. The straight-line method
b. The double-declining balance method.
EXERCISE 8–5
(LO2)
Mayr Inc. began a business on January 1, 2019. It purchased a machine for its factory on this
date for $110,000. The machine is expected to have an es mated useful life of four years with a
residual value of $40,000.
Required: Compute the deprecia on for 2019, 2020, 2021, and 2022 using
a. The straight-line method
b. The double-declining balance method.
EXERCISE 8–6
(LO2,3)
Penny Corp. purchased a new car on March 1, 2019 for $25,000. The es mated useful life of
the car was five years or 500,000 kms. Es mated residual value was $5,000. The car was driven
120,000 kms. in 2019 and 150,000 kms. in 2020. Penny Corp.’s year end is December 31.
Required:
a. Applying the half-year rule, calculate deprecia on for 2019 and 2020 using
i. The straight-line method
ii. Units-of-produc on method
iii. Double-declining-balance method
b. Assuming Penny Corp. calculates deprecia on to the nearest whole month, determine de-
precia on for 2019 and 2020 using
i. The straight-line method
ii. Units-of-produc on method
iii. Double-declining-balance method
EXERCISE 8–7
(LO4)

Exercises
331
Global Flow Inc. purchased machinery on January 1, 2019 for $60,000 cash. It had an es mated
useful life of three years, with no residual value, and deprecia on is calculated using the straight-
line method. During 2021, Global Flow determined that the es mated useful life should be revised
to a total of five years and the residual value changed to $10,000.
Required: Prepare the entry to record revised deprecia on for the year ended December 31,
2021.
EXERCISE 8–8
(LO4)
Denton Inc. purchased machinery on January 1, 2019 for $140,000 cash. It had an es mated use-
ful life of five years and no residual value. On January 1, 2020, Denton purchased a specialized
component for $50,000 that was a ached to the machinery to significantly increase its produc-
vity. The es mated useful life of the component was four years with no residual value. The life
and residual value of the original machinery was not affected by the new component.
Required:
a. Prepare the entry to record deprecia on for the year ended December 31, 2019.
b. Prepare the entry to record revised deprecia on for the year ended December 31, 2020.
EXERCISE 8–9
(LO5)
As part of its December 31, 2019 year end procedures, Beltore Inc. is evalua ng its assets for
impairment. It has recorded no impairment losses for previous years. Following is the Property,
Plant and Equipment schedule showing adjusted balances as at December 31, 2019:
Date of
Deprecia on
Es mated
Es mated
Accumulated
Recoverable
Asset
Purchase
Method
Cost
Residual
Useful life
Deprecia on
Amount
Land
Sept. 1/2018
N/A
$100,000
N/A
N/A
N/A
$115,000
Building
Dec. 1/2018
SL
890,000
$250,000
20
$34,667
870,000
Machinery
Dec. 1/2018
SL
400,000
150,000
10
27,083
350,000
DDB = Double-declining-balance; SL = Straight-line; U = Units-of-produc on; N/A = Not applica-
ble
Required:
a. Record any impairment losses at December 31, 2019.

332
Long-lived Assets
b. Record deprecia on expense for the year ended December 31, 2020 assuming no changes
in the es mated residual values or es mated useful lives of the assets.
EXERCISE 8–10
(LO6)
Freeman Inc. purchased a piece of agricultural land several years ago for $125,000. The land has
a fair value of $200,000 now. The company plans to exchange this land for equipment owned by
a land developer that has a fair value of $240,000. The equipment was originally purchased for
$325,000, and $80,000 of deprecia on has been recorded to the date of the exchange.
Required:
a. Prepare the journal entry on the books of
i. Freeman
ii. the developer.
b. Why would the developer give up an asset with a fair value of $240,000 in exchange for an
asset with a fair value of only $200,000?
EXERCISE 8–11
(LO6)
Mayr Inc. showed the following selected adjusted trial balance informa on at June 30, 2019:
Debits
Credits
Equipment
$60,000
Accumulated Deprecia on – Equipment
$40,000
Required: Mayr Inc. is planning on selling the equipment. Using the informa on provided above,
prepare the journal entry to record the sale assuming
a. The equipment was sold for $20,000.
b. The equipment was sold for $30,000.
c. The equipment was sold for $5,000.
EXERCISE 8–12
(LO7)

Exercises
333
On March 1, 2019, Willis Publishing purchased the copyright from the author of a new book for
cash of $50,000. It is expected that the book will have a shelf life of about 5 years with no expected
residual value. On October 1, 2021, Willis sold the copyright to a movie producer for $100,000.
Willis Publishing uses the straight-line method to amor ze copyrights.
Required: Prepare Willis Publishing’s journal entries at
a. March 1, 2019 to record the purchase of the copyright.
b. December 31, 2019, Willis’s year-end, to record amor za on of the copyright.
c. October 1, 2021.

334
Long-lived Assets
Problems
PROBLEM 8–1
(LO1)
Arrow Construc on Company Ltd. purchased a farm from K. Jones. Arrow and Jones completed
the transac on under the following terms: a cheque from Arrow to Jones for $140,000; bank loan
assumed by Arrow, $100,000. Legal, accoun ng, and brokerage fees amounted to $20,000.
It was Arrow’s inten on to build homes on the property a er sub-dividing. Crops on the farm were
sold for $6,000; a house, to be moved by the buyer, was sold for $1,600; barns were razed at a
cost of $6,000, while salvaged lumber was sold for $4,400. The property was cleared and levelled
at a cost of $10,000.
The necessary property was turned over to the township for roads, schools, churches, and play-
grounds. Riverside s ll expected to secure a total of 500 iden cal lots from the remaining land.
Required: Prepare a schedule showing the cost to Arrow of the 500 lots.
PROBLEM 8–2
(LO2)
On January 1, 2017, Beyond Adventures Ltd. purchased a safari jeep for use in their wilderness
weekends. The following informa on is available.
Cost
$30,000
Es mated useful life 6 years or 80,000 kms
Residual value
$8,000
Mileage in 2017
15,000 kms
Required:
1. Assuming that the company depreciates on the basis of 50% each in the years of acquisi on
and disposal, calculate the deprecia on for 2018 under each of the methods below. Round
your final answer to nearest whole dollar.
(a) Usage based (Units of Produc on)
(b) Straight-line
(c) Double-declining balance – round percentage to two decimal places.
2. Compare the carrying amount for 2017 under each of these methods.

Problems
335
3. Which of the three methods results in the lowest net income for 2017?
4. Which of the three methods results in the lowest net income for 2018 if 25,000 kms were
driven?
PROBLEM 8–3
(LO2,6)
Janz Corpora on purchased a piece of machinery on January 1, 2019. The company’s year-end is
December 31. The following informa on is available regarding the machinery:
Es mated
Es mated
Deprecia on
Cost
Useful Life
Residual Value
Method
$95,000
9,000 units
$5,000
Units-of-Produc on
Assume actual output was:
Actual Units
Year
Produced
2019
2,000
2020
3,000
2021
2,800
2022
2,900
The machinery was sold on January 15, 2023 for $12,000.
Required:
1. Calculate the deprecia on expense for each of 2019 through to 2022 inclusive.
2. What is the balance of accumulated deprecia on at the end of 2022?
3. What is the carrying amount of the machinery shown on the balance sheet at the end of
2022?
4. Prepare the entry on January 15, 2023 to record the sale of the machinery.
PROBLEM 8–4
(LO1,2,4)
The following are details about an equipment purchase on January 1, 2017:

336
Long-lived Assets
Purchase price
$35,000
Transporta on charges
1.200
Installa on costs
5,700
Minor repair cost
100
Useful life
four years
Residual value
$8,000
Required:
1. Calculate the total cost of the equipment asset.
2. Record the deprecia on for each year of the expected useful life of the machine under
straight-line method and double-declining balance method. Year-end is Dec 31.
3. Assume now that on January 1, 2020, management changed the es mated useful life on
the machine to a total of five years from the date of purchase. Residual value was also
changed to $2,000. Calculate the deprecia on that should be recorded in 2020 and each
year therea er assuming the company used the straight-line method.
Round all final answers to the nearest whole dollar.
PROBLEM 8–5
(LO4,6)
On January 1, 2011, Inceptor Ltd. purchased equipment for $115,000. The es mated useful life
was thirty years. The residual value was es mated to be 15 per cent of the original cost. On
January 1, 2018, experts were hired to review the expected useful life and residual value of the
machine. They determined that the es mated useful life remaining was fi een years and the new
residual value was $18,000.
Deprecia on has not yet been recorded in 2018. The company uses straight-line method of de-
precia on and the policy is to depreciate 50% each in the years of acquisi on and disposal.
Required:
1. Calculate the carrying amount of the machine at December 31, 2017.
2. Calculate and record the deprecia on expense at December 31, 2018.
3. Record the journal entries if the machine is sold on July 31, 2019 for $80,000.
PROBLEM 8–6
(LO4,6)

Problems
337
On August 1, 2014 Mayfere Co. commenced business and purchased produc on equipment for
$250,000 cash. The equipment had an es mated useful life of eight years, an es mated total
produc on output of 200,000 units, and a residual value of $40,000. The equipment was depre-
ciated using the units-of-produc on method. Actual units of output over three years were: 2014:
11,000; 2015: 25,000; and 2016: 35,000.
On January 1, 2017, the company traded in the original equipment for new produc on equipment.
The company paid and addi onal $30,000 cash for the new equipment. The fair value of the
original equipment was $140,000 at the date of the trade.
Required: Prepare journal entries to record the transac ons for:
1. The equipment purchase
2. Deprecia on for 2014, 2015 and 2016
3. The sale of the equipment
PROBLEM 8–7
(LO7,8,9)
Teldor Ltd. paid $1M cash to purchase the following tangible and intangible assets of Zak Company
on January 1, 2018. The fair values of the assets purchased were:
Land
$150,000
Building
400,000
Patents
200,000
Machinery
150,000
The patents have an es mated useful life of twenty years and are amor zed on a straight-line
basis. They have no residual value. On January 3, 2020, the value of the patents was es mated to
be $165,000.
Required: Record the entries for the following transac ons for Teldor:
1. The $900,000 purchase.
2. The decline in value of the patents at January 3, 2020.
3. The amor za on of the patents at December 31, 2020.
4. Prepare a par al balance sheet for the intangible assets sec on at December 31, 2020 in
good form, with proper disclosures.

338
Long-lived Assets
PROBLEM 8–8
(LO1,2)
Global Flow Inc. purchased a computer on January 1, 2018 for $3,000 cash. It had an es mated
useful life of three years and no residual value. Global Flow made the following changes to the
computer:
Mar 1, 2018
Added storage capacity at a cost of $1,000. This had no effect on residual value
or es mated useful life.
Apr 1, 2019
Added a new processing board for $2,000, which extended the es mated useful
life of the computer another three years but did not affect residual value.
Required:
1. Prepare a journal entry to record each of the above expenditures. Assume all amounts are
material. Descrip ons are not necessary.
2. Calculate and prepare journal entries to record deprecia on expense for 2018 and 2019
using the double-declining balance method. Assume a December 31 fiscal year-end and
that the company depreciates 50% each in the acquisi on and disposal years.

Chapter 9
Debt Financing: Current and Long-term Liabili es
A corpora on o en has liabili es. These liabili es must be classified on the balance sheet as
current or long-term. Current liabili es can include known liabili es such as payroll liabili es,
interest payable, and other accrued liabili es. Short-term notes payable and es mated liabili es,
including warran es and income taxes, are also classified as current. Long-term debt is used to
finance opera ons and may include a bond issue or long-term bank loan.
Chapter 9 Learning Objec ves
LO1 – Iden fy and explain current versus long-term liabili es.
LO2 – Record and disclose known current liabili es.
LO3 – Record and disclose es mated current liabili es.
LO4 – Iden fy, describe, and record bonds.
LO5 – Explain, calculate, and record long-term loans.
Concept Self-Check
Use the following as a self-check while working through Chapter
1. What is the difference between a current and long-term liability?
2. What are some examples of known current liabili es?
3. How are known current liabili es different from es mated current liabili es?
4. What are some examples of es mated current liabili es?
5. How is an es mated current liability different from a con ngent liability?
6. What are bonds, and what rights are a ached to bond cer ficates?
7. What are some characteris cs of bonds?
8. When a bond is issued at a premium, is the market interest rate higher or lower than the
contract interest rate on the bond?
339

340
Debt Financing: Current and Long-term Liabili es
9. When a bond is issued at a discount, is the market interest rate higher or lower than the
contract interest rate on the bond?
10. How are bonds and related premiums or discounts recorded in the accoun ng records and
disclosed on the balance sheet?
11. How is a loan payable similar to a bond issue? How is it different?
12. How are payments on a loan recorded, and how is a loan payable presented on the balance
sheet?
NOTE: The purpose of these ques ons is to prepare you for the concepts introduced in the chap-
ter. Your goal should be to answer each of these ques ons as you read through the chapter. If,
when you complete the chapter, you are unable to answer one or more the Concept Self-Check
ques ons, go back through the content to find the answer(s). Solu ons are not provided to these
ques ons.
9.1 Current versus Long-term Liabili es
LO1 – Iden fy
and
explain
current
ver-
sus
long-term
liabili es.
Current or short-term liabili es are a form of debt that is expected to be
paid within the longer of one year of the balance sheet date or one oper-
a ng cycle. Examples include accounts payable, wages or salaries payable,
unearned revenues, short-term notes payable, and the current por on of
long-term debt.
Long-term liabili es are forms of debt expected to be paid beyond one
year of the balance sheet date or the next opera ng cycle, whichever is
longer. Mortgages, long-term bank loans, and bonds payable are examples
of long-term liabili es.
Current and long-term liabili es must be shown separately on the balance sheet. For example,
assume the following adjusted trial balance at December 31, 2015 for Waterton Inc.:
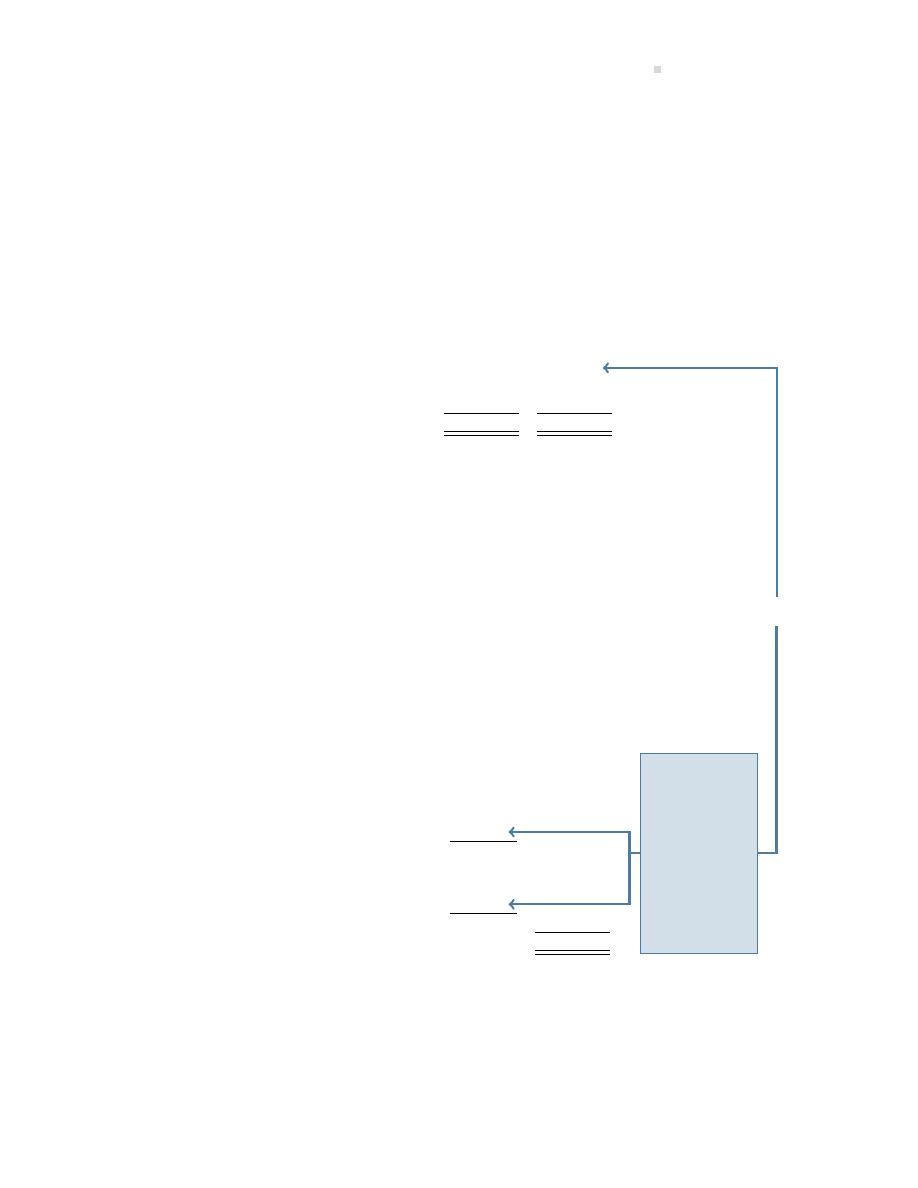
9.1. Current versus Long-term Liabili es
341
Waterton Inc.
Adjusted Trial Balance
December 31, 2015
Account
Debits
Credits
Cash
$ 80,000
Accounts receivable
140,000
Equipment
570,000
Accumulated deprecia on – equipment
$ 40,000
Accounts payable
39,000
Unearned revenue
15,000
Wages payable
7,000
Notes payable, due November 30, 2016
20,000
Notes payable, due March 31, 2018
75,000
Mortgage payable (Note 1)
115,797
Share capital
300,000
Retained earnings
178,203
$790,000
$790,000
Note 1: A 4-year, 6%, $150,000 mortgage was dated January 1, 2015. Waterton makes
monthly payments of $3,523. The principal balances at the end of each year are:
December 31, 2015
–
$
115,797
December 31, 2016
–
$
79,484
December 31, 2017
–
$
40,931
December 31, 2018
–
$
-0-
Based on this informa on, the liabili es sec on of the December 31, 2015 balance sheet would
appear as follows:
Waterton Inc.
Liabili es Sec on of the Balance Sheet
December 31, 2015
Liabili es
Current liabili es
Accounts payable
$39,000
Unearned revenues
15,000
Wages payable
7,000
Notes payable, due November 30, 2016
20,000
Current por on of mortgage payable
36,313
Total current liabili es
$117,313
Long-term liabili es
Notes payable, due March 31, 2018
$75,000
Mortgage payable (less current por on)
79,484
Total long-term liabili es
154,484
Total liabili es
$271,797
No ce the sum
of the cur-
rent and long-
term por on
of the mort-
gage equals
the unadjusted
balance of
$115,797 on
the Adjusted
Trial Balance.
This must al-
ways be the
case.
The $20,000 notes payable, due November 30, 2016 is a current liability because its maturity date
is within one year of the balance sheet date, a characteris c of a current liability. The $75,000
notes payable, due March 31, 2018 is a long-term liability since it is to be repaid beyond one year
of the balance sheet date.
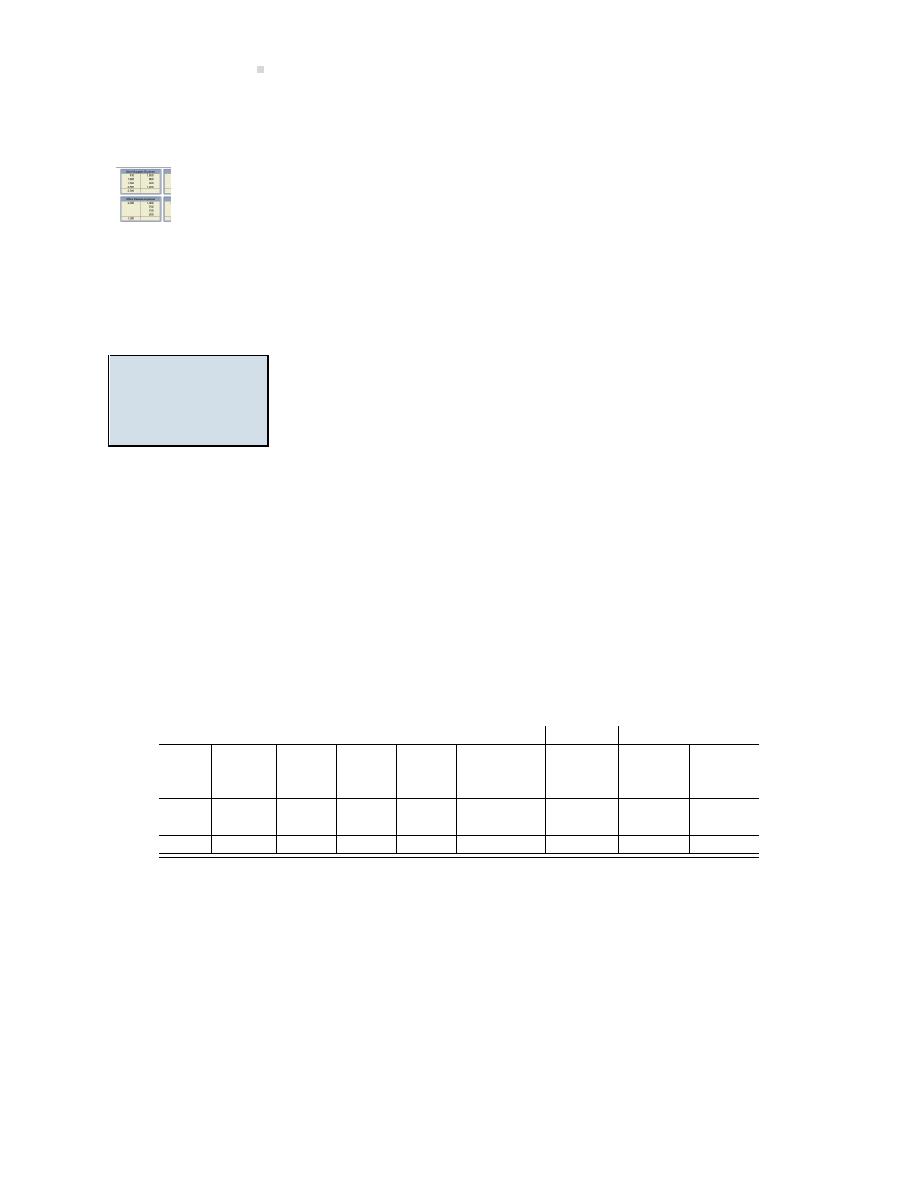
342
Debt Financing: Current and Long-term Liabili es
It is important to classify liabili es correctly otherwise decision makers may make incorrect con-
clusions regarding, for example, the organiza on’s liquidity posi on.
An explora on is available on the Lyryx site. Log into your Lyryx course to run
Current and Long-Term Liabili es
9.2 Known Current Liabili es
LO2
–
Record
and
disclose
known
current
liabili es.
Known current liabili es are those where the payee, amount, and m-
ing of payment are known. Examples include accounts payable, unearned
revenues, and payroll liabili es. These are different from es mated cur-
rent liabili es where the amount is not known and must be es mated.
Es mated current liabili es are discussed later in this chapter.
Payroll Liabili es
Accounts payable and unearned revenues were introduced and discussed in previous chapters.
Payroll liabili es are amounts owing to employees. Employee income taxes, Canada Pension Plan
(CPP, or Quebec Pension Plan in Quebec), Employment Insurance (EI), union dues, health insur-
ance, and other amounts are deducted by the employer from an employee’s salary or wages.
These withheld amounts are remi ed by the employer to the appropriate agencies. An employee’s
gross earnings, less the deduc ons withheld by the employer, equals the net pay. To demonstrate
the journal entries to record a business’s payroll liabili es for its two employees, assume the fol-
lowing payroll record:
Deduc ons
Payment
Distribu on
Sales
Office
Income
Health
Union
Total
Salaries
Salaries
EI
Taxes
Ins.
CPP
Dues
Deduc ons
Net Pay
Expense
Expense
25.84
285.00
55.00
62.16
105.00
533.00
1,027.00
1,560.00
16.50
114.00
55.00
51.50
75.00
312.00
663.00
975.00
42.34
399.00
110.00
113.66
180.00
845.00
1,690.00
1,560.00
975.00
The employer’s journal entries would be:
9.2. Known Current Liabili es
343
General Journal
Date
Account/Explana on
PR
Debit
Credit
Sales Salaries Expense . . . . . . . . . . . . . . . . . .
1,560.00
Office Salaries Expense . . . . . . . . . . . . . . . . .
975.00
EI Payable . . . . . . . . . . . . . . . . . . . . . . . . . .
42.34
Employee Income Taxes Payable . . . . . .
399.00
Employee Health Insurance Payable . .
110.00
CPP Payable . . . . . . . . . . . . . . . . . . . . . . . .
113.66
Employee Union Dues Payable . . . . . . .
180.00
Salaries Payable . . . . . . . . . . . . . . . . . . . .
1,690.00
To record payroll.
General Journal
Date
Account/Explana on
PR
Debit
Credit
EI Expense . . . . . . . . . . . . . . . . . . . . . . . . . . . .
59.28
CPP Expense . . . . . . . . . . . . . . . . . . . . . . . . . . .
113.66
EI Payable . . . . . . . . . . . . . . . . . . . . . . . . . .
59.28
CPP Payable . . . . . . . . . . . . . . . . . . . . . . . .
113.66
To record the employer’s por ons of EI
and CPP calculated as 1.4 mes (42.34 x
1.4) and 1 mes (113.66 x 1) the employ-
ees’ por on.
For EI and CPP, both the employee and employer are responsible for making payments to the
government. At the me of wri ng, the employer’s por on of EI was calculated as 1.4 mes
the employee’s EI amount. For CPP, the employer is required to pay the same amount as the
employee. EI, CPP, and federal/provincial income tax amounts payable are based on rates applied
to an employee’s gross earnings. The rates are subject to change each tax year. The actual rates
for EI, CPP, and federal/provincial income tax can be viewed online at Canada Revenue Agency’s
website:
.
Sales Taxes
Sales taxes are also classified as known current liabili es. There are two types of sales taxes in
Canada: federal Goods and Services Tax (GST) and Provincial Sales Tax (PST). The Goods and Ser-
vices Tax (GST) is calculated as 5% of the selling price of taxable supplies. For example, if a business
is purchasing supplies with a selling price of $1,000, the GST is $50 (calculated as $1,000 x 5%).
Taxable supplies are the goods or services on which GST applies. GST is not applied to zero-rated
supplies (prescrip on drugs, groceries, and medical supplies) or exempt supplies (services such
as educa on, health care, and financial). Sellers of taxable supplies are registrants, businesses
registered with Canada Revenue Agency that sell taxable supplies and collect GST on behalf of the
Receiver General for Canada. The Receiver General for Canada is the federal government body to
which all taxes, including federal income tax, are remi ed. Registrants also pay GST on the pur-
chase of taxable supplies recording an input tax credit for the GST paid. Total input tax credits, or
GST receivable, less GST payable is the amount to be remi ed/refunded.

344
Debt Financing: Current and Long-term Liabili es
Provincial Sales Tax (PST) is the provincial sales tax paid by the final consumers of products. The
PST rate is determined provincially. PST is calculated as a percentage of the selling price. Quebec’s
equivalent to PST is called the Quebec Sales Tax (QST).
The Harmonized Sales Tax (HST) is a combina on of GST and PST that is used in some Canadian
jurisdic ons. Figure
summarizes sales taxes across Canada.
GST PST
QST
HST
Alberta
5%
-
-
-
Bri sh Columbia
5%
7%
-
-
Manitoba
5%
7%
-
-
Northwest Territories
5%
-
-
-
Nunavut
5%
-
-
-
Saskatchewan
5%
5%
-
-
Yukon
5%
-
-
-
Quebec
5%
-
9.975%
-
Newfoundland and Labrador
-
-
-
13%
New Brunswick
-
-
-
13%
Nova Sco a
-
-
-
15%
Ontario
-
-
-
13%
Prince Edward Island
-
-
-
14%
Figure 9.1: Sales Taxes in Canada
To demonstrate how sales taxes are recorded, let us review an example. Assume Perry Sales, out
of Saskatchewan, purchased $2,400 of merchandise inventory on account from a supplier, Carmen
Inc., also in Saskatchewan. Perry Sales then sold this merchandise inventory to a customer for cash
of $3,600. Perry Sales’ entries for the purchase, subsequent sale of merchandise, and remi ance
of sales taxes are:
1
These were the sales tax rates in effect at the me of wri ng, July 2014.

9.2. Known Current Liabili es
345
M
erchandise Inventory. . . . . . . . . . .
2,400.00
GST Receivable . . . . . . . . . . . . . . . . . .
120.00
Accounts Payable – Carmen Inc.
2,520.00
T
o record purchase of merchandise inventory on account.
C
ash . . . . . . . . . . . . . . . . . . . . . . . . . . .
3,960.00
Sales . . . . . . . . . . . . . . . . . . . . . . . .
3,600.00
PST Payable . . . . . . . . . . . . . . . . . .
180.00
GST Payable . . . . . . . . . . . . . . . . . .
180.00
To record cash sale.
Cost of Goods Sold . . . . . . . . . . . . . .
2,400.00
Merchandise Inventory . . . . . . . .
2,400.00
T
o record the cost of the sale.
P
ST Payable . . . . . . . . . . . . . . . . . . . . .
180.00
GST Payable . . . . . . . . . . . . . . . . . . . . .
180.00
GST Receivable . . . . . . . . . . . . . . .
120.00
Cash . . . . . . . . . . . . . . . . . . . . . . . . .
240.00
T
o record remi ance of sales taxes.
GST receivable is deb-
ited. Because Perry
Sales is a merchandiser
and therefore not the
final consumer, there is
no PST.
The previous $120 debit
to GST receivable plus
the $180 credit to GST
payable in this entry re-
sult in a balance owing
to the government of
$60.
PST and GST are remit-
ted to the appropriate
government authority.
Short-term Notes Payable
Short-term notes receivable were discussed in Chapter
. A short-term note payable is iden cal
to a note receivable except that it is a current liability instead of an asset. In Chapter 7, BDCC’s
customer Bendix Inc. was unable to pay its $5,000 account within the normal 30-day period. The
receivable was converted to a 5%, 60-day note receivable dated December 5, 2015. The following
example contrasts the entries recorded by BDCC for the note receivable to the entries recorded
by Bendix Inc. for its note payable.
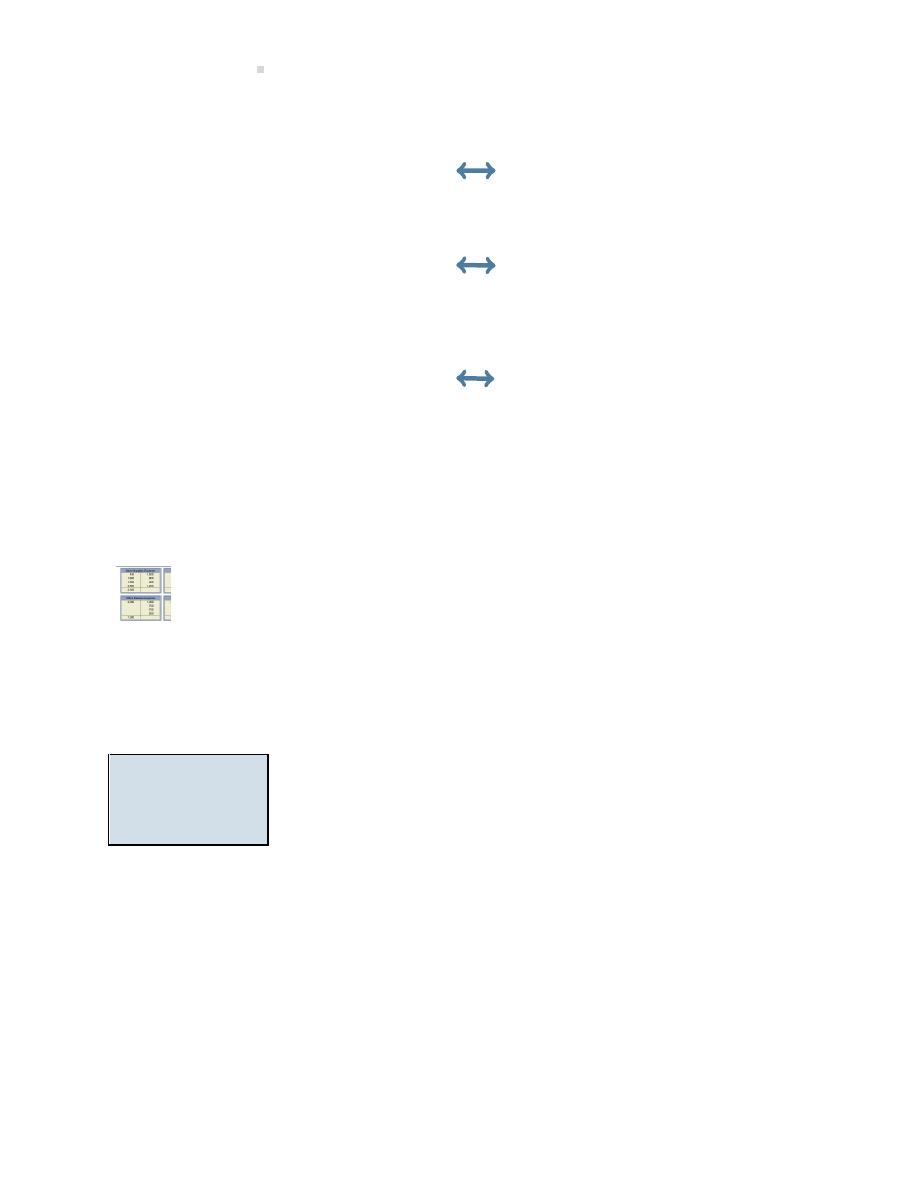
346
Debt Financing: Current and Long-term Liabili es
Entries in BDCC’s records for the note receivable:
Entries in Bendix Inc.’s records for the note payable:
Notes Receivable – Bendix . . . . . . . .
5,000
Accounts Payable – BDCC . . . . . . . . .
5,000
Accounts Receivable – Bendix . .
5,000
Notes Payable
– BDCC . . . . . . . . .
5,000
To record the conversion of a customer’s account to a 5%,
60-day note dated December 5, 2015.
To record the conversion of a supplier’s account to a 5%,
60-day note dated December 5, 2015.
Interest Receivable . . . . . . . . . . . . . .
17.81
Interest Expense . . . . . . . . . . . . . . . . .
17.81
Interest Revenue . . . . . . . . . . . . . .
17.81
Interest Payable
. . . . . . . . . . . . . . .
17.81
To record the adjus ng entry on December 31 to accrue
interest from December 5 to December 31.
To record the adjus ng entry on December 31 to accrue
interest from December 5 to December 31.
Cash . . . . . . . . . . . . . . . . . . . . . . . . . . . 5,041.10
Notes Payable – BDCC . . . . . . . . . . . . 5,000.00
Note Receivable – Bendix . . . . . .
5,000.00
Interest Expense . . . . . . . . . . . . . . . . .
23.29
Interest Receivable . . . . . . . . . . . .
17.81
Interest Payable
. . . . . . . . . . . . . . . . .
17.81
Interest Revenue . . . . . . . . . . . . . .
23.29
Cash . . . . . . . . . . . . . . . . . . . . . . . . .
5,041.10
To record the collec on of the principal and interest at
maturity on February 3, 2016.
To record the payment of the principal and interest at ma-
turity on February 3, 2016.
No ce that the dollar amounts in the entries for BDCC are iden cal to those for Bendix. The dif-
ference is that BDCC is recognizing a receivable from Bendix while Bendix is recognizing a payable
to BDCC.
An explora on is available on the Lyryx site. Log into your Lyryx course to run
Known (Determinable) Liabili es
9.3 Es mated Current Liabili es
LO3
–
Record
and disclose es-
mated current
liabili es.
An es mated liability is known to exist where the amount, although un-
certain, can be es mated. Two common examples of es mated liabili es
are warran es and income taxes.
Warranty Liabili es
A warranty is an obliga on incurred by the seller of a product or service to replace or repair de-
fects. Warran es typically apply for a limited period of me. For example, appliances are o en
sold with a warranty for a specific me period. The seller does not know which product/service
will require warranty work, when it might occur, or the amount. To match the warranty expense
to the period in which the revenue was realized, the following entry that es mates the amount of
warranty expense and related liability must be recorded:
9.3. Es mated Current Liabili es
347
General Journal
Date
Account/Explana on
PR
Debit
Credit
Warranty Expense . . . . . . . . . . . . . . . . . . . . . .
XXX
Es mated Warranty Liability . . . . . . . . .
XXX
To record es mated warranty expense
and related liability.
When the warranty work is actually performed, assuming both parts and labour, the following is
recorded:
General Journal
Date
Account/Explana on
PR
Debit
Credit
Es mated Warranty Liability . . . . . . . . . . . .
XXX
Parts Inventory . . . . . . . . . . . . . . . . . . . . .
XXX
Wages Payable . . . . . . . . . . . . . . . . . . . . .
XXX
To record the actual costs of parts and
labour for warranty work.
An explora on is available on the Lyryx site. Log into your Lyryx course to run
.
Income Tax Liabili es
A corpora on is taxed on the taxable income it earns. As for any en ty, corpora ons must file a
tax return annually. However, the government typically requires the corpora on to make advance
monthly payments based on an es mated amount. When the total actual amount of income
tax is known at the end of the accoun ng period, the corpora on will record an adjustment to
reconcile any difference between the total actual tax and the total monthly tax accrued in the
accoun ng records. For example, assume it is es mated that the total income tax for the year
ended December 31, 2015 will be $300,000. This translates into $25,000 of income tax to be
accrued at the end of each month ($300,000
÷ 12 months = $25,000/month). Assume further
that the government requires payments to be made by the 15th of the following month. The
entries at the end of each month from January through to November would be:
General Journal
Date
Account/Explana on
PR
Debit
Credit
Income Tax Expense . . . . . . . . . . . . . . . . . . . .
25,000
Income Tax Payable . . . . . . . . . . . . . . . . .
25,000
To record es mated income tax expense.
On the 15th of each month beginning February 15th to December 15th, the following entry would
be recorded:
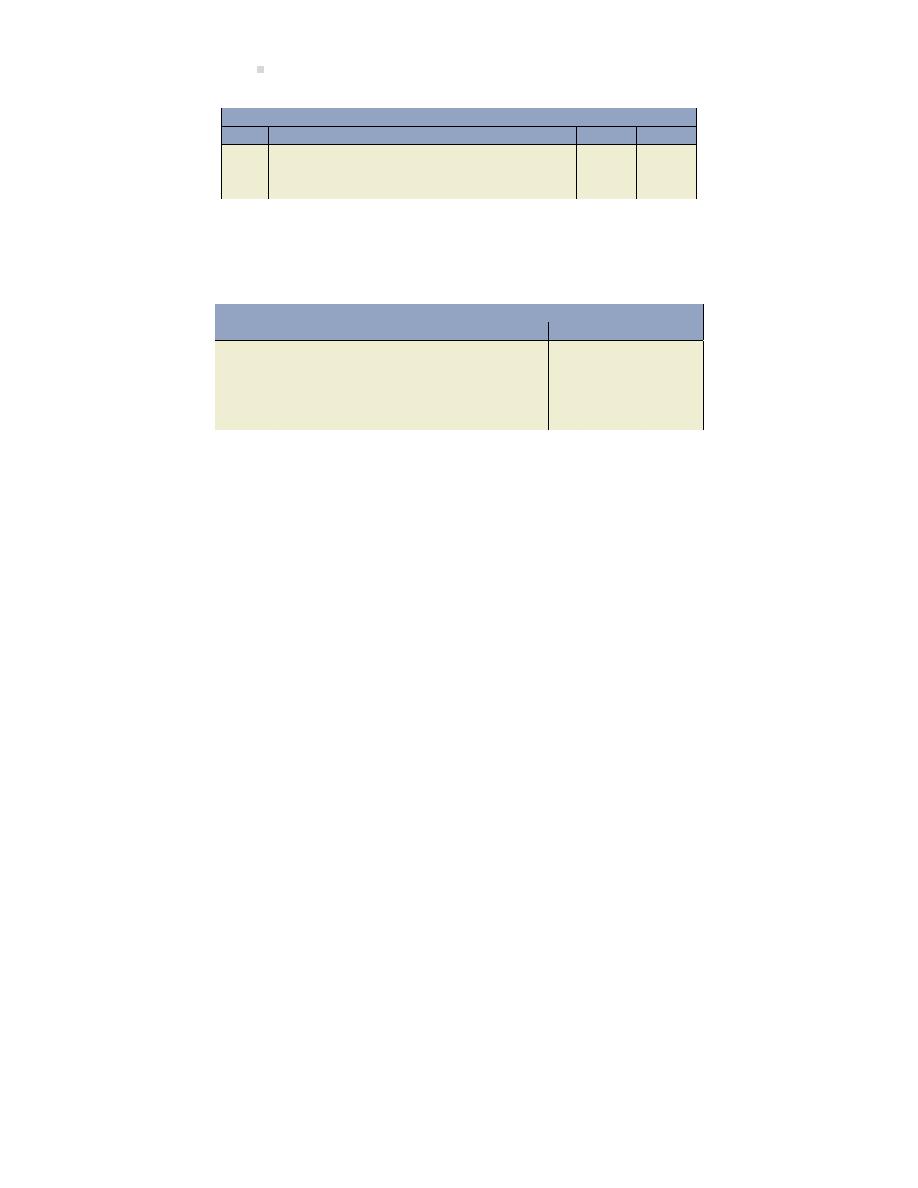
348
Debt Financing: Current and Long-term Liabili es
General Journal
Date
Account/Explana on
PR
Debit
Credit
Income Tax Payable . . . . . . . . . . . . . . . . . . . .
25,000
Cash . . . . . . . . . . . . . . . . . . . . . . . . . . . . . . .
25,000
To record payment of income tax.
Assume that at the end of December, the corpora on’s actual income tax was determined to be
$297,000 instead of the originally es mated $300,000. The entry at December 31 would be:
General Journal
Date
Account/Explana on
PR
Debit
Credit
Dec 31
Income Tax Expense . . . . . . . . . . . . . . . . . . . .
22,000
Income Tax Payable . . . . . . . . . . . . . . . . .
22,000
To report income tax expense; ($25,000
x 11 months = $275,000; $297,000 -
$275,000 = $22,000).
Con ngent Liabili es
Recall that an es mated liability is recorded when the liability is probable and the amount can be
reliably es mated. A con ngent liability exists when one of the following two criteria are sa sfied:
1. it is not probable or
2. it cannot be reliably es mated.
A liability that is determined to be con ngent is not recorded, rather it is disclosed in the notes to
the financial statements except when there is a remote likelihood of its existence. An example of
a con ngent liability is a lawsuit where it is probable there will be a loss but the amount cannot
be reliably determined. A brief descrip on of the lawsuit must be disclosed in the notes to the
financial statements; it would not be recorded un l the amount of the loss could be reliably es -
mated. Great care must be taken with con ngencies — if an organiza on inten onally withholds
informa on, it could cause decision makers, such as investors, to make decisions they would not
otherwise have made.
Con ngent assets, on the other hand, are not recorded un l actually realized. If a con ngent asset
is probable, it is disclosed in the notes to the financial statements.

9.4. Long-Term Liabili es—Bonds Payable
349
9.4 Long-Term Liabili es—Bonds Payable
LO4 – Iden fy,
describe,
and
record bonds.
Corpora ons generally acquire long-lived assets like property, plant, and
equipment through the issue of shares or long-term debt that is repayable
over many years. Chapter
addresses the ways in which a corpora on
can raise funds by issuing shares, known as equity financing. This chapter
discusses corporate financing by means of issuing long-term debt, known
as debt financing. Types of long-term debt are typically classified accord-
ing to their means of repayment.
1. Bonds pay only interest at regular intervals to investors. The original investment is repaid
to bondholders when the bond matures (or comes due), usually a er a number of years.
Bonds are generally issued to many individual investors.
2. Loans are repaid in equal payments on a regular basis. The payments represent both interest
and principal paid to creditors. Such payments are said to be blended. That is, each payment
contains repayment of a certain amount of the original amount of the loan (the principal),
as well as interest on the remaining principal balance.
Bonds are discussed in this sec on. Loans are expanded upon in the next sec on. Other types of
debt, such as leases, are le for study in a more advanced accoun ng textbook.
Rights of Bondholders
As noted above, a bond is a debt instrument, generally issued to many investors, that requires fu-
ture repayment of the original amount at a fixed date, as well as periodic interest payments during
the intervening period. A contract called a bond indenture is prepared between the corpora on
and the future bondholders. It specifies the terms with which the corpora on will comply, such as
how much interest will be paid and when. Another of these terms may be a restric on on further
borrowing by the corpora on in the future. A trustee is appointed to be an intermediary between
the corpora on and the bondholder. The trustee administers the terms of the indenture.
Ownership of a bond cer ficate carries with it certain rights. These rights are printed on the actual
cer ficate and vary among bond issues. The various characteris cs applicable to bond issues are
the subject of more advanced courses in finance and are not covered here. However, individual
bondholders always acquire two rights.
1. The right to receive the face value of the bond at a specified date in the future, called the
maturity date.
2. The right to receive periodic interest payments at a specified percent of the bond’s face
value.

350
Debt Financing: Current and Long-term Liabili es
Bond Authoriza on
Every corpora on is legally required to follow a well-defined sequence in authorizing a bond issue.
The bond issue is presented to the board of directors by management and must be approved by
shareholders. Legal requirements must be followed and disclosure in the financial statements of
the corpora on is required.
Shareholder approval is an important step because bondholders are creditors with a prior claim
on the corpora on’s assets if liquida on occurs. Further, dividend distribu ons may be restricted
during the life of the bonds, and those shareholders affected usually need to approve this. These
restric ons are typically reported to the reader of financial statements through note disclosure.
Assume that Big Dog Carworks Corp. decides to issue $30 million of 12% bonds to finance its
expansion. The bonds are repayable three years from the date of issue, January 1, 2015. The
amount of authorized bonds, their interest rate, and their maturity date can be shown in the
accounts as follows:
GENERAL LEDGER
Bonds Payable –
Long-Term
Due Jan. 1, 2018
Acct. No. 272
Date
Descrip on
Debit
Credit
DR/CR
Balance
2015
Jan.
1
Authorized to issue $30,000,000
of 12%, 3-year bonds, due
January 1, 2018.
Bonds in the Financial Statement
Each bond issue is disclosed separately in the notes to the financial statements because each issue
may have different characteris cs. The descrip ve informa on disclosed to readers of financial
statements includes the interest rate and maturity date of the bond issue. Also disclosed in a note
are any restric ons imposed on the corpora on’s ac vi es by the terms of the bond indenture
and the assets pledged, if any.
Other Issues Related to Bond Financing
There are several addi onal considera ons related to the issue of bonds.
1. Cash Required in the Immediate and the Foreseeable Future
Most bond issues are sold in their en rety when market condi ons are favourable. However,
more bonds can be authorized in a par cular bond issue than will be immediately sold.
Authorized bonds can be issued whenever cash is required.

9.4. Long-Term Liabili es—Bonds Payable
351
2. Time Periods Associated with Bonds
The interest rate of bonds is associated with me, their maturity date is based on me,
and other provisions — such as conver bility into share capital and restric ons on future
dividend distribu ons of the corpora on — are typically ac vated at a given point in me.
These must also be considered, as the success of a bond issue o en depends on the proper
combina on of these and other similar features.
3. Assets of the Corpora on to Be Pledged
Whether or not long-lived assets like property, plant, and equipment are pledged as secu-
rity is an important considera on for bondholders because doing so helps to safeguard their
investments. This decision is also important to the corpora on because pledging all these
assets may restrict future borrowings. The total amount of authorized bonds is usually a
frac on of the pledged assets, such as 50%. The difference represents a margin of safety to
bondholders. The value of these assets can shrink substan ally but s ll permit reimburse-
ment of bondholders should the company be unable to pay the bond interest or principal,
and need to sell the pledged assets.
Bond Characteris cs
Each corpora on issuing bonds has unique financing needs and a empts to sa sfy various bor-
rowing situa ons and investor preferences. Many types of bonds have been created to meet these
varying needs.
Secured bonds are backed by physical assets of the corpora on. These are usually long-lived
assets. When real property is legally pledged as security for the bonds, they are called mortgage
bonds.
Unsecured bonds are commonly referred to as debentures. A debenture is a formal document
sta ng that a company is liable to pay a specified amount with interest. The debt is not backed by
any collateral. As such, debentures are usually only issued by large, well-established companies.
Debenture holders are ordinary creditors of the corpora on. These bonds usually command a
higher interest rate because of the added risk for investors.
Registered bonds require the name and address of the owner to be recorded by the corpora on
or its trustee. The tle to bearer bonds passes on delivery of the bonds to new owners and is not
tracked. Payment of interest is made when the bearer clips coupons a ached to the bond and
presents these for payment. Bearer bonds are becoming increasingly rare.
When serial bonds are issued, the bonds have differing maturity dates, as indicated on the bond
contract. Investors are able to choose bonds with a term that agrees with their investment plans.
For example, in a $30 million serial bond issue, $10 million worth of the bonds may mature each
year for three years.
The issue of bonds with a call provision permits the issuing corpora on to redeem, or call, the
bonds before their maturity date. The bond indenture usually indicates the price at which bonds
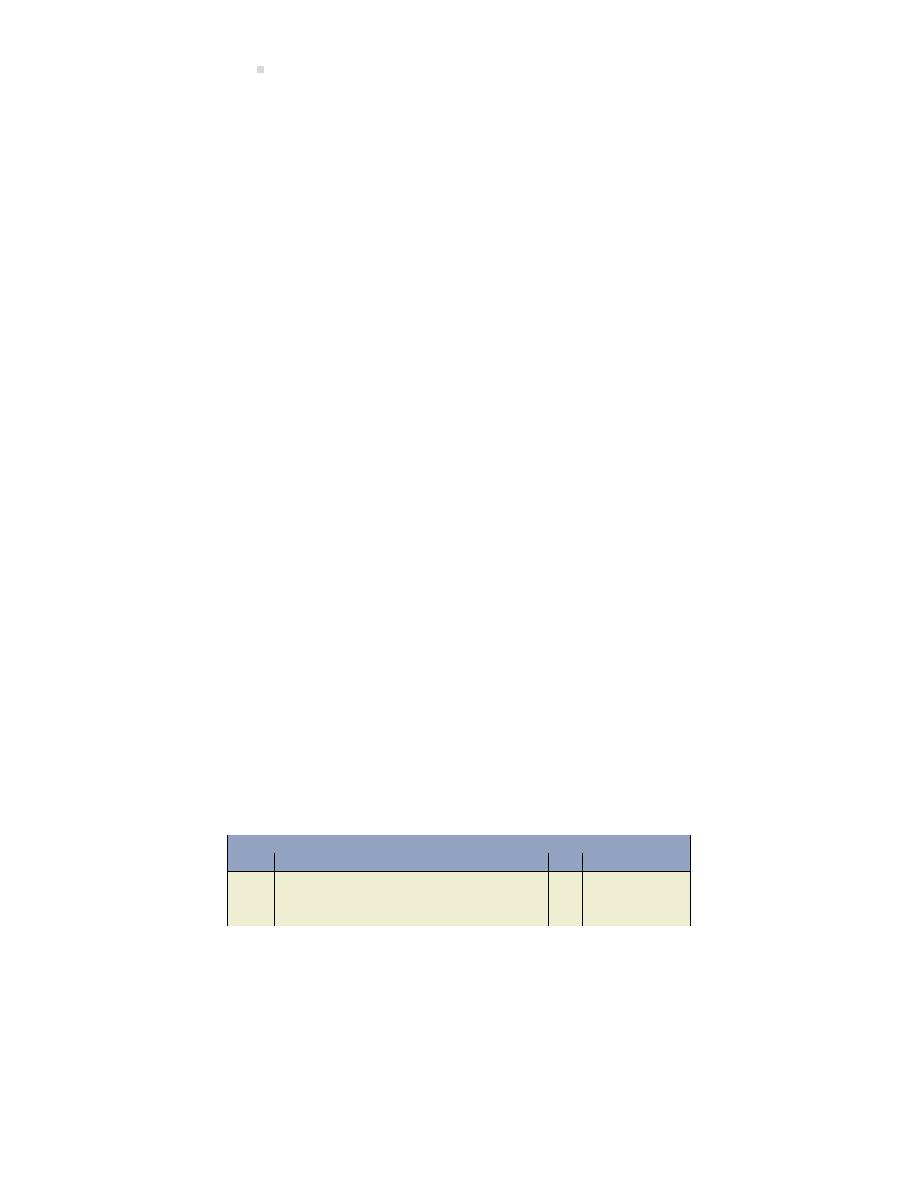
352
Debt Financing: Current and Long-term Liabili es
are callable. Corporate bond issuers are thereby protected in the event that market interest rates
decline below the bond contract interest rate. The higher interest rate bonds can be called to be
replaced by bonds bearing a lower interest rate.
Some bonds allow the bondholder to exchange bonds for a specified type and amount of the
corpora on’s share capital. Bonds with this feature are called conver ble bonds. This feature
permits bondholders to enjoy the security of being creditors while having the op on to become
shareholders if the corpora on is successful.
When sinking fund bonds are issued, the corpora on is required to deposit funds at regular in-
tervals with a trustee. This feature ensures the availability of adequate cash for the redemp on
of the bonds at maturity. The fund is called “sinking” because the transferred assets are ed up
or “sunk,” and cannot be used for any purpose other than the redemp on of the bonds.
The corpora on issuing bonds may be required to restrict its retained earnings. The restric on of
dividends means that dividends declared cannot exceed a specified balance in retained earnings.
This protects bondholders by limi ng the amount of dividends that can be paid.
Investors consider the interest rates of bonds as well as the quality of the assets, if any, that are
pledged as security. The other provisions in a bond contract are of limited or no value if the issuing
corpora on is in financial difficul es. A corpora on in such difficul es may not be able to sell its
bonds, regardless of the a rac ve provisions a ached to them.
Recording the Issuance of Bonds at Face Value (at Par)
Each bond has an amount printed on the face of the bond cer ficate. This is called the face value
of the bond; it is also referred to as the par-value of the bond. When the cash received is the
same as a bond’s face value, the bond is said to be issued at par. A common face value of bonds
is $1,000, although bonds of other denomina ons exist. A $30 million bond issue can be divided
into 30,000 bonds, for example. This permits a large number of individuals and ins tu ons to
par cipate in corporate financing.
If a bond is sold at face value, the journal entry is:
General Journal
Date
Account/Explana on
PR
Debit
Credit
Cash . . . . . . . . . . . . . . . . . . . . . . . . . . . . . . . . . .
1,000
Bonds Payable . . . . . . . . . . . . . . . . . . . . . .
1,000
To record the issue of 8% bonds at par.
Recording the Issuance of Bonds at a Premium
A $1,000 bond is sold at a premium when it is sold for more than its face value. This results
when the bond interest rate is higher than the market interest rate. For instance, assume Big Dog
Carworks Corp. issues a bond on January 1, 2015 with a face value of $1,000, a maturity date of
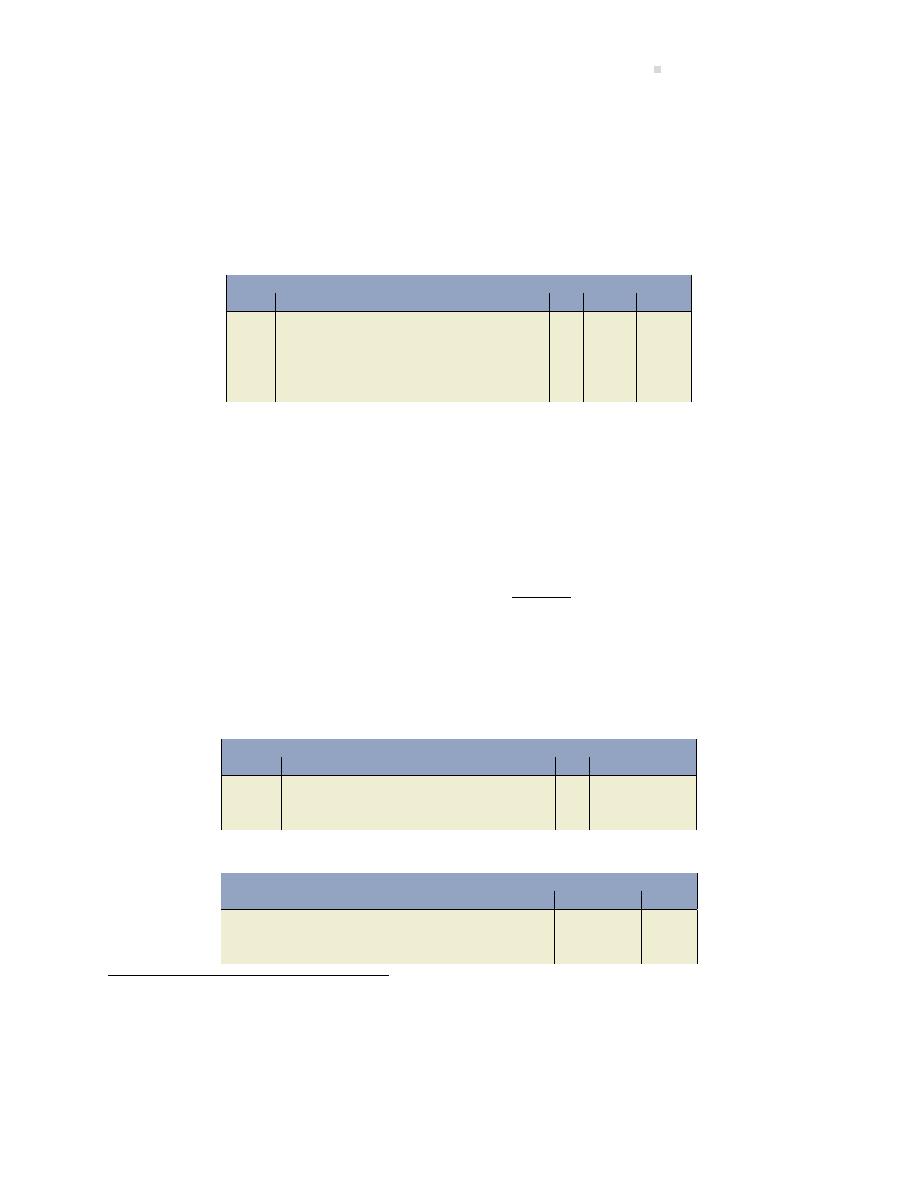
9.4. Long-Term Liabili es—Bonds Payable
353
one year, and a stated or contract interest rate of 8% per year, at a me when the market interest
rate is 7%. Poten al investors will bid up the bond price to $1,009.34 based on present value
calcula ons where FV = $1,000; PMT = $80; i = 7 (the market rate); and n = 1.
We will round the
$1,009.34 to $1,009 to simplify the demonstra on.
The premium is the $9 difference between the $1,009 selling price of the bond and the $1,000
face value. The journal entry to record the sale of the bond on January 1, 2015 is:
General Journal
Date
Account/Explana on
PR
Debit
Credit
Jan 1
Cash . . . . . . . . . . . . . . . . . . . . . . . . . . . . . . . . . .
1,009
Bonds Payable . . . . . . . . . . . . . . . . . . . . . .
1,000
Premium on Bonds Payable . . . . . . . . . .
9
To record the issue of 8% bonds at a pre-
mium.
The Premium on Bonds Payable account is a contra liability account that is added to the value of
the bonds on the balance sheet. Because the bonds mature in one year, the bond appears in the
current liabili es sec on of the balance sheet as follows:
Liabili es
Current
Bonds payable
$1,000
Add: Premium on bonds payable
9
$1,009
On the maturity date of December 31, 2015, the interest expense of $80 is paid, bondholders are
repaid, and the premium is wri en off as a reduc on of interest expense.
These three journal entries would be made:
General Journal
Date
Account/Explana on
PR
Debit
Credit
Dec 31
Interest Expense . . . . . . . . . . . . . . . . . . . . . . .
80
Cash . . . . . . . . . . . . . . . . . . . . . . . . . . . . . . .
80
To record interest paid on bonds.
General Journal
Date
Account/Explana on
PR
Debit
Credit
Dec 31
Bonds Payable . . . . . . . . . . . . . . . . . . . . . . . . .
1,000
Cash . . . . . . . . . . . . . . . . . . . . . . . . . . . . . . .
1,000
To record payment of bonds.
2
Present Value (PV) calcula ons can be done using tables or a business calculator. Table values are rounded causing
results to be less accurate. Since business calculators have PV func onality, all PV calcula ons should be done using a
calculator. PV calcula ons are reviewed in Sec on
. Given the variety of calculators on the market, students should
take responsibility for knowing how to do PV calcula ons using their own calculator.
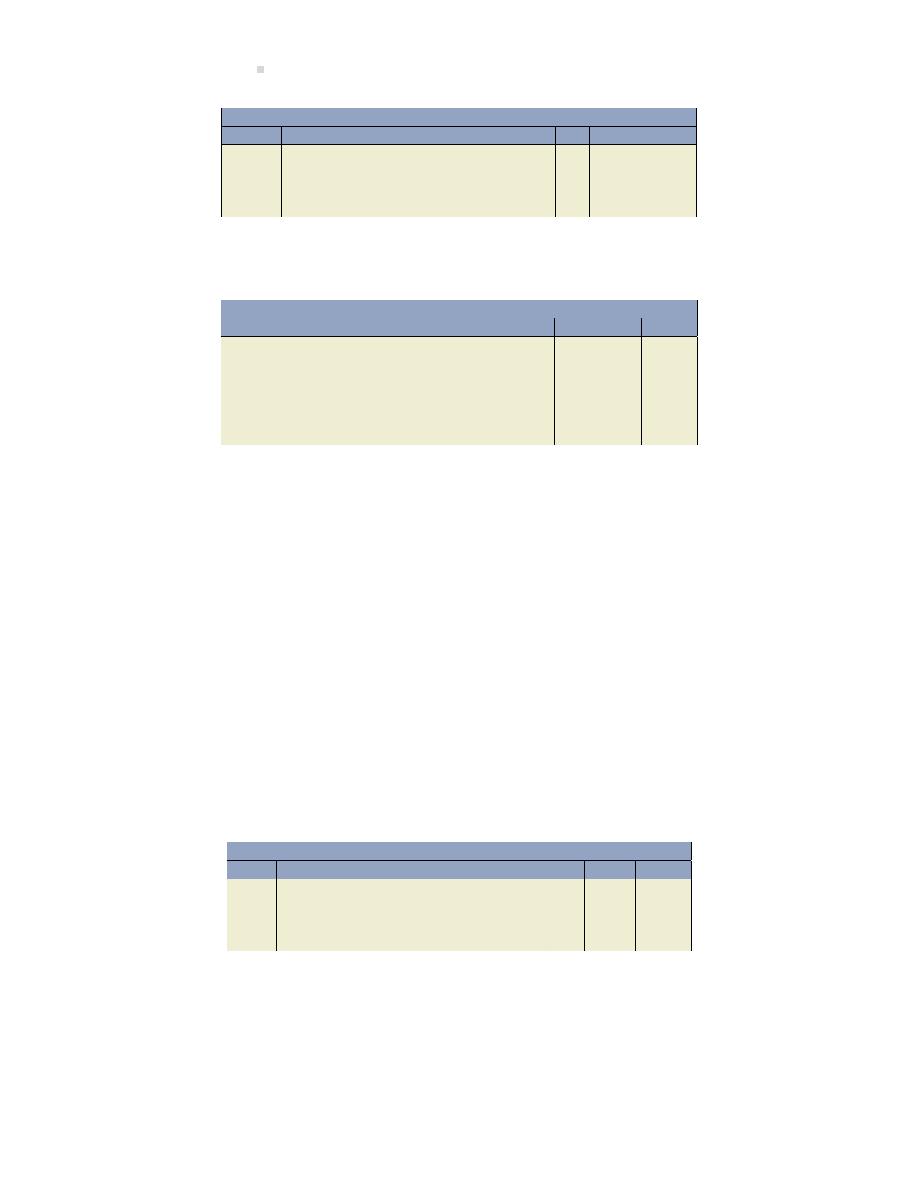
354
Debt Financing: Current and Long-term Liabili es
General Journal
Date
Account/Explana on
PR
Debit
Credit
Dec 31
Premium on Bonds Payable . . . . . . . . . . . . .
9
Interest Expense . . . . . . . . . . . . . . . . . . . .
9
To record write-off of premium against in-
terest.
Alterna vely, a single entry would be preferable as follows:
General Journal
Date
Account/Explana on
PR
Debit
Credit
Dec 31
Interest Expense . . . . . . . . . . . . . . . . . . . . . . .
71
Premium on Bonds Payable . . . . . . . . . . . . .
9
Bonds Payable . . . . . . . . . . . . . . . . . . . . . . . . .
1,000
Cash . . . . . . . . . . . . . . . . . . . . . . . . . . . . . . .
1,080
To record payment of bond and interest
on maturity date.
Note that the interest expense recorded on the income statement would be $71 ($80 – 9). This is
equal to the market rate of interest at the me of bond issue.
Recording the Issuance of Bonds at a Discount
If the bond is sold for less than $1,000, then the bond has been sold at a discount. This results
when the bond interest rate is lower than the market interest rate. To demonstrate the journal
entries, assume a $1,000, one-year, 8% bond is issued by BDCC when the market interest rate is
9%. The selling amount will be $990.83 using PV calcula ons where FV = $1,000; PMT = $80; i = 9
(the market rate); and n = 1. We will round the $990.83 to $991 to simplify the demonstra on.
The difference between the face value of the bond ($1,000) and the selling price of the bond ($991)
is $9. This is the discount.
The journal entry to record the transac on on January 1, 2015 is:
General Journal
Date
Account/Explana on
PR
Debit
Credit
Jan 1
Cash . . . . . . . . . . . . . . . . . . . . . . . . . . . . . . . . . .
991
Discount on Bonds Payable . . . . . . . . . . . . .
9
Bonds Payable . . . . . . . . . . . . . . . . . . . . . .
1,000
To record issue of bonds at a discount.
The $9 amount is a contra liability account and is deducted from the face value of the bonds on
the balance sheet as follows:
9.4. Long-Term Liabili es—Bonds Payable
355
Liabili es
Current
Bonds payable
$1,000
Less: Discount on bonds payable
(9)
$991
On December 31, 2015, when the bonds mature, the following entries would be recorded:
General Journal
Date
Account/Explana on
PR
Debit
Credit
Dec 31
Interest Expense . . . . . . . . . . . . . . . . . . . . . . .
80
Cash . . . . . . . . . . . . . . . . . . . . . . . . . . . . . . .
80
To record interest paid on bonds.
General Journal
Date
Account/Explana on
PR
Debit
Credit
Dec 31
Bonds Payable . . . . . . . . . . . . . . . . . . . . . . . . .
1,000
Cash . . . . . . . . . . . . . . . . . . . . . . . . . . . . . . .
1,000
To record payment of bonds.
General Journal
Date
Account/Explana on
PR
Debit
Credit
Dec 31
Interest Expense . . . . . . . . . . . . . . . . . . . . . . .
9
Discount on Bonds Payable . . . . . . . . . .
9
To record write-off of discount against in-
terest.
Alterna vely, a single entry would be preferable as follows:
General Journal
Date
Account/Explana on
PR
Debit
Credit
Dec 31
Interest Expense . . . . . . . . . . . . . . . . . . . . . . .
89
Bonds Payable . . . . . . . . . . . . . . . . . . . . . . . . .
1,000
Discount on Bonds Payable . . . . . . . . . .
9
Cash . . . . . . . . . . . . . . . . . . . . . . . . . . . . . . .
1,080
To record payment of bond and interest
on maturity date.
The interest expense recorded on the income statement would be $89 ($80 + 9). This is equal to
the market rate of interest at the me of bond issue.
These are simplified examples, and the amounts of bond premiums and discounts in these ex-
amples are insignificant. In reality, bonds may be outstanding for a number of years, and related
premiums and discounts can be substan al when millions of dollars of bonds are issued. These
premiums and discounts are amor zed using the effec ve interest method over the same number
of periods as the related bonds are outstanding. The amor za on of premiums and discounts is
an intermediate financial accoun ng topic and is not covered here.
356
Debt Financing: Current and Long-term Liabili es
Refer to the Appendix Sec on
at the end of this chapter for discussions and illustra ons re-
garding the use of the effec ve interest method for bonds issued at a premium or discount.
Bonds Issued in Between Interest Payments
If investors purchase bonds on dates falling in between the interest payment dates, then the in-
vestor pays an addi onal interest amount. This is because the bond issuer always pays the full six
months interest to the bondholder on the interest payment date because it is the easiest way to
administer mul ple interest payments to poten ally thousands of investors. For example, if an
investor purchases a bond four months a er the last interest payment, then the issuer will add
these addi onal four months of interest to the purchase price. When the next interest payment
date occurs, the issuer pays the full six months interest to the purchaser. The interest amount
paid and received by the bond-holder will net to two months. This makes intui ve sense given
that the bonds have only been held for two months making interest for two months the correct
amount.
For example, on September 1, 2016, an investor purchases at face value, $100,000, 10-year, 8%
bonds with interest payable each May 1 and November 1.
Bond payable
$100,000
Accrued interest (100,000
× 8% × 4 ÷ 12)
2,667
Total cash paid
$102,667
To record the bond issuance on September 1, with four months’ accrued interest:
General Journal
Date
Account/Explana on
PR
Debit
Credit
Sept 1, 2016
Cash . . . . . . . . . . . . . . . . . . . . . . . . . . . . . . . . . .
102,667
Bond payable . . . . . . . . . . . . . . . . . . . . . . .
100,000
Interest payable . . . . . . . . . . . . . . . . . . . .
2,667
To record the first semi-annual interest payment on November 1 and zero out the interest payable:
General Journal
Date
Account/Explana on
PR
Debit
Credit
Nov 1, 2016
Interest payable . . . . . . . . . . . . . . . . . . . . . . .
2,667
Bond interest expense . . . . . . . . . . . . . . . . . .
1,333
Cash ($100,000
× 8% × 6 ÷ 12). . . . . .
4,000
Note that the bond interest on November 1 is for the amount the bondholder is en tled to, which
is two months’ of interest.
The December 31 year-end accrued interest entry:
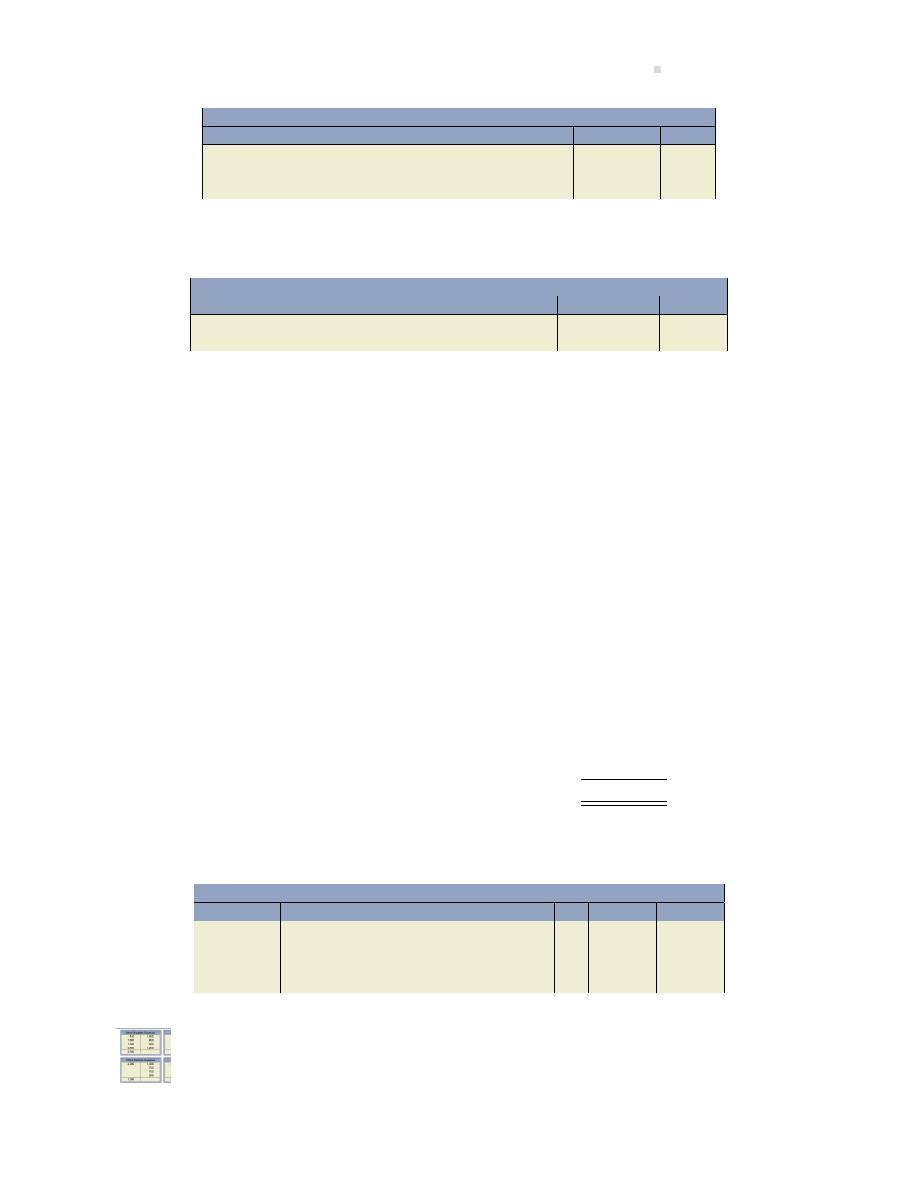
9.4. Long-Term Liabili es—Bonds Payable
357
General Journal
Date
Account/Explana on
PR
Debit
Credit
Dec 31, 2016
Interest expense . . . . . . . . . . . . . . . . . . . . . . .
1,333
Interest payable ($100,000
× 8% × 2 ÷
12) . . . . . . . . . . . . . . . . . . . . . . . . . . . . . . . . . . .
1,333
At maturity, the May 1, 2026, entry would be:
General Journal
Date
Account/Explana on
PR
Debit
Credit
May 1, 2026
Bond payable . . . . . . . . . . . . . . . . . . . . . . . . . .
100,000
Cash . . . . . . . . . . . . . . . . . . . . . . . . . . . . . . .
100,000
Repayment Before Maturity Date
In some cases, a company may want to repay a bond issue before its maturity. Examples of such
bonds are callable bonds, which give the issuer the right to call and re re the bonds before matu-
rity. For example, if market interest rates drop, the issuer will want to take advantage of the lower
interest rate. In this case, the reacquisi on price paid to ex nguish and derecognize the bond
issuance will likely be slightly higher than the bond carrying value on that date, and the difference
will be recorded by the issuing corpora on as a loss on redemp on. The company can, then, sell
a new bond issuance at the new, lower interest rate.
For example, on January 1, 2016, Angen Ltd. issued bonds with a par value of $500,000 at 99, due
in 2026. On January 1, 2020, the en re issue was called at 101 and cancelled. The bond payable
carrying value on the call date was $497,000. Interest is paid annually and the discount amor zed
using the straight-line method. The carrying value of the bond on January 1, 2020, would be
calculated as follows:
Carrying value on call date
$497,000
Re-acquisi on price ($500,000
× 101)
505,000
Loss on redemp on
$
8,000
Angen Ltd. would make the following entry:
General Journal
Date
Account/Explana on
PR
Debit
Credit
Jan 1, 2020
Bond Payable . . . . . . . . . . . . . . . . . . . . . . . . . .
500,000
Loss on redemp on of bonds . . . . . . . . . . .
8,000
Cash . . . . . . . . . . . . . . . . . . . . . . . . . . . . . . .
505,000
Discount on Bonds Payable . . . . . . . . . .
3,000
An explora on is available on the Lyryx site. Log into your Lyryx course to run
358
Debt Financing: Current and Long-term Liabili es
An explora on is available on the Lyryx site. Log into your Lyryx course to run
Recording payment of Bond Interest
.
An explora on is available on the Lyryx site. Log into your Lyryx course to run
Pricing Bonds Using a Calculator
An explora on is available on the Lyryx site. Log into your Lyryx course to run
An explora on is available on the Lyryx site. Log into your Lyryx course to run
9.5 Long-term Liabili es—Loans Payable
LO5 – Explain,
calculate,
and
record long-term
loans.
A loan is another form of long-term debt that a corpora on can use to
finance its opera ons. Like bonds, loans can be secured, giving the lender
the right to specified assets of the corpora on if the debt cannot be repaid.
For instance a mortgage is a loan secured by specified real estate of the
company, usually land with buildings on it.
Unlike a bond, a loan is typically obtained from one lender such as a bank. Also, a loan is repaid in
equal blended payments over a period me. These payments contain both interest payments and
some repayment of principal. As well, a loan does not give rise to a premium or discount because
it is obtained at the market rate of interest in effect at the me.
To demonstrate the journal entries related to long-term loans, assume BDCC obtained a three-
year, $100,000, 10% loan on January 1, 2015 from First Bank to acquire a piece of equipment.
When the loan proceeds are deposited into BDCC’s bank account, the following entry is recorded:
General Journal
Date
Account/Explana on
PR
Debit
Credit
Jan 1
Cash . . . . . . . . . . . . . . . . . . . . . . . . . . . . . . . . . .
100,000
Long-Term Note Payable . . . . . . . . . . . . .
100,000
To record 10%, 3-year, $100,000 bank
loan.
The loan is repayable in three annual blended payments. To calculate the payments, PV analysis
is used whereby the following keystrokes are entered into a business calculator:
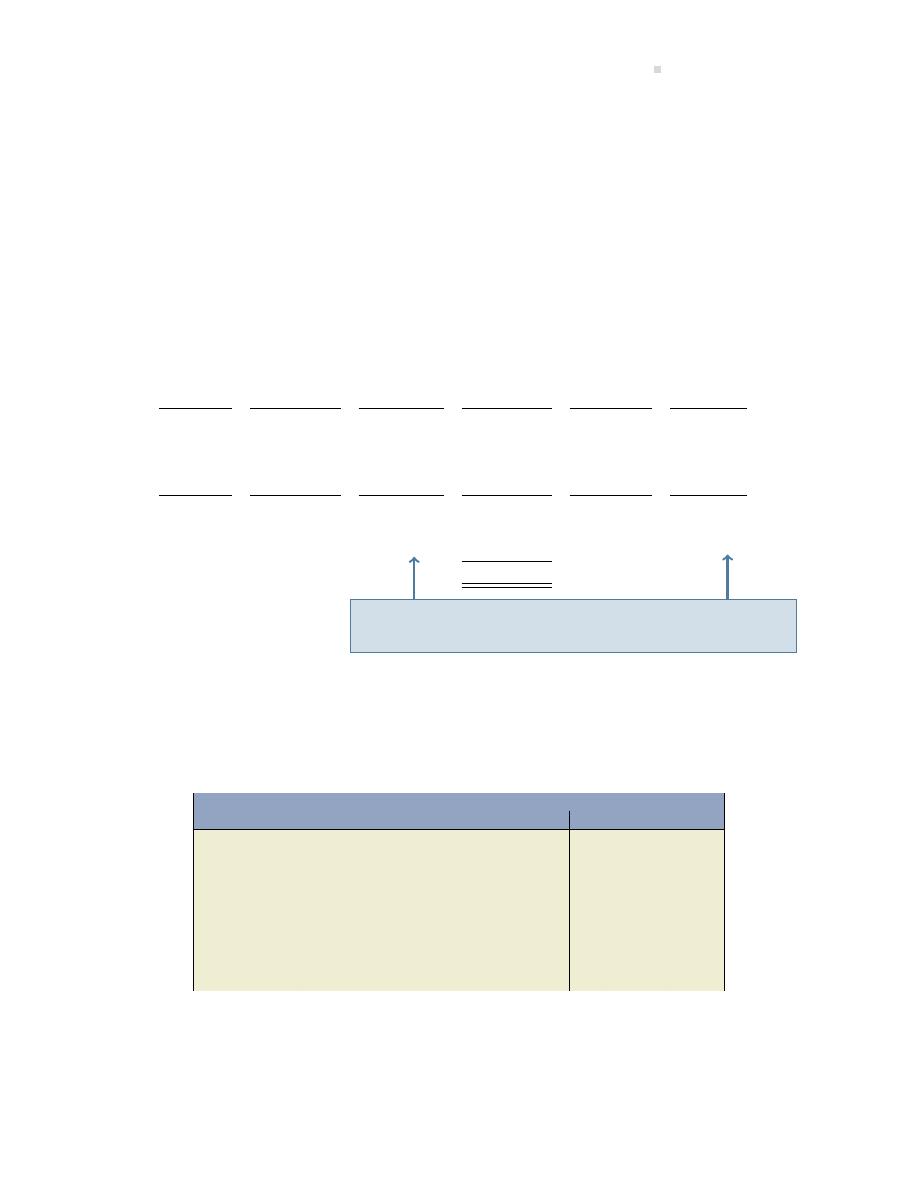
9.5. Long-term Liabili es—Loans Payable
359
PV = 100000 (the cash received from the bank),
i = 10 (the interest rate),
n = 3 (the term of the loan is three years), and
Compute PMT.
The PMT (or payment) is -40211.48. The result is nega ve because payments are cash ou lows.
While the payments remain the same each year, the amount of interest paid decreases and the
amount of principal increases. Figure
illustrates this effect.
(a)
(b)
(c)
(d)
(e)
Beginning
Periodic
Reduc on
Ending
Year
Loan
Interest
of Loan
Total
Loan
Ended
Balance
Expense
Payable
Loan
Balance
Dec. 31
(e)
(a) x 10%
(d) - (b)
Payment
(a) - (c)
2015
$100,000
$10,000
$30,211
$40,211
$69,789
2016
69,789
6,979
33,232
40,211
36,557
2017
36,557
3,654
36,557
40,211
-0-
$100,000
Interest expense and the principal balance decrease
with each loan payment.
Figure 9.2: Effect of Blended Interest and Principal Payments
Figure
can be used to construct the journal entries to record the loan payments at the end of
each year:
General Journal
Date
Account/Explana on
PR
Debit
Credit
Dec. 31, 2015
Interest Expense . . . . . . . . . . . . . . . . . . . . . . .
10,000
Loan Payable . . . . . . . . . . . . . . . . . . . . . . . . . .
30,211
Cash . . . . . . . . . . . . . . . . . . . . . . . . . . . . . . .
40,211
Dec. 31, 2016
Interest Expense . . . . . . . . . . . . . . . . . . . . . . .
6,979
Loan Payable . . . . . . . . . . . . . . . . . . . . . . . . . .
33,232
Cash . . . . . . . . . . . . . . . . . . . . . . . . . . . . . . .
40,211
Dec. 31, 2017
Interest Expense . . . . . . . . . . . . . . . . . . . . . . .
3,654
Loan Payable . . . . . . . . . . . . . . . . . . . . . . . . . .
36,557
Cash . . . . . . . . . . . . . . . . . . . . . . . . . . . . . . .
40,211
The amounts in Figure
can also be used to present the related informa on on the financial
statements of BDCC at each year end. Recall that assets and liabili es need to be classified as

360
Debt Financing: Current and Long-term Liabili es
current and non-current por ons on the balance sheet. Current liabili es are amounts paid within
one year of the balance sheet date. That part of the loan payable to First Bank to be paid in the
upcoming year needs to be classified as a current liability on the balance sheet. The amount of
the total loan outstanding at December 31, 2015, 2016, and 2017 and the current and non-current
por ons are shown in Figure
:
A
B
C
D
Ending loan
Year
balance per
Current por on
(B – C)
ended Dec.
general ledger
(Fig.
, Col. C)
Long-term
31
(Fig
, Col. E)
por on
2015
$69,788
$33,232
$36,557
2016
36,557
36,557
-0-
2017
-0-
-0-
-0-
Figure 9.3: Current and Long-term Por ons of Loan Principal
Balance sheet presenta on would be as follows at the end of 2015, 2016, and 2017:
2015
2016
2017
Current liabili es
Current por on of bank loan
$33,232
$36,557
$
-0-
Long-term liabili es
Bank loan (Note X)
36,557
-0-
-0-
Details of the loan would be disclosed in a note to the financial statements. Only the principal
amount of the loan is reported on the balance sheet. The interest expense por on is reported on
the income statement as an expense. Because these loan payments are made at BDCC’s year end,
no interest payable is accrued or reported on the balance sheet.
An explora on is available on the Lyryx site. Log into your Lyryx course to run
9.6 Appendix A: Present Value Calcula ons
Interest is the me value of money. If you borrow $1 today for one year at 10% interest, its future
value in one year is $1.10 ($1
× 110% = $1.10). The increase of 10 cents results from the interest
on $1 for the year. Conversely, if you are to pay $1.10 one year from today, the present value
is $1 — the amount you would need to invest today at 10% to receive $1.10 in one year’s me
($1.10/110% = $1). The exclusion of applicable interest in calcula ng present value is referred to
as discoun ng.
If the above $1.10 amount at the end of the first year is invested for an addi onal year at 10%
interest, its future value would be $1.21 ($1.10 x 110%). This consists of the original $1 investment,

9.6. Appendix A: Present Value Calcula ons
361
$.10 interest earned in the first year, and $.11 interest earned during the second year. Note that
the second year’s interest is earned on both the original $1 and on the 10 cents interest earned
during the first year. This increase provides an example of compound interest — interest earned
on interest.
The following formula can be used to calculate this:
FV = PV
× (1 + i)
n
where FV = future value, PV = present value, i = the interest rate, and n = number of
periods.
Subs tu ng the values of our example, the calcula on would be FV = $1[(1 + .1)
2
]
, or $1.21.
If the future value of today’s $1 at 10% interest compounded annually amounts to $1.21 at the
end of two years, the present value of $1.21 to be paid in two years, discounted at 10%, is $1. The
formula to calculate this is just the inverse of the formula shown above, or
PV =
FV
(1 + i)
n
Subs tu ng the values of our example,
PV =
$1.21
(1 + .1)
2
That is, the present value of $1.21 received two years in the future is $1. The present value is
always less than the future value, since an amount received today can be invested to earn a return
(interest) in the intervening period. Calcula ng the present value of amounts payable or receivable
over several me periods is explained more thoroughly below.
Instead of using formulas to calculate future and present values, a business calculator can be used
where:
PV = present value
FV = future value
i = interest rate per period (for a semi-annual period where the annual interest rate is
8%, for example, i = 4% and would be entered into the calculator as ‘4’ – not .04)
PMT = dollar amount of interest per period
n = number of periods.
The following three scenarios demonstrate how PV analysis is used to determine the issue price
of a $100,000 bond.

362
Debt Financing: Current and Long-term Liabili es
1. Big Dog Carworks Corp. issues $100,000 of 3-year, 12% bonds on January 1, 2015 when the
market rate of interest is 12%. Interest is paid semi-annually.
2. BDCC’s bonds are issued at a premium because the market rate of interest is 8% at the date
of issue.
3. BDCC’s bonds are issued at a discount because the market rate of interest is 16% at the date
of issue.
In each scenario, the bond principal of $100,000 will be repaid at the end of three years, and in-
terest payments of $6,000 (calculated as $100,000 x 12% x 6/12) will be received every six months
for three years.
Scenario 1: The Bond Contract Interest Rate is 12% and the Market Interest Rate
Is 12%
The market interest rate is the same as the bond interest rate, therefore the bond is selling at
par. The present value will be $100,000, the face value of the bond, which can be confirmed by
entering the following into a business calculator:
FV = -100000 (we enter this as a nega ve because it is a cash ou low — it is being paid
and not received when the bond matures)
i = 6 (calculated as 12%/year
÷ 2 periods per year)
PMT = -6000 (we enter this as a nega ve because it is a cash ou low — it is being paid
and not received each semi-annual interest period)
n = 6 (3-year bond
× 2 periods per year)
Compute PV
The PV = 100000. This result confirms that the bond is being issued at par or face value.
Scenario 2: The Bond Contract Interest Rate is 12% and the Market Interest Rate
Is 8%
The market interest rate is less than the bond interest rate, therefore the bond is selling at a pre-
mium. The present value can be determined by entering the following into a business calculator:
FV = -100000 (we enter this as a nega ve because it is a cash ou low — it is being paid
and not received when the bond matures)
i = 4 (calculated as 8%/year
÷ 2 periods per year)

9.7. Appendix B: Addi onal Payroll Transac ons
363
PMT = -6000 (we enter this as a nega ve because it is a cash ou low — it is being paid
and not received each semi-annual interest period)
n = 6 (3-year bond
× 2 periods per year)
Compute PV
The PV = 110484.27. This confirms that the bond is being issued at a premium. The premium is
$10,484.27 calculated as the difference between the present value of $110,484.27 and the face
value of $100,000.
Scenario 3: The Bond Contract Interest Rate is 12% and the Market Interest Rate
Is 16%
The market interest rate is more than the bond interest rate, therefore the bond is selling at a dis-
count. The present value can be determined by entering the following into a business calculator:
FV = -100000 (we enter this as a nega ve because it is a cash ou low — it is being paid
and not received when the bond matures)
i = 8 (calculated as 16%/year
÷ 2 periods per year)
PMT = -6000 (we enter this as a nega ve because it is a cash ou low — it is being paid
and not received each semi-annual interest period)
n = 6 (3-year bond
× 2 periods per year)
Compute PV
The PV = 90754.24. This confirms that the bond is being issued at a discount. The discount is
$9,245.76 calculated as the difference between the present value of $90,754.24 and the face value
of $100,000.
9.7 Appendix B: Addi onal Payroll Transac ons
Net pay calcula ons
A business maintains a Payroll Register that summarizes the hours worked for each employee per
pay period. The payroll register details an employee’s regular pay plus any over me pay before
deduc ons, known as gross pay. An employee is paid their net pay (gross pay less total deduc-
ons). Payroll deduc ons are amounts subtracted by the employer from an employee’s gross pay.
Deduc ons are also known as withholdings or withheld amounts. Deduc ons can vary depending
on the employer. Some deduc ons are op onal and deducted by the employer based on direc-
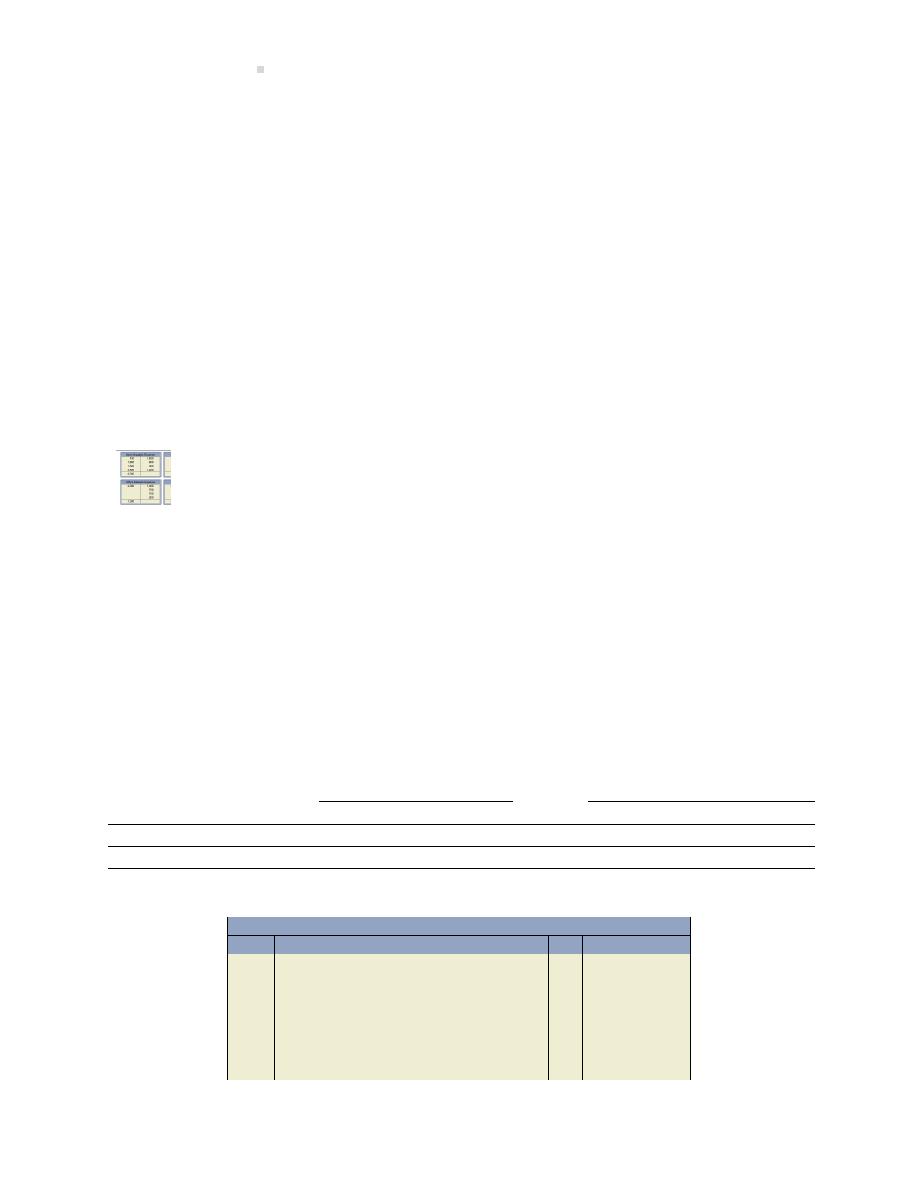
364
Debt Financing: Current and Long-term Liabili es
ons made by the employee. Examples of op onal deduc ons include an employee’s charitable
dona ons or Canada Savings Bonds contribu ons.
Certain payroll deduc ons are required by law. Deduc ons legally required to be deducted by the
employer from an employee’s gross pay are income tax, Employment Insurance (EI), and Canada
Pension Plan (CPP or QPP in Quebec). The amount of legally required deduc ons is prescribed
and based on an employee’s income. For more detailed informa on regarding the calcula on
of these deduc ons, go to:
http://www.cra-arc.gc.ca/tx/bsnss/tpcs/pyrll/clcltng/
Other deduc ons that are o en withheld by employers include union dues and health care pre-
miums.
All deduc ons withheld by employers must be paid to the appropriate authority. For example,
income tax, EI, and CPP must be paid to the Receiver General for Canada. Charitable dona ons
withheld by an employer would be paid to the charity as directed by the employee.
An explora on is available on the Lyryx site. Log into your Lyryx course to run
.
Recording Payroll
The entry made by the employer to record payroll would debit the appropriate salary or wage
expense category and credit:
1. Salaries Payable or Wages Payable for the net pay and
2. Each deduc on such as EI Payable, CPP Payable, etc.
To demonstrate, assume the following payroll informa on for Wil Stavely and Courtney Dell:
Deduc ons
Distribu on
Gross Pay Income Tax
EI
CPP Net Pay Exec Salaries Office Wages
Dell, Courtney
5,800
1,160
106
280
4,254
5,800
Stavely, Will
3,500
700
70
170
2,560
3,500
The payroll journal entry would be:
General Journal
Date
Account/Explana on
PR
Debit
Credit
Exec Salaries Expense . . . . . . . . . . . . . . . . . .
5,800
Office Wages Expense . . . . . . . . . . . . . . . . . .
3,500
Employee Income Tax Payable . . . . . . .
1,860
EI Payable . . . . . . . . . . . . . . . . . . . . . . . . . .
176
CPP (or QPP) Payable . . . . . . . . . . . . . . . .
450
Salaries Payable . . . . . . . . . . . . . . . . . . . .
6,814
To record payroll.
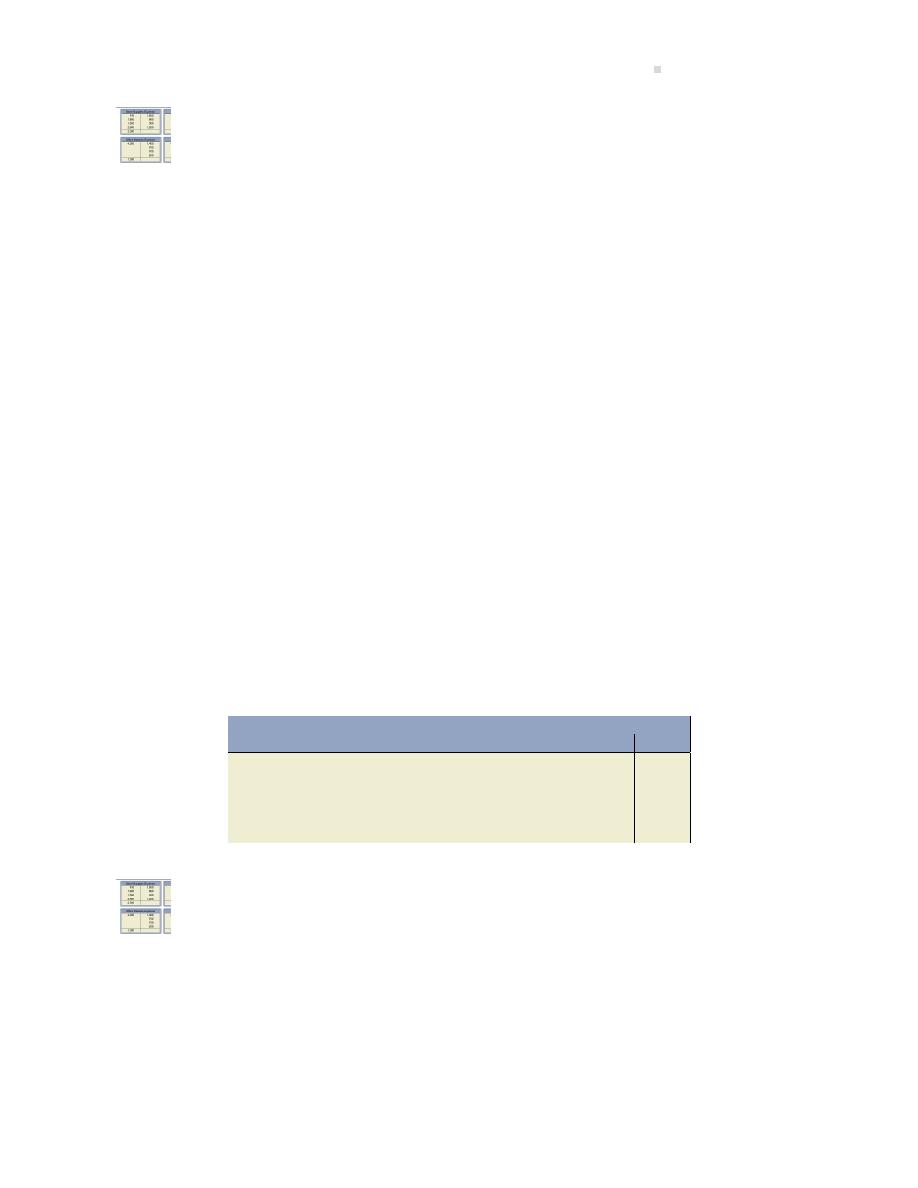
9.7. Appendix B: Addi onal Payroll Transac ons
365
An explora on is available on the Lyryx site. Log into your Lyryx course to run
.
Recording Employer’s CPP and EI Amounts
As already indicated, employers are legally required to deduct/withhold an employee’s amount
for each of the following from an employee’s gross pay:
1. the employee’s amount for Canada Pension Plan (CPP or QPP in Quebec) and
2. the employee’s amount for Employment Insurance (EI).
The employer is required by law to pay Employment Insurance (EI) at the rate of 1.4 mes the EI
withheld from each employee. For example, if the employer withheld $100 of EI from Employee
A’s gross pay, the employer would have to pay EI of $140 (calculated as $100 x 1.4). Therefore, the
total amount of EI being paid to the government regarding Employee A is $240 (calculated as the
employee’s por on of $100 plus the employer’s por on of $140).
The employer is also required by law to pay CPP (or QPP in Quebec) of an amount that equals the
employee amount. For example, if the employer withheld $50 of CPP from Employee A’s gross
pay, the employer would have to pay CPP of $50. Therefore, the total amount of CPP being paid
to the government regarding Employee A is $100 (calculated as the employee’s por on of $50 plus
the employer’s por on of $50).
The journal entry to record the employer’s amounts above for EI and CPP would be:
General Journal
Date
Account/Explana on
PR
Debit
Credit
EI Expense . . . . . . . . . . . . . . . . . . . . . . . . . . . .
140
CPP (or QPP) Expense . . . . . . . . . . . . . . . . . .
50
EI Payable . . . . . . . . . . . . . . . . . . . . . . . . . .
140
CPP (or QPP) Payable . . . . . . . . . . . . . . . .
50
To record employer’s EI and CPP amounts.
An explora on is available on the Lyryx site. Log into your Lyryx course to run
Journalizing Liability for Employer Payroll Amounts
.
Employer’s Entries to Pay the Payroll Deduc ons
Employers are required by law to pay/remit to the Receiver General for Canada all income tax, EI,
and CPP amounts deducted/withheld from employees along with the employer’s por on of EI and
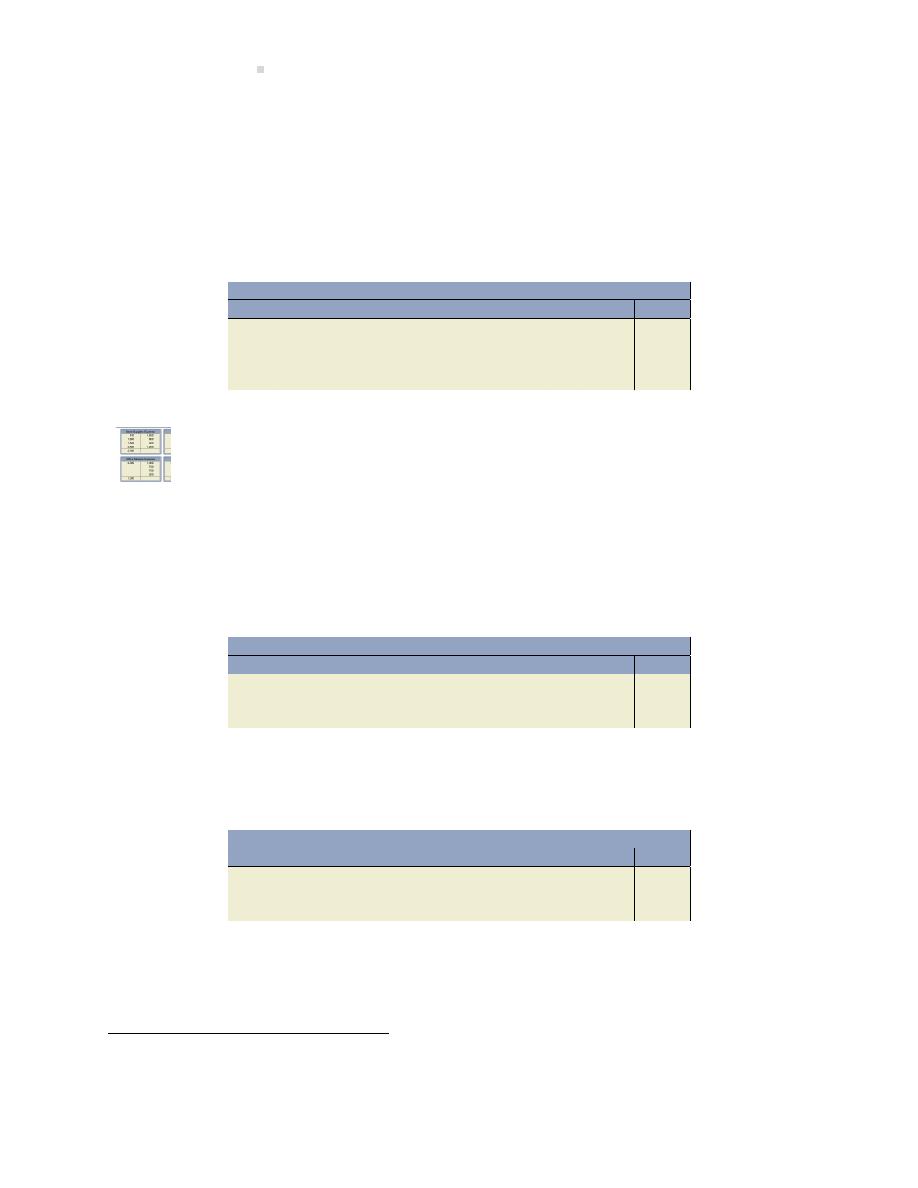
366
Debt Financing: Current and Long-term Liabili es
CPP. Any other amounts deducted/withheld from employees such as union dues, health care pre-
miums, or charitable dona ons must also be paid/remi ed to the appropriate organiza ons. The
journal entry to record these payments/remi ances by the employer would debit the respec ve
liability account and credit cash. For example, using the informa on from our previous example,
we know that the employer withheld from the employee’s gross pay $100 of EI and $50 of CPP.
Addi onally, the employer recorded its share of the EI ($140) and CPP ($50) amounts. The total
EI to be paid is therefore $240 and the total CPP $100. The payment by the employer would be:
General Journal
Date
Account/Explana on
PR
Debit
Credit
EI Payable
. . . . . . . . . . . . . . . . . . . . . . . . . . . .
240
CPP (or QPP
) Payable . . . . . . . . . . . . . . . . . .
100
Cash . . . . . . . . . . . . . . . . . . . . . . . . . . . . . . .
340
To record employer’s EI and CPP amounts.
An explora on is available on the Lyryx site. Log into your Lyryx course to run
Journalizing Payment of Employer Amounts
Fringe Benefits and Vaca on Benefits
Some employers pay for an employee’s benefits such as health insurance. The journal entry to
record benefits would be:
General Journal
Date
Account/Explana on
PR
Debit
Credit
Benefits Expense . . . . . . . . . . . . . . . . . . . . . . .
XX
Health Insurance Payable . . . . . . . . . . . .
XX
To record health insurance benefits.
Employers are also required to pay for vaca on me equal to 4% of gross income. The entry to
accrue vaca on benefits would be:
General Journal
Date
Account/Explana on
PR
Debit
Credit
Benefits Expense . . . . . . . . . . . . . . . . . . . . . . .
XX
Es mated Vaca on Liability . . . . . . . . . .
XX
To record accrual of vaca on benefits.
When vaca on benefits are realized by the employee, the Es mated Vaca on Liability account is
debited and the appropriate liability accounts to record deduc ons/withholdings and net pay are
credited.
3
Employee’s $100 por on + Employer’s $140 por on
4
Employee’s $50 por on + Employer’s $50 por on
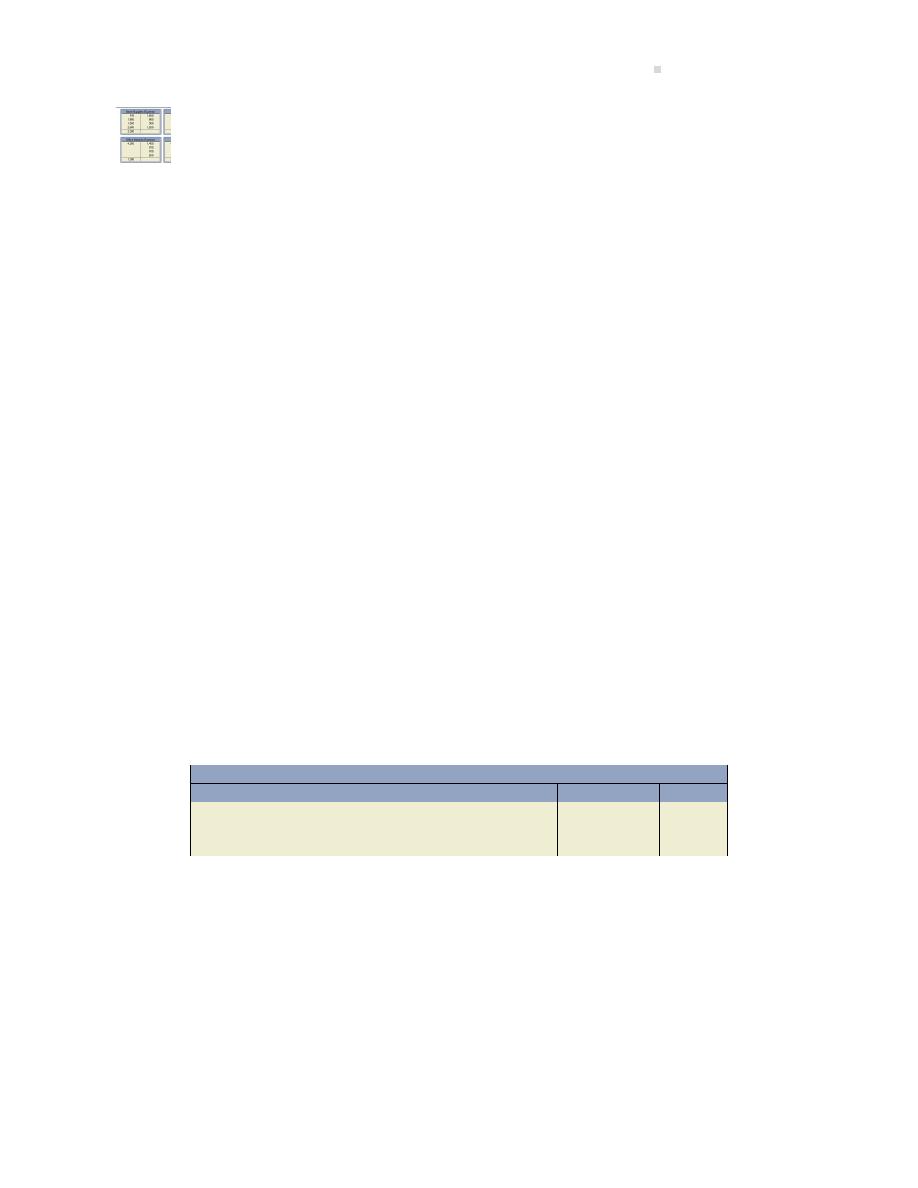
9.8. Appendix C: The Effec ve Interest Rate Method
367
An explora on is available on the Lyryx site. Log into your Lyryx course to run
9.8 Appendix C: The Effec ve Interest Rate Method
Another way to calculate the interest expense when a bond is issued at a premium or discount is
the effec ve interest rate method.
Below are two examples where a bond is issued at a premium or discount. The interest expense
and the amor za on of the premium or discount is computed using the effec ve interest rate
method.
Note that the bond’s fair value can be determined by either using the market spot rate or by
performing a present value calcula on. Use of the market spot rate is shown in the bond premium
example, while the present value calcula on is shown in the bond discount example. These are
discussed next.
Bonds Issued at a Premium
On May 1, 2016, Impala Ltd. issued a 10-year, 8%, $500,000 face value bond at a spot rate of 102
(2% above par). Interest is payable each year on May 1 and November 1. The company uses the
effec ve interest rate method to calculate interest expense and amor ze the bond premium.
The spot rate is 102, so the amount to be paid is $510,000 (500,000
× 1.02) and, therefore, rep-
resents the fair value or present value of the bond issuance on the purchase date.
The entry for the bond issuance is:
General Journal
Date
Account/Explana on
PR
Debit
Credit
May 1, 2016
Cash . . . . . . . . . . . . . . . . . . . . . . . . . . . . . . . . . .
510,000
Bond payable . . . . . . . . . . . . . . . . . . . . . . .
500,000
Premium on bonds payable . . . . . . . . . .
10,000
Below is a por on of the effec ve interest rate method table:
Payment
Interest
Amor za on
Balance
3.8547%
of Premium
May 1, 2016
510,000
Nov 1, 2016
20,000
19,659
341 509,659
May 1, 2017
20,000
19,646
354 509,305
Nov 1, 2017
20,000
19,632
368 508,937
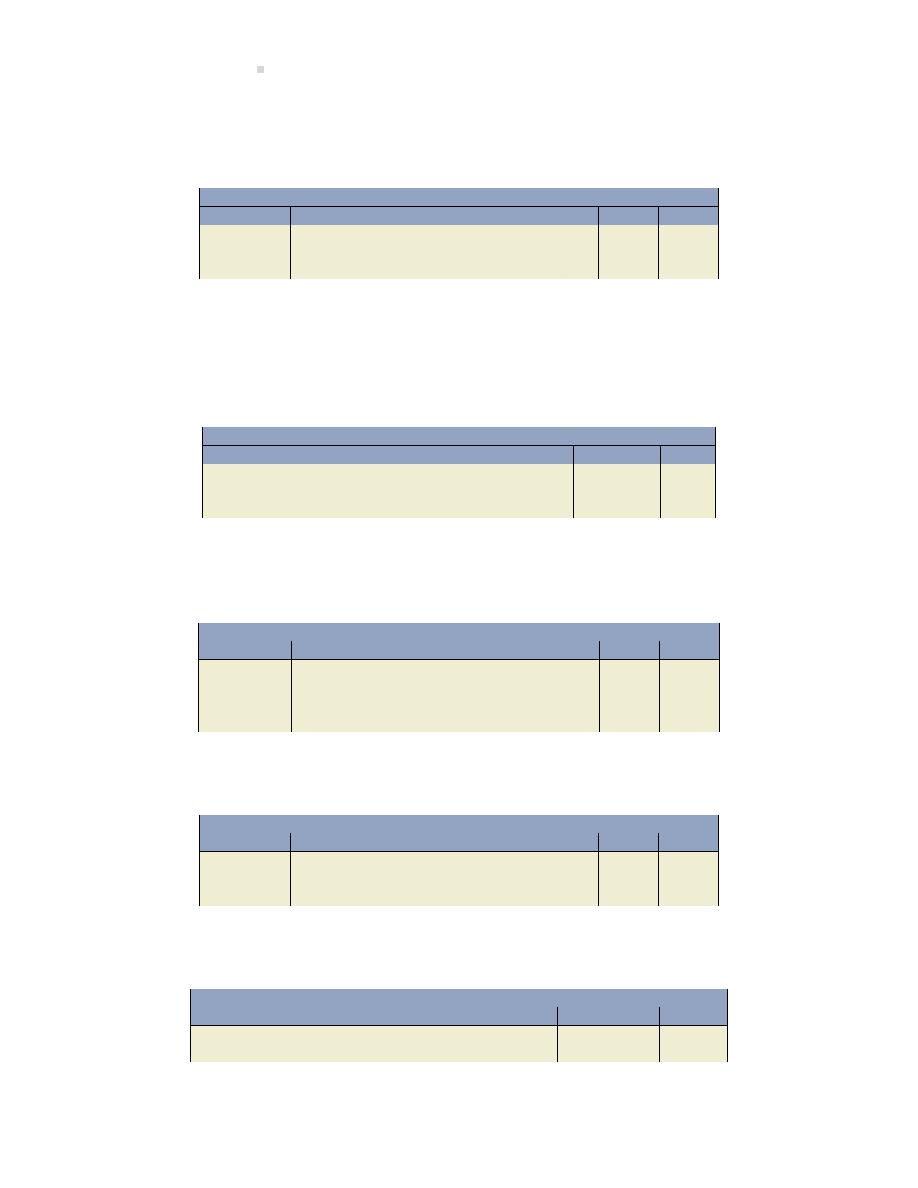
368
Debt Financing: Current and Long-term Liabili es
Using the informa on from the schedule, the entries are completed below.
To record the interest payment and amor za on of premium on November 1:
General Journal
Date
Account/Explana on
PR
Debit
Credit
Nov 1, 2016
Interest expense . . . . . . . . . . . . . . . . . . . . . . .
19,659
Premium on bonds payable . . . . . . . . . . . . .
341
Cash . . . . . . . . . . . . . . . . . . . . . . . . . . . . . . .
20,000
Recording the accrued interest at the December 31 year-end uses the relevant por on of the ef-
fec ve interest schedule. For example, at December 31, 2016, the table shows interest of $19,646
and bond amor za on of $354 at May, 2017. Prora ng these amounts for November and Decem-
ber, or two months, results in the following entry:
General Journal
Date
Account/Explana on
PR
Debit
Credit
Dec 31, 2016
Interest expense (19,646
× 2 ÷ 6) . . . . . . .
6,549
Premium on bonds payable (354
× 2 ÷ 6)
118
Interest payable . . . . . . . . . . . . . . . . . . . .
6,667
To record the interest payment on May 1, 2017, interest expense and amor za on will be for the
remainder of the table amounts of $19,646 and $354 respec vely:
General Journal
Date
Account/Explana on
PR
Debit
Credit
May 1, 2017
Interest expense (19,646
− 6,549) . . . . . . .
13,097
Interest payable . . . . . . . . . . . . . . . . . . . . . . .
6,667
Premium on bonds payable (354
− 118). .
236
Cash . . . . . . . . . . . . . . . . . . . . . . . . . . . . . . .
20,000
To record the interest payment on November 1, 2017:
General Journal
Date
Account/Explana on
PR
Debit
Credit
Nov 1, 2017
Interest expense . . . . . . . . . . . . . . . . . . . . . . .
19,632
Premium on bonds payable . . . . . . . . . . . . .
368
Cash . . . . . . . . . . . . . . . . . . . . . . . . . . . . . . .
20,000
At maturity, the May 1, 2026, entry would be:
General Journal
Date
Account/Explana on
PR
Debit
Credit
May 1, 2026
Bond payable . . . . . . . . . . . . . . . . . . . . . . . . . .
500,000
Cash . . . . . . . . . . . . . . . . . . . . . . . . . . . . . . .
500,000
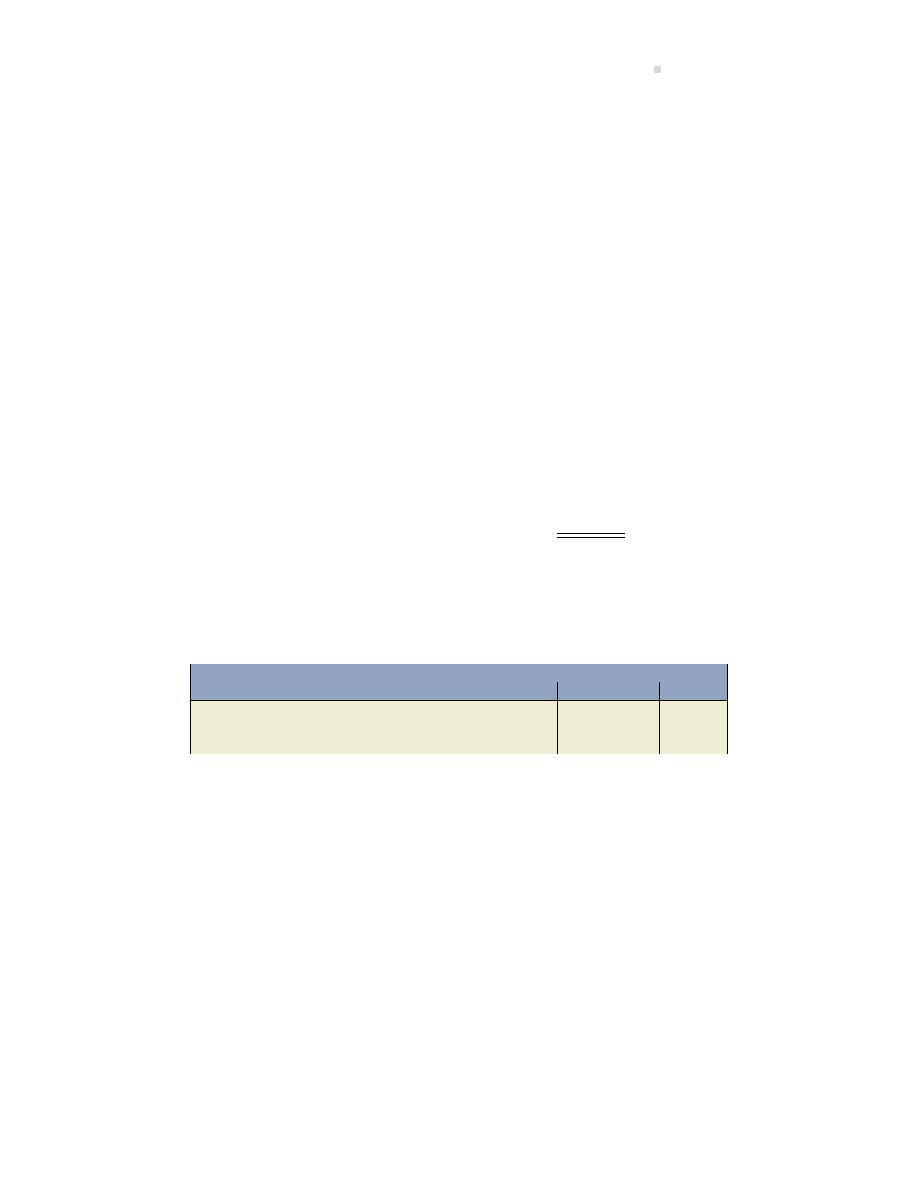
9.8. Appendix C: The Effec ve Interest Rate Method
369
Bonds Issued at a Discount
On May 1, 2016, Engels Ltd. issued a 10-year, 8%, $500,000 face value bond with interest payable
each year on May 1 and November 1. The market rate at the me of issuance is 9% and the
company year-end is December 31. In this case the stated rate of 8% is less than the market rate
of 9%. This means that the bond issuance is trading at a discount and the fair value, or its present
value of the future cash flows, will be less than the face value upon issuance. The present value is
calculated as:
20,000
PMT
(where semi-annual interest using the stated or face rate is $500,000
× 8% ×
6
÷ 12)
4.5
I/Y
(where 9% market or effec ve interest is paid twice per year)
20
N
(where interest is paid twice per year for 10 years)
500,000 FV
(where a single payment of the face value is due in a future year 2026);
Expressed in the following variables string, and using a financial calculator, the present value is
calculated:
Present value (PV) = (20,000 PMT, 4.5 I/Y, 20 N, 500,000 FV) = $467,480
Had the market spot rate been used, this bond would be trading at a spot rate of 93.496 (or
93.496% of the bond’s face value, which is below par). The fair value would also be $467,480
($500,000
× 0.93496).
General Journal
Date
Account/Explana on
PR
Debit
Credit
May 1, 2016
Cash . . . . . . . . . . . . . . . . . . . . . . . . . . . . . . . . . .
467,480
Discount on bonds payable . . . . . . . . . . . . .
32,520
Bond payable . . . . . . . . . . . . . . . . . . . . . . .
500,000
The stated rate of 8% is less than the market rate of 9%, resul ng in a present value less than
the face amount of $500,000. This bond issuance is trading at a discount. Since the market rate
is greater, the investor would not be willing to purchase bonds paying less interest at the face
value. The bond issuer must, therefore, sell these at a discount in order to en ce investors to
purchase them. The investor pays the reduced price of $467,480. For the seller, the discount
amount of $32,520 ($500,000
− 467,480) is then amor zed over the life of the bond issuance
using the effec ve interest rate method. The total interest expense for either method will be the
same.
The interest schedule for the bond issuance is shown below:
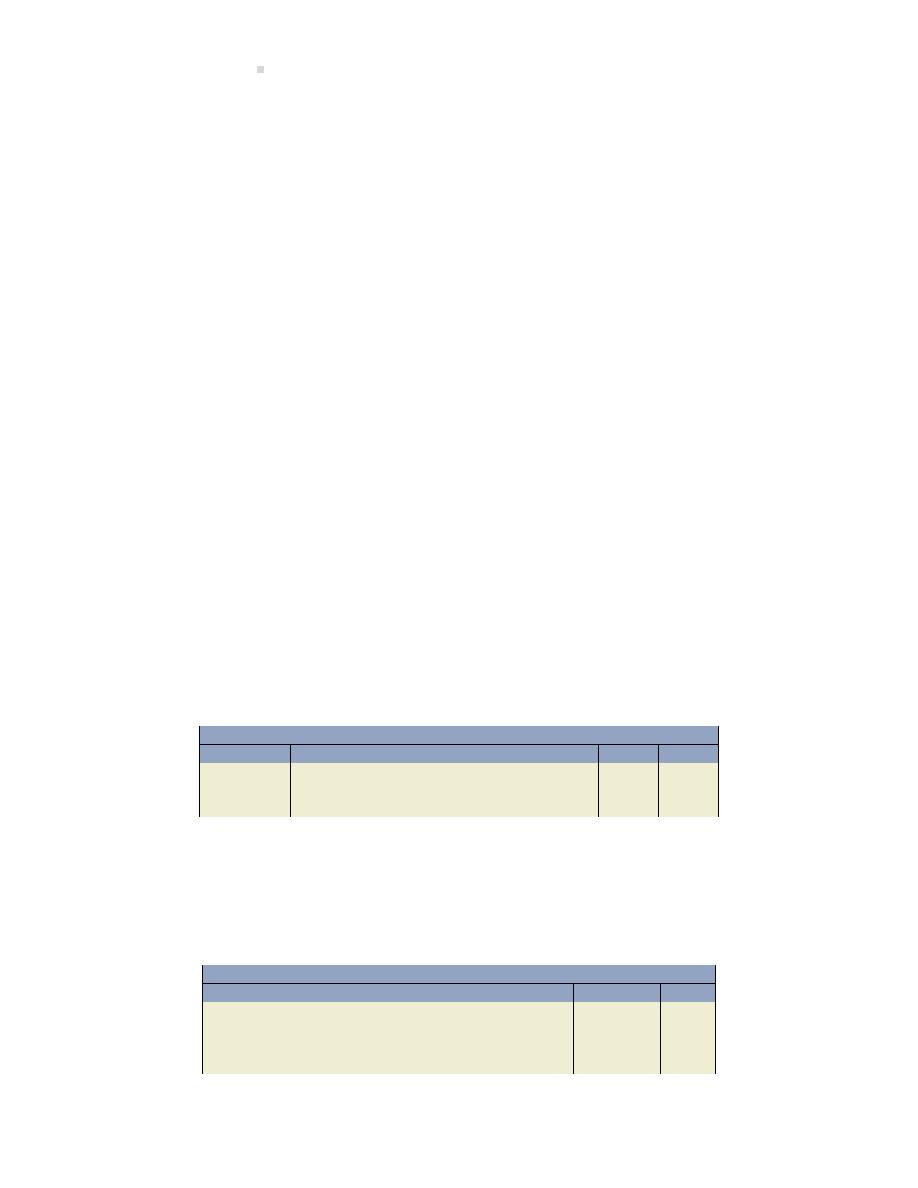
370
Debt Financing: Current and Long-term Liabili es
Payment Interest Amor za on
Balance
4.5%
of Discount
May 1, 2016
467,480
Nov 1, 2016
20,000
21,037
1,037
468,517
May 1, 2017
20,000
21,083
1,083
469,600
Nov 1, 2017
20,000
21,132
1,132
470,732
May 1, 2018
20,000
21,183
1,183 471,915
Nov 1, 2018
20,000
21,236
1,236
473,151
May 1, 2019
20,000
21,292
1,292
474,443
Nov 1, 2019
20,000
21,350
1,350
475,793
May 1, 2020
20,000
21,411
1,411
477,203
Nov 1, 2020
20,000
21,474
1,474
478,677
May 1, 2021
20,000
21,540
1,540
480,218
Nov 1, 2021
20,000
21,610
1,610
481,828
May 1, 2022
20,000
21,682
1,682
483,510
Nov 1, 2022
20,000
21,758
1,758
485,268
May 1, 2023
20,000
21,837
1,837
487,105
Nov 1, 2023
20,000
21,920
1,920
489,025
May 1, 2024
20,000
22,006
2,006
491,031
Nov 1, 2024
20,000
22,096
2,096
493,127
May 1, 2025
20,000
22,191
2,191
495,318
Nov 1, 2025
20,000
22,289
2,289
497,607
May 1, 2026
20,000
22,392
2,392
500,000
Using the informa on from the schedule, the entries are completed below.
To record the interest payment on November 1:
General Journal
Date
Account/Explana on
PR
Debit
Credit
Nov 1, 2016
Interest expense (467,480
× 4.5%) . . . . . .
21,037
Discount on bonds payable . . . . . . . . . .
1,037
Cash . . . . . . . . . . . . . . . . . . . . . . . . . . . . . . .
20,000
Recording the accrued interest at the December 31 year-end uses the relevant por on of the ef-
fec ve interest schedule. For example, at December 31, 2016, the table shows interest of $21,083
and bond amor za on of $1,083 at May, 2017. Prora ng these amounts for November and De-
cember, or two months, results in the following entry
General Journal
Date
Account/Explana on
PR
Debit
Credit
Dec 31, 2016
Interest expense (21,083
× 2 ÷ 6) . . . . . . .
7,028
Discount on bonds payable (1,083
×2÷
6) . . . . . . . . . . . . . . . . . . . . . . . . . . . . . . . . . . . .
361
Interest payable . . . . . . . . . . . . . . . . . . . .
6,667
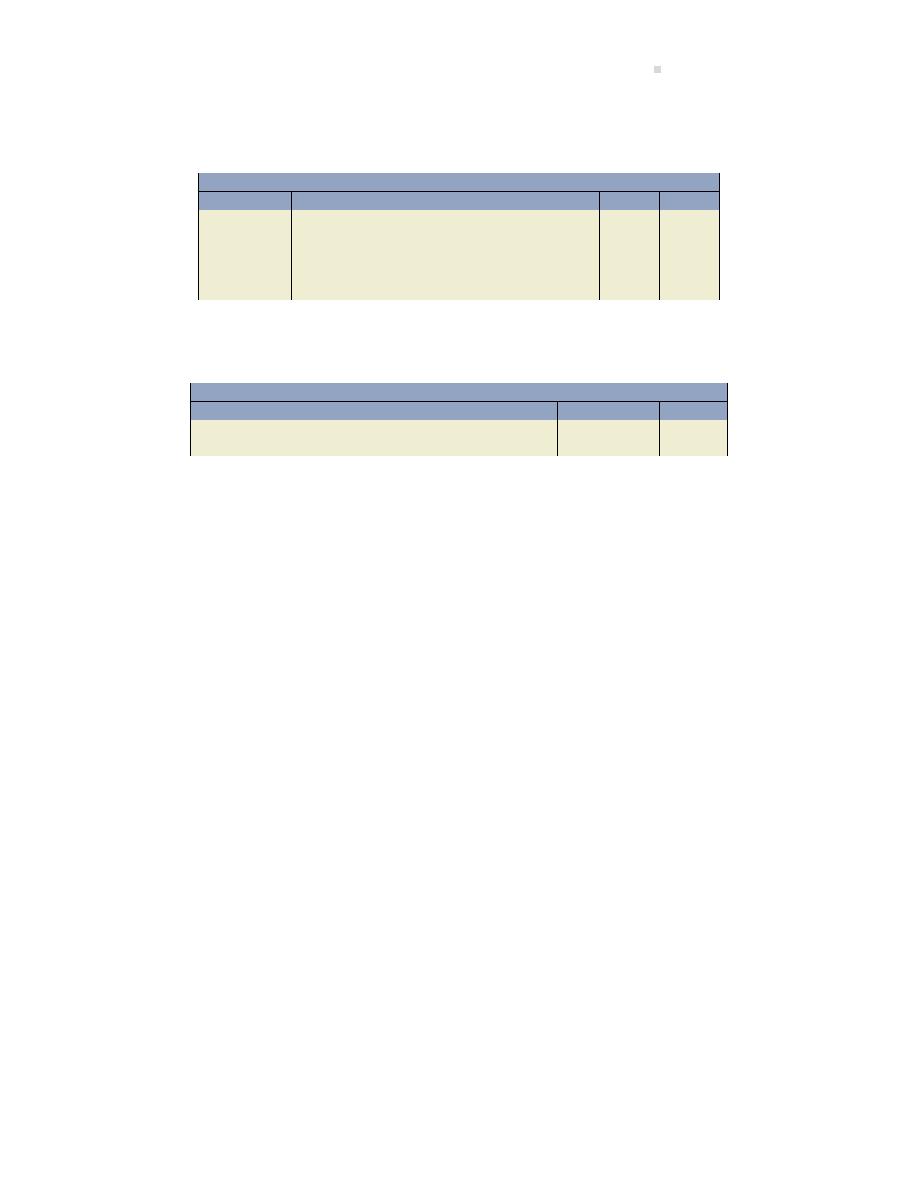
Summary of Chapter
Learning Objec ves
371
To record the interest payment on May 1, 2017, interest expense and amor za on will be for the
remainder of the table amounts of $21,083 and $1,083 respec vely:
General Journal
Date
Account/Explana on
PR
Debit
Credit
May 1, 2017
Interest expense (21,083
− 7,028) . . . . . . .
14,055
Interest payable . . . . . . . . . . . . . . . . . . . . . . .
6,667
Discount on bonds payable (1,083
−
361) . . . . . . . . . . . . . . . . . . . . . . . . . . . . . . . . . .
722
Cash . . . . . . . . . . . . . . . . . . . . . . . . . . . . . . .
20,000
At maturity, the May 1, 2026, entry would be:
General Journal
Date
Account/Explana on
PR
Debit
Credit
May 1, 2026
Bond payable . . . . . . . . . . . . . . . . . . . . . . . . . .
500,000
Cash . . . . . . . . . . . . . . . . . . . . . . . . . . . . . . .
500,000
Summary of Chapter 9 Learning Objec ves
LO1 – Iden fy and explain current versus long-term liabili es.
Current or short-term liabili es are a form of debt that is expected to be paid within the longer of
one year of the balance sheet date or one opera ng cycle. Long-term liabili es are a form of debt
that is expected to be paid beyond one year of the balance sheet date or the next opera ng cycle,
whichever is longer. Current and long-term liabili es must be shown separately on the balance
sheet.
LO2 – Record and disclose known current liabili es.
Known current liabili es are those where the payee, amount, and ming of payment are known.
Payroll liabili es are a type of known current liability. Employers are responsible for withholding
from employees amounts including Employment Insurance (EI), Canada Pension Plan (CPP), and
income tax, and then remi ng the amounts to the appropriate authority. Sales taxes, including
the Goods and Services Tax (GST) and Provincial Sales Tax (PST), must be collected by registrants
and subsequently remi ed to the Receiver General for Canada. Short-term notes payable, also
a known current liability, can involve the accrual of interest if the maturity date falls in the next
accoun ng period.

372
Debt Financing: Current and Long-term Liabili es
LO3 – Record and disclose es mated current liabili es.
An es mated liability is known to exist where the amount, although uncertain, can be es mated.
Warran es and income taxes are examples of es mated liabili es. Con ngent liabili es are nei-
ther a known liability nor an es mated liability and are not recorded if they are determined to
exist. A con ngent liability exists when it is not probable or it cannot be realiably es mated. A
con ngent liability is disclosed in the notes to the financial statements.
LO4 – Iden fy, describe, and record bonds.
Bonds pay interest at regular intervals to bondholders. The original investment is repaid to bond-
holders when the bonds mature. There are different types of bonds: secured or unsecured, as
well as registered or bearer bonds. Bonds can have a variety of characteris cs, including: varying
maturity dates, call provisions, conversion privileges, sinking fund requirements, or dividend re-
stric ons. Bonds are issued: (a) at par (also known as the face value) when the market interest
rate is the same as the bond (or contract) interest rate; (b) at a discount when the market interest
rate is higher than the bond interest rate; or (c) at a premium when the market interest rate is
lower than the bond interest rate.
LO5 – Explain, calculate, and record long-term loans.
A loan is a form of long-term debt that can be used by a corpora on to finance its opera ons.
Loans can be secured and are typically obtained from a bank. Loans are o en repaid in equal
blended payments containing both interest and principal.
Discussion Ques ons
1. What is the difference between a current and long-term liability?
2. What are some examples of known current liabili es?
3. How are known current liabili es different from es mated current liabili es?
4. What are some examples of es mated current liabili es?
5. How is an es mated current liability different from a con ngent liability?
6. What is a bond? ...a bond indenture? Why might a trustee be used to administer a bond
indenture?
7. List and explain some bondholder rights.
8. How are different bond issues reported in the financial statements of a corpora on?

Exercises
373
9. What are three reasons why bonds might be redeemed before their maturity date?
10. Why would investors pay a premium for a corporate bond? Why would a corpora on issue
its bonds at a discount? Explain, using the rela onship between the bond contract interest
rate and the prevailing market interest rate.
11. How is an unamor sed bond premium or discount disclosed in accordance with GAAP?
12. If the bond contract interest rate is greater than that required in the market on the date of
issue, what is the effect on the selling price of the bond? Why?
13. What method is used to amor se premiums and discounts?
14. How is a loan payable similar to a bond? How is it different?
15. Dis nguish between future value and present value. What is the me value of money? Why
is it important?
16. How is the actual price of a bond determined?
Exercises
EXERCISE 9–1
(LO1)
Ajam Inc. shows the following selected adjusted account balances at March 31, 2019:
Accounts Payable
$ 58,000
Wages Payable
102,000
Accumulated Deprecia on – Machinery
69,000
Income Taxes Payable
92,000
Note Payable, due May 15, 2021
108,000
Note Payable, due November 30, 2019
64,000
Mortgage Payable
320,000
Accounts Receivable
71,000
Note: $240,000 of the mortgage payable balance is due one year beyond the balance sheet date;
the remainder will be paid within the next 12 months.
Required: Prepare the liability sec on of Ajam’s March 31, 2019 balance sheet.
EXERCISE 9–2
(LO2)

374
Debt Financing: Current and Long-term Liabili es
On June 7, 2019, Dilby Mechanical Corp. completed $50,000 of servicing work for a client and
billed them for that amount plus GST of $2,500 and PST of $3,500; terms are n20.
Required:
a. Prepare the journal entry as it would appear in Dilby’s accoun ng records.
b. Assume the receivable established on June 7 was collected on June 27. Record the entry.
EXERCISE 9–3
(LO2)
Libra Company borrowed $300,000 by signing a 3.5%, 45-day note payable on July 1, 2019. Libra’s
year-end is July 31. Round all calcula ons to two decimal places.
Required:
a. Prepare the entry to record the issuance of the note on July 1, 2019.
b. Prepare the entry to accrue interest on July 31, 2019.
c. On what date will this note mature?
d. Prepare the entry to record the payment of the note on the due date.
EXERCISE 9–4
(LO3)
On January 23, 2019, Zenox Company sold $105,000 of furniture on account that had a cost of
$82,000. All of Zenox’s sales are covered by an uncondi onal 24-month replacement warranty.
Historical data indicates that warranty costs average 2% of the cost of sales. On January 29, 2019,
Zenox replaced furniture with a cost of $2,000 that was covered by warranty.
Required:
a. Prepare the journal entry to record the es mated warranty liability for January.
b. Prepare the entry to record the warranty expense incurred in January.
c. Assuming the Es mated Warranty Liability account had a credit balance of $740 on January
1, 2019, calculate the balance at January 31, 2019 a er the entries above were posted.

Exercises
375
EXERCISE 9–5
(LO2)
An extract from the trial balance of Paragon Corpora on at December 31, 2018 is reproduced
below:
Amount in
Amount in
unadjusted
adjusted
trial balance trial balance
a.
Salaries expense (J. Smith)
$50,000
$52,000
b. Employee income taxes payable
-0-
500
c.
Employment insurance payable
1,000
96
d. Government pension payable
-0-
160
Addi onal Informa on: Employees pay 2% of their gross salaries to the government employment
insurance plan and 4% of gross salaries to the government pension plan. The company matches
employees’ government pension contribu ons 1 to 1, and employment insurance contribu ons
1.4 to 1.
Required:
a. Prepare the adjus ng entry that was posted, including a plausible descrip on.
b. Prepare the journal entries to record the payments on January 5, 2019 to employee J. Smith
and the Government of Canada.
EXERCISE 9–6
(LO3)
Paul’s Roofing Corpora on paid monthly corporate income tax instalments of $500 commencing
February 15, 2018. The company’s income before income taxes for the year ended December 31,
2018 was $15,000. The corporate income tax rate is 40%. Paul’s Roofing paid the 2018 corporate
income taxes owing on January 31, 2019.
Required:
a. Record the February 15, 2018 payment.
b. Record the 2018 corporate income tax expense.
c. Record the January 31, 2019 payment.

376
Debt Financing: Current and Long-term Liabili es
Leong Corpora on was authorized to issue $500,000 face value bonds on January 1, 2017. The
corpora on issued $100,000 of face value bonds on that date. The bonds will mature on December
31, 2020. Interest is paid semi-annually on June 30 and December 31 each year. The bond interest
rate per the terms of the indenture is 12% per year.
EXERCISE 9–7
(LO4)
Leong Corpora on was authorized to issue $500,000 face value bonds on January 1, 2017. The
corpora on issued $100,000 of face value bonds on that date. The bonds will mature on December
31, 2020. Interest is paid semi-annually on June 30 and December 31 each year. The bond interest
rate per the terms of the indenture is 12% per year.
Required: Answer the ques ons for each of the following cases.
Case A: The bonds were issued at face value.
Case B: The bonds were issued for $112,000.
Case C: The bonds were issued for $88,000.
a. How much cash does Leong receive for the bonds?
b. How much annual interest must the corpora on pay? On what amount does the corpora on
pay?
c. Prepare the journal entry to record the sale of the bonds.
d. Record the entries applicable to interest and straight-line amor za on for June 30, 2017 and
for December 31, 2017.
EXERCISE 9–8
(LO4)
Bonds Issued at a Discount and Re red
On January 1, 2017, the date of bond authoriza on, Nevada Inc. issued a 3-year, 12-per cent bond
with a face value of $100,000 at 94. Semi-annual interest is payable on June 30 and December 31.
Required:
a. Prepare journal entries to record the following transac ons:
i. The issuance of the bonds.
ii. The interest payment on June 30, 2017.

Exercises
377
iii. The amor za on of the discount on June 30, 2017 (use the straight-line method of
amor za on).
b. Calculate the amount of interest paid in cash during 2017 and the amount of interest ex-
pense that will appear in the 2017 income statement.
c. Prepare a par al balance sheet at December 31, 2017 showing how the bonds payable and
the discount on the bonds should be shown on the balance sheet.
d. Prepare the journal entry to record the re rement of the bonds on December 31, 2019.
e. Prepare the journal entry on January 1, 2018, assuming the bonds were called at 102.
EXERCISE 9–9
(LO4)
Bonds Issued at a Premium and Re red
On January 1, 2019, the date of bond authoriza on, Sydney Corp. issued 3-year, 12-per cent bonds
with a face value of $200,000 at 112. Semi-annual interest is payable on June 30 and December
31.
Required:
a. Prepare the journal entries to record the following transac ons:
i. The issuance of the bonds.
ii. The interest payment on June 30, 2019.
iii. The amor za on of the premium on June 30, 2019 (use the straight-line method of
amor za on).
b. Calculate the amount of interest paid in cash during 2019 and the amount of interest ex-
pense that will appear in the 2019 income statement. Why are these amounts different?
c. Prepare a par al balance sheet at December 31, 2019 showing how the bonds payable and
the premium on bonds should be shown on the balance sheet.
d. Prepare the journal entry on January 1, 2022 when the bonds were called at 106.
EXERCISE 9–10
(LO4)
Bonds Issued between Interest Dates
On September 1, 2017, Harvort Inc. issues $100,000, 10-year, 8% bonds at par. Interest is payable
each May 1 and November 1. The company year-end is December 31.
Required: Prepare the journal entries to record the following transac ons:

378
Debt Financing: Current and Long-term Liabili es
a. The issuance of the bonds.
b. The journal entries for 2018.
c. The bond at maturity.
d. Prepare a par al balance sheet at December 31, 2018 showing how the bonds and interest
payable should be shown on the balance sheet.
EXERCISE 9–11
(LO5)
Long Term Loan Payable
Rosedale Corp. obtained a $50,000 loan from Second Capital Bank on January 1, 2021. It purchases
a piece of heavy equipment for $48,000 on the same day. The loan bears interest at 6% per year on
the unpaid balance and is repayable in three annual blended payments of $18,705 on December
31 each year.
Required:
a. Prepare the journal entries to record the following transac ons:
i. Receipt of loan proceeds from the bank.
ii. Purchase of the equipment.
b. Prepare the loan repayment schedule.
c. Prepare the journal entry to record the first loan payment.
d. Prepare the liabili es sec on of the balance sheet in good form, including all disclosures,
for this loan at December 31, 2021. (Hint: The current por on of a long-term liability must
be reported.)
EXERCISE 9–12
(LO4)
Required: Complete the following by responding either premium or discount.
a. If the market rate of interest is 15 per cent and the bond interest rate is 10 per cent, the
bonds will sell at a
.
b. If a bond’s interest rate is 10 per cent and the market rate of interest is 8 per cent, the bonds
will sell at a
.

Exercises
379
c. In compu ng the carrying amount of a bond, unamor sed
is subtracted from
the face value of the bond.
d. In compu ng the carrying amount of a bond, unamor sed
is added to the
face value of the bond.
e. If a bond sells at a
, an amount in excess of the face value of the bond is
received on the date of issuance.
f. If a bond sells at a
, an amount less than the face value of the bond is received
on the date of issuance.
EXERCISE 9–13
(LO4)
On January 1, 2019, the date of bond authoriza on, Nevada Inc. issued a 3-year, 12-per cent bond
with a face value of $100,000 at 94. Semi-annual interest is payable on June 30 and December 31.
Required: Prepare the journal entry to record the issuance of the bonds on January 1, 2019.
EXERCISE 9–14
(LO4)
On January 1, 2019, the date of bond authoriza on, Sydney Corp. issued 3-year, 12-per cent bonds
with a face value of $200,000 at 112. Semi-annual interest is payable on June 30 and December
31.
Required: Prepare the journal entry to record the issuance of the bonds on January 1, 2019.
EXERCISE 9–15
(LO5)
Rosedale Corp. obtained a $50,000 loan from Second Capital Bank on January 1, 2019. It pur-
chased a piece of heavy equipment for $48,000 on the same day. The loan bears interest at 6%
per year on the unpaid balance and is repayable in three annual blended payments of $18,705 on
December 31 each year.
Required:
a. Prepare the journal entries to record the following transac ons:
i. Receipt of loan proceeds from the bank.
ii. Purchase of the equipment.

380
Debt Financing: Current and Long-term Liabili es
b. Prepare the loan repayment schedule.
c. Prepare the journal entry to record the first loan payment.
Problems
PROBLEM 9–1
(LO5)
Zinc Corp. obtained a $100,000 loan from First Capital Bank on December 31, 2015. It purchased
a piece of heavy equipment for $95,000 on January 2, 2016. The loan bears interest at 8% per year
on the unpaid balance and is repayable in four annual blended payments of $30,192 on December
31 each year, star ng in 2016.
Required:
1. Prepare the journal entries to record the following transac ons:
(a) Receipt of loan proceeds from the bank.
(b) Purchase of the equipment.
2. Prepare the loan repayment schedule in the following format:
Zinc Corp.
Loan Repayment Schedule
A
B
C
D
E
(D
− B)
(A
− C)
Year
Beginning
Reduc on
Total
Ending
Ended
Loan
Interest
of Loan
Loan
Loan
Dec. 31
Balance
Expense
Payable
Payment
Balance
2016
2017
2018
2019
3. Prepare the journal entry to record the last loan payment.
4. Prepare a par al balance sheet showing the loan liability at December 31, 2017

Chapter 10
Equity Financing
Corpora ons some mes finance a large por on of their opera ons by issuing equity in the form
of shares. This chapter discusses in detail the nature of the corporate form of organiza on, the
different types of shares used to obtain funds for business ac vi es, and how these transac ons
are recorded. It also expands on the concept of dividends.
Chapter 10 Learning Objec ves
LO1 – Iden fy and explain characteris cs of the corporate form of organiza on and classes
of shares.
LO2 – Record and disclose preferred and common share transac ons including share splits.
LO3 – Record and disclose cash dividends.
LO4 – Record and disclose share dividends.
LO5 – Calculate and explain the book value per share ra o.
Concept Self-Check
Use the following as a self-check while working through Chapter
1. What are the characteris cs of a corpora on?
2. What types of shares can a corpora on issue to investors?
3. What are the rights of common shareholders in a corpora on?
4. How are the rights of common shareholders different from those of preferred shareholders?
5. How are share transac ons recorded?
6. When both preferred and common shares are issued by a corpora on, how is this disclosed
in the equity sec on of the balance sheet?
7. What is meant by authorized shares?
8. How do issued shares differ from outstanding shares?
381
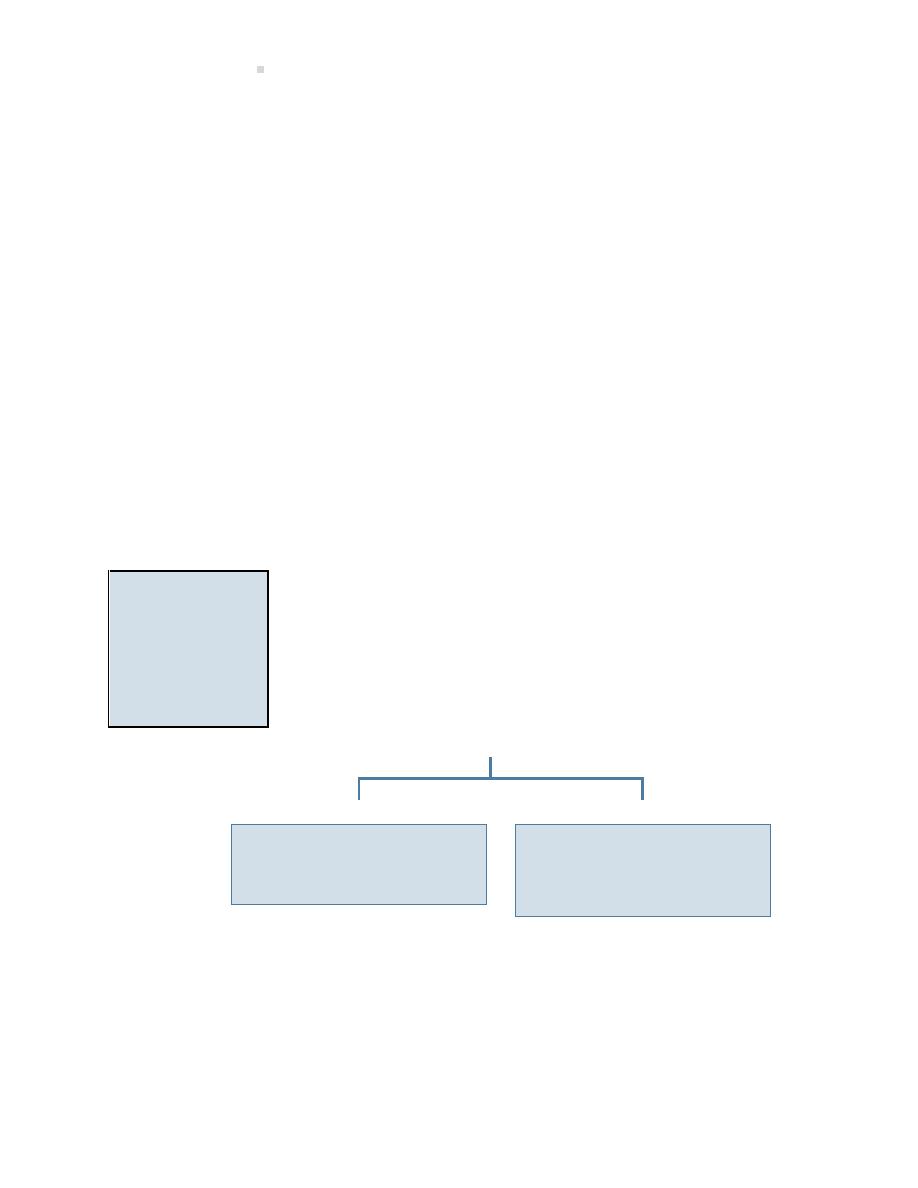
382
Equity Financing
9. What is a share split?
10. How does a share split affect equity?
11. How are cash dividends recorded?
12. What is a share dividend and how is it recorded?
13. How does a share dividend affect equity?
14. What is book value and how is it calculated?
NOTE: The purpose of these ques ons is to prepare you for the concepts introduced in the chap-
ter. Your goal should be to answer each of these ques ons as you read through the chapter. If,
when you complete the chapter, you are unable to answer one or more the Concept Self-Check
ques ons, go back through the content to find the answer(s). Solu ons are not provided to these
ques ons.
10.1 The Corporate Structure
LO1 – Iden fy
and explain char-
acteris cs of the
corporate
form
of
organiza on
and classes of
shares.
The accoun ng equa on expresses the rela onship between assets owned
by a corpora on and the claims against those assets by creditors and share-
holders. Accoun ng for equity in a corpora on requires a dis nc on be-
tween the two main sources of shareholders’ equity: share capital and
retained earnings. Their rela onship to the accoun ng equa on is shown
in Figure
ASSETS =
LIABILITIES +
EQUITY
SHARE CAPITAL
RETAINED EARNINGS
This is the amount sharehold-
ers have paid to purchase
ownership interests in a com-
pany.
This is the total net income
earned by a company over
its life that has not been dis-
tributed to shareholders as
dividends.
Figure 10.1: Share Capital Versus Retained Earnings
Corporate Characteris cs
A unique characteris c of corpora ons is that they are legally separate from their owners, who
are called shareholders. Each unit of ownership of a corpora on is called a share. If a corpora on

10.1. The Corporate Structure
383
issues 1,000 shares and you own 100 of them, you own 10% of the company. Corpora ons can be
privately-held shares or publicly-held shares. A privately-held corpora on’s shares are not issued
for sale to the general public. A publicly-held corpora on offers its shares for sale to the gen-
eral public, some mes on a stock market like the Toronto Stock Exchange or the New York Stock
Exchange.
A corpora on has some of the same rights and obliga ons as individuals. For instance, it pays
income taxes on its earnings, can enter into legal contracts, can own property, and can sue and
be sued. A corpora on also has dis nc ve features. It is separately regulated by law, has an
indefinite life, its owners have limited liability, and it can usually acquire capital more easily than
an individual. These features are discussed below.
• Crea on by law
A corpora on is formed under legisla on enacted by a country or a poli cal jurisdic on within
it. For instance, in Canada a corpora on can be formed under either federal or provincial laws.
Although details may vary among jurisdic ons, a legal document variously described as ar cles of
incorpora on, a memorandum of associa on, or le ers patent is submi ed for considera on to
the appropriate government by prospec ve shareholders. The document lists the classes or types
of shares that will be issued as well as the total number of shares of each class that can be issued,
known as the authorized number of shares.
When approved, the government issues a cer ficate of incorpora on. Investors then purchase
shares from the corpora on. They meet and elect a board of directors. The board formulates cor-
pora on policy and broadly directs the affairs of the corpora on. This includes the appointment
of a person in charge of day-to-day opera ons, o en called a president, chief execu ve officer, or
similar tle. This person in turn has authority over the employees of the corpora on.
A shareholder or group of shareholders who control more than 50% of the vo ng shares of a
corpora on are able to elect the board of directors and thus direct the affairs of the company. In a
large public corpora on with many shareholders, minority shareholders with similar ideas about
how the company should be run some mes delegate their votes to one person who will vote on
their behalf by signing a proxy statement. This increases their rela ve vo ng power, as many other
shareholders may not par cipate in shareholders’ mee ngs.
Shareholders usually meet annually to vote for a board of directors — either to re-elect the current
directors or to vote in new directors. The board meets regularly, perhaps monthly or quarterly,
to review the opera ons of the corpora on and to set policies for future opera ons. The board
may decide to distribute some assets of the corpora on as a dividend to shareholders. It may
also decide that some percentage of the assets of the corpora on legally available for dividends
should be made unavailable; in this case, a restric on is created. Accoun ng for such restric ons
is discussed later in this chapter.
Wherever it is incorporated, a company is generally subject to the following regula ons:
1. It must provide mely financial informa on to investors.

384
Equity Financing
2. It must file required reports with the government.
3. It cannot distribute profits arbitrarily but must treat all shares of the same class alike.
4. It is subject to special taxes and fees.
Despite these requirements, a corpora on’s advantages usually outweigh its disadvantages when
compared to other forms of business such as a proprietorship or partnership. These features of a
corpora on are described further below. Proprietorships and partnerships are discussed in more
detail in Chapter
• Indefinite life
A corpora on has an existence separate from that of its owners. Individual shareholders may
die, but the corporate en ty con nues. The life of a corpora on comes to an end only when it is
dissolved, becomes bankrupt, or has its charter revoked for failing to follow laws and regula ons.
• Limited liability
The corpora on’s owners are liable only for the amount that they have invested in the corpora on.
If the corpora on fails, its assets are used to pay creditors. If insufficient assets exist to pay all
debts, there is no further liability on the part of shareholders. This situa on is in direct contrast
to a proprietorship or a partnership. In these forms of organiza on, creditors have full recourse to
the personal assets of the proprietorship or partners if the business is unable to fulfill its financial
obliga ons. For the protec on of creditors, the limited liability of a corpora on must be disclosed
in its name. The words “Limited,” “Incorporated,” or “Corpora on” (or the abbrevia ons Ltd., Inc.,
or Corp.) are o en used as the last word of the name of a company to indicate this corporate form.
• Ease of acquiring capital
Issuing shares allows many individuals to par cipate in the financing of a corpora on. Both small
and large investors are able to par cipate because of the rela vely small cost of a share, and
the ease with which ownership can be transferred — shares are simply purchased or sold. Large
amounts of capital can be raised by a corpora on because the risks and rewards of ownership can
be spread among many investors.
A corpora on only receives money when shares are first issued. Once a share is issued, it can be
bought and sold a number of mes by various investors. These subsequent transac ons between
investors do not affect the corpora on’s balance sheet.

10.1. The Corporate Structure
385
Income Taxes on Earnings
Because corpora ons are considered separate legal en
es, they pay income taxes on their earn-
ings. To encourage risk-taking and entrepreneurial ac vity, certain types of corpora ons may be
taxed at rates that are lower than other corpora ons and individual shareholders’ income tax
rates. This can encourage research and development ac vity or small-company start-ups, for in-
stance.
Classes of Shares
There are many types of shares, with differences related to vo ng rights, dividend rights, liquida-
on rights, and other preferen al features. The rights of each shareholder depend on the class or
type of shares held.
Every corpora on issues common shares. The rights and privileges usually a ached to common
shares are outlined below.
• The right to par cipate in the management of the corpora on by vo ng at shareholders’
mee ngs (this par cipa on includes vo ng to elect a board of directors; each share normally
corresponds to one vote).
• The right to receive dividends when they are declared by the corpora on’s board of direc-
tors.
• The right to receive assets upon liquida on of the corpora on.
• The right to appoint auditors through the board of directors.
For other classes of shares, some or all of these rights are usually restricted. The ar cles of incor-
pora on may also grant the shareholders the pre-emp ve right to maintain their propor onate
interests in the corpora on if addi onal shares are issued.
If the company is successful, common shareholders may receive dividend payments. As well, the
value of common shares may increase. Common shareholders can submit a proposal to raise
any ma er at an annual mee ng and have this proposal circulated to other shareholders at the
corpora on’s expense. If the corpora on intends to make fundamental changes in its business,
these shareholders can o en require the corpora on to buy their shares at their fair value. In
addi on, shareholders can apply to the courts for an appropriate remedy if they believe their
interests have been unfairly disregarded by the corpora on.
Some corpora ons issue different classes of shares in order to appeal to as large a group of in-
vestors as possible. This permits different risks to be assumed by different classes of shareholders
in the same company. For instance, a corpora on may issue common shares but divide these into
different classes like class A and class B common shares. When dividends are declared, they might
only be paid to holders of class A shares.

386
Equity Financing
Preferred shares is a class of share where the shareholders are en tled to receive dividends before
common shareholders. These shares usually do not have vo ng privileges. Preferred shareholders
typically assume less risk than common shareholders. In return, they receive only a limited amount
of dividends. Issuing preferred shares allows a corpora on to raise addi onal capital without re-
quiring exis ng shareholders to give up control. Preferred shares are listed before common shares
in the equity sec on of the balance sheet. Other characteris cs of preferred shares and dividend
payments are discussed later in this chapter.
The shares of a corpora on can have a different status at different points in me. They can be
unissued or issued, issued and outstanding, or issued and reacquired by the corpora on (called
treasury shares). The meaning of these terms is summarized in Figure
:
AUTHORIZED SHARES
Total number of shares that can be issued.
UNISSUED SHARES
ISSUED SHARES
Shares that have not yet
been sold.
Shares that have been sold
but may have been repur-
chased by the corpora on.
ISSUED AND OUTSTANDING
SHARES
REQUIRED SHARES
(or TREASURY SHARES)
Shares that have been sold
and are held by investors.
Shares that have been is-
sued, were once held by
shareholders, and have now
been reacquired by the cor-
pora on. They may be reis-
sued or cancelled at a later
date. (To cancel a share is
to prevent it from being
sold again.)
Figure 10.2: Status of Shares
The Debt Versus Equity Financing Decision
Many factors influence management in its choice between the issue of debt and the issue of share
capital. One of the most important considera ons is the poten al effect of each of these financing
methods on the present shareholders.
Consider the example of Old World Corpora on, which has 100,000 common shares outstanding,
is a growth company, and is profitable. Assume Old World requires $30 million in cash to finance

10.1. The Corporate Structure
387
a new plant. Management is currently reviewing three financing op ons:
1. Issue 12% debt, due in three years
2. Issue 300,000 preferred shares at $100 each (dividend $8 per share annually)
3. Issue an addi onal 200,000 common shares at $150 each.
Management es mates that the new plant should result in income before interest and tax of $6
million. Management has prepared the following analysis to compare and evaluate each financing
op on.
Plan 1:
Plan 2:
Plan 3:
Issue
Issue
Preferred
Common
Issue Debt
Shares
Shares
Income before interest and income taxes
$ 6,000,000
$ 6,000,000
$ 6,000,000
Less: Interest expense ($30M x 12%)
(3,600,000)
-0-
-0-
Income before taxes
$ 2,400,000
$ 6,000,000
$ 6,000,000
Less: Income taxes assumed to be 50%
(1,200,000)
(3,000,000)
(3,000,000)
Net income
1,200,000
3,000,000
3,000,000
Less: Preferred dividends (300,000 x $8 per share)
-0-
(2,400,000)
-0-
Net income available to common shareholders
$ 1,200,000
$
600,000
$ 3,000,000
Number of common shares outstanding
100,000
100,000
300,000
Earnings per common share
$
12
$
6
$
10
Plan 1, the issue of debt, has several advantages for exis ng common shareholders.
• Advantage 1: Earnings per share
If the addi onal long-term financing were acquired through the issue of debt, the corporate earn-
ings per share (EPS) on each common share would be $12. This EPS is greater than the EPS earned
through financing with either preferred shares or addi onal common shares. On this basis alone,
the issue of debt is more financially a rac ve to exis ng common shareholders.
• Advantage 2: Control of the corpora on
1
The amount of net income earned in a year can be divided by the number of common shares outstanding to
establish how much return has been earned for each outstanding share. EPS is calculated as:
Net income
Number of common shares outstanding
EPS is quoted in financial markets and is disclosed on the income statement of publicly-traded companies. It is
discussed in more detail in Chapter
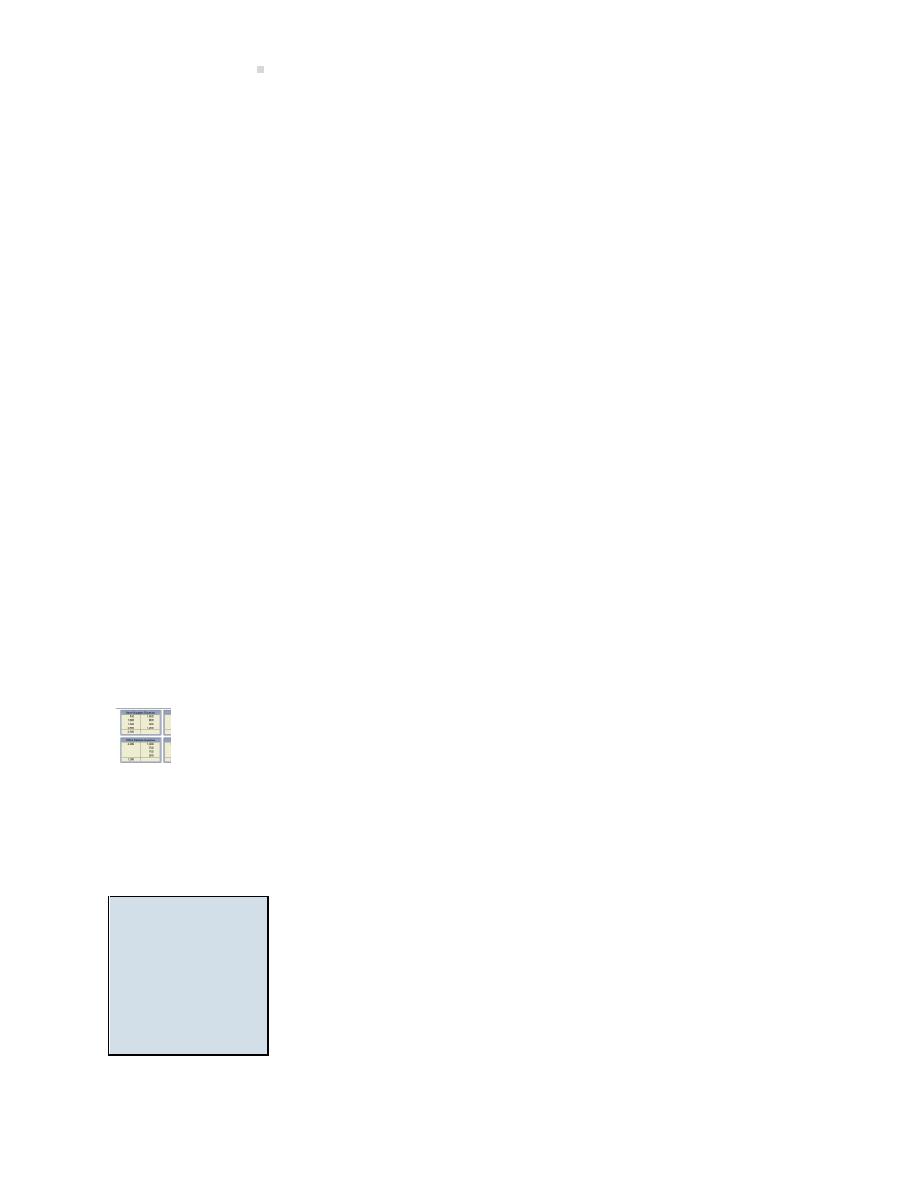
388
Equity Financing
Creditors have no vote in the affairs of the corpora on. If addi onal common shares were issued,
there might be a loss of corporate control by exis ng shareholders because ownership would be
distributed over a larger number of shareholders, or concentrated in the hands of one or a few
new owners. In the Old World case, issuing common shares would increase the number threefold
from 100,000 to 300,000 shares.
• Advantage 3: Income taxes expense
Interest expense paid on debt is deduc ble from income for income tax purposes. Dividend pay-
ments are distribu ons of retained earnings, which is a er-tax income. Thus, dividends are not
deduc ble again for tax purposes. With a 50% income tax rate, the a er-tax interest expense to
the corpora on is only 6% (12% x 50%), with the other 6% being used to offset income tax that
would be otherwise due. However, for preferred shares 8% ($8/$100) of the money raised will be
paid to the new shareholders as preferred dividends in the first year.
Debt Financing Disadvantages
There are also some disadvantages in long-term financing with debt that must be carefully re-
viewed by management and the board of directors. The most serious disadvantage is the pos-
sibility that the corpora on might earn less than $6 million before interest expense and income
taxes. The interest expense is a fixed amount. It must be paid to creditors at specified mes, unlike
dividends.
Another disadvantage is the fact that debt must be repaid at maturity, whether or not the corpo-
ra on is financially able to do so. Shares do not have to be repaid.
An explora on is available on the Lyryx site. Log into your Lyryx course to run
.
10.2 Recording Share Transac ons
LO2
–
Record
and
disclose
preferred
and
common
share
transac ons
including
share
splits.
Shares have a stated (or nominal) value—the amount for which they are
issued. Alterna vely, but rarely, shares will have a par-value which is the
amount stated in the corporate charter below which shares cannot be sold
upon ini al offering. For consistency, we will assume all shares have a
stated value.
To demonstrate the issuance and financial statement presenta on of shares,
assume that New World Corpora on is authorized to issue share capital
consis ng of an unlimited number of vo ng common shares and 100,000
non-vo ng preferred shares.
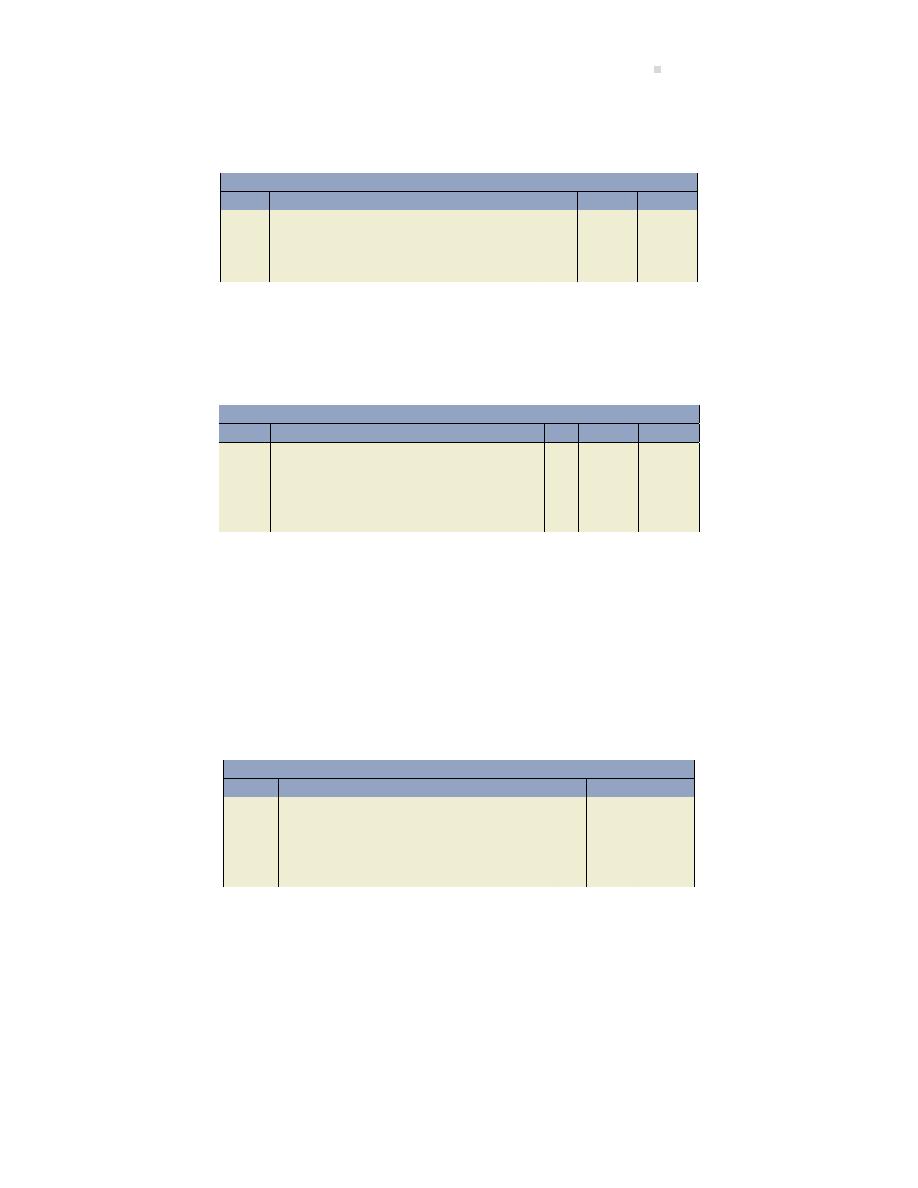
10.2. Recording Share Transac ons
389
Transac on 1: On January 1, 2015, New World sells 1,000 common shares to its first shareholders
for $10 per share, or $10,000 cash. New World records the following entry:
General Journal
Date
Account/Explana on
PR
Debit
Credit
Jan 1
Cash . . . . . . . . . . . . . . . . . . . . . . . . . . . . . . . . . .
10,000
Common Shares . . . . . . . . . . . . . . . . . . . .
10,000
To record the issuance of 1,000 common
shares at $10 per share.
Transac on 2: On February 1, 2015, 2,500 preferred shares are issued to the owner of land and
buildings that have a fair value of $35,000 and $50,000, respec vely. The journal entry to record
this transac on is:
General Journal
Date
Account/Explana on
PR
Debit
Credit
Feb 1
Land . . . . . . . . . . . . . . . . . . . . . . . . . . . . . . . . . .
35,000
Building . . . . . . . . . . . . . . . . . . . . . . . . . . . . . . .
50,000
Preferred Shares . . . . . . . . . . . . . . . . . . . .
85,000
To record the issuance of 2,500 preferred
shares in exchange for land and buildings.
Usually, one or more individuals decide to form a corpora on and before the corpora on is cre-
ated, may then use their own funds to pay for legal and government fees, travel and promo onal
costs, and so on. When the corpora on is legally formed, it is not unusual for the corpora on to
issue shares to these organizers for these amounts. These expenditures are referred to as organi-
za on costs (start-up costs) and are expensed.
Transac on 3: On March 1, 2015, 500 common shares are issued to the organizers of New World
to pay for their services, valued at $5,000. The journal entry to record this transac on is:
General Journal
Date
Account/Explana on
PR
Debit
Credit
Mar 1
Organiza on Expense . . . . . . . . . . . . . . . . . .
5,000
Common Shares . . . . . . . . . . . . . . . . . . . .
5,000
To record the issuance of 500 common
shares in exchange for organiza on ef-
forts.
Assuming no further share transac ons and a retained earnings balance of $480,000, the equity
sec on of the New World Corpora on balance sheet would show the following at December 31,
2015:
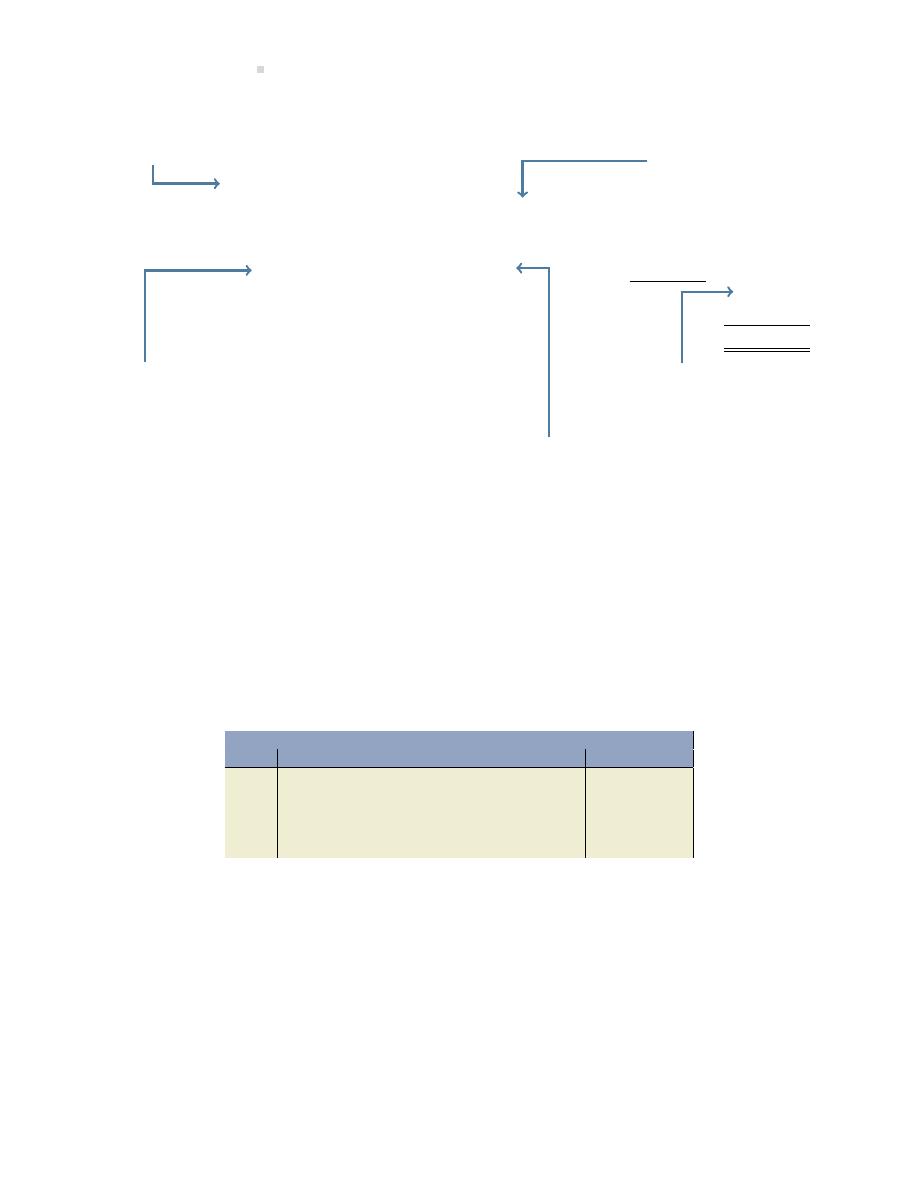
390
Equity Financing
Equity Sec on of the Balance Sheet
Contributed capital
Preferred shares, 100,000 shares authorized,
2,500 shares issued and outstanding . . . . . . . . . .
$85,000
Common shares, unlimited shares authorized,
1,500 shares issued and outstanding . . . . . . . . . .
15,000
Total contributed capital . . . . . . . . . . . . . . . . . . . . . . .
$100,000
Retained earnings . . . . . . . . . . . . . . . . . . . . . . . . . . . . . . .
480,000
Total equity . . . . . . . . . . . . . . . . . . . . . . . . . . . . . . . . . . . . .
$580,000
Heading required when there is more
than one share capital account on a
classified balance sheet.
1,500 shares issued
means 1,500 shares
have been sold.
100,000 shares authorized
means there are 100,000
shares available for sale.
1,500 shares outstanding means 1,500 shares are held by shareholders (shares that have
been issued but are not outstanding means the corpora on purchased its own shares).
A Total contributed capital
subtotal is required if there is
more than one class of shares.
Transac on 4: Corporate legisla on permits a company to reacquire some of its shares, provided
that the purchase does not cause insolvency. A company can repurchase and then cancel the
repurchased shares. When repurchased shares are cancelled, they are no longer issued and no
longer outstanding. A company can also repurchase shares and then hold them in treasury. Trea-
sury shares are issued but not outstanding. A company can use treasury shares for purposes such
as giving to employees as an incen ve or bonus.
Assume that New World Corpora on decides to repurchase 200 common shares on December 1,
2016 and hold them in treasury. Assume that the price of each share is the average issue price of
the outstanding common shares, or $10. The journal entry to record the repurchase is:
General Journal
Date
Account/Explana on
PR
Debit
Credit
Dec 1
Common Shares . . . . . . . . . . . . . . . . . . . . . . .
2,000
Cash . . . . . . . . . . . . . . . . . . . . . . . . . . . . . . .
2,000
To record the repurchase of 200 common
shares at $10 per share to be held in trea-
sury.
Assuming no further transac ons, the equity sec on of the New World Corpora on balance sheet
would show the following at December 31, 2016:
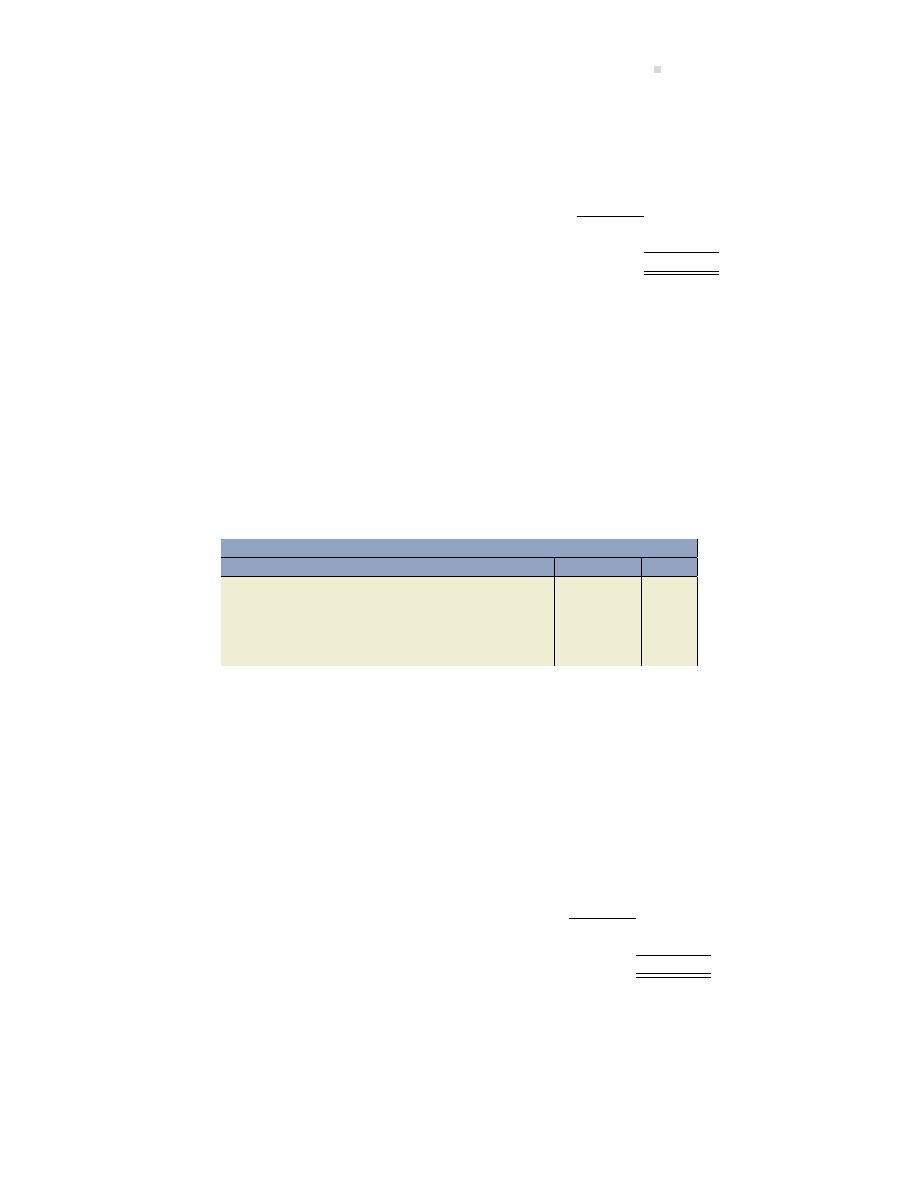
10.2. Recording Share Transac ons
391
Equity Sec on of the Balance Sheet
Contributed capital
Preferred shares, 100,000 shares authorized,
2,500 shares issued and outstanding . . . . . . . . . . . . .
$85,000
Common shares, unlimited shares authorized,
1,500 shares issued; 1,300 shares outstanding . . . .
13,000
Total contributed capital . . . . . . . . . . . . . . . . . . . . . . . . . .
$98,000
Retained earnings . . . . . . . . . . . . . . . . . . . . . . . . . . . . . . . . . .
480,000
Total equity . . . . . . . . . . . . . . . . . . . . . . . . . . . . . . . . . . . . . . . .
$578,000
No ce that the repurchase of shares caused a decrease in both the paid-in capital for the common
shares ($2,000 decrease) and in the number of shares outstanding decreased (decreased by 200
shares). If the 200 shares had been cancelled, both the number of shares issued and outstanding
would have decreased by 200 shares.
Transac on 5: Shares Re rement
If New World Corpora on decides to repurchase and cancel 100 common shares on December 15,
2016. Assume that the purchase price is $9, which is less than the average issue price of $10 per
share. The entry would be:
General Journal
Date
Account/Explana on
PR
Debit
Credit
Dec 15
Common Shares ($10
× 100 shares) . . . . .
1,000
Contributed surplus, shares re rement
100
Cash ($9
× 100 shares) . . . . . . . . . . . . . .
900
To record the repurchase of 100 common
shares at $9 per share.
The contributed surplus account is reported in the equity sec on of the balance sheet, below the
share capital accounts. The share capital accounts and the contributed capital account are then
subtotalled and reported as total contributed capital of $99,100 as shown below:
Equity Sec on of the Balance Sheet
Contributed capital
Preferred shares, 100,000 shares authorized,
2,500 shares issued and outstanding . . . . . . . . . . .
$85,000
Common shares, unlimited shares authorized,
1,400 shares issued and outstanding . . . . . . . . . . .
14,000
Contributed surplus
100
Total contributed capital . . . . . . . . . . . . . . . . . . . . . . . .
$99,100
Retained earnings . . . . . . . . . . . . . . . . . . . . . . . . . . . . . . . .
480,000
Total equity . . . . . . . . . . . . . . . . . . . . . . . . . . . . . . . . . . . . . .
$579,100
If New World Corpora on also repurchases and cancels another 150 common shares on December
17, 2016, at a price of $11, this is more than the average issue price of $10 per share, and the entry
would be:
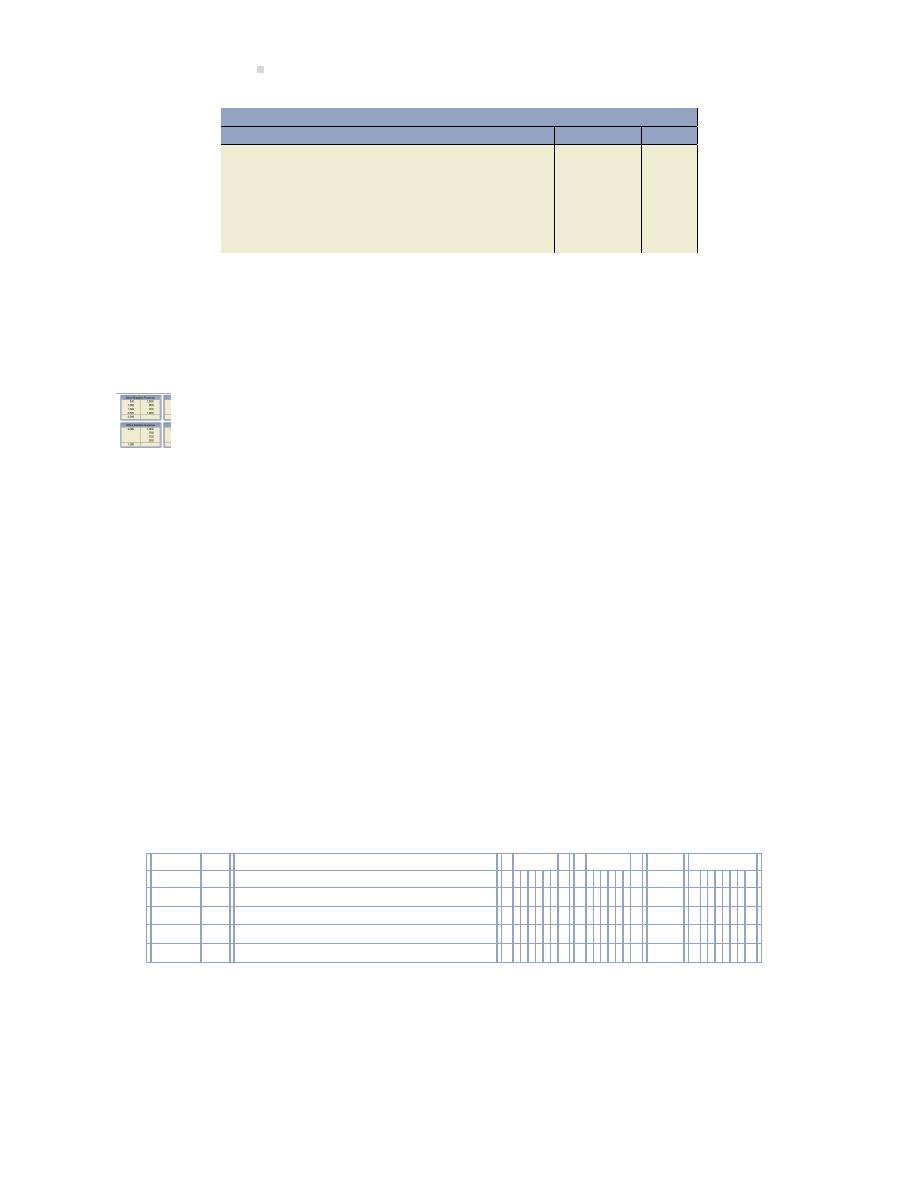
392
Equity Financing
General Journal
Date
Account/Explana on
PR
Debit
Credit
Dec 17
Common Shares ($10
× 150 shares) . . . . .
1,500
Contributed suplus, shares re rement . . .
100
Retained earnings . . . . . . . . . . . . . . . . . . . . . .
50
Cash ($11
× 150 shares). . . . . . . . . . . . .
1650
To record the repurchase of 150 common
shares at $11 per share.
The excess of the purchase price of $11 over the average shares issue price of $10 totals $150 for
150 shares. This would be debited to retained earnings. However, in this case, New World already
has contributed surplus of $100 from the December 15 shares cancella on, so this amount must
be reversed first. The remainder, or $50, is debited to retained earnings.
An explora on is available on the Lyryx site. Log into your Lyryx course to run
.
Share Splits
A corpora on may find its shares are selling at a high price on a stock exchange, perhaps pu ng
them beyond the reach of many investors. To increase the marketability of a corpora on’s shares,
management may opt for a share split. A share split increases the number of shares issued and
outstanding, and lowers the cost of each new share. The originally-issued shares are exchanged
for a larger number of new shares.
Assume that on December 1, 2017 New World Corpora on declares a 3-for-1 common share split.
This results in three new common shares replacing each currently-issued and outstanding com-
mon share. The number of issued and outstanding shares has now been tripled. The market price
of each share will decrease to about one-third of its former market price. Since there is no change
in the dollar amount of common shares, no debit-credit entry is required to record the share split.
Instead, a memorandum entry would be recorded in the general ledger indica ng the new number
of shares issued and outstanding, as follows:
Common Shares
Acct. No. 320
Date
Descrip on
Debit
Credit
DR/CR
Balance
2017
Dec.
1
Memorandum Entry:
Because of a 3-for-1 share split, the issued and outstanding common shares
increased, respec vely, from 1,500 and 1,300 to 4,500 and 3,900.
The dollar amount shown on the balance sheet and statement of changes in equity will not change.
The only change is an increase in the number of issued and outstanding common shares. A er
the share split, the equity sec on of the New World Corpora on would appear as follows:
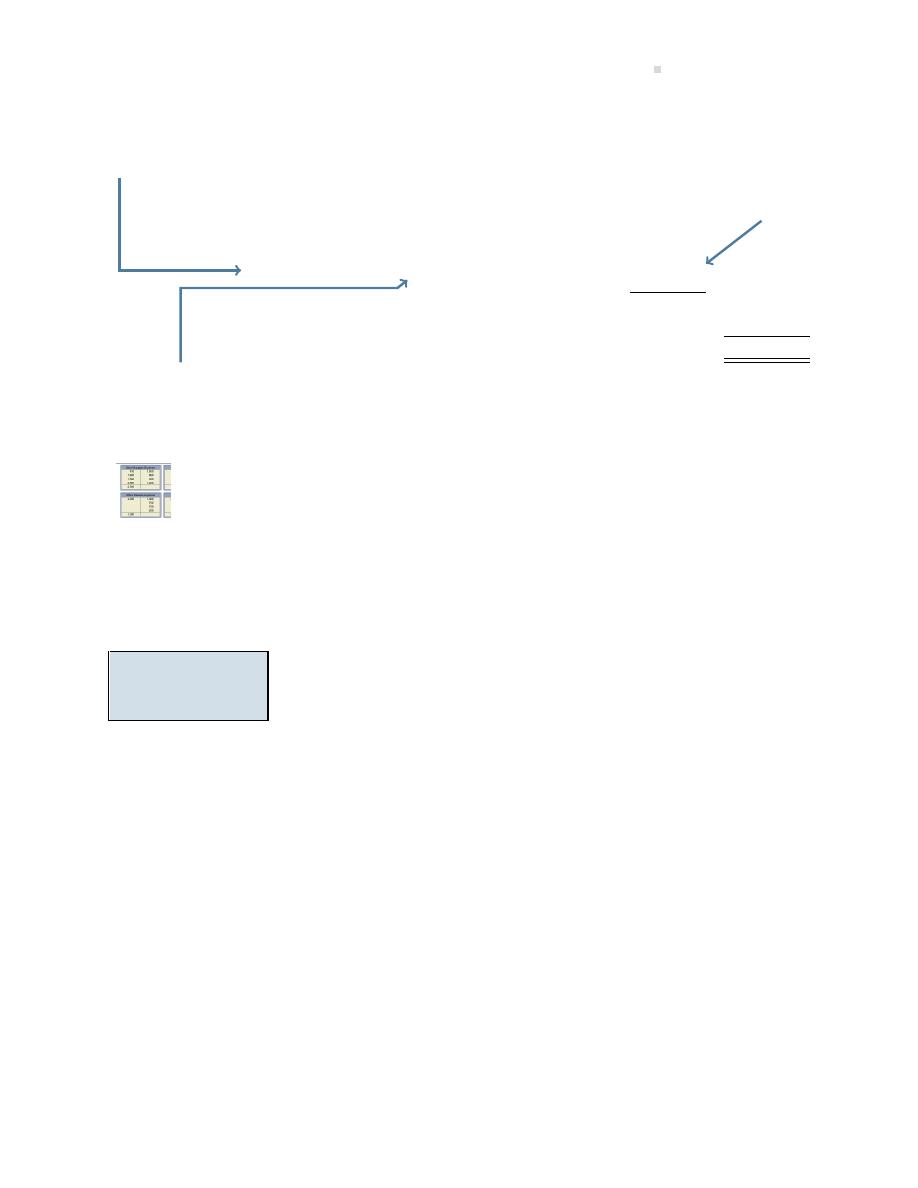
10.3. Cash Dividends
393
Equity Sec on of the Balance Sheet
Contributed capital
Preferred shares, 100,000 shares authorized,
2,500 shares issued and outstanding . . . . . . . . . .
$85,000
Common shares, unlimited shares authorized,
4,500 shares issued; 3,900 shares outstanding . .
13,000
Total contributed capital . . . . . . . . . . . . . . . . . . . . . . .
$98,000
Retained earnings . . . . . . . . . . . . . . . . . . . . . . . . . . . . . . .
480,000
Total equity . . . . . . . . . . . . . . . . . . . . . . . . . . . . . . . . . . . . .
$578,000
The number of common shares is-
sued changed from 1,500 shares
before the share split to 4,500 a er
the share split.
The number of common shares outstanding
changed from 1,300 shares before the share
split to 3,900 a er the share split.
The paid-in
capital is not
affected by a
share split.
An explora on is available on the Lyryx site. Log into your Lyryx course to run
.
10.3 Cash Dividends
LO3 – Record and
disclose cash div-
idends.
Both creditors and shareholders are interested in the amount of assets
that can be distributed as dividends. Dividends The paid-in share capital
is not available for distribu on as dividends. This helps protect creditors
by preven ng shareholders from withdrawing assets as dividends to the
point where remaining assets become insufficient to pay creditors. For ex-
ample, assume total assets are $40,000; total liabili es $39,000; and total
equity $1,000, consis ng of $900 in common shares and $100 of retained
earnings. The maximum dividends that could be declared in this situa on
is $100, the balance in retained earnings.
Dividend Policy
Some mes the board of directors may choose not to declare any dividends. There may be financial
condi ons in the corpora on that make the payment imprac cal.
• Considera on 1: There may not be adequate cash
Corpora ons regularly reinvest their earnings in assets in order to make more profits. In this way,
growth occurs and reliance on creditor financing can be minimized. As a result, there may not be

394
Equity Financing
enough cash on hand to declare and pay a cash dividend. The assets of the corpora on may be
ed up in property, plant, and equipment, for instance.
• Considera on 2: A policy of the corpora on may preclude dividend payments
Some corpora ons pay no dividends. Instead, they reinvest their earnings in the business. Share-
holders generally benefit through increased earnings, reflected in increased market price for the
corpora on’s shares. A stated policy to this effect can apprise investors. This type of dividend
policy is o en found in growth-oriented corpora ons.
• Considera on 3: No legal requirement that dividends have to be paid
The board of directors may decide that no dividends should be paid. Legally, there is no require-
ment to do so. If shareholders are dissa sfied, they can elect a new board of directors or sell their
shares.
• Considera on 4: Dividends may be issued in shares of the corpora on rather than in cash
Share dividends may be issued to conserve cash or to increase the number of shares to be traded
on the stock market. Shares dividends are discussed in Sec on
Dividend Declara on
Dividends can be paid only if they have been officially declared by the board of directors. The
board must pass a formal resolu on authorizing the dividend payment. No ces of the dividend
are then published. Once a dividend declara on has been made public, the dividend becomes a
liability and must be paid. An example of a dividend no ce is shown in Figure
.
New World Corpora on
Dividend No ce
On May 25, 2016 the board of directors of New World Corpora on declared a
dividend of $0.50 per share on common shares outstanding (3,900). The dividend
will be paid on June 26, 2016 to shareholders of record on June 7, 2016.
By order of the board
[signed]
Lee Smith
Secretary
May 25, 2016
Figure 10.3: An Example of a Dividend No ce
10.3. Cash Dividends
395
There are three dates associated with a dividend. Usually dividends are declared on one date, the
date of declara on (May 25, 2016 in this case); they are payable to shareholders on a second date,
the date of record (June 7, 2016); and the dividend is paid on a third date, the date of payment
(June 26, 2016).
Date of Declara on
The dividend declara on provides an official no ce of the dividend. It specifies the amount of the
dividend as well as which shareholders will receive the dividend. The liability for the dividend is
recorded in the books of the corpora on at its declara on date.
The following entry would be made in the general ledger of New World Corpora on on May 25,
2016, the date of declara on:
General Journal
Date
Account/Explana on
PR
Debit
Credit
May 25
Cash Dividends Declared . . . . . . . . . . . . . . . .
1,950
Dividends Payable . . . . . . . . . . . . . . . . . .
1,950
To record $0.50 per common share
cash dividend declared; 3,900 shares x
$0.50/share = $1,950.
OR
General Journal
Date
Account/Explana on
PR
Debit
Credit
May 25
Retained Earnings . . . . . . . . . . . . . . . . . . . . . .
1,950
Dividends Payable . . . . . . . . . . . . . . . . . .
1,950
To record $0.50 per common share
cash dividend declared; 3,900 shares x
$0.50/share = $1,950.
If, as shown in the second entry above, retained earnings is debited instead of cash dividends
declared, a closing entry is not required for dividends during the closing process.
Date of Record
Shareholders who own shares on the date of record will receive the dividend even if they have
sold the shares before the dividend is actually paid. No journal entry is made in the accoun ng
records for the date of record.
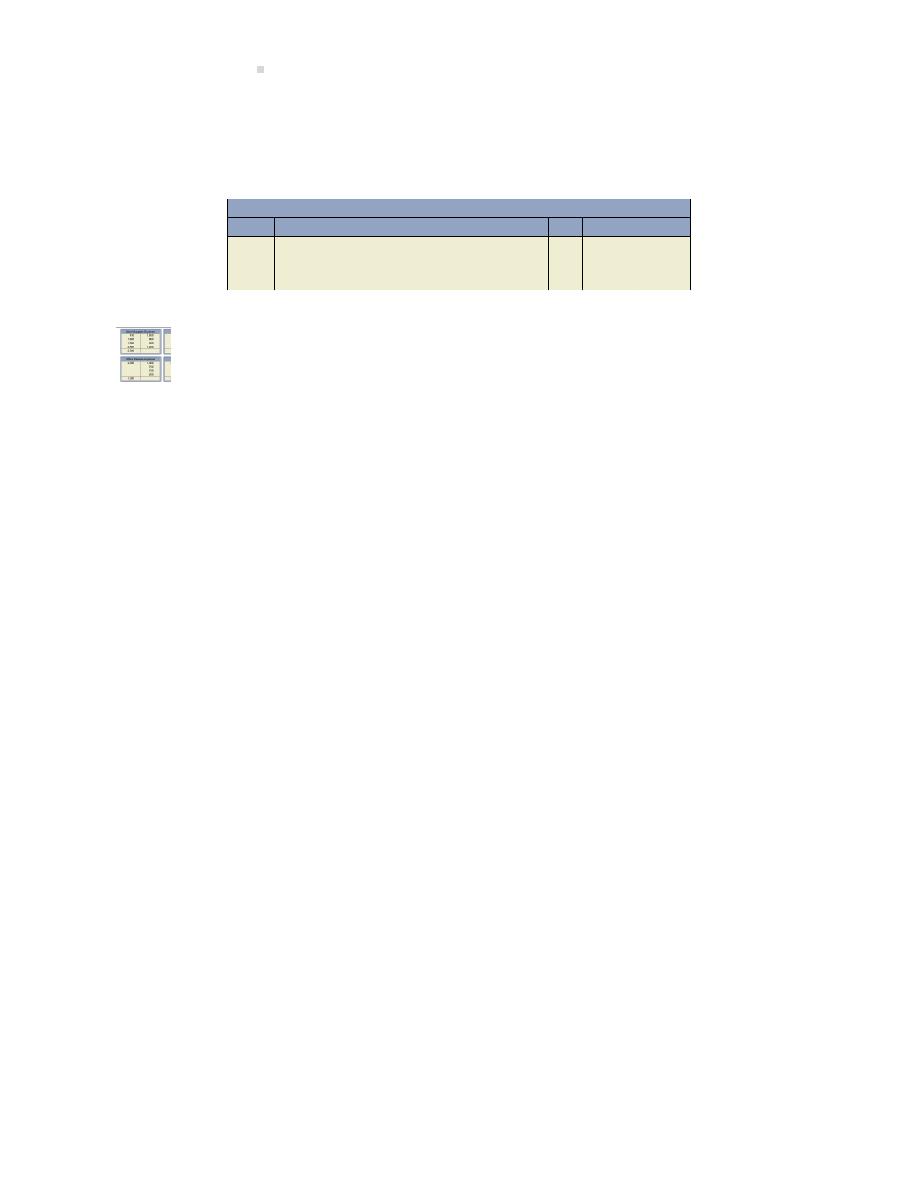
396
Equity Financing
Date of Payment
The dividend is paid on this date and recorded as:
General Journal
Date
Account/Explana on
PR
Debit
Credit
Dividends Payable . . . . . . . . . . . . . . . . . . . . . .
1,950
Cash . . . . . . . . . . . . . . . . . . . . . . . . . . . . . . .
1,950
To record payment of dividend.
An explora on is available on the Lyryx site. Log into your Lyryx course to run
.
Preferred Shareholder Dividends
Preferred shares are offered to a ract investors who have lower tolerance for risk than do common
shareholders. Preferred shareholders are content with a smaller but more predictable share of a
corpora on’s profits. For instance, preferred shareholders are en tled to dividends before any
dividends are distributed to common shareholders. Also, most preferred shares specifically state
what amount of dividends their holders can expect each year. For example, owners of $8 preferred
shares would be paid $8 per share held each year. These dividends are o en paid even if the
corpora on experiences a net loss in a par cular year.
Preferred shares may also have other dividend preferences, depending on what rights have been
a ached to preferred shares at the date of incorpora on. One such preference is the accumu-
la on of undeclared dividends from one year to the next — referred to as cumula ve dividends.
Discussion of other preferences is beyond the scope of this introductory textbook. Cumula ve
dividends are discussed in the next sec on.
Cumula ve Dividend Preferences
Cumula ve preferred shares require that any unpaid dividends accumulate from one year to the
next and are payable from future earnings when a dividend is eventually declared by a corpora on.
These accumulated dividends must be paid before any dividends are paid on common shares. The
unpaid dividends are called dividends in arrears. Dividends in arrears are not recorded as a liability
on the balance sheet of the company un l they have been declared by the board of directors.
However, disclosure of dividends in arrears must be made in a note to the financial statements.
If a preferred share is non-cumula ve, a dividend not declared by the board of directors in any
one year is never paid to shareholders.
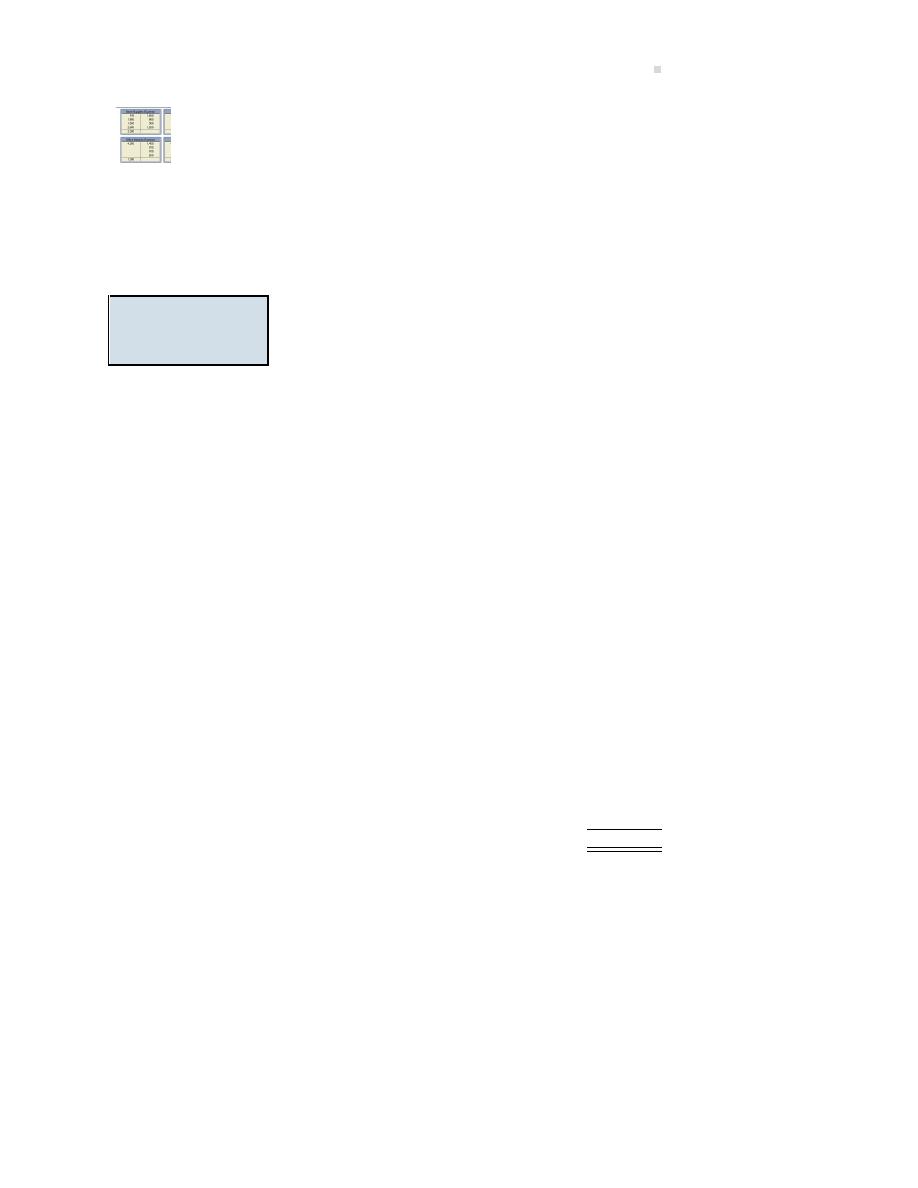
10.4. Share Dividends
397
An explora on is available on the Lyryx site. Log into your Lyryx course to run
.
10.4 Share Dividends
LO4 – Record and
disclose
share
dividends.
A share dividend is a dividend given to shareholders in the form of shares
rather than cash. In this way, the declaring corpora on is able to retain
cash in the business and reduce the need to finance its ac vi es through
borrowing. Like a cash dividend, a share dividend reduces retained earn-
ings. However, a share dividend does not cause assets to change. Instead,
it simply transfers an amount from retained earnings to contributed capi-
tal. Total assets, total liabili es, and total equity remain unchanged when
there is a share dividend. Like a cash dividend, there are three dates re-
garding a share dividend: date of declara on, date of record, and date of
distribu on. No ce that there is no ‘date of payment’ as there was for
a cash dividend. This is because there is no cash payment involved for a
share dividend. Instead, shares are distributed, or given, to the sharehold-
ers.
Accoun ng for Share Dividends
To demonstrate a share dividend, assume that the Sherbrooke Corpora on declares a 10% share
dividend to common shareholders. The share dividend is declared on December 15, 2015 payable
to shareholders of record on December 20, 2015. The share dividend is distributed on January 10,
2016. At the me of the dividend declara on, the shares were trading on the stock exchange at
$4 per share and the equity of the corpora on consisted of the following:
Common shares; 20,000 shares authorized;
5,000 shares issued and outstanding . . . . . . . .
$25,000
Retained earnings . . . . . . . . . . . . . . . . . . . . . . . . . . .
100,000
Total equity . . . . . . . . . . . . . . . . . . . . . . . . . . . . . . . . .
$125,000
The 10% share dividend equals 500 shares (calculated as 5,000 outstanding shares x 10% share
dividend). The market price on the date of declara on is used to record a share dividend. On the
declara on date, the journal entry to record the share dividend is:
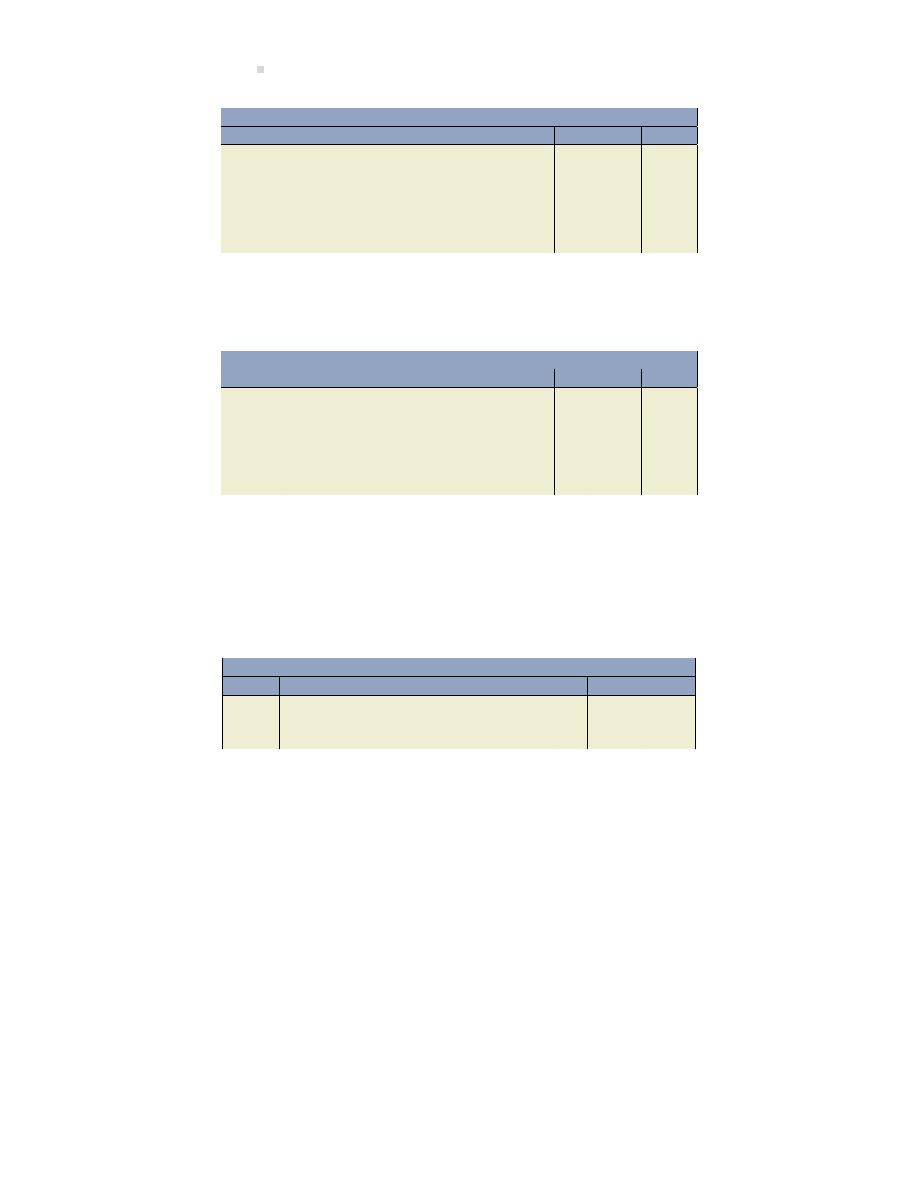
398
Equity Financing
General Journal
Date
Account/Explana on
PR
Debit
Credit
Dec 15
Share Dividends Declared . . . . . . . . . . . . . . .
2,000
Common
Share
Dividends
Dis-
tributable . . . . . . . . . . . . . . . . . . . . . . . . . . . . .
2,000
To record declara on of share dividend;
5,000 shares x 10% = 500 shares; 500
shares x $4 = $2,000.
OR
General Journal
Date
Account/Explana on
PR
Debit
Credit
Dec 15
Retained Earnings . . . . . . . . . . . . . . . . . . . . . .
2,000
Common
Share
Dividends
Dis-
tributable . . . . . . . . . . . . . . . . . . . . . . . . . . . . .
2,000
To record declara on of share dividend;
5,000 shares x 10% = 500 shares; 500
shares x $4 = $2,000.
If, as shown in the second entry above, retained earnings is debited instead of share dividends, a
closing entry is not required for dividends during the closing process. Common Share Dividends
Distributable is an equity account, specifically, a share capital account.
On the share dividend distribu on date, the following entry is recorded:
General Journal
Date
Account/Explana on
PR
Debit
Credit
Jan 10
Common Share Dividends Distributable . .
2,000
Common Shares . . . . . . . . . . . . . . . . . . . .
2,000
To record distribu on of share dividend.
The effect of these entries is to transfer $2,000 from retained earnings to share capital. No as-
sets are paid by the corpora on when the addi onal shares are issued as a share dividend, and
therefore the total equity remains unchanged.
Is There Any Change in the Investor’s Percentage of Corporate Ownership Be-
cause of a Share Dividend?
Since a share dividend is issued to all shareholders of a par cular class, as a result of a share
dividend, each shareholder has a larger number of shares. However, ownership percentage of the
company remains the same for each shareholder, as illustrated below, for the four shareholders
of Sherbrooke Corpora on.
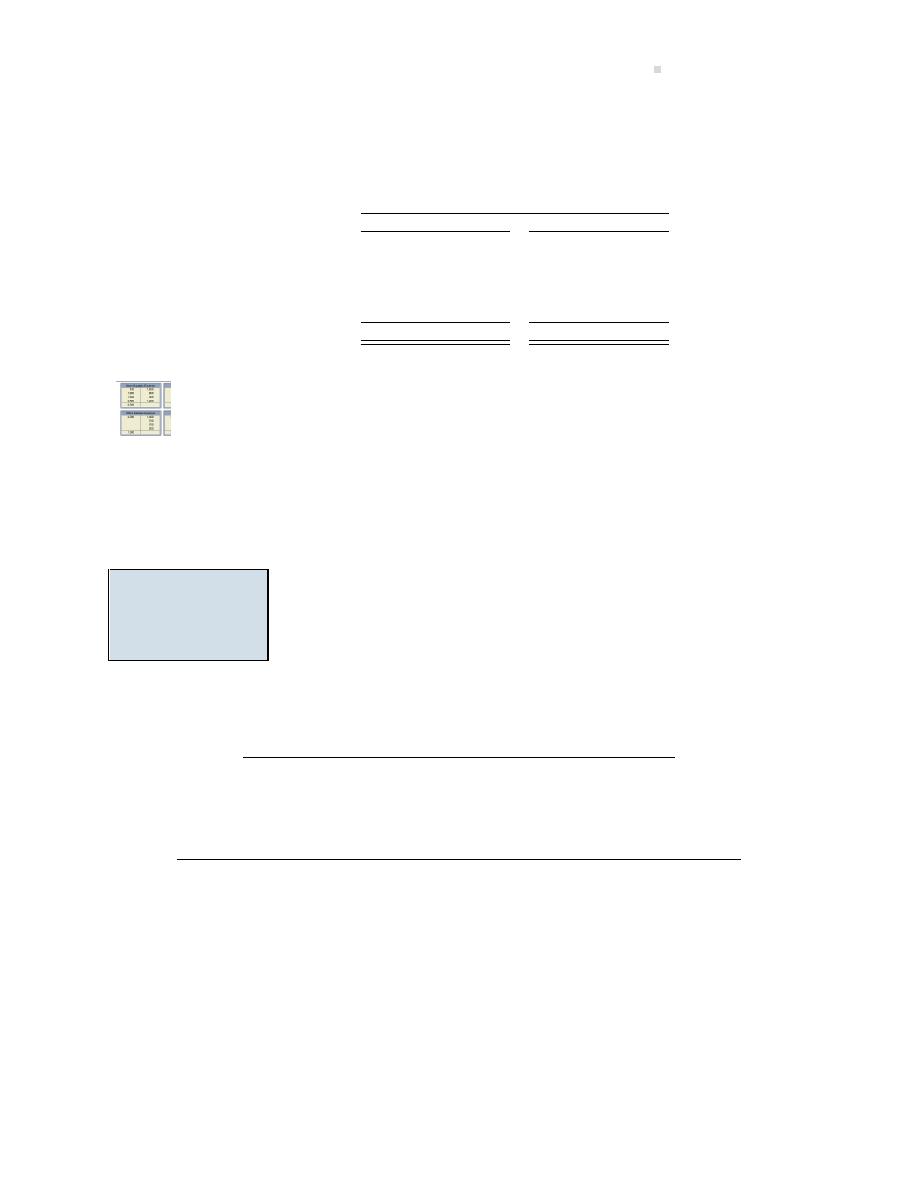
10.5. Book Value
399
Each shareholder has received a 10% share dividend but their ownership percentage of the com-
pany remains constant. Since total equity does not change when there is a share dividend, the
propor on owned by each shareholder does not change.
Corporate ownership
Before share dividend
A er share dividend
Shareholder
Shares
Percent
Shares
Percent
1
1,000
20%
1,100
20%
2
500
10%
550
10%
3
2,000
40%
2,200
40%
4
1,500
30%
1,650
30%
5,000
100%
5,500
100%
An explora on is available on the Lyryx site. Log into your Lyryx course to run
10.5 Book Value
LO5 – Calculate
and explain the
book value per
share ra o.
The book value of a share is the amount of net assets represented by
one share. When referring to common shares, book value represents the
amount of net assets not claimed by creditors and preferred shareholders.
When referring to preferred shares, book value represents the amount
that preferred shareholders would receive if the corpora on were liqui-
dated.
Book value per preferred share =
Paid-in capital for preferred shares plus dividends in arrears
Number of preferred shares outstanding
Book value per common share =
Total equity less (paid-in capital for preferred shares plus dividends in arrears)
Number of common shares outstanding
Calcula on of the Book Value of Shares
The calcula on of the book value of preferred and common shares can be illustrated by using the
following data:

400
Equity Financing
Equity Sec on of the Balance Sheet
Contributed capital
Preferred shares; 5,000 shares authorized;
1,000 shares issued and outstanding . .
$10,000
Common shares; 200,000 shares authorized;
60,000 shares issued and outstanding . .
20,000
Total contributed capital . . . . . . . . .
$30,000
Retained earnings . . . . . . . . . . . . .
105,000
Total equity . . . . . . . . . . . . . . . .
$135,000
Book value is calculated as:
Preferred shares
Common shares
Dividends in arrears
$ 5,000
Total equity
$135,000
Plus: Paid-in capital
10,000
Less: Preferred claims
15,000
Balance
$15,000
Balance
$120,000
Shares outstanding
1,000
Shares outstanding
60,000
Book value per share
$15
Book value per share
$2
Comparison of book value with market value provides insight into investors’ evalua ons of the
corpora on. For instance, if the book value of one common share of Corpora on A is $20 and its
common shares are traded on a public stock exchange for $40 per share (market value), it is said
to be trading for “two mes book value.” If Corpora on B is trading for three mes book value,
investors are indica ng that the future profit prospects for corpora on B are higher than those
for Corpora on A. They are willing to pay propor onately more for shares of Corpora on B than
Corpora on A, rela ve to the underlying book values.
Some shares regularly sell for less than their book value on various stock exchanges. This does
not necessarily mean they are a bargain investment. The market price of a share is related to such
factors as general economic outlook and perceived poten al of the company to generate earnings.
An explora on is available on the Lyryx site. Log into your Lyryx course to run
10.6 Appendix A: Repor ng for Mul ple Classes of Shares
Mul ple classes of shares are to be separately reported in the financial statements. For example,
in Sec on
the equity por on of the balance sheet has separated the preferred shares and
common shares. This provides important informa on about the composi on of the company’s
share capital for its shareholders and creditors. Recall that preferred shares are en tled to receive
dividends before common shareholders.
Another statement affected by mul ple classes of shares is the statement of changes in equity,
where mul ple classes of shares are to be separately reported, as shown below using some sample

Summary of Chapter
Learning Objec ves
401
data:
Sample Company Ltd.
Statement of Changes in Equity
For the year ended December 31, 2017
Preferred
Common
Retained
Total
Shares
Shares
Earnings
Equity
Jan 1, 2017, opening balance
$
5,000
$ 15,000
$ 80,000
$ 100,000
Addi onal shares issued
5,000
5,000
10,000
Dividends declared
(12,000)
(12,000)
Net income
20,000
20,000
Dec 31, 2017, closing balance
$ 10,000
$ 20,000
$ 88,000
$118,000
Summary of Chapter 10 Learning Objec ves
LO1 – Iden fy and explain characteris cs of the corporate form of organiza on
and classes of shares.
A corpora on is a legal en ty that is separate from its owners, known as shareholders. The board
of directors is responsible for corporate policy and broad direc on of the corpora on, includ-
ing hiring the person in charge of day-to-day opera ons. A corpora on has an indefinite life, its
shareholders have limited liability, it can acquire capital more easily than a sole proprietorship or
partnership, and it pays income taxes on its earnings since it is a separate legal en ty. A corpora-
on can issue common and preferred shares. Common shares have vo ng rights while preferred
shares do not. Preferred shares are listed before common shares in the equity sec on of the
balance sheet. Preferred shareholders are en tled to receive dividends before common share-
holders. Authorized shares are the total number of shares that can be issued or sold. Shares that
have been issued can be repurchased by the corpora on and either held in treasury for subse-
quent sale/distribu on or cancelled. Outstanding shares are those that have been issued and are
held by shareholders. Shares repurchased by a corpora on are not outstanding shares.
LO2 – Record and disclose preferred and common share transac ons including
share splits.
Common and preferred shares can be issued for cash or other assets. Organiza on costs are ex-
pensed when incurred and organizers some mes accept shares in lieu of cash for their work in
organizing the corpora on. When more than one type of share has been issued, the equity sec-
on of the balance sheet must be classified by including a Contributed Capital sec on. When a
corpora ons shares are selling at a high price, a share split may be declared to increase the mar-
ketability of the shares. There is no journal entry for a share split. Instead, a memorandum entry
is entered into the records detailing the split. A share split increases the number of shares but
does not change any of the dollar amounts on the financial statements.

402
Equity Financing
LO3 – Record and disclose cash dividends.
Cash dividends are a distribu on of earnings to the shareholders and are declared by the board
of directors. On the declara on date, cash dividends declared (or retained earnings) is debited
and dividends payable is credited. On the date of record, no journal entry is recorded. Sharehold-
ers who hold shares on the date of record are eligible to receive the declared dividend. On the
date of payment, dividends payable is debited and cash is credited. Preferred shares may have a
feature known as cumula ve or non-cumula ve. Cumula ve preferred shares accumulate unde-
clared dividends from one year to the next. These unpaid dividends are called dividends in arrears.
When dividends are subsequently declared, dividends in arrears must be paid before anything is
paid to the other shareholders. Non-cumula ve preferred shares do not accumulate undeclared
dividends.
LO4 – Record and disclose share dividends.
Share dividends distribute addi onal shares to shareholders and are declared by the board of di-
rectors. On the declara on date, share dividends declared (or retained earnings) is debited and
common share dividends distributable, a share capital account, is credited. When the share divi-
dend is distributed to shareholders, the Common Share Dividends Distributable account is debited
and common shares is credited. Share dividends cause an increase in the number of shares issued
and outstanding but do not affect account balances. Share dividends simply transfer an amount
from retained earnings to share capital within the equity sec on of the balance sheet.
LO5 – Calculate and explain the book value per share ra o.
The book value of a share is the amount of net assets represented by one share. Book value per
common share is the amount of net assets not claimed by creditors and preferred shareholders.
Preferred book value per share is the net assets that preferred shareholders would receive if the
corpora on were liquidated.
Discussion Ques ons
1. What are some advantages of the corporate form of organiza on?
2. What is meant by limited liability of a corpora on?
3. What rights are a ached to common shares? Where are these rights indicated?
4. What is a board of directors and whom does it represent? Are the directors involved in the
daily management of the en ty?
5. Describe:

Exercises
403
a. two main classes of shares that can be issued by a corpora on; and
b. the different terms rela ng to the status of a corpora on’s shares.
6. In what ways can shares be “preferred”? In which ways are they similar to common shares?
Different from common shares?
7. Why do corpora ons some mes opt for a share split?
8. Iden fy the major components of the equity sec on of a balance sheet. Why are these
components dis nguished?
9. How can retained earnings be said to be reinvested in a corpora on?
10. What are the main issues a board of directors considers when making a dividend declara on
decision?
11. Even if a corpora on is making a substan al net income each year, why might the board of
directors decide to not pay any cash dividends?
12. Dis nguish among the date of dividend declara on, the date of record, and the date of
payment.
13. What is the difference in accoun ng between cash dividends and share dividends?
14. Explain the different dividend preferences that may be a ached to preferred shares. Why
would preferred shares have these preferences over common shares? Does it mean that
purchasing preferred shares is be er than purchasing common shares?
15. What are dividends in arrears? Are they a liability of the corpora on?
16. How does a share dividend differ from a share split?
17. Does a share dividend change an investor’s percentage of corporate ownership? Explain,
using an example.
Exercises
EXERCISE 10–1
(LO1,2)
Bagan Corpora on, a profitable growth company with 200,000 shares of common shares out-
standing, is in need of $40 million in new funds to finance a required expansion. Management has
three op ons:
(1) Sell $40 million of 12% bonds at face value.

404
Equity Financing
(2) Sell preferred shares: 400,000, $10 shares at $100 per share.
(3) Sell an addi onal 200,000 common shares at $200 per share.
Opera ng income (before interest and income taxes) upon comple on of the expansion is ex-
pected to average $12 million per year; assume an income tax rate of 50 per cent.
Required:
a. Complete the schedule below.
12%
Preferred
Common
Bonds
Shares
Shares
Income before interest and income taxes
Less: Interest expense
Income before taxes
Less: Income taxes at 50%
Net income
Less: Preferred dividends
Net income available to common shareholders
Number of common shares outstanding
Earnings per common share
b. Which financing op on is most advantageous to the common shareholders? Why?
EXERCISE 10–2
(LO2)
A tract of land valued at $50,000 has been given to a corpora on in exchange for 1,000 preferred
shares.
Required:

Exercises
405
a. Prepare the journal entry to record the transac on.
b. Where would the transac on be classified in the balance sheet?
EXERCISE 10–3
(LO1,2)
The equity sec on of Gannon Oilfield Corpora on’s balance sheet at December 31, 2019 is shown
below.
Preferred Shares
Authorized – 100 shares
Issued and Outstanding – 64 Shares
$3,456
Common Shares
Authorized – 2,000 Shares
Issued and Outstanding – 800 Shares
1680
Retained Earnings
600
Required:
a. What is the average price received for each issued preferred share?
b. What is the average price received for each issued common share?
c. What is the total contributed capital of the company?
EXERCISE 10–4
(LO3)
Strada Controls Inc. has 100,000 common shares outstanding on January 1, 2019. On May 25,
2019, the board of directors declared a semi-annual cash dividend of $1 per share. The dividend
will be paid on June 26, 2019 to shareholders of record on June 7, 2019.
Required: Prepare journal entries for
a. The declara on of the dividend.
b. The payment of the dividend.
EXERCISE 10–5
(LO1,3)

406
Equity Financing
Landers Flynn Inc. has 1,000, $5 cumula ve preferred shares outstanding. Dividends were not
paid last year. The corpora on also has 5,000 common shares outstanding. Landers Flynn declared
a $14,000 cash dividend to be paid in the current year.
Required:
a. Calculate the dividends received by the preferred and common shareholders
b. If the preferred shares were non-cumula ve, how would your answers to part (a) above
change?
EXERCISE 10–6
(LO1,3)
The following note appeared on the balance sheet of Sabre Rigging Limited:
As of December 31, 2019, dividends on the 1,000 issued and outstanding shares of
cumula ve preferred shares were in arrears for three years at the rate of $5 per share
per year or $15,000 in total.
Required:
a. Does the $15,000 of dividends in arrears appear as a liability on the December 31, 2019
balance sheet? Explain your answer.
b. Why might the dividends be in arrears?
c. The comptroller of Sabre Rigging projects net income for the 2020 fiscal year of $35,000.
When the company last paid dividends, the directors allocated 50 per cent of current year’s
net income for dividends. If dividends on preferred shares are declared at the end of 2020
and the established policy of 50 per cent is con nued, how much will be available for divi-
dends to the common shareholders if the profit projec on is realized?
EXERCISE 10–7
(LO1,2,3,4)
The December 31, 2018 balance sheet for Arrow Streaming Corpora on shows that as of that
date it issued a total of 10,000 common shares for $140,000. On April 1, 2019 Arrow Streaming
declared a 10 per cent share dividend, payable on April 15 to shareholders of record on April 10.
The market value of Arrow’s shares on April 1 was $15. On June 1, the company declared a $2

Exercises
407
cash dividend per share to common shareholders of record on June 10, and paid the dividend on
June 30. Assume the year end of the corpora on is December 31.
Required: Prepare journal entries for the above transac ons, including closing entries.
EXERCISE 10–8
(LO2,5)
The equity sec on of Pembina Valley Manufacturing Limited’s balance sheet at December 31, 2019
is shown below.
Share Capital
Preferred Shares, Cumula ve
Authorized – 500 shares
Issued and Outstanding – 300 Shares
$300
Common Shares
Authorized – 100 Shares
Issued and Outstanding – 20 Shares
500
Total Contributed Capital
800
Retained Earnings
192
Total Equity
$992
Note: There were $30 of dividends in arrears on the preferred shares at December 31, 2019.
Required:
a. Calculate the December 31, 2019 book value per share of
i. the preferred shares; and
ii. the common shares.
b. Assume that the common shares were split 2 for 1 on January 2, 2020 and that there was no
change in any other account at that me. Calculate the new book value of common shares
immediately following the share split.
EXERCISE 10–9
(LO2)
Essen al Financial Service Corp. was incorporated on January 1, 2018 to prepare business plans
for small enterprises seeking bank financing.
Required: Prepare journal entries to record the following transac ons on January 2, 2018:

408
Equity Financing
a. Received an incorpora on charter authorizing the issuance of an unlimited number of no
par-value common shares and 10,000, 4% preferred shares.
b. Issued in exchange for incorpora on costs incurred by shareholders 10,000 common shares
at $1.
c. Issued for cash 1,000 preferred shares at $3 each.
EXERCISE 10–10
(LO4)
The shareholders’ equity sec on of Lakeview Homes Corpora on’s statement of financial posi on
at December 31, 2018 is reproduced below:
Shareholders’ Equity
Common shares
Authorized unlimited shares, issued 5,000 shares
$ 20,000
Retained earnings
100,000
Total shareholders’ equity
$120,000
On January 15, 2018, Lakeview Homes declared a 10 per cent share dividend to holders of common
shares. At this date, the common shares of the corpora on were trading on the stock exchange
at $10 each. The share dividend was issued February 15, 2018.
Required: Prepare the journal entries to record the share dividend.
EXERCISE 10–11
(LO2,3,4)
Blitz Power Tongs Inc. received a charter that authorized it to issue an unlimited number of com-
mon shares. The following transac ons were completed during 2018:
Jan 5
Issued 10 common shares for a total of $150 cash.
Jan 12
Exchanged 50 shares of common shares for assets listed at their fair values: machinery
– $100; building – $100; land – $50.
Feb 28
Declared a 10% share dividend. Market value is $7 per share. Net income to date is
$60.
Mar 15 Issued the share dividend.
Dec 31
Closed the 2018 net income of $200 from the Income Summary account in the general
ledger to the Retained Earnings account.
Dec 31
Declared a $1 per share cash dividend.
Required:

Exercises
409
a. Prepare journal entries for the 2018 transac ons, including closing entries.
b. Prepare the shareholders’ equity sec on of the statement of financial posi on at:
i. January 31, 2018
ii. February 28, 2018
iii. December 31, 2018
EXERCISE 10–12
(LO1)
The board of directors of Oolong Ltd. is planning to expand its manufacturing facili es. To raise
the $1.5 million capital needed, the following financing methods are being considered:
i. Sell $1.5 million of 10% bonds at face value.
ii. Sell $10 preferred shares: 15,000 shares at $100 a share (no other preferred shares are out-
standing).
iii. Sell another 30,000 shares of common shares at $50 a share (currently 20,000 common shares
are outstanding).
Income before interest and income taxes is expected to average $750,000 per year following the
expansion; the income tax rate is 30%.
Required:
a. Calculate the earnings per common share for each alterna ve.
b. Which financing method will the shareholders most likely prefer and why?
EXERCISE 10–13
(LO2,3)
At December 31, 2018, the shareholders’ equity sec on of the statement of financial posi on
for Belfast Steel Ltd. totalled $30,000,000. Following are the balances of various general ledger
accounts at that date.
Preferred shares, $1.00, cumula ve Issued 100,000 shares
$ 1,000,000
Common shares
Issued 1,250,000 shares
25,000,000
Retained earnings
4,000,000

410
Equity Financing
The following transac ons occurred during 2019:
Feb 20
A cash dividend of $0.50 per preferred share was declared, payable Mar 1 to share-
holders of record on Feb 25.
Mar 1
Payment of previously declared dividend on preferred shares was made.
Apr 15
A cash dividend on common shares of $0.60 per share was declared, payable Jun 10
to shareholders of record on May 1.
Jun 10
Payment of the previously-declared dividend on common shares was made.
Aug 1
10,000 common shares were issued for $250,000 cash.
Dec 31 A cash dividend totalling $425,000 was declared and paid.
Required:
a. Prepare journal entries for the 2019 transac ons. Separate the dividends for preferred and
common shares into the two classes of shares.
b. Prepare the statement of changes in equity for the year ended December 31, 2019 assuming
net income for the year amounted to $500,000.
EXERCISE 10–14
(LO2,3)
Bray Co. was authorized to issue 10,000 $2.00 preferred shares and unlimited common shares.
December 31 is Bray’s year-end. During 2016, its first year of opera ons, the following selected
transac ons occurred:
i. January 15: Issued 32,000 common shares to the corpora on’s organizers in exchange for
services to get the company opera onal. Their efforts are es mated to be worth $15,000.
ii. February 20: 15,000 common shares were issued for cash of $6 per share.
iii. March 7: 4,500 preferred shares were issued for cash totalling $90,000.
iv. April 9: 60,000 common shares were issued in exchange for land and building with appraised
values of $300,000 and $120,000 respec vely.
v. May 1: 3,500 of the preferred shares were issued for a cash price of $18.00 per share.
vi. May 15: Declared and paid dividends to the shareholders of record May 18. Total cash paid
dividends was $50,000.
vii. Junuary 5: 16,000 of the common shares were issued for a cash total of $112,000.
viii. July 15: 2,000 preferred shares and 20,000 common shares were issued for a cash price of
$17.50 and $7.50 respec vely.

Exercises
411
ix. December 31: The company closed all its temporary accounts. The Income Summary account
showed a debit balance of $25,000.
Required:
a. Prepare journal entries for each of the items above during Bray’s first year of opera ons.
b. Prepare the equity sec on of the balance sheet in good form with all disclosures and subto-
tals, for the year ended December 31, 2019.
EXERCISE 10–15
(LO2,3)
The par al balance sheet for the Carman Corp. reported the following components of equity on
December 31, 2016:
Carman Corp.
Equity Sec on of the Balance Sheet
December 31, 2016
Contributed capital:
Preferred shares, $1.50 cumula ve, 20,000 shares authorized;
10,000 shares issued and outstanding
$150,000
Common shares, unlimited shares authorized;
25,000 shares issued and outstanding.
250,000
Total contributed capital
$400,000
Retained earnings
250,000
Total equity
$650,000
In 2017, Carman Corp. had the following transac ons affec ng the various equity accounts:
Jan 4
Sold 15,000 common shares at $11 per share.
Jan 8
The directors declared a total cash dividend of $57,500 payable on Jan. 31 to the Jan.
21 shareholders of record. Dividends had not been declared for 2015 and 2016. All of
the preferred shares had been issued during 2015.
Jan 31
Paid the dividends declared on January 8.
July 1
Sold preferred shares for a total of $77,500. The average issue price was $15.50 per
share.
Aug 7
The directors declared a $1.00 dividend per common share cash dividend payable on
Aug. 31 to the Aug. 20 shareholders of record.
Aug 31
Paid the dividends declared on Aug 7.
Required:

412
Equity Financing
a. Prepare journal entries to record the transac ons for 2017.
b. Prepare a statement of changes in equity for the year ended December 31, 2017. For pur-
poses of preparing this statement, assume that the retained earnings balance at December
31, 2017 was $102,500.
c. Prepare the equity sec on of the company’s balance sheet as at December 31, 2017 in good
form with all required disclosures and subtotals.
d. Calculate the book value per preferred share and per common share as at December 31,
2016 and December 31, 2017. Round final answer to nearest two decimal places.
Problems
PROBLEM 10–1
(LO2)
Following is the equity sec on of Cri er Contrac ng Inc. shown before and a er the board of
directors authorized a 5 for 1 share split on April 15, 2019.
Before split
A er split
Equity
Equity
Common Shares
Common Shares
Authorized – 5,000 Shares
Authorized – ? Shares
Issued and Outstanding
Issued and Outstanding
– 1,000 Shares
$100,000
– ? Shares
$ ?
Required:
1. Complete the equity sec on of the balance sheet a er the split.
2. Record a memorandum indica ng the new number of shares.
3. If the market value per share was $40 before the split, what would be the market value a er
the split? Why?
PROBLEM 10–2
(LO3,4)
The equity sec on of TWR Contrac ng Inc.’s December 31, 2018 balance sheet showed the fol-
lowing:

Problems
413
Equity
Share Capital
Preferred Shares, $0.60, Cumula ve,
Issued and Outstanding – 40 Shares
$ 400
Common Shares,
Issued and Outstanding – 2,000 Shares
2,000
Total Contributed Capital
2,400
Retained Earnings
900
Total Equity
$3,300
The following transac ons occurred during 2019:
Feb. 15
Declared the regular $0.30 per share semi-annual dividend on its
preferred shares and a $0.05 per share dividend on the common shares to
holders of record March 5, payable April 1.
Apr. 1
Paid the dividends declared on February 15.
May 1
Declared a 10 per cent share dividend to common shareholders of record
May 15 to be issued June 15, 2016. The market value of the common
shares at May 1 was $2 per share.
June 15
Distributed the dividends declared on May 1.
Aug. 15
Declared the regular semi-annual dividend on preferred shares and a
dividend of $0.05 on the common shares to holders of record August 31,
payable October 1.
Oct. 1
Paid the dividends declared on August 15.
Dec. 15
Declared a 10 per cent share dividend to common shareholders of record
December 20 to be issued on December 27, 2019. The market value of the
common shares at December 15 was $3 per share.
Dec. 27
Distributed the dividends declared on December 15.
Dec. 31
Net income for the year ended December 31, 2019 was $1,400.
Required:
1. Prepare journal entries to record the 2019 transac ons, including closing entries for the
December 31 year end date. Show calcula ons. Descrip ve narra ve is not needed.
2. Prepare the statement of changes in equity for the year ended December 31, 2019.
PROBLEM 10–3
(LO1,2,3,4)
The equity sec on of Wondra Inc.’s December 31, 2018 balance sheet showed the following:

414
Equity Financing
Contributed Capital
Preferred Shares; $0.50 cumula ve;
unlimited shares authorized; 30,000
shares issued and outstanding
$ 480,000
Common Shares; unlimited shares
authorized; 70,000 shares issued and
outstanding
560,000
Total contributed capital
$1,040,000
Retained Earnings
95,000
Total Equity
$1,135,000
At December 31, 2018 there were $15,000 of dividends in arrears.
The following transac ons occurred during 2019:
Feb. 10
Declared a total dividend of $32,000 to shareholders of record on
February 15, payable March 1.
Mar. 1
Paid dividends declared February 10.
5 Issued for cash 2,000 preferred shares at $18 each.
Apr. 15 The Board of Directors declared a 2:1 split on the preferred and common
shares.
Jun. 22 Issued for cash 20,000 common shares at $4.00 per share.
Nov. 10
Declared a 20% share dividend to common shareholders of record on
Nov. 14, distributable Dec. 15. The market price of the shares on Nov. 10
was $3.50.
Dec. 15
Distributed share dividend declared on November 10.
Dec. 31
Closed the Income Summary account which had a credit balance of
$290,000.
31 Closed the dividend accounts.
Required:
1. Journalize the 2019 transac ons.
2. Prepare the equity sec on of the December 31, 2019 balance sheet.
PROBLEM 10–4
(LO1,2,5)
The following is the equity sec on of the balance sheet of Tridon Construc on Limited at Decem-
ber 31, 2019.

Problems
415
Equity
Share Capital
Common Shares
Authorized – 500 shares
Issued and Outstanding – 300 Shares
$3,070
Retained Earnings
500
Total Equity
$3,570
Required:
1. What is the paid-in capital per common share? ...the book value per common share? Round
calcula ons to two decimal places.
2. On December 31, the Tridon Construc on common shares traded at $24. Why is the market
value different from the book value of commons shares?


Chapter 11
The Statement of Cash Flows
Details about the amount of cash received and paid out during an accoun ng period are not shown
on the balance sheet, income statement, or statement of changes in equity. This informa on is
disclosed on the statement of cash flows (SCF). This chapter discusses the purpose of the state-
ment of cash flows, the steps in preparing the SCF, as well as how to interpret various sec ons of
the statement of cash flows.
Chapter 11 Learning Objec ves
LO1 – Explain the purpose of the statement of cash flows.
LO2 – Prepare a statement of cash flows.
LO3 – Interpret a statement of cash flows.
Concept Self-Check
Use the following as a self-check while working through Chapter
1. What is the defini on of cash and cash equivalents?
2. Why is a statement of cash flows prepared?
3. What are the three sec ons of a statement of cash flows?
4. What two methods can be used to prepare the opera ng ac vi es sec on of the statement
of cash flows?
5. Why is deprecia on expense an adjustment in the opera ng ac vi es sec on of the state-
ment of cash flows?
6. Where are dividend payments listed on the statement of cash flows?
7. In what sec on of the statement of cash flows are the cash proceeds resul ng from the sale
of a non-current asset listed?
8. Where on the statement of cash flows is a long-term bank loan payment iden fied?
417

418
The Statement of Cash Flows
NOTE: The purpose of these ques ons is to prepare you for the concepts introduced in the chap-
ter. Your goal should be to answer each of these ques ons as you read through the chapter. If,
when you complete the chapter, you are unable to answer one or more the Concept Self-Check
ques ons, go back through the content to find the answer(s). Solu ons are not provided to these
ques ons.
11.1 Financial Statement Repor ng
LO1
–
Explain
the purpose of
the statement of
cash flows.
Cash flow is an important factor in determining the success or failure of
a corpora on. It is quite possible for a profitable business to be short of
cash. As discussed in Chapter
, a company can have liquidity issues be-
cause of large amounts of cash ed up in inventory and accounts receiv-
able, for instance. Conversely, an unprofitable business might have suffi-
cient cash to pay its bills if it has access to enough financing from loans or
by issuing share capital.
We know that the financial ac vi es of a corpora on are reported through four financial state-
ments: a balance sheet, an income statement, a statement of changes in equity, and a statement
of cash flows (SCF). Statement of cash flowsThis chapter discusses the statement of cash flows in
detail.
The SCF iden fies the sources (inflows) and uses (ou lows) of cash during the accoun ng period.
It explains why the cash balance at the end of the accoun ng period is different from that at the
beginning of the period by describing the enterprise’s financing, inves ng, and opera ng ac vi es.
Cash flow informa on is useful to management when making decisions such as purchasing equip-
ment, plant expansion, re ring long-term debt, or declaring dividends. The SCF is useful to exter-
nal users when evalua ng a corpora on’s financial performance.
The SCF, together with the income statement, provides a somewhat limited means of assessing
future cash flows because these statements are based on historical, not prospec ve data. Nev-
ertheless, the ability to generate cash from past opera ons is o en an important indica on of
whether the enterprise will be able to meet obliga ons as they become due, pay dividends, pay
for recurring opera ng costs, or survive adverse economic condi ons.
For SCF purposes, cash includes cash and cash equivalents — assets that can be quickly converted
into a known amount of cash, such as short-term investments that are not subject to significant
risk of changes in value. For our purposes, an investment will be considered a cash equivalent
when it has a maturity of three months or less from the date of acquisi on.
Because of differences in the nature of each en ty and industry, management judgment is required
to determine what assets cons tute cash and cash equivalents for a par cular firm. This decision
needs to be disclosed on the SCF or in a note to the financial statements as shown in the following
example:
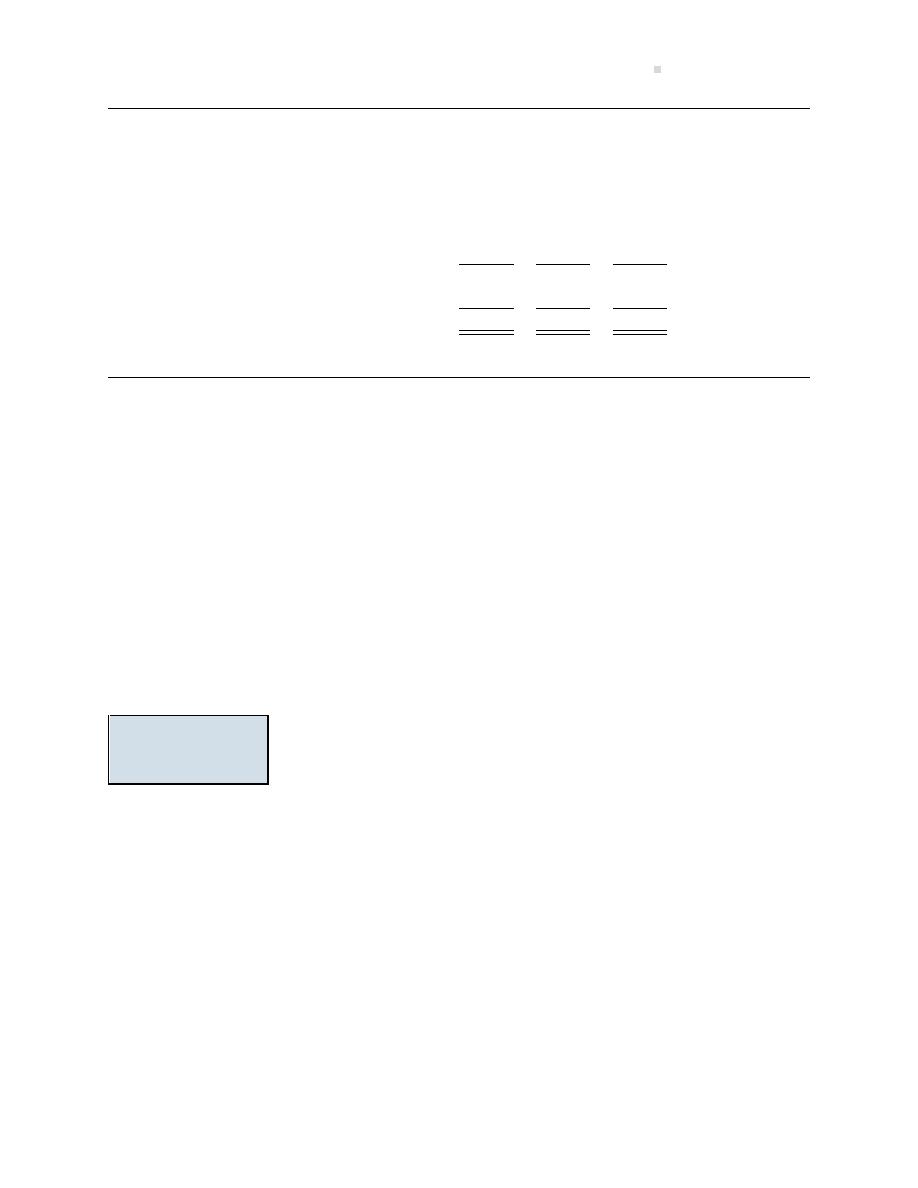
11.2. Preparing the Statement of Cash Flows
419
Note X
Cash and cash equivalents consist of cash on deposit and short-term investments held for the
purposes of mee ng cash commitments within three months from the balance sheet date. Cash
and cash equivalents consist of the following:
($000s)
2019
2018
2017
Cash on Deposit
$20
$30
$50
Short-term Investments
36
31
37
$56
$61
$87
For simplicity, examples throughout this chapter involving cash and cash equivalents will include
only cash.
Cash flows result from a wide variety of a corpora on’s ac vi es as cash is received and disbursed
over a period of me. Because the income statement is based on accrual accoun ng that matches
expenses with revenues, net income most o en does not reflect cash receipts and disbursements
during the me period they were made. As we will see, the statement of cash flows converts
accrual net income to a cash basis net income.
11.2 Preparing the Statement of Cash Flows
LO2 – Prepare a
statement of cash
flows.
The general format for a SCF is shown in Figure 11.1. The SCF details the
cash inflows and ou lows that caused the beginning of the period cash
account balance to change to its end of period balance.

420
The Statement of Cash Flows
Name of Company
Statement of Cash Flows
For the Period Ended
Cash flows from opera ng ac vi es:
[Each opera ng inflow/ou low is listed]
Net cash inflow/ou low from opera ng ac vi es
$
XX
Cash flows from inves ng ac vi es:
[Each inves ng inflow/ou low is listed]
Net cash inflow/ou low from inves ng ac vi es
XX
Cash flows from financing ac vi es:
[Each financing inflow/ou low is listed]
Net cash inflow/ou low from financing ac vi es
XX
Net increase/decrease in cash
$
XX
Cash at beginning of period
XX
Cash at end of period
$
XX
Figure 11.1: General Format for a Statement of Cash Flows
No ce that the cash flows in Figure
are separated into three groups: cash flows from oper-
a ng, inves ng, and financing ac vi es. Grouping or classifying cash flows is a key component of
preparing a SCF.
Classifying Cash Flows—Opera ng Ac vi es
Cash flow from opera ng ac vi es represents cash flows generated from the principal ac vi es
that produce revenue for a corpora on, such as selling products, and the related expenses re-
ported on the income statement. Because of accrual accoun ng, the net income reported on the
income statement includes noncash transac ons. For example, revenue earned on account is in-
cluded in accrual net income but it does not involve cash (debit accounts receivable and credit
revenue). Therefore, the opera ng ac vi es sec on of the SCF must convert accrual net income
to a cash basis net income. There are two generally accepted methods for preparing the operat-
ing ac vi es sec on of the SCF, namely the direct method and the indirect method. This chapter
illustrates the indirect method because it is more commonly used in Canada. The direct method
is addressed in a different textbook. Both methods result in the same cash flows from opera ng
ac vi es — it is the way in which the number is calculated that differs. The method used has
an impact on only the opera ng ac vi es sec on and not on the inves ng or financing ac vi es
sec ons.
In using the indirect method for preparing the opera ng ac vi es sec on, the accrual net in-
come is adjusted for changes in current assets (except cash), current liabili es (except dividends
payable), deprecia on expense, and gains/losses on the disposi on of non-current assets. Fig-
ure
illustrates the effect of these items on the SCF.

11.2. Preparing the Statement of Cash Flows
421
Cash flows from opera ng ac vi es:
Net income/net loss
$
XX
Adjustments to reconcile net income/loss to cash pro-
vided/used by opera ng ac vi es:
Add: Decreases in current assets (except Cash)
XX
Subtract: Increases in current assets (except Cash)
XX
Add: Increases in current liabili es (except Dividends
payable)
XX
Subtract: Decreases in current liabili es (except Divi-
dends payable)
XX
Add: Deprecia on expense
XX
Add: Losses on disposal of non-current assets
XX
Subtract: Gains on disposal of non-current assets
XX
Net cash inflow/ou low from opera ng ac vi es
$
XX
Figure 11.2: Detailed Adjustments to Convert Accrual Net Income to a Cash Basis
Decreases in current assets are added back as an adjustment to net income because, for example,
a decrease in accounts receivable indicates that cash was collected from credit customers (debit
cash and credit accounts receivable) yet it is not part of accrual net income, so the cash collected
must be added. An increase in accounts receivable indicates that sales on account were recorded
(debit accounts receivable and credit sales) so it is part of accrual net income. However, since no
cash was collected, this must be subtracted from accrual net income to adjust it to a cash basis.
Increases in current liabili es are added back as an adjustment to net income because, for ex-
ample, an increase in accounts payable indicates that a purchase/expense was made on account
(debit expense and credit accounts payable) so it was subtracted in calcula ng accrual net income.
However, since no cash was paid, this must be added back to accrual net income to adjust it to a
cash basis. A decrease in accounts payable indicates that a payment was made to a creditor (debit
accounts payable and credit cash) yet it is not part of accrual net income so the cash paid must be
subtracted.
Deprecia on expense is subtracted in calcula ng accrual net income. However, an analysis of the
journal entry shows that no cash was involved (debit deprecia on expense and credit accumulated
deprecia on), so it must be added back to adjust the accrual net income to a cash basis.
A loss on the disposal of a non-current asset is added back as an adjustment to net income because,
in analyzing the journal entry when losses occur (e.g., debit cash, debit loss, credit land), the loss
represents the difference between the cash proceeds and the book value of the non-current asset.
Since a loss is subtracted on the income statement and does not represent a cash ou low, it is
added back to adjust the accrual net income to a cash basis. The same logic applies for a gain on
the disposal of a non-current asset.
Classifying Cash Flows—Inves ng Ac vi es
Cash flows from inves ng ac vi es involve increases and decreases in long-term asset accounts.
These include outlays for the acquisi on of property, plant, and equipment, as well as proceeds

422
The Statement of Cash Flows
from their disposal. Figure
illustrates the effect of these items on the SCF.
Cash flows from inves ng ac vi es:
Cash proceeds from sale of non-current assets
XX
Cash paid to purchase non-current assets
XX
Net cash inflow/ou low from inves ng ac vi es
XX
Figure 11.3: Detail of Inflows/(Ou lows) From Inves ng Ac vi es
Classifying Cash Flows—Financing Ac vi es
Cash flows from financing ac vi es result when the composi on of the debt and equity capital
structure of the en ty changes. This category is generally limited to increases and decreases in
long-term liability accounts and share capital accounts such as common and preferred shares.
These include cash flows from the issue and repayment of debt, and the issue and repurchase of
share capital. Dividend payments are generally considered to be financing ac vi es, since these
represent a return to shareholders on the original capital they invested. Figure
illustrates the
effect of these items on the SCF.
Cash flows from financing ac vi es:
Cash proceeds from issuance of shares
XX
Cash paid for repurchase of shares
XX
Cash proceeds from borrowings
XX
Cash repayments of borrowings
XX
Cash paid for dividends
XX
Net cash inflow/ou low from financing ac vi es
XX
Figure 11.4: Detail of Inflows/(Ou lows) From Financing Ac vi es
Classifying Cash Flows—Noncash Inves ng and Noncash Financing Ac vi es
There are some transac ons that involve the direct exchange of non-current balance sheet items
so that cash is not affected. For example, noncash inves ng and noncash financing ac vi es would
include the purchase of a non-current asset by issuing debt or share capital, the declara on and
issuance of a share dividend, re rement of debt by issuing shares, or the exchange of noncash
assets for other noncash assets. Although noncash inves ng and noncash financing ac vi es do
not appear on the SCF, the full disclosure principle requires that they be disclosed either in a note
to the financial statements or in a schedule on the SCF.
An explora on is available on the Lyryx site. Log into your Lyryx course to run
Cash Flow Statement Categories
Now, let us demonstrate the prepara on of a SCF using the balance sheet, income statement, and
statement of changes in equity of Example Corpora on shown below.

11.2. Preparing the Statement of Cash Flows
423
Example Corpora on
Balance Sheet
At December 31
($000s)
2016
2015
Assets
Current assets
Cash
$
27
$
150
Accounts receivable
375
450
Merchandise inventory
900
450
Prepaid expenses
20
10
Total current assets
1,322
1,060
Property, plant, and equipment
Land
70
70
Buildings
1,340
620
Less: Accumulated deprecia on - buildings
(430)
(280)
Machinery
1,130
920
Less: Accumulated deprecia on - machinery
(250)
(240)
Total property, plant, and equipment
1,860
1,090
Total assets
$
3,182
$
2,150
Liabili es
Current liabili es
Accounts payable
$
235
$
145
Dividends payable
25
30
Income taxes payable
40
25
Total current liabili es
300
200
Long-term loan payable
1,000
500
Total liabili es
1,300
700
Equity
Common shares
1,210
800
Retained earnings
672
650
Total equity
1,882
1,450
Total liabili es and equity
$
3,182
$
2,150
Example Corpora on
Income Statement
For the Year Ended December 31, 2016
($000s)
Sales
$
1,200
Cost of goods sold
674
Gross profit
526
Opera ng expenses
Selling, general, and administra on
$
115
Deprecia on
260
375
Income from opera ons
151
Other revenues and expenses
Interest expense
26
Loss on disposal of machinery
10
36
Income before income taxes
115
Income taxes
35
Net Income
$
80

424
The Statement of Cash Flows
Example Corpora on
Statement of Changes in Equity
For the Year Ended December 31, 2016
($000s)
Share
Retained
Total
Capital
Earnings
Equity
Opening balance
$
800
$
650
$
1,450
Common shares issued
410
-
410
Net income
-
80
80
Dividends declared
-
(58)
(58)
Ending balance
$
1,210
$
672
$
1,882
The SCF can be prepared from an analysis of transac ons recorded in the Cash account. Accoun-
tants summarize and classify these cash flows on the SCF for the three major ac vi es noted ear-
lier, namely opera ng, inves ng, and financing. To aid our analysis, the following list of addi onal
informa on from the records of Example Corpora on will be used.
Addi onal Informa on
1. A building was purchased for $720 cash.
2. Machinery was purchased for $350 cash.
3. Machinery cos ng $140 with accumulated deprecia on of $100 was sold for $30 cash.
4. Total deprecia on expense of $260 was recorded during the year; $150 on the building and
$110 on the machinery.
5. Example Corpora on received $500 cash from issuing a long-term loan with the bank.
6. Shares were issued for $410 cash.
7. $58 of dividends were declared during the year.
Analysis of Cash Flows
There are different ways to analyze cash flows and then prepare the SCF; only one of those tech-
niques will be illustrated here using the following steps.
1. Set up a cash flow table.
2. Calculate the changes in each balance sheet account.
3. Calculate and analyze the changes in retained earnings and dividends payable (if there is a
Dividends Payable account).

11.2. Preparing the Statement of Cash Flows
425
4. Calculate and analyze the changes in the noncash current assets and current liabili es (ex-
cluding Dividends Payable account).
5. Calculate and analyze changes in non-current asset accounts
6. Calculate and analyze changes in Long-term Liability and Share Capital accounts.
7. Reconcile the analysis.
8. Prepare a statement of cash flows.
Step 1: Set up a cash flow table
Set up a table as shown below with a row for each account shown on the balance sheet. Enter
amounts for each account for 2015 and 2016. Show credit balances in parentheses. Total both
columns and ensure they equal zero. The table should appear as follows a er this step has been
completed:
Balance
($000s)
Account
2016
2015
Dr. (Cr.)
Dr. (Cr.)
Cash
27
150
Accounts receivable
375
450
Merchandise inventory
900
450
Prepaid expenses
20
10
Land
70
70
Buildings
1,340
620
Accum. dep.- buildings
(430)
(280)
Machinery
1,130
920
Accum. dep.- machinery
(250)
(240)
Accounts payable
(235)
(145)
Dividends payable
(25)
(30)
Income taxes payable
(40)
(25)
Long-term loan payable
(1,000)
(500)
Share capital
(1,210)
(800)
Retained earnings
(672)
(650)
Total
-0-
-0-
Step 2: Calculate the change in cash
Add two columns to the cash flow table. Calculate the net debit or net credit change in cash and
insert this change in the appropriate column. This step is shown below.
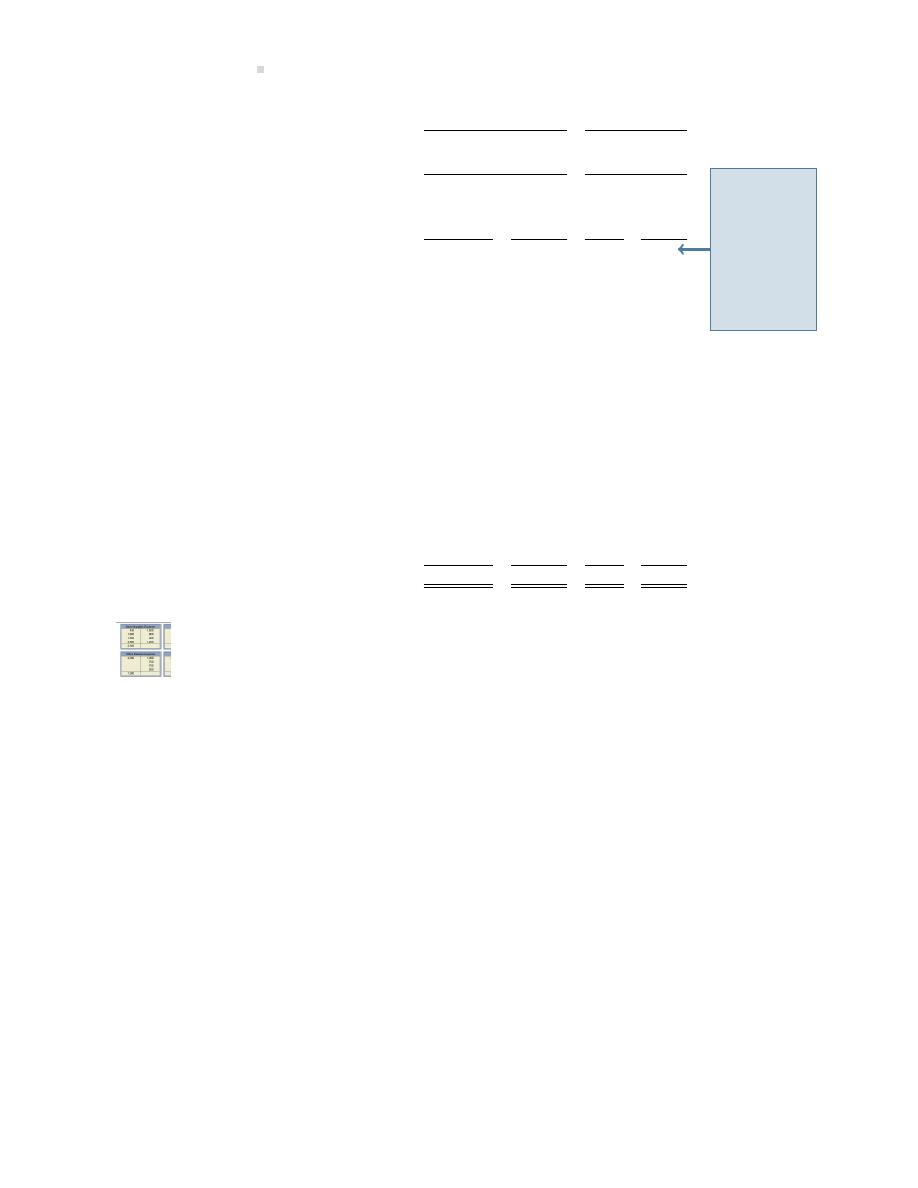
426
The Statement of Cash Flows
Step 2
Balance
($000s)
Change
2016
2015
Dr.
Dr.
Account
(Cr.)
(Cr.)
Dr.
Cr.
Cash
27
150
123
Accounts receivable
375
450
Merchandise inventory
900
450
Prepaid expenses
20
10
Land
70
70
Buildings
1,340
620
Accum. dep. – buildings
(430)
(280)
Machinery
1,130
920
Accum. dep. – machinery
(250)
(240)
Accounts payable
(235)
(145)
Dividends payable
(25)
(30)
Income taxes payable
(40)
(25)
Long-term loan payable
(1,000)
(500)
Share capital
(1,210)
(800)
Retained earnings
(672)
(650)
Total
-0-
-0-
Cash has
decreased
by $123k.
This is the
amount
that the
SCF anal-
ysis must
reconcile
to.
An explora on is available on the Lyryx site. Log into your Lyryx course to run
Step 3: Calculate and analyze the changes in retained earnings and dividends payable (if there
is a Dividends Payable account)
When we calculate the changes for each of retained earnings and dividends payable, the net dif-
ference may not always reflect the causes for change in these accounts. For example, the net
difference between the beginning and ending balances in retained earnings is an increase of $22
thousand. However, two things occurred to cause this net change: a net income of $80 thousand
(a debit to income summary and a credit to retained earnings) and dividends of $58 thousand
that were declared during the year per the addi onal informa on (a debit to retained earnings of
$58k and a credit to dividends payable of $58k). The net income of $80 thousand is the star ng
posi on in the opera ng ac vi es sec on of the SCF (see Figure
).
The change in the dividends payable balance was also caused by two transac ons — the divi-
dend declara on of $58 thousand (a debit to retained earnings and a credit to dividends payable)
and a $63 thousand payment of dividends (a debit to dividends payable and a credit to cash).
The $63 thousand cash payment is subtracted in the financing ac vi es sec on of the SCF (see
Figure
). Dividends payable can change because of two transac ons, as in this example, or
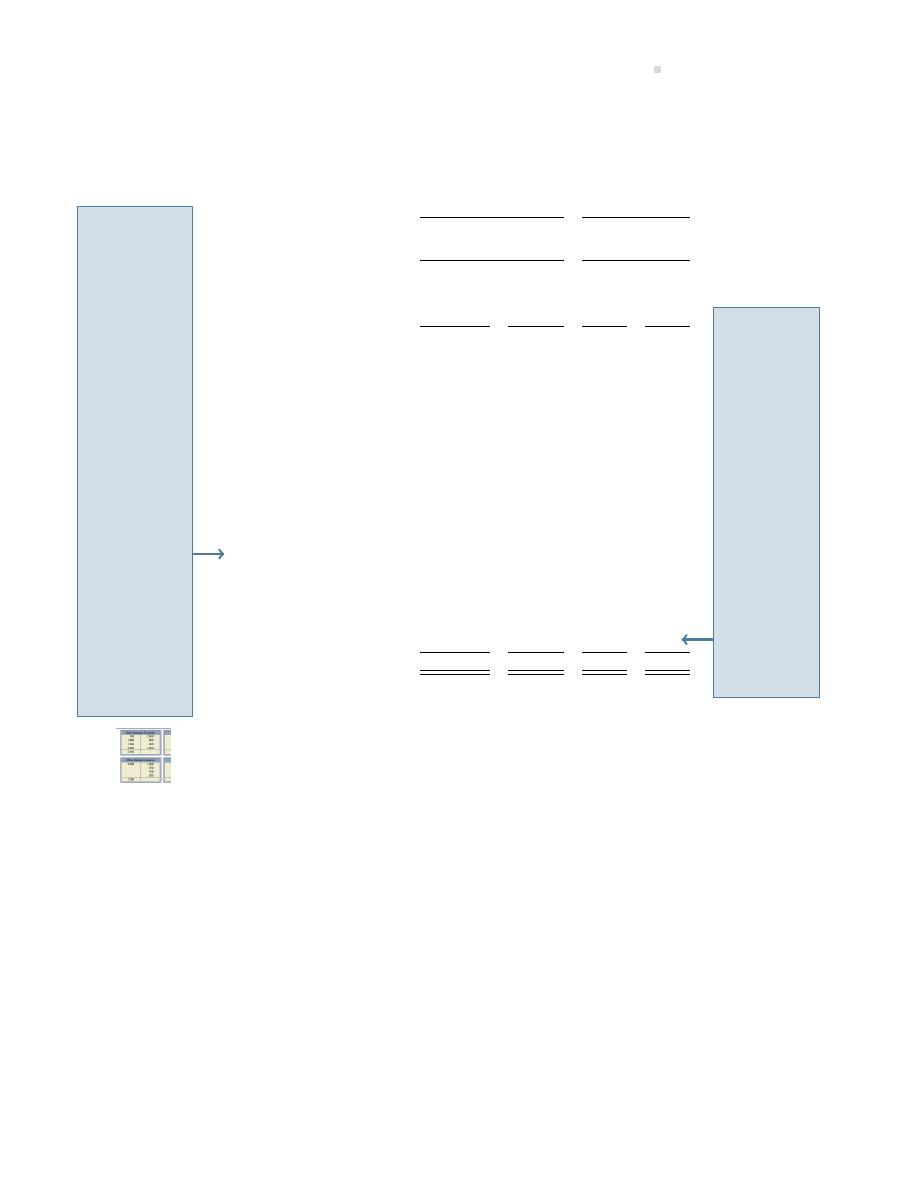
11.2. Preparing the Statement of Cash Flows
427
because of one transac on, which could be either a dividend declara on with no payment of cash,
or a payment of the dividend payable and no dividend declara on. Step 3 as it applies to Example
Corpora on is detailed below.
Step 3
Balance
($000s)
Change
2016
2015
Dr.
Dr.
Account
(Cr.)
(Cr.)
Dr.
Cr.
Cash
27
150
123
Accounts receivable
375
450
75
Merchandise inventory
900
450
450
Prepaid expenses
20
10
10
Land
70
70
Buildings
1,340
620
Accum. dep. – buildings
(430)
(280)
Machinery
1,130
920
Accum. dep. – machinery
(250)
(240)
Accounts payable
(235)
(145)
90
Dividends payable
(25)
(30)
63
58
Income taxes payable
(40)
(25)
15
Long-term loan payable
(1,000)
(500)
Share capital
(1,210)
(800)
Retained earnings
(672)
(650)
58
80
Total
-0-
-0-
During
2016, net
income of
$80k was
earned.
The be-
ginning
balance in
retained
earnings
of $650k
plus net
income of
$80 means
$58k of
dividends
were de-
clared,
crea ng
the $672k
ending
retained
earnings
balance.
During
2016, div-
idends of
$58k were
declared
(this infor-
ma on was
given). The
beginning
balance of
$30k plus
$58k means
$63k were
paid, creat-
ing the end-
ing balance
of $25k (the
$63k was
not given so
had to be
calculated
and results
in a debit
to dividends
payable).
The pay-
ment of
$63k of div-
idends is a
financing
ac vity.
An explora on is available on the Lyryx site. Log into your Lyryx course to run
Net income/loss and Dividends Paid
Step 4: Calculate and analyze the changes in the noncash current assets and current liabili es
(excluding Dividends Payable account)
Calculate the net debit or net credit changes for each current asset and current liability account
on the balance sheet and insert these changes in the appropriate column. Step 4 as it applies
to Example Corpora on is detailed below. The $75 thousand decrease in accounts receivable is
added in the opera ng ac vi es sec on of the SCF, the $450 thousand increase in merchandise
inventory is subtracted, the $10 thousand increase in prepaid expenses is subtracted, the $90
thousand increase in accounts payable is added, and the $15 thousand increase in income taxes
payable is added (see Figure
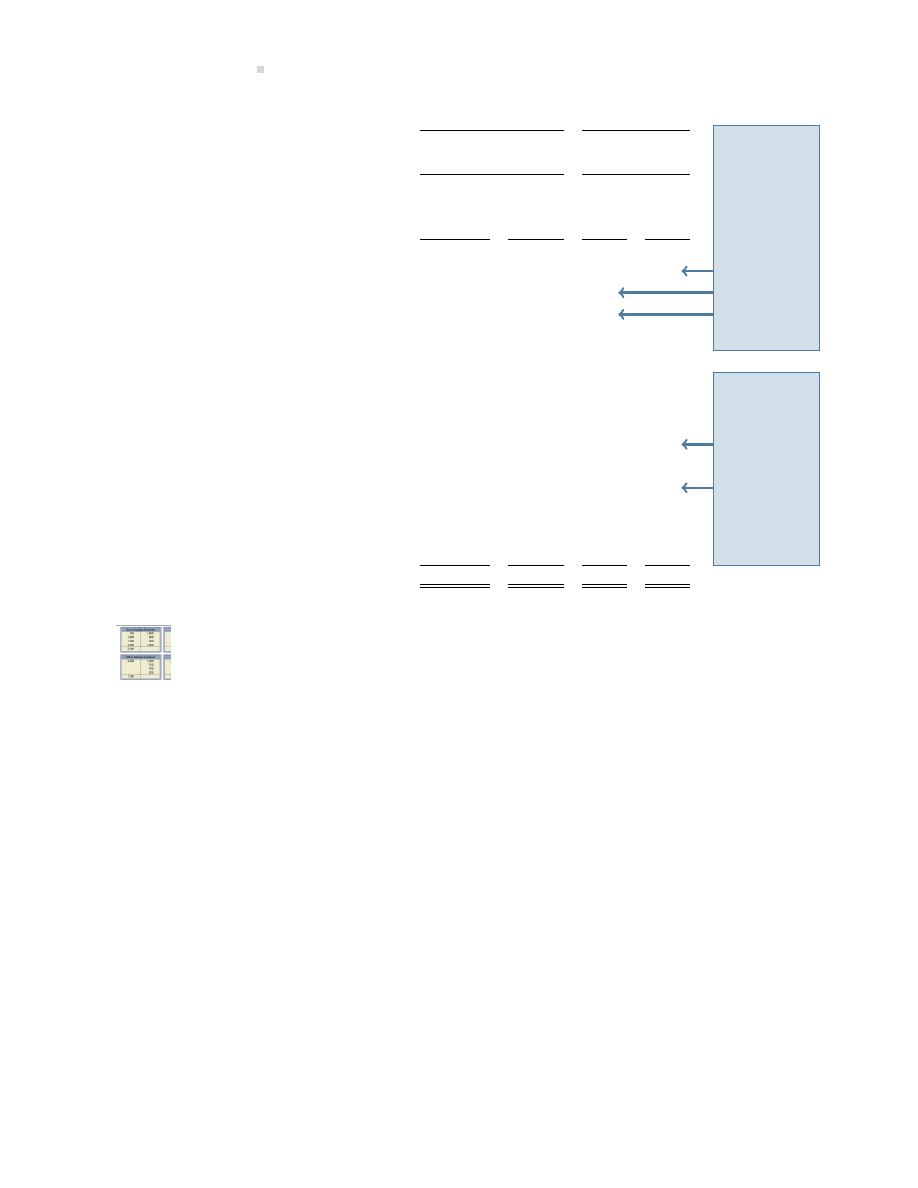
428
The Statement of Cash Flows
Step 4
Balance
($000s)
Change
2016
2015
Dr.
Dr.
Account
(Cr.)
(Cr.)
Dr.
Cr.
Cash
27
150
123
Accounts receivable
375
450
75
Merchandise inventory
900
450
450
Prepaid expenses
20
10
10
Land
70
70
Buildings
1,340
620
Accum. dep. – buildings
(430)
(280)
Machinery
1,130
920
Accum. dep. – machinery
(250)
(240)
Accounts payable
(235)
(145)
90
Dividends payable
(25)
(30)
Income taxes payable
(40)
(25)
15
Long-term loan payable
(1,000)
(500)
Share capital
(1,210)
(800)
Retained earnings
(672)
(650)
Total
-0-
-0-
The net
change in
each of
accounts
receivable,
merchan-
dise inven-
tory, and
prepaid
expenses
are clas-
sified as
opera ng
ac vi es.
The net
change in
each of
accounts
payable
and in-
come taxes
payable
are clas-
sified as
opera ng
ac vi es.
An explora on is available on the Lyryx site. Log into your Lyryx course to run
Cash Flows from Opera ng Ac vi es
Step 5: Calculate and analyze changes in non-current asset accounts
Changes in non-current assets are classified as inves ng ac vi es. There was no change in the
Land account. We know from the addi onal informa on provided that buildings and machinery
were purchased and that machinery was sold.
Buildings were purchased for $720 thousand (a debit to buildings and a credit to cash). The cash
payment of $720 thousand is shown in the inves ng ac vi es sec on (see Figure
).
Accumulated deprecia on–buildings is a non-current asset account and it increased by $150 thou-
sand. This change was caused by a debit to deprecia on expense and a credit to accumulated
deprecia on–building. We know from an earlier discussion that deprecia on expense is an ad-
justment in the opera ng ac vi es sec on of the SCF therefore the $150 thousand is added in
the opera ng ac vi es sec on (see Figure
).
Two transac ons caused machinery to change. First, the purchase of $350 thousand of machin-
ery (debit machinery and credit cash); the $350 thousand cash payment is shown in the inves ng
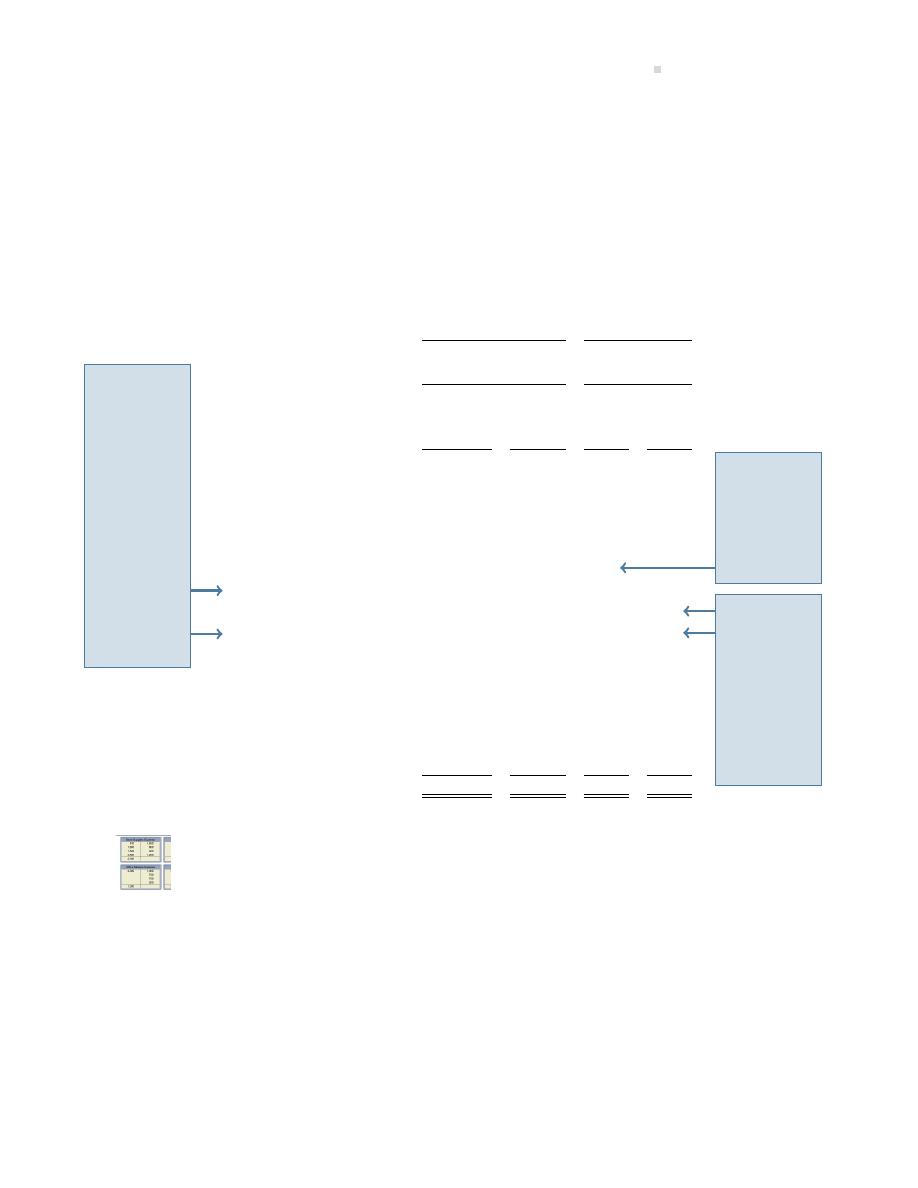
11.2. Preparing the Statement of Cash Flows
429
ac vi es sec on (see Figure
). Second, machinery cos ng $140 thousand with accumulated
deprecia on of $100 thousand was sold for cash of $30 thousand resul ng in a loss of $10 thou-
sand. The cash proceeds of $30 thousand is shown in the inves ng ac vi es sec on of the SCF
and the $10 thousand loss is added in the opera ng ac vi es sec on (see Figure
Accumulated deprecia on–machinery not only decreased $100 thousand because of the sale of
machinery but it increased by $110 thousand because of deprecia on (debit deprecia on expense
and credit accumulated deprecia on–machinery). The $110 thousand of deprecia on expense is
added in the opera ng ac vi es sec on of the SCF (see Figure
).
Step 5
Balance
($000s)
Change
2016
2015
Dr.
Dr.
Account
(Cr.)
(Cr.)
Dr.
Cr.
Cash
27
150
123
Accounts receivable
375
450
75
Merchandise inventory
900
450
450
Prepaid expenses
20
10
10
Land
70
70
-0-
Buildings
1,340
620
720
Accum. dep. – buildings
(430)
(280)
150
Machinery
1,130
920
350
140
Accum. dep. – machinery
(250)
(240)
100
110
Accounts payable
(235)
(145)
90
Dividends payable
(25)
(30)
5
Income taxes payable
(40)
(25)
15
Long-term loan payable
(1,000)
(500)
Share capital
(1,210)
(800)
Retained earnings
(672)
(650)
Total
-0-
-0-
Total de-
precia on
expense of
$260k was
recorded
during
the year;
$150k on
the build-
ing and
$110k on
the ma-
chinery, an
adjustment
under op-
era ng ac-
vi es on
the SCF.
Machinery
cos ng
$140k with
accum.
dep. of
$100k was
sold for
cash of
$30k, an
inves ng
ac vity.
A build-
ing was
purchased
for cash of
$720k, an
inves ng
ac vity.
An explora on is available on the Lyryx site. Log into your Lyryx course to run
.
Step 6: Calculate and analyze changes in Long-term Liability and Share Capital accounts
Changes in Long-term Liability and Share Capital accounts result from financing ac vi es. We
know from the addi onal informa on provided earlier that Example Corpora on received cash of
$500k from a bank loan (debit cash and credit long-term loan payable) and issued shares for $410k
cash (debit cash and credit share capital). The $500 thousand cash proceeds from the bank loan
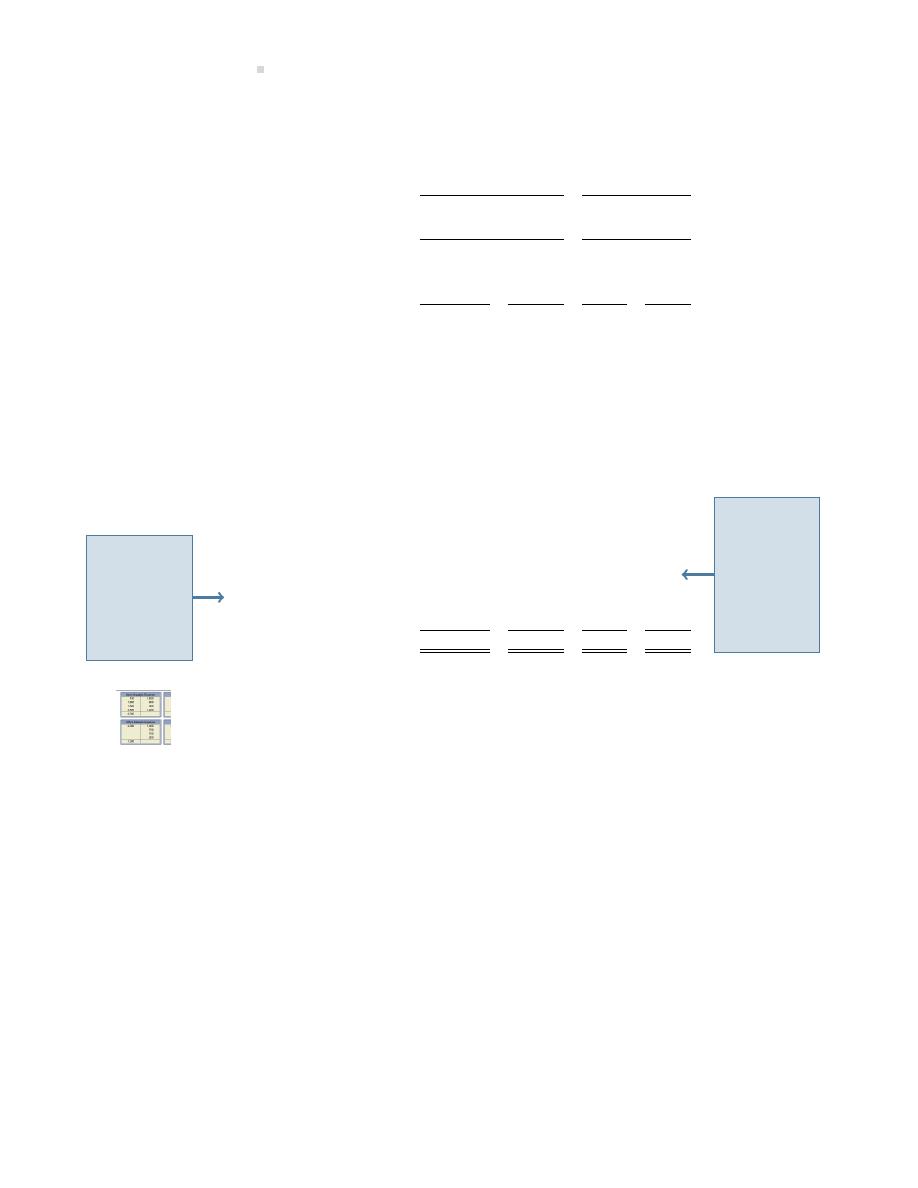
430
The Statement of Cash Flows
and $410 thousand cash proceeds from the issuance of shares are listed in the financing sec on
of the SCF (see Figure
).
Step 6
Balance
($000s)
Change
2016
2015
Dr.
Dr.
Account
(Cr.)
(Cr.)
Dr.
Cr.
Cash
27
150
123
Accounts receivable
375
450
75
Merchandise inventory
900
450
450
Prepaid expenses
20
10
10
Land
70
70
-0-
Buildings
1,340
620
720
Accum. dep. – buildings
(430)
(280)
150
Machinery
1,130
920
350
140
Accum. dep. – machinery
(250)
(240)
100
110
Accounts payable
(235)
(145)
90
Dividends payable
(25)
(30)
5
Income taxes payable
(40)
(25)
15
Long-term loan payable
(1,000)
(500)
500
Share capital
(1,210)
(800)
410
Retained earnings
(672)
(650)
58
80
Total
-0-
-0-
Shares
were is-
sued for
cash of
$410k, a
financing
ac vity.
$500k of
cash was
received
because
of an ad-
di onal
bank loan,
a financing
ac vity.
An explora on is available on the Lyryx site. Log into your Lyryx course to run
.
Step 7: Reconcile the analysis
The analysis is now complete. Add the debit and credit changes, excluding the change in cash. The
total debits of $1,693 less the total credits of $1,570 equal a difference of $123 which reconciles
to the decrease in cash calculated in Step 2.

11.2. Preparing the Statement of Cash Flows
431
Step 7
Balance
($000s)
Change
2016
2015
Dr.
Dr.
Account
(Cr.)
(Cr.)
Dr.
Cr.
Cash
27
150
123
Accounts receivable
375
450
75
Merchandise inventory
900
450
450
Prepaid expenses
20
10
10
Land
70
70
-0-
Buildings
1,340
620
720
Accum. dep. – buildings
(430)
(280)
150
Machinery
1,130
920
350
140
Accum. dep. – machinery
(250)
(240)
100
110
Accounts payable
(235)
(145)
90
Dividends payable
(25)
(30)
5
Income taxes payable
(40)
(25)
15
Long-term loan payable
(1,000)
(500)
500
Share capital
(1,210)
(800)
410
Retained earnings
(672)
(650)
58
80
Total
-0-
-0-
1,693
1,570
Change in cash
123
The
change
in cash cal-
culated in
Step 2…
…must
agree to
the change
in cash
resul ng
from the
analysis.
The informa on in the completed analysis can be used to prepare the statement of cash flows
shown in Figure

432
The Statement of Cash Flows
Example Corpora on
Statement of Cash Flows
For the Year Ended December 31, 2016
($000s)
Cash flows from opera ng ac vi es:
Net income
$
80
Adjustments to reconcile net income
cash provided by opera ng ac vi es:
Decrease in accounts receivable
75
Increase in merchandise inventory
(450)
Increase in prepaid expenses
(10)
Increase in accounts payable
90
Increase in income taxes payable
15
Deprecia on expense
260
Loss on disposal of machinery
10
Net cash inflow from opera ng ac vi es
$
70
Cash flows from inves ng ac vi es:
Proceeds from sale of machinery
30
Purchase of building
(720)
Purchase of machinery
(350)
Net cash ou low from inves ng ac vi es
(1,040)
Cash flows from financing ac vi es:
Payment of dividends
(63)
Proceeds from bank loan
500
Issuance of shares
410
Net cash inflow from financing ac vi es
847
Net decrease in cash
$ (123)
Cash at beginning of year
150
Cash at end of year
$
27
Figure 11.5: Statement of Cash Flows for Example Corpora on
11.3 Interpre ng the Statement of Cash Flows
LO3 – Interpret a
statement of cash
flows.
Readers of financial statements need to know how cash has been used by
the enterprise. The SCF provides external decision makers such as credi-
tors and investors with this informa on. The statement of cash flows pro-
vides informa on about an enterprise’s financial management policies and
prac ces. It also may aid in predic ng future cash flows, which is an im-
portant piece of informa on for investors and creditors.
The quality of earnings as reported on the income statement can also be assessed with the infor-
ma on provided by the SCF. The measurement of net income depends on a number of accruals
and alloca ons that may not provide clear informa on about the cash-genera ng power of a com-
pany. Users will be more confident in a company with a high correla on between cash provided by
opera ons and net income measured under the accrual basis. Recall, for instance, that although
Example Corpora on has net income of $80,000 during 2016, its net cash inflow from opera ons

11.4. Appendix A: Pu ng It All Together: Corporate Financial Statements
433
is only $70,000, chiefly due to the large increase in inventory levels. Although net cash flow from
opera ons is s ll posi ve, this discrepancy between net income and cash flow from opera ons
may indicate looming cash flow problems, par cularly if the trend con nues over me.
Example Corpora on’s SCF also reveals that significant net addi ons to plant and equipment assets
occurred during the year ($1,070,000), financed in part by cash flow from opera ng ac vi es but
primarily by financing ac vi es. These ac vi es included the assump on of loans and issue of
shares that amounted to $847,000, net of dividend payments ($500,000 from issuing a long-term
loan plus $410,000 from issuing shares less $63,000 for payment of dividends).
It appears that a significant plant and equipment asset acquisi on program may be underway,
which may affect future financial performance posi vely. This expansion has been financed mainly
by increases in long-term debt and the issuance of common shares. However, the magnitude of
the plant and equipment asset purchases, coupled with the payment of the dividends to share-
holders, has more than offset cash inflows from opera ng and financing ac vi es, resul ng in
a net overall decrease in cash of $123,000. Though the current cash expenditure on long-term
produc ve assets may be a prudent business decision, it has resulted in (hopefully temporary)
adverse effects on overall cash flow.
The SCF is not a subs tute for an income statement prepared on the accrual basis. Both statements
should be used to evaluate a company’s financial performance. Together, the SCF and income
statement provide a be er basis for determining the enterprise’s ability to generate funds from
opera ons and thereby meet current obliga ons when they fall due (liquidity), pay dividends,
meet recurring opera ng costs, survive adverse economic condi ons, or expand opera ons with
internally-generated cash.
The SCF highlights the amount of cash available to a corpora on, which is important. Excess cash
on hand is unproduc ve. Conversely, inadequate cash decreases liquidity. Cash is the most liquid
asset, and its efficient use is one of the most important tasks of management. Cash flow informa-
on, interpreted in conjunc on with other financial statement analyses, is useful in assessing the
effec veness of the enterprise’s cash management policies.
Readers who wish to evaluate the financial posi on and results of an enterprise’s opera ons also
require informa on on cash flows produced by inves ng and financing ac vi es. The SCF is the
only statement that explicitly provides this informa on. By examining the rela onship among the
various sources and uses of cash during the year, readers can also focus on the effec veness of
management’s inves ng and financing decisions and how these may affect future financial per-
formance.
11.4 Appendix A: Pu ng It All Together: Corporate Financial State-
ments
The core financial statements connect to complete an overall picture of the company’s opera ons
and its current financial state. It is important to understand how these reports connect; therefore,

434
The Statement of Cash Flows
a review of some simplified financial statements for Wellbourn Services Ltd. is presented below.
Wellbourn Services Ltd.
Statement of Income
for the year ended December 31, 2015
Revenues:
Sales
$
250,000
Services revenue
53,000
Total revenue
$
303,000
Opera ng expenses:
Cost of good sold
100,000
Deprecia on expense
3,000
Rent expense
20,000
Salaries expense
65,000
Total opera ng expense
188,000
Income from con nuing opera ons before tax
115,000
Income tax
34,500
Net income
$
80,500
Earnings per share
$
24
Wellbourn Services Ltd.
Statement of Changes in Equity
for the year ended December 31, 2015
Common
Retained
Shares
Earnings
Total
Balance, January 1
$200,000
$75,000
$275,000
Net income
80,500
80,500
Issuance of common shares
10,000
10,000
Dividends declared
(50,000)
(50,000)
Balance, December 31
$210,000
$105,500
$315,500
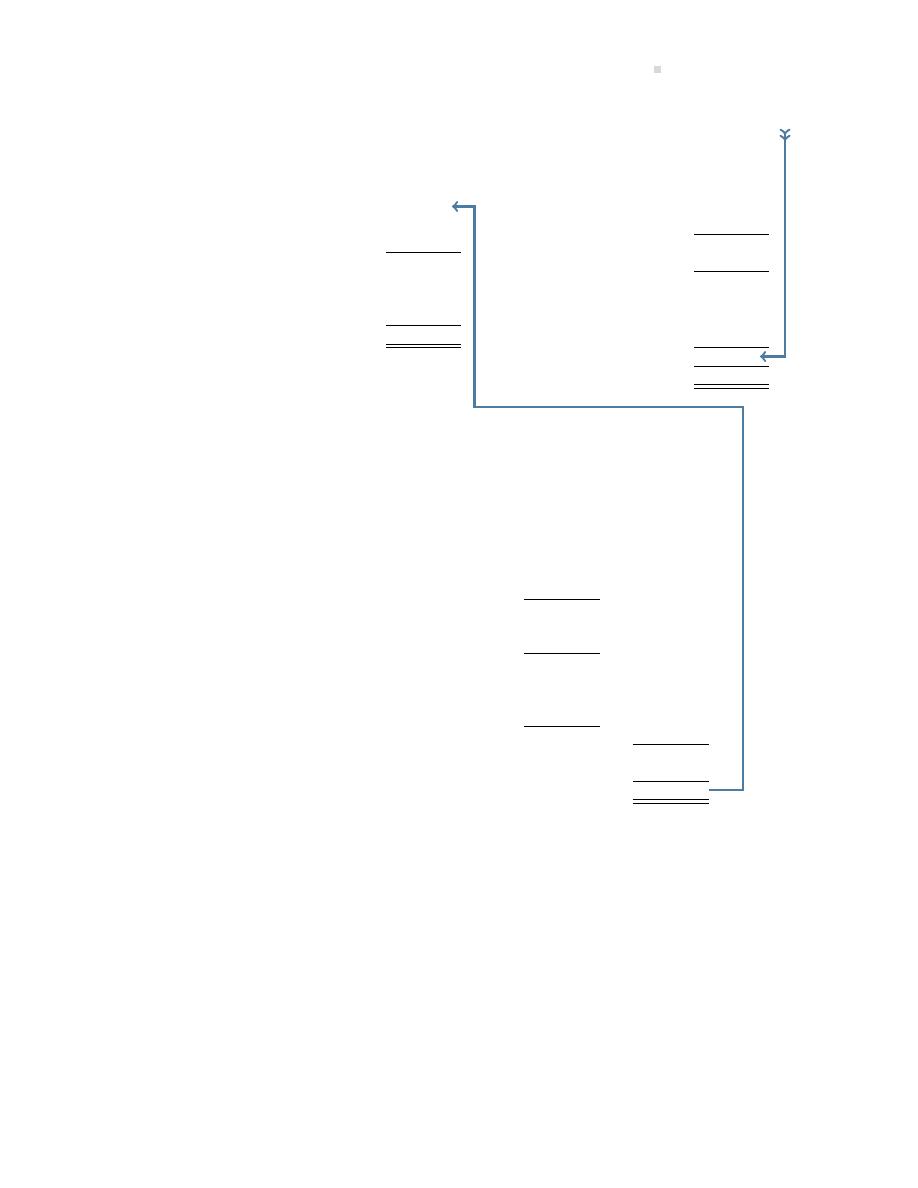
11.4. Appendix A: Pu ng It All Together: Corporate Financial Statements
435
Wellbourn Services Ltd.
Statement of Financial Posi on
December 31, 2015
Assets
Liabili es
Current assets
Current liabili es
Cash
$135,500
Accounts payable
$ 77,500
Accounts receivable (net)
225,000
Accrued liabili es
225,000
Inventory
130,000
Total current liabili es
302,500
Total current assets
490,500
Bonds payable
160,000
Investments
100,000
Total liabili es
462,500
Property, plant, and equipment (net)
172,500
Equity
Intangible assets
15,000
Common shares
210,000
Total assets
$778,000
Retained earnings
105,500
Total equity
315,500
Liabili es and equity
$778,000
Wellbourn Services Ltd.
Statement of Cash Flows
for the year ended December 31, 2015
Cash flows from opera ng ac vi es
Net income
$ 80,500
plus: Deprecia on
3,000
Increase in accounts receivable
(50,000)
Increase in inventory
(34,700)
Decrease in accounts payable
(20,000)
Decrease in accrued liabili es
(5,000)
Net cash used by opera ng ac vi es
(26,200)
Cash flows from inves ng ac vi es
Purchase of equipment
(25,000)
Net cash used by inves ng ac vi es
(25,000)
Cash flows from financing ac vi es
Dividends paid
(50,000)
Issued bonds
160,000
Net cash received by financing ac vi es
110,000
Net increase in cash
58,800
Cash balance, January 1
76,700
Cash balance, December 31
$135,500
As can be seen from the flow of the numbers above, the net income from the statement of income
is closed to retained earnings.
The statement of changes in equity total column flows to the equity sec on of the balance sheet.
Finally, the statement of cash flows (SCF) ending cash balance must be equal to the cash ending
balance reported in the balance sheet, which completes the loop of interconnec ng accounts and
amounts.

436
The Statement of Cash Flows
Statement of Income with Discon nued Opera ons
Single-step and Mul ple-step Statement of Income
Companies can choose whichever format best suits their repor ng needs. Smaller companies
tend to use the simpler single-step format, while larger companies tend to use the mul ple-step
format.
The Wellbourn Services Ltd. statement of income, shown earlier, is an example of a typical single-
step income statement. For this type of statement, revenue and expenses are each reported in the
two sec ons for con nuing opera ons. Discon nued opera ons are separately reported below
the con nuing opera ons. The separate disclosure and format for the discon nued opera ons
sec on is a repor ng requirement and is discussed and illustrated below. The single-step format
makes the statement simple to complete and keeps sensi ve informa on out of the hands of
compe
ve companies, but provides li le in the way of analy cal detail.
The mul ple-step income statement format provides much more detail. Below is an example of
a mul ple-step statement of income for Toulon Ltd. for the year ended December 31, 2015.

11.4. Appendix A: Pu ng It All Together: Corporate Financial Statements
437
Toulon Ltd.
Statement of Income
for the year ended December 31, 2015
In $000’s except per share amounts
2015
2014
Sales
$6,260
$5,008
Cost of goods sold
2,500
1,750
Gross profit
3,760
3,258
Opera ng expenses
Salaries and benefits expense
650
520
Deprecia on expense
35
20
Travel and entertainment expense
150
120
Adver sing expense
55
45
Freight-out expenses
10
8
Supplies and postage expense
5
4
Telephone and internet expense
15
12
Legal and professional expenses
8
6
Insurance expense
6
5
934
740
Income from opera ons
2,826
2,518
Other revenue and expense
Interest income from investments
5
5
Gain from sale of trade investments
4
0
Interest expense
(2)
(3)
7
2
Income from con nuing opera ons
2,833
2,520
before income tax
Income tax expense
850
680
Income from con nuing opera ons
1,983
1,840
Discon nued opera ons
Loss from disposal of division
(net of tax of $63,000)
(147)
0
(147)
0
Net income
1,836
1,840
Mul ple-step for-
mat - typical sec-
ons and subtotals:
Heading
Gross profit sec on
with subtotal
Opera ng expenses
with subtotal
Non-opera oning
sec on with subto-
tal
Income tax ex-
pense
Subtotal from con-
nuing opera ngs
Discon nued
Net income (profit
or loss)
Basic earnings per share
Con nuing opera ons
$ 16.32 $13.25
Discon nued opera ons
(1.21)
0
Earnings per share
The mul ple-step format with its sec on subtotals makes performance analysis and ra o calcula-
ons such as gross profit margins easier to complete and makes it easier to assess the company’s
future earnings poten al. The mul ple-step format also enables investors and creditors to evalu-
ate company performance results from con nuing and ongoing opera ons having a high predic ve
value separately, compared to non-opera ng or unusual items having li le predic ve value.

438
The Statement of Cash Flows
Opera ng Expenses
As discussed in an earlier chapter, expenses from opera ons can be reported by their nature and,
op onally, by func on. Expenses by nature relate to the type of expense or the source of expense
such as salaries, insurance, adver sing, travel and entertainment, supplies expense, deprecia on
and amor za on, and u li es expense, to name a few. The statement for Toulon Ltd. is an example
of repor ng expenses by nature.
Expenses by func on relate to how various expenses are incurred within the various departments
and ac vi es of a company such as selling and administra ve expenses.
The sum of all the revenues, expenses, gains, and losses to this point represents the income or
loss from con nuing opera ons. This is a key component used in performance analysis.
Income Tax Alloca ons
This is the process of alloca ng income tax expense to various categories within the statement of
income such as income from con nuing opera ons before taxes and discon nued opera ons. The
purpose of these alloca ons is to make the informa on within the statements more informa ve
and complete. For example, Toulon’s statement of income for the year ending December 31, 2015,
allocates tax at a rate of 30% to the following:
• Income from con nuing opera ons of $850,000 ($2,833,000
× 30%)
• Loss from disposal of discon nued opera ons of $63,000
Discon nued opera ons
Some mes companies will sell or shut down certain business opera ons because the opera ng
segment is no longer profitable, or they may wish to focus their resources on other business oper-
a ons. Examples are a major business line or geographical area. If the discon nued opera on has
not yet been sold, then there must be a formal plan in place to dispose of the component within
one year and to report it as a discon nued opera on.
The items reported in this sec on of the statement of income are to be reported net of tax, with
the tax amount disclosed.
Earnings per Share
Basic earnings per share represent the amount of income a ributable to each outstanding com-
mon share, as shown in the calcula on below:
Basic earnings per share (EPS) =
Net income
− preferred dividends
Number of common shares outstanding
The earnings per share amounts are not required for private companies. This is because ownership
of privately owned companies is o en held by only a few investors, compared to publicly-traded
companies where shares are held by many investors.

11.5. Appendix B: Statement of Cash Flows – Direct Method
439
Basic earnings per share are to be reported on the face of the statement of income as follows:
• Basic EPS from con nuing opera ons
• Basic EPS from discon nued opera ons, if any
If the outstanding common shares for Toulon was 121,500, the EPS from con nuing opera ons
would be $16.32 (1,983,000
÷121,500) and $(1.21) from discon nued opera ons ($147,000 loss÷
121,500), as reported in their statement above. There is also a requirement to report diluted EPS
but this is beyond the scope of this course.
11.5 Appendix B: Statement of Cash Flows – Direct Method
The Importance of Cash Flow – For Be er, For Worse, For Richer, For Poorer…
A business is a lot like a marriage. It takes work to make it succeed. One of the keys to business
success is managing and maintaining adequate cash flows. In the field of financial management,
there is an old saying that revenue is vanity, profits are sanity, but cash is king. In other words, a
firm’s revenues and profits may look spectacular, but this does not guarantee there will be cash in
the bank. Without cash, a business cannot pay its bills and it will ul mately not survive.
Let’s take a look at the dis nc ons between revenue and profits, and cash, using a numeric exam-
ple for a new business:
Income Statement
Cash Flows
Revenue*
$1,000,000
Revenue (cash received)
$ 400,000
Cost of goods sold**
(500,000)
Cost of goods sold (paid in cash)
(300,000)
Gross profit
500,000
Net cash
100,000
Opera ng expenses***
200,000
Opera ng expenses (paid in cash)
90,000
Net income/net profit
$ 300,000
Net cash
$
10,000
* Sales of $400,000 were paid in cash
** Purchases of $300,000 were paid in cash
*** Opera ng expenses of $90,000 were cash paid
Revenue is reported in the income statement as $1 million which is a sizeable amount, but only
$400,000 was cash paid by customers. (The rest is reported as accounts receivable.) Gross profit
is reported in the income statement as $500,000. This is also a respectable number, but only
$100,000 translates into a posi ve cash flow, because only some of the inventory purchases were
paid in cash. (The rest of the inventory is reported as accounts payable.) The company must s ll
pay some of its opera ng expenses, leaving only $10,000 cash in the bank.

440
The Statement of Cash Flows
When investors and creditors review the income statement, they will see $1 million in revenue
with gross profits of one-half million or 50%, and a respectable net income of $300,000 or 30%
of revenue. They could conclude that this looks pre y good for the first year of opera ons and
incorrectly assume that the company now has $300,000 available to spend.
However, lurking deeper in the financial statements is the cash posi on of the company–the
amount of cash le over from this opera ng cycle. Sadly, there is only $10,000 cash in the bank,
so the company cannot even pay its remaining accounts payable in the short term. So, how can
management keep track of its cash?
The statement of cash flows is the defini ve financial statement to bridge the gaps between rev-
enues and profits, and cash. Therefore, it is vital to understand the statement of cash flows.
As cash is generally viewed by many as the most cri cal asset to success, this appendix will focus
on how to correctly prepare and interpret the statement of cash flows using the direct method.
For example, below is the statement of cash flows using the direct method for the year ended
December 31, 2015 for Wellbourn Services Ltd. at December 31, 2015.
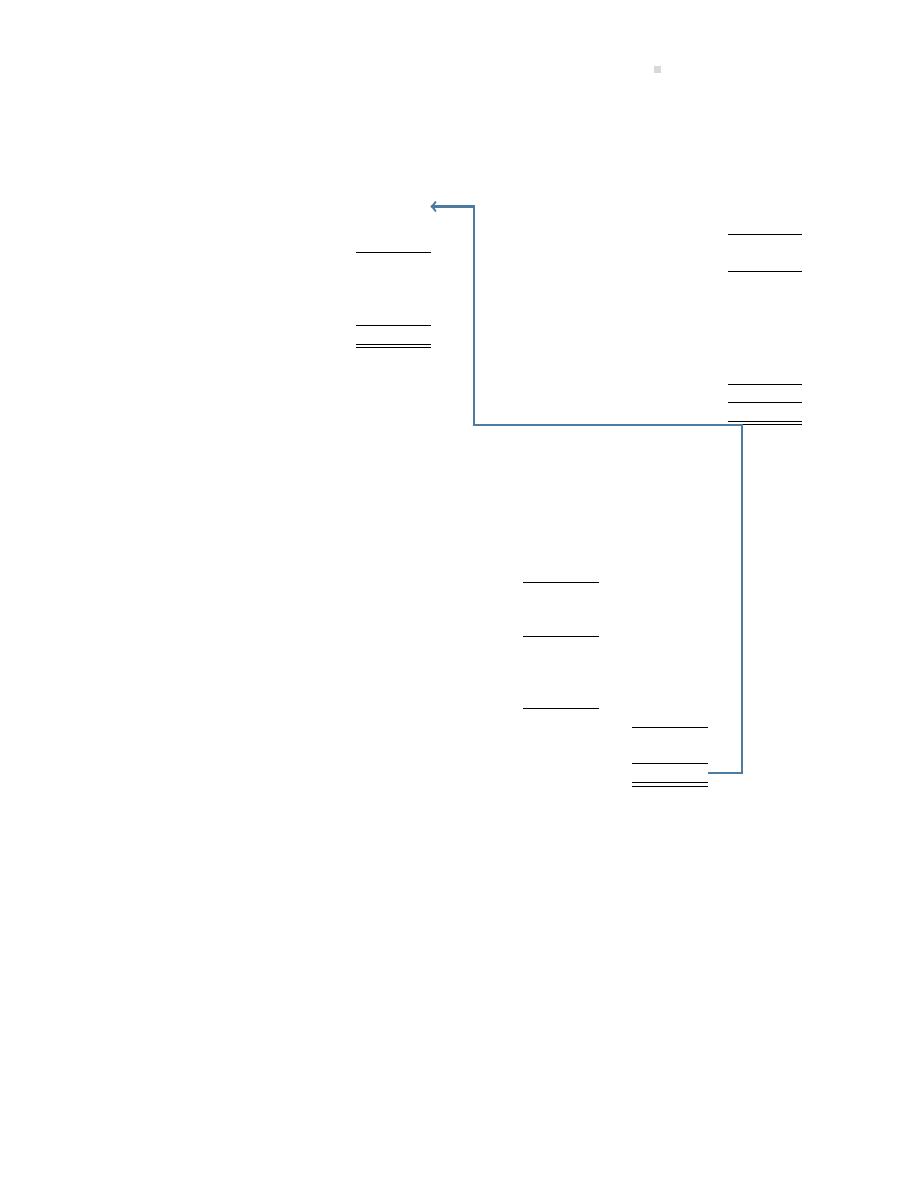
11.5. Appendix B: Statement of Cash Flows – Direct Method
441
Wellbourn Services Ltd.
Statement of Financial Posi on
December 31, 2015
Assets
Liabili es
Current assets
Current liabili es
Cash
$135,500
Accounts payable
$ 77,500
Accounts receivable (net)
225,000
Accrued liabili es
225,000
Inventory
130,000
Total current liabili es
302,500
Total current assets
490,500
Bonds payable
160,000
Investments
100,000
Total liabili es
462,500
Property, plant, and equipment (net)
246,000
Equity
Intangible assets
15,000
Share capital
210,000
Total assets
$851,500
Contributed surplus
25,000
Retained earnings
105,500
Accum. Other Comp. Income(AOCI)
48,500
Total equity
389,000
Liabili es and equity
$851,500
Wellbourn Services Ltd.
Statement of Cash Flows
For the year ended December 31, 2015
Cash flows from opera ng ac vi es
Cash received from sales
$ 50,000
Cash paid for goods and services
(25,000)
Cash paid to or on behalf of employees
(51,200)
Net cash flows from opera ng ac vi es
(26,200)
Cash flows from inves ng ac vi es
Purchase of equipment
(25,000)
Net cash flows from inves ng ac vi es
(25,000)
Cash flows from financing ac vi es
Dividends paid
(50,000)
Issued bonds
160,000
Net cash flows from financing ac vi es
110,000
Net increase in cash
58,800
Cash balance, January 1
76,700
Cash balance, December 31
$ 135,500
Note how Wellbourn’s ending cash balance of $135,500, from the statement of cash flows for the
year ended December 31, matches the ending cash balance in the balance sheet on that date.
This is a cri cal rela onship between these two financial statements. The balance sheet provides
informa on about a company’s resources (assets) at a specific point in me, and whether these
resources are financed mainly by debt (current and long-term liabili es) or equity (shareholders’
equity). The statement of cash flows iden fies how the company u lized its cash inflows and
ou lows over the repor ng period and, ul mately, ends with its current cash and cash equivalents
balance at the balance sheet date. As well, since the statement of cash flows is prepared on a cash
basis, it excludes non-cash accruals like deprecia on and interest, making the statement of cash
flows harder to manipulate than the other financial statements.
Two methods are used to prepare a statement of cash flows, namely the indirect method and the

442
The Statement of Cash Flows
direct method. The indirect method was discussed earlier in this chapter. Both methods organize
the reported cash flows into three ac vi es: opera ng, inves ng, and financing. The only dif-
ference when applying the direct method is in the opera ng ac vi es sec on; the inves ng and
financing sec ons are prepared exactly the same way for both methods.
For the direct method categories are based on the nature of the cash flows. With the indirect
method the cash flows are based on the income statement and changes in each current asset and
liability account, except cash. Below is a comparison of the two methods:
Indirect Method
Direct Method
Cash flows from opera ng ac vi es:
Cash flows from opera ng ac vi es:
Net income
$$
Cash received from sales
$$
Adjust for non-cash items:
Cash paid for goods and services
($$)
Deprecia on
$$
Cash paid to or on behalf of employees ($$)
Gain on sale of asset
($$)
Cash received for interest income
$$
Increase in accounts receivable
($$)
Cash paid for interest
($$)
Decrease in inventory
$$
Cash paid for income taxes
($$)
Increase in accounts payable
$$
Cash received for dividends
$$
Net cash flows from opera ng ac vi es
$$
Net cash flows from opera ng ac vi es
$$
The direct method is straigh orward due to the grouping of informa on by nature. This also makes
interpreta on of the statement easier for stakeholders. However, companies record thousands of
transac ons every year and many of them do not involve cash. Since the accoun ng records are
kept on an accrual basis, it can be a me-consuming and expensive task to separate and collect the
cash-only data required for the direct method categories by nature. Also, repor ng on sensi ve
informa on, such as cash receipts from customers and cash payments to suppliers, may not be in
the best interest of the company in light of compe tor companies using the informa on to their
advantage. For these reasons, many companies prefer not to use the direct method, even though
IFRS standards prefer its use over the indirect method. Also, the indirect method may be easier
to prepare because it collects much of its data directly from the exis ng income statement and
balance sheet. However, it is more difficult to understand because it uses the accounts-based
categories as shown above.

11.5. Appendix B: Statement of Cash Flows – Direct Method
443
11.5.1Preparing a Statement of Cash Flows: Direct Method
As with the indirect method, preparing a statement of cash flows using the direct method is made
much easier if specific steps are followed in sequence. Below is a summary of those steps to
complete the opera ng sec on of the statement of cash flows using the direct method for Watson
Ltd:
Watson Ltd.
Par al Balance Sheet
As at December 31, 2015
2015
2014
Current assets
Cash
$ 307,500
$ 250,000
Investments – trading
12,000
10,000
Accounts receivable (net)
249,510
165,000
Notes receivable
18,450
22,000
Inventory (LCNRV)
708,970
650,000
Prepaid insurance expenses
18,450
15,000
Total current assets
1,314,880
1,112,000
Current liabili es
Accounts payable
$ 221,000
$
78,000
Accrued interest payable
24,600
33,000
Income taxes payable
54,120
60,000
Unearned revenue
25,000
225,000
Current por on of long-term notes payable
60,000
45,000
Total current liabili es
384,720
441,000

444
The Statement of Cash Flows
Watson Ltd.
Income Statement
For the Year Ended December 31, 2015
Sales
$3,500,000
Cost of goods sold
2,100,000
Gross profit
1,400,000
Opera ng expenses
Salaries and benefits expense
800,000
Deprecia on expense
43,000
Travel and entertainment expense
134,000
Adver sing expense
35,000
Freight-out expense
50,000
Supplies and postage expense
12,000
Telephone and internet expense
125,000
Legal and professional expenses
48,000
Insurance expense
50,000
1,297,000
Income from opera ons
103,000
Other revenue and expenses
Dividend income
3,000
Interest income
2,000
Gain from sale of building
5,000
Interest expense
(3,000)
7,000
Income from con nuing opera ons before income tax
110,000
Income tax expense
33,000
Net income
$
77,000

11.5. Appendix B: Statement of Cash Flows – Direct Method
445
Direct Method Steps:
Step 1. Record headings, categories, and three addi onal columns into an Opera ng Ac vi es
worksheet as shown below:
Watson Ltd.
Opera ng Ac vi es
Changes to
Net
Working Capital Cash Flow
Cash flows from opera ng ac vi es
I/S Accounts
Accounts
In (Out)
Cash received from sales
Cash paid for goods and services
Cash paid to employees
Cash received for interest income
Cash paid for interest
Cash paid for income taxes
Cash received for dividends
Net cash flows from opera ng ac vi es
Step 2. Record each income statement amount into the corresponding direct method category
of the Opera ng Ac vi es worksheet shown below (recall that non-cash items such as deprecia-
on and gains or losses are excluded from a statement of cash flows so they are will be recorded
as memo items only):
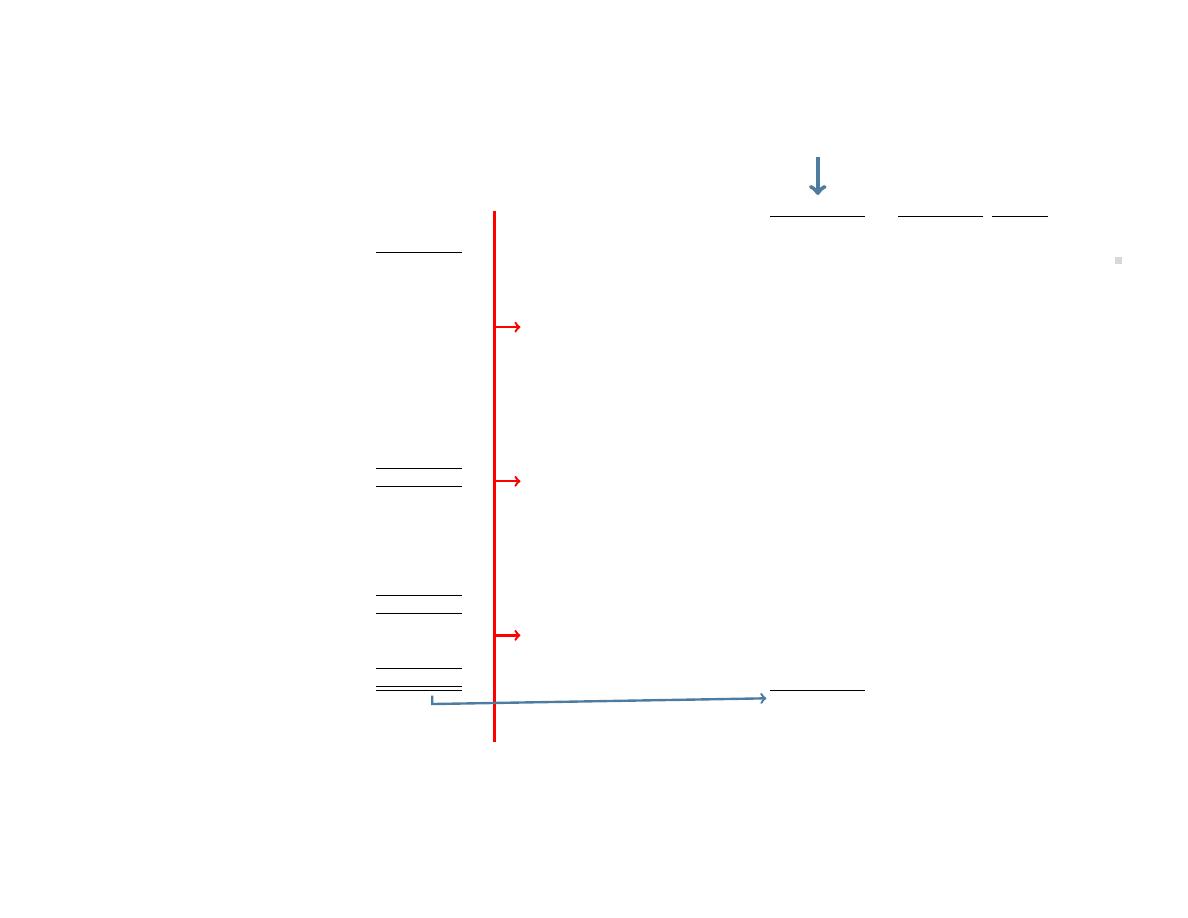
446
The
St
at
emen
t
of
Cash
Flo
w
s
Watson Ltd.
Watson Ltd.
Income Statement
Opera ng Ac vi es
For the year ended December 31, 2015
Changes to
Net
Working
Cash
Capital
Flow
Cash flows from opera ng ac vi es
I/S Accounts
Accounts
In (Out)
Sales
$3,500,000
1
Cash received from sales
$ 3,500,000
1
Cost of goods sold
2,100,000
2
Cash paid for goods and services
(2,100,000)
2
Gross profit
1,400,000
(134,000)
5
(35,000)
6
Opera ng expenses
(50,000)
7
Salaries and benefits expense
800,000
3
(12,000)
8
Deprecia on expense
43,000
4
(125,000)
9
Travel and entertainment expense
134,000
5
(48,000)
10
Adver sing expense
35,000
6
(50,000)
11
Freight-out expenses
50,000
7
Cash paid to employees
(800,000)
3
Supplies and postage expense
12,000
8
Cash received for interest income
2,000
13
Telephone and internet expense
125,000
9
Cash paid for interest
(3,000)
15
Legal and professional expenses
48,000
10
Cash paid for income taxes
(33,000)
16
Insurance expense
50,000
11
Cash received for dividends
3,000
12
1,297,000
Income from opera ons
103,000
Other revenue and expenses
Dividend income
3,000
12
Interest income from investments
2,000
13
Gain from sale of building
5,000
14
Interest expense
(3,000)
15
7,000
Income from con nuing opera ons
before income taxes
110,000
Memo items:
Income tax expense
33,000
16
Deprecia on expense
(43,000)
4
Net income
77,000
Gain on sale of building
5,000
14
$
77,000
Net cash flows from opera ng ac vi es
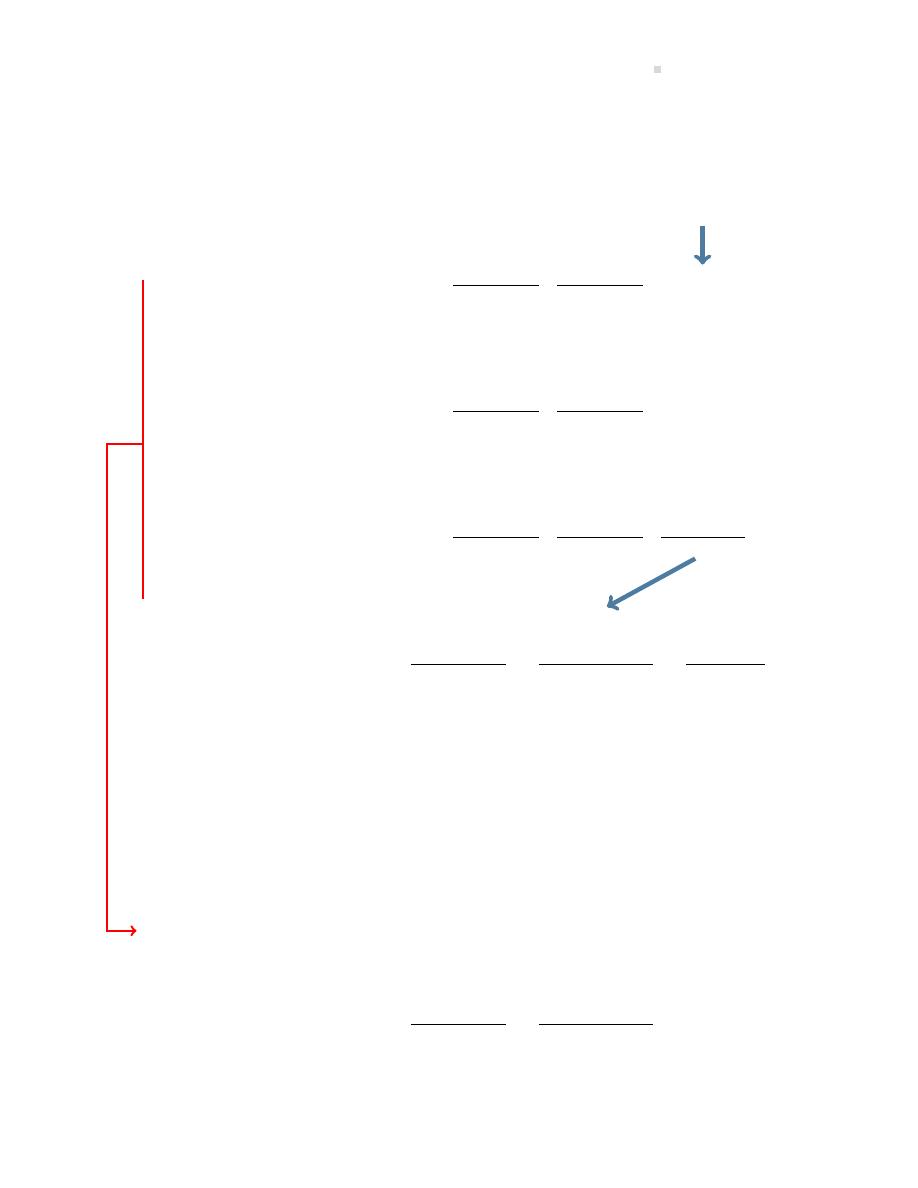
11.5. Appendix B: Statement of Cash Flows – Direct Method
447
Step 3. Calculate the net change amount for each current asset (except cash), and each current
liability from the balance sheet below. Record each change amount in the second column of the
Opera ng Ac vi es worksheet:
Watson Ltd.
Balance Sheet
as at December 31, 2015
2015
2014
Change
Current assets
Cash
$ 307,500
$ 250,000
Investments – trading
12,000
10,000
$
(2,000)
17
Accounts receivable (net)
249,510
165,000
(84,510)
18
Notes receivable
18,450
22,000
3,550
19
Inventory
708,970
650,000
(58,970)
20
Prepaid insurance expenses
18,450
15,000
(3,450)
21
Total current assets
1,314,880
1,112,000
Current liabili es
Accounts payable
$ 221,000
$
78,000
$ 143,000
22
Accrued interest payable
24,600
33,000
(8,400)
23
Income taxes payable
54,120
60,000
(5,880)
24
Unearned revenue
25,000
225,000
(200,000)
25
Current por on of long-term notes payable
60,000
45,000
N/A
Total current liabili es
384,720
441,000
(216,660)
Watson Ltd.
Opera ng Ac vi es
Changes to
Net
Working Capital
Cash Flow
Cash flows from opera ng ac vi es
I/S Accounts
Accounts
In (Out)
Cash received from sales
$ 3,500,000
1
$
(84,510)
18
3,550
19
(200,000)
25
Cash paid for goods and services
(2,100,000)
2
(58,970)
20
(134,000)
5
(3,450)
21
(35,000)
6
143,000
22
(50,000)
7
(12,000)
8
(125,000)
9
(48,000)
10
(50,000)
11
Cash paid to employees
(800,000)
3
Cash received for interest income
2,000
13
(2,000)
17
Cash paid for interest
(3,000)
15
(8,400)
23
Cash paid for income taxes
(33,000)
16
(5,880)
24
Cash received for dividends
3,000
12
Memo items:
Deprecia on expense
(43,000)
4
Gain on sale of building
5,000
14
Net cash flows from opera ng ac vi es
$
77,000
$ (216,660)
Record each change
to the correspond-
ing category
Calculate
change
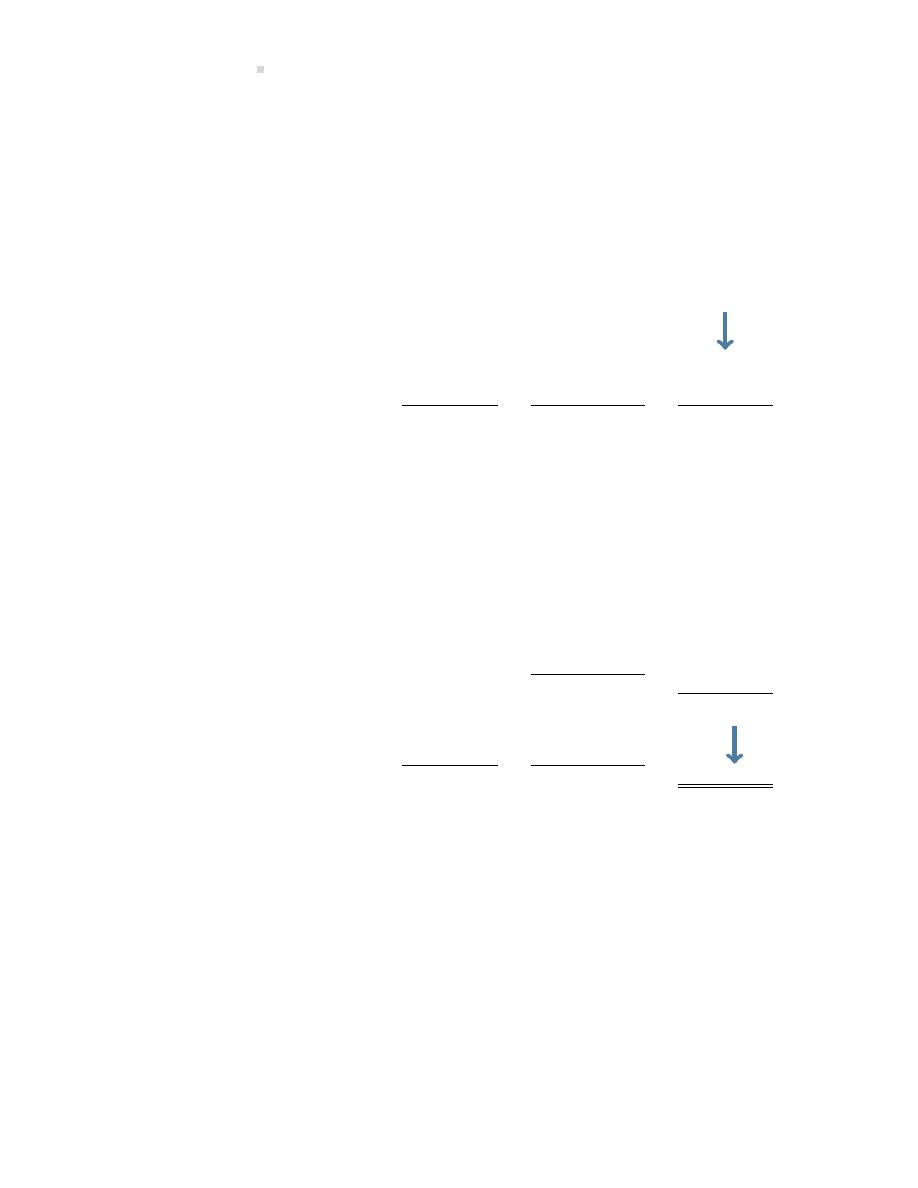
448
The Statement of Cash Flows
Note how items 13 and 17 on the opera ng ac vi es statement cancel each other out. This is be-
cause the interest income was accrued and not actually received in cash. Also note that the current
por on of long-term notes was excluded from the opera ng ac vi es sec on. Recall from the ear-
lier chapter material on the indirect method that this account is combined with its corresponding
long-term note payable account in the financing sec on of the statement of cash flows.
Step 4. Calculate the net cash flow total for each category and the net cashflow total for the
opera ng ac vi es sec on. Transfer the amounts to the statement of cash flows, opera ng
ac vi es sec on:
Watson Ltd.
Opera ng Ac vi es
Changes to
Net
Working Capital
Cash Flow
Cash flows from opera ng ac vi es
I/S Accounts
Accounts
In (Out)
Cash received from sales
$ 3,500,000
1
$ (84,510)
18
3,550
19
(200,000)
25
$ 3,219,040
Cash paid for goods and services
(2,100,000)
2
(58,970)
20
(134,000)
5
(3,450)
21
(35,000)
6
143,000
22
(50,000)
7
(12,000)
8
(125,000)
9
(48,000)
10
(50,000)
11
(2,473,420)
Cash paid to employees
(800,000)
3
(800,000)
Cash received for interest income
2,000
13
(2,000)
17
0
Cash paid for interest
(3,000)
15
(8,400)
23
(11,400)
Cash paid for income taxes
(33,000)
16
(5,880)
24
(38,880)
Cash received for dividends
3,000
12
3,000
Memo items:
Deprecia on expense
(43,000)
4
Gain on sale of building
5,000
14
Net cash flows from opera ng ac vi es
$
77,000
$ (216,660)
$ (101,660)
The completed por on of the statement of cash flows, opera ng sec on is shown below:

Summary of Chapter
Learning Objec ves
449
Watson Ltd.
Statement of Cash Flows – Opera ng Ac vi es
For the Year Ended December 31, 2015
Cash flows from opera ng ac vi es:
Cash received from sales
$ 3,219,040
Cash paid for goods and services
(2,473,420)
Cash paid to or on behalf of employees
(800,000)
Cash paid for interest
(11,400)
Cash paid for income taxes
(38,880)
Cash received for dividends
3,000
Net cash flows from opera ng ac vi es
$(101,660)
Summary of Chapter 11 Learning Objec ves
LO1 – Explain the purpose of the statement of cash flows.
The statement of cash flows is one of the four financial statements. It highlights the net increase
or decrease in the cash and cash equivalents balance during the accoun ng period, and details
the sources and uses of cash that caused that change.
LO2 – Prepare a statement of cash flows.
The opera ng ac vi es sec on of the statement of cash flows can be prepared using the direct or
indirect method. This textbook focuses only on the indirect method. The result of both methods is
iden cal; it is only how the calcula ons are performed that differs. The opera ng ac vi es sec on
begins with accrual net income and, by adjus ng for changes in current assets, current liabili es,
adding back deprecia on expense, and adding back/subtrac ng losses/gains on disposal of non-
current assets, arrives at net income on a cash basis. The inves ng ac vi es sec on analyzes cash
inflows and ou lows from the sale and purchase of non-current assets. The finance ac vi es
sec on details the cash inflows and ou lows resul ng from the issue and payment of loans, issue
and repurchase of shares, and payment of dividends.
LO3 – Interpret a statement of cash flows.
A statement of cash flows contributes to the decision-making process by explaining the sources
and uses of cash. The opera ng ac vi es sec on can signal poten al areas of concern by focus-
ing on differences between accrual net income and cash basis net income. The inves ng ac vi es
sec on can highlight if cash is being used to acquire assets for genera ng revenue, while the fi-
nancing ac vi es sec on can iden fy where the cash to purchase those assets might be coming

450
The Statement of Cash Flows
from. Those who use financial statements can focus on the effec veness of management’s invest-
ing and financing decisions and how these may affect future financial performance.
Discussion Ques ons
1. Using an example, explain in your own words the func on of a statement of cash flows. Why
is it prepared? What does it communicate to the reader of financial statements? What is its
advantage over a balance sheet? over an income statement?
2. Why are financing and inves ng ac vi es of a corpora on important to financial statement
readers?
3. How does an increase in accounts receivable during the year affect the cash flow from op-
era ng ac vi es?
4. What effect does the declara on of a cash dividend have on cash flow? the payment of a
dividend declared and paid during the current year? the payment of a dividend declared in
the preceding year?
5. Why may a change in the Short-term investments account not affect the amount of cash
provided by opera ons?
6. Why is it possible that cash may have decreased during the year, even though there has
been a substan al net income during the same period?
7. Describe common transac ons affec ng balance sheet accounts that use cash. Explain how
these items are analysed to iden fy cash flows that have occurred during the year.
Exercises
EXERCISE 11–1
(LO1,2)
The following transac ons were carried out by Crozier Manufacturing Limited.
Required: Indicate into which category each transac on or adjustment is placed in the state-
ment of cash flows: opera ng (O), financing (F), or inves ng (I) ac vi es. For non-cash invest-
ing/financing ac vi es that are disclosed in a note to the financial statements, indicate (NC).
A payment of $5,000 was made on a bank loan.
Deprecia on expense for equipment was $1,000.
$10,000 of share capital was issued for cash.

Exercises
451
Cash dividends of $2,500 were declared and paid to shareholders.
Bonds were issued in exchange for equipment cos ng $7,000.
Land was purchased for $25,000 cash.
$750 of accrued salaries was paid.
$10,000 of accounts receivable was collected.
A building was purchased for $80,000: $30,000 was paid in cash
and the rest was borrowed.
A long-term investment in shares of another company was sold
for $50,000 cash.
Equipment was sold for $6,000. The related accumula on
deprecia on was $3,000 with an original cost of $10,000.
$1,200 was paid for a 12-month insurance policy in effect next
year.
A patent was amor zed for $500.
Bonds were issued for $50,000 cash.
EXERCISE 11–2
(LO2)
Assume the following selected income statement and balance sheet informa on for Larriet Inc.:
Larriet Inc.
Larriet Inc.
Income Statement
Balance Sheet Informa on
Year Ended December 31, Year 5
(000’s)
(000’s)
December 31,
Year 5
Year 4
Sales revenue
$385
Cash
$40
$22
Cost of goods sold
$224
Accounts receivable
34
39
Other opera ng expenses
135
Merchandise inventory
150
146
Deprecia on expense
25
Prepaid expenses
3
2
Loss on sale of machinery
3
(387)
Machinery
125
138
Net loss
$2
Accumulated deprecia on
55
42
Accounts payable
29
31
Dividends payable
1
5
Bonds payable
15
38
Common shares
208
150
Retained earnings
44
81
Addi onal informa on:
i. Machinery cos ng $20 thousand was sold for cash.

452
The Statement of Cash Flows
ii. Machinery was purchased for cash.
iii. The change in retained earnings was caused by the net loss and the declara on of dividends.
Required:
a. Reconstruct the journal entry regarding the sale of the machinery.
b. Reconstruct the entry regarding the purchase of machinery.
c. Reconstruct the entry regarding the declara on of dividends.
d. Reconstruct the entry regarding the payment of dividends.
e. Prepare the statement of cash flows for the year ended December 31, Year 5.
EXERCISE 11–3
(LO2,3)
The compara ve statement of financial posi ons of Glacier Corpora on showed the following at
December 31.
2019
2018
Debits
Cash
$ 10
$
8
Accounts receivable
18
10
Merchandise inventory
24
20
Land
10
24
Plant and equipment
94
60
$156
$122
Credits
Accumulated deprecia on
$ 14
$ 10
Accounts payable
16
12
Non-current borrowings
40
32
Common shares
60
50
Retained earnings
26
18
$156
$122
The statement of profit and loss for 2019 was as follows:

Exercises
453
Glacier Corpora on
Statement of Profit and Loss
For the Year Ended December 31, 2019
Sales
$ 300
Cost of sales
200
Gross profit
100
Opera ng expenses
Rent
$77
Deprecia on
6
83
Income from opera ons
17
Other gains (losses)
Gain on sale of equipment
1
Loss on sale of land
(4)
(3)
Net income
$ 14
Addi onal informa on:
i. Cash dividends paid during the year amounted to $6.
ii. Land was sold during the year for $10. It was originally purchased for $14.
iii. Equipment was sold during the year that originally cost $7. Carrying amount was $5.
iv. Equipment was purchased for $41.
Required:
a. Prepare a statement of cash flows for the year ended December 31, 2019.
b. Comment on the opera ng, financing, and inves ng ac vi es of Glacier Corpora on for the
year ended December 31, 2019.
EXERCISE 11–4
(LO2,3)
The following trial balance has been prepared from the ledger of Lelie Ltd. at December 31, 2019,
following its first year of opera ons.

454
The Statement of Cash Flows
(in $000’s)
Debits
Credits
Cash
$
40
Accounts receivable
100
Merchandise inventory
60
Prepaid rent
10
Equipment
160
Accumulated deprecia on – equipment
$
44
Patent
-0-
Accounts payable
50
Dividends payable
10
Income taxes payable
8
Note payable – due 2023
80
Common shares
140
Retained earnings
-0-
Cash dividends
20
Sales
225
Deprecia on
44
Cost of goods sold
100
Selling and administra ve expenses
28
Income taxes expense
10
Gain on sale of land
15
$ 572
$ 572
Addi onal informa on:
i. A patent cos ng $30,000 was purchased, and then sold during the year for $45,000.
ii. Lelie assumed $100,000 of long-term debt during the year.
iii. Some of the principal of the long-term debt was repaid during the year.
iv. Lelie issued $40,000 of common shares for equipment. Other equipment was purchased for
$120,000 cash. No equipment was sold during the year.
Required:
a. Prepare a statement of cash flows for the year ended December 31, 2019.
b. Explain what the statement of cash flows tells you about Lelei Ltd. at the end of December
31, 2019.

Exercises
455
EXERCISE 11–5
(LO2,3)
The accounts balances of ZZ Corp. at December 31 appear below:
2019
2018
Debits
Cash
$ 40,000
$ 30,000
Accounts receivable
40,000
30,000
Merchandise inventory
122,000
126,000
Prepaid expenses
6,000
4,000
Land
8,000
30,000
Buildings
220,000
160,000
Equipment
123,000
80,000
$559,000
$460,000
Credits
Accounts payable
$ 48,000
$ 50,000
Accumulated deprecia on
86,000
70,000
Note payable, due 2023
70,000
55,000
Common shares
300,000
250,000
Retained earnings
55,000
35,000
$559,000
$460,000
The following addi onal informa on is available:
i. Net income for the year was $40,000; income taxes expense was $4,000 and deprecia on
recorded on building and equipment was $27,000.
ii. Equipment cos ng $30,000 was purchased; one-half was paid in cash and a 4-year promissory
note signed for the balance.
iii. Equipment cos ng $50,000 was purchased in exchange for 6,000 common shares.
iv. Equipment was sold for $15,000 that originally cost $37,000. The gain/loss was reported in
net income.
v. An addi on to the building was built during the year.
vi. Land cos ng $22,000 was sold for $26,000 cash during the year. The related gain was reported
in the income statement.
vii. Cash dividends were paid.
Required:

456
The Statement of Cash Flows
a. Prepare a statement of cash flows for the year ended December 31, 2019.
b. What observa ons about ZZ Corp. can be made from this statement?
EXERCISE 11–6
(LO2,3)
Below is a compara ve statement of financial posi on for Egglestone Vibe Inc. as at December 31,
2016:
Egglestone Vibe Inc.
Statement of Financial Posi on
December 31
2016
2015
Assets:
Cash
$ 166,400
$ 146,900
Accounts receivable
113,100
76,700
Inventory
302,900
235,300
Land
84,500
133,900
Plant assets
507,000
560,000
Accumulated deprecia on – plant assets
(152,100)
(111,800)
Goodwill
161,200
224,900
Total assets
$1,183,000
$1,265,900
Liabili es and Equity:
Accounts payable
38,100
66,300
Dividend payable
19,500
41,600
Notes payable
416,000
565,500
Common shares
322,500
162,500
Retained earnings
386,900
430,000
Total liabili es and equity
$1,183,000
$1,265,900
Addi onal informa on:
i. Net income for the 2016 fiscal year was $24,700. Deprecia on expense was $55,900.
ii. During 2016, land was purchased for cash of $62,400 for expansion purposes. Six months
later, another sec on of land with a carrying value of $111,800 was sold for $150,000 cash.
iii. On June 15, 2016, notes payable of $160,000 was re red in exchange for the issuance of com-
mon shares. On December 31, 2016, notes payable for $10,500 were issued for addi onal
cash flow.

Exercises
457
iv. At year-end, plant assets originally cos ng $53,000 were sold for $27,300, since they were no
longer contribu ng to profits. At the date of the sale, the accumulated deprecia on for the
asset sold was $15,600.
v. Cash dividends were declared and a por on of those were paid in 2016.
vi. Goodwill impairment loss was recorded in 2016 to reflect a decrease in the recoverable amount
of goodwill. (Hint: Review impairment of long-lived assets in Chapter
of the text.)
Required:
a. Prepare a statement of cash flows for the year ended December 31, 2016.
b. Analyse and comment on the results reported in the statement.
EXERCISE 11–7
(LO2)
Below is a compara ve statement of financial posi on for Nueton Ltd. as at June 30, 2016:
Nueton Ltd.
Balance Sheet
June 30
2016
2015
Cash
$ 55,800
$ 35,000
Accounts receivable (net)
80,000
62,000
Inventory
66,800
96,800
Prepaid expenses
5,400
5,200
Equipment
130,000
120,000
Accumulated deprecia on
28,000
10,000
Accounts payable
6,000
32,000
Wages payable
7,000
16,000
Income taxes payable
2,400
3,600
Notes payable (long-term)
40,000
70,000
Common shares
230,000
180,000
Retained earnings
24,600
7,400

458
The Statement of Cash Flows
Nueton Ltd.
Income Statement
For Year Ended June 30, 2016
Sales
$500,000
Cost of goods sold
300,000
Gross profit
200,000
Opera ng expenses:
Deprecia on expense
58,600
Other expenses
80,000
Total opera ng expenses
138,600
Income from opera ons
61,400
Gain on sale of equipment
2,000
Income before taxes
63,400
Income taxes
19,020
Net income
$ 44,380
Addi onal Informa on:
i. A note is re red at its carrying value.
ii. New equipment is acquired during 2016 for $58,600.
iii. The gain on sale of equipment cos ng $48,600 during 2016 is $2,000.
Required: Use the Neuton Ltd. informa on given above to prepare a statement of cash flows for
the year ended June 30, 2016.
EXERCISE 11–8
(LO2)
The trial balance for Yuco n Corp. is shown below. All accounts have normal balances.

Exercises
459
Yuco n Corp.
Trial Balance
December 31
2016
2015
Cash
$ 248,000
$ 268,000
Accounts receivable
62,000
54,000
Inventory
406,000
261,000
Equipment
222,000
198,000
Accumulated deprecia on, equipment
(104,000)
(68,000)
Accounts payable
46,000
64,000
Income taxes payable
18,000
16,000
Common shares
520,000
480,000
Retained earnings
116,000
58,000
Sales
1,328,000
1,200,000
Cost of goods sold
796,000
720,000
Deprecia on expense
36,000
30,000
Opera ng expenses
334,000
330,000
Income taxes expense
28,000
25,000
Addi onal informa on:
i. Equipment is purchased for $24,000 cash.
ii. 16,000 common shares are issued for cash at $2.50 per share.
iii. Declared and paid $74,000 of cash dividends during the year.
Required: Prepare a statement of cash flows for 2016.
EXERCISE 11–9
(LO2)
Below is an unclassified balance sheet and income statement for Tubric Corp. for the year ended
December 31, 2016:

460
The Statement of Cash Flows
Tubric Corp.
Balance Sheet
December 31
2016
2015
Cash
$ 40,000
$ 20,800
Pe y cash
14,400
8,000
Accounts receivable
73,600
31,200
Inventory
95,200
69,600
Long-term investment
0
14,400
Land
64,000
64,000
Building and equipment
370,400
380,000
Accumulated deprecia on
98,400
80,800
Total assets
$559,200
$507,200
Accounts payable
16,600
31,500
Dividends payable
1,000
500
Bonds payable
20,000
0
Preferred shares
68,000
68,000
Common shares
338,400
338,400
Retained earnings
115,200
68,800
Total liabili es and equity
$559,200
$507,200
Tubric Corp.
Income Statement
For the year ended December 31, 2016
Sales
$720,000
Cost of goods sold
480,000
Gross profit
240,000
Opera ng expenses
$110,600
Deprecia on expense
34,400
Loss on sale of equipment
3,200
Income tax expense
15,000
Gain on sale of long-term investment
(9,600)
153,600
Net income
$ 86,400
During 2016, the following transac ons occurred:
i. Purchased equipment for $16,000 cash.
ii. Sold the long-term investment on January 2, 2016, for $24,000.
iii. Sold equipment originally cos ng $25,600 for $5,600 cash. Equipment had $16,800 of accu-
mulated deprecia on at the me of the sale.

Exercises
461
iv. Issued $20,000 of bonds payable at par.
Required:
a. Calculate the cash paid dividends for 2016.
b. Prepare a statement of cash flows for Tubric Corp. for the year ended December 31, 2016.
EXERCISE 11–10
()
This exercise uses the direct method for crea ng Statements of Cash Flows as explained in Sec-
on
.
Below are the unclassified financial statements for Rorrow Ltd. for the year ended December 31,
2015:
Rorrow Ltd.
Balance Sheet
As at December 31, 2015
2015
2014
Cash
$ 152,975
$
86,000
Accounts receivable (net)
321,640
239,080
Inventory
801,410
855,700
Prepaid insurance expenses
37,840
30,100
Equipment
2,564,950
2,156,450
Accumulated deprecia on, equipment
(625,220)
(524,600)
Total assets
$3,253,595
$2,842,730
Accounts payable
$ 478,900
$ 494,500
Salaries and wages payable
312,300
309,600
Accrued interest payable
106,210
97,180
Bonds payable, due July 31, 2023
322,500
430,000
Common shares
1,509,300
1,204,000
Retained earnings
524,385
307,450
Total liabili es and shareholders’ equity
$3,253,595
$2,842,730

462
The Statement of Cash Flows
Rorrow Ltd.
Income Statement
For the Year Ended December 31, 2015
Sales
$5,258,246
Expenses
Cost of goods sold
3,150,180
Salaries and benefits expense
754,186
Deprecia on expense
100,620
Interest expense
258,129
Insurance expense
95,976
Income tax expense
253,098
4,612,189
Net income
$ 646,057
Required:
a. Complete the direct method worksheet for the opera ng ac vi es sec on for the year
ended December 31, 2015.
b. Prepare the opera ng ac vi es sec on for Rorrow Ltd. for the year ended December 31,
2015.
EXERCISE 11–11
()
This exercise is similar to Exercise
except that it uses the direct method for crea ng State-
ments of Cash Flows as explained in Sec on
.
The following trial balance has been prepared from the ledger of Lelie Ltd. at December 31, 2019,
following its first year of opera ons.

Exercises
463
(in $000’s)
Debits
Credits
Cash
$
40
Accounts receivable
100
Merchandise inventory
60
Prepaid rent
10
Equipment
160
Accumulated deprecia on – equipment
$
44
Patent
-0-
Accounts payable
50
Dividends payable
10
Income taxes payable
8
Note payable – due 2023
80
Common shares
140
Retained earnings
-0-
Cash dividends
20
Sales
225
Deprecia on
44
Cost of goods sold
100
Selling and administra ve expenses
28
Income taxes expense
10
Gain on sale of land
15
$ 572
$ 572
Addi onal informa on:
i. A patent cos ng $30,000 was purchased, and then sold during the year for $45,000.
ii. Lelie assumed $100,000 of long-term debt during the year.
iii. Some of the principal of the long-term debt was repaid during the year.
iv. Lelie issued $40,000 of common shares for equipment. Other equipment was purchased for
$120,000 cash. No equipment was sold during the year.
Required:
a. Prepare a statement of cash flows for the year ended December 31, 2019 using the direct
method.
b. Explain what the statement of cash flows tells you about Lelei Ltd. at the end of December
31, 2019.

464
The Statement of Cash Flows
EXERCISE 11–12
()
This exercise is similar to Exercise
except that it uses the direct method for crea ng State-
ments of Cash Flows as explained in Sec on
.
Below is a compara ve statement of financial posi on for Nueton Ltd. as at June 30, 2016:
Nueton Ltd.
Balance Sheet
June 30
2016
2015
Cash
$ 55,800
$ 35,000
Accounts receivable (net)
80,000
62,000
Inventory
66,800
96,800
Prepaid expenses
5,400
5,200
Equipment
130,000
120,000
Accumulated deprecia on
28,000
10,000
Accounts payable
6,000
32,000
Wages payable
7,000
16,000
Income taxes payable
2,400
3,600
Notes payable (long-term)
40,000
70,000
Common shares
230,000
180,000
Retained earnings
24,600
7,400
Nueton Ltd.
Income Statement
For Year Ended June 30, 2016
Sales
$500,000
Cost of goods sold
300,000
Gross profit
200,000
Opera ng expenses:
Deprecia on expense
58,600
Other expenses
80,000
Total opera ng expenses
138,600
Income from opera ons
61,400
Gain on sale of equipment
2,000
Income before taxes
63,400
Income taxes
19,020
Net income
$ 44,380
Addi onal Informa on:

Problems
465
i. A note is re red at its carrying value.
ii. New equipment is acquired during 2016 for $58,600.
iii. The gain on sale of equipment cos ng $48,600 during 2016 is $2,000.
iv. Assume that Other expenses includes salaries expense of $30,000, interest expense of $5,000
and the remaining for various purchases of goods and services.
Required: Use the Neuton Ltd. informa on given above to prepare a statement of cash flows for
the year ended June 30, 2016 using the direct method.
Problems
PROBLEM 11–1
(LO2)
Assume the following income statement informa on:
Sales (all cash)
$35
Opera ng Expenses
Deprecia on
10
Income before Other Item
25
Other Item
Gain on Sale of Equipment
8
Net Income
$33
Required:
1. Assume the equipment that was sold for a gain of $8 originally cost $20, had a book value
of $4 at the date of disposal, and was sold for $12. Prepare the journal entry to record the
disposal. What is the cash effect of this entry?
2. Calculate cash flow from opera ng ac vi es.
PROBLEM 11–2
(LO2)
Assume the following selected income statement and balance sheet informa on for the year
ended December 31, 2019:

466
The Statement of Cash Flows
Sales
$200
Cost of Goods Sold
120
Gross Profit
80
Opera ng Expenses
Rent
30
Net Income
$50
2019
2018
Dr. (Cr.)
Dr. (Cr.)
Cash
$100
$86
Accounts Receivable
60
40
Inventory
36
30
Prepaid Rent
10
-0-
Retained Earnings
(206)
(156)
Required:
1. Reconcile the change in retained earnings from December 31, 2018 to December 31, 2019.
2. Calculate cash flow from opera ng ac vi es.
PROBLEM 11–3
(LO2)
Assume the following income statement and balance sheet informa on:
Revenue
$-0-
Deprecia on Expense
(100)
Net Loss
$(100)
2019
2018
Dr. (Cr.)
Dr. (Cr.)
Cash
$350
$650
Machinery
500
200
Accumulated Deprecia on – Machinery
(250)
(150)
Retained Earnings
(600)
(700)
No machinery was disposed during the year. All machinery purchases were paid in cash.
Required:

Problems
467
1. Prepare a journal entry to record the deprecia on expense for the year. Determine the cash
effect.
2. Prepare a journal entry to account for the change in the Machinery balance sheet account.
What is the cash effect of this entry?
3. Prepare a statement of cash flows for the year ended December 31, 2019.
PROBLEM 11–4
(LO2)
Assume the following income statement and balance sheet informa on:
Service Revenue (all cash)
$175
Opera ng Expenses
Salaries (all cash)
85
Net Income
$90
2019
2018
Dr. (Cr.)
Dr. (Cr.)
Cash
$1,350
$1,800
Borrowings
(800)
(1,300)
Retained Earnings
(550)
(500)
Other informa on: All dividends were paid in cash.
Required:
1. Calculate cash flow from opera ng ac vi es.
2. Calculate the amount of dividends paid during the year.
3. Calculate cash flow used by financing ac vi es.
PROBLEM 11–5
(LO2)
The following transac ons occurred in the Hubris Corpora on during the year ended December
31, 2019.

468
The Statement of Cash Flows
(a)
Net income for the year (accrual basis)
$800
(b) Deprecia on expense
120
(c)
Increase in wages payable
20
(d) Increase in accounts receivable
40
(e)
Decrease in merchandise inventory
50
(f)
Amor za on of patents
5
(g)
Payment of non-current borrowings
250
(h) Issuance of common shares for cash
500
(i)
Payment of cash dividends
30
Other informa on: Cash at December 31, 2019 was $1,200.
Required: Prepare a statement of cash flows.
PROBLEM 11–6
(LO2,3)
During the year ended December 31, 2019, the Wheaton Co. Ltd. reported $95,000 of revenues,
$70,000 of opera ng expenses, and $5,000 of income taxes expense. Following is a list of trans-
ac ons that occurred during the year:
(a) Deprecia on expense, $3,000 (included with opera ng expenses)
(b) Increase in wages payable, $500
(c) Increase in accounts receivable, $900
(d) Decrease in merchandise inventory, $1,200
(e) Amor sa on of patent, $100
(f) Non-current borrowings paid in cash, $5,000
(g) Issuance of common shares for cash, $12,500
(h) Equipment, cost $10,000, acquired by issuing common shares
(i) At the end of the fiscal year, a $5,000 cash dividend was declared but not paid.
(j) Old machinery sold for $6,000 cash; it originally cost $15,000 (one-half depreciated). Loss
reported on income statement as ordinary item and included in the $70,000 of opera ng ex-
penses.
(k) Decrease in accounts payable, $1,000.
(l) Cash at January 1, 2019 was $1,000; increase in cash during the year, $37,900
(m) There was no change in income taxes owing.

Problems
469
Required:
1. Prepare a statement of cash flows.
2. Explain what this statement tells you about Wheaton Co. Ltd.


Chapter 12
Financial Statement Analysis
Financial statements can be used by shareholders, creditors, and other interested par es to an-
alyze a corpora on’s liquidity, profitability, and financial structure compared to prior years and
other similar companies. As part of this analysis, financial evalua on tools are used. Some of
these tools are discussed in this chapter.
Chapter 12 Learning Objec ves
LO1 – Describe ra o analysis, and explain how the liquidity, profitability, leverage, and mar-
ket ra os are used to analyze and compare financial statements.
LO2 – Describe horizontal and ver cal trend analysis, and explain how they are used to an-
alyze financial statements.
Concept Self-Check
Use the following as a self-check while working through Chapter
1. What is working capital?
2. What is meant by liquidity?
3. What are some ra os commonly used to evaluate liquidity?
4. What is a company’s revenue opera ng cycle and how is it measured?
5. What profitability ra os can be used to evaluate a corpora on?
6. How is the amount of shareholder claims against a corpora on’s assets compared to the
amount of creditor claims?
7. What are the rela ve advantages of short-term and long-term debt?
8. What are some measures used to evaluate the future financial prospects of a company for
investors?
9. What is a horizontal analysis? How does it differ from a ver cal analysis?
10. What is a common-size analysis?
471

472
Financial Statement Analysis
NOTE: The purpose of these ques ons is to prepare you for the concepts introduced in the chap-
ter. Your goal should be to answer each of these ques ons as you read through the chapter. If,
when you complete the chapter, you are unable to answer one or more the Concept Self-Check
ques ons, go back through the content to find the answer(s). Solu ons are not provided to these
ques ons.
12.1 Introduc on to Ra o Analysis
LO1 – Describe
ra o
analysis,
and explain how
the
liquidity,
profitability,
leverage,
and
market
ra os
are
used
to
analyze and com-
pare
financial
statements.
A common way to evaluate financial statements is through ra o analysis.
A ra o is a rela onship between two numbers of the same kind. For exam-
ple, if there are two apples and three oranges, the ra o of the number of
apples to the number of oranges is 2:3 (read as “two to three”). A financial
ra o is a measure of the rela ve magnitude of two selected numerical val-
ues taken from a company’s financial statements. For instance, the gross
profit percentage studied in Chapter 6, also known as the gross profit ra-
o, expresses the numerical rela onship between gross profit and sales.
If a company has a gross profit ra o of 0.25:1, this means that for every $1
of sales, the company earns, on average, $0.25 to cover expenses other
than cost of goods sold. Another way of sta ng this is to say that the gross
profit ra o is 25%.
Financial ra os are effec ve tools for measuring the financial performance of a company because
they provide a common basis for evalua on — for instance, the amount of gross profit generated
by each dollar of sales for different companies. Numbers that appear on financial statements
need to be evaluated in context. It is their rela onship to other numbers and the rela ve changes
of these numbers that provide some insight into the financial health of a business. One of the
main purposes of ra o analysis is to highlight areas that require further analysis and inves ga on.
Ra o analysis alone will not provide a defini ve financial evalua on. It is used as one analy c tool,
which, when combined with informed judgment, offers insight into the financial performance of
a business.
For example, one business may have a completely different product mix than another company
even though both operate in the same broad industry. To determine how well one company is
doing rela ve to others, or to iden fy whether key indicators are changing, ra os are o en com-
pared to industry averages. To determine trends in one company’s performance, ra os are o en
compared to past years’ ra os of the same company.
To perform a comprehensive analysis, qualita ve informa on about the company as well as ra os
should be considered. For example, although a business may have sold hundreds of refrigerators
last year and all of the key financial indicators suggest growth, qualita ve informa on from trade
publica ons and consumer reports may indicate that the trend will be towards refrigerators us-
1
Any ra o in the form X:1 can be expressed as a percentage by mul plying both the numerator and denominator
by 100. For example, a 0.25:1 ra o would equal 25% [(0.25
× 100)/(1 × 100) = 25/100 = 25%]

12.1. Introduc on to Ra o Analysis
473
ing significantly different technologies in the next few years. If the company does not have the
capacity or necessary equipment to produce these new appliances, the present posi ve financial
indicators may not accurately reflect the likely future financial performance of the company.
An examina on of qualita ve factors provides valuable insights and contributes to the compre-
hensive analysis of a company. An important source of qualita ve informa on is also found in the
notes to the financial statements, which are an integral part of the company’s financial statements.
In this chapter, financial ra os will be used to provide insights into the financial performance of
Big Dog Carworks Corp. (BDCC). The ra os will focus on financial informa on contained within the
income statement, statement of changes in equity, and balance sheet of BDCC for the three years
2019, 2020, and 2021. This informa on is shown below. Note that figures in these statements are
reported in thousands of dollars (000s). For consistency, all final calcula ons in this chapter are
rounded to two decimal places.
Big Dog Carworks Corp.
Balance Sheet
At December 31
($000s)
Assets
2021
2020
2019
Current
Cash
$
20
$
30
$
50
Short-term Investments
36
31
37
Accounts Receivable
544
420
257
Inventories
833
503
361
1,433
984
705
Property, Plant, and Equipment, net
1,053
1,128
712
Total Assets
$
2,486
$
2,112
$
1,417
Liabili es
Current
Borrowings
$
825
$
570
$
100
Accounts Payable
382
295
$
219
Income Taxes Payable
48
52
$
50
1,255
917
369
Equity
Share Capital
1,063
1,063
963
Retained Earnings
168
132
85
1,231
1,195
1,048
Total Liabili es and Equity
$
2,486
$
2,112
$
1,417

474
Financial Statement Analysis
Big Dog Carworks Corp.
Income Statement
For the Year Ended December 31
($000s)
2021
2020
2019
Sales (net)
$
3,200
$
2,800
$
2,340
Cost of Goods Sold
2,500
2,150
1,800
Gross Profit
700
650
540
Opera ng Expenses
Selling, General, and Administra on
212
183
154
Employee Benefits
113
109
119
Deprecia on
75
84
63
400
376
336
Income from Opera ons
300
274
204
Financing Costs
Interest
89
61
-0-
Income Before Income Taxes
211
213
204
Income Taxes
95
96
92
Net Income
$
116
$
117
$
112
Big Dog Carworks Corp.
Statement of Changes in Equity
For the Year Ended December 31
($000s)
2021
2020
2019
Share
Retained
Total
Total
Total
Capital
Earnings
Equity
Equity
Equity
Opening Balance
$1,063
$132
$1,195
$1,048
$
43
Common Shares Issued
100
953
Net Income
116
116
117
112
Dividends Declared
(80)
(80)
(70)
(60)
Ending Balance
$1,063
$168
$1,231
$1,195
$1,048
Assume that 100,000 common shares are outstanding at the end of 2019, 2020, and 2021. Shares
were issued in 2020, but at the end of year the number of outstanding shares was s ll 100,000.
There are four major types of financial ra os: a) liquidity ra os that measure the ability of a cor-
pora on to sa sfy demands for cash as they arise in the near-term (such as payment of current
liabili es); b) profitability ra os that measure various levels of return on sales, total assets em-
ployed, and shareholder investment; c) leverage ra os that measure the financial structure of a
corpora on, its amount of rela ve debt, and its ability to cover interest expense; and d) market
ra os that measure financial returns to shareholders, and percep ons of the stock market about
the corpora on’s value.
Ini al insights into the financial performance of BDCC can be derived from an analysis of rela ve
amounts of current and non-current debt. This analysis is addressed in the following sec ons.

12.2. Liquidity Ra os: Analyzing Short-term Cash Needs
475
12.2 Liquidity Ra os: Analyzing Short-term Cash Needs
Current (Short-term) versus Non-current (Long-term) Debt
Short-term and long-term financing strategies both have their advantages. The advantage of some
short-term debt (repayable within one year of the balance sheet date) is that it o en does not
require interest payments to creditors. For example, accounts payable may not require payment
of interest if they are paid within the first 30 days they are outstanding. Short-term debt also
has its disadvantages; payment is required within at least one year, and o en sooner. Interest
rates on short-term debt are o en higher than on long-term debt. An increase in the propor on
of short-term debt is more risky because it must be renewed and therefore renego ated more
frequently.
The advantages of long-term debt are that payment may be made over an extended period of me.
Risk may be somewhat reduced through the use of a formal contractual agreement that is o en
lacking with short-term debt. The disadvantages of long-term debt are that interest payments
must be made at specified mes and the amounts owing may be secured by assets of the company.
Analyzing Financial Structure
As a general rule, long-term financing should be used to finance long-term assets. Note that in
BDCC’s case, property, plant, and equipment assets amount to $1,053,000 at December 31, 2021
yet the firm has no long-term liabili es. This is unusual. An analysis of the company’s balance
sheet reveals the following:
(000s)
2021
2020
2019
Current Liabili es
$1,255
$917
$369
Non-current Liabili es
-0-
-0-
-0-
2021 informa on indicates that BDCC’s management relies solely on short-term creditor financ-
ing, part of which is $382,000 of accounts payable that may bear no interest and $825,000 of
borrowings that also need to be repaid within one year. The risk is that management will likely
need to replace current liabili es with new liabili es. If creditors become unwilling to do this, the
ability of BDCC to pay its short-term creditors may be compromised. As a result, the company
may experience a liquidity crisis — the inability to pay its current liabili es as they come due. The
ra os used to evaluate liquidity of a corpora on are discussed below.
Even though a company may be earning net income each year (as in BDCC’s case), it may s ll
be unable to pay its current liabili es as needed because of a shortage of cash. This can trigger
various problems related to current and non-current liabili es and equity.
Current Liabili es

476
Financial Statement Analysis
• Creditors can refuse to provide any further goods or services on account.
• Creditors can sue for payment.
• Creditors can put the company into receivership or bankruptcy.
Non-current Liabili es
• Long-term creditors can refuse to lend addi onal cash.
• Creditors can demand repayment of their long-term debts, under some circumstances.
Equity
• Shareholders may be unwilling to invest in addi onal share capital of the company.
• Shareholders risk the loss of their investments if the company declares bankruptcy.
There are several ra os that can be used to analyze the liquidity of a company.
Working Capital
Working capital is the difference between a company’s current assets and current liabili es at a
point in me. BDCC’s working capital calcula on is as follows:
(000s)
2021
2020
2019
Current Assets
Cash
$
20
$
30
$
50
Short-term Investments
36
31
37
Accounts Receivable
544
420
257
Inventories
833
503
361
Total Current Assets (a)
1,433
984
705
Current Liabili es
Borrowings
825
570
100
Accounts Payable
382
295
219
Income Taxes Payable
48
52
50
Total Current Liabili es (b)
1,255
917
369
Net Working Capital (a-b)
$
178
$
67
$
336
In the schedule above, working capital amounts to $178,000 at December 31, 2021. Between 2019
and 2021, working capital decreased by $158,000 ($336,000 – 178,000). BDCC is less liquid in 2021
than in 2019, though its liquidity posi on has improved since 2020 when it was only $67,000.

12.2. Liquidity Ra os: Analyzing Short-term Cash Needs
477
In addi on to calcula ng an absolute amount of working capital, ra o analysis can also be used.
The advantage of a ra o is that it is usually easier to interpret.
An explora on is available on the Lyryx site. Log into your Lyryx course to run
.
Current Ra o
Is BDCC able to repay short-term creditors? The current ra o can help answer this ques on. It
expresses working capital as a propor on of current assets to current liabili es and is calculated
as:
Current assets
Current liabili es
The relevant BDCC financial data required to calculate this ra o is taken from the balance sheet,
as follows:
(000s)
2021
2020
2019
Current Assets
(a)
$1,433
$984
$705
Current Liabili es
(b)
1,255
917
369
Current Ra o
(a/b)
1.14:1
1.07:1
1.91:1
This ra o indicates how many current asset dollars are available to pay current liabili es at a point
in me. The expression “1.14:1” is read, “1.14 to 1.” In this case it means that at December 31,
2021, $1.14 of current assets exist to pay each $1 of current liabili es. This ra o is difficult to
interpret in isola on. There are two types of addi onal informa on that could help. First, what is
the trend within BDCC over the last three years? The ra o declined between 2019 and 2020 (from
1.91 to 1.07), then recovered slightly between the end of 2020 and 2021 (from 1.07 to 1.14). The
overall decline may be a cause for concern, as it indicates that in 2021 BDCC had fewer current
assets to sa sfy current liabili es as they became due.
A second interpreta on aid would be to compare BDCC’s current ra o to a similar company or
that of BDCC’s industry as a whole. Informa on is available from various trade publica ons and
business analysts’ websites that assemble financial ra o informa on for a wide range of industries.
Some analysts consider that a corpora on should maintain a 2:1 current ra o, depending on the
industry in which the firm operates. The reasoning is that, if there were $2 of current assets to
pay each $1 of current liabili es, the company should s ll be able to pay its current liabili es as
they become due, even in the event of a business downturn. However, it is recognized that no
one current ra o is applicable to all en
es; other factors — such as the composi on of current
assets — must also be considered to arrive at an acceptable ra o. This is illustrated below.

478
Financial Statement Analysis
Composi on of Specific Items in Current Assets
In the following example, both Corpora on A and Corpora on B have a 2:1 current ra o. Are the
companies equally able to repay their short-term creditors?
Corp. A
Corp. B
Current Assets
Cash
$
1,000
$
10,000
Accounts Receivable
2,000
20,000
Inventories
37,000
10,000
Total Current Assets
$
40,000
$
40,000
Current Liabili es
$
20,000
$
20,000
Current Ra o
2:1
2:1
The companies have the same dollar amounts of current assets and current liabili es. However,
they have different short-term debt paying abili es because Corpora on B has more liquid current
assets than does Corpora on A. Corpora on B has less inventory ($10,000 vs. $37,000) and more
in cash and accounts receivable. If Corpora on A needed more cash to pay short-term creditors
quickly, it would have to sell inventory, likely at a lower-than-normal gross profit. So, Corpora on
B is in a be er posi on to repay short-term creditors.
Since the current ra o doesn’t consider the components of current assets, it is only a rough in-
dicator of a company’s ability to pay its debts as they become due. This weakness of the current
ra o is partly remedied by the acid-test ra o discussed below.
An explora on is available on the Lyryx site. Log into your Lyryx course to run
Acid-Test Ra o
A more rigid test of liquidity is provided by the acid-test ra o; also called the quick ra o. To
calculate this ra o, current assets are separated into quick current assets and non-quick current
assets.

12.2. Liquidity Ra os: Analyzing Short-term Cash Needs
479
Quick Current Assets
Cash
Short-term investments
Accounts Receivable
Non-quick Current Assets
Inventories
Prepaid Expenses
These current assets are considered to
be readily conver ble into cash.
Cash cannot be obtained either at all
or easily from these current assets.
Inventory and prepaid expenses cannot be converted into cash in a short period of me, if at all.
Therefore, they are excluded in the calcula on of this ra o. The acid-test ra o is calculated as:
Quick current assets
Current liabili es
The BDCC informa on required to calculate this ra o is:
(000s)
2021
2020
2019
Cash
$
20
$
30
$
50
Short-term investments
36
31
37
Accounts receivable
544
420
257
Quick current assets
(a)
$
600
$
481
$
344
Current liabili es
(b)
$
1,255
$
917
$
369
Acid-test ra o
(a/b)
0.48:1
0.52:1
0.93:1
This ra o indicates how many quick asset dollars exist to pay each dollar of current liabili es. What
is an adequate acid-test ra o? It is generally considered that a 1:1 acid test ra o is adequate to
ensure that a firm will be able to pay its current obliga ons. However, this is a fairly arbitrary
guideline and is not appropriate in all situa ons. A lower ra o than 1:1 can o en be found in
successful companies. However, BDCC’s acid-test ra o trend is worrisome.
There were $0.48 of quick assets available to pay each $1 of current liabili es in 2021. This amount
appears inadequate. In 2020, the acid-test ra o of $0.52 also seems to be too low. The 2019 ra o
of $0.93 is less than 1:1 but may be reasonable. Of par cular concern to financial analysts would
be BDCC’s declining trend of the acid-test ra o over the three years.
Addi onal analysis can also be performed to determine the source of liquidity issues. These are
discussed next.

480
Financial Statement Analysis
An explora on is available on the Lyryx site. Log into your Lyryx course to run
.
Accounts Receivable Collec on Period
Liquidity is affected by management decisions related to trade accounts receivable. Slow collec-
on of receivables can result in a shortage of cash to pay current obliga ons. The effec veness of
management decisions rela ng to receivables can be analyzed by calcula ng the accounts receiv-
able collec on period.
The calcula on of the accounts receivable collec on period establishes the average number of
days needed to collect an amount due to the company. It indicates the efficiency of collec on
procedures when the collec on period is compared with the firm’s sales terms (in BDCC’s case,
the sales terms are net 30 meaning that amounts are due within 30 days of the invoice date).
The accounts receivable collec on period is calculated as:
Average net accounts receivable
Net credit sales (or revenues)
× 365
The BDCC financial informa on required to make the calcula on is shown below (the 2019 calcu-
la on cannot be made because 2018 Accounts Receivable amount is not available). Assume all of
BDCC’s sales are on credit.
(000s)
2021
2020
Net credit sales
(a)
$3,200
$2,800
Average accounts receivable
[(Opening balance + closing balance)/2]
(b)
$ 482
$ 338.5
Average collec on period
[(b/a)
× 365 days]
54.98 days
44.13 days
When Big Dog’s 30-day sales terms are compared to the 54.98-day collec on period, it can be seen
that an average 24.98 days of sales (54.98 days – 30 days) have gone uncollected beyond the regu-
lar credit period in 2021. The collec on period in 2021 is increasing compared to 2020. Therefore,
some over-extension of credit and possibly ineffec ve collec on procedures are indicated by this
ra o. Quicker collec on would improve BDCC’s cash posi on. It may be that older or uncollec ble
amounts are buried in the total amount of receivables; this would have to be inves gated.
2
Average balance sheet amounts are used when income statement amounts are compared to balance sheet
amounts in a ra o. This is because the income statement item is realized over a fiscal year, while balance sheet
amounts are recorded at points in me at the end of each fiscal year. Averaging opening and ending balance sheet
amounts is an a empt to match numerators and denominators to an approximate midpoint in the fiscal year.
3
($420 + 544)/2 = $482
4
($257 + 420)/2 = $338.5

12.2. Liquidity Ra os: Analyzing Short-term Cash Needs
481
Whether the increase in collec on period is good or bad depends on several factors. For instance,
more liberal credit terms may generate more sales (and therefore profits). The root causes of the
change in the ra o need to be inves gated. However, the calcula on does provide an indica on
of the change in effec veness of credit and collec on procedures between 2020 and 2021.
An explora on is available on the Lyryx site. Log into your Lyryx course to run
Accounts Receivable Collec on Period
.
Number of Days of Sales in Inventory
The effec veness of management decisions rela ng to inventory can be analyzed by calcula ng
the number of days of sales that can be serviced by exis ng inventory levels.
The number of days of sales in inventory is calculated by dividing average inventory by the cost
of goods sold and mul plying the result by 365 days.
Average merchandise inventory
Cost of goods sold
× 365
The BDCC financial data for 2020 and 2021 required to calculate this ra o are shown below.
(000s)
2021
2020
Cost of goods sold
(a)
$2,500
$2,150
Average inventory
[(Opening balance + closing balance)/2]
(b)
$ 668
$ 432
Cost of goods sold
365
365
Number of days sales in inventory
[(b/a)
× 365 days]
97.53 days
73.34 days
The calcula on indicates that BDCC is inves ng more in inventory in 2021 than in 2020 because
there are 97.53 days of sales in inventory in 2021 versus 73.34 days in 2020. BDCC has approx-
imately 3 months of sales with its exis ng inventory (98 days represents about 3 months). The
increase from 2020 to 2021 may warrant inves ga on into its causes.
A declining number of days of sales in inventory is usually a sign of good inventory management
because it indicates that the average amount of assets ed up in inventory is lessening. With lower
inventory levels, inventory-related expenses such as rent and insurance are lower because less
storage space is o en required. However, lower inventory levels can have nega ve consequences
since items that customers want to purchase may not be in inventory resul ng in lost sales.
Increasing days of sales in inventory is usually a sign of poor inventory management because an
excessive investment in inventory es up cash that could be used for other purposes. Increasing
5
($503 + 833)/2 = $668
6
($361 + 503)/2 = $432
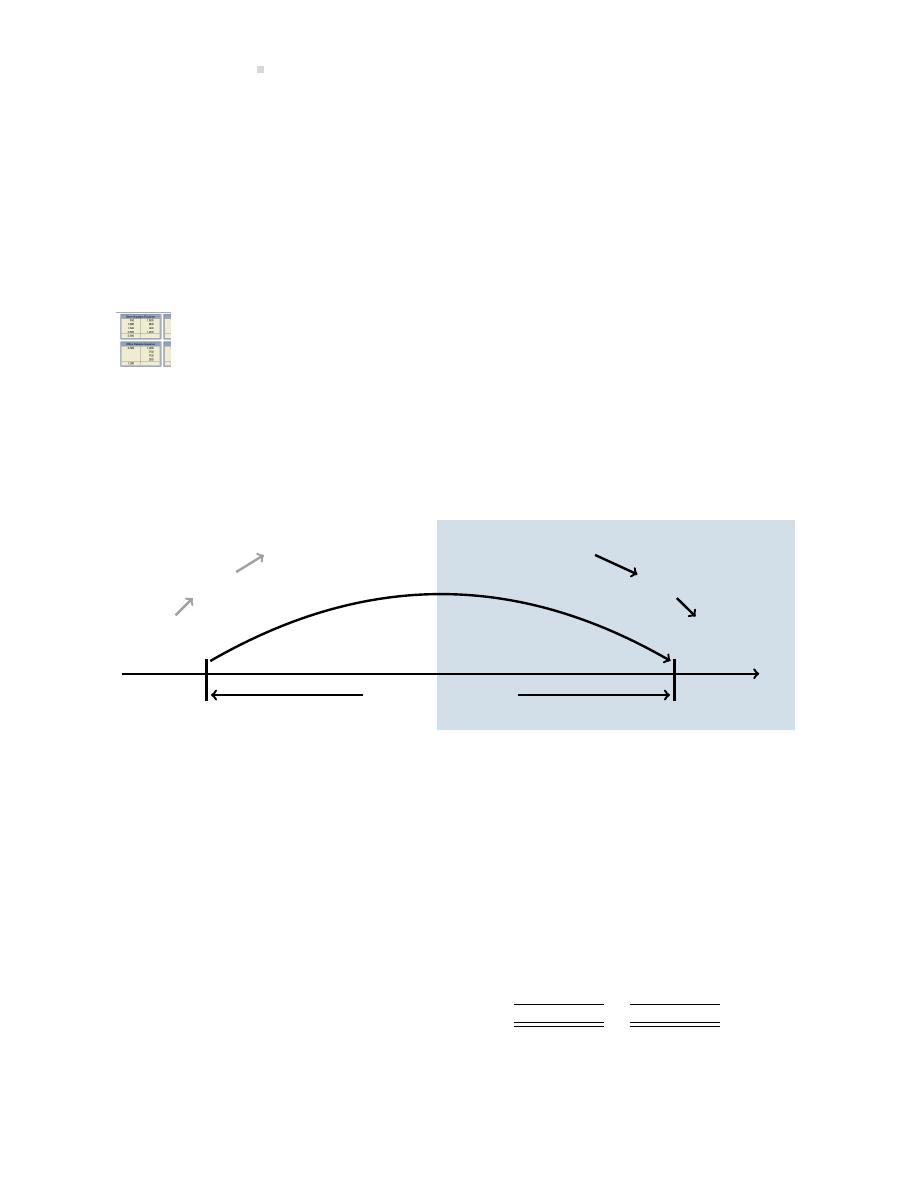
482
Financial Statement Analysis
levels may indicate that inventory is becoming obsolete (consider clothing) or deteriora ng (con-
sider perishable groceries). Obsolete and/or deteriora ng inventories may be unsalable. How-
ever, the possible posi ve aspect of more days of sales in inventory is that there can be shorter
delivery me to customers if more items are in stock.
Whether Big Dog’s increasing days of sales in inventory is posi ve or nega ve depends on man-
agement’s objec ves. Is management increasing inventory to provide for increased sales in the
next year, or is inventory being poorly managed? Remember that ra o analyses iden fy areas
that require inves ga on. The resul ng inves ga on will guide any required ac on.
An explora on is available on the Lyryx site. Log into your Lyryx course to run
Number of Days of Sales in Inventory Ra o
The Revenue Por on of the Opera ng Cycle
As discussed in Chapter
, the sale of inventory and resul ng collec on of receivables are part of
a business’s opera ng cycle as shown in Figure
Inventory is
purchased.
A liability is incurred.
Cash payment to supplier is made.
Inventory sold to customer.
Accounts receivable result.
Cash is collected
from customer.
One Opera ng Cycle
Time
Figure 12.1: Sales and Collec on Por on of the Opera ng Cycle
A business’s revenue opera ng cycle is a subset of the opera ng cycle and includes the purchase
of inventory, the sale of inventory and crea on of an account receivable, and the genera on of
cash when the receivable is collected. The length of me it takes BDCC to complete one revenue
opera ng cycle is an important measure of liquidity and can be calculated by adding the number
of days of sales in inventory plus the number of days it takes to collect receivables. The BDCC
financial data required for this calcula on follows.
2021
2020
Average number of days of sales in inventory
97.53 days
73.34 days
Average number of days to collect receivables
54.98 days
44.13 days
Number of days to complete the revenue cycle
152.51 days
117.47 days
In 2021, 152.51 days were required to complete the revenue cycle, compared to 117.47 days in

12.3. Profitability Ra os: Analyzing Opera ng Ac vi es
483
2020. So, if accounts payable terms require payment within 60 days, BDCC may not be able to pay
them because the number of days to complete the revenue cycle for both 2020 (117.47 days) and
2021 (152.51 days) are significantly greater than 60 days.
Analysis of BDCC’s Liquidity
Reflec ng on the results of all the liquidity ra os, it appears that Big Dog Carworks Corp. is growing
less liquid. Current assets, especially quick assets, are declining rela ve to current liabili es. The
revenue opera ng cycle is increasing.
12.3 Profitability Ra os: Analyzing Opera ng Ac vi es
Profitability ra os compare various expenses to revenues, and measure how well the assets of a
corpora on have been used to generate revenue.
Gross Profit Ra o
The gross profit ra o, as introduced briefly in Chapter
, indicates the percentage of sales revenue
that is le to pay opera ng expenses, creditor interest, and income taxes a er deduc ng cost of
goods sold. The ra o is calculated as:
Gross profit
Net sales
OR Gross profit
Net sales × 100
BDCC’s gross profit ra os for the three years are:
(000s)
2021
2020
2019
Gross profit
(a)
$
700
$
650
$
540
Net sales
(b)
$
3,200
$
2,800
$
2,340
Gross profit ra o
(a/b)
0.2188:1 or 21.88%
0.2321:1 or 23.21%
0.2308:1 or or 23.08%
In other words, for each dollar of sales BDCC has $0.22 of gross profit le to cover opera ng,
interest, and income tax expenses ($0.23 in each of 2020 and 2019). The ra o has not changed
significantly from year to year. However, even a small decline in this percentage can affect net
income significantly because the gross profit is such a large component of the income statement.
Changes in the gross profit ra o should be inves gated, as it will impact future financial perfor-
mance.
An explora on is available on the Lyryx site. Log into your Lyryx course to run
484
Financial Statement Analysis
Opera ng Profit Ra o
The opera ng profit ra o is one measure of rela ve change in these other expenses. This ra o
indicates the percentage of sales revenue le to cover interest and income taxes expenses a er
deduc ng cost of goods sold and opera ng expenses. In other words:
Income from opera ons
Net sales
OR Income from opera ons
Net sales
× 100
BDCC’s opera ng profit ra o for the 2019, 2020, and 2021 fiscal years is calculated as follows:
(000s)
2021
2020
2019
Income from opera ons
(a)
$
300
$
274
$
204
Net sales
(b)
$
3,200
$
2,800
$
2,340
Opera ng profit ra o
(a/b)
0.0938:1 or 9.38%
0.0979:1 or 9.79%
0.0872:1 or or 8.72%
For each dollar of sales revenue in 2021, the company had $0.09 le to cover interest and income
tax expenses a er deduc ng cost of goods sold and opera ng expenses. A review of the com-
pany’s opera ng expenses (selling, general, and administra ve expenses; employee benefits, and
deprecia on) show that they have all increased. As a result, and despite increasing sales revenue
and gross profit, opera ng income has remained rela vely flat. Although it seems reasonable that
an increase in opera ng expenses would follow an increase in sales, the reasons for the opera ng
expense increases should be inves gated.
An explora on is available on the Lyryx site. Log into your Lyryx course to run
.
Net Profit Ra o
The net profit ra o is the percentage of sales revenue retained by the company a er payment of
opera ng expenses, interest expenses, and income taxes. It is an index of performance that can
be used to compare the company to others in the same industry. This ra o is calculated by the
following formula:
Net income
Net sales (or revenues)
OR
Net income
Net sales (or revenues) ×
100
BDCC’s net profit ra os for the three years are calculated as follows:
(000s)
2021
2020
2019
Net income
(a)
$
116
$
117
$
112
Net sales
(b)
$
3,200
$
2,800
$
2,340
Net profit ra o
(a/b)
0.0363:1 or 3.63%
0.418:1 or 4.18%
0.0479:1 or or 4.79%
12.3. Profitability Ra os: Analyzing Opera ng Ac vi es
485
For each $1 of sales in 2021, BDCC earned $0.04 of net income. The net profit ra o has been
rela vely stable but needs to be compared with industry or compe tors’ averages for a be er
perspec ve.
Recall that revenues are generated from a business’s asset holdings. The financial strength and
success of a corpora on depends on the efficient use of these assets. An analysis of asset invest-
ment decisions can be made by calcula ng several ra os, and is discussed next.
An explora on is available on the Lyryx site. Log into your Lyryx course to run
.
Sales to Total Assets Ra o
Are BDCC’s sales adequate in rela on to its assets? The calcula on of the sales to total assets ra o
helps to answer this ques on by establishing the number of sales dollars earned for each dollar
invested in assets. The ra o is calculated as:
Net sales
Average total assets OR
Net sales
Average total assets × 100
BDCC’s ra os are calculated as follows:
(000s)
2021
2020
Net sales
(a)
$
3,200
$
2,800
Average total assets
(b)
$
2,299
$
1,764.50
Sales to total assets ra o
(a/b)
1.3919:1 or 139.19%
1.5869:1 or 158.69%
The ra o has decreased from 2020 to 2021. Each $1 of investment in assets in 2020 generated
sales of $1.59. In 2021, each $1 of investment in assets generated only $1.39 in sales. Over the
same period, BDCC’s investment in assets increased. The ra os indicate that the addi onal assets
are not producing revenue as effec vely as in the past. It may be too soon to tell whether the
increase in assets in 2020 will eventually create greater sales but an inves ga on is required.
As noted earlier, comparison with industry averages would be useful. A low ra o in rela on to
other companies in the same industry may indicate an over-investment in or inefficient use of
assets by BDCC. On the other hand, a higher ra o in comparison to other companies would be a
posi ve indicator.
An explora on is available on the Lyryx site. Log into your Lyryx course to run
.
7
($2,112 + 2,486)/2 = $2,299
8
($1,417 + 2,112)/2 = $1,764.50

486
Financial Statement Analysis
Return on Total Assets Ra o (ROA)
The return on total assets ra o or ROA is designed to measure the efficiency with which all of a
company’s assets are used to produce income from opera ons. The ra o is calculated as:
Income from opera ons
Average total assets
OR Income from opera ons
Average total assets
× 100
Note that expenses needed to finance the company opera ons are excluded from the calcula on,
specifically interest and income taxes. This is because all the assets of the company are considered
in the ra o’s denominator, whether financed by investors or creditors. Average Total Assets are
used in the calcula on because the amount of assets used likely varies during the year. The use
of averages tends to smooth out such fluctua ons.
BDCC’s returns on total assets for 2020 and 2021 are calculated as follows:
(000s)
2021
2020
Income from opera ons
(a)
$
300
$
274
Average total assets
(b)
$
$
Return on total assets ra o
(a/b)
0.1305:1 or 13.05%
0.1553:1 or 15.53%
The ra os indicate that Big Dog earned $0.13 of income from opera ons for every $1 of average
total assets in 2021, a decrease from $0.16 per $1 in 2020. This downward trend indicates that
assets are being used less efficiently. However, it may be that the increased investment in assets
has not yet begun to pay off. On the other hand, although sales are increasing, it is possible that
future sales volume will not be sufficient to jus fy the increase in assets. More informa on about
the company’s plans and projec ons would be useful. Recall that ra o analysis promotes the
asking of directed ques ons for the purpose of more informed decision making.
An explora on is available on the Lyryx site. Log into your Lyryx course to run
.
Return on Equity Ra o (ROE)
The return on equity ra o measures the return to shareholders — how much net income was
earned for the owners of a business. It is calculated as:
Net income
Average equity OR
Net income
Average equity × 100
9
($2,112 + 2,486)/2 = $2,299
10
($1,417 + 2,112)/2 = $1,764.50

12.4. Leverage Ra os: Analyzing Financial Structure
487
The 2020 and 2021 returns on equity ra os for BDCC are calculated as follows (note that the 2019
ra o is excluded because average equity cannot be calculated since 2018 ending balances are not
provided):
(000s)
2021
2020
Net income
(a)
$
116
$
117
Average equity
(b)
$
$
1,121.50
Return on equity ra o
(a/b)
0.0956:1 or 9.56%
0.1043:1 or 10.43%
In both years, shareholders earned, on average, $0.10 for every $1 invested in BDCC, or 10%.
Industry averages could help with this analysis. For instance, if the industry as a whole earned
only a 5% return on equity in 2021, it could be concluded that BDCC performed be er than the
industry average in terms of return on equity.
An explora on is available on the Lyryx site. Log into your Lyryx course to run
.
12.4 Leverage Ra os: Analyzing Financial Structure
The accoun ng equa on expresses a rela onship between assets owned by an en ty and the
claims against those assets. Although shareholders own a corpora on, they alone do not finance
the corpora on; creditors also finance some of its ac vi es. Together, creditor and shareholder
capital are said to form the financial structureFinancial structure of a corpora on. At December
31, 2021, the balance sheet of BDCC shows the following financial structure:
ASSETS =
LIABILITIES +
EQUITY
$2,486
=
$1,255
+
$1,231
Debt Ra o
The propor on of total assets financed by debt is called the debt ra o, and is calculated by dividing
total liabili es by total assets.
Total liabili es
Total assets
OR Total liabili es
Total assets × 100
In BDCC’s case, these amounts are:
11
($1,195 + 1,231)/2 = $1,213
12
($1,048 + 1,195)/2 = $1,121.50
488
Financial Statement Analysis
(000s)
2021
2020
Total liabili es
(a)
$
1,255
$
917
Total assets
(b)
$
2,486
$
2,112
Debt ra o
(a/b)
0.5048:1 or 50.48%
0.4342:1 or 43.42%
In other words, 50.48% of BDCC’s assets are financed by debt. Therefore, because assets are
financed by debt (aka liabili es) and equity, we intui vely know that 49.52% of BDCC’s assets
must be financed by equity which is the topic of the next sec on.
An explora on is available on the Lyryx site. Log into your Lyryx course to run
Equity Ra o
The propor on of total assets financed by equity is called the equity ra o, and is calculated by
dividing total equity by total assets. In BDCC’s case, these amounts are:
(000s)
2021
2020
Total equity
(a)
$
1,231
$
1,195
Total assets
(b)
$
2,486
$
2,112
Equity ra o
(a/b)
0.4952:1 or 49.52%
0.5658:1 or 56.58%
In 2021, 49.52% of the assets were financed by equity while in 2020 56.58% of the assets were
financed by equity. Generally, this is considered an unfavourable trend because as equity financing
decreases, we know that debt financing must be increasing as evidenced by the debt ra o above.
The greater the debt financing, the greater the risk because principal and interest payments are
part of debt financing.
No ce that the sum of the debt and equity ra os will always equal 100% because of the accoun ng
equa on rela onship: A = L + E where A = 100% and, in the case of BDCC, L = 43.42% in 2020 and
E = 56.58% in 2020.
An explora on is available on the Lyryx site. Log into your Lyryx course to run
.
Debt to Equity Ra o
The propor on of creditor to shareholders’ claims is called the debt to equity ra o, and is calcu-
lated by dividing total liabili es by equity. In BDCC’s case, these amounts are:

12.4. Leverage Ra os: Analyzing Financial Structure
489
(000s)
2021
2020
2019
Total liabili es
(a)
$
1,255
$
917
$
369
Equity
(b)
$
1,231
$
1,195
$
1,048
Debt to equity ra o
(a/b)
1.02:1
0.77:1
0.35:1
In other words, BDCC has $1.02 of liabili es for each dollar of equity at the end of its current fiscal
year, 2021. The propor on of debt financing has been increasing since 2019. In 2019 there was
only $0.35 of debt for each $1 of equity. In 2021, creditors are financing a greater propor on of
BDCC than are shareholders. This may be a cause for concern.
On the one hand, management’s reliance on creditor financing is good. Issuing addi onal shares
might require exis ng shareholders to give up some of their control of BDCC. Creditor financing
may also be more financially a rac ve to exis ng shareholders if it enables BDCC to earn more
with the borrowed funds than the interest paid on the debt.
On the other hand, management’s increasing reliance on creditor financing increases risk because
interest and principal have to be paid on this debt. Before deciding to extend credit, creditors o en
look at the total debt load of a company, and therefore the company’s ability to meet interest
and principal payments in the future. Total earnings of BDCC could be reduced if high interest
payments have to be made, especially if interest rates rise. Creditors are interested in a secure
investment and may evaluate shareholder commitment by measuring rela ve amounts of capital
invested. From the creditors’ perspec ve, the more capital invested by owners of the company,
the greater the rela ve risk assumed by shareholders thus decreasing risk to creditors.
Although there is no single most appropriate debt to equity ra o, there are techniques for es -
ma ng the op mum balance. These are beyond the scope of introductory financial accoun ng.
For now, it is sufficient to note that for BDCC the debt to equity ra o has increased considerably
over the three-year period which is generally unfavourable because of the risk associated with
debt financing.
An explora on is available on the Lyryx site. Log into your Lyryx course to run
Times Interest Earned Ra o
Creditors are interested in evalua ng a company’s financial performance, in order to project whether
the firm will be able to pay interest on borrowed funds and repay the debt when it comes due.
Creditors are therefore interested in measures such as the mes interest earned ra o. This ra o
indicates the amount by which income from opera ons could decline before a default on interest
may result. The ra o is calculated by the following formula:
Income from opera ons
Interest expense

490
Financial Statement Analysis
Note that income from opera ons is used, so that income before deduc on of creditor payments
in the form of income taxes and interest is incorporated into the calcula on. BDCC’s 2020 and
2021 ra os are calculated as follows:
(000s)
2021
2020
2019
Income from opera ons
(a)
$
300
$
274
$
204
Interest expense
(b)
$
89
$
61
-0-
Times interest earned ra o
(a/b)
3.37:1
4.49:1
n/a
The larger the ra o, the be er creditors are protected. BDCC’s interest coverage has decreased
from 2020 to 2021 (3.37 mes vs. 4.49 mes), but income would s ll need to decrease significantly
for the company to be unable to pay its obliga ons to creditors. The analysis does indicate, though,
that over the past two years interest charges have increased compared to income from opera ons.
Creditors need to assess company plans and projec ons, par cularly those affec ng income from
opera ons, to determine whether their loans to the company are at risk. As discussed above, it
may be that significant investments in assets have not yet generated related increases in sales and
income from opera ons.
An explora on is available on the Lyryx site. Log into your Lyryx course to run
.
12.5 Market Ra os: Analysis of Financial Returns to Investors
Investors frequently consider whether to invest or divest in shares of a corpora on. There are
various ra os that help them make this decision. These are called market ra os, because the
stock market plays an important role in alloca ng financial resources to corpora ons that offer
their shares to the public.
Earnings-per-Share (EPS)
Measures of efficiency can focus on shareholder returns on a per-share basis. That is, the amount
of net income earned in a year can be divided by the number of common shares outstanding to
establish how much return has been earned for each outstanding share. This earnings-per-share
(EPS) value is calculated as:
Net income
Number of common shares outstanding
EPS is quoted in financial markets and is disclosed on the income statement of publicly-traded
companies. If there are preferred shareholders, they have first rights to distribu on of dividends.
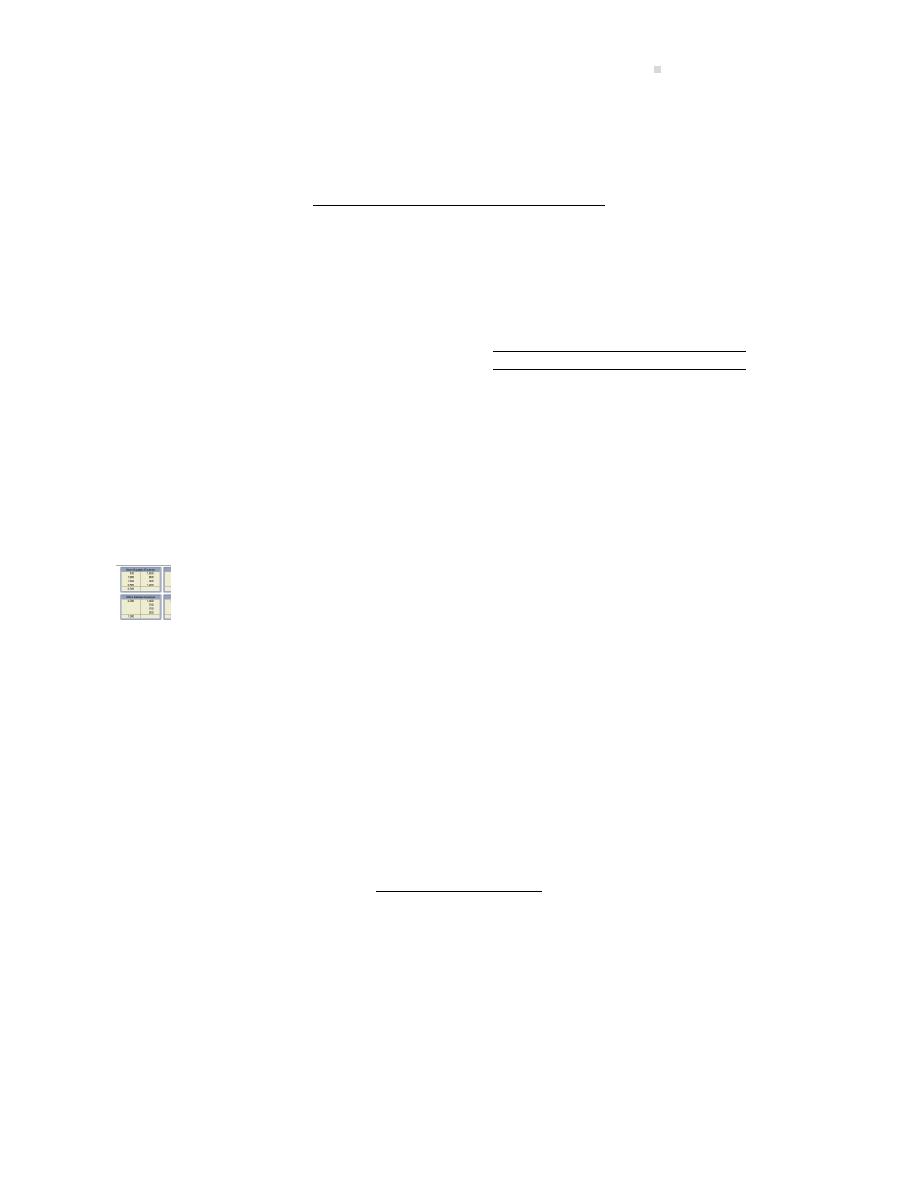
12.5. Market Ra os: Analysis of Financial Returns to Investors
491
Therefore, when calcula ng EPS, preferred shareholders’ claims on net income are deducted from
net income to calculate the amount available for common shareholders:
Net income
− preferred share dividends
Number of common shares outstanding
BDCC has no preferred shares and thus no preferred share dividends. Recall that 100,000 common
shares are outstanding at the end of 2019, 2020, and 2021. For BDCC, EPS calcula ons for the
three years are:
(000s)
2021
2020
2019
Net income
(a)
$
116
$
117
$
112
Number of common shares outstanding
(b)
100
100
100
Earnings per share
(a/b)
$
1.16
$
1.17
$
1.12
Big Dog’s EPS has remained rela vely constant over the three-year period because both net in-
come and number of outstanding shares have remained fairly stable. Increasing sales levels and
the resul ng posi ve effects on net income, combined with unchanged common shares issued,
has generally accounted for the slight increase from 2019 to 2020.
An explora on is available on the Lyryx site. Log into your Lyryx course to run
Price-earnings (P/E) Ra o
A price at which a common share trades on a stock market is perhaps the most important measure
of a company’s financial performance. The market price of one share reflects the opinions of
investors about a company’s future value compared to alterna ve investments.
The earnings performance of common shares is o en expressed as a price-earnings (P/E) ra o.
Price-earnings (P/E) ra o It is calculated as:
Market price per share
Earnings per share
This ra o is used as an indicator of the market’s expecta on of a company’s future performance.
Assume Company A has a current market value of $15 per share and an EPS of $1 per share. It will
have a P/E ra o of 15. If Company B has a market value of $4 per share and an EPS of $0.50 per
share, it will have a P/E ra o of 8. This means that the stock market expects Company A to earn
rela vely more in the future than Company B. For every $1 of net income generated by Company
A, investors are willing to invest $15. In comparison, for every $1 of net income generated by
Company B, investors are willing to pay only $8. Investors perceive shares of Company A as more

492
Financial Statement Analysis
valuable because the company is expected to earn greater returns in the future than is Company
B.
Assume that BDCC’s average market price per common share was $4 in 2019, $5 in 2020, and $6
in 2021. Its P/E ra o would be calculated as:
(000s)
2021
2020
2019
Market price per common share
(a)
$
6.00
$
5.00
$
4.00
Earnings per share (see above)
(b)
$
1.16
$
1.17
$
1.12
Price-earnings ra o
(a/b)
5.17
4.27
3.57
BDCC’s P/E ra o has increased each year. Although industry and compe tor’s P/E ra o com-
parisons would be important to compare, BDCC’s increasingly posi ve ra o also indicates that
investors are “bullish” on BDCC. That is, the stock market indicates that it expects BDCC to be
increasingly profitable in the coming years. Despite a rela vely constant EPS ra o from 2019 to
2021, investors are willing to pay more and more for the company’s common shares. This must
be because future financial prospects are an cipated to be be er than in the past three years.
An explora on is available on the Lyryx site. Log into your Lyryx course to run
Dividend Yield
Some investors’ primary objec ve is to maximize dividend revenue from share investments, rather
than realize an increasing market price of the shares. This type of investor is interested in informa-
on about the earnings available for distribu on to shareholders and the actual amount of cash
paid out as dividends rather than the market price of the shares.
The dividend yield ra o is a means to determine this. It is calculated as:
Dividends per share
Market price per share
This ra o indicates how large a return in the form of dividends can be expected from an investment
in a company’s shares. The relevant informa on for BDCC over the last three years is shown in the
financial statements, as follows:
(000s – except per share values)
2021
2020
2019
Dividends declared
(a)
$
80
$
70
$
60
Outstanding common shares
(b)
100
100
100
Dividends per share
(a/b)
$
0.80
$
0.70
$
0.60

12.6. Overall Analysis of Big Dog’s Financial Statements
493
The dividend yield ra o is therefore:
2021
2020
2019
Dividends per share
(a)
$
0.80
$
0.70
$
0.60
Market price per share (given)
(b)
$
6.00
$
5.00
$
4.00
Dividend yield ra o
(a/b)
0.13:1
0.14:1
0.15:1
The company’s dividend yield ra o decreased from 2019 to 2021. In 2019, investors received
$0.15 for every $1 invested in shares. By 2021, this had decreased to $0.13 for every $1 invested.
Though the decline is slight, the trend may concern investors who seek steady cash returns. Also
no ce that total dividends declared increased from 2019 to 2021 even though net income did
not substan ally increase, and despite the company’s poor liquidity posi on noted in an earlier
analysis. Investors might ask why such high levels of dividends are being paid given this situa on.
An explora on is available on the Lyryx site. Log into your Lyryx course to run
12.6 Overall Analysis of Big Dog’s Financial Statements
Results of ra o analysis are always more useful if accompanied by other informa on such as overall
industry performance, the general economy, financial ra os of prior years, and qualita ve factors
such as analysts’ opinions and management’s plans.
However, there are some interpreta ons that can be made about BDCC from the foregoing ra o
analyses even without other informa on. Although BDCC is experiencing growth in sales, net in-
come has not substan ally increased over the three-year period 2019 to 2021. The gross profit
ra o is rela vely constant. Their increasing opera ng expenses appear to be an issue. The sales
to total assets and return on assets ra os have decreased due to a recent investment in property,
plant and equipment assets and growth in current assets. Income from opera ons has not in-
creased with the growth in the asset base. However, it may be premature to make conclusions
regarding the ming of outlays for property, plant, and equipment.
The most immediate problem facing BDCC is the shortage of working capital and its poor liquidity.
BDCC expanded its property, plant, and equipment in 2020 and experienced increases in revenue
that did not correspond to increases in accounts receivable and inventories. The company should
therefore review its credit policies and monitor its investment in inventory to ensure that these
expand in propor on to sales.
The plant expansion produced an increase in current liabili es (mainly borrowings). The com-
pany’s ability to meet its debt obliga ons appears to be deteriora ng. The ability of income from
opera ons to cover interest expense has declined. The company’s liquidity posi on is deteriorat-
ing, even though it con nues to produce net income each year. BDCC should inves gate alterna-
ves to short-term borrowings, such as conver ng some of this to long-term debt and/or issuing
addi onal share capital to re re some of its short-term debt obliga ons.
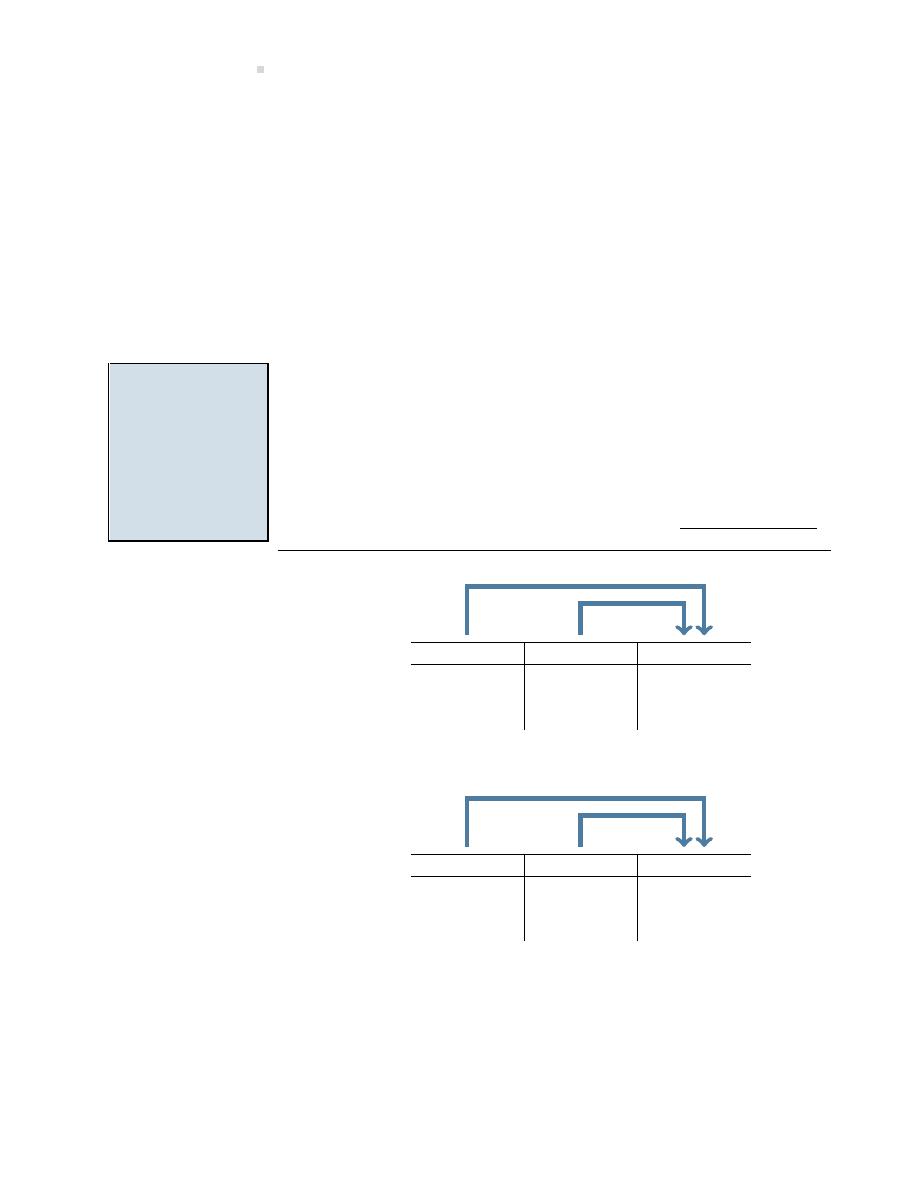
494
Financial Statement Analysis
Despite these challenges, the stock market indicates that it expects BDCC to be increasingly prof-
itable in the future. Perhaps it views the nega ve indicators noted above as only temporary or
easily rec fied by management.
The next sec on provides further insights into BDCC’s opera ons through trend analysis of the
company’s financial statements.
12.7 Horizontal and Ver cal Trend Analysis
LO2 – Describe
horizontal
and
ver cal
trend
analysis,
and
explain
how
they are used to
analyze financial
statements.
Trend analysis is the evalua on of financial performance based on a re-
statement of financial statement dollar amounts to percentages. Horizon-
tal analysis and ver cal analysis are two types of trend analyses.
Horizontal analysis involves the calcula on of percentage changes from
one or more years over the base year dollar amount. The base year is
typically the oldest year and is always 100%. The following two examples
of horizontal analysis use an abbreviated income statement and balance
sheet informa on where 2019 represents the base year. For demonstra on
purposes, the percentages have been rounded to the nearest whole number.
2021
2020
2019
Sales
1
$100 200%
$70 140%
$50 100%
Gross profit
$ 48
160%
$45 150%
$30 100%
Net income
$ 14
140%
$12 120%
$10 100%
1. Sales in 2020 were 140% of 2019 sales calculated as ($70/$50)x100. Sales
in 2021 were 200% of 2019 sales calculated as ($100/$50)x100.
2021
2020
2019
Current assets
2
$ 18
90%
$ 22
110%
$ 20
100%
Long-term investments
$ -0-
N/A
$ 48
60%
$ 80
100%
Total assets
$252 105%
$228
95%
$240 100%
2. Current assets in 2020 were 110% of 2019 current assets calculated as
($22/$20)x100. Current assets in 2021 were 90% of 2019 current assets cal-
culated as ($18/$20)x100.
An alternate method of performing horizontal analysis calcula ons is to simply calculate the per-
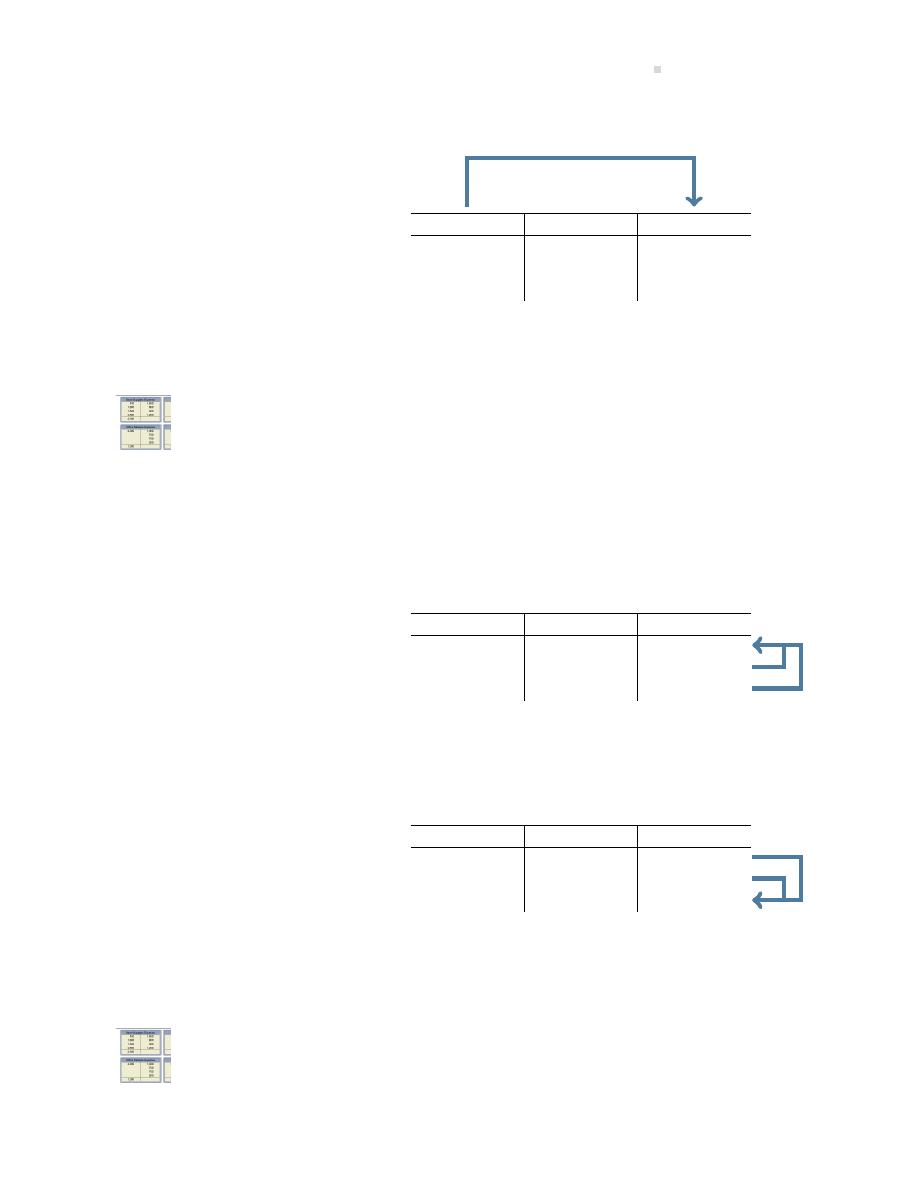
12.7. Horizontal and Ver cal Trend Analysis
495
centage change between two years as shown in the following example.
2021
% Change
2020
Sales
3
$100
43%
$70
Gross profit
$ 48
7%
$45
Net income
$ 14
17%
$12
3. Sales in 2021 increased 43% over 2020 calculated as ($100–$70)=$30;
($30/$70)x100=43%.
An explora on is available on the Lyryx site. Log into your Lyryx course to run
.
Ver cal analysis requires numbers in a financial statement to be restated as percentages of a base
dollar amount. For income statement analysis, the base amount used is sales. For balance sheet
analysis, total assets, or total liabili es and equity, are used as the base amounts. When financial
statements are converted to percentages, they are called common-size financial statements. The
following two examples of ver cal analysis use informa on from an abbreviated income statement
and balance sheet.
2021
2020
2019
1
Sales
$100 100%
$70 100%
$50 100%
Gross profit
$ 48
48%
$45
64%
$30
60%
Net income
$ 14
14%
$12
17%
$10
20%
1. 2019 Gross profit was 60% of Sales calculated as ($30/$50)x100; 2019 Net
income was 20% of Sales calculated as ($10/$50)x100.
2021
2020
2019
2
Current assets
$ 18
7%
$ 22
10%
$ 20
8%
Long-term investments
$ -0-
N/A
$ 48
21%
$ 80
33%
Total assets
$252 100%
$228 100%
$240 100%
2. 2019 Current assets were 8% of Total assets calculated as ($20/$240)x100.
2019 Long-term investments were 33% of Total assets calculated as
($80/$240)x100.
An explora on is available on the Lyryx site. Log into your Lyryx course to run
.
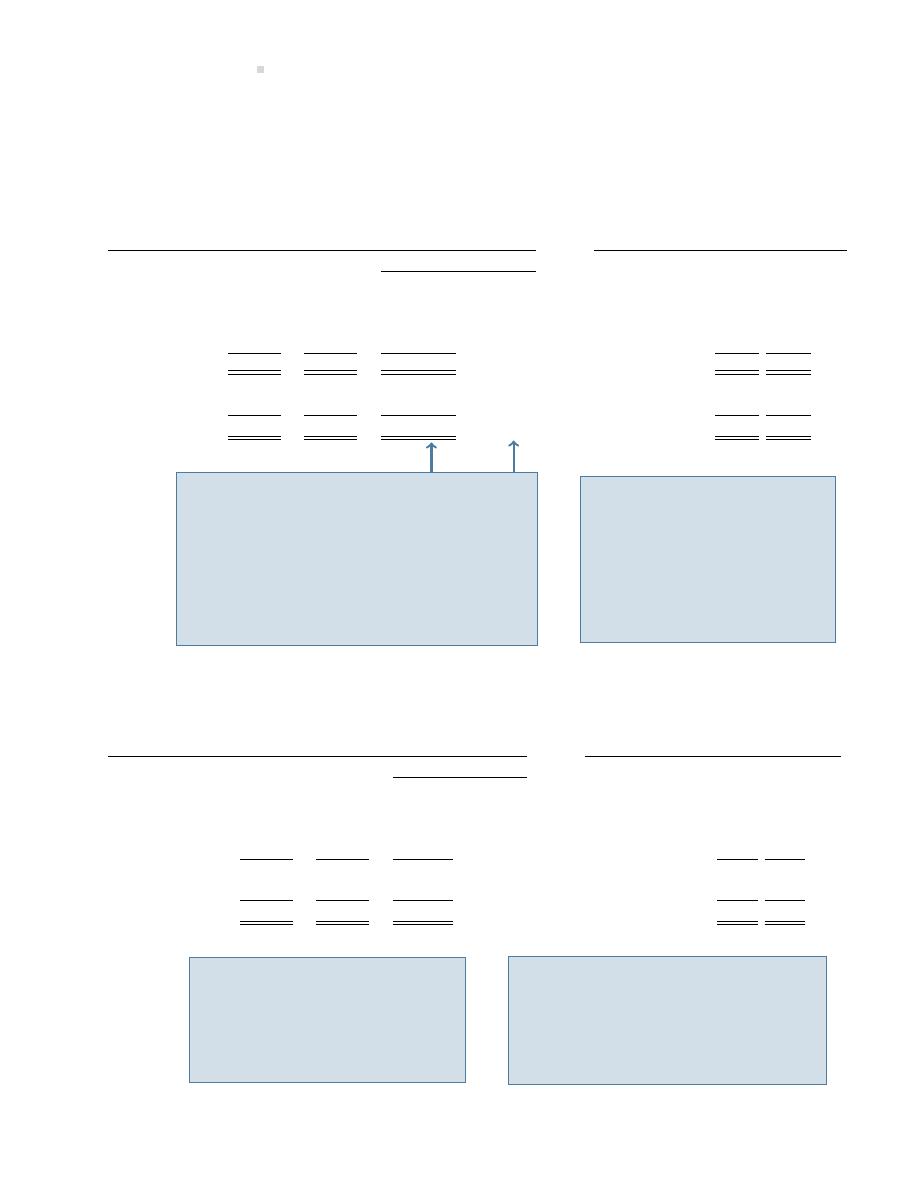
496
Financial Statement Analysis
No ce that the same informa on was used for both the horizontal and ver cal analyses examples
but that the results are different because of how the dollar amounts are being compared.
Horizontal and ver cal analyses of the balance sheets of Big Dog Carworks Corp. are as follows:
Horizontal Analysis: Balance Sheet
Ver cal Analysis (Common-size):
Balance
Change
Per
%
%
2021
2020
Difference
Cent
2021
2020
Current assets
$1,433
(a)
$ 984
(b)
+$449
(a-b)
+45.6
[(a-b)/b]
Current assets
57.6
46.6
(b/c)
PPE assets
1,053
1,128
-75
-6.6
PPE assets
42.4
53.4
Total
$2,486
$2,112
(c)
+$374
+17.7
Total
100.0 100.0
Current liabili es $1,255
$917
+$338
+36.9
Current liabili es 50.5
43.4
Equity
1,231
1,195
+36
+3.0
Equity
49.5
56.6
Total
$2,486
$2,112
+$374
+17.7
Total
100.0 100.0
No ce the two columns introduced here. Anal-
ysis of the changes indicates a large increase in
current assets (45.6%) together with a large in-
crease in current liabili es (36.9%). There was
a small decline in PPE assets (6.6%) and a small
increase in equity (3%). The percentage change
must always be interpreted together with the
absolute dollar amount of change to avoid incor-
rect conclusions; percentage can some mes be
misleading.
In the common-size balance
sheet, the composi on of the
assets has changed with an over-
all shi to current assets in 2019
(57.6% vs. 46.6%). Also, an in-
crease in the percentage of cur-
rent liabili es has occurred, re-
sul ng in an overall shi from
equity financing to debt financing
from 2020 to 2021.
The same analysis of BDCC’s income statement is as follows:
Horizontal Analysis: Income Statements
Ver cal Analysis (Common-size):
Income Statements
Change
Per
%
%
2021
2020
Amount
Cent
2021 2020
Sales
$3,200
(a)
$2,800
(b)
+$400
(a-b)
+14
[(a-b)/b]
Sales
100
100
(b/c)
Cost of Goods Sold 2,500
2,150
+$350
+16
Cost of Goods Sold
78
77
Gross Profit
700
650
(c)
+$ 50
+8
Gross Profit
22
23
Expenses
584
533
+$ 51
+10
Expenses
18
19
Net Income
$ 116
$ 117
-$
1
-1
Net Income
4
4
Although sales and gross profit in-
creased in dollar amounts, net in-
come decreased slightly from 2020
to 2021 (1%). This net decrease re-
sulted because cost of goods sold
increased at a faster rate than sales
(16% vs. 14%).
No ce the rela ve change in the compo-
nents. For example, cost of goods sold
increased in 2021 rela ve to sales (78% vs.
77%), while expenses in 2021 rela ve to
sales decreased (18% vs. 19%). The over-
all changes were almost offse ng, as net
income remained fairly stable.

12.7. Horizontal and Ver cal Trend Analysis
497
The percentages calculated become more informa ve when compared to earlier years. Further
analysis is usually undertaken in order to establish answers to the following ques ons:
What caused this change?
How do the percentages of this
Is this change favourable or
company compare with other
unfavourable?
companies in the same industry?
In other industries?
These and similar ques ons call a en on to areas that require further study. One item of note
becomes more apparent as a result of the trend analysis above. Ini ally, it was stated that oper-
a ng expenses were increasing between 2019 and 2021. Based on trend analysis, however, these
expenses are actually declining as a percentage of sales. As a result, their fluctua ons may not be
as significant as first inferred. Conversely, the increases each year in cost of goods sold may be
worrisome. Ini al gross profit ra o calcula ons seemed to indicate li le varia on, and thus li le
effect on income from opera ons. The increase in cost of goods sold (78% vs. 77% of sales) may
warrant further inves ga on.
The ra os covered in this chapter are summarized in Figure
Analysis of liquidity:
Calcula on of ra o:
Indicates:
1. Working Capital
Current assets – Current liabili es
The excess of current assets available
a er covering current liabili es
(expressed as a dollar amount).
2. Current ra o
Current assets
Current liabili es
The amount of current assets available to
pay current liabili es.
3. Acid-test ra o
Quick current assets
Current liabili es
Whether the company is able to meet the
immediate demands of creditors. (This is
a more severe measure of liquidity.)
4. Accounts
receivable collec on
period
Average net
accounts receivable
Net credit sales
(or revenues)
× 365
The average me needed to collect
receivables.
5. Number of days of
sales in inventory
Average inventory
Cost of goods sold × 365
How many days of sales can be made with
exis ng inventory
6. Revenue
opera ng cycle
Average number of days to collect
receivables + Average number of
days of sales inventory
Length of me between the purchase of
inventory and the subsequent collec on
of cash.

498
Financial Statement Analysis
Analysis of
profitability:
Calcula on of ra o:
Indicates:
1. Gross profit ra o
Gross profit
Net sales
The percentage of sales revenue that is
le to pay opera ng expenses, interest,
and income taxes a er deduc ng cost of
goods sold.
2. Opera ng profit
ra o
Income from opera ons
Net sales
The percentage of sales revenue that is
le to pay interest and income taxes
expenses a er deduc ng cost of goods
sold and opera ng expenses.
3. Net profit ra o
Net income
Net sales (or revenues) ×
100
The percentage of sales le a er payment
of all expenses.
4. Sales to total
assets ra o
Net sales
Average total assets
The adequacy of sales in rela on to the
investment in assets.
5. Return on total
assets
Income from opera ons
Average total assets
How efficiently a company uses its assets
as resources to earn net income.
6. Return on equity
Net income
Average equity
The adequacy of net income as a return
on equity.
Leverage ra os:
Calcula on of ra o:
Indicates:
1. Debt ra o
Total liabili es
Total assets
The propor on of total assets financed by
debt.
2. Equity ra o
Total equity
Total assets
The propor on of total assets financed by
equity.
3. Debt to equity
ra o
Total liabili es
Equity
The propor on of creditor financing to
shareholder financing.
4. Times interest
earned ra o
Income from opera ons
Interest expense
The ability of a company to pay interest to
long-term creditors.
Market ra os:
Calcula on of ra o:
Indicates:
1. Earnings per share
Net income
−
Preferred share dividends
Average number of common shares
outstanding
The amount of net income that has been
earned on each common share a er
deduc ng dividends to preferred
shareholders.
2. Price-earnings
ra o
Market price per share
Earnings per share
Market expecta ons of future
profitability.
3. Dividend yield
ra o
Dividends per share
Market price per share
The short-term cash return that can be
expected from an investment in a
company’s shares.
Figure 12.2: Summary of Financial Statement Analysis Ra os

Summary of Chapter
Learning Objec ves
499
Schema cally, the various analy cal tools can be illustrated as shown in Figure
.
Financial
Market
Trend
Liquidity
Profitability
Structure
Measures
Analysis
Returns on
Short-term
Current asset
Returns on balance sheet
cash needs
performance
sales
items
Current
A/R collec on
Gross
Sales to total
Debt to
Earnings
Horizontal
ra o
period
profit ra o assets ra o
equity ra o
per share
Acid-test
Number of
Opera ng
Return on
Times
Price-
Ver cal
ra o
days of sales
income
total assets
interest
earnings
in inventory
ra o
earned
ra o
ra o
Revenue
Net profit
Return on
Dividend
opera ng
ra o
equity
yield ra o
cycle
Figure 12.3: Categoriza on of Financial Statement Analy cal Tools
Summary of Chapter 12 Learning Objec ves
LO1 – Describe ra o analysis, and explain how the liquidity, profitability, lever-
age, and market ra os are used to analyze and compare financial statements.
Ra o analysis measures the rela ve magnitude of two selected numerical values taken from a
company’s financial statements and compares the result to prior years and other similar compa-
nies. Financial ra os are an effec ve tool for measuring: (a) liquidity (current ra o, acid-test ra o,
accounts receivable collec on period, and number of days of sales in inventory); (b) profitability
(gross profit ra o, opera ng profit ra o, net profit ra o, sales to total assets ra o, return on total
assets, and return on equity); (c) leverage (debt ra o, equity ra o, debt to equity ra o, and mes
interest earned ra o); and (d) market ra os (earnings per share, price-earnings ra o, and dividend
yield ra o). Ra os help iden fy the areas that require further inves ga on.
LO2 – Describe horizontal and ver cal trend analysis, and explain how they are
used to analyze financial statements.
Horizontal analysis involves the calcula on of percentage changes from one or more years over
the base year dollar amount. The base year is typically the oldest year and is always 100%. Ver-
cal analysis requires that numbers in a financial statement be restated as percentages of a base
dollar amount. For income statement analysis, the base amount used is sales. For balance sheet

500
Financial Statement Analysis
analysis, total assets, or total liabili es and equity, are used as the base amounts. When financial
statements are converted to percentages, they are called common-size financial statements.
Discussion Ques ons
1. Ra os need to be evaluated against some base. What types of informa on can be used to
compare ra os against?
2. Explain what liquidity means. When a corpora on is illiquid, what are the implica ons for
shareholders? ...for creditors?
3. How is it possible that a corpora on producing net income each year can be illiquid?
4. What ra os can be calculated to evaluate liquidity? Explain what each one indicates.
5.
a. Define working capital. Dis nguish between the current ra o and the acid-test ra o.
b. “The current ra o is, by itself, inadequate to measure liquidity.” Discuss this statement.
6. Two firms have the same amount of working capital. Explain how it is possible that one is
able to pay off short-term creditors, while the other firm cannot.
7. Management decisions rela ng to accounts receivable and inventory can affect liquidity.
Explain.
8. What is one means to evaluate the management of accounts receivable? ...inventory?
9. Discuss the advantages and disadvantages of decreasing number of days of sales in inven-
tory.
10. What is the revenue opera ng cycle? How is its calcula on useful in evalua ng liquidity?
11.
a. Iden fy and explain six ra os (and any associated calcula ons) that evaluate a corpo-
ra on’s profitability.
b. What does each ra o indicate?
12. Why are analysts and investors concerned with the financial structure of a corpora on?
13. Is the reliance on creditor financing good or bad? Explain its impact on net income.
14. Discuss the advantages and disadvantages of short-term debt financing compared to long-
term debt financing.
15. Iden fy and explain ra os that evaluate financial returns for investors.
16. Dis nguish between horizontal and ver cal analyses of financial statements.

Exercises
501
Exercises
EXERCISE 12–1
(LO1)
The following are condensed compara ve financial statements of Stockwell Inc. for the three years
ended December 31, 2015.
Balance Sheet
At December 31
Assets
2015
2014
2013
Current
Cash
$ 21
$ 8
$ 17
Accounts Receivable
38
30
20
Merchandise Inventory
60
40
30
Prepaid Expenses
1
2
3
Total Current Assets
120
80
70
Property, plant and equipment assets,
260
150
76
at carrying amount
Total Assets
$380
$230
$146
Liabili es
Current
Accounts Payable
$100
$ 80
$ 50
Non-current
Bonds Payable, 4%
50
50
-0-
150
130
50
Equity
Common Shares
200
80
80
Retained Earnings
30
20
16
230
100
96
Total Liabili es and Equity
$380
$230
$146

502
Financial Statement Analysis
Income Statement
For the Years Ended December 31
2015
2014
2013
Sales
$210
$120
$100
Cost of Goods Sold
158
80
55
Gross Profit
52
40
45
Opera ng Expenses
35
32
33
Income from Opera ons
17
8
12
Interest Expense
2
2
-0-
Income before Income Taxes
15
6
12
Income Taxes
5
2
4
Net Income
$ 10
$ 4
$ 8
Addi onal informa on:
i. The company’s accounts receivable at December 31, 2012 totalled $20.
ii. The company’s merchandise inventory at December 31, 2012 totalled $20.
iii. The company’s property, plant and equipment assets at December 31, 2012 totalled $70.
iv. Credit terms are net 60 days from date of invoice.
v. Number of common shares outstanding: 2013–80, 2014–80, 2015–400.
Required:
a. Calculate liquidity ra os and discuss.
b. What is your evalua on of
i. The financial structure of the corpora on?
ii. The propor on of shareholder and creditor claims to its assets?
iii. The structure of its short-term and long-term credit financing?
c. What are some other observa ons you can make about the financial performance of Stock-
well?
EXERCISE 12–2
(LO1)
The following informa on relates to three companies in the same industry:

Exercises
503
Latest
Earnings
Dividends
Company
market price
per share
per share
A
$ 35
$ 11
$ -0-
B
40
5
4
C
90
10
6
Required: Explain and calculate the price-earnings and dividend yield ra os. On the basis of only
the foregoing informa on, which company represents the most a rac ve investment opportunity
to you? Explain.
EXERCISE 12–3
(LO1)
Consider the following informa on:
Salinas Limited
Balance Sheet
At December 31, 2012
Assets
Liabili es and Equity
Cash
$ 72
Accounts Payable
$ 60
Accounts Receivable
88
Bank Loan, non-current
150
Merchandise Inventory
100
Prepaid Expenses
40
Preferred Shares
60
Property, Plant, and Equipment,
Common Shares
250
at carrying amount
320
Retained Earnings
100
Total Assets
$620
Total Liabili es and Equity
$620
Salinas Limited
Income Statement
For the Year Ended December 31, 2012
Sales
$240
Cost of Goods Sold
144
Gross Profit
96
Opera ng Expenses
Salaries
$ 44
Deprecia on
6
50
Income from Opera ons
46
Less: Interest
8
Income before Income Taxes
38
Less: Income Taxes
18
Net Income
$ 20

504
Financial Statement Analysis
Assume that 80% of sales are on credit, that the average of all balance sheet items is equal to the
year-end figure, that all preferred share dividends have been paid and the total annual preferred
dividend en tlement is $6, and that the number of common shares outstanding is 10.
Required: Calculate the following ra os and percentages
a. Current ra o
b. Return on total assets
c. Sales to total assets
d. Acid-test ra o
e. Times interest earned
f. Earnings per common share
g. Accounts receivable collec on period
h. Return on equity
EXERCISE 12–4
(LO2)
The following data are taken from the records of Cronkite Corp.:
2012
2011
Sales
$2,520
$1,440
Cost of Goods Sold
1,890
960
Gross Profit
630
480
Other Expenses
510
430
Net Income
$ 120
$ 50
Required: Perform horizontal analysis on the above date and interpret your results.
EXERCISE 12–5
(LO2)
Assume you are an accountant analysing Escalade Corpora on. Escalade has expanded its produc-
on facili es by 200% since 2010. Its income statements for the last three years are as follows:

Exercises
505
Escalade Corpora on
Compara ve Income Statements
For the Years Ending December 31
2012
2011
2010
Sales
$250
$150
$120
Cost of Goods Sold
190
100
60
Gross Profit
60
50
60
Other Expenses
35
34
35
Net Income
$ 25
$ 16
$ 25
Required:
a. Prepare a ver cal analysis of Escalade Corpora on’s income statement for the three years.
b. What inferences can be drawn from this analysis?
EXERCISE 12–6
(LO1)
The following informa on is taken from the par al balance sheet of Quail Produc ons Corp.
2018
2017
Current assets
Cash
$ 10
$ 15
Marketable investments
35
35
Accounts receivable
200
150
Inventory
600
400
Current liabili es
Accounts payable
500
400
Borrowings
245
180
Required:
a. Describe the purpose of and calculate the current ra o for each year.
b. Describe the purpose of and calculate the acid-test ra o for both years.
c. What observa ons can you make from a comparison of the two types of ra os?
EXERCISE 12–7
(LO1)
506
Financial Statement Analysis
The following informa on is taken from the records of Black Spruce Co. Ltd.:
2019
2018
2017
Sales
$252
$141
$120
Gross profit
63
48
54
Net income
12
5
15
Required: Analyse the gross profit and net profit ra os using the above data. Comment on any
trends that you observe.
EXERCISE 12–8
(LO1)
In the le -hand column, a series of independent transac ons is listed. In the right-hand column,
a series of ra os is listed.
Transac on
Ra o
Effect on ra o
Declared a cash dividend
Current ra o
Wrote-off an uncollec ble account
receivable
Accounts receivable collec on period
Purchased inventory on account
Acid-test ra o
Issued 10-year bonds to acquire
property, plant, and equipment
Return on total assets
Issued addi onal shares for cash
Debt to shareholders’ equity ra o
Declared a share dividend on
common shares
Earnings per share
Purchased supplies on account
Current ra o
Paid a current creditor in full
Acid-test ra o
Paid an account payable
Number of days of sales in inventory
Required: For each transac on indicate whether the ra o will increase (I), decrease (D), or remain
unchanged (No Change). Assume all ra os are greater than 1:1 before each transac on where
applicable.
EXERCISE 12–9
(LO1)
Consider the following financial statement data:

Exercises
507
Balance Sheet
Cash
$ 20
Accounts receivable
20
Merchandise inventory
40
Plant, at carrying amount
140
$220
Accounts payable
$ 20
Non-current borrowings
60
Common shares (8 shares issued)
80
Retained earnings
60
$220
Income Statement
Sales
$100
Cost of goods sold
50
Gross profit
50
Opera ng expenses
14
Income from opera ons
36
Less: Interest
6
Income before income taxes
30
Less: Income taxes
10
Net income
$ 20
Assume that the average of all balance sheet items is equal to the year-end figure and that all sales
are on credit.
Required:
a. Calculate the following ra os:
i. Return on total assets (assume interest has been paid)
ii. Return on shareholders’ equity
iii. Times interest earned ra o
iv. Earnings per share
v. Number of days of sales in inventory
vi. Accounts receivable collec on period
vii. Sales to total assets ra o
viii. Current ra o
ix. Acid-test ra o

508
Financial Statement Analysis
x. Debt to shareholders’ equity ra o.
b. Which of these ra os are measures of liquidity?
EXERCISE 12–10
(LO1)
Assume a company has the following financial informa on:
Cash and short-term investments
$
6
Prepaid expenses
-0-
Capital assets
90
Total liabili es
40
Shareholders’ equity
140
Sales
420
Credit sales
300
Current ra o
2.5:1
Acid-test ra o
1:1
Gross profit ra o
30%
Assume current assets consist of cash, short-term investments, accounts receivable, inventory,
and prepaid expenses, and that ending balances are the same as average balances for the year.
Required: Calculate
a. Current liabili es
b. Inventory
c. Accounts receivable collec on period
d. Number of days of sales in inventory
e. Revenue opera ng cycle
EXERCISE 12–11
(LO1)
A company began the month of May with $200,000 of current assets, a 2.5 to 1 current ra o, and
a 1.25 to 1 acid-test ra o. During the month, it completed the following transac ons:
Exercises
509
Effect on
Transac on
current ra o
i.
Bought $20,000 of merchandize on account (the company uses a
perpetual inventory system)
ii.
Sold for $10,000 cash, merchandize that cost $5,000
iii.
Collected a $2,500 account receivable
iv.
Paid a $10,000 account payable
v.
Wrote off a $1,500 bad debt against the allowance for doub ul accounts
vi.
Declared a $1 per-share cash dividend on the 10,000 outstanding
common shares
vii.
Paid the dividend declared above
viii.
Borrowed $10,000 from a bank by assuming a 60-day, 10-per cent loan
ix.
Borrowed $25,000 from a bank by placing a 10-year mortgage on the
plant
x.
Used the $25,000 proceeds of the mortgage to buy addi onal machinery
Required:
a. Indicate the effect on current ra o assuming each transac on is independent of the others:
Increase, Decrease, or No Change.
b. At the end of May, and taking all the above transac ons into account, what was the current
ra o and acid-test ra o?
Use the following format. The opening current ra o calcula on and effects of the first transac on
are provided:
Current ra o:
Bal
Bal
In thousands of dollars
May 1
i
ii
iii
iv
v
vi
vii
vii
ix
x
May 31
Current assets
x
200
+20
Current liabili es
y
80 +20
Current ra o
x/y
2.5
Acid-test ra o:
Bal
Bal
In thousands of dollars
May 1
i
ii
iii
iv
v
vi
vii
viii
ix
x
May 31
Quick assets
x
Current liabili es
y
Acid-test ra o
x/y

510
Financial Statement Analysis
Problems
PROBLEM 12–1
(LO1)
Belafonte Corpora on’s books were destroyed in a fire on April 20, 2011. The comptroller of the
corpora on can only remember a few odd pieces of informa on:
a. The current ra o was 3.75 to 1.
b. Sales for the year were $73,000.
c. Inventories were $20,000 and were equal to property, plant and equipment at carrying amount,
and also equal to bonds payable.
d. The accounts receivable collec on period was 40 days.
e. The bonds payable amount was 10 mes cash.
f. Total current assets were twice as much as common shares.
Required: Using this informa on, prepare Belafonte Corpora on’s balance sheet at April 30, 2011.
Assume balances at April 30, 2011 are the same as average balances for the year then ended, and
besides retained earnings, there are no accounts other than those men oned above.
PROBLEM 12–2
(LO1)
The incomplete balance sheet of Hook Limited is given below.

Problems
511
Hook Limited
Balance Sheet
At December 31, 2011
Assets
Current
Cash
$30,000
Accounts Receivable
?
Merchandise Inventory
?
$
?
Property, plant and equipment assets
?
Less: Accumulated Deprecia on
100,000
?
Total Assets
$
?
Liabili es
Current
Accounts Payable
$50,000
Accrued Liabili es
?
$120,000
Non-current
8% Bonds Payable
?
Equity
Common Shares
?
Retained Earnings
?
Total Liabili es and Equity
$
?
Addi onal informa on for 2011 year-end:
a. The amount of working capital is $150,000.
b. The issued value of the shares is $10 per share.
c. Market price per share is $15.
d. Price-earnings ra o is 3.
e. Income before payment of interest and income tax is $80,000.
f. The ra o of shareholder’s equity to total assets is 0.60 to 1.
g. Income tax expense equals $30,000.
h. The acid-test ra o is 1.5 to 1.
i. The mes interest earned ra o is 8 to1.
Required: Complete Hook Limited’s balance sheet.


Chapter 13
Proprietorships and Partnerships
Chapter
introduced the three forms of business organiza ons — corpora ons, proprietorships,
and partnerships. The corpora on has been the focus in Chapters
through
. This chapter will
expand on some of the basic accoun ng concepts as they apply to proprietorships and partner-
ships.
Chapter 13 Learning Objec ves
LO1 – Describe the characteris cs of a proprietorship, including how its financial statements
are different from those of a corpora on.
LO2 – Describe the characteris cs of a partnership including how its financial statements
are different from those of a corpora on.
Concept Self-Check
Use the following ques ons as a self-check while working through Chapter
.
1. What are some of the characteris cs of a proprietorship, that are different from those of a
corpora on?
2. What is the journal entry to record the investment of cash by the owner into a proprietor-
ship?
3. How are the closing entries for a proprietorship different than those recorded for a corpo-
ra on?
4. Why is there only one equity account on a sole proprietorship’s balance sheet and mul ple
accounts in the equity sec on of a corporate balance sheet?
5. What is mutual agency as it relates to a partnership?
6. How is a partnership different than a corpora on?
NOTE: The purpose of these ques ons is to prepare you for the concepts introduced in the chap-
ter. Your goal should be to answer each of these ques ons as you read through the chapter. If,
when you complete the chapter, you are unable to answer one or more the Concept Self-Check
ques ons, go back through the content to find the answer(s). Solu ons are not provided to these
ques ons.
513
514
Proprietorships and Partnerships
13.1 Proprietorships
LO1 – Describe
the
charac-
teris cs
of
a
proprietorship
including,
how
its
financial
statements
are
different
from those of a
corpora on.
As discussed in Chapter 1, a proprietorship is a business owned by one per-
son. It is not a separate legal en ty, which means that the business and
the owner are considered to be the same en ty. As a result, for example,
from an income tax perspec ve, the profits of a proprietorship are taxed
as part of the owner’s personal income tax return. Unlimited liability is an-
other characteris c of a proprietorship meaning that if the business could
not pay its debts, the owner would be responsible even if the business’s
debts were greater than the owner’s personal resources.
Inves ng in a Proprietorship
When the owners of a corpora on, known as shareholders, invest in the corpora on, shares are
issued. The shares represent how much of the corpora on is owned by each shareholder. In a
proprietorship, there is only one owner. When that owner invests in their business, the journal
entry is:
General Journal
Date
Account/Explana on
PR
Debit
Credit
Cash . . . . . . . . . . . . . . . . . . . . . . . . . . . . . . . . . .
XXX
Owner’s Capital. . . . . . . . . . . . . . . . . . . . .
XXX
To record the owner’s investment into
their business.
Distribu on of Income in a Proprietorship — Withdrawals
A corpora on distributes a por on of income earned to its owners, the shareholders, in the form
of dividends. In a proprietorship, the owner distributes a por on of the business’s income to
her/himself in the form of withdrawals. Typically, the owner will withdraw cash but they can
withdraw other assets as well. The journal entry to record a cash withdrawal is:
General Journal
Date
Account/Explana on
PR
Debit
Credit
Withdrawals . . . . . . . . . . . . . . . . . . . . . . . . . . .
XXX
Cash . . . . . . . . . . . . . . . . . . . . . . . . . . . . . . .
XXX
To record the owner’s withdrawal of cash.

13.1. Proprietorships
515
Closing Entries for a Proprietorship
The closing entries for a corpora on involved four steps:
Entry 1: Close the revenue accounts to the Income Summary account
This would be iden cal for a proprietorship.
Entry 2: Close the expense accounts to the Income Summary account
This would also be iden cal for a proprietorship.
Entry 3: Close the income summary to retained earnings
Instead of closing the balance in the income summary to retained earnings, a proprietorship would
close the income summary to the Owner’s Capital account.
Entry 4: Close dividends to retained earnings
The equivalent to dividends for a proprietorship is withdrawals. There is no Retained Earnings
account in a proprietorship. A corpora on separates investments made by the owners (share-
holders) into a Share Capital account while dividends and accumulated net incomes/losses are
recorded in retained earnings. In a proprietorship, all owner investments, withdrawals, and net
incomes/losses are maintained in the Owner’s Capital account. Therefore, the fourth closing entry
for a proprietorship closes withdrawals to this Owner’s Capital account.
Figure
compares the closing entries for a proprietorship and a corpora on.

516
Proprietorships and Partnerships
Proprietorship
Corpora on
Entry 1: Close the revenue accounts to the In-
come Summary account.
Revenues
XXX
Revenues
XXX
Income Summary
XXX
Income Summary
XXX
Entry 2: Close the expense accounts to the In-
come Summary account.
Income Summary
XXX
Income Summary
XXX
Expenses
XXX
Expenses
XXX
Entry 3: Close the Income Summary account
…to the Owner’s Capital account.
…to the Retained Earnings account.
Income Summary
XXX
Income Summary
XXX
Owner’s Capital
XXX
Retained Earnings
XXX
When there is a net income.
When there is a net income.
OR
OR
Owner’s Capital
XXX
Retained Earnings
XXX
Income Summary
XXX
Income Summary
XXX
When there is a net loss.
When there is a net loss.
Entry 4: Close
…withdrawals to the Owner’s Capital account.
…dividends to the Retained Earnings account.
Owner’s Capital
XXX
Retained Earnings
XXX
Withdrawals
XXX
Dividends
XXX
Figure 13.1: Comparing Closing Entries for a Proprietorship and Corpora on
An explora on is available on the Lyryx site. Log into your Lyryx course to run
.
Financial Statements
The financial statements for a proprietorship are much the same as for a corpora on with some
minor differences. As shown in Figure
, the income statements only differ in that the pro-
prietorship does not include income tax expense since its profits are taxed as part of the owner’s
personal income tax return.

13.1. Proprietorships
517
Proprietorship
Corpora on
ABC Consul ng
ABC Inc.
Income Statement
Income Statement
Year ended December 31, 2015
Year ended December 31, 2015
Revenues
$400
Revenues
$400
Opera ng expenses
180
Opera ng expenses
180
Income from opera ons
$220
Income from opera ons
$220
Other revenues and expenses
Interest revenue
$20
Interest revenue
$20
Loss on sale of equipment (5)
Loss on sale of equipment
(5)
15
15
Net income
$235
Income before tax
$235
Income tax expense
50
Net income
$185
Figure 13.2: Comparing the Income Statement for a Proprietorship and for a Corpora on
The statement of changes in equity for each of a proprietorship and corpora on includes the same
elements: beginning equity, addi onal investments by the owner(s), net income/loss, distribu on
of income to the owner(s), and the ending balance in equity. However, the statements are struc-
tured differently because in a proprietorship, all the equity items are combined in one account, the
Owner’s Capital account. In a corpora on, equity is divided between share capital and retained
earnings. These differences are illustrated in Figure
Proprietorship
Corpora on
ABC Consul ng
ABC Inc.
Statement of Changes in Equity
Statement of Changes in Equity
Year ended December 31, 2015
Year ended December 31, 2015
Share
Retained
Total
Owner’s capital, January 1, 2015
$12,000
Capital
Earnings
Equity
Add: Owner investment
$1,000
Balance, January 1, 2015
$9,000
$3,000
$12,000
Net income
235
1,235
Issuance of share capital
1,000
1,000
Total
$13,235
Net income/loss
185
185
Less: Withdrawals
150
Dividends
(150)
(150)
Owner’s capital, December 31, 2015
$13,085
Balance, December 31, 2015 $10,000
$3,035
$13,035
Figure 13.3: Comparing the Statement of Changes in Equity for a Proprietorship and for a Cor-
pora on
Although both statements are based on iden cal dollar amounts, no ce that the total equity at
December 31, 2015 for the proprietorship is $13,085 which is $50 more than the $13,035 shown
for the corpora on. The $50 difference is the income tax expense deducted on the corpora on’s
income tax.

518
Proprietorships and Partnerships
The balance sheet for each of a proprietorship and corpora on includes the same elements: as-
sets, liabili es, and equity. However, the equity sec on of the statement differs because in a
proprietorship, all the equity items are combined in one account, the owner’s capital account. In
a corpora on, equity is divided between share capital and retained earnings. These differences
are illustrated in Figure
.
Proprietorship
Corpora on
ABC Consul ng
ABC Inc.
Balance Sheet
Balance Sheet
December 31, 2015
December 31, 2015
Assets
Assets
Cash
$ 4,000
Cash
$ 3,950
Other assets
86,000
Other assets
86,000
Total assets
$90,000
Total assets
$89,950
Liabili es
$76,915
Liabili es
$76,915
Equity
Equity
Owner’s capital
13,085
Share capital
$10,000
Total liabili es and equity $90,000
Retained earnings
3,035
Total equity
13,035
Total liabili es and equity
$89,950
Figure 13.4: Comparing the Balance Sheet for a Proprietorship and for a Corpora on
The $50 difference between the proprietorship’s and corpora on’s balances in each of cash and
total equity is because the corpora on paid $50 income tax which the proprietorship is not sub-
ject to. The equity sec ons of the two balance sheets are different only in terms of the types of
accounts used.
An explora on is available on the Lyryx site. Log into your Lyryx course to run
13.2. Partnerships
519
13.2 Partnerships
LO2 – Describe
the
characteris-
cs of a partner-
ship,
including
how
its
finan-
cial
statements
are
different
from those of a
corpora on.
As discussed in Chapter
, a partnership is a business owned by more than
one person. Partners should have a partnership contract that details their
agreement on things such as each partner’s rights and du es, the shar-
ing of incomes/losses and withdrawals, as well as dispute and termina on
procedures. A partnership is not a separate legal en ty, which means that
the business and the partners are considered to be the same en ty. As a
result, for example, from an income tax perspec ve, each partner’s share
of the profits is taxed as part of that partner’s personal income tax return.
Unlimited liability is another characteris c of a partnership, meaning that
if the business could not pay its debts, the partners would be responsible
even if the business’s debts were greater than their personal resources.
The excep on to this would be the forma on of a limited liability partnership (LLP) that that is
permi ed for professionals such as lawyers and accountants. In an LLP, the general partner(s)
is/are responsible for the management of the partnership and assume(s) unlimited liability, while
the limited partners have limited liability but also limited roles in the partnership as specified in
the partnership agreement. Partnerships also have a limited life and are subject to mutual agency.
Mutual agency means that a partner can commit the partnership to any contract because each
partner is an authorized agent of the partnership. For example, one partner could sign a contract
to purchase merchandise that falls within the scope of the business’s opera ons.
Inves ng in a Partnership
Recall that when the owners of a corpora on, known as shareholders, invest in the corpora on,
shares are issued. Recall as well that in a proprietorship there is only one owner whose invest-
ments into the business are credited to their capital account. A partnership is similar to a pro-
prietorship in that each partner’s investment into the business is credited to an owner’s capital
account. The difference is that in a partnership there will be more than one owner’s capital ac-
count. For example, assume Doug Wharton, Lisa Bartwiz, and Tahanni Bu
started a partnership
called WBB Consul ng and invested cash of $20,000, $15,000, and $40,000, respec vely. The
journal entry to record the investment is:
General Journal
Date
Account/Explana on
PR
Debit
Credit
Cash . . . . . . . . . . . . . . . . . . . . . . . . . . . . . . . . . .
75,000
Wharton, Capital . . . . . . . . . . . . . . . . . . .
20,000
Bartwiz, Capital . . . . . . . . . . . . . . . . . . . . .
15,000
Bu , Capital . . . . . . . . . . . . . . . . . . . . . . .
40,000
To record each partner’s investment into
the business.
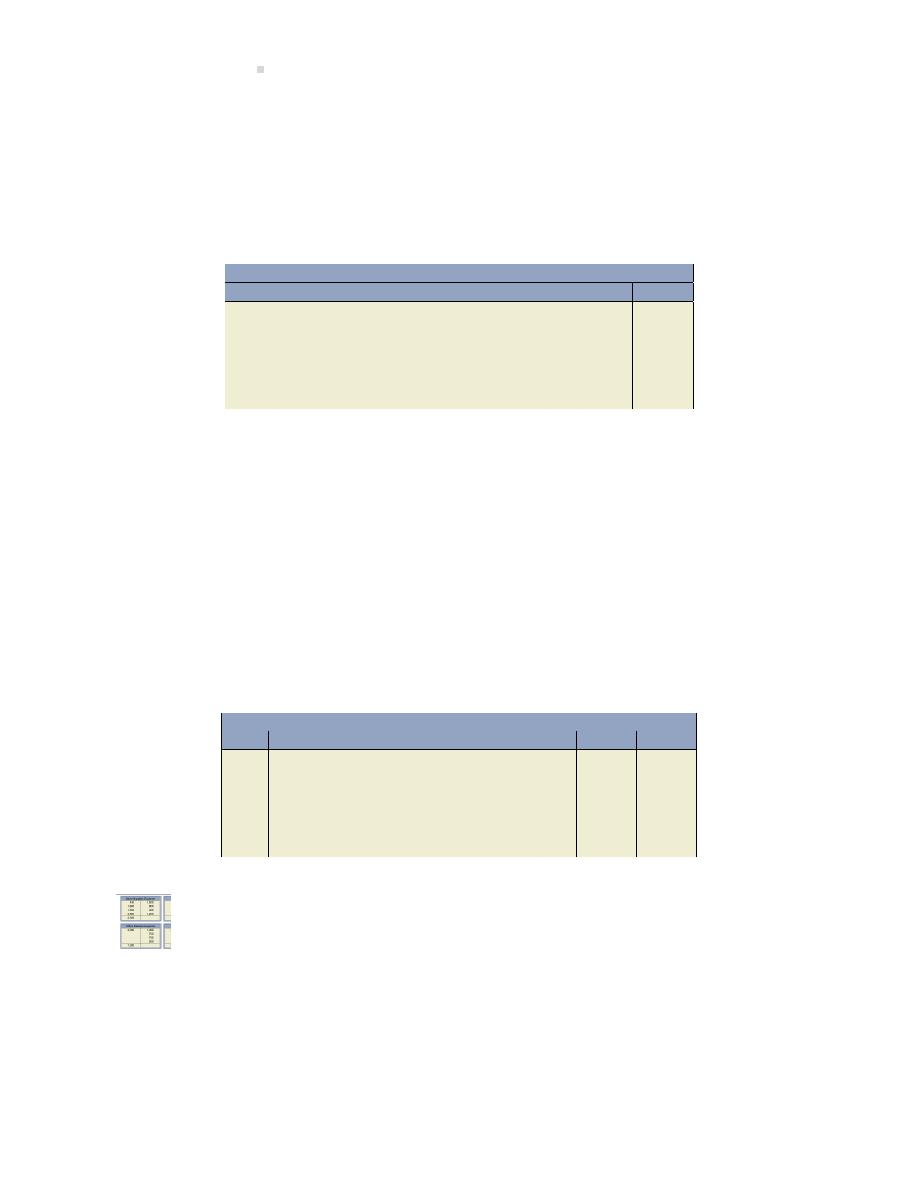
520
Proprietorships and Partnerships
Distribu on of Income in a Partnership — Withdrawals
Recall that a corpora on distributes a por on of income earned to its owners, the shareholders,
in the form of dividends. In a proprietorship and partnership, the owner/partners distribute a
por on of the income to themselves in the form of withdrawals. Assume Wharton, Bartwiz, and
Bu
each withdraw $5,000. The journal entry is:
General Journal
Date
Account/Explana on
PR
Debit
Credit
Wharton, Withdrawals . . . . . . . . . . . . . . . . .
5,000
Bartwiz, Withdrawals . . . . . . . . . . . . . . . . . . .
5,000
Bu , Withdrawals . . . . . . . . . . . . . . . . . . . . .
5,000
Cash . . . . . . . . . . . . . . . . . . . . . . . . . . . . . . .
15,000
To record the partners’ withdrawal of
cash.
Closing Entries for a Partnership
The closing entries for a partnership are much the same as those for a proprietorship except that
for a partnership there is more than one withdrawals account and more than one capital account.
The only complexity with the closing entries for a partnership is with closing the Income Summary
account to the capital accounts. The complexity stems from the partnership agreement which
details how incomes/losses are to be allocated. Let us review several scenarios.
Example 1: Assume WBB Consul ng earned $60,000 during the year and the partnership agree-
ment s pulates that incomes/losses are to be allocated equally. The journal entry to close the
income summary to the partners’ capital accounts would be:
General Journal
Date
Account/Explana on
PR
Debit
Credit
Income Summary . . . . . . . . . . . . . . . . . . . . . .
60,000
Wharton, Capital . . . . . . . . . . . . . . . . . . .
20,000
Bartwiz, Capital . . . . . . . . . . . . . . . . . . . . .
20,000
Bu , Capital . . . . . . . . . . . . . . . . . . . . . . .
20,000
To close the income summary based on
equal alloca on.
An explora on is available on the Lyryx site. Log into your Lyryx course to run
Alloca ng Income - No Partnership Agreement
Example 2: Assume WBB Consul ng had a net loss of $70,000 during the year and the partner-
ship agreement s pulates that incomes/losses are to be allocated on a frac onal basis of 2:1:4,
respec vely. The journal entry to close the income summary to the partners’ capital accounts
would be:
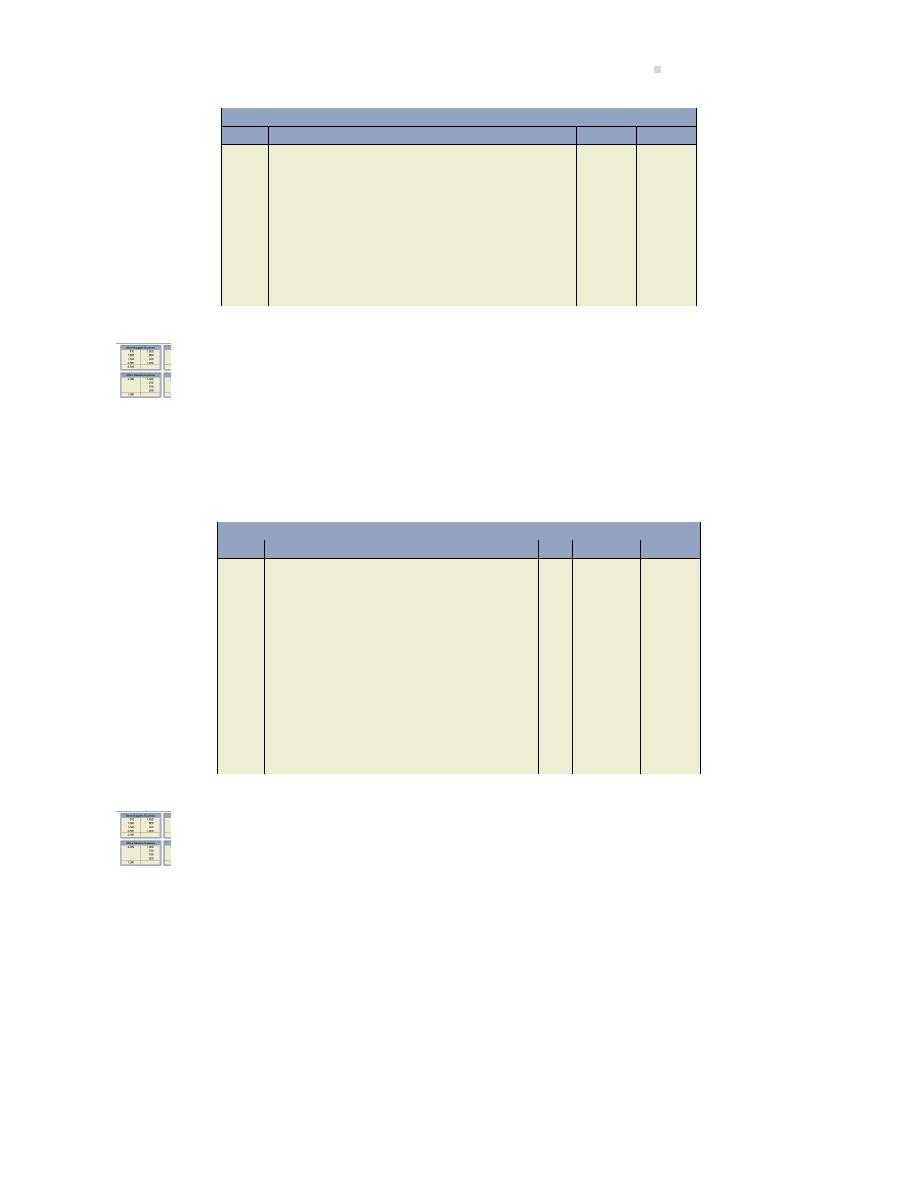
13.2. Partnerships
521
General Journal
Date
Account/Explana on
PR
Debit
Credit
Wharton, Capital . . . . . . . . . . . . . . . . . . . . . . .
20,000
Bartwiz, Capital . . . . . . . . . . . . . . . . . . . . . . . .
10,000
Bu , Capital . . . . . . . . . . . . . . . . . . . . . . . . . .
40,000
Income Summary . . . . . . . . . . . . . . . . . . .
70,000
To close the income summary based on
2:1:4 frac onal alloca on; calcula ons:
2/(2+1+4) x 70,000 = 20,000; 1/(2+1+4)
x 70,000 = 10,000; 4/(2+1+4) x 70,000 =
40,000.
An explora on is available on the Lyryx site. Log into your Lyryx course to run
Alloca ng Income/Loss – Frac onal Basis
.
Example 3: Assume WBB Consul ng had a net income of $100,000 during the year and the part-
nership agreement s pulates that incomes/losses are to be allocated on the ra o of capital invest-
ments. The journal entry to close the income summary to the partners’ capital accounts would
be:
General Journal
Date
Account/Explana on
PR
Debit
Credit
Income Summary . . . . . . . . . . . . . . . . . . . . . .
100,000
Wharton, Capital . . . . . . . . . . . . . . . . . . .
26,667
Bartwiz, Capital . . . . . . . . . . . . . . . . . . . . .
20,000
Bu , Capital . . . . . . . . . . . . . . . . . . . . . . .
53,333
To close the income summary with the al-
loca on based on a ra o of capital invest-
ments; calcula ons: (20,000/75,000) x
100,000 = 26,667 (rounded to the nearest
whole dollar); (15,000/75,000) x 100,000
= 20,000; (40,000/75,000 x 100,000 =
53,333 (rounded to the nearest whole dol-
lar).
An explora on is available on the Lyryx site. Log into your Lyryx course to run
Alloca ng Income – Ra o of Investments
.
Example 4: Assume WBB Consul ng had a net income of $60,000 during the year and the part-
nership agreement s pulates that incomes/losses are to be allocated based on salaries of $70,000
to Wharton; $20,000 to Bartwiz; zero to Bu ; and the remainder equally. The journal entry to
close the income summary to the partners’ capital accounts would be:
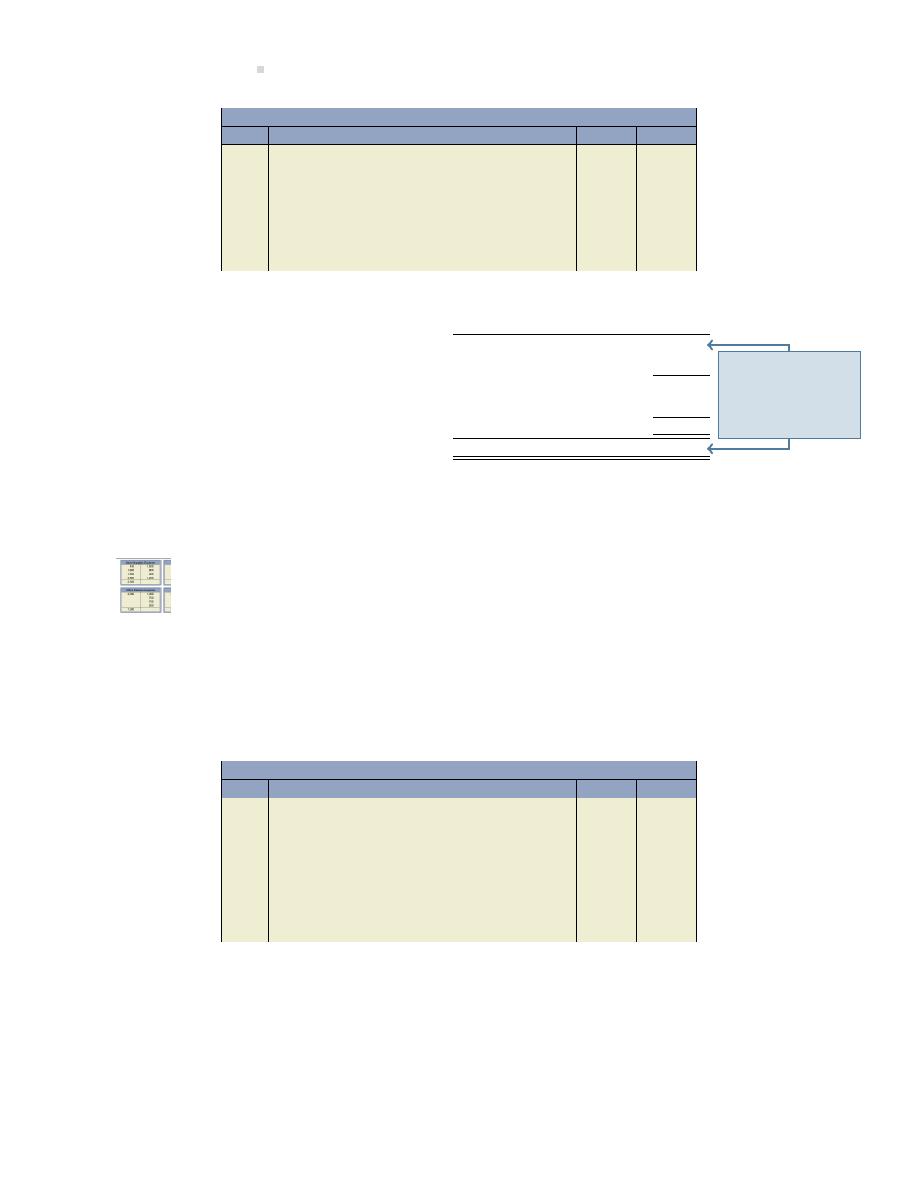
522
Proprietorships and Partnerships
General Journal
Date
Account/Explana on
PR
Debit
Credit
Income Summary . . . . . . . . . . . . . . . . . . . . . .
60,000
Bu , Capital . . . . . . . . . . . . . . . . . . . . . . . . . .
10,000
Wharton, Capital . . . . . . . . . . . . . . . . . . .
60,000
Bartwiz, Capital . . . . . . . . . . . . . . . . . . . . .
10,000
To close the income summary with the al-
loca on based on salaries and the remain-
der allocated equally; calcula ons:
Wharton Bartwiz
Bu
Total
Net income
60,000
Salaries:
70,000
20,000
0 -90,000
Remainder to be allocated:
-30,000
-30,000x1/3
-10,000 -10,000 -10,000
30,000
Balance of net income to be allocated
0
Total to be allocated to each partner
60,000
10,000 -10,000
60,000
The sum of the to-
tals must reconcile
(be equal to) the
net income/loss
being allocated.
No ce in Example 4 that Bu
is receiving a nega ve alloca on which results in a debit to her
Capital account.
An explora on is available on the Lyryx site. Log into your Lyryx course to run
Alloca ng Income – Remainder to be Allocated
.
Example 5: Assume WBB Consul ng had a net income of $90,000 during the year and the partner-
ship agreement s pulates that incomes/losses are to be allocated based on a combina on of: (a)
20% interest of each partner’s beginning-of-year capital balance; (b) salaries of $70,000 to Whar-
ton, $20,000 to Bartwiz, $15,000 to Bu ; and (c) the remainder equally. The journal entry to close
the income summary to the partners’ capital accounts would be:
General Journal
Date
Account/Explana on
PR
Debit
Credit
Income Summary . . . . . . . . . . . . . . . . . . . . . .
90,000
Wharton, Capital . . . . . . . . . . . . . . . . . . .
64,000
Bartwiz, Capital . . . . . . . . . . . . . . . . . . . . .
13,000
Bu , Capital . . . . . . . . . . . . . . . . . . . . . . .
13,000
To close the income summary with the al-
loca on based on a combina on of inter-
est and salaries with the remainder allo-
cated equally; calcula ons:
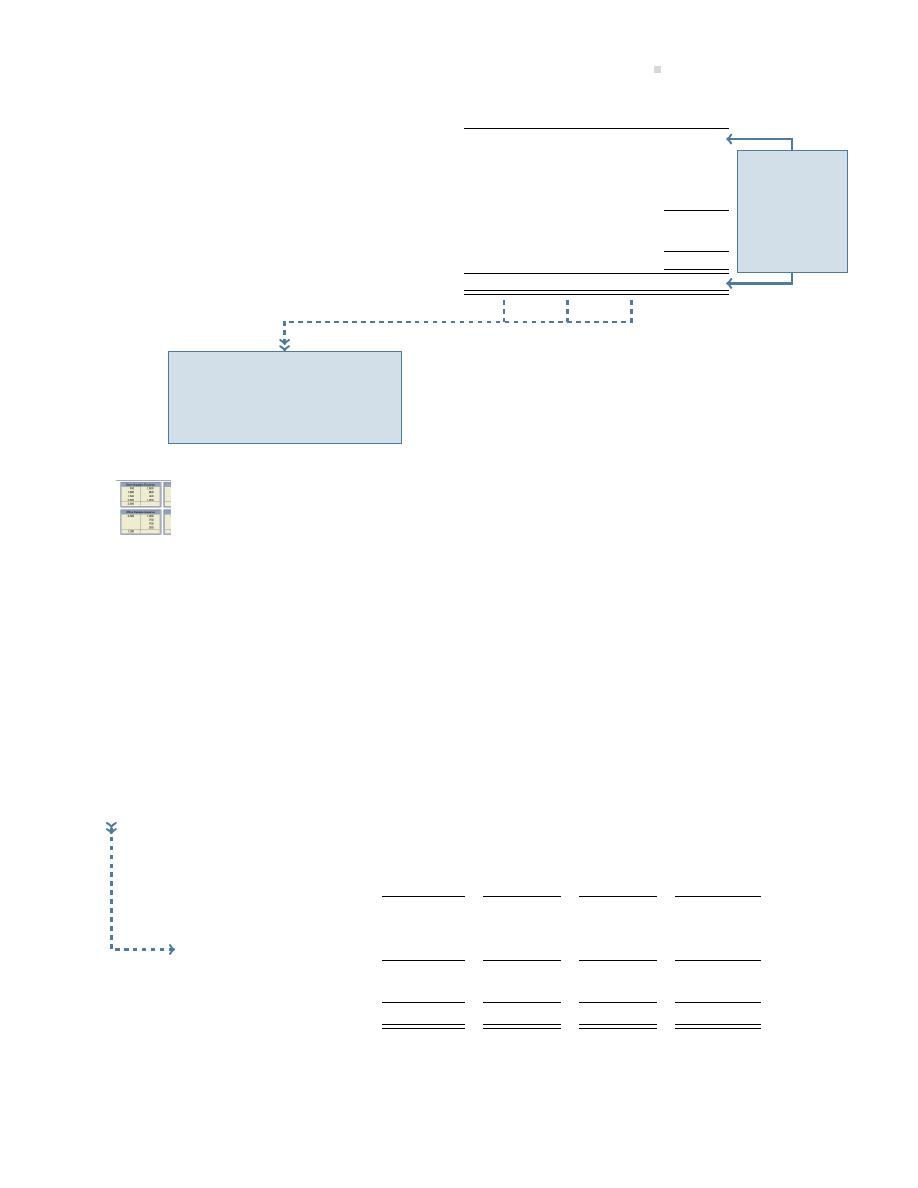
13.2. Partnerships
523
Wharton Bartwiz
Bu
Total
Net income
90,000
Interest:
20%x20,000; 20%x15,000; 20%x40,000
4,000
3,000
8,000
-15,000
Salaries:
70,000
20,000
15,000 -105,000
Remainder to be allocated:
-30,000
-30,000x1/3
-10,000 -10,000 -10,000
30,000
Balance of net income to be allocated
0
Total to be allocated to each partner
64,000
13,000
13,000
90,000
The sum of
the totals
must recon-
cile (be equal
to) the net
income/loss
being allo-
cated.
The total income allocated to
each partner is carried into
the net income line of the
Statement of Changes in Eq-
uity (as shown next).
An explora on is available on the Lyryx site. Log into your Lyryx course to run
Alloca ng Incomes/Losses – Interest, Salaries, Remainder
.
Financial Statements
The income statement for a partnership is iden cal to that for a proprietorship. The statement
of changes in equity for a partnership is similar to a proprietorship’s except that there is a Capital
account and Withdrawals account for each of the partners.
Assume that on January 1, 2015, the first year of opera ons for WBB Consul ng, the partners,
Wharton, Bartwiz, and Bu , invested $20,000, $15,000, and $40,000, respec vely. During 2015
they each withdrew $5,000. The statement of changes in equity would appear as illustrated in
Figure
given a net income for the year of $90,000 allocated as shown in Example 5 previously.
WBB Consul ng
Statement of Changes in Equity
Year Ended December 31, 2015
Wharton
Bartwiz
Bu
Totals
Capital, January 1, 2015
$
0
$
0
$
0
$
0
Add: Investments by partners
20,000
15,000
40,000
75,000
Net income
64,000
13,000
13,000
90,000
Subtotals
$84,000
$28,000
$53,000
$165,000
Less: Withdrawals by partners
5,000
5,000
5,000
15,000
Capital, December 31, 2015
$79,000
$23,000
$48,000
$150,000
Figure 13.5: Statement of Changes in Equity for a Partnership
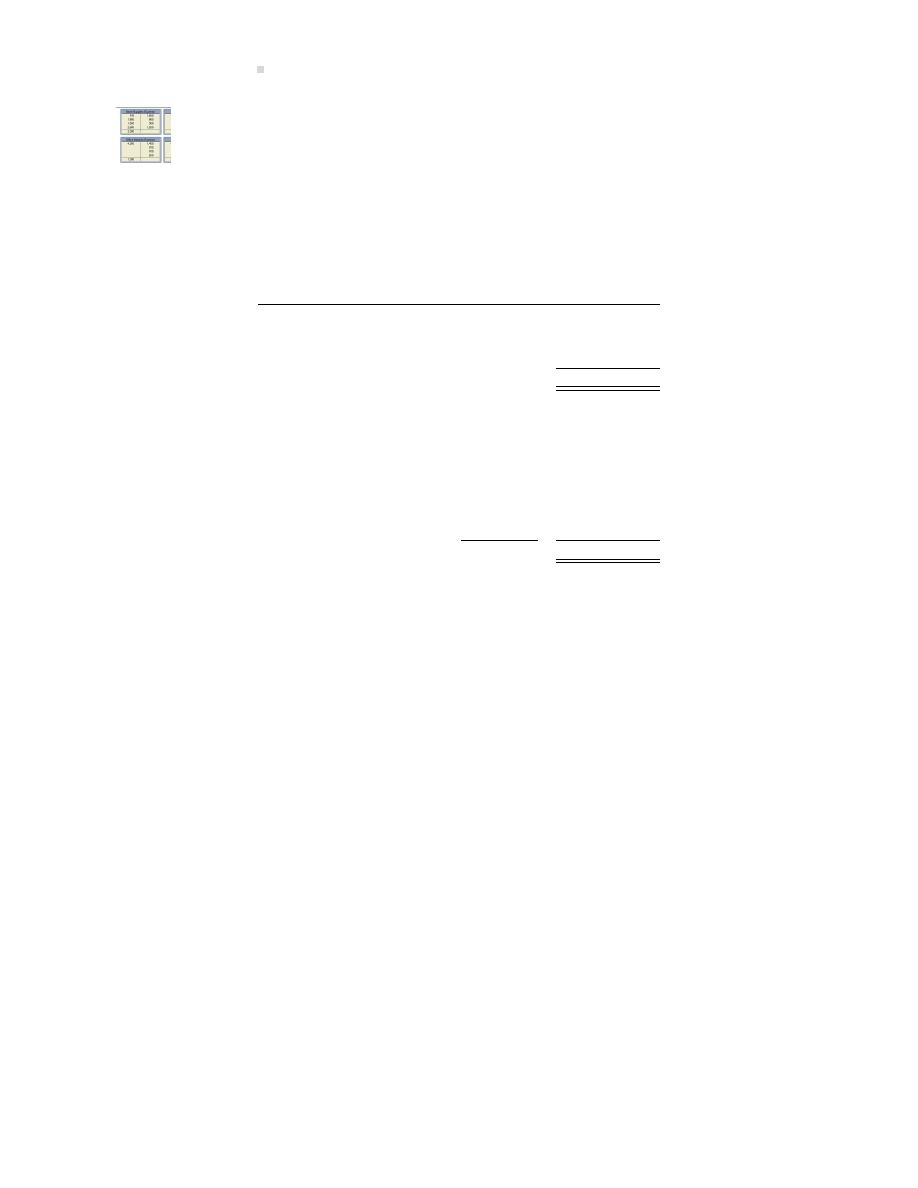
524
Proprietorships and Partnerships
An explora on is available on the Lyryx site. Log into your Lyryx course to run
Alloca ng Income – Remainder to be Allocated
.
In the equity sec on on the balance sheet there will be more than one owner’s capital account as
shown in Figure
WBB Consul ng
Balance Sheet
December 31, 2015
Assets
Cash
$
35,000
Other assets
143,000
Total assets
$
178,000
Liabili es
$
28,000
Equity
Wharton, capital
$79,000
Bartwiz, capital
23,000
Bu , capital
48,000
150,000
Total liabili es and equity
$
178,000
Figure 13.6: Balance Sheet for a Partnership

Summary of Chapter
Learning Objec ves
525
Summary of Chapter 13 Learning Objec ves
LO1 – Describe the characteris cs of a proprietorship, including how its financial
statements are different from those of a corpora on.
A proprietorship is a business owned by one person. It is not a separate legal en ty, which means
that the business and the owner are considered to be the same en ty. The profits of a propri-
etorship are taxed as part of the owner’s personal income tax return. Unlimited liability is an-
other characteris c of a proprietorship meaning that if the business could not pay its debts, the
owner would be responsible even if the business’s debts were greater than the owner’s personal
resources. Owner investments, owner withdrawals, and net incomes/losses are closed to one
permanent account: the Owner’s Capital account.
LO2 – Describe the characteris cs of a partnership, including how its financial
statements are different from those of a corpora on.
A partnership is a business owned by more than one person. Partners should have a partnership
contract that details their agreement on things such as each partner’s rights and du es, the sharing
of incomes/losses and withdrawals, as well as dispute and termina on procedures. A partnership
is not a separate legal en ty, which means that the business and the partners are considered to
be the same en ty. Each partner’s share of the profits is taxed as part of that partner’s personal
income tax return. Unlimited liability is another characteris c of a partnership meaning that if
the business could not pay its debts, the partners would be responsible even if the business’s
debts were greater than the partners’ personal resources. The excep on to this would be the for-
ma on of a limited liability partnership (LLP) that is permi ed for professionals such as lawyers
and accountants. In an LLP, the general partner(s) is/are responsible for the management of the
partnership and assume(s) unlimited liability while the limited partners have limited liability but
also limited roles in the partnership as specified in the partnership agreement. Partnerships also
have a limited life and are subject to mutual agency. Mutual agency means that a partner can
commit the partnership to any contract because each partner is an authorized agent of the part-
nership. The closing entries for a partnership are the same as those for a proprietorship except
there is more than one capital account and more than one withdrawals account. The closing of
the income summary to each partner’s capital account is based on the alloca on details in the
partnership agreement.
Discussion Ques ons
1. Define a partnership and briefly explain five characteris cs.
2. What are the advantages and disadvantages of partnerships?

526
Proprietorships and Partnerships
3. How does accoun ng for a proprietorship, partnership, and corpora on differ?
4. How can partnership profits and losses be divided among partners?
5. Why are salary and interest bases used as a means to allocate profits and losses in a part-
nership?
6. How are partners’ capital balances disclosed in the balance sheet?
Exercises
EXERCISE 13–1
(LO2)
You are given the following data for the partnership of B. White and C. Green.
B. White and C. Green Partnership
Trial Balance
December 31, 2015
Cash
$41,000
Accounts Receivable
68,400
Merchandise Inventory
27,000
Accounts Payable
$45,800
B. White, Capital
30,000
B. White, Withdrawals
7,000
C. Green, Capital
20,000
C. Green, Withdrawals
5,000
Sales
322,000
Cost of Goods Sold
160,500
Rent Expense
36,000
Adver sing Expense
27,200
Delivery Expense
9,600
Office Expense
12,800
U li es Expense
23,300
Totals
$417,800
$417,800
Each partner contributed $10,000 cash during 2015. The partners share profits and losses equally.
Required:
a. Prepare an income statement for the year.

Exercises
527
b. Prepare a statement of changes in equity for the year in the following format:
Statement of Changes in Equity
For the Year Ended December 31, 2015
White
Green
Total
Opening Balance
$
$
$
Add: Investments during 2015
Net Income
$
$
$
Deduct: Withdrawals
Ending Balance
$
$
$
c. Prepare a balance sheet at December 31, 2015.
d. Prepare closing entries at year end.
EXERCISE 13–2
(LO1,2)
Refer to EXERCISE
Required: Prepare the equivalent statement of changes in equity at December 31, 2015 assuming
that the partnership is instead:
a. A proprietorship owned by B. White called White’s (Combine C. Green balances and trans-
ac ons with those of B. White.)
b. A corpora on named BW and CG Ltd. with 100 common shares issued for $1 per share to
each of B. White and C. Green. Assume opening retained earnings equal $29,800 and that
20,000 common shares were issued during 2015 for $20,000. Assume the net income of
$52,600 is net of income tax.
EXERCISE 13–3
(LO2)
Refer to EXERCISE
Required: Prepare the journal entry to allocate net income to each of the partners assuming the
following unrelated scenarios:
a. Net income is allocated in a fixed ra o of 5:3 (White: Green).

528
Proprietorships and Partnerships
b. Net income is allocated by first paying each partner 10% interest on opening capital bal-
ances, then alloca ng salaries of $30,000 for White and $10,000 for Green, then spli ng
the remaining unallocated net income in a fixed ra o of 3:2 (White:Green).
EXERCISE 13–4
(LO2)
Walsh and Abraham began a partnership by inves ng $320,000 and $400,000, respec vely. They
agreed to share net incomes/losses by allowing a 10% interest alloca on their investments, an
annual salary alloca on of $75,000 to Walsh and $150,000 to Abraham, and the balance 1:3.
Required: Prepare the journal entry to allocate net income to each of the partners assuming the
following unrelated scenarios:
a. Net income for the first year was $210,000.
b. A net loss for the first year was realized in the amount of $95,000.
EXERCISE 13–5
(LO1)
You are given the following data for the proprietorship of R. Black.
R. Black Proprietorship
Trial Balance
December 31, 2018
Debit
Credit
Cash
$ 10,000
Accounts receivable
20,000
Merchandise inventory
30,000
Accounts payable
$ 25,000
R. Black, capital
5,000
R. Black, withdrawals
7,000
Sales
166,000
Cost of goods sold
100,000
Rent expense
24,000
Income taxes expense
5,000
Totals
$196,000
$196,000
Black contributed $5,000 capital during the year.
Required:

Exercises
529
a. Prepare an income statement for the year.
b. Prepare a statement of proprietor’s capital for the year in the following format:
R. Black Proprietorship
Statement of Proprietor’s Capital
For the Year Ended December 31, 2018
Balance at Jan. 1, 2018
$
Contribu ons
Net income
Withdrawals
Balance at Dec 31, 2018
$
c. Prepare a balance sheet at December 31, 2018.
d. Prepare closing entries at year-end.
EXERCISE 13–6
(LO1)
Refer to EXERCISE
. Assume that the proprietorship is instead a corpora on named R. Black
Ltd., with 1,000 common shares issued on January 1, 2018 for a stated value of $5 per share.
Assume there are no opening retained earnings and consider withdrawals to be dividends. Assume
income taxes expense applies to corporate earnings.
Required:
a. Prepare an income statement for the year ended December 31, 2018.
b. Prepare a statement of changes in equity.
c. Prepare a balance sheet at December 31, 2018.
d. Prepare closing entries at year-end.
EXERCISE 13–7
(LO2)
Assume the following informa on just prior to the admission of new partner I:

530
Proprietorships and Partnerships
Assets
Liabili es
Cash
$ 5,000
Accounts payable
$ 8,000
Accounts receivable
43,000
Partners’ Capital
G, Capital
$30,000
H, Capital
10,000
40,000
$48,000
$48,000
Required: Prepare journal entries to record the following unrelated scenarios:
a. New partner I purchases partners G’s partnership interest for $40,000.
b. New partner I receives a cash bonus of $2,000 and a one-tenth ownership share, allocated
equally from the partnership interests of G and H.
c. New partner I contributes land with a fair value of $100,000. Rela ve ownership interests
a er this transac on are:
Partner
Ownership interest
G
20%
H
5%
I
75%
100%
EXERCISE 13–8
(LO2)
Assume the following informa on just prior to the withdrawal of Partner X:
Assets
Liabili es
Cash
$20,000
Accounts payable
$ 5,000
Inventory
50,000
Partners’ Capital
X, Capital
$10,000
Y, Capital
20,000
Z, Capital
35,000
65,000
$70,000
$70,000
Required: Prepare journal entries to record the following unrelated scenarios:
a. Partner X sells his interest to new partner T for $25,000.

Problems
531
b. Partner X sells his interest to partner Y for $30,000.
c. Partner X sells his interest and is paid a share of partnership net assets as follows:
Cash
$ 5,000
Inventory
5,000
Accounts payable
(2,000)
$ 8,000
Partner Y receives a 60% share of the partnership interest of X. Partner Z receives 40%.
EXERCISE 13–9
(LO2)
Smith, Jones, and Black are partners, sharing profits equally. They decide to admit Gray for an
equal partnership (25%). The balances of the partners’ capital accounts are:
Smith, capital
$ 50,000
Jones, capital
40,000
Black, capital
10,000
$100,000
Required: Prepare journal entries to record admission of Gray, using the bonus method:
a. assuming the bonus is paid to the new partner; Gray invests $5,000 cash;
b. assuming the bonus is paid to exis ng partners; Gray invests $60,000 cash; the remaining
partners benefit equally from the bonus.
Problems
PROBLEM 13–1
(LO2)
On January 1, 2015, Bog, Cog, and Fog had capital balances of $60,000, $100,000, and $20,000
respec vely in their partnership. In 2015 the partnership reported net income of $40,000. None
of the partners withdrew any assets in 2013. The partnership agreed to share profits and losses
as follows:

532
Proprietorships and Partnerships
a. A monthly salary allowance of $2,000, $2,500, and $4,000 to Bog, Cog and Fog respec vely.
b. An annual interest allowance of 10 per cent to each partner based on her capital balance at the
beginning of the year.
c. Any remaining balance to be shared in a 5:3:2 ra o (Bog:Cog:Fog).
Required:
1. Prepare a schedule to allocate the 2015 net income to partners.
2. Assume all the income statement accounts for 2015 have been closed to the income sum-
mary account. Prepare the entry to record the division of the 2015 net income.

Solu ons To Discussion Ques ons
Chapter 1 Solu ons
1. Generally accepted accoun ng principles (GAAP) are a set of principles and assump ons
that guide the prepara on of financial statements, and that have gained wide-spread ac-
ceptance among users and prac
oners.
2. The revenue recogni on principle assumes that revenue is earned by the en ty at the me
when a service is provided or when a sale is made, not necessarily when cash is received.
3. The matching concept states that revenue is recognized in the me period when goods and
services are provided and that the assets of the en ty that have been used up during the
me period (expenses) must be matched with the asset inflows (revenues) during the same
period.
4. Accoun ng informa on should be comparable, verifiable, mely and understandable. Ac-
coun ng informa on should only be disclosed if it is material – that is, of sufficient size or
importance to influence the judgement of a reasonably knowledgeable user. Accoun ng in-
forma on should also be disclosed in such a manner that the benefits of doing so outweigh
the costs.
5. An asset is anything of value that is owned by the en ty. Assets are economic resources
controlled by an en ty. They have some future value to the en ty, usually for genera ng
revenue.
6. A liability is an obliga on to pay an asset or to provide services or goods in the future. Un l
the obliga ons are paid, creditors have claims against the assets of the en ty.
Equity represents the amount of assets owing to the owners of the en ty. The total assets
of an en ty belong either to the shareholders or to the creditors.
7. The exchange of assets or obliga ons by a business en ty, expressed in monetary terms like
dollars, is called a financial transac on. The exchange of cash for land or a building is an
example of such a transac on.
8. The three forms of business organiza on are corpora ons, sole proprietorships, and part-
nerships.
9. A business en ty is a unit of accountability that exists independently from other units. A
set of accoun ng records is kept for each unit or en ty. The en ty exists separately from
its owners. This concept is important because it keeps separate all the various ac vi es
533

534
Solu ons To Discussion Ques ons
in which the owner is involved; lumping all the ac vi es together would not yield useful
informa on for keeping track of the financial performance each financial unit.
10. Financial statements evaluate the performance of an en ty and measure its progress. Fi-
nancial informa on is collected, then summarized and reported in the financial statements
(balance sheet, income statement, statement of cash flows, and statement of changes in
equity).
11. The date line on the income statement, statement of changes in equity, and statement of
cash flows represents a period of me. The income statement details the revenues and
expenses that occurred over a given period of me. The statement of changes in equity
shows how equity changed over a given period of me. The statement of cash flows shows
how the balance in cash changed over a given period of me. The date line on the balance
sheet is a point in me because each account listed on the balance sheet iden fies the
account balance on a specific date.
12. The purpose of the income statement is to communicate the inflow of assets, in the form
of revenues, and the ou low or consump on of assets, in the form of expenses, over a
period of me. Total inflows greater than total ou lows creates net income or profit, which
is reported on the Income statement and in retained earnings in the equity sec on of the
balance sheet. The purpose of the balance sheet is to communicate what the en ty owns (its
assets), what the en ty owes (its liabili es), and the difference between assets and liabili es
(its equity) at a point in me.
If revenue is recorded on the income statement, there is usually a corresponding increase in
assets on the balance sheet. Similarly, if expenses are recorded on the income statement,
there is generally a decrease in assets or increase of liabili es on the balance sheet.
13. Revenue is an increase in an en ty’s assets or a decrease in liabili es in return for services
performed or goods sold, expressed in monetary units like dollars. An expense is an asset
belonging to the en ty that is used up or obliga ons incurred in selling goods or performing
services.
14. Net income is the difference between revenues and expenses. It communicates whether
the ac vi es of the en ty are being conducted profitably. Thus it is one measure of the
success of the en ty. Net income is one of the criteria used to determine the amount of
dividends to be declared.
15. The statement of changes in equity shows why share capital and retained earnings have
changed over a specified period of me – for instance, when shares are issued or net income
is earned. The statement of cash flows explains to the users of the financial statements the
en ty’s sources (inflows) and the uses (ou lows) of cash over a specified period of me.
16. Financial statements are prepared at regular intervals to keep a number of interested groups
informed about the financial performance of an en ty. The ming is determined in response
to the needs of management in running the en ty or of outside par es, such as bankers
to aid in gran ng loans to the en ty, shareholders, or others interested in evalua ng the

Chapter 2 Solu ons
535
progress of the en ty. They are generally used as a means to inform inves ng and lending
decisions.
17. The accoun ng equa on has the following form:
ASSETS
=
LIABILITIES
+
EQUITY
(economic resources
(creditors’ claims to assets)
(owners’ claims to assets –
owned by an en ty)
residual claims)
The en ty has assets, which are the resources it owns. The total assets owned by an en ty
must always equal the total claims of creditors and owners, who have the residual claims.
A company’s accoun ng equa on is expanded to include major categories of the balance
sheet, like cash and share capital. An expanded form of the accoun ng equa on could be
as follows:
ASSETS
=
LIABILITIES
+
EQUITY
Cash+Accounts Receivable
Accounts Payable
Share Capital
+
Equipment+Truck
+
Retained Earnings
18. The double entry accoun ng system reflects the fact that each financial transac on affects at
least two items in the accoun ng equa on, in order to maintain the equality of the equa on.
For example,
a. A truck is sold for cash: The asset truck decreases and the asset cash increases.
b. An obliga on is paid: The liability accounts payable decreases and the asset cash de-
creases.
c. An account is collected: The asset cash increases and the asset accounts receivable
decreases.
In this way, the equa on always remains in balance a er each transac on is recorded.
19. A year-end is the last day of the fiscal year of the en ty. The income statement, statement of
cash flows, and statement of changes in equity reflect financial transla ons for the year up to
this date. The balance sheet reflects the financial posi on of the en ty at the year-end date.
Interim financial statements may be prepared more frequently, say quarterly or monthly;
these are prepared for each en ty only if required by certain users, usually shareholders of
large corpora ons with many shareholders. Year-end financial statements must be prepared
for all en
es.
20. A fiscal year refers to a 12-month accoun ng period and that may not coincide with the
calendar year. A company whose fiscal year-end coincides with the calendar year has a
December 31 year-end.
Chapter 2 Solu ons
1. The use of a transac ons worksheet is imprac cal in actual prac ce because the record

536
Solu ons To Discussion Ques ons
keeping and the calcula on of totals becomes convoluted. This method is therefore not
very efficient or convenient, especially for a business with a high volume of transac ons.
2. An account is an accoun ng record designed to classify and accumulate the dollar effect of
financial transac ons. In a simplified account called a T-account, the term “debit” is used to
describe the le side of the account, while the term “credit” refers to the right side.
3. The associa on of “good” and “bad” or “increase” and “decrease” with credits and debits
is not a valid associa on. To an accountant, “debit” means only “place an amount of the
le side of an account” and “credit” means only “place an amount on the right side of an
account.”
4. A debit, which is always on the le side, records an increase in assets and expenses. A credit,
which is always on the right side, records a decrease in assets and expenses. For example,
a. If an asset like a truck is purchased for cash, the asset account “Truck” is debited and
the Cash account is credited.
b. If rent expense is incurred and paid with cash, the account “Rent Expense” is debited.
The Cash account is credited.
5. A debit, which is always on the le side, records a decrease in liabili es, equity, and rev-
enue. A credit, which is always on the right side, records an increase in liabili es, equity,
and revenue. For example,
a. A cash sale is made. Cash is debited, Sales is credited.
b. We incur an expense, so we debit the expense account and credit a liability account
like Accounts Payable.
c. We issue some share capital for cash. The general ledger account Share Capital is cred-
ited and Cash is debited.
6.
Assets, Expenses
Liabili es, Equity, Revenues
Increases are debited.
Increases are credited.
Decreases are credited. Decreases are debited.
7. A trial balance is a list of each account contained in the general ledger of an en ty, together
with its individual debit or credit balance. It is prepared in order to establish the equality of
debits with credits before the prepara on of the financial statements
8. A trial balance is used to prepare the financial statements. It shows the totals of each rev-
enue and expense account that will appear on the income statement and the asset, liability,
and equity balances that will appear on the balance sheet.
9. A general journal is a chronological record of an en ty’s financial transac ons. It is o en
called a book of original entry because each transac on is recorded in the general journal
first before it is posted to the en ty’s accounts.

Chapter 3 Solu ons
537
10. The posi oning of a debit-credit entry in the journal is similar in some respects to program-
ming methods. In the following entry,
General Journal
Date
Account/Explana on
PR
Debit
Credit
Dec. 1
Accounts Receivable . . . . . . . . . . . . . . . . . . .
XX
Sales . . . . . . . . . . . . . . . . . . . . . . . . . . . . . .
XXX
To record a sale on account.
The posi ons represent the instruc ons “Post $XX to the debit side of the Accounts Receiv-
able account” (thus increasing the accounts receivable) and “Post $XXX to the credit side of
the Sales account” (thus increasing sales).
11. A general ledger is a book that contains the separate asset, liability, equity, revenue, and
expense accounts of an en ty. It is o en referred to as a book of final entry and it is prepared
so that the balance of each account can be found easily at any me.
12. A chart of accounts is a list of account names and numbers used in the general ledger, nor-
mally listed in the order of presenta on on the financial statements. For example, accounts
that appear on the balance sheet or on the income statement are grouped together. This
facilitates the prepara on of the financial statements.
13. The steps in the accoun ng cycle involve analyzing transac ons, journalizing them in the
general journal, pos ng from the general journal into the general ledger, preparing the trial
balance, and genera ng financial statements are steps followed each accoun ng period.
These steps form the core of the accoun ng cycle. Addi onal steps involved in the account-
ing cycle will be introduced in Chapter
Chapter 3 Solu ons
1. The sequence of financial transac ons that occurs con nuously during an accoun ng me
period is called the opera ng cycle. Opera ons begin with some cash on hand. The cash
is used to purchase supplies and pay expenses while revenue is being generated. When
revenue is earned, cash is collected, beginning the cycle over again. While some transac ons
are being completed, others are only beginning.
2. No, the opera ng cycle does not have to be complete before income can be measured.
Revenue can be recorded as earned when the product is sold or the service performed re-
gardless of whether cash is collected. To measure income, expenses must be matched to
revenues or the relevant me period. This usually can be done whether or not the opera ng
cycle is complete.
3. Accrual accoun ng matches expenses to revenues for a par cular me period. The ac-
crual method is the basis on which accounts are adjusted to reach this objec ve. Under
this method, expenses are matched to the revenues during the period that the revenues

538
Solu ons To Discussion Ques ons
are generated. The revenue recogni on assump on helps determine when revenues are
earned, thus allowing expenses to be matched to these revenues. Revenues are not gen-
erally matched to expenses by conven on. The ra onale is that revenues are recognised
before expenses; therefore expenses should be matched to revenues.
4. Under the going concern concept, it is assumed that opera ng cycles that are incomplete
at the end of financial periods will be completed during the (assumed) unlimited life of the
en ty. Since accountants must prepare financial statements even though opera ng cycles
are incomplete, accrual accoun ng techniques are employed to more accurately measure
economic ac vity during a given me period.
5.
a. The cost of goods that are transferred to customers (such as items sold); these ex-
penses can be matched to revenue generated rela vely easily.
b. The cost of assets only par ally consumed during the me period like trucks and equip-
ment; these expenses are as easily matched with revenue.
c. Some expenses incurred during the accoun ng period are not easily iden fied with
revenue generated, such as salaries of administra ve staff. These are matched to the
period in which they are incurred, rather than to related revenue.
6. Adjus ng entries are changes made at the end of an opera ng cycle to more accurately
reflect economic ac vity during the period. For instance, deprecia on is calculated on plant
and equipment assets and charged to the income statement.
7. At the end of the accoun ng period, an accountant must determine the amount of future
benefits (assets like Prepaid Insurance) that belong on the balance sheet and how much
should be recorded in the income statement (as Insurance Expense, in this example). The
appropriate amounts must be transferred by means of adjus ng entries.
8. Plant and equipment accounts and are handled differently than other asset accounts. The
expired por on of the cost of such an asset is es mated based on its useful life and recorded
as deprecia on expense. This requires no cash outlay, despite being an expense. Plant and
equipment asset accounts themselves are not reduced by the deprecia on expense; rather,
a contra asset account is set up in order to show a reduced balance on the balance sheet.
9. A contra account is used to reduce the value of a related balance sheet item. For instance,
the account Accumulated Deprecia on-Equipment is credited by the amount of deprecia-
on expense recorded each year. The balance in this account is ne ed against the related
account (Equipment, in this example) so that the asset is shown at carrying amount on the
balance sheet.
10. At the end of the accoun ng period, the amount of the liability that belongs on the balance
sheet must be determined. The account balance is adjusted through the use of an adjus ng
entry to the related revenue account (Repair Revenue, in this example).
11. Accruals are assets and liabili es that increase during an accoun ng period but are not
recognised in the normal course of recording financial transac ons. They are recorded

Chapter 3 Solu ons
539
through the use of accrual adjus ng entries at the end of the accoun ng period. Examples
of accounts that accrue are:
Examples of Income
Related Balance
Statement Account
Sheet Account
Revenues:
Interest Earned
Interest Receivable
Rent Earned
Unearned Rent
Revenue
Expenses:
Interest Expense
Interest Payable
Rent Expense
Prepaid Rent
Insurance Expense
Prepaid Insurance
Salaries Expense
Salaries Payable
Related balance sheet accounts are eventually reduced when cash is received or paid, as
applicable.
12. An adjusted trial balance is prepared a er pos ng the adjus ng entries in order to establish
the equality of debits and credits, and before preparing the financial statements.
13. The adjusted trial balance conveniently summarises the general ledger accounts in order
of their appearance in the financial statements. This facilitates prepara on of the financial
statements.
14. The eight steps in the accoun ng cycle are:
a. Transac ons are analysed and recorded in the general journal.
b. The journal entries are posted to general ledger accounts.
c. An unadjusted trial balance is prepared to ensure debits equal credits.
d. The account balances are analysed, and adjus ng entries are prepared and posted.
e. An adjusted trial balance is prepared to prove the equality of debits and credits.
f. The adjusted trial balance is used to prepare financial statements.
g. Closing entries are journalized and posted.
h. A post-closing trial balance is prepared to ensure closing entries have been appropri-
ately recorded and to ensure equality of debits and credits.
15. The first two steps in the accoun ng cycle occur con nuously throughout the accoun ng
period:
a. Transac ons are analysed and recorded in the general journal.
b. The journal entries are posted to general ledger accounts.
16. The next six steps in the accoun ng cycle occur only at the end of the accoun ng period:
a. An unadjusted trial balance is prepared to ensure debits equal credits.

540
Solu ons To Discussion Ques ons
b. The account balances are analysed, and adjus ng entries are prepared and posted.
c. An adjusted trial balance is prepared to prove the equality of debits and credits.
d. The adjusted trial balance is used to prepare financial statements.
e. Closing entries are journalized and posted.
f. A post-closing trial balance is prepared to ensure closing entries have been appropri-
ately recorded and to ensure equality of debits and credits.
These steps differ from the others because they don’t deal with individual transac ons but
address account balances. The adjusted balances are used to prepare financial statements.
17. Revenues must be accrued during the current accoun ng period if they have been earned
and even if they have not yet been sa sfied with cash during in the current accoun ng pe-
riod. An account receivable is an example. Expenses must be accrued during the current
accoun ng period if they relate to the revenue recognised during the current period or the
current me period itself (for example, salaries) even if they have not yet been paid in cash.
An account payable is an example. Cash outlays are recorded as prepaid expenses if cash
is paid in advance of expense recogni on. Prepaid Insurance is an example. For each such
asset and liability, the accountant must determine at the end of the accoun ng period the
appropriate balance that should be recorded on the balance sheet. These accounts are ad-
justed as appropriate through adjus ng entries.
18. The need for regular financial informa on requires that revenue and expense accounts of a
business be accumulated for usually no more than one year by conven on, and that financial
statements be prepared for that period. Using a consistent me period allows revenue and
expenses for one period to be compared to a preceding period. A one-year cycle reduces
effects of seasonal varia ons in business ac vity, for instance, but also allows for business
performance to be evaluated by owners and creditors regularly and predictably.
19. Temporary accounts include all revenues and expense categories that are reduced to zero
at the end of the fiscal year when they are closed to the Retained Earnings account. Perma-
nent accounts have a con nuing balance from one fiscal year to the next: these include all
balance sheet accounts.
20. An income summary account is an account used only at year-end to accumulate all revenue
and expense balances, and to reduce their general ledger accounts to zero at the end of the
fiscal year. This account summarises the Net Income (or Net Loss) for the period. It is closed
to the Retained Earnings account at year-end.
21. A post-closing trial balance is a lis ng of balance sheet accounts and their balances a er all
temporary accounts have been closed. It proves the equality of general ledger debit and
credit balances before the next accoun ng period commences.

Chapter 4 Solu ons
541
Chapter 4 Solu ons
1. The economic resources of Big Dog Carworks Corp. are its assets: cash, accounts receivable,
inventories, prepaid expenses and property, plant and equipment.
2. The financial statements are the balance sheet, the income statement, the statement of
changes in equity, and the statement of cash flows. Notes to the financial statements are
also included. The statements report the financial posi on of the company at year-end, the
results of opera ons for the year, changes in share capital and retained earnings, sources
and uses of cash during the year, and informa on in the notes that is not quan fiable or
that provides addi onal suppor ng informa on to the financial statements.
3. Fundamentally, accoun ng measures the financial progress of an en ty. The purpose of
financial statements is to communicate informa on about this progress to external users,
chiefly investors and creditors.
4. ASSETS = LIABILITIES + EQUITY
$284,645 = 241,145 + 43,500.
5. Net assets equal $43,500 ($284,645
− 241,145). Net assets are synonymous with equity.
They represent the amount of total assets a ributable to the shareholders a er taking into
account the claims of creditors.
6. The individual assets of Big Dog Carworks Corp. as shown on the balance sheet are cash,
accounts receivable, inventories, prepaid expenses, and property, plant, and equipment. Its
liabili es are borrowings, accounts payable, and income taxes payable.
7. Per Note 3(d), property, plant, and equipment are depreciated on a straight-line basis over
their es mated useful lives. Land is not depreciated.
8.
a. Current asset accounts: Per Note 3(a) and (b), revenue and expenses are accrued. This
will give rise to current assets and current liabili es like accounts receivable, inventory,
prepaid expenses, accounts payable, income taxes payable, and accrued liabili es. In
addi on, accounts receivable are carried at net realizable value. Inventory is carried at
lower of cost and net realizable value. These amounts must be adjusted to the correct
balance. Prepaid expenses would be adjusted to reflect the unused por on at the end
of the period.
b. Non-current asset accounts: Per Note 3(d), buildings are depreciated at 4% per year
using the straight-line method. Equipment is depreciated at 10% per year on a straight-
line basis; motor vehicles are depreciated on a straight-line basis over five years.
c. Current liability accounts: income taxes payable are adjusted at the end of the period
to reflect the es mated amount of taxes incurred for the period. All expenses that are
incurred but not yet paid are added to the unrecorded accrual accounts. Examples are
salaries payable for par al periods and interest owed but not yet paid.

542
Solu ons To Discussion Ques ons
d. Non-current liability accounts: borrowings must be analysed to determine current and
non-current amounts, as shown in Note 5.
9. The balance sheet is classified in order to facilitate the analysis of its informa on. For in-
stance, comparing amounts that will be needed to be sa sfied within the upcoming year
(current liabili es) with resources available to sa sfy these claims (current assets) allows
readers to assess the rela ve ability of the corpora on to meets its short-term obliga ons
as they become due.
10. Big Dog Carworks Corp. makes it easier to compare financial informa on from period to
period by presen ng compara ve annual financial data for two years.
11. The auditor is H. K. Walker, Chartered Professional Accountant. The audit report states
that the financial statements of BDCC have been examined in accordance with generally
accepted audi ng standards. It also states that, in the auditor’s opinion, the statements
present fairly the financial posi on of BDCC and the results of its opera ons and changes in
financial posi on for the year just ended. There are no concerns raised in the report.
12. The auditor’s report indicates that GAAP have been consistently applied in BDCC’s financial
statements (see last sentence of the report).
13. Management’s responsibili es for financial statements are to ensure that they are prepared
in accordance with GAAP, in this case Interna onal Financial Repor ng Standards.
Though the financial statements are produced under the direc on of management, they
belong to the shareholders. Shareholders are the owners of the company.
Chapter 5 Solu ons
1. A business providing a service holds no inventory for resale. Thus, a business that sells
goods must match the cost of the goods sold with the revenue the sales generate. The
Income Statement will show this, as well as the Gross Profit (also known as Gross Margin)—
the difference between Sales and Cost of Goods Sold. A service business Income Statement
would not show these items.
2. Gross Profit is the result of deduc ng Cost of Goods Sold from Sales (or Net Sales). For
example, if a car is sold for $16,000 but cost $12,000, the Gross Profit calcula on would be
Sales
$16,000
Cost of Goods Sold
12,000
Gross Profit
4,000
The profit on the sale, before considering opera ng and other expenses, is $4,000. The
Gross Profit percentage is $4,000/16,000 or 25 per cent. That means for every $1 of Sales,
the business earns $0.25 on average to cover opera ng and other expenses.

Chapter 6 Solu ons
543
3. The Merchandise Inventory account collects informa on regarding the purchase of inven-
tory, return to supplier of inventory, purchase discounts, transporta on costs, and inventory
shrinkage adjustments.
4. The sales and collec on cycle starts off when a sale is made, o en crea ng an Account
Receivable. The Account Receivable is subsequently removed when cash is collected. If
merchandise is returned because it is say, the wrong model or defec ve, a Sales Returns
and Allowances records this amount and the Account Receivable is reduced. To speed up
collec ons, discounts may be offered in return for prompt payments. If so, a Sales Discount
may be given.
Assuming a perpetual inventory system, the purchase and payment cycle starts with the
purchase of merchandise, which becomes the inventory held for resale; the purchase gen-
erally creates an Account Payable. The Account Payable is removed once the account is
paid by a cash disbursement. Purchases may be returned if the inventory item is wrong or
defec ve. If so, the Account Payable would be reduced and a credit to Merchandise Inven-
tory would be recorded. Discounts may be offered by the supplier to speed up payment by
the purchaser. If so, the purchaser would be given a purchase discount which is debited to
Account Payable and credited to Merchandise Inventory.
5. The contra accounts used for sales are
a. Sales Returns and Allowances, which accumulates merchandise returned to the seller
by the customer because of some defect or error.
b. Sales Discounts, which accumulates discounts taken by customers when payments are
made to the seller within the discount period.
In a perpetual inventory system, there are no contra accounts used for purchases.
6. (Appendix) In a perpetual inventory system, the balances in Merchandise Inventory and Cost
of Goods Sold are updated with each transac on involving purchases and sales. In a periodic
inventory system, the balances in Merchandise Inventory and Cost of Goods Sold are not
known un l an inventory count is performed. The advantage of a perpetual system is that
account balances are maintained in real me and therefore always known which is not the
case for a periodic system where account balances have to be es mated un l an inventory
count is performed.
Chapter 6 Solu ons
1.
a. The amount of inventory on hand is important to management for two reasons. First,
management wants to ensure there is ample inventory to meet all customers’ or-
ders. Second, because the cost of carrying inventory (for instance, rental of warehouse
space, insurance) can be quite high, management wants to keep the inventory as low
as possible.

544
Solu ons To Discussion Ques ons
b. Investors and creditors are concerned with the inventory because inventory is a large
asset. They will want to assess its current amount and trends compared to other years
and compe tors’ levels to help determine the financial strength of the company before
inves ng or lending money, or for use as collateral, for instance.
2. Accountants must ensure the inventory is not obsolete or unsalable and that it is properly
counted and valued, using an acceptable inventory cost flow assump on that is applied
consistently from year to year.
3. The laid-down cost of inventory is the invoice price of the goods less purchase discounts,
plus transporta on-in, insurance while in transit, and any other expenditure made by the
purchaser to get the merchandise to the place of business and ready for sale.
4. Flow of goods is the physical movement of the goods themselves as they enter the firm
and are sold, especially when dealing with similar items, while the flow of costs is the costs
assigned to the flow of goods in the firm using specific iden fica on, FIFO, or average cost
bases.
GAAP does not require that the flow of costs basis be similar to the physical flow of goods,
except when individual units of inventory can be iden fied by, for example, serial numbers.
However, it does require that once the cost basis is selected, that it be followed consistently
from period to period.
5. Two factors are considered in cos ng inventory: the quan ty and the assigned value per
unit. Assigning the value is o en the more difficult aspect, as this involves tracking the laid-
down costs of many items. Physical quan
es can be tracked by computerised accoun ng
systems and verified or determined by physical count at year-end.
6. Consistency in inventory cos ng is necessary for comparing a company’s performance from
year to year. GAAP does allow a company to change its inventory valua on method; how-
ever, the company must restate inventory and cost of goods sold effects on prior years using
the new method. In prac se this change is rarely made.
7. If the ending inventory is overstated at the end of 2018, then cost of goods sold is under-
stated; therefore, the 2018 net income is overstated by $5,000. In 2019, the opening inven-
tory would be overstated and cost of goods sold would be overstated; therefore, the net
income would be understated by $5,000.
8. Inventory should be valued at less than cost when the lower of cost and net realisable value
(LCNRV) principle is applied, perhaps due to factors such as physical deteriora on, obsoles-
cence, or changes in price levels.
9. The primary reason for the use of the LCNRV method of inventory valua on is to prevent
overstatement. If the likely value of inventory has declined below cost, it is prudent to rec-
ognize the loss immediately, rather than when the goods are eventually sold. Net realisable
value is the expected selling cost of inventory, less any applicable costs related to the sale.
10. When inventory is valued at LCNRV, cost refers to the laid-down cost.

Chapter 6 Solu ons
545
11. The inventory cost flow assump ons permissible under GAAP are specific iden fica on,
FIFO or average cost.
12. Es ma ng inventory is useful for two reasons:
a. It is useful for inventory control. When a total inventory amount is calculated under a
periodic inventory system through physical count and valua on, an es mate can help
check the accuracy.
b. It is useful for the prepara on of interim financial statements. Under a periodic inven-
tory system, inventory on hand at any point in me is not readily available. To take
a physical count o en would be costly and inconvenient. An es mate offers a way of
determining a company’s inventory at any point in me in a cost-effec ve manner.
13. Under the gross profit method, the percentage of profit remaining a er accoun ng for cost
of goods sold (the gross profit percentage) is assumed to remain the same from year to year.
By applying the rate to sales, gross profit and then cost of goods sold can be es mated.
Opening inventory and purchases will be known from the accoun ng records, so cost of
goods available for sale can be determined. The difference between the cost of goods sold
and cost of goods available for sale is the ending inventory amount.
Under the retail inventory method, mark-up on goods purchases then sold is considered to
be constant. Both cost and selling prices of goods acquired are then valued at retail by using
the mark-up amount. From this, the ending inventory at retail is calculated. By applying the
cost percentage (costs of goods available for sale divided by retail costs of goods available
for sale) to the retail ending inventory, its value at cost can be calculated.
i. Example – gross profit method:
Sales
$100
Cost of Goods Sold:
Opening Inventory (from records)
80
Purchases (from records)
70
Cost of Goods Available for Sale
150
Ending Inventory
(a)?
(b)?
Gross Profit
$(c)?
If the gross profit percentage average is 25%, the following can be es mated:
(c) Gross profit
=
25% of $100
=
$25
(b) Cost of goods sold
=
$100
− $25 (c) = $75
(a) Ending inventory
=
$150
− $75 (b) = $75
Ending inventory (a) would be $75.
ii. Example – retail inventory method; assumed mark-up = 200%:

546
Solu ons To Discussion Ques ons
At Retail
At Cost
Sales
$500
$500
Cost of Goods Sold:
Opening Inventory (records)
$(b)
$80
Purchases (records)
(b)
300
Cost of Goods Available for Sale
(c)
380
Ending Inventory
(d)?
(e)?
Cost of Goods Sold
(a)?
(f)?
Gross Profit (same as Sales)
$-0-
(g)?
(a) Cost of Goods restated at retail to equal sales
=
$500
(b) Opening Inventory and Purchases re-stated at retail
=
$300
× 200% = $600;
=
80
× 200% = 160
(c) Cost of Goods Available at retail
=
$600 (b) + 160 (b)
=
$760
(d) Ending Inventory at retail
=
$760 (c)
− 500 (a)
=
Cost of Goods Available at retail
=
$260
− Cost of Goods Sold at retail
(e) Inventory at cost = Inventory at retail/200%
=
$260 (c)/200%
=
$130
(f) Cost of Goods Sold at cost
=
$380
− 130(e) = $250
(e) Gross Profit at cost
=
$500
− $250(e) = $250
14. The gross profit method is par cularly useful in cases where goods have been stolen or lost
in a fire; in such cases it is not possible to determine the balance in the ending inventory by
a physical count when the periodic inventory system is used.
15. The retail inventory method assumes an average inventory cost flow assump on because
the cost percentage used to calculate ending inventory and cost of goods sold is based on a
constant mark-up.
Chapter 7 Solu ons
1. Internal control is the system, plan, or organiza on established to ensure, as far as prac-
cal, the orderly and efficient conduct of business. In part, it is used to ensure accurate
record-keeping and the mely prepara on of financial statements, safeguard the assets of
the business, and promote efficiency.
2. A bank reconcilia on is a comparison of the items shown on the bank statement with the
entries made in the records of the en ty. A reconcilia on leads to the update of the ac-
coun ng records and the correc on of errors, if any. Thus, control over cash is enhanced.
3. Different reconciling items that may appear in a bank reconcilia on are as follows:

Chapter 7 Solu ons
547
Book Reconciling Items
Bank Reconciling Items
Book errors
Outstanding deposits
NSF cheques
Outstanding cheques
Bank charges
Bank errors
4. The steps in preparing a bank reconcilia on are (for which there is no specific order):
a. Cancelled cheques returned by the bank are compared with cheques recorded as cash
disbursements (both outstanding cheques from previous months and cheques wri en
in current month’s cash disbursements). Any outstanding cheques must be deducted
from the bank statement ending balance.
b. Other disbursements made by the bank are examined. These could include NSF (not
sufficient funds) cheques or bank service charges. These must be deducted from the
companies Cash account balance in the general ledger.
c. The deposits shown on the bank statement are compared with the amounts recorded
in the company records.
d. The prior month’s bank reconcilia on is reviewed for outstanding deposits at the cur-
rent date.
e. Errors in the bank statement and in the company’s record must be entered on the
reconcilia on.
5. A cheque received from trade customers that has been deposited but cannot be cleared by
the bank because the customer’s own bank balance is less than the amount of the cheque
is an NSF (Not Sufficient Funds) cheque.
6. A pe y cash system reimburses pe y cash for an amount equal to the amounts disbursed
when the fund has been depleted.
7. When a pe y cash fund is established, a regular cheque is wri en for the amount to be
held in the pe y cash fund. The general ledger account Pe y Cash is debited and Cash is
credited. The cheque is cashed and the funds are held by the pe y cash fund custodian.
When the balance of cash in the funds held by the custodian is low, a cheque is wri en to
reimburse the fund for the amount of all receipts held. The cheque is recorded as a debit
to the applicable expense accounts and a credit to the Cash account in the general ledger.
8. Allowance for doub ul accounts is a contra accounts receivable account showing the es -
mated amount that will not be collected. To set it up, bad debt expense is debited and the
allowance is credited for the es mated amount. In this way, the bad debt expenses for the
period are matched with revenues for that period.
9. The income statement method for calcula ng the es mated amount of doub ul accounts
assumes that a certain percentage of sales made on account will become uncollec ble. The
percentage is applied to credit sales and is chosen on the basis of bad debt experience of
previous years. The es mated bad debt expense is calculated independently of any current
balance in the Allowance for Doub ul Accounts general ledger account.

548
Solu ons To Discussion Ques ons
10. Ageing of accounts receivable is the detailed analysis of trade accounts receivable based on
me that has elapsed since the crea on of the receivable. An es mated loss percentage
is applied to each me category to es mate an uncollec ble amount. The es mated bad
debt expense consists of the difference between the current balance in the Allowance for
Doub ul Accounts general ledger account and the amount required to be set up based on
this analysis.
11. The usual balance in the Accounts Receivable general ledger account is a debit. Occasionally,
as a result of double payments, merchandise returns, or allowances granted for example, a
credit balance occurs in some accounts. Theore cally, the credit balance should be trans-
ferred to liabili es. In prac ce, the net amount of accounts receivable is reported on the
balance sheet unless the credits would materially distort the numbers reported.
Chapter 8 Solu ons
1. To capitalize a cost means to record an expenditure as an asset instead of an expense.
2. An expenditure is a cash disbursement. A capital expenditure is one that
a. Benefits more than the current accoun ng period, and these benefits are reasonably
assured;
b. Is material in amount.
A revenue expenditure is an expense and does not have the characteris cs belonging to
a capital expenditure. NOTE: An expense is known as a revenue expenditure because its
purpose is to generate revenue in the period in which it was expended (i.e., the current
accoun ng period).
3. The purchase of a computer for business use qualifies as a capital expenditure when it ben-
efits more than one accoun ng period. However, its purchase price may not be immate-
rial, depending on the company’s capitaliza on policy. The annual maintenance or repairs
made to the computer to keep it running are revenue expenditures if the cash disburse-
ments are frequent, small, and do not extend the life of the computer. Purchase of a part
that significantly enhances performance or extends the useful life of the computer might be
capitalized, again depending on materiality.
4. Purchasing land and buildings for a lump sum means that no dis nc on is made between
the two items at the me the purchase price is nego ated. The purchase price must be
appor oned between the Land and Building accounts because buildings are subject to de-
precia on. The purchase price, therefore, is allocated on the basis of rela ve fair values of
the land and the buildings.
5. As a ma er of expediency, large companies set a dollar limit to help determine whether a
disbursement is to be treated as a revenue or a capital expenditure because efforts required
to capitalize and amor ze an inexpensive item are so much greater than the benefits to be

Chapter 8 Solu ons
549
derived. The concept of materiality is used to determine the amount at which an expendi-
ture is considered capital in nature.
6. The three criteria are life of the part (whether it will benefit more than the current account-
ing period), the effect of the expenditure (whether it will enhance the service poten al of
the asset), and whether it is a material amount.
7. When one asset is exchanged for another, the cost of the asset acquired is determined by
the fair value of the asset given up. If the fair value of the asset given up is not known, then
the fair value of the asset acquired becomes the cost of the new asset.
8. Deprecia on is the process of alloca ng the cost of a tangible, long-lived asset to each ac-
coun ng period that will benefit from its use. The amount to be allocated is based on an
es mate of the asset’s useful life, residual value, and method of deprecia on to be used.
9. As me elapses, the economic benefits provided by an asset may decrease, so that the
efficiency of the asset is greater during its ini al years and less later on. If a car is free
from ini al defect, it should not require any repairs in its first year of use, but it will need
regular maintenance (e.g., oil changes). Eventually, it will likely require repairs, such as a
replacement ba ery or new valves. The annual maintenance costs will increase, cos ng the
user more to use the car. Therefore, the value of the car or the value of its services each
year will decrease, so deprecia on should be lower in subsequent years.
10. A usage method of deprecia on is useful when the use of an asset varies from period to
period and when wear and tear is the major cause of deprecia on. A me-based method,
such as straight-line deprecia on, assumes that each period receives services of equal value
from the use of the asset; me-based methods ignore asset usage. The preferable method
is a ma er of judgement.
The sports car may wear out in two ways. The distance travelled has a large bearing on the
value of the car; however, the passage of me also does, as an older model generally sells
for less than its original cost. In terms of the useful life of the car, it will only last for a certain
number of kilometres and it only renders services if it is driven. A usage method is likely best
to measure deprecia on, since the car is not necessarily driven for equal mes during each
period; the less it is driven, the more periods it will last.
11. Under the declining balance method, the calcula on of deprecia on is made without an
adjustment for residual value. The asset cannot be depreciated below a reasonable residual
value. The arithme c of this formula is such that it will never reduce the asset balance to
zero. Under the straight-line method, there is an adjustment made for residual value. This
difference is not inconsistent, since both methods eventually result in a balance considered
to be the residual value.
12. Under the declining balance method, a constant deprecia on rate is applied in each ac-
coun ng period to the remaining carrying amount (cost less accumulated deprecia on).
Both the deprecia on expense and the carrying amount decline every period. Therefore, it
is called the declining balance method.

550
Solu ons To Discussion Ques ons
Under the straight-line method, the deprecia on expense for each accoun ng period is the
same over the useful life of the asset.
13. If an asset is expected to have a 10-year life, then, each year 10 per cent of its life is over
(100%/10 years = 10%). The double-declining balance is double this rate or 20% per year,
calculated on the carrying amount of the asset at the end of the previous year.
14. Par al-year deprecia on can be calculated using the half-year rule or by pro-ra ng depre-
cia on expense over the number of months (rounded) that the asset was in use.
15. Either changes in es mated residual value or useful life may affect the calcula on of depreci-
a on expense. In both cases, no change is made to deprecia on expense already recorded.
The effects of the changes are spread over the remaining future periods.
16. Subsequent capital expenditures affect deprecia on calcula ons in the same manner as
changes in accoun ng es mates. The effects are accounted for prospec vely (over the re-
maining future periods).
17. At the end of each repor ng period, the recoverable amount (fair value less es mated costs
of disposal) of an asset must be compared to its carrying value. If the recoverable amount
is lower, the carrying value must be adjusted downward (a credit to the asset account) and
an impairment loss must be recorded (a debit to an expense account). Subsequent years’
deprecia on expense calcula ons must also be adjusted.
18. Es mates of future events are commonplace in accoun ng, and necessary to provide more
meaningful informa on to financial statement users, within reason. Deprecia on is one
example. The benefits of matching the use of a capital asset to the revenue of future periods
which it helps to produce is deemed to be useful informa on under GAAP. To facilitate this,
deprecia on methods rely on es mates, and es mates of future events are subject to error.
Accoun ng is intended to produce financial informa on that are not precise but rather that
present a fair representa on of the en ty. If the es mates used subsequently prove to be
incorrect, accountants change them.
19. Significant parts may have different es mated usage pa erns, useful lives, and residual
values. They may be replaced at different points in the useful life of the long-lived asset.
Separate accoun ng for significant parts allows for these differences to be reflected in the
financial statements.
20. A gain or loss on disposal does not occur when the carrying amount of an asset is the same
as the proceeds of disposi on.
21. A trade-in involves acquiring a long-lived asset by giving up a similar asset to the one being
acquired (i.e., exchanging it) as part of the purchase price. It is not quite the same as an
outright sale, which involves giving up a long-lived asset and receiving just cash for it.
22. The trade-in allowance may be higher or lower than the fair value of the used asset on the
open market. Dealers o en give more trade-in allowance on a used car than it is actually
worth to make purchasers think that they are ge ng a be er deal on the new car.

Chapter 9 Solu ons
551
23. The cost of the new asset is calculated as the sum of cash paid plus the fair value of the
trade-in.
24. Intangible assets, unlike property, plant, and equipment, cannot be touched or otherwise
sensed. They are the same as PPE in that they represent future economic benefits to an
en ty over more than one accoun ng period, and so are similarly capitalized.
25. A patent is an exclusive right granted by the state to an inventor to produce and sell an
inven on for a specified period of me. A patent’s useful life may be affected by economic
factors based on demand and compe
on. The 20-year life may be excessive; a shorter
life may be more realis c. For example, if a company develops a unique computer and
patents it, even though it cannot be reproduced by other firms for 20 years, nothing stops a
compe tor from studying it, improving it, and paten ng this improved computer. Although
the “unique” computer may be useful for many years, it may be technologically obsolete
before the patent expires.
26. A copyright is the exclusive right granted by the state to publish a literary or ar s c work. It
exists for the life me of the author and for a specific period of me a er death. Similarly,
a trademark is a legal right granted by the state, in this case for an en ty to use a symbol
or a word as a trademark to iden fy one of its products or services. A copyright would be
granted for a piece of music or a novel. Examples of trademarks are the word “Coke”®on
so drink bo les and the stylised ‘M’®of the McDonald’s®logo.
27. Goodwill is a long-lived asset that represents the capitalized value of superior earnings po-
ten al of an acquired company. Goodwill is an asset but it is not an intangible asset. Such
factors as favourable customer rela ons, loyal and competent employees, possession of
valuable patents or copyrights, high-quality products, or effec ve management help cre-
ate goodwill. Goodwill cannot be iden fied separately because it relates to the total en ty
acquired. Its useful life is considered indefinite unless its value is impaired because these
a ributes are assumed to con nue into the future. Goodwill can only be purchased in an
arms-length transac on because it is otherwise difficult to a ach a value to it.
28. Intangible assets are generally measured and recorded at cost. The measurement basis
should be disclosed, along with
• the type of amor za on method for each class of intangible asset;
• opening and ending balances for cost, accumulated amor za on, and carrying value,
and disclosure of any changes;
• whether they are internally generated; and
• whether they have finite or indefinite lives.
Chapter 9 Solu ons
1. A current liability is a form of debt that is expected to be paid within the longer of one year of
the balance sheet date or one opera ng cycle. A long-term liability is also a form of debt but

552
Solu ons To Discussion Ques ons
it is expected to be paid beyond one year of the balance sheet date or the next opera ng
cycle, whichever is longer. Current and long-term liabili es must be shown separately on
the balance sheet.
2. Examples of known current liabili es are accounts payable, sales taxes payable, short-term
notes payable, and payroll liabili es.
3. Known current liabili es are those where the payee, amount, and ming of payment are
known. These are different from es mated current liabili es where the amount is not
known and must be es mated.
4. Examples of es mated current liabili es include warran es and income taxes.
5. Es mated current liabili es are those where the amount is not known and must be es -
mated. The amount of an es mated current liability is probable and can be reliably es -
mated. A con ngent liability is either not probably or it cannot be reliably es mated. Con-
ngent liabili es are not recorded whereas es mated current liabili es are recorded.
6. A bond is a debt security that necessitates periodic interest payments during its life as well
as a future repayment of the borrowed amount. A bond indenture is the contract that binds
the corpora on to the bondholders; it specifies the terms with which the corpora on must
comply and may restrict further borrowing by the corpora on. A trustee may be used to
serve as an impar al intermediary between the corpora on and the bondholders, and so
be er balance the rights and needs of these two groups.
7. A bondholder has the following rights:
a. The right to receive the face value of the bond at a specified maturity date in the future,
that is, the right to receive the amount of money that was invested;
b. The right to receive periodic interest payments at a specified per cent of the bond’s
face value; this interest represents the bondholder’s return on investment; and
c. The right to have the corpora on pledge some secured assets to protect the bond-
holder’s investment; this safeguard restricts excess borrowing and, in the event that
interest or the face amount of the bonds cannot be paid, allows for the sale of these
assets to generate the funds necessary for repayment.
8. Bond issues with different characteris cs are disclosed separately in the financial state-
ments, or more usually, in a note. The interest rate, maturity date, and any restric ons
imposed on the corpora on in the bond indenture, together with any assets pledged, also
must be disclosed.
9. The different possibili es in the redemp on of bonds before their maturity follow:
a. The bonds can be repurchased on the open market if this op on is financially advan-
tageous to the issuer.
b. The issuer may exercise a call provision if it is financially advantageous. A call provision,
some mes included in a bond indenture, permits early redemp on at a specified price,
usually higher than the face value.

Chapter 9 Solu ons
553
c. The bondholder or issuer may exercise a conversion feature if provided for in the bond
indenture, whereby the bonds can be converted into corporate shares.
10. If the bond contract interest rate is the same as the prevailing market interest rate, the
bond will sell “at par”. If the bond contract interest rate is higher than the prevailing market
interest rate, the bond will sell at a premium. Prospec ve bondholders will bid up the price
of the bonds because the bonds pay a rate of interest higher than other securi es with
similar features and risks. This creates a premium over the face value of the bonds. If the
bond contract interest rate is lower than the prevailing market interest rate, the bond will
sell at a discount because prospec ve bondholders will not be willing to pay the face value
of the bonds. The issuer will have to accept a lower price so the effec ve interest rate will
equal that of other securi es with similar features and risks.
11. Under GAAP, an unamor sed premium (discount) is added to (deducted from) the face value
of the bond so that the liability is recorded at its carrying amount on the balance sheet.
12. If the bond contract interest rate is greater than that required in the market, then the bonds
are sold at a premium. If the investment market operates efficiently, investor should earn
only the market rate of interest. By paying a premium over the face value, the overall return
to the investor is reduced from the bond contract rate to the market rate in effect at the
issue date.
13. The effec ve interest method of amor sa on calculates different amounts of amor sa on
from one period to another.
14. A loan, like a bond issue, is a means for an en ty to raise investment capital through credi-
tors. Both can be secured, and generally have fixed rates of interest and specified terms of
repayment. However, loans are repaid with blended payments of interest and principal over
the life of the liability. While the total payment on a loan is constant, the rela ve por on
of interest decreases with each payment because loan principal is being reduced with each
preceding payment. The por on of principal repayment increases. Bonds pay interest only
to investors at regular intervals over the life of the issue plus a payment for the face value
of the bond when it matures.
15. If money is borrowed today for one year, at the end of that year the money to be repaid
is increased by the amount of interest charged. The future value is therefore the principal
plus interest. If a certain sum must be repaid in one year, the value in today’s money would
exclude the interest to be earned in the future. This is its present value. The me value
of money is represented by interest. Interest is added to the principal to obtain the future
value, and it is removed from a future sum to arrive at the present value.
16. The price of a bond is determined by combining the present value of the following future
cash flows associated with the bond:
a. a single amount, the face value, to be paid at maturity; and
b. semi-annual interest payments made during the bond’s life.

554
Solu ons To Discussion Ques ons
Chapter 10 Solu ons
1. The corporate form of organiza on offers the following advantages:
a. It is a legal en ty with unlimited life; its existence is separate from its owners; and it
has many of the rights and responsibili es of an individual.
b. It has limited liability; the owners are liable only for the amount they invest in the
corpora on.
c. Acquiring capital is facilitated by being able to issue shares (ownership units) with dif-
ferent risk and reward structures to many owners.
d. Corpora ons may pay income taxes at rates that may be lower than rates for individu-
als.
2. The owners of the corpora on are liable for only the amount they have each invested. If
the corpora on fails, its assets are used to pay the creditors. If assets are not sufficient to
pay all creditors, the shareholders have no further liability. Creditors are protected to some
degree by disclosure of the corpora on’s limited liability.
3. Some of the rights of common shareholders are as follows:
a. The right to par cipate in the management of the corpora on by vo ng at sharehold-
ers’ mee ngs (1 share generally equals 1 vote).
b. The right to par cipate in dividends when they are declared by the corpora on’s board
of directors.
c. The right to par cipate in a distribu on of assets on liquida on.
d. The right to appoint auditors.
The rights may be printed on the share cer ficate itself; they are detailed in the ar cles
of incorpora on.
4. The shareholders elect a board of directors, which appoints the officers of the corpora on.
The officers execute the policies approved by the board of directors. The directors are not
involved in the daily management of the corpora on.
5.
a. The two main classes of shares are:
i. Preferred Shares – a class of shares that has a preference over common shares.
Holders of preferred shares are en tled to payment of dividends before common
shareholders and usually have prior claims on a corpora on’s assets on liquida on.
A fixed dividend rate may be a ached to the shares. Some preferred shares may
have vo ng privileges.
ii. Common Shares – the class of shares that are the basic ownership units in a cor-
pora on. Ownership of common shares carries the right to vote, to share in divi-
dends, and to share in the assets of the corpora on if it is liquidated; however, all
other claims to the assets of a corpora on rank ahead of the common sharehold-
ers’ claims.

Chapter 10 Solu ons
555
b. Terms rela ng to the present status of a corpora on’s shares:
i. Authorized Shares – the designated number of shares within each class of shares
that a corpora on may issue.
ii. Unissued Shares – the shares of share capital in each class that a corpora on is
authorized to issue but has not yet issued.
iii. Issued Shares – the total number of authorized shares that have been issued in the
name of shareholders; issued shares may not actually be in the hands of share-
holders (e.g., treasury shares).
iv. Outstanding Shares – authorized shares that have been issued and are actually in
the hands of shareholders.
v. Reacquired Shares – shares that have been re-purchased from shareholders, have
not been cancelled, and have not been reissued (also called treasury shares).
6. Shares are preferred in that their owners
a. Generally assume less risk than common shareholders. When a corpora on is dis-
solved, preferred shareholders have first claim on the remaining assets a er the cred-
itors have been paid; and
b. Have a prior claim to the earnings of the corpora on. Preferred shareholders must be
paid specified dividends before any payments are made to common shareholders.
Preferred shareholders are similar to common shareholders in that both
a. Own share cer ficates, evidence of corporate ownership;
b. Have the legal guarantee that all shares of the same class will be treated equally with
respect to rights and privileges a ached to them;
c. Have the right to dividends declared by the board of directors; and
d. Have the right to par cipate in distribu on of assets on liquida on of the corpora on.
Preferred shareholders differ from common shareholders in that
a. Common shareholders can par cipate in the management of the corpora on by vo ng
at shareholders’ mee ngs (though some preferred shares may have vo ng privileges);
b. Common shareholders can appoint auditors;
c. Common shareholders assume more risk than preferred shareholders. However, com-
mon shareholders have more poten al for receiving substan al dividends and increases
in the value of their shares if the corpora on is successful; and
d. Common shareholders receive the balance of assets a er other claims have been sa sfied—
in the case of a bankruptcy or liquida on, there are usually few or no other assets to
distribute to common shareholders; preferred shareholders have prior claims.
7. When the shares of a corpora on are selling at a high price on the stock market, manage-
ment may opt for a share split in order to put them more easily within the reach of more
investors.

556
Solu ons To Discussion Ques ons
8. The major components of the equity sec on of the balance sheet are share capital (pre-
ferred shares and common shares) and retained earnings. These two major components
are dis nguished because share capital represents invested capital not available for distri-
bu on to owners, while retained earnings are available for distribu on as dividends.
9. Retained earnings represent net assets that are earned by a corpora on over its life that
have not been distributed as dividends to shareholders. As such, they can be used to invest
in produc ve ac vi es of the business.
10. Some of the main considera ons involving the declara on of dividends are
a. Whether or not there is enough cash, or whether the dividends can be paid by distri-
bu on of some other assets;
b. Whether the policy of the corpora on precludes dividend payments; and
c. Whether there is a legal requirement that dividends must be declared.
11. A corpora on may decide not to pay cash dividends even though it has a substan al net
income because financial condi ons may make it imprac cal or impossible.
a. There may be insufficient cash, due to a significant investment in capital assets or re-
duc on of debt, for instance. In a growth-oriented corpora on, shareholders benefit
from this strategy through increased earnings, which increase market prices for the
shares.
b. The policy of the corpora on may preclude dividend payments.
c. There is no legal requirement that dividends must be paid, unless otherwise specified
by the various classes of shares.
d. Dividends may be issued in shares of the corpora on rather than in cash. A share
dividend helps to preserve cash or to increase the number of shares traded on the
stock market.
12. The date of dividend declara on: the corpora on is legally required to pay the dividend; a
liability is established.
The date of record: shareholders who own the shares on this date will receive the dividend.
The date of payment: the dividend is actually paid on this date.
13. A cash dividend reduces both the asset Cash and the equity account Retained Earnings. A
share dividend does not affect Cash; the Retained Earnings account is s ll reduced, but the
account Common Shares (or Preferred, if applicable) is increased. A share dividend has no
net effect on equity.
14. Dividend preferences that may be a ached to preferred shares are
a. Preferred shareholders are en tled to dividends before any dividends are distributed
to common shareholders;

Chapter 11 Solu ons
557
b. Preferred shares may be cumula ve; undeclared dividends can accumulate from one
year to the next; and
c. Preferred shareholders may par cipate with common shareholders in dividend distri-
bu ons beyond their usual preferred dividends.
Preferred shares have returns that are more predictable and thus a ract investors with a
lower tolerance for risk. These advantages do not mean that purchasing preferred shares
are necessarily be er than purchasing common shares. Holding common shares has its own
advantages. Common shareholders generally have legal control of the corpora on. Own-
ership of commons shares carries the right to vote, to earn poten ally unlimited dividends,
and to have share values increase on stock markets.
15. If preferred shares are cumula ve, undeclared dividends from previous years are accumu-
lated and must be paid along with the current dividend. The unpaid dividends are called
dividends in arrears. They are not a liability of the corpora on unless dividends have been
declared by the board of directors.
16. A share dividend is a dividend in the form of shares of the corpora on. Retained earnings
decrease and share capital increases. A share split is an ac on taken by the corpora on
to increase the number of shares outstanding and reduce the per-share market value. No
journal entry is required to record a share split, and there is no effect on the accoun ng
records.
17. A share dividend increases the number of shares held by each shareholder but the own-
ership percentage remains the same. If a 10 per cent share dividend is distributed, each
shareholder holds more shares but the percentage of ownership remains the same, illus-
trated as follows:
Ownership
Before Share
A er Share
Dividend
Dividend
Shareholders
Shares
%
Shares
%
W
250
25%
275
25%
X
250
25%
275
25%
Y
250
25%
275
25%
Z
250
25%
275
25%
1,000
100%
1,100
100%
Chapter 11 Solu ons
1. A statement of cash flows (SCF) provides external readers of a corpora on’s financial state-
ments with a summary of the cash transac ons that took place in the company in a par-
cular period. For example, a reader could determine the amount of proceeds from the
sale of plant and equipment assets, or whether plant and equipment assets were acquired.

558
Solu ons To Discussion Ques ons
It communicates how the company is financing its ac vi es (internally from opera ons or
externally from other sources), and why cash increased or decreased.
Its advantage over the balance sheet is that the balance sheet reports the financial posi on
of the company at a par cular point in me, while the SCF reports the changes in cash that
occurred from one balance sheet date to another.
An income statement reports earnings on an accrual basis, which is important. However,
investors and creditors are also interested in determining how a corpora on has generated
and used cash during a fiscal period, because cash is an important determinant of liquidity.
The SCF provides this informa on succinctly to readers.
2. These ac vi es are important to readers who wish to evaluate the financial posi on and
the results of opera ons of a par cular company in order to make certain decisions, such as
whether or not to invest in it. The extent of cash flows resul ng from financing and inves ng
decisions can help readers iden fy the underlying, longer-range ac vi es of the firm that
may affect future earnings, such as whether plant and equipment assets are being acquired,
or debt is being re red. The SCF makes these ac vi es explicit.
3. An increase in accounts receivable during a fiscal year is recorded by a debit. The offset-
ng credit to the Cash account denotes a use of cash. In effect, cash has been diminished
because amounts owing by customers has increased, instead of being collected.
4. The declara on of cash dividends has no effect on cash flow, since it does not involve the
use of cash; it merely sets up a dividend payable in the books of the company. The payment
of a dividend declared decreases cash flow, since it involves the outlay of cash. Whether the
dividend was declared in prior years or in the current year has no effect; only the payment
reduces cash. Changes in the dividends payable account balance from one year to the next
also affect cash flows. A net reduc on in dividends payable (a debit) increases cash ou low
(a credit). A net increase in dividends payable decreases cash ou low.
5. Buying or selling short-term investments may decrease or increase the amount of cash avail-
able to the company if they are considered part of cash and cash equivalents. If they are
considered part of C&CE, transac ons involving short-term investments have no effect on
cash flow from opera ng ac vi es.
6. Net income for a period usually consists of sales less cost of sales, opera ng expenses, and
other expenses like interest and income taxes. If there are a large number of credit sales and
the amount of accounts receivable over the last year has increased, then there is less cash
inflow compared to sales revenue recorded on the income statement. If many expenses are
prepaid, then cash has been used but the expenses have not decreased net income. Simi-
larly, if inventory levels have increased from one year-end to the next, cash has decreased
but cost of goods sold is unaffected on the income statement.
Deprecia on of property, plant, and equipment decreases net income but not cash. Losses
and gains on sale of property, plant, and equipment assets affect net income, but do not
affect cash flows. Cash may also be used to purchase property, plant, and equipment, pay
off borrowings, and pay dividends, as examples. These inves ng and financing ac vi es
affect cash, but are not reflected on the income statement.

Chapter 12 Solu ons
559
7. Main balance sheet account transac ons that use cash are (a) opera ons of the company
(net cash ou low from opera ng ac vi es during the period), (b) purchase of property,
plant and equipment assets, (c) re rement of debt and share capital, and (d) payment of
dividends. The balance sheet accounts are analysed by looking at the opening and ending
balances of the account, determining the reasons for the change in the account, and record-
ing the effects as a cash inflow or ou low from opera ng, financing, or inves ng ac vi es.
Chapter 12 Solu ons
1. Comparisons can be made using published industry sta s cs, sta s cs of previous years,
sta s cs of leading compe tors, or internally-developed ra os.
2. Liquidity is a corpora on’s ability to pay current liabili es as they become due. Being “illiq-
uid” means creditors that have provided the corpora on with goods and services on ac-
count, or with other forms of short-term borrowing, cannot be paid. Implica ons of being
illiquid:
Creditors:
a. Can refuse to provide further goods or services on account.
b. Can sue for payment.
c. Can put the corpora on into receivership or bankruptcy.
d. Can refuse to lend addi onal cash.
e. Can demand repayment of all debts, including long-term debt.
Shareholders:
a. May be unwilling to invest in addi onal share capital of the corpora on
b. Risk the loss of their investments if the company becomes bankrupt
3. Net income is based on accrual accoun ng and not cash basis accoun ng. For example, if
$1,000,000 of sales are on account, this transac on increases net income but not cash. As
an addi onal example, the corpora on may have large sums of capital ed up in inventory
which means there is less cash available to pay the liabili es.
4. Current ra o: Indicates how many current asset dollars exist to pay current liabili es.
Acid-test ra o: Indicates whether or not the corpora on is able to meet the immediate
demands of creditors, without considering current assets ed up in inventory or prepaid
expenses.
Accounts receivable collec on period: Indicates the average me needed to collect receiv-
ables.
Number of days of sales in inventory: Indicates how many days of sales can be made with
inventory on hand.

560
Solu ons To Discussion Ques ons
Revenue opera ng cycle: Indicates how long it is between the purchase of inventory and
the subsequent collec on of cash from sales of inventory.
5.
a. Working capital is the difference between current assets and current liabili es.
The current ra o is computed by dividing current assets by current liabili es. It is one
measure of whether or not the corpora on is able to repay short-term creditors. The
acid-test ra o, on the other hand, is a more severe test of liquidity. It is computed by
dividing quick assets (cash, short-term investments, accounts receivable) by current
liabili es.
b. The current ra o is only a rough indica on of how able an en ty is to pay its current
liabili es as they become due. The rela ve liquidity of components of current assets
is not considered in the calcula on of this ra o. The acid-test ra o is o en used as a
more severe test of liquidity.
6. The ability to pay short-term creditors as amounts become due depends on the liquidity of
the current assets. If, for example, company X’s current assets consist of cash and company
Y’s current assets consist of inventory, company Y will not be able to pay its creditors easily
because of a lack of cash.
7. Taking too long to collect accounts receivable will reduce the amount of cash available to pay
liabili es as they become due. The same is true if there is an over-investment in inventory.
8. An acceptable number of days to collect accounts receivable and to convert inventory to
sales depends on several factors, including the industry in which the corpora on does busi-
ness and the state of the economy. Management judgement and experience are crucial. If
accounts receivable are collected too slowly, or if credit is extended to liberally, debts may
not be collected in a mely manner, or at all. If accounts receivable collec ons are too short,
poten al credit sales may be lost. Similarly, higher number of days of sales in inventory in-
dicates that more cash is ed up in inventory. On the other hand, a lower number of days
of sales in inventory may indicate that inventory levels are too low. Poten al sales may be
lost.
9. Advantages of decreasing number of days of sales in inventory might be that
a. The amount of assets ed up in inventory is reduced.
b. The dangers of obsolescence or deteriora on are reduced.
c. Less storage space is used for inventory, so that warehousing expenses are reduced.
A disadvantage of decreasing number of days of sales in inventory is that stock can be re-
duced to the point where sales are lost.
10. The revenue opera ng cycle indicates the number of days that elapse between the purchase
of inventory and the subsequent collec on of cash a er a sale is made. It is computed by
adding the average number of days needed to turn over inventory and the average number
of days needed to collect receivables. It is useful in evalua ng liquidity because a compar-
ison can be made of the number of days needed to complete the cycle and the number of

Chapter 12 Solu ons
561
days within which the payables are due. Management can determine how long it will take
the corpora on to pay reinvest in inventory with cash generated by the revenue opera ng
cycle.
11.
a. Ra os that measure margins on sales:
i. Gross profit ra o: indicates the amount of revenue le to cover other expenses
a er deduc ng cost of goods sold. It is calculated by dividing gross profit by net
sales.
ii. Opera ng profit ra o: indicates the amount of revenue le to cover interest and
income taxes expenses a er deduc ng cost of goods sold and opera ng expenses.
It is calculated by dividing income from opera ons by net sales.
iii. Net profit ra o: Indicates the percentage of sales revenue le in the business a er
payment of opera ng expenses, interest, and income taxes. It is calculated by
dividing net income by net sales.
b. Ra os that measure returns on balance sheet items:
i. Sales to total assets ra o: Indicates the adequacy of sales in rela on to average
total assets. It is calculated by dividing net sales by average total assets. In the
longer term, typically investments in property, plant and equipment assets make
up the majority of assets that generate sales and so PPE is some mes used as a
good es mate when calcula ng this ra o.
ii. Return on total assets ra o: Indicates how efficiently a company uses all of its
balance sheet assets to earn income from opera ons. It is calculated by dividing
income from opera ons by average total assets.
iii. Return on equity ra o: Indicates the amount of income that is generated by share-
holders’ propor on of total assets. It is calculated by dividing net income by aver-
age equity.
12. Analysts and investors are concerned with the financial structure of a corpora on because
the higher the reliance on debt, the more substan al claim the creditors have against the
assets of the corpora on. The corpora on is also more vulnerable to rises in interest rates
and economic downturns, which in turn affects future earnings expecta ons.
13. Reliance on creditor financing can be posi ve, since financing a corpora on by issuing addi-
onal shares results in a dilu on of exis ng shareholders’ control of the corpora on. Also,
creditor financing is beneficial to shareholders when the return is greater than the interest
paid on the debt. However, interest has to be paid on the debt and, ul mately, the debt
itself has to be repaid. Interest reduces the income of the corpora on. If interest rates
paid on debt are higher than the returns generated from the borrowed funds, net income
is reduced. The corpora on is more suscep ble to economic downturns and interest rate
increases as its reliance on debt grows.
14. Short-Term Financing Advantages:
a. Usually does not require interest payment to the creditors
b. Easily obtained

562
Solu ons To Discussion Ques ons
Disadvantages:
a. Payment is required within a short me
b. More risky, because it has to be renewed more frequently
Long-Term Financing Advantages:
a. More secure, because renewal is infrequent
b. Principal repayment not required for a long me
Disadvantages:
a. Must pay interest, and legal documents are o en signed to enforce this.
b. More work to acquire (must present financial statements, may have to be audited)
15.
a. Earnings per share: Indicates the amount of net income that has been earned on each
common share. It is calculated by dividing (net income less preferred share dividends)
by number of common shares outstanding.
b. Price-earnings ra o: Indicates the reasonableness of the market price in rela on to
per-share earnings. It is calculated by dividing market price per share by earnings per
share.
c. Dividend yield: Indicates the short-term cash return that could be expected from an
investment in a company’s shares. It is calculated by dividing dividends declared by
outstanding common shares.
16. Horizontal analysis is the comparison of the change in one item on financial statements (such
as merchandise inventory) during two or more accoun ng periods. Ver cal analysis is the
analysis of the composi on of a financial statement by resta ng all items in that statement as
percentages of a total. Generally sales is used as the income statement base and total assets
(or total liabili es and equity) is used as the balance sheet base. Comparing the percentages
of a par cular item between two or more years shows the change in composi on of the
statement components.
Chapter 13 Solu ons
1. A partnership is an unincorporated form of business organisa on in which the en ty is
owned by two or more persons. Five characteris cs of a partnership are:
a. Limited life – if a partner is admi ed, withdraws, or dies, the exis ng partnership is
dissolved and the business con nues under a new partnership agreement.
b. Unlimited liability – in general, each partner is personally liable for the debts that the
partnership cannot pay. In the event that a partner cannot pay his/her share of part-
nership debts, the other partners can be called on to pay personally for such debts.

Chapter 13 Solu ons
563
c. Mutual agency – each partner can make binding agreements not only on the partner-
ship, but also on the other partners.
d. Co-ownership of assets – all assets contributed to the partnership by individual part-
ners are jointly owned by all partners.
e. Sharing of profits and losses – if the partnership agreement does not s pulate how
profits and losses will be shared, all profits and losses are shared equally.
2. The advantages of a partnership are:
a. The knowledge, skills, and financial resources of two or more persons can be com-
bined.
b. Partnerships can be formed rela vely easily and quickly.
c. A partnership can act promptly as a business enterprise in all ma ers. A corpora on
may be restricted in its ac ons on certain ma ers by its charter, by laws, or by statute.
d. Many of the formal government reports required of a corpora on are not required of
the partnership.
e. Income taxes are not levied against partnerships. The partners, however, report on
their individual tax returns their share of partnership income.
The disadvantages of partnerships are:
a. Liability is usually unlimited. Partners are liable for all debts of the partnership.
b. The life of the partnership is limited. Death, withdrawal, or admission of a partner;
agreement to terminate; bankruptcy; and incapacity of a partner are all terminate a
partnership.
c. The partnership is a mutual agency; that is, each partner may act in business ma ers
as the agent of the partnership.
d. The ability of a partnership to raise funds may be limited.
3. Although a proprietorship, partnership, and corpora on engage in the same equity trans-
ac ons of investment, distribu on of income, and incomes/losses, how they are recorded
is different.
In a proprietorship, there is only one equity account: owner’s capital. Investments by the
owner, distribu ons of income known as withdrawals, and incomes/losses are all recorded
in the owner’s capital account.
In a partnership, there is a capital account for each partner. A partner’s investments, distri-
bu ons of income in the form of withdrawals, and a share of incomes/losses are all recorded
in the partner’s capital account.
In a corpora on, there are two types of equity accounts: share capital and retained earnings.
Investments by the owners, known as shareholders, are recorded in share capital. Distribu-
ons of income, known as dividends, along with incomes/losses are recorded in retained
earnings.

564
Solu ons To Discussion Ques ons
4. Profits and losses are divided equally among partners if no agreement exists. Otherwise,
several methods may be followed to allocate profits or losses Formulas o en consider three
factors – a return to each partner based on rela ve levels of services rendered, a return on
capital invested, and a further division of remaining profits and losses according to a fixed
ra o.
5. Salary and interest alloca ons are included in the division of profits and losses because the
me and effort contributed by individual partners to the business and the amount of con-
tributed capital may differ among partners.
6. The balance sheet of a partnership merely shows the ending capital balance of each partner.
If many partners exist, a total capital amount is shown and the details of each partner’s
capital account appear in a statement of changes in equity.

Solu ons To Exercises
Chapter 1 Solu ons
EXERCISE 1–1
a. Partnership
b. Interna onal Financial Repor ng Standards
c. Ethics
d. Financial accoun ng
e. Managerial accoun ng
f. Separate legal en ty
g. Limited liability
h. Unlimited liability
EXERCISE 1–2
a. Viola on Cost principle
b. Viola on: Business en ty principle
c. Viola on: Business en ty principle
d. Viola on: Revenue recogni on principle
e. Correct: Materiality principle
f. Correct: Monetary unit principle
g. Correct: Matching principle
565

566
Solu ons To Exercises
h. Viola on: Consistency principle
i. Viola on: Full disclosure principle and possibly going concern principle if the company is no
longer viable
EXERCISE 1–3
a. 30,000
b. 9,000
c. 95,000
d. In a, debt financing = (20,000/50,000)
× 100=40%. In b, debt financing = (9,000/10,000) ×
100=90%. In c, debt financing = (15,000/95,000)
× 100 = 15.79% (rounded to two decimal
places). Therefore, the greatest percentage of debt financing is reflected in b.
e. In a, equity financing = 100
− 40 = 60%. In b, equity financing = 100 − 90 = 10%. In c,
equity financing = 100
− 15.79 = 84.21%. Therefore, the greatest percentage of equity
financing is reflected in c.
EXERCISE 1–4
ASSETS
=
LIABILITIES
+
EQUITY
Cash
+
Equipment
=
Accounts Payable + Share Capital
+
Retained Earnings
A.
Retained earnings
=
$5,000 (3,000 + 8,000
− 4,000 − 2,000)
B.
Accounts payable
=
$3,000 (1,000 + 6,000
− 3,000 − 1,000)
C.
Cash
=
$1,000 (4,000
− 1,500 − 3,000 − 500)
D.
Retained earnings
=
$6,000 (6,000 + 7,000
− 3,000 − 4,000)
E.
Equipment
=
$3,500 (2,500
−4,500 − 500 − 1,000)
EXERCISE 1–5
a. ASSETS = LIABILITIES + EQUITY
Equity at Jan. 1 = $10,000 ($50,000
− 40,000)
Equity at Dec. 31 = $20,000 ($40,000
− 20,000)
The increase in equity during the year was $10,000 ($20,000 ending equity
− 10,000 begin-
ning equity). Given that during the year no share capital was issued and no dividends were
declared, $10,000 is the amount of net income earned during 2015.

Chapter 1 Solu ons
567
b. ASSETS = LIABILITIES + EQUITY
Equity at Jan. 1 = $10,000 ($50,000
− 40,000)
Equity at Dec. 31 = $20,000 ($40,000
− 20,000)
The increase in equity during the year was $10,000 ($20,000 ending equity
− 10,000 begin-
ning equity). Given that during the year no share capital was issued and $5,000 of dividends
were declared, $15,000 is the amount of net income earned during 2015 [calculated as net
income
− $5,000 dividends = $10,000 increase in equity; net income = 10,000 + 5,000 or
15,000].
c. ASSETS = LIABILITIES + EQUITY
Equity at Jan. 1 = $10,000 ($50,000
− 40,000)
Equity at Dec. 31 = $20,000 ($40,000
− 20,000)
The increase in equity during the year was $10,000 ($20,000 ending equity
− 10,000 be-
ginning equity). Given that during the year $12,000 of share capital was issued and no
dividends were declared, a net loss of $2,000 was realized for 2015 (calculated as net in-
come + $12,000 share capital issued = $10,000 increase in equity; net income = $10,000
− $12,000; net income is therefore a nega ve $2,000 which represents a net loss).
d. ASSETS = LIABILITIES + EQUITY
Equity at Jan. 1 = $10,000 ($50,000
− 40,000)
Equity at Dec. 31 = $20,000 ($40,000
− 20,000)
The increase in equity during the year was $10,000 ($20,000 ending equity
− 10,000 begin-
ning equity). Given that during the year $8,000 of share capital was issued and $12,000 of
dividends were declared, $14,000 is the amount of net income earned during 2015 (calcu-
lated as net income + $8,000 share capital issued
− $12,000 dividends = $10,000 increase
in equity; net income = $10,000
− $8,000 + $12,000; net income = $14,000).
EXERCISE 1–6
a.
L
h.
A
o.
L
b. A
i.
A
p.
E
c.
L
j.
E
q.
A
d. A
k.
E
r.
E
e.
A
l.
A
s.
E
f.
E
m.
E
t.
A
g.
L
n.
E
EXERCISE 1–7

568
Solu ons To Exercises
1. ASSETS
=
Cash + Accounts Receivable + Unused Supplies + Land + Building
+
Equipment
=
$33,000 + $82,000 + $2,000 + $25,000 + $70,000 + $30,000
=
$242,000 Total Assets
2. LIABILITIES
=
Bank Loan + Accounts Payable
=
$15,000 + $27,000
=
$42,000 Total Liabili es
3. ASSETS
=
LIABILITIES + EQUITY
EQUITY
=
$242,000 Total Assets
− $42,000 Total Liabili es
=
$200,000 Total Equity
Since equity is $200,000 and retained earnings is $40,000, share capital must be $160,000.
EXERCISE 1–8
EDW Inc.
EDW Inc.
Income Statement
Statement of Changes in Equity
Month Ended March 31, 2015
Month Ended March 31, 2015
Revenues
Share
Retained
Total
Service Revenue
$20,000
Capital
Earnings
Equity
Expenses
Opening Balance
$
-0-
$
-0-
$
-0-
Wages Expense
$9,000
Shares Issued
2,000
2,000
Miscellaneous Expense
2,500
Net Income
6,000
6,000
Insurance Expense
1,500
Ending Balance
$2,000
$6,000
$8,000
Office Supplies Expense
1,000
14,000
Net Income
$6,000
EDW Inc.
Balance Sheet
March 31, 2015
Assets
Liabili es
Cash
$1,000
Accounts Payable
$5,000
Accounts Receivable
4,000
Equipment
8,000
Equity
Share Capital
$2,000
Retained Earnings
6,000
Total Equity
8,000
Total Assets
$13,000
Total Liabili es and Equity
$13,000
NOTE:
The $2,000 amount for shares issued was calculated using A = L + E or, using the accounts in the
order given in the alphabe zed informa on; 4,000 + 1,000 + 8,000 = 5,000
− 1,500 − 2,500 −
1,000 + 20,000 + Share Capital
− 9,000; 13,000 = 11,000 + Share Capital; 13,000 − 11,000 =
2,000 Share Capital.

Chapter 1 Solu ons
569
Alterna vely, you could have inserted all the values from the alphabe zed informa on into the
financial statements and then solved for the unknown Share Capital amount. There is o en more
than one approach to solving math related ques ons.
EXERCISE 1–9
Algonquin Inc.
Algonquin Inc.
Income Statement
Statement of Changes in Equity
Year Ended July 31, 2015
Year Ended July 31, 2015
Revenues
Share
Retained
Total
Service Revenue
$81,000
Capital
Earnings
Equity
Expenses
Opening Balance
$10,000
$6,000
$16,000
Adver sing Expense
$5,000
Net Income
5,000
5,000
Insurance Expense
7,000
Dividends
(2,000)
(2,000)
Salaries Expense
64,000
76,000
Ending Balance
$10,000
$9,000
$19,000
Net Income
$5,000
Algonquin Inc.
Balance Sheet
July 31, 2015
Assets
Liabili es
Cash
$9,000
Accounts Payable
$3,000
Accounts Receivable
17,000
Note Payable
18,000
Machinery
14,000
Total Liabili es
$21,000
Equity
Share Capital
$10,000
Retained Earnings
9,000
Total Equity
19,000
Total Assets
$40,000
Total Liabili es and Equity
$40,000
EXERCISE 1–10
Algonquin Inc.
Algonquin Inc.
Income Statement
Statement of Changes in Equity
Year Ended July 31, 2015
Year Ended July 31, 2015
Revenues
Share
Retained
Total
Service Revenue
$81,000
Capital
Earnings
Equity
Expenses
Opening Balance
$7,000
$6,000
$13,000
Adver sing Expense
$5,000
Shares Issued
3,000
3,000
Insurance Expense
7,000
Net Income
5,000
5,000
Salaries Expense
64,000
76,000
Dividends
(2,000)
(2,000)
Net Income
$5,000
Ending Balance
$10,000
$9,000
$19,000

570
Solu ons To Exercises
Algonquin Inc.
Balance Sheet
July 31, 2015
Assets
Liabili es
Cash
$9,000
Accounts Payable
$3,000
Accounts Receivable
17,000
Note Payable
18,000
Machinery
14,000
Total Liabili es
$21,000
Equity
Share Capital
$10,000
Retained Earnings
9,000
Total Equity
19,000
Total Assets
$40,000
Total Liabili es and Equity
$40,000
NOTE:
Given that addi onal shares were issued for cash of $3,000 during the year ended July 31, 2015
and share capital had a balance of $10,000 at July 31, 2015, the end of the year, the beginning
balance in share capital must have been $7,000.
EXERCISE 1–11
Wallaby Inc.
Wallaby Inc.
Income Statement
Statement of Changes in Equity
Month Ended March 31, 2015
Month Ended March 31, 2015
Revenues
Share
Retained
Total
Fees Earned
$12,000
Capital
Earnings
Equity
Expenses
Opening Balance
$6,400
$4,000
$10,400
Equipment Rental Expense
$9,400
Net Loss
(1,300)
(1,300)
Wages Expense
3,400
Ending Balance
$6,400
$2,700
$9,100
Fuel Expense
500
13,300
Net Loss
$1,300
Wallaby Inc.
Balance Sheet
March 31, 2015
Assets
Liabili es
Cash
$6,000
Rent Payable
$2,500
Accounts Receivable
1,600
Note Payable
18,000
Truck
22,000
Total Liabili es
$20,500
Equity
Share Capital
$6,400
Retained Earnings
2,700
Total Equity
9,100
Total Assets
$29,600
Total Liabili es and Equity
$29,600

Chapter 1 Solu ons
571
EXERCISE 1–12
Adams Ltd.
Income Statement
For the Month Ended January 31, 2015
Revenue
Service Revenue
$3,335
Expenses
Rent expense
$300
Repairs expense
500
Salaries expense
1,000
Miscellaneous expense
335
Total expenses
2,135
Net Income
$1,200
Adams Ltd.
Statement of Changes in Equity
For the Month Ended January 31, 2015
Share
Retained
Total
Capital
Earnings
Equity
Opening balance
$
-0-
$
-0-
$
-0-
Shares issued
3,000
-0-
3,000
Net income
-0-
1,200
1,200
Ending balance
$3,000
$1,200
$4,200
Adams Ltd.
Balance Sheet
At January 31, 2015
Assets
Cash
$1,000
Land
1,000
Building
2,500
Total assets
$4,500
Liabili es
Accounts payable
$300
Equity
Share capital
$3,000
Retained earnings
1,200
Total equity
4,200
Total liabili es and equity
$4,500

572
Solu ons To Exercises
EXERCISE 1–13
Mitch’s Architects Ltd.
Income Statement
For the Year Ended December 31, 2015
Revenues
Consul ng fees earned
$150,000
Expenses
Office rent expense
$60,000
Salaries and benefits expense
40,000
U li es expense
12,000
Insurance expense
5,000
Supplies and postage expense
2,400
119,400
Net income
$ 30,600
EXERCISE 1–14
Mitch’s Architects Ltd.
Statement of Changes in Equity
For the Year Ended December 31, 2015
Share
Retained
Total
Capital
Earnings
Equity
Opening balance*
$20,400
$ 6,000
$ 26,400
Shares issued**
10,000
10,000
Net income
30,600
30,600
Dividends***
(1,000)
(1,000)
Ending balance
$30,400
$ 35,600
$66,000
* Share capital opening balance ($30,400
− 10,000)
* Retained earnings opening balance ($5,000 balance + 1,000 dividends)
** Share capital issued during the current year given in the ques on as $10,000
*** Dividends paid during the current year given in the ques on as $1,000
EXERCISE 1–15

Chapter 1 Solu ons
573
Mitch’s Architects Ltd.
Balance Sheet
At December 31, 2015
Assets
Liabili es
Cash
$ 23,000
Accounts payable
$30,000
Accounts receivable
24,000
Unearned consul ng fees
15,000
Office supplies inventory
2,000
Total liabili es
$ 45,000
Prepaid insurance
7,000
Equity
Truck
40,000
Share capital
$30,400
Office equipment
15,000
Retained earnings
35,600
Total equity
66,000
Total assets
$111,000
Total liabili es and equity
$111,000
EXERCISE 1–16
Gillespie Corp.
Income Statement
For the Year Ended May 31, 2015
Revenues
Service revenue
$382,000
Rent revenue
90,000
Total Revenue
472,000
Expenses
Warehouse rent expense
100,000
Salaries and benefits expense
110,000
U li es expense
42,000
Insurance expense
15,000
Shop supplies expense
6,000
Net income
$199,000

574
Solu ons To Exercises
Gillespie Corp.
Statement of Changes in Equity
At May 31, 2015
Share
Retained
Total
Capital
Earnings
Equity
Opening balance
$5,000
$140,000
$145,000
Net income
199,000
199,000
Dividends
(10,000)
(10,000)
Ending balance
$5,000
$ 329,000
$334,000
Gillespie Corp.
Balance Sheet
For the Year Ended May 31, 2015
Assets
Liabili es
Cash
$ 50,000
Accounts payable
$130,000
Accounts receivable
85,000
Unearned service revenue
25,000
Prepaid adver sing
17,000
Total liabili es
$155,000
Shop supplies
52,000
Equity
Building
240,000
Share capital
$
5,000
Office equipment
45,000
Retained earnings
329,000
Total equity
334,000
Total assets
$489,000
Total liabili es and equity
$489,000
EXERCISE 1–17
Using the same calcula on as the retained earnings column in the statement of changes in equity:
Opening retained earnings + Net income (or minus net loss) – Dividends = Ending retained earnings
a. $50,000 + Net income ? – 20,000 = $40,000
Net income = $40,000 – 50,000 + 20,000 = $10,000
b. Retained earnings opening balance ? + 150,000 – 40,000 = $130,000
Retained earnings opening balance = $130,000 – 150,000 + 40,000 = $20,000
c. $75,000 – 35,000 – Dividends ? = $40,000
Dividends = $40,000 – 75,000 + 35,000 = 0
EXERCISE 1–18

Chapter 1 Solu ons
575
a.
Assets
=
Liabili es +
Equity
Balances at April 1, 2015
$100,000
$60,000
$40,000
10,000
April net income(loss)
Balances at April 30, 2015
$180,000 =
$130,000
+
$50,000
b.
Assets
=
Liabili es +
Equity
Balances at April 1, 2015
$100,000
$60,000
$40,000
$50,000
Shares issued in April
(40,000)
April net income(loss)
Balances at April 30, 2015
$180,000 =
$130,000
+
$50,000
c.
Assets
=
Liabili es +
Equity
Balances at April 1, 2015
$100,000
$60,000
$40,000
14,000
April net income(loss)
(4,000)
Dividends paid in April
Balances at April 30, 2015
$180,000 =
$130,000
+
$50,000
EXERCISE 1–19

576
Solu ons To Exercises
a.
Assets
=
Liabili es +
Equity
Balances at June 1, 2015
$160,000
$100,000
$60,000
$70,000
June net income(loss)
(20,000)
Dividends paid in June
Balances at June 30, 2015
$200,000 =
$90,000
+
$110,000
b.
Assets
=
Liabili es +
Equity
Balances at June 1, 2015
$160,000
$100,000
$60,000
$40,000
Shares issued in June
$90,000
June net income(loss)
(80,000)
Dividends paid in June
Balances at June 30, 2015
$200,000 =
$90,000
+
$110,000
c.
Assets
=
Liabili es +
Equity
Balances at June 1, 2015
$160,000
$100,000
$60,000
$130,000
Shares issued in June
($80,000) June net income(loss)
-0-
Dividends paid in June
Balances at June 30, 2015
$200,000 =
$90,000
+
$110,000
EXERCISE 1–20
a.
3
Purchased a truck for cash.
b.
1
Issued share capital for cash.
c.
2
Incurred a bank loan as payment for equipment.
d.
3
Made a deposit for electricity service to be provided to the company in the
future.
e.
4
Paid rent expense.
f.
NT
Signed a new union contract that provides for increased wages in the future.
g.
NT
Wrote a le er of complaint to the prime minister about a mail strike and hired
a messenger service to deliver le ers.
h.
4
Received a collect telegram from the prime minister; paid the messenger.
i.
1
Billed customers for services performed.
j.
5
Made a cash payment to sa sfy an outstanding obliga on.
k.
3
Received a payment of cash in sa sfac on of an amount owed by a customer.
l.
1
Collected cash from a customer for services rendered.
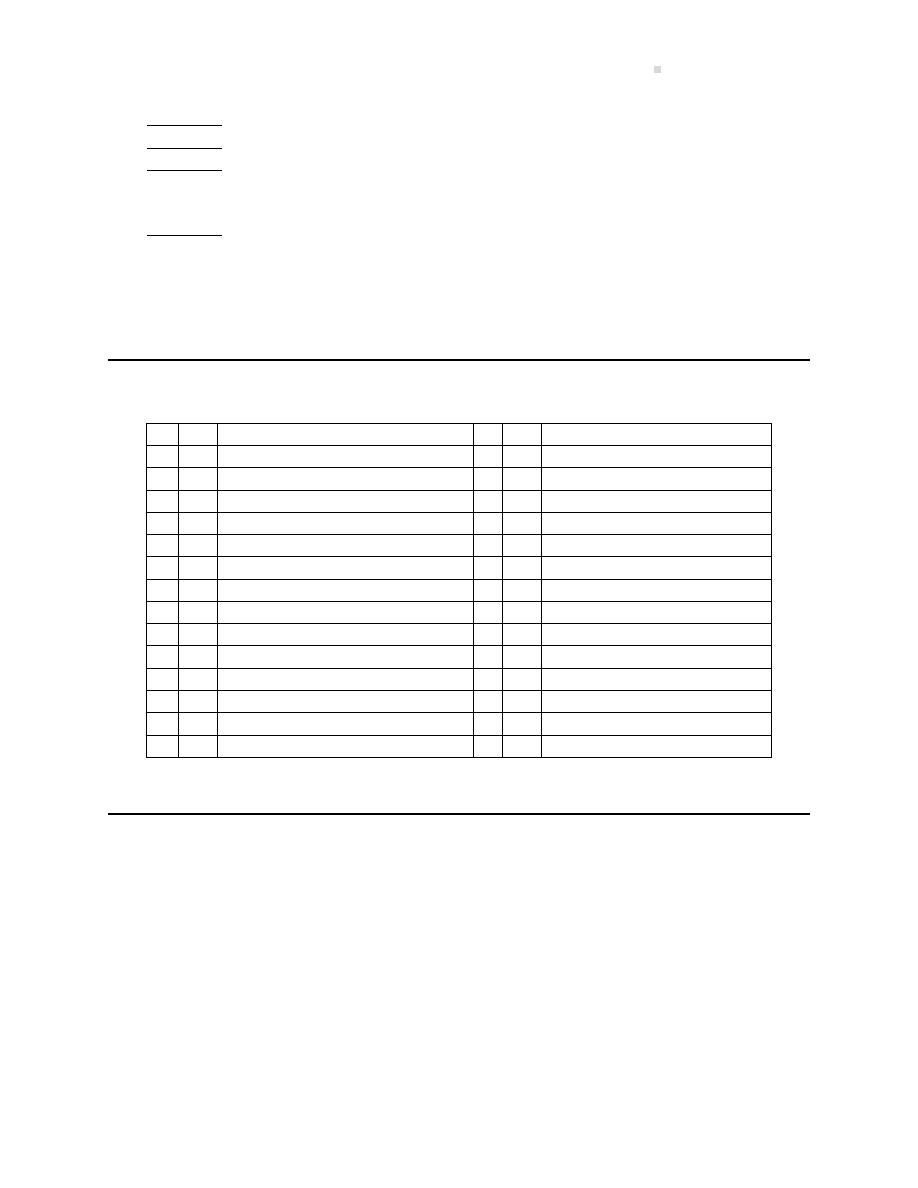
Chapter 2 Solu ons
577
m.
4
Paid cash for truck opera on expenses.
n.
5&4
Made a monthly payment on the bank loan; this payment included a payment
on part of the loan and also an amount of interest expense. (Hint: This
transac on affects more than two parts of the accoun ng equa on.)
o.
7
Issued shares in the company to pay off a loan.
Chapter 2 Solu ons
EXERCISE 2–1
a.
b.
L
CR
Unearned consul ng fees
A
DR
Vehicles
A
DR
Prepaid insurance
E
DR
Deprecia on expense
A
DR
Office supplies
R
CR
Interest income
A
DR
Notes receivable
E
DR
Interest expense
R
CR
Insurance fee revenue
A
DR
Furniture
L
CR
Unearned insurance fee revenue
L
CR
U li es payable
E
DR
Salary and benefits expense
L
CR
Unearned rent revenue
A
DR
Small tools and supplies
E
CR
Retained earnings
R
CR
Service fees earned
L
CR
Salaries and benefits payable
R
CR
Service fees revenue
E
DR
Compensa on expense
L
CR
Notes payable
R
CR
Interest earned
A
DR
Buildings
E
DR
Meals and mileage expense
L
CR
Rent payable
L
CR
Unearned service fees
E
CR
Share capital
A
DR
Equipment
EXERCISE 2–2
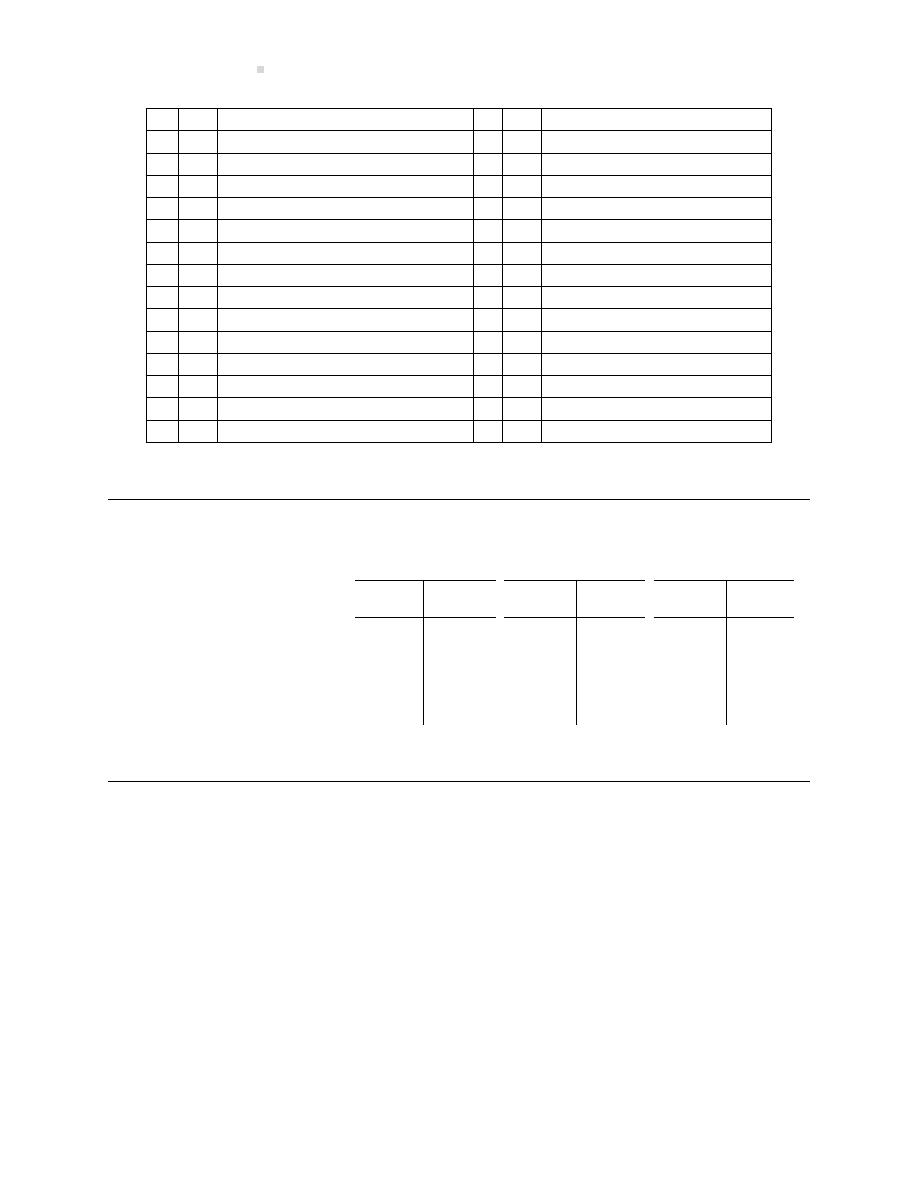
578
Solu ons To Exercises
a.
b.
L
DR
Unearned consul ng fees
A
CR
Vehicles
A
CR
Prepaid insurance
E
CR
Deprecia on expense
A
CR
Office supplies
R
DR
Interest income
A
CR
Notes receivable
E
CR
Interest expense
R
DR
Insurance fee revenue
A
CR
Furniture
L
DR
Unearned insurance fee revenue
L
DR
U li es payable
E
CR
Salary and benefits expense
L
DR
Unearned rent revenue
A
CR
Small tools and supplies
E
DR
Retained earnings
R
DR
Service fees earned
L
DR
Salaries and benefits payable
R
DR
Service fees revenue
E
CR
Compensa on expense
L
DR
Notes payable
R
DR
Interest earned
A
CR
Buildings
E
CR
Meals and mileage expense
L
DR
Rent payable
L
DR
Unearned service fees
E
DR
Share capital
A
CR
Equipment
EXERCISE 2–3
Assets
Liabili es
Equity
Debit Credit
Debit Credit
Debit Credit
(increase) (decrease)
(decrease) (increase)
(decrease) (increase)
2. Borrowed $5,000 from the bank.
5,000
5,000
3. Paid $2,000 of the bank loan.
2,000
2,000
4. Paid $600 in advance for a
one-year insurance policy.
600 600
5. Received $500 in advance for next
month’s rental of office space.
500
500
EXERCISE 2–4

Chapter 2 Solu ons
579
Debit
Credit
2. Purchased equipment on credit.
Equipment
Accounts Payable
3. Paid for a one-year insurance policy.
Prepaid Expenses
Cash
4. Billed a customer for repairs completed today.
Accounts Receivable
Repair Revenue
5. Paid this month’s rent.
Rent Expense
Cash
6. Collected the amount billed in transac on 4 above.
Cash
Accounts Receivable
7. Collected cash for repairs completed today.
Cash
Repair Revenue
8. Paid for the equipment purchased in transac on
Accounts Payable
Cash
2 above.
9. Signed a union contract.
No Entry
No Entry
10. Collected cash for repairs to be made for
Cash
Unearned Revenue
customers next month.
11. Transferred this month’s por on of prepaid
Insurance Expense
Prepaid Expenses
insurance that was used to Insurance Expense.
EXERCISE 2–5
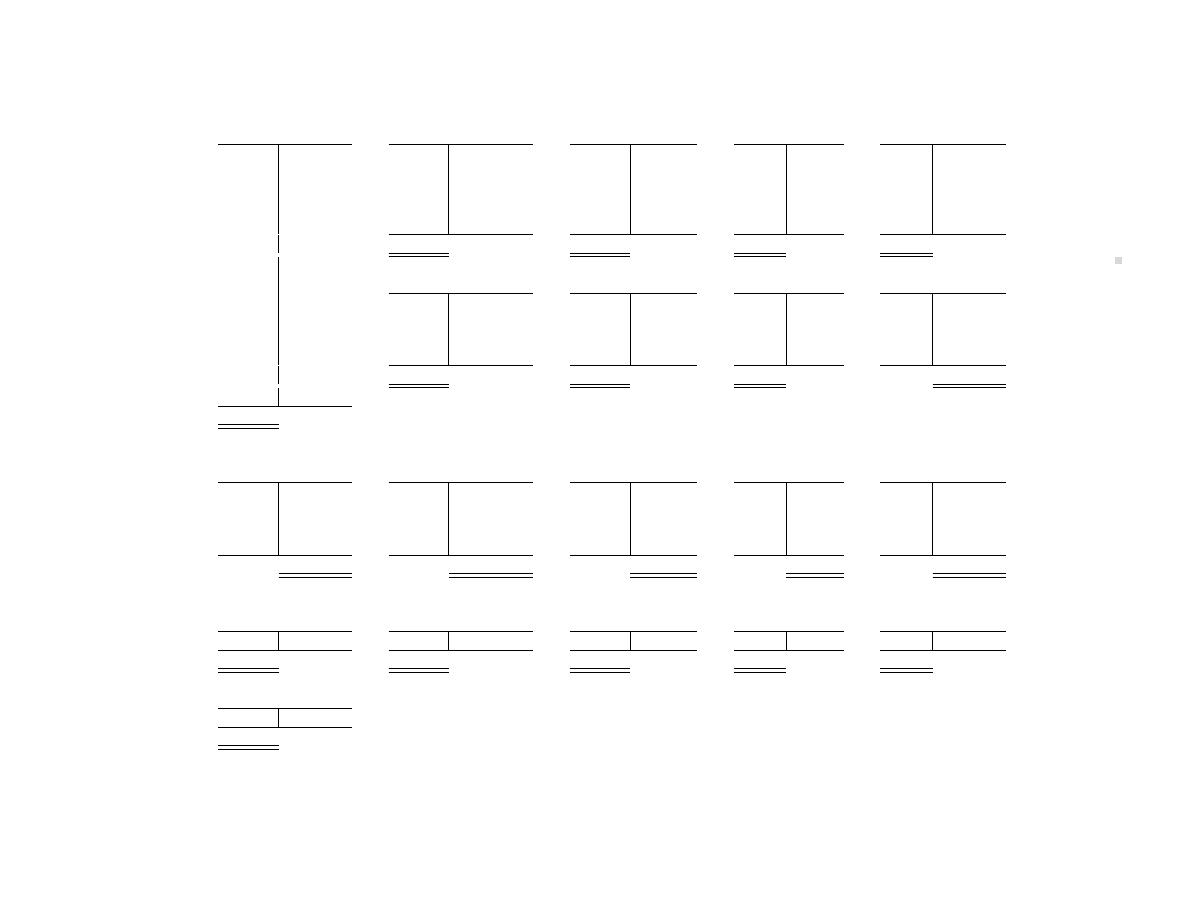
580
Soluons
To
Ex
er
cises
Office Supplies
#
Cash
#
Accounts Receivable
#
Prepaid Rent
#
Inventory
#
Equipment
1
3,000
6
12,000
22
5,000
19
3,000
8
1,000
3
10,000
7
7,000
4
2,000
9
12,000
8
1,000
13
5,000
9
12,000
20
8,000
10
5,000
Bal
10,000
Bal
5,000
Bal
3,000
Bal
1,000
11
1,500
12
25
#
Vehicle
#
Furniture
#
Computer
#
Accounts Payable
13
5,000
14
30,000
16
3,000
21
2,500
2
200
14
10,000
15
200
15
200
16
3,000
17
2,000
19
3,000
18
2,000
Bal
30,000
Bal
3,000
Bal
2,500
Bal
6,000
22
5,000
Bal
9,275
Unearned Service
#
Loan Payable
#
Notes Payable
#
Revenue
#
Share Capital
#
Service Revenue
3
10,000
5
5,000
18
2,000
1
3,000
6
12,000
11
1,350
14
20,000
7
7,000
21
2,500
17
2,000
20
8,000
Bal
8,650
Bal
27,500
Bal
2,000
Bal
3,000
Bal
29,000
Vehicle/Travel
#
Electricity Expense
#
Expense
#
Repairs Expense
#
Rent Expense
#
Salaries Expense
2
200
12
25
5
5,000
10
5,000
4
2,000
Bal
200
Bal
25
Bal
5,000
Bal
5,000
Bal
2,000
#
Interest Expense
11
150
Debits
76,150
Bal
150
Credits
76,150

Chapter 2 Solu ons
581
EXERCISE 2–6
BOLA Co.
Trial Balance
At August 31, 2016
Debit
Credit
Cash
$ 9,275
Accounts receivable
10,000
Prepaid rent
5,000
Office supplies inventory
3,000
Equipment
1,000
Vehicle
30,000
Furniture
3,000
Computer
2,500
Accounts payable
$ 6,000
Loan payable
8,650
Notes payable
27,500
Unearned service revenue
2,000
Share capital
3,000
Service revenue
29,000
Electricity expense
200
Vehicle/travel expense
25
Repairs expense
5,000
Rent expense
5,000
Salaries expense
2,000
Interest expense
150
$76,150
$76,150
EXERCISE 2–7

582
Solu ons To Exercises
BOLA Co.
Income Statement
For the Month Ended August 31, 2016
Revenues
Service revenue
$29,000
Expenses
Electricity expense
$
200
Vehicle/Travel expense
25
Repairs expense
5,000
Rent expense
5,000
Salaries expense
2,000
Interest expense
150
12,375
Net income
$16,625
BOLA Co.
Statement of Changes in Equity
For the Month Ended August 31, 2016
Share
Retained
Total
Capital
Earnings
Equity
Opening balance
$
–
$
–
$
–
Shares issuance
3,000
3,000
Net income
16,625
16,625
Ending balance
$3,000
$ 16,625
$19,625
BOLA Co.
Balance Sheet
At August 31, 2016
Assets
Liabili es
Cash
$ 9,275
Accounts payable
$ 6,000
Accounts receivable
10,000
Loan payable
8,650
Prepaid rent
5,000
Note payable
27,500
Office supplies inventory
3,000
Unearned service revenue
2,000
Equipment
1,000
Total liabili es
$44,150
Vehicle
30,000
Equity
Furniture
3,000
Share capital
$ 3,000
Computer
2,500
Retained earnings
16,625
Total equity
19,625
Total assets
$63,775
Total liabili es and equity
$63,775

Chapter 2 Solu ons
583
EXERCISE 2–8
Cash
Bank Loan
Share Capital
Repair Revenue
(1) 5,000 (2)
900 (8) 2,500 (5) 7,500
(1) 5,000
(3) 1,500
(5) 7,500 (8) 2,500
(6)
500 (10) 2,000
Accounts Receivable
Accounts Payable
Electricity Expense
(3) 1,500 (6)
500 (10) 2,000 (4) 2,000
(7) 200
(7)
200
Prepaid Expense
Rent Expense
(2)
900 (11)
300
(11) 300
Unused Supplies
Supplies Expense
(4) 2,000 (9)
800
(9) 800
EXERCISE 2–9
Cross Corpora on
Trial Balance
At December 31, 2015
Account Balances
Debits
Credits
Cash
$120,400
Accounts Receivable
26,000
Unused Supplies
6,000
Land
8,000
Building
120,000
Accounts Payable
$30,000
Loan Payable
80,000
Share Capital
170,000
Commissions Earned
5,000
Insurance Expense
100
Rent Expense
1,000
Salaries Expense
3,000
Supplies Expense
300
Telephone Expense
200
–
Total
$285,000
$285,000

584
Solu ons To Exercises
EXERCISE 2–10
General Journal
Date
Account/Explana on
PR
Debit
Credit
Cash . . . . . . . . . . . . . . . . . . . . . . . . . . . . . . . . . .
3,000
Share Capital . . . . . . . . . . . . . . . . . . . . . . .
3,000
(a) To record the issuance of share capital.
Equipment . . . . . . . . . . . . . . . . . . . . . . . . . . . .
2,000
Accounts Payable . . . . . . . . . . . . . . . . . . .
2,000
(b) To record the purchase of equipment
on account.
Rent Expense . . . . . . . . . . . . . . . . . . . . . . . . . .
400
Cash . . . . . . . . . . . . . . . . . . . . . . . . . . . . . . .
400
(c) To record the payment of rent for the
month.
Supplies . . . . . . . . . . . . . . . . . . . . . . . . . . . . . . .
4,000
Accounts Payable . . . . . . . . . . . . . . . . . . .
4,000
(d) To record the purchase of supplies.
Accounts Receivable . . . . . . . . . . . . . . . . . . .
2,500
Repair Revenue . . . . . . . . . . . . . . . . . . . . .
2,500
(e) To record repair revenue.
Accounts Payable . . . . . . . . . . . . . . . . . . . . . .
2,000
Cash . . . . . . . . . . . . . . . . . . . . . . . . . . . . . . .
2,000
(f) To record the payment on account.
Cash . . . . . . . . . . . . . . . . . . . . . . . . . . . . . . . . . .
500
Accounts Receivable . . . . . . . . . . . . . . . .
500
(g) To record collec on of an amount
owed.
Cash . . . . . . . . . . . . . . . . . . . . . . . . . . . . . . . . . .
1,000
Equipment . . . . . . . . . . . . . . . . . . . . . . . . .
1,000
(h) To record the sale of equipment.
EXERCISE 2–11

Chapter 2 Solu ons
585
General Journal
Date
Account/Explana on
PR
Debit
Credit
Cash . . . . . . . . . . . . . . . . . . . . . . . . . . . . . . . . . .
XX
Share Capital . . . . . . . . . . . . . . . . . . . . . . .
XX
(1) To record issuance of share capital
Unused Supplies . . . . . . . . . . . . . . . . . . . . . . .
XX
Cash . . . . . . . . . . . . . . . . . . . . . . . . . . . . . . .
XX
Accounts Payable . . . . . . . . . . . . . . . . . . .
XX
(2) To record the purchase of supplies.
Cash . . . . . . . . . . . . . . . . . . . . . . . . . . . . . . . . . .
XX
Repair Revenue . . . . . . . . . . . . . . . . . . . . .
XX
(3) To record revenue earned.
Accounts receivable . . . . . . . . . . . . . . . . . . . .
XX
Repair Revenue . . . . . . . . . . . . . . . . . . . . .
XX
(4) To record revenue earned.
Prepaid Expense . . . . . . . . . . . . . . . . . . . . . . .
XX
Cash . . . . . . . . . . . . . . . . . . . . . . . . . . . . . . .
XX
(5) To record expense paid in advance.
Supplies Expense . . . . . . . . . . . . . . . . . . . . . .
XX
Accounts Payable . . . . . . . . . . . . . . . . . . .
XX
(6) To record supplies purchased and
used.
Rent Expense . . . . . . . . . . . . . . . . . . . . . . . . . .
XX
Accounts Payable . . . . . . . . . . . . . . . . . . .
XX
(7) To record rent expense.
Cash . . . . . . . . . . . . . . . . . . . . . . . . . . . . . . . . . .
XX
Unused Supplies . . . . . . . . . . . . . . . . . . . .
XX
(8) To record the sale of supplies.
Electricity Expense . . . . . . . . . . . . . . . . . . . . .
XX
Prepaid Expense . . . . . . . . . . . . . . . . . . . .
XX
(9) To record electricity expense for the
month.
Accounts Payable . . . . . . . . . . . . . . . . . . . . . .
XX
Cash . . . . . . . . . . . . . . . . . . . . . . . . . . . . . . .
XX
(10) To record payment on account.
Cash . . . . . . . . . . . . . . . . . . . . . . . . . . . . . . . . . .
XX
Bank Loan . . . . . . . . . . . . . . . . . . . . . . . . . .
XX
(11) To record the issuance of a bank loan.
EXERCISE 2–12

586
Soluons
To
Ex
er
cises
a. General Ledger T-accounts with transac ons:
Cash
Accounts Payable
Share Capital
Service Revenue
Jan. 1
10,000
Jan. 5
200
Jan. 28
450
Jan. 1
10,000
Jan. 11
1,300
11
1,300
4
4,000
31
1,600
30
1,800
Bal.
5,300
Bal.
2,900
Accounts Receivable
Rent Expense
Jan. 31
1,600
Jan. 5
200
Unused Supplies
Truck Opera on Expense
Jan. 9
4,000 Jan. 31
200
Jan. 28
450
Bal.
3,800
Salaries Expense
Jan. 30 1,800
Supplies Expense
Jan. 31
200

Chapter 2 Solu ons
587
b. Trial balance is as follows:
Elgert Corpora on
Trial Balance
January 31, 2015
Debit
Credit
Cash
$5,300
Accounts receivable
1,600
Unused supplies
3,800
Accounts payable
$450
Share capital
10,000
Service revenue
2,900
Rent expense
200
Truck opera on expense
450
Salaries expense
1,800
Supplies expense
200
Total
$13,350
$13,350
c. Income statement, statement of changes in equity, and the balance sheet are as follows:
Elgert Corpora on
Income Statement
For the Month Ended January 31, 2015
Revenue
Service revenue
$2,900
Expenses
Rent expense
$200
Truck opera on expense
450
Salaries expense
1,800
Supplies expense
200
Total expenses
2,650
Net income
$250
Elgert Corpora on
Statement of Changes in Equity
For the Month Ended January 31, 2015
Share
Retained
Total
Capital
Earnings
Equity
Opening balance
$
0
$
0
$
0
Shares issued
10,000
0
10,000
Net income
0
250
250
Ending balance
$10,000
$250
$10,250
588
Solu ons To Exercises
Elgert Corpora on
Balance Sheet
At January 31, 2015
Assets
Cash
$5,300
Accounts receivable
1,600
Unused supplies
3,800
Total assets
$10,700
Liabili es
Accounts payable
$450
Equity
Share capital
$10,000
Retained earnings
250
10,250
Total liabili es and equity
$10,700
EXERCISE 2–13
1. Adjus ng Entry required to correct the error:
General Journal
Date
Account/Explana on
PR
Debit
Credit
Cash . . . . . . . . . . . . . . . . . . . . . . . . . . . . . . . . . .
1,500
Accounts payable . . . . . . . . . . . . . . . . . . .
150
Adver sing expense . . . . . . . . . . . . . . . . .
1,350
2. Adjus ng Entry required to correct the error:
General Journal
Date
Account/Explana on
PR
Debit
Credit
Salaries expense . . . . . . . . . . . . . . . . . . . . . . .
4,400
Cash . . . . . . . . . . . . . . . . . . . . . . . . . . . . . . .
4,400
3. Adjus ng Entry required to correct the error:
General Journal
Date
Account/Explana on
PR
Debit
Credit
Repairs expense . . . . . . . . . . . . . . . . . . . . . . .
1,500
Prepaid repairs . . . . . . . . . . . . . . . . . . . . .
1,500
4. Adjus ng Entry required to correct the error:
General Journal
Date
Account/Explana on
PR
Debit
Credit
Accounts receivable . . . . . . . . . . . . . . . . . . . .
3,400
Revenue . . . . . . . . . . . . . . . . . . . . . . . . . . .
3,400
Chapter 3 Solu ons
589
5. Adjus ng Entry required to correct the error:
General Journal
Date
Account/Explana on
PR
Debit
Credit
Rent expense . . . . . . . . . . . . . . . . . . . . . . . . . .
5,500
Cash . . . . . . . . . . . . . . . . . . . . . . . . . . . . . . .
5,500
6. Adjus ng Entry required to correct the error:
General Journal
Date
Account/Explana on
PR
Debit
Credit
Revenue . . . . . . . . . . . . . . . . . . . . . . . . . . . . . .
4,000
Unearned revenue . . . . . . . . . . . . . . . . . .
4,000
7. Adjus ng Entry required to correct the error:
General Journal
Date
Account/Explana on
PR
Debit
Credit
Accounts receivable . . . . . . . . . . . . . . . . . . . .
8,000
Accounts payable . . . . . . . . . . . . . . . . . . .
8,000
8. Adjus ng Entry required to correct the error:
General Journal
Date
Account/Explana on
PR
Debit
Credit
Prepaid rent . . . . . . . . . . . . . . . . . . . . . . . . . . .
10,000
Rent expense . . . . . . . . . . . . . . . . . . . . . . .
10,000
Chapter 3 Solu ons
EXERCISE 3–1
a. and c.
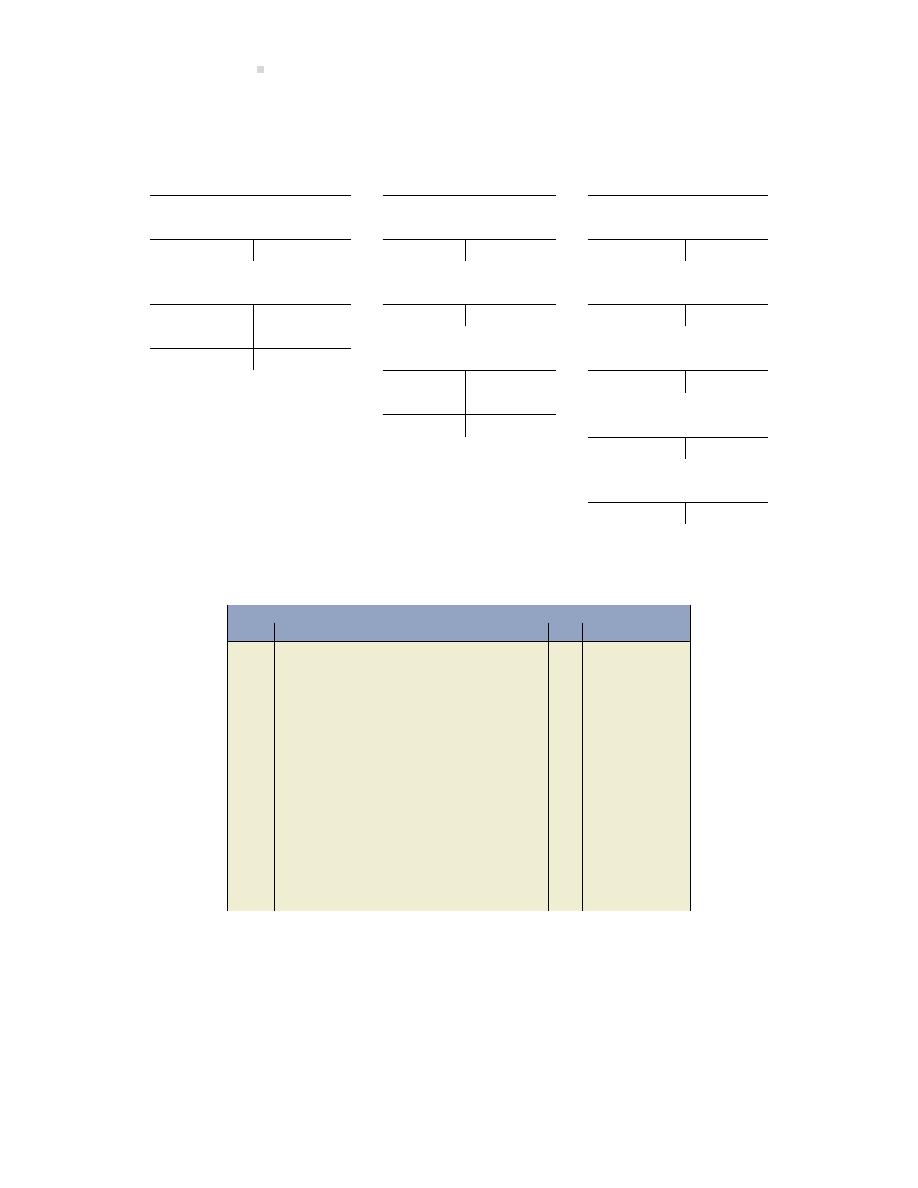
590
Solu ons To Exercises
Graham Corpora on
General Ledger
ASSETS
=
LIABILITIES
+
EQUITY
Interest Receivable
Interest Payable
Interest Earned
(a)
110
(c)
90
(a)
110
Prepaid Insurance
Salaries Payable
Rent Earned
1,800
(d)
450
(e) 500
(b)
1,200
Bal.
600
Unearned Rent
Insurance Expense
700
(b) 1,200
(e)
500
Bal. 200
Interest Expense
(c)
90
Salaries Expense
(d)
450
b.
General Journal
Date
Account/Explana on
PR
Debit
Credit
Interest Receivable . . . . . . . . . . . . . . . . . . . . .
110
Interest Earned . . . . . . . . . . . . . . . . . . . . .
110
(a)
Insurance Expense . . . . . . . . . . . . . . . . . . . . .
1,200
Prepaid Insurance. . . . . . . . . . . . . . . . . . .
1,200
(b)
Interest Expense . . . . . . . . . . . . . . . . . . . . . . .
90
Interest Payable . . . . . . . . . . . . . . . . . . . .
90
(c)
Salaries Expense . . . . . . . . . . . . . . . . . . . . . . .
450
Salaries Payable . . . . . . . . . . . . . . . . . . . .
450
(d)
Unearned Rent . . . . . . . . . . . . . . . . . . . . . . . .
500
Rent Earned . . . . . . . . . . . . . . . . . . . . . . . .
500
(e)
d.

Chapter 3 Solu ons
591
Revenues
Interest Earned
$110
Rent Earned
500
Expenses
Insurance Expense
$1,200
Interest Expense
90
Salaries Expense
450
EXERCISE 3–2
a. The adjustments column is as follows:
Lauer Corpora on
Trial
Adjusted
Balance
Adjustments
Trial Balance
Dr.
Cr.
Dr.
Cr.
Dr.
Cr.
Cash
$4,000
$4,000
Accounts Receivable
5,000
5,000
Prepaid Insurance
3,600
(a)
$300
3,300
Prepaid Rent
1,000
(b)
500
500
Truck
6,000
6,000
Accumulated
Deprecia on – Truck
(c)
1,500
$1,500
Accounts Payable
$7,000
(d)
400
7,400
Salaries Payable
(e)
1,000
1,000
Unearned Rent
1,200 (f)
$600
600
Share Capital
2,700
2,700
Revenue
25,000
25,000
Rent Earned
(f)
600
600
Adver sing Expense
700
700
Commissions Expense
2,000
2,000
Deprecia on Expense
(c)
1,500
1,500
Insurance Expense
(a)
300
300
Interest Expense
100
(d)
400
500
Rent Expense
5,500
(b)
500
6,000
Salaries Expense
8,000
(e)
1,000
9,000
Totals
$35,900
$35,900
$4,300
$4,300
$38,800
$38,800
b. The general journal is as follows:
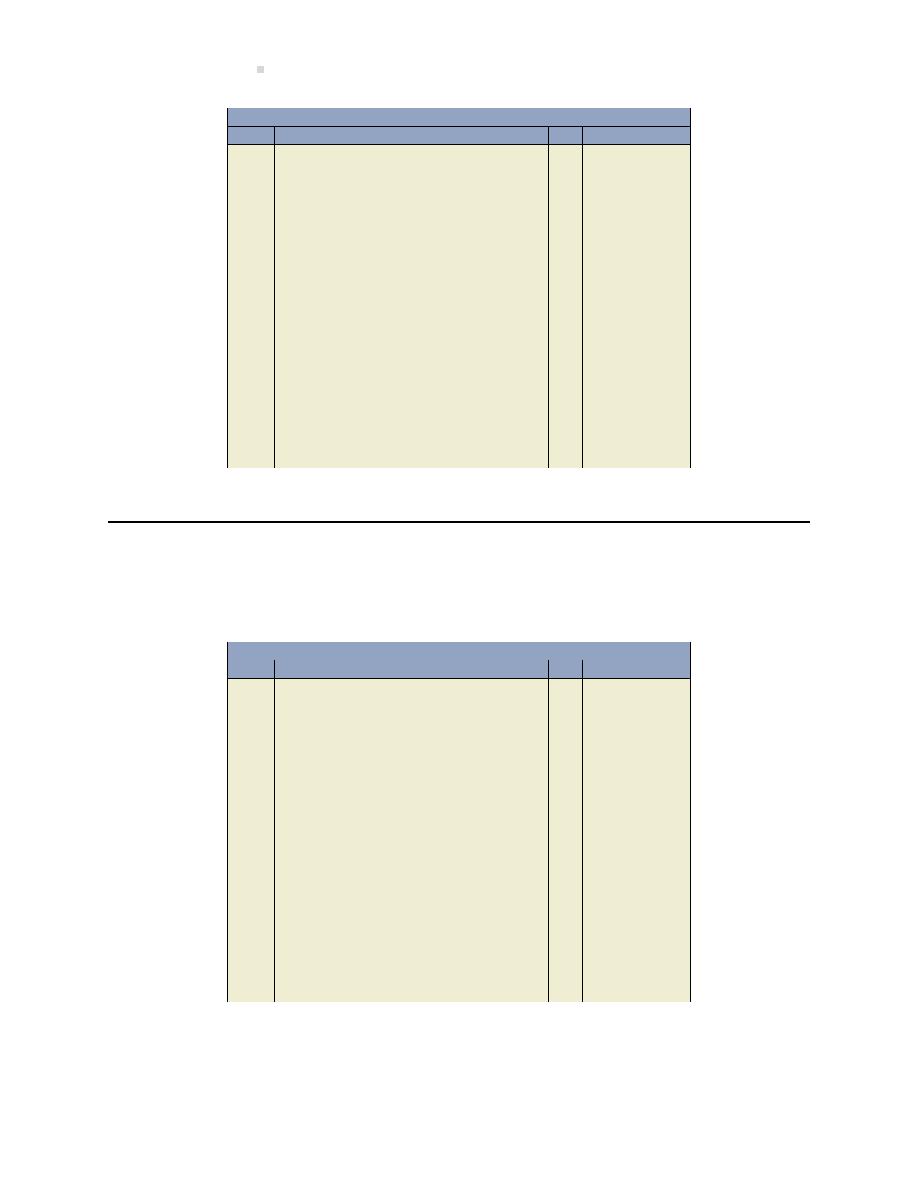
592
Solu ons To Exercises
General Journal
Date
Account/Explana on
PR
Debit
Credit
Insurance Expense . . . . . . . . . . . . . . . . . . . . .
300
Prepaid Insurance. . . . . . . . . . . . . . . . . . .
300
(a) To record expiry of prepaid insurance.
Rent Expense . . . . . . . . . . . . . . . . . . . . . . . . . .
500
Prepaid Rent . . . . . . . . . . . . . . . . . . . . . . .
500
(b) To record expiry of prepaid rent.
Deprecia on Expense . . . . . . . . . . . . . . . . . .
1,500
Accumulated Deprecia on – Truck. . . .
1,500
(c) To record truck deprecia on.
Interest Expense . . . . . . . . . . . . . . . . . . . . . . .
400
Accounts Payable . . . . . . . . . . . . . . . . . . .
400
(d) To accrue interest.
Salaries Expense . . . . . . . . . . . . . . . . . . . . . . .
1,000
Salaries Payable . . . . . . . . . . . . . . . . . . . .
1,000
(e) To accrue unpaid salaries.
Unearned Rent . . . . . . . . . . . . . . . . . . . . . . . .
600
Rent Earned . . . . . . . . . . . . . . . . . . . . . . . .
600
(f) To record expiry of unearned rent.
EXERCISE 3–3
a. The general journal is as follows:
General Journal
Date
Account/Explana on
PR
Debit
Credit
Rent Expense . . . . . . . . . . . . . . . . . . . . . . . . . .
200
Prepaid Rent . . . . . . . . . . . . . . . . . . . . . . .
200
(a) To adjust prepaid rent account to the
proper balance.
Office Supplies Expense. . . . . . . . . . . . . . . . .
400
Unused Office Supplies . . . . . . . . . . . . . .
400
(b) To record the ending balance of sup-
plies on hand.
Income Taxes Expense . . . . . . . . . . . . . . . . . .
5,000
Income Taxes Payable . . . . . . . . . . . . . . .
5,000
(c) To record income taxes for the period.
Unearned Commissions . . . . . . . . . . . . . . . .
1,000
Commissions Earned . . . . . . . . . . . . . . . .
1,000
(d) To record the proper balance in the Un-
earned Commissions account.
Salaries Expense . . . . . . . . . . . . . . . . . . . . . . .
300
Salaries Payable . . . . . . . . . . . . . . . . . . . .
300
(e) To accrue salaries for the period.
b. Assets would be overstated by $600 [(a): 200 + (b): 400].
Liabili es would be understated by $4,300 [(c): 5,000
− (d): 1,000 + (e): 300].
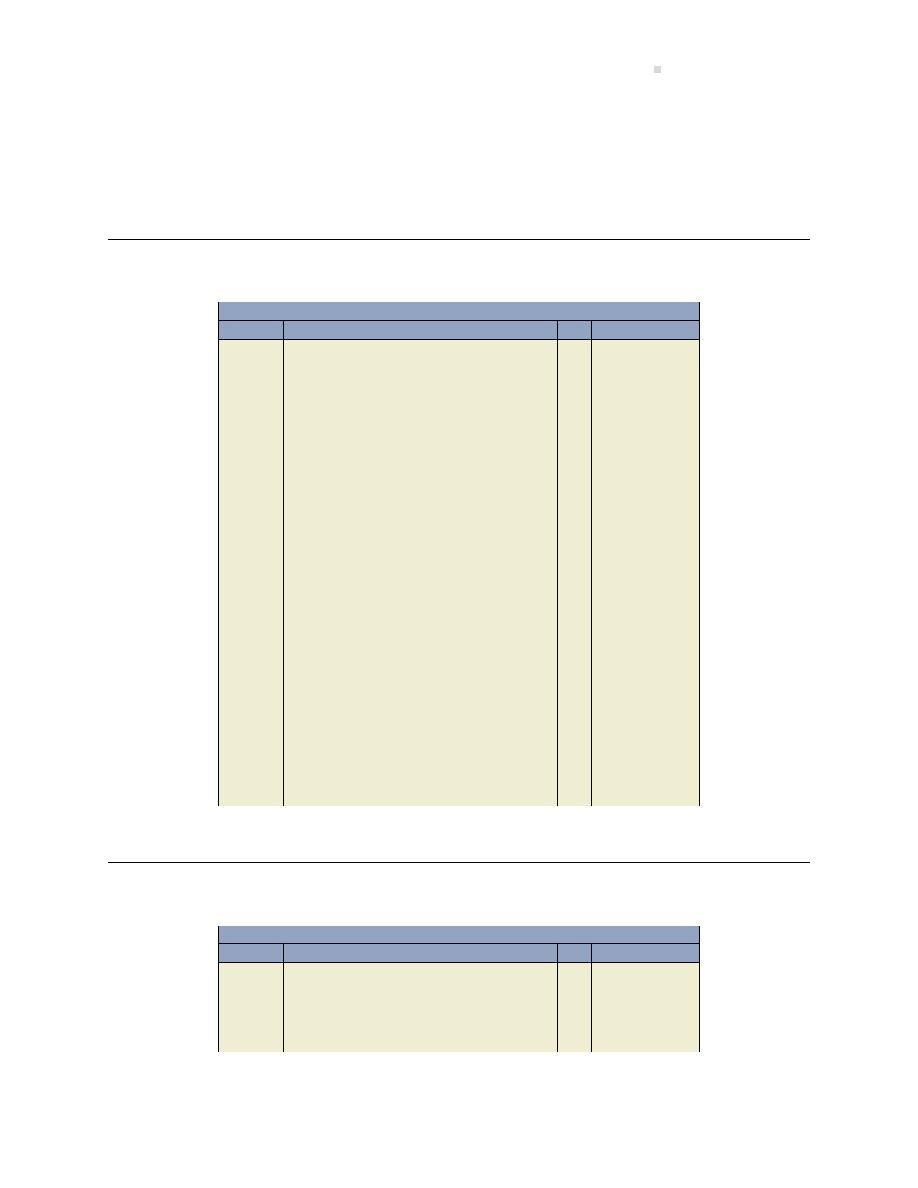
Chapter 3 Solu ons
593
Revenue would be understated by $1,000 (d).
Expenses would be understated by $5,900 [(a): 200 + (b): 400 + (c): 5,000 + (e): 300].
Equity would be overstated by $4,900 [(a):200 + (b):400 + (c):5,000
− (d):1,000 + (e):300].
EXERCISE 3–4
General Journal
Date
Account/Explana on
PR
Debit
Credit
Dec. 31
Adver sing Expense . . . . . . . . . . . . . . . . . . . .
500
Prepaid Adver sing . . . . . . . . . . . . . . . . .
500
To record the expired por on of adver s-
ing for the period.
31
Supplies Expense . . . . . . . . . . . . . . . . . . . . . .
400
Unused Supplies . . . . . . . . . . . . . . . . . . . .
400
To record the remaining amount of sup-
plies on hand.
31
Deprecia on Expense – Equipment . . . . . .
250
Accumulated Deprecia on – Equip-
ment . . . . . . . . . . . . . . . . . . . . . . . . . . . . . . . . .
250
To record the deprecia on for the period.
31
Maintenance Expense . . . . . . . . . . . . . . . . . .
200
Telephone Expense . . . . . . . . . . . . . . . . . . . . .
100
U li es Expense . . . . . . . . . . . . . . . . . . . . . . .
400
Commissions Expense . . . . . . . . . . . . . . . . . .
800
Accounts Payable . . . . . . . . . . . . . . . . . . .
1,500
To record expenses incurred but not yet
paid for the period.
31
Salaries Expense . . . . . . . . . . . . . . . . . . . . . . .
700
Salaries Payable . . . . . . . . . . . . . . . . . . . .
700
To record salaries accrued for the period.
31
Unearned Subscrip ons . . . . . . . . . . . . . . . .
5,000
Subscrip on Revenue . . . . . . . . . . . . . . .
5,000
To record subscrip ons earned for the pe-
riod.
EXERCISE 3–5
General Journal
Date
Account/Explana on
PR
Debit
Credit
Dec. 31
Deprecia on Expense – Truck . . . . . . . . . . .
1,200
Accumulated Deprecia on – Truck. . . .
1,200
To record addi onal truck deprecia on
for the year ($2,500
− 1,300) ($10,000/4
years = $2,500/year).
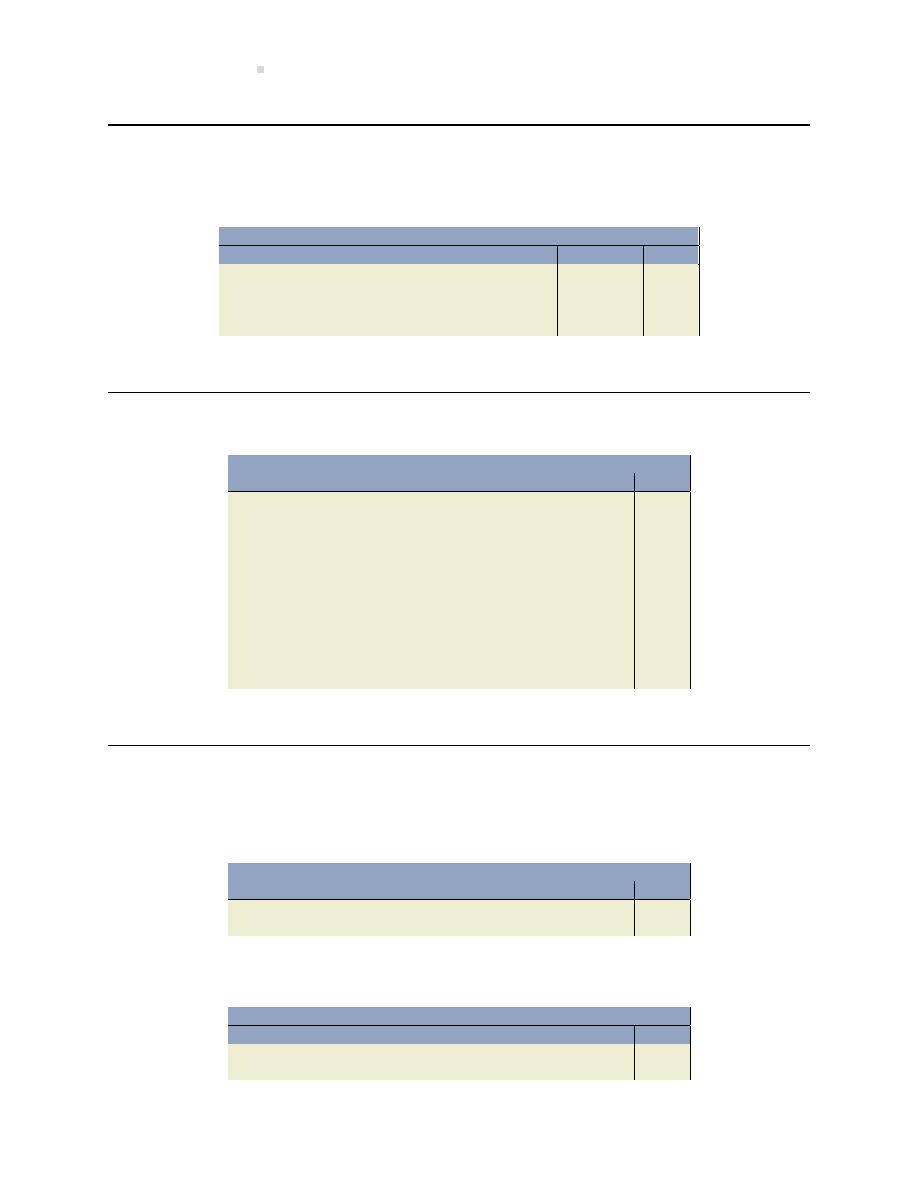
594
Solu ons To Exercises
EXERCISE 3–6
Interest expense for the year should be $12,000
× 10% = $1,200. The needed adjus ng entry is:
General Journal
Date
Account/Explana on
PR
Debit
Credit
Dec. 31
Interest Expense . . . . . . . . . . . . . . . . . . . . . . .
100
Interest Payable . . . . . . . . . . . . . . . . . . . .
100
To record interest accrued at December
31 ($1,200
− 1,100).
EXERCISE 3–7
General Journal
Date
Account/Explana on
PR
Debit
Credit
Insurance Expense . . . . . . . . . . . . . . . . . . . . .
600
Prepaid Insurance. . . . . . . . . . . . . . . . . . .
600
(a) To record expiry of 6 months insur-
ance.
Supplies Expense . . . . . . . . . . . . . . . . . . . . . .
200
Unused Supplies . . . . . . . . . . . . . . . . . . . .
200
(b) To adjust supplies on hand to physical
count.
Telephone Expense . . . . . . . . . . . . . . . . . . . . .
50
Accounts Payable . . . . . . . . . . . . . . . . . . .
50
(c) To record account payable at year end.
EXERCISE 3–8
1.
General Journal
Date
Account/Explana on
PR
Debit
Credit
Accounts receivable . . . . . . . . . . . . . . . . . . . .
Dr
Revenue . . . . . . . . . . . . . . . . . . . . . . . . . . .
Cr
2.
General Journal
Date
Account/Explana on
PR
Debit
Credit
Cash . . . . . . . . . . . . . . . . . . . . . . . . . . . . . . . . . .
Dr
Unearned revenue . . . . . . . . . . . . . . . . . .
Cr
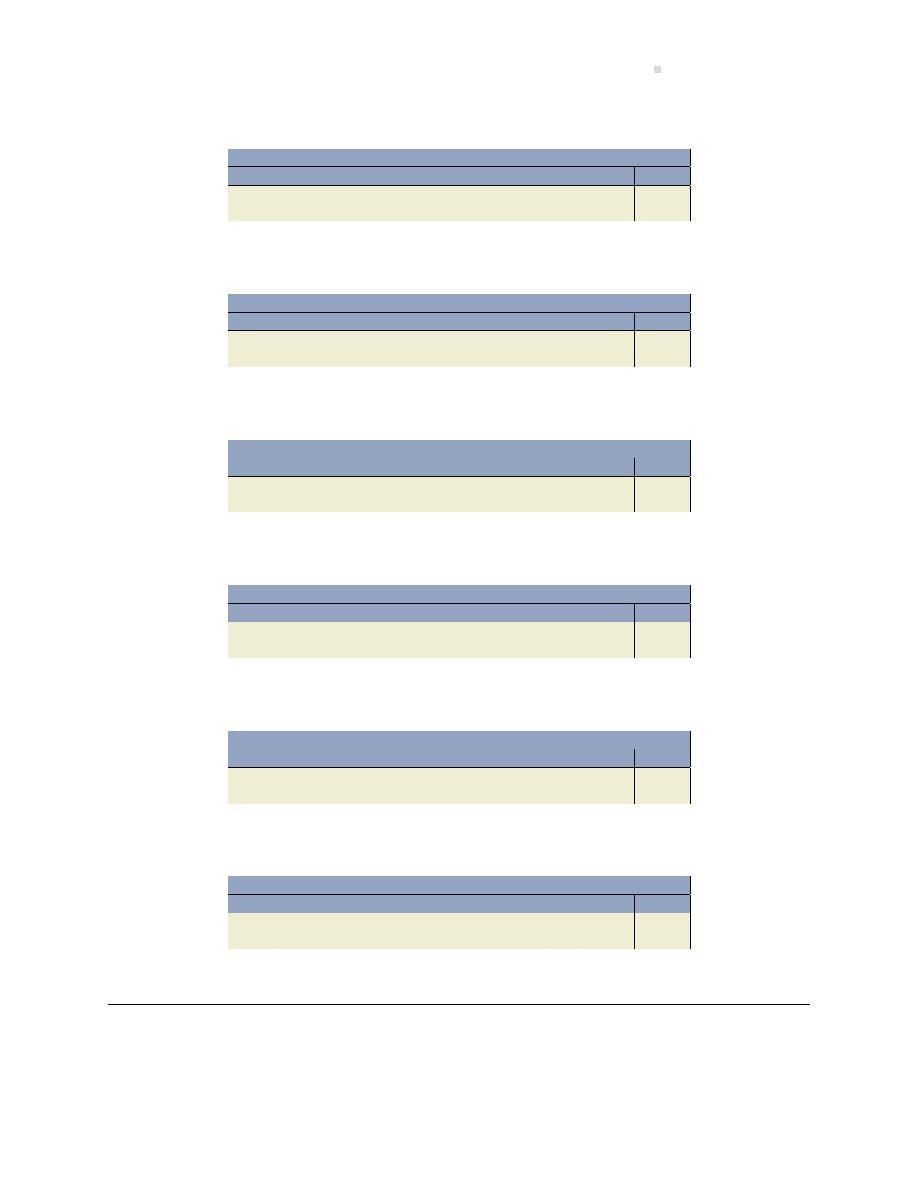
Chapter 3 Solu ons
595
3.
General Journal
Date
Account/Explana on
PR
Debit
Credit
Unearned revenue . . . . . . . . . . . . . . . . . . . . .
Dr
Revenue . . . . . . . . . . . . . . . . . . . . . . . . . . .
Cr
4.
General Journal
Date
Account/Explana on
PR
Debit
Credit
Repairs expense . . . . . . . . . . . . . . . . . . . . . . .
Dr
Accounts payable . . . . . . . . . . . . . . . . . . .
Cr
5.
General Journal
Date
Account/Explana on
PR
Debit
Credit
Prepaid repairs expense . . . . . . . . . . . . . . . .
Dr
Cash . . . . . . . . . . . . . . . . . . . . . . . . . . . . . . .
Cr
6.
General Journal
Date
Account/Explana on
PR
Debit
Credit
Repairs expense . . . . . . . . . . . . . . . . . . . . . . .
Dr
Prepaid repairs expense . . . . . . . . . . . . .
Cr
7.
General Journal
Date
Account/Explana on
PR
Debit
Credit
Salaries expense . . . . . . . . . . . . . . . . . . . . . . .
Dr
Accrued salaries payable . . . . . . . . . . . .
Cr
8.
General Journal
Date
Account/Explana on
PR
Debit
Credit
Deprecia on expense . . . . . . . . . . . . . . . . . .
Dr
Accumulated deprecia on, equipment
Cr
EXERCISE 3–9
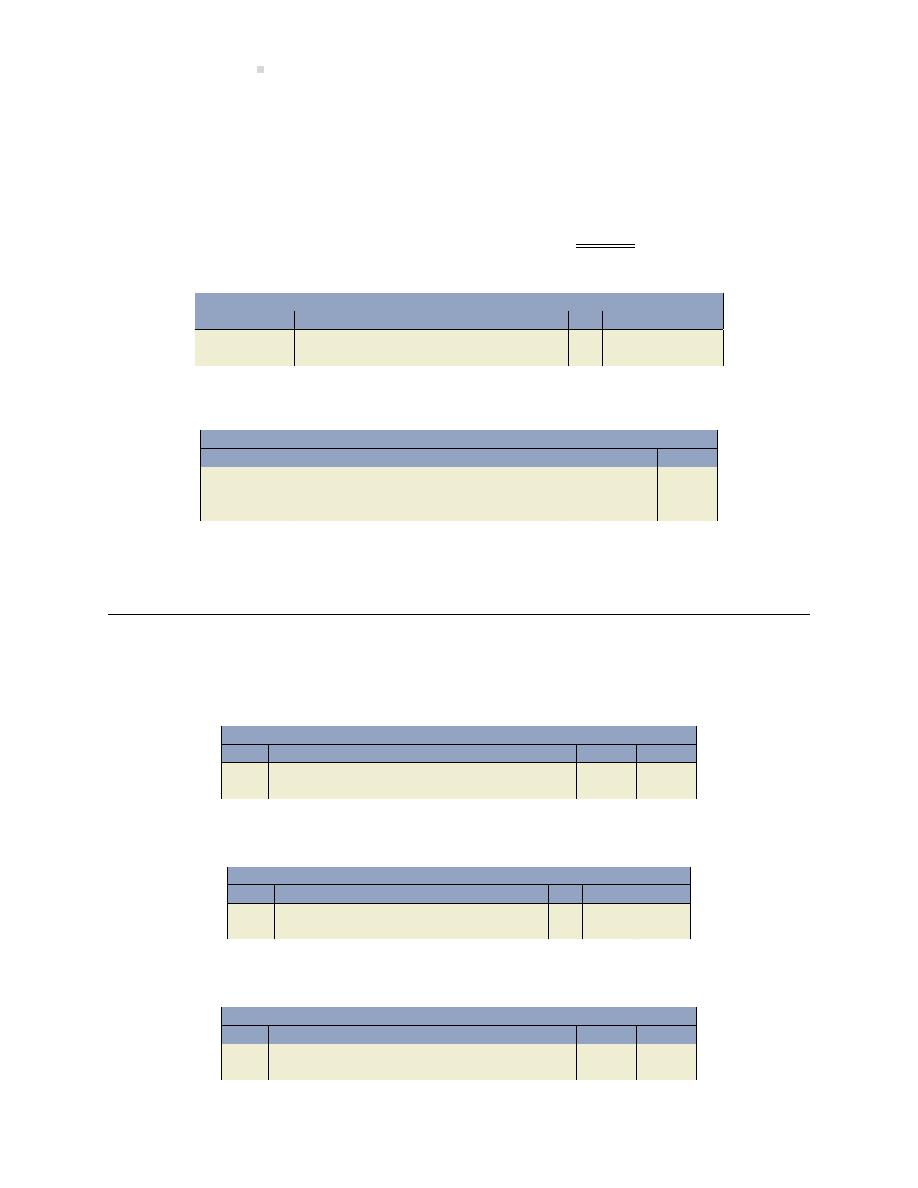
596
Solu ons To Exercises
1. Last pay date was Monday, March 28, 2016, for work done un l Friday, March 25, 2016.
Number of remaining business days from last pay date to March 31, 2016 is 4 days.
Total payroll per day: 65 employees
× $80 day = $5,200 per day
Total accrued salaries to March 31, 2016: $5,200 per day
× 4 days = $20,800
Total payroll per week: $5,200
× 5 working days per week = $26,000 per week
2.
General Journal
Date
Account/Explana on
PR
Debit
Credit
Mar 31, 2016
Salaries expense . . . . . . . . . . . . . . . . . . . . . . .
20,800
Accrued salaries payable . . . . . . . . . . . .
20,800
3.
General Journal
Date
Account/Explana on
PR
Debit
Credit
Apr 4, 2016
Salaries expense* . . . . . . . . . . . . . . . . . . . . . .
5,200
Accrued salaries payable . . . . . . . . . . . . . . . .
20,800
Cash . . . . . . . . . . . . . . . . . . . . . . . . . . . . . . .
26,000
* 5 days per week
− 4 days accrued = 1 day not yet expensed × $5,200 per day = $5,200
EXERCISE 3–10
1. Adjus ng entry for $70,000 of revenue earned but not yet billed to the customer.
General Journal
Date
Account/Explana on
PR
Debit
Credit
Accounts receivable . . . . . . . . . . . . . . . . . . . .
70,000
Revenue . . . . . . . . . . . . . . . . . . . . . . . . . . .
70,000
2. Adjus ng entry for $4,500 of salaries from the last pay date of October 14.
General Journal
Date
Account/Explana on
PR
Debit
Credit
Salaries expense . . . . . . . . . . . . . . . . . . . . . . .
4,500
Accrued salaries payable . . . . . . . . . . . .
4,500
3. Adjus ng entry for $40,000 of cash received from a customer for revenue not yet earned.
General Journal
Date
Account/Explana on
PR
Debit
Credit
Cash . . . . . . . . . . . . . . . . . . . . . . . . . . . . . . . . . .
40,000
Unearned revenue . . . . . . . . . . . . . . . . . .
40,000
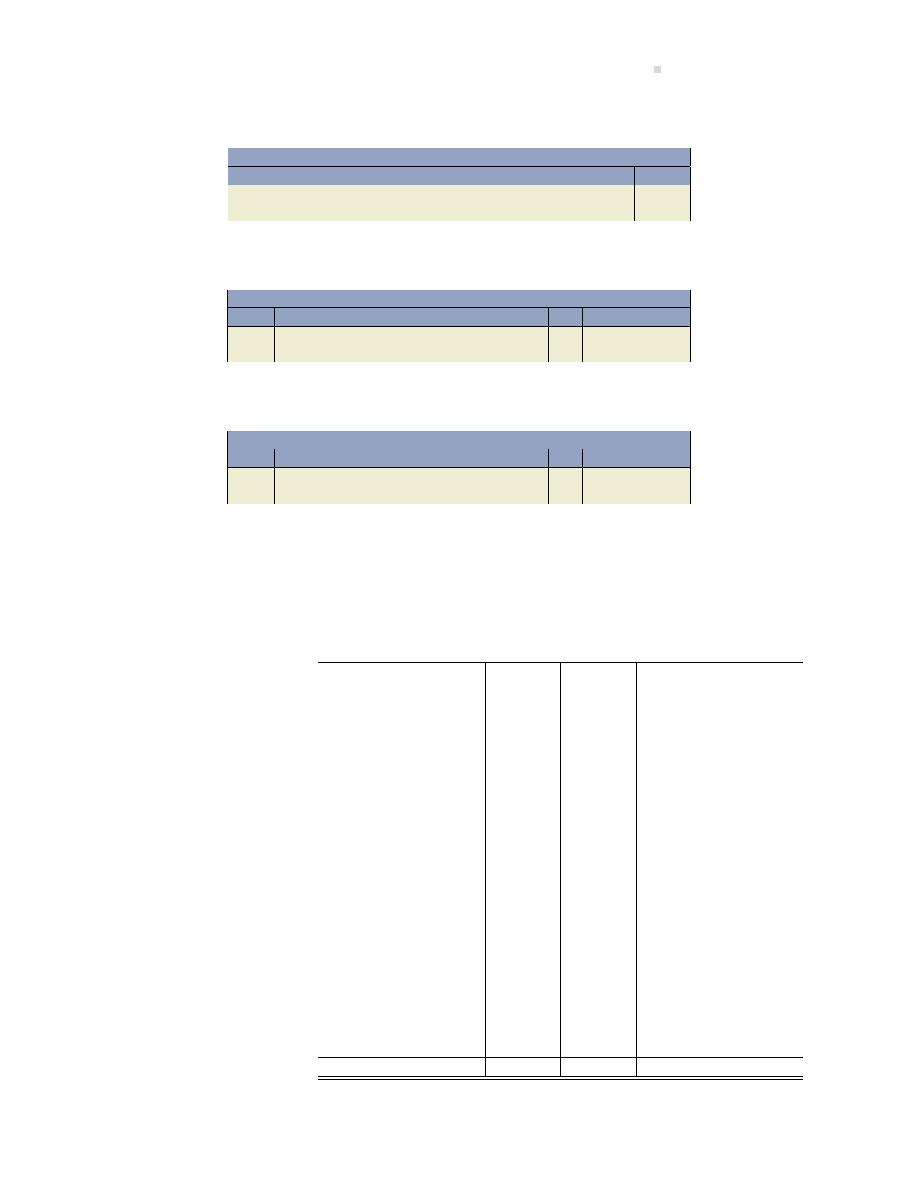
Chapter 3 Solu ons
597
4. Adjus ng entry for $500 of u li es for October, but not yet paid.
General Journal
Date
Account/Explana on
PR
Debit
Credit
U li es expense . . . . . . . . . . . . . . . . . . . . . . .
500
Accounts payable . . . . . . . . . . . . . . . . . . .
500
5. Adjus ng entry for $1,300 of cash paid to a supplier for adver sing not yet published.
General Journal
Date
Account/Explana on
PR
Debit
Credit
Prepaid adver sing expenses . . . . . . . . . . . .
1,300
Cash . . . . . . . . . . . . . . . . . . . . . . . . . . . . . . .
1,300
6. Adjus ng entry for October deprecia on expense for equipment.
General Journal
Date
Account/Explana on
PR
Debit
Credit
Deprecia on expense . . . . . . . . . . . . . . . . . .
1,000
Accumulated deprecia on, equipment
1,000
Self-Check Trail balance accounts:
Quer n Quick Fix Ltd.
Trial Balance
At October 31, 2016
Unadjusted Trial Balance
Adjustments
Adjusted Trial Balance
Debit
Credit
Debit
Credit
Debit
Credit
Accounts payable
$225,000
$
500
$225,500
Accounts receivable
$325,000
$ 70,000
$395,000
Accrued salaries payable
5,000
4,500
9,500
Accumulated deprecia on,
equipment
1,500
1,000
2,500
Adver sing expense
1,500
1,500
Cash
80,000
40,000
1,300
118,700
Deprecia on expense
800
1,000
1,800
Equipment
150,000
150,000
Land
150,000
150,000
Maintenance service expenses
1,000
1,000
Notes payable
210,000
210,000
Office supplies
5,000
5,000
Prepaid expenses
15,000
1,300
16,300
Rent expense
14,000
14,000
Retained earnings
37,800
37,800
Salaries expense
45,000
4,500
49,500
Service revenue
300,000
70,000
370,000
Share capital
10,000
10,000
Unearned service revenue
10,000
40,000
50,000
U li es expense
12,000
500
12,500
$799,300
$799,300
$117,300
$117,300
$915,300
$915,300
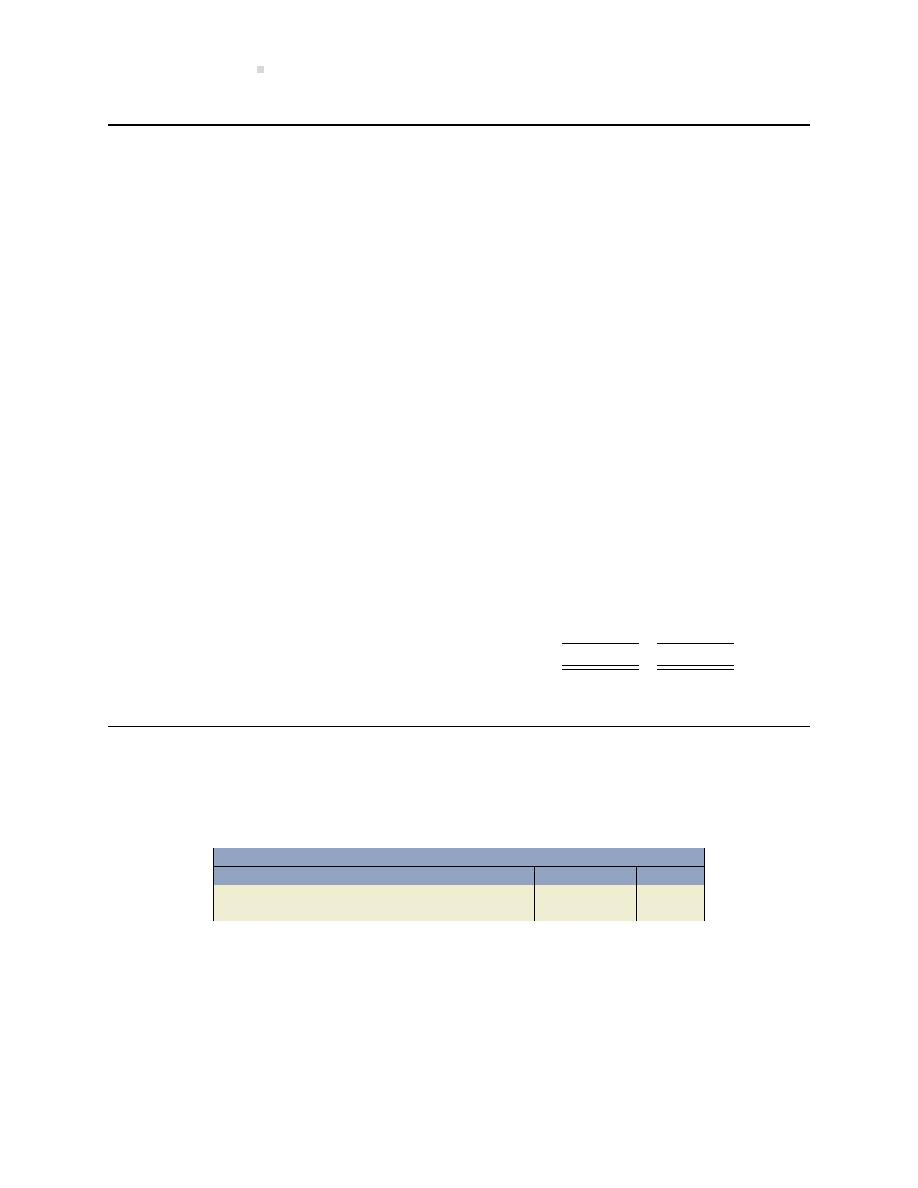
598
Solu ons To Exercises
EXERCISE 3–11
Bernard Inc.
Adjusted Trial Balance
December 31, 2015
Debits
Credits
Prepaid adver sing
$1,000
Supplies
750
Equipment
21,750
Accumulated deprecia on – equipment
$1,500
Accounts payable
13,250
Salaries payable
700
Unearned subscrip ons
10,000
Share capital
8,000
Subscrip on revenue
5,000
Adver sing expense
500
Commissions expense
800
Deprecia on expense – equipment
250
Maintenance expense
200
Salaries expense
10,200
Supplies expense
2,500
Telephone expense
100
U li es expense
400
Totals
$38,450
$38,450
EXERCISE 3–12
1. Close revenue accounts to income summary account.
General Journal
Date
Account/Explana on
PR
Debit
Credit
Services revenue . . . . . . . . . . . . . . . . . . . . . . .
276,000
Income summary . . . . . . . . . . . . . . . . . . .
276,000
2. Close expense accounts to income summary account.
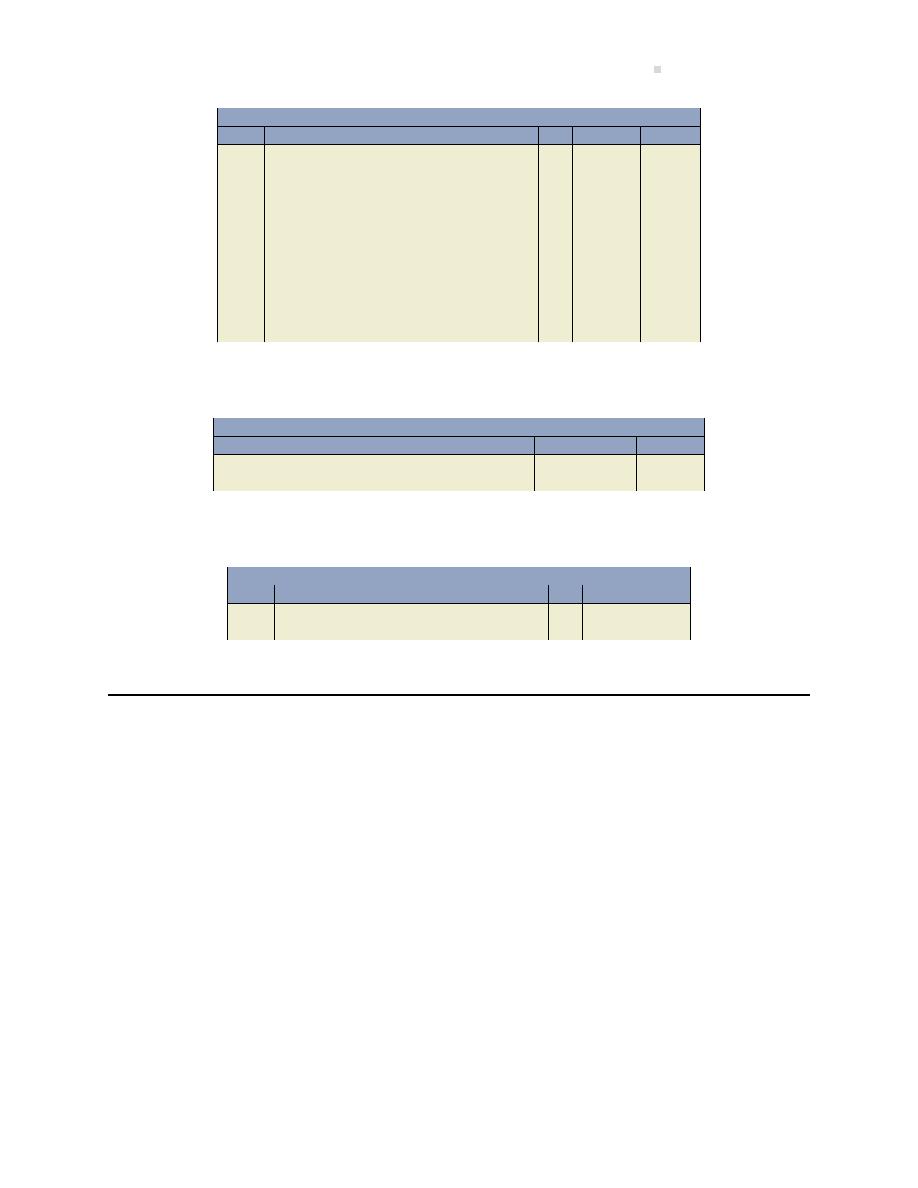
Chapter 3 Solu ons
599
General Journal
Date
Account/Explana on
PR
Debit
Credit
Income summary . . . . . . . . . . . . . . . . . . . . . .
110,780
Salaries expense . . . . . . . . . . . . . . . . . . . .
41,700
Insurance expense . . . . . . . . . . . . . . . . . .
3,700
Interest expense . . . . . . . . . . . . . . . . . . . .
150
Shop supplies expense . . . . . . . . . . . . . .
750
Adver sing expense . . . . . . . . . . . . . . . . .
4,050
Deprecia on expense . . . . . . . . . . . . . . .
2,380
Repairs expenses . . . . . . . . . . . . . . . . . . .
7,800
Rent expense . . . . . . . . . . . . . . . . . . . . . . .
22,500
Income tax expense . . . . . . . . . . . . . . . . .
4,500
U li es expense . . . . . . . . . . . . . . . . . . . .
23,250
3. Close the income summary account to retained earnings.
General Journal
Date
Account/Explana on
PR
Debit
Credit
Income summary . . . . . . . . . . . . . . . . . . . . . .
165,220
Retained earnings . . . . . . . . . . . . . . . . . .
165,220
4. Close dividends to retained earnings.
General Journal
Date
Account/Explana on
PR
Debit
Credit
Retained earnings . . . . . . . . . . . . . . . . . . . . . .
5,000
Cash dividends . . . . . . . . . . . . . . . . . . . . .
5,000
EXERCISE 3–13
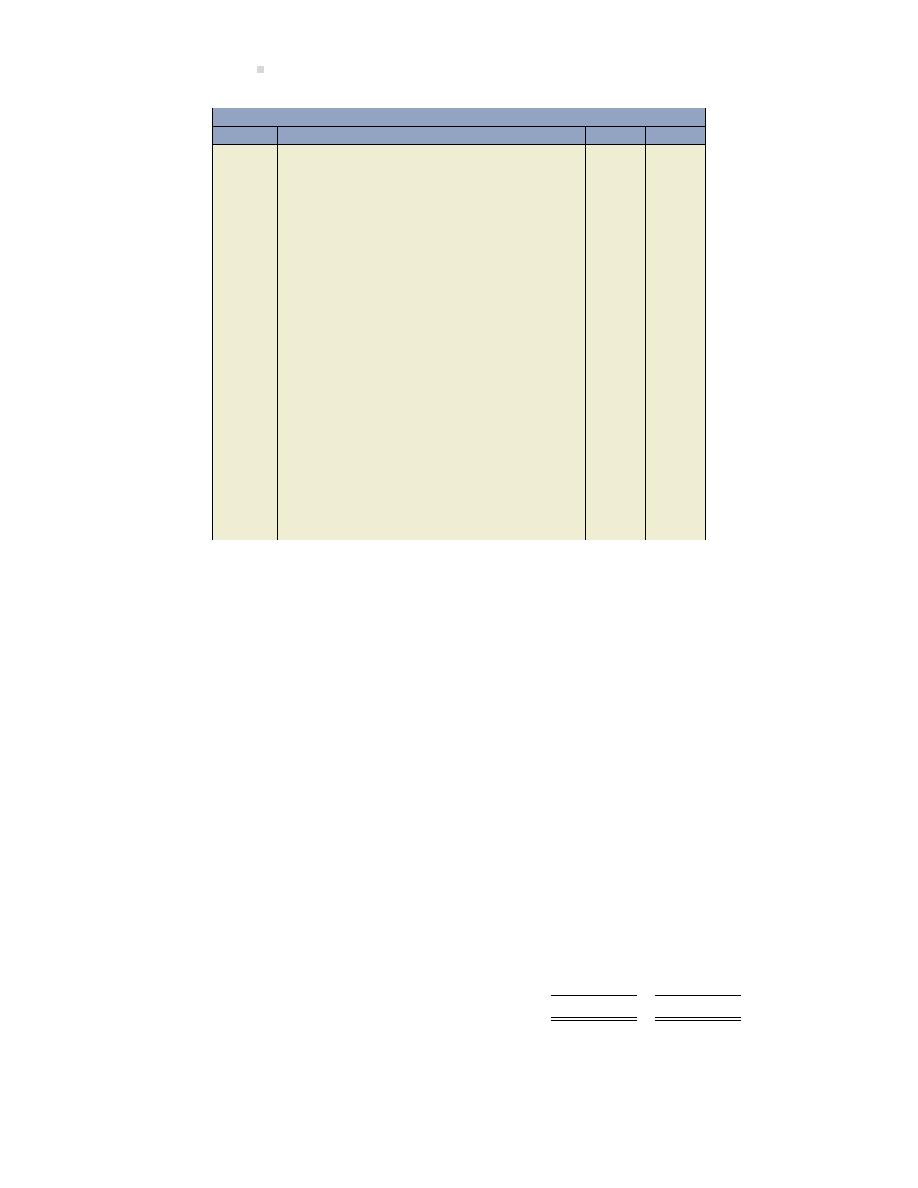
600
Solu ons To Exercises
General Journal
Date
Account/Explana on
PR
Debit
Credit
Dec. 31
Commissions Earned . . . . . . . . . . . . . . . . . . .
20,000
Subscrip ons Revenue. . . . . . . . . . . . . . . . . .
17,630
Income Summary . . . . . . . . . . . . . . . . . . .
37,630
To close revenue accounts to income sum-
mary.
31
Income Summary . . . . . . . . . . . . . . . . . . . . . .
58,400
Deprecia on Expense – Machinery . . .
900
Deprecia on Expense – Warehouse . .
1,200
Insurance Expense . . . . . . . . . . . . . . . . . .
1,800
Interest Expense . . . . . . . . . . . . . . . . . . . .
2,365
Salaries Expense . . . . . . . . . . . . . . . . . . . .
33,475
Supplies Expense . . . . . . . . . . . . . . . . . . .
15,800
U li es Expense . . . . . . . . . . . . . . . . . . . .
2,860
To close expense accounts to income sum-
mary.
31
Retained Earnings . . . . . . . . . . . . . . . . . . . . . .
20,770
Income Summary . . . . . . . . . . . . . . . . . . .
20,770
To close net loss in income summary to re-
tained earnings.
31
Retained Earnings . . . . . . . . . . . . . . . . . . . . . .
14,000
Dividends . . . . . . . . . . . . . . . . . . . . . . . . . .
14,000
To close dividends to retained earnings.
Willis Inc.
Post-Closing Trial Balance
December 31, 2015
Debits
Credits
Accounts payable
$4,400
Accounts receivable
$3,600
Accumulated deprecia on – machinery
$2,800
Accumulated deprecia on – warehouse
8,000
Bank loan
47,600
Cash
12,000
Interest payable
1,200
Land
15,000
Machinery
20,000
Retained earnings*
1,230
Salaries payable
1,970
Share capital
52,100
Supplies
2,500
Unearned fees
800
Warehouse
67,000
Totals
$120,100
$120,100
*calculated as $36,000 adjusted retained earnings balance +$37,630 total revenues closed to re-

Chapter 4 Solu ons
601
tained earnings
−$58,400 total expenses closed to retained earnings −$14,000 dividends closed
to retained earnings.
Chapter 4 Solu ons
EXERCISE 4–1
a. The balance sheet is as follows:

602
Solu ons To Exercises
Joyes Enterprises Ltd.
Balance Sheet
At December 31, 2016
Assets
Current
Cash
$2,000
Accounts Receivable
8,000
Merchandise Inventory
19,000
Prepaid Insurance
1,000
Total Current Assets
$30,000
Property, Plant, and Equipment
Land
5,000
Buildings
$25,000
Less: Accum. Dep’n.
1,000
24,000
Equipment
20,000
Less: Accum. Dep’n.
4,000
16,000
Net Property, Plant, and Equipment
45,000
Total Assets
$75,000
Liabili es
Current Liabili es
Bank Loan
$5,000
Accounts Payable
7,000
Income Taxes Payable
3,000
Total Current Liabili es
$15,000
Non-current Liabili es
Mortgage Payable
5,000
Total Liabili es
20,000
Equity
Share Capital
48,000
Retained Earnings
7,000
Total Equity
55,000
Total Liabili es and Equity
$75,000
b. Current assets total $30,000. Current liabili es total $15,000. The company appears to have
sufficient resources to meet its obliga ons in the next year.
c. Total equity is $55,000. Total liabili es equal $20,000. The ra o is $55,000/20,000 = 2.75
to 1.

Chapter 4 Solu ons
603
EXERCISE 4–2
a. The building should likely be a non-current asset, as its useful life is generally greater than
one fiscal year. Short-term investments are current assets because they are readily mar-
ketable, by defini on. Unused office supplies are likely current assets, as they will usually
be used in the next fiscal period. The bank loan payable is due in 2022 and therefore a non-
current liability, as it will not be paid within the next fiscal year. Salaries payable is likely a
current liability, as it will be paid in the next fiscal year in all likelihood. The last line on the
balance sheet should read “Total Liabili es and Equity”. The balance sheet lists a building
account but not a land account. Some mes a company owns a building without owning
land, but it is more likely that these two assets should have been separated when they were
acquired. Retained earnings should be shown in the equity sec on. There is no accumu-
lated deprecia on recorded for the long-lived assets and there are no income taxes payable
recorded. The reasons for these omissions should be inves gated.
b. The balance sheet is as follows:

604
Solu ons To Exercises
Abbey Limited
Balance Sheet
At November 30, 2015
Assets
Current
Cash
$1,000
Short-term Investments
3,000
Accounts Receivable
6,000
Merchandise Inventory
3,000
Unused Supplies
100
Total Current Assets
$13,100
Property, Plant, and Equipment
Building*
12,000
Equipment
1,500
Truck
1,350
Net Property, Plant, and Equipment
14,850
Total Assets
$27,950
Liabili es
Current
Accounts Payable
$5,600
Notes Payable
2,000
Salaries Payable
250
Total Current Liabili es
$7,850
Non-current
Bank Loan
1,000
Mortgage Payable
7,000
Total Non-current Liabili es
8,000
Total Liabili es
15,850
Equity
Share Capital
11,100
Retained Earnings
1,000
Total Equity
12,100
Total Liabili es and Equity
$27,950
*Land may need to be separated out.
c. Addi onal disclosure should be considered for:
• deprecia on rates for plant and equipment.
• details about cost and accumulated deprecia on amounts for property, plant, and
equipment.
Chapter 4 Solu ons
605
• details about debt, including interest rates, due dates, any assets securing the debt,
repayment amounts and intervals, and when terms will be re-nego ated.
• details about share capital.
EXERCISE 4–3
3
Land used in the normal course of
business opera ons
5
Accrued salaries payable
5
Notes payable, due in four months
1
Prepaid adver sing
3
Truck
8
Adver sing expense
2
Land held for investment
5
Unearned revenue
4
Copyright
8
Service revenue
5
Accounts payable
1
Cash
8
Cash dividends
6
Mortgage payable, due in fi een years
3
Building
5
Mortgage payable, due in six months
3
Furniture
7
Share capital
1
Accounts receivable, from customer sales
1
Shop supplies
4
Franchise
3
Accumulated deprecia on, building
8
U li es expense
8
Deprecia on expense
5
U li es payable
1
Office supplies
EXERCISE 4–4
a. 1. Close revenue accounts to income summary account.
General Journal
Date
Account/Explana on
PR
Debit
Credit
Dec 31
Revenue . . . . . . . . . . . . . . . . . . . . . . . . . . . . . .
35,000
Income summary . . . . . . . . . . . . . . . . . . .
35,000
2. Close expense accounts to income summary account.
General Journal
Date
Account/Explana on
PR
Debit
Credit
Dec 31
Income summary . . . . . . . . . . . . . . . . . . . . . .
16,600
Salaries expense . . . . . . . . . . . . . . . . . . . .
8,000
Insurance expense . . . . . . . . . . . . . . . . . .
600
Supplies and postage expense . . . . . . .
3,000
Rent expense . . . . . . . . . . . . . . . . . . . . . . .
3,000
Travel expense. . . . . . . . . . . . . . . . . . . . . .
1,500
U li es expense . . . . . . . . . . . . . . . . . . . .
500

606
Solu ons To Exercises
3. Close the income summary account to retained earnings.
General Journal
Date
Account/Explana on
PR
Debit
Credit
Dec 31
Income summary . . . . . . . . . . . . . . . . . . . . . .
18,400
Retained earnings . . . . . . . . . . . . . . . . . .
18,400
4. Close dividends to retained earnings: No entry required.
b.
Abled Appliance Repair Ltd.
Balance Sheet
At December 31, 2016
Assets
Liabili es
Cash
$ 80,000
Accounts payable
$ 35,000
Accounts receivable
66,000
Unearned consul ng fees
10,000
Office supplies
2,000
Total current liabili es
$ 45,000
Prepaid insurance expense
5,000
Total current assets
153,000
Equity
Property, Plant and Equipment
Share capital
$
1,000
Land
$20,000
Retained earnings
135,000*
Office equipment
10,000
Total equity
Accumulated deprecia on,
Total liabili es and equity
136,000
office equipment
(2,000)
28,000
Total assets
$181,000
$181,000
*Net income (35,000
− 3,000 − 8,000 − 500 − 1,500 − 600 − 3,000) = $18,400
Retained earnings ($116,600 + 18,400) = 135,000
c.

Chapter 4 Solu ons
607
Abled Appliance Repair Ltd.
Post-closing Trial Balance
At December 31, 2016
Debit
Credit
Cash
$ 80,000
Accounts receivable
66,000
Office supplies
2,000
Prepaid insurance expense
5,000
Land
20,000
Office equipment
10,000
Accumulated deprecia on, office equipment
$
2,000
Accounts payable
35,000
Unearned consul ng fees
10,000
Share capital
1,000
Retained earnings
135,000
$183,000
$183,000
EXERCISE 4–5
Mystery Company Ltd.
Balance Sheet
At November 30, 2016
Assets
Liabili es
Cash
$150,650
Accounts payable
$ 95,960
Accounts receivable
99,520
Accrued salaries payable
58,580
Office supplies
1,300
Current por on of long-term
Prepaid insurance expense
10,000
note payable
72,000
Prepaid rent expense
12,000
Income taxes payable
32,500
Total current assets
273,470
Interest payable
12,000
Unearned revenue
150,000
Property, Plant and Equipment
Total current liabili es
421,040
Building
$270,000
Accumulated deprecia on, building
(43,530)
226,470
Long-term Liabili es
Vehicle
108,000
Note payable, due 2025
145,000
Accumulated deprecia on, vehicle
(8,650)
99,350
Total liabili es
566,040
Total property, plant and
equipment
325,820
Equity
Share capital
$10,000*
Intangible Assets
Retained earnings
74,850
84,850
Copyright
51,600
Total liabili es and equity
$650,890
Total assets
$650,890

608
Solu ons To Exercises
* Share capital:
Assets = Liabili es + Equity
Total assets
$ 650,890
Less total liabili es
(566,040)
Less retained earnings
(74,850)
Share capital
$
10,000
EXERCISE 4–6
Hitalle Heights Corp.
Statement of Changes in Equity
For the Period Ended May 31, 2016
Share
Retained
Total
Capital
Earnings
Equity
Opening balance
$ 640
$192,355
$192,995
Shares issuance
200
200
Dividends declared
(2,800)
(2,800)
Net income
47,759
47,759
Ending balance
$ 840
$237,314
$238,154
Net income ($94,000
− 1,333 − 2,520 − 2,072 − 84 − 12,600 − 840 − 23,352 − 420 − 3,020) =
$47,759
Hitalle Heights Corp.
Balance Sheet
At May 31, 2016
Assets
Liabili es
Cash
$
8,888
Accounts payable
$ 13,020
Accounts receivable
59,808
Accrued salaries payable
4,872
Shop supplies
1,008
Current por on of long-term
5,200
Prepaid rent expense
7,162
note payable*
5,200
Total current assets
76,866
Income taxes payable
3,320
Interest payable
224
Unearned revenue
21,000
Property, Plant and Equipment
Total current liabili es
47,636
Land
58,048
Furniture
$ 8,400
Long-term Liabili es
Accumulated deprecia on, furniture
(1,792)
6,608
Note payable, due 2025*
11,600
Total property, plant and
64,656
Total liabili es
59,236
equipment
Equity
Intangible Assets
Share capital
$
840
Franchise
155,868
Retained earnings
237,314
238,154
Total assets
$297,390
Total liabili es and equity
$297,390
Chapter 5 Solu ons
609
Chapter 5 Solu ons
EXERCISE 5–1
a. The completed table is as follows:
2014
2013
2012
2011
Sales
$10,000
$9,000
$8,000
$7,000
Cost of Goods Sold
7,500
6,840
6,160
5,460
Gross Profit
2,500
2,160
1,840
1,540
Gross Profit Percentage
25%
24%
23%
22%
b. The company’s gross profit percentage has increased each year from 2011 to 2014 inclusive.
This means it is earning more per sales dollar each year (from 22 cents per dollar in 2011 to
25 cents per dollar in 2014). This is a favourable trend because the company is genera ng
more gross profit to apply against opera ng and other expenses which hopefully results in
greater net income.
EXERCISE 5–2
General Journal
Date
Account/Explana on
PR
Debit
Credit
Jul. 6
Merchandise Inventory . . . . . . . . . . . . . . . . .
600
Accounts Payable . . . . . . . . . . . . . . . . . . .
600
To record purchase of inventory on ac-
count.
9
Accounts Payable . . . . . . . . . . . . . . . . . . . . . .
200
Merchandise Inventory . . . . . . . . . . . . . .
200
To record returns made on goods pur-
chased.
15
Accounts Payable . . . . . . . . . . . . . . . . . . . . . .
400
Cash . . . . . . . . . . . . . . . . . . . . . . . . . . . . . . .
396
Merchandise Inventory . . . . . . . . . . . . . .
4
To record payment made within discount
period.
EXERCISE 5–3
a. The Horne Inc. general journal is as follows:
610
Solu ons To Exercises
General Journal
Date
Account/Explana on
PR
Debit
Credit
May 5
Accounts Receivable . . . . . . . . . . . . . . . . . . .
4,000
Sales . . . . . . . . . . . . . . . . . . . . . . . . . . . . . .
4,000
Cost of Goods Sold . . . . . . . . . . . . . . . . . . . . .
2,500
Merchandise Inventory . . . . . . . . . . . . . .
2,500
7
Sales Returns and Allowances . . . . . . . . . . .
500
Accounts Receivable . . . . . . . . . . . . . . . .
500
Merchandise Inventory . . . . . . . . . . . . . . . . .
300
Cost of Goods Sold . . . . . . . . . . . . . . . . . .
300
15
Cash . . . . . . . . . . . . . . . . . . . . . . . . . . . . . . . . . .
3,430
Sales Discounts . . . . . . . . . . . . . . . . . . . . . . . .
70
Accounts Receivable . . . . . . . . . . . . . . . .
3,500
31
Cost of Goods Sold . . . . . . . . . . . . . . . . . . . . .
100
Merchandise Inventory . . . . . . . . . . . . . .
100
(3,000 beginning MI
− 2,500 + 300 = 800
unadjusted MI balance; 800
− 700 = 100
shrinkage)
b. The Sperling Renova ons Ltd. general journal is as follows:
General Journal
Date
Account/Explana on
PR
Debit
Credit
May 5
Merchandise Inventory . . . . . . . . . . . . . . . . .
4,000
Accounts Payable . . . . . . . . . . . . . . . . . . .
4,000
7
Accounts Payable . . . . . . . . . . . . . . . . . . . . . .
500
Merchandise Inventory . . . . . . . . . . . . . .
500
15
Accounts Payable . . . . . . . . . . . . . . . . . . . . . .
3,500
Merchandise Inventory . . . . . . . . . . . . . .
70
Cash . . . . . . . . . . . . . . . . . . . . . . . . . . . . . . .
3,430
The shrinkage adjustment recorded by
Horne Inc. does not impact Sperling in
any way therefore no adjus ng entry is re-
quired in Sperling’s records.
EXERCISE 5–4
General Journal
Date
Account/Explana on
PR
Debit
Credit
Mar 1
Merchandise inventory . . . . . . . . . . . . . . . . .
25,000
Accounts payable . . . . . . . . . . . . . . . . . . .
25,000
(Purchase, terms 2/10, net 30)
Mar 3
Accounts receivable . . . . . . . . . . . . . . . . . . . .
5,000
Cost of goods sold . . . . . . . . . . . . . . . . . . . . .
2,600
Sales . . . . . . . . . . . . . . . . . . . . . . . . . . . . . .
5,000
Merchandise inventory . . . . . . . . . . . . . .
2,600
(Sale, terms 1/10, n30)
Chapter 5 Solu ons
611
General Journal
Date
Account/Explana on
PR
Debit
Credit
Mar 4
Merchandise inventory . . . . . . . . . . . . . . . . .
100
Sales returns and allowances . . . . . . . . . . . .
200
Accounts receivable . . . . . . . . . . . . . . . . .
200
Cost of goods sold . . . . . . . . . . . . . . . . . .
100
(Sales return, Mar 3)
Mar 5
Merchandise inventory . . . . . . . . . . . . . . . . .
15,000
Cash . . . . . . . . . . . . . . . . . . . . . . . . . . . . . . .
15,000
(Cash purchase)
Mar 6
Merchandise inventory . . . . . . . . . . . . . . . . .
200
Cash . . . . . . . . . . . . . . . . . . . . . . . . . . . . . . .
200
(Freight)
Mar 7
Cash . . . . . . . . . . . . . . . . . . . . . . . . . . . . . . . . . .
500
Merchandise inventory . . . . . . . . . . . . . .
500
(Allowance for damaged inventory)
Mar 8
Accounts receivable . . . . . . . . . . . . . . . . . . . .
25,000
Cost of goods sold . . . . . . . . . . . . . . . . . . . . .
13,000
Sales . . . . . . . . . . . . . . . . . . . . . . . . . . . . . .
25,000
Merchandise inventory . . . . . . . . . . . . . .
13,000
(Sale, terms 1.5/10, n30)
Mar 9
Delivery expense or freight-out . . . . . . . . . .
500
Cash . . . . . . . . . . . . . . . . . . . . . . . . . . . . . . .
500
(Shipping costs for Mar 8 sale)
Mar 11
Accounts payable . . . . . . . . . . . . . . . . . . . . . .
12,500
Merchandise inventory . . . . . . . . . . . . . .
250
Cash . . . . . . . . . . . . . . . . . . . . . . . . . . . . . . .
12,250
(50% payment of Mar 1 purchase)
Mar 13
Cash . . . . . . . . . . . . . . . . . . . . . . . . . . . . . . . . . .
4,950
Sales discount . . . . . . . . . . . . . . . . . . . . . . . . .
50
Accounts receivable . . . . . . . . . . . . . . . . .
5,000
(Collect Mar 3 sale)
Mar 15
Office supplies inventory . . . . . . . . . . . . . . . .
540
Account payable . . . . . . . . . . . . . . . . . . . .
540
(Purchase 1/10, n30)
Mar 18
No Entry . . . . . . . . . . . . . . . . . . . . . . . . . . . . . .
Mar 20
Cash . . . . . . . . . . . . . . . . . . . . . . . . . . . . . . . . . .
6,010
Accounts receivable . . . . . . . . . . . . . . . . .
6,010
(Collect account)
Mar 25
Account payable . . . . . . . . . . . . . . . . . . . . . . .
540
Office supplies inventory . . . . . . . . . . . .
5.40
Cash . . . . . . . . . . . . . . . . . . . . . . . . . . . . . . .
534.60
(Payment of Mar 15 purchase)
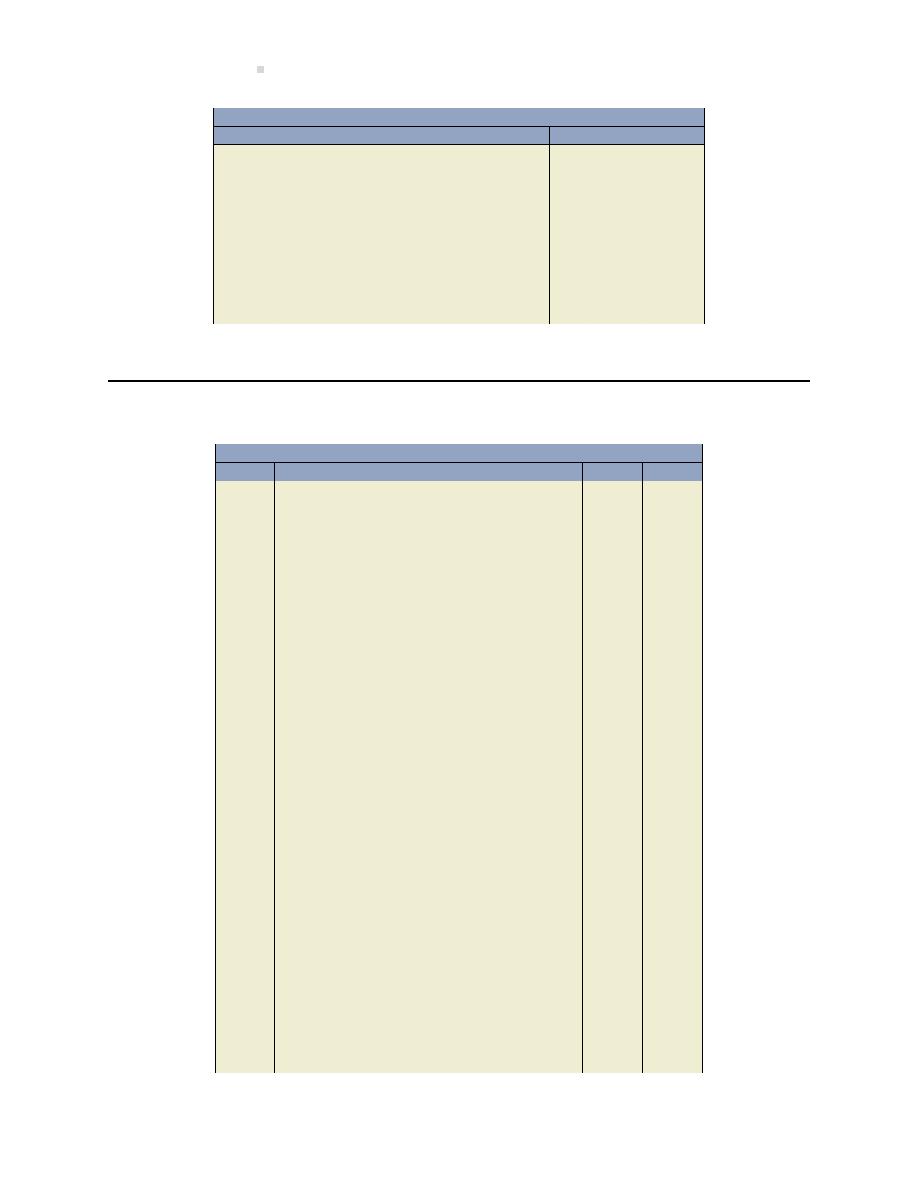
612
Solu ons To Exercises
General Journal
Date
Account/Explana on
PR
Debit
Credit
Mar 27
Cash . . . . . . . . . . . . . . . . . . . . . . . . . . . . . . . . . .
12,500
Cost of goods sold . . . . . . . . . . . . . . . . . . . . .
5,000
Sales . . . . . . . . . . . . . . . . . . . . . . . . . . . . . .
12,500
Merchandise inventory . . . . . . . . . . . . . .
5,000
(Cash sale)
Mar 31
Account payable . . . . . . . . . . . . . . . . . . . . . . .
12,500
Cash . . . . . . . . . . . . . . . . . . . . . . . . . . . . . . .
12,500
(Payment of Mar 1 balance, discount ex-
pired)
EXERCISE 5–5
General Journal
Date
Account/Explana on
PR
Debit
Credit
Apr 1
Merchandise inventory . . . . . . . . . . . . . . . . .
15,000
Cash . . . . . . . . . . . . . . . . . . . . . . . . . . . . . . .
15,000
(Cash purchase)
Apr 3
Cash . . . . . . . . . . . . . . . . . . . . . . . . . . . . . . . . . .
8,000
Cost of goods sold . . . . . . . . . . . . . . . . . . . . .
4,600
Sales . . . . . . . . . . . . . . . . . . . . . . . . . . . . . .
8,000
Merchandise inventory . . . . . . . . . . . . . .
4,600
(Cash sale)
Apr 5
Merchandise inventory . . . . . . . . . . . . . . . . .
10,000
Accounts payable . . . . . . . . . . . . . . . . . . .
10,000
(Purchase, terms 1/10, n30)
Apr 7
Accounts payable . . . . . . . . . . . . . . . . . . . . . .
2,000
Merchandise inventory . . . . . . . . . . . . . .
2,000
(Purchase returns)
Apr 8
Accounts receivable . . . . . . . . . . . . . . . . . . . .
8,000
Cost of goods sold . . . . . . . . . . . . . . . . . . . . .
4,000
Merchandise inventory . . . . . . . . . . . . . .
4,000
Sales . . . . . . . . . . . . . . . . . . . . . . . . . . . . . .
8,000
(Sale, terms 2/10, n30)
Apr 9
Delivery expense or freight-out . . . . . . . . . .
500
Cash . . . . . . . . . . . . . . . . . . . . . . . . . . . . . . .
500
(Shipping costs for Apr 8 sale)
Apr 10
Merchandise inventory . . . . . . . . . . . . . . . . .
1,000
Sales returns and allowances . . . . . . . . . . . .
400
Cost of goods sold . . . . . . . . . . . . . . . . . .
400
Cash . . . . . . . . . . . . . . . . . . . . . . . . . . . . . . .
1,000
(Sale return)

Chapter 5 Solu ons
613
General Journal
Date
Account/Explana on
PR
Debit
Credit
Apr 10
Sales allowance . . . . . . . . . . . . . . . . . . . . . . . .
200
Accounts receivable . . . . . . . . . . . . . . . . .
200
(Apr 8 sale, sales allowance)
Apr 12
Merchandise inventory . . . . . . . . . . . . . . . . .
22,000
Accounts payable . . . . . . . . . . . . . . . . . . .
22,000
(Purchase, terms 1/10, n30)
Apr 15
Accounts payable . . . . . . . . . . . . . . . . . . . . . .
8,000
Merchandise inventory . . . . . . . . . . . . . .
Cash ($10,000
− 2,000) × 0.99 . . . . . .
7,920
(Paid Apr 5 purchase)
Apr 16
Merchandise inventory . . . . . . . . . . . . . . . . .
600
Cash . . . . . . . . . . . . . . . . . . . . . . . . . . . . . . .
600
(Freight on Apr 12 purchase)
Apr 18
Cash . . . . . . . . . . . . . . . . . . . . . . . . . . . . . . . . . .
5,000
Sales discount . . . . . . . . . . . . . . . . . . . . . . . . .
102
Accounts receivable ($5,000
÷ 0.98). .
5,102
(Par al payment on account)
Apr 27
Accounts payable . . . . . . . . . . . . . . . . . . . . . .
22,000
Cash . . . . . . . . . . . . . . . . . . . . . . . . . . . . . . .
22,000
(Paid account, discount forfeited)
Apr 27
Cash . . . . . . . . . . . . . . . . . . . . . . . . . . . . . . . . . .
20,000
Cost of goods sold . . . . . . . . . . . . . . . . . . . . .
10,000
Merchandise inventory . . . . . . . . . . . . . .
10,000
Sales . . . . . . . . . . . . . . . . . . . . . . . . . . . . . .
20,000
(Cash sale)
EXERCISE 5–6
a. The income statement is as follows:

614
Solu ons To Exercises
Smith Corp.
Income Statement
Year Ended June 30, 2015
Sales
$72,000
Less: Sales returns and allowances
2,000
Net sales
$70,000
Cost of goods sold
50,000
Gross profit
$20,000
Opera ng expenses:
Selling expenses:
Adver sing expense
$1,500
Commissions expense
4,000
Delivery expense
500
Rent expense - store
1,500
Sales salaries expense
2,000
Total selling expenses
$9,500
General and administra ve expenses:
Deprecia on expense - equipment
500
Insurance expense
1,000
Office salaries expense
3,000
Rent expense - office
1,000
Total general and administra ve expenses
5,500
Total opera ng expenses
15,000
Income before income tax expense
5,000
Income tax expense
1,000
Net income
$4,000
b. The gross profit percentage, rounded to two decimal places, is 28.57% calculated as 100
×
(20,000/70,000).
EXERCISE 5–7
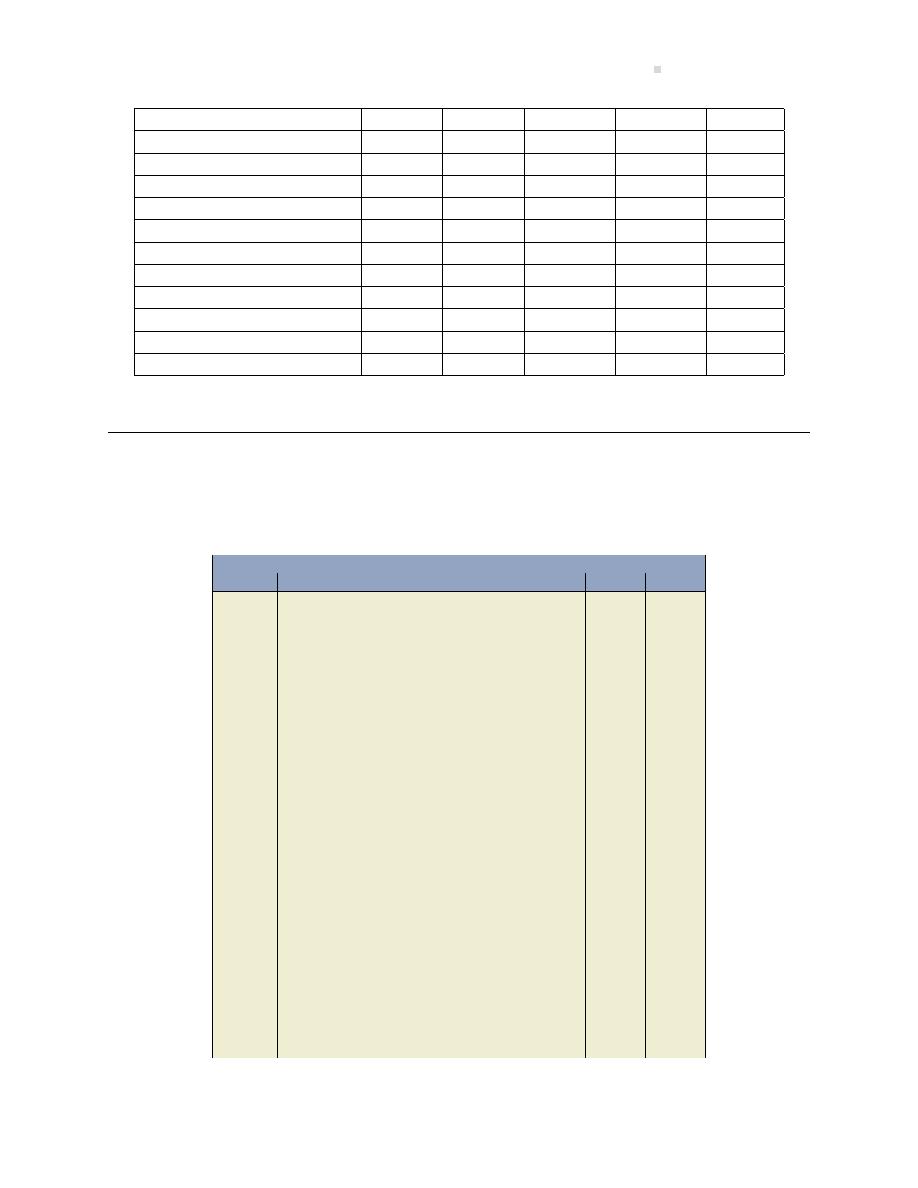
Chapter 5 Solu ons
615
Inventory, opening balance
$ 10,000
$ 53,000
$ 561,800
$ 168,540
50,562
Plus: purchases
30,000
159,000
1,685,400
1,011,240
606,744
Total goods available for sale
40,000
212,000
2,247,200
1,179,780
657,306
Less: ending inventory
15,000
79,500
842,700
556,180
100,000
Cost of goods sold
25,000
132,500
1,404,500
623,600
557,306
Sales
55,000
240,000
1,600,000
900,000
700,000
Less: cost of goods sold
25,000
132,500
1,404,500
623,600
557,306
Gross profit
30,000
107,500
195,500
276,400
142,694
Less: opera ng expenses
12,000
63,600
275,000
250,000
145,000
Net income/(loss)
18,000
43,900
(79,500)
26,400
(2,306)
Gross profit/sales (%)
54.55%
44.79%
12.22%
30.71%
0
EXERCISE 5–8
a. Closing entries:
General Journal
Date
Account/Explana on
PR
Debit
Credit
June 30
Sales . . . . . . . . . . . . . . . . . . . . . . . . . . . . . . . . . .
72,000
Income Summary . . . . . . . . . . . . . . . . . . .
72,000
(to close credit balance temporary ac-
counts)
30
Income Summary . . . . . . . . . . . . . . . . . . . . . .
68,000
Sales Returns and Allowances . . . . . . . .
2,000
Cost of Goods Sold . . . . . . . . . . . . . . . . . .
50,000
Adver sing Expense . . . . . . . . . . . . . . . . .
1,500
Commissions Expense . . . . . . . . . . . . . . .
4,000
Delivery Expense . . . . . . . . . . . . . . . . . . .
500
Rent Expense – Store . . . . . . . . . . . . . . . .
1,500
Sales Salaries Expense . . . . . . . . . . . . . . .
2,000
Deprecia on Expense – Equipment . . .
500
Insurance Expense . . . . . . . . . . . . . . . . . .
1,000
Office Salaries Expense . . . . . . . . . . . . . .
3,000
Rent Expense – Office . . . . . . . . . . . . . . .
1,000
Income Tax Expense . . . . . . . . . . . . . . . . .
1,000
(to close debit balance temporary ac-
counts)
30
Income Summary . . . . . . . . . . . . . . . . . . . . . .
4,000
Retained Earnings . . . . . . . . . . . . . . . . . . .
4,000
(to close balance in Income Summary to
Retained Earnings)
30
Retained Earnings . . . . . . . . . . . . . . . . . . . . . .
2,000
Dividends . . . . . . . . . . . . . . . . . . . . . . . . . .
2,000
(to close Dividends to Retained Earnings)

616
Solu ons To Exercises
b. The June 30, 2015 post-closing balance in Retained Earnings is $20,000 calculated as:
Retained Earnings
18,000
Beginning Balance
Dividends
2,000
4,000
Net Income
20,000
Ending Balance
EXERCISE 5–9
A
B
C
D
Opening Inventory
500
184
112
750
Purchases
1,415
344
840
5,860
Transporta on-In
25
6
15
10
Cost of Goods Available for Sale
1,940
534
967
6,620
Ending Inventory
340
200
135
880
Cost of Goods Sold
1,600
334
832
5,740
EXERCISE 5–10
Opening Inventory
375
Purchases
2,930
Less: Purchases Discounts
5
Less: Purchases Returns and Allowances
20
Transporta on-In
105
Less: Ending Inventory
440
Cost of Goods Sold
2,945
EXERCISE 5–11
a. The completed table is as follows:
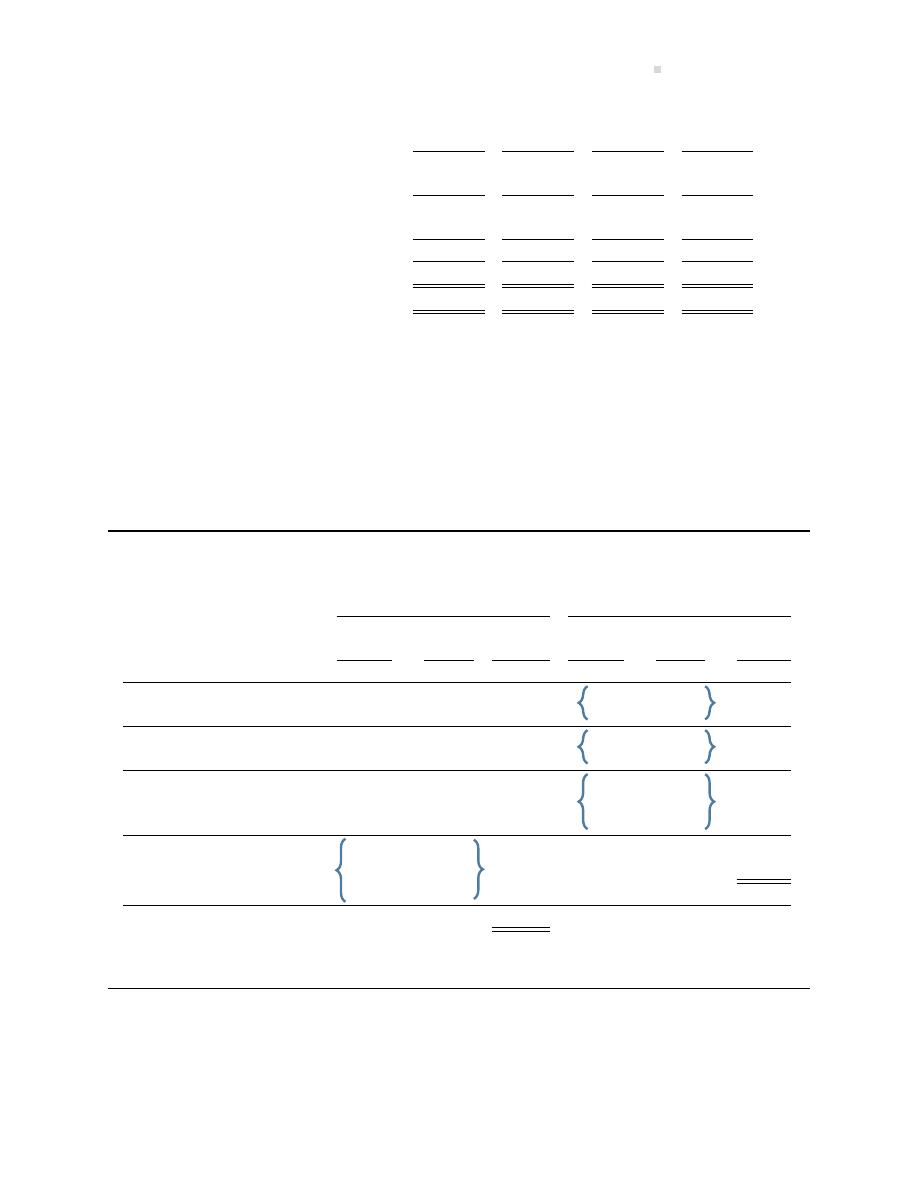
Chapter 6 Solu ons
617
A
B
C
D
Sales
$300
$150
$195
$90
Opening Inventory
80
40
40
12
Purchases
240
120
150
63
Cost of Goods Available for Sale
320
160
190
75
Ending Inventory
(120)
(60)
(60)
(15)
Cost of Goods Sold
200
100
130
60
Gross Profit
$100
$50
$65
$30
Gross Profit percentage
33.33%
33.33%
33.33%
33.33%
b. All four companies have the same gross profit percentage of 33.33% which means each is
contribu ng equally to opera ng expenses. In terms of real dollars, Company A is doing the
best because its gross profit is $100.
Chapter 6 Solu ons
EXERCISE 6–1
Purchased (Sold)
Balance
Unit
Unit
Total
Date
Units
Cost
COGS
Units
Cost
Cost
Jan. 1 Opening Inventory
100
×
$1 =
$100
7 Purchase #1
10
×
$2
100
×
1
10
×
2
120
9 Sale #1
(80)
×
1
($80)
20
×
1
10
×
2
40
21
Purchase #2
20
×
3
20
×
1
10
×
2
100
20
×
3
24
Sale #2
(20)
×
1
(10)
×
2
(70)
10
×
3 =
30
(10)
×
3
Total COGS
$150
EXERCISE 6–2
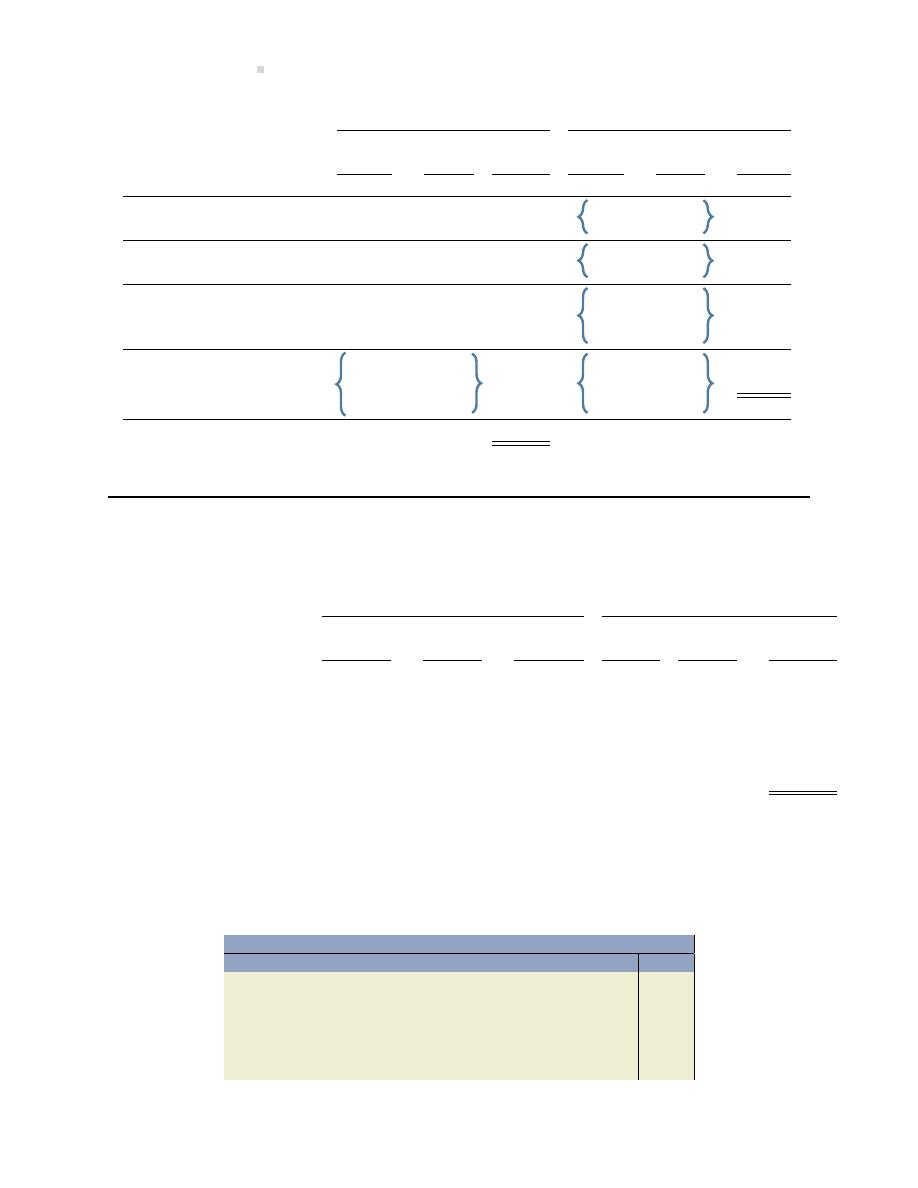
618
Solu ons To Exercises
Purchased (Sold)
Balance
Unit
Unit
Total
Date
Units
Cost
COGS
Units
Cost
Cost
Jan. 1 Opening Inventory
100
×
$1 =
$100
7 Purchase #1
10
×
$2
100
×
1
10
×
2
120
9 Sale #1
(72)
×
1
($72)
28
×
1
(8)
×
2
($16)
2
×
2
32
21
Purchase #2
20
×
3
28
×
1
2
×
2
92
20
×
3
24
Sale #2
(23)
×
1
5
×
1
(74)
2
×
2 =
18
(17)
×
3
3
×
3
Total COGS
$162
EXERCISE 6–3
Weighted Average (per unit costs must be rounded to two decimal places)
Purchased (Sold)
Balance
Unit
Unit
Total
Date
Units
Cost
COGS
Units
Cost
Cost
Jan. 1 Opening Inventory
2,000
$0.50 =
$1,000
5 Sales #1
(1,200)
× $0.50
($600)
800
400
6 Purchase #1
1,000
×
2.00
1,800
1.33
1
2,400
10 Purchase #2
500
×
1.00
2,300
1.26
2
2,900
16 Sale #2
(2,000)
×
1.26
=
(2,520)
300
380
21 Purchase #3
1,000
×
2.50
1,300
2.22
3
$2,880
1
[$400 + (1,000
× $2)]/(800 + 1,000) = $1.33/unit (rounded)
2
[$2,400 + (500
× 1)]/(1,800 +
500) = $1.26/unit (rounded)
3
[$380 + (1,000
× 2.50)]/(300 + 1,000) = $2.22/unit (rounded)
a. The entry for the January 5 sale:
General Journal
Date
Account/Explana on
PR
Debit
Credit
Jan. 5
Accounts Receivable . . . . . . . . . . . . . . . . . . .
6,000
Sales . . . . . . . . . . . . . . . . . . . . . . . . . . . . . .
6,000
Cost of Goods Sold . . . . . . . . . . . . . . . . . . . . .
600
Merchandise Inventory . . . . . . . . . . . . . .
600
To record Jan. 5 sales: 1,200 units
×
$5.00/unit selling price = $6,000.
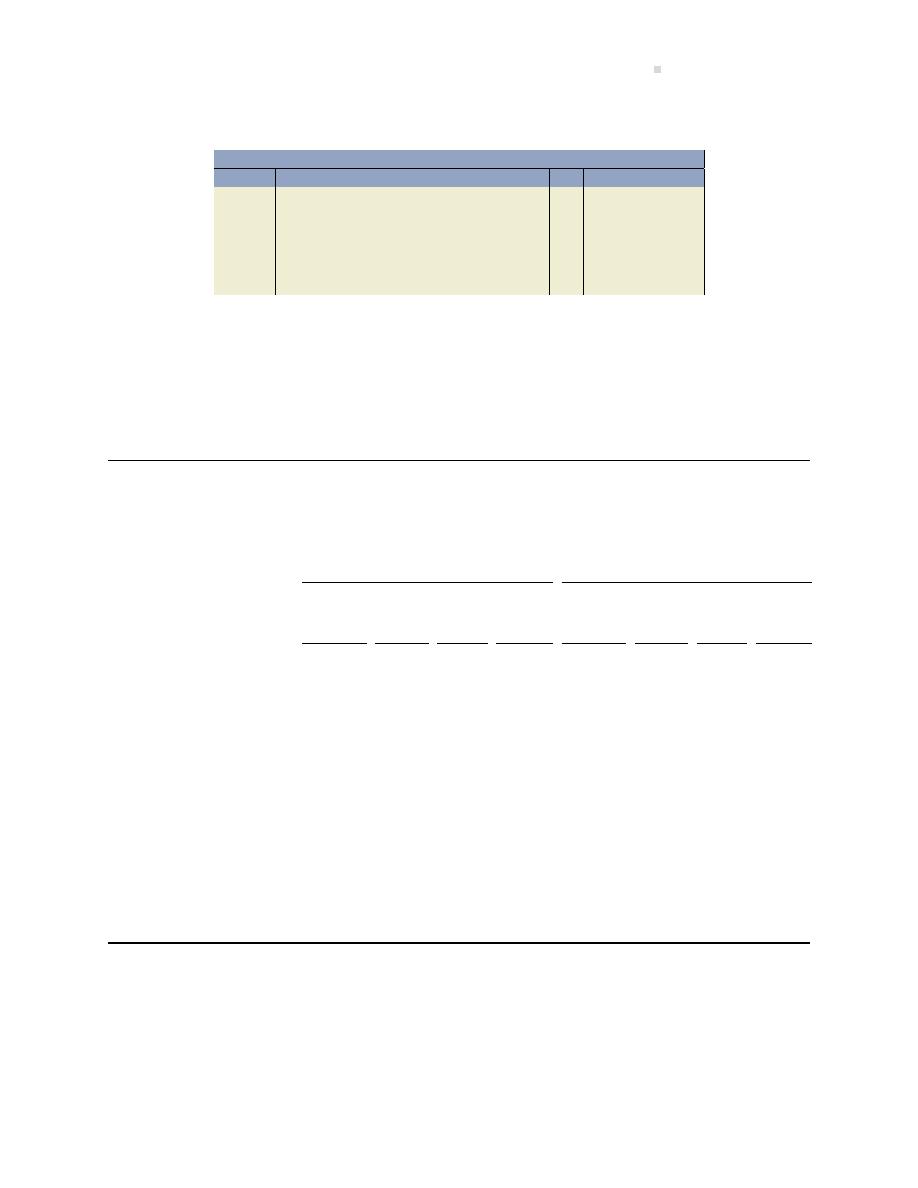
Chapter 6 Solu ons
619
b. The entry for the January 16 sale:
General Journal
Date
Account/Explana on
PR
Debit
Credit
Jan. 16
Accounts Receivable . . . . . . . . . . . . . . . . . . .
12,000
Sales . . . . . . . . . . . . . . . . . . . . . . . . . . . . . .
12,000
Cost of Goods Sold . . . . . . . . . . . . . . . . . . . . .
2,520
Merchandise Inventory . . . . . . . . . . . . . .
2,520
To record Jan. 16 sales: 2,000 units
×
$6.00/unit selling price = $12,000.
c. Per the above table, there are 1,300 units on hand @ $2.22 (rounded), for a total ending
inventory cost of $2,880. Be careful to note that the total ending inventory cost of $2,880
is NOT calculated as 1,300 units
× the average unit cost of $2.22. The $2,880 is calculated
as the inventory balance of $380 on January 16 plus the January 21 purchase of $2,500.
EXERCISE 6–4
N/E = No Effect; O = Overstated; U = Understated
2016 Statements
2017 Statements
2016
2016
2017
2017
Opening
Ending
Total
Net
Opening
Ending
Total
Net
Errors
Invent.
Invent.
Assets
Income
Invent.
Invent.
Assets
Income
1. Goods purchased in 2016
were included in the
December 31, 2016
N/E
U
U
U
U
N/E
N/E
O
inventory, but the
transac on was not
recorded un l early 2017.
2. Goods purchased in 2017
were included in December
31, 2016 inventory, and the
N/E
O
O
O
O
N/E
N/E
U
transac on was recorded in
2016.
EXERCISE 6–5
a.
i. Ending inventory for 2021 was understated by $2,000. Thus, cost of goods sold should
have been $18,000 and gross profit, $12,000. Because of this mistake, the 2022 opening
inventory was also understated by $2,000, causing cost of goods sold to be understated

620
Solu ons To Exercises
by $2,000 and gross profit overstated by $2,000; gross profit in 2022 should have been
$15,000. There is no impact on 2023 as a result of the error.
ii. The 2023 ending inventory was overstated by $5,000. Thus, cost of goods sold should
have been $30,000 and gross profit, $20,000. This error does not impact 2021 or 2022.
b. For 2021, the merchandise inventory on the balance sheet was understated by $2,000. Thus,
the total assets were $2,000 less than they should have been. For 2022, there is no effect
on the balance sheet, as the error is in opening inventory. For 2023, the ending inventory
in the balance sheet is overstated by $5,000, which means that total assets were overstated
by $5,000.
EXERCISE 6–6
a. LCNRV on a unit-by-unit basis: (2
× $50) + (3 × $75) + (4 × $20) = $405
Therefore, LCNRV = $405 on a unit-by-unit basis.
b. LCNRV on a group inventory basis: Total cost of the group: (2
× $50) + (3 × $150) + (4 ×
$25) = $650 Total NRV of the group: (2
× $60) + (3 × $75) + (4 × $20) = $425
Therefore, LCNRV = $425 on a group inventory basis.
EXERCISE 6–7
a. Es mated amount of inventory lost in the fire:
Sales
$300,000
100%
Cost of Goods Sold:
Opening Inventory
$80,000
Purchases
150,000
Cost of Goods Available
230,000
Ending Inventory (es mated)
(iii)
Cost of Goods Sold
(ii)
65%
Gross Profit
(i)
35%
(i)
Gross Profit = 35% of Sales
=
35%
× $300,000
=
$105,000
(ii)
Cost of Goods Sold
=
Sales
− Gross Profit
=
$300,000
− 105,000
=
$195,000
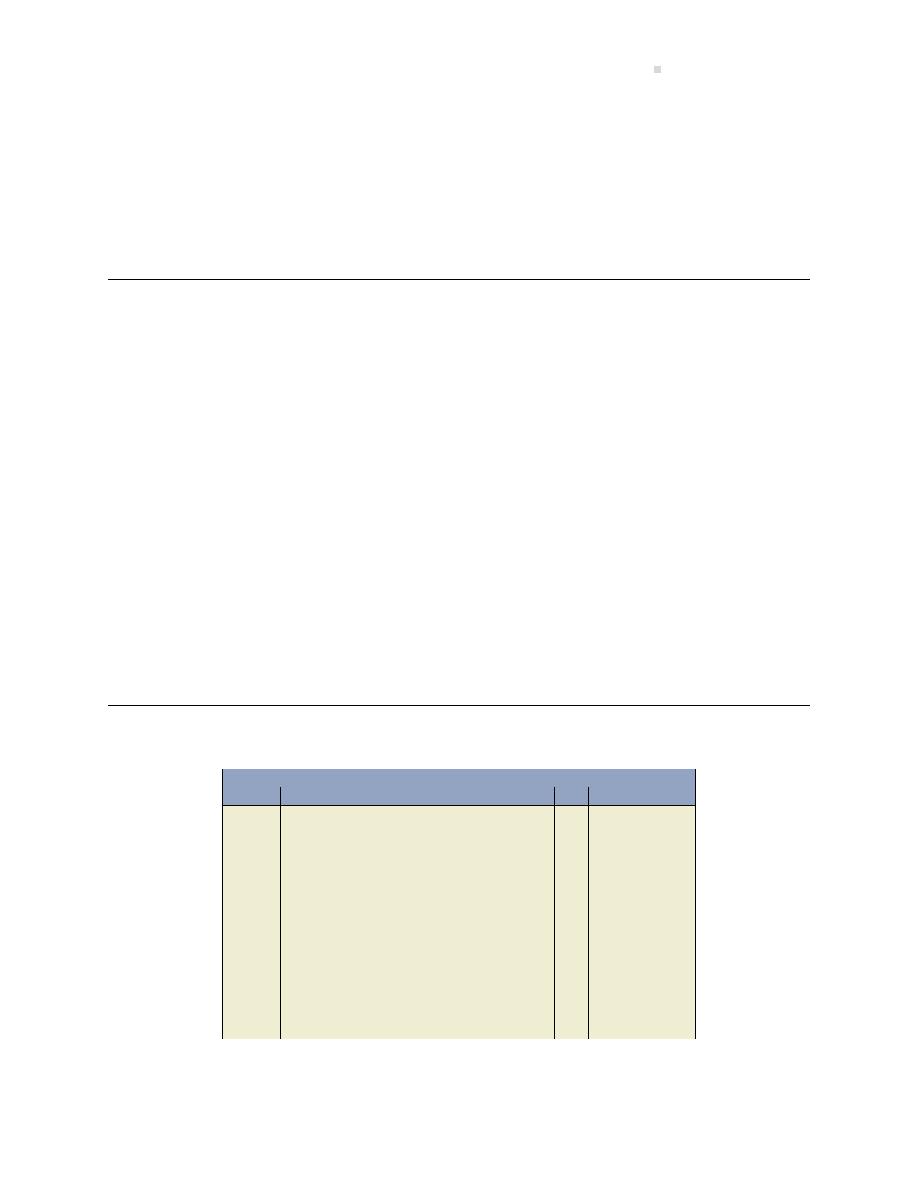
Chapter 7 Solu ons
621
(iii)
Es mated Ending Inventory
=
Cost of Goods Available
− Total Cost of Goods Sold
=
$230,000
− 195,000
=
$35,000
b. Balton lost about $35,000 of inventory in the fire and is claiming $45,000. This does not
appear reasonable.
EXERCISE 6–8
a. Merchandise inventory turnover for each of the years 2022 to 2025:
2025
2024
2023
2022
2021
Cost of Goods Sold
370,000
400,000
420,000
440,000
450,000
Merchandise Inventory
120,000
111,250
88,750
111,250
88,750
Merchandise Inventory Turnover
3.2
4
4.2
4.4
b. The change in Able Corp.’s Merchandise Inventory Turnover ra o is unfavourable because
inventory is being sold at a slower rate from 2022 to 2025, from 4.4 mes per year in 2022
to 3.2 mes per year in 2025.
Chapter 7 Solu ons
EXERCISE 7–1
General Journal
Date
Account/Explana on
PR
Debit
Credit
Mar. 1
Pe y Cash . . . . . . . . . . . . . . . . . . . . . . . . . . . . .
200
Cash . . . . . . . . . . . . . . . . . . . . . . . . . . . . . . .
200
12
Office Supplies Expense. . . . . . . . . . . . . . . . .
60
Maintenance Expense . . . . . . . . . . . . . . . . . .
35
Miscellaneous Selling Expense . . . . . . . . . .
25
Cash . . . . . . . . . . . . . . . . . . . . . . . . . . . . . . .
120
18
Pe y Cash . . . . . . . . . . . . . . . . . . . . . . . . . . . . .
200
Cash . . . . . . . . . . . . . . . . . . . . . . . . . . . . . . .
200
25
Office Supplies Expense. . . . . . . . . . . . . . . . .
75
Delivery Expense . . . . . . . . . . . . . . . . . . . . . . .
30
Cash . . . . . . . . . . . . . . . . . . . . . . . . . . . . . . .
105
28
Cash . . . . . . . . . . . . . . . . . . . . . . . . . . . . . . . . . .
50
Pe y Cash . . . . . . . . . . . . . . . . . . . . . . . . .
50
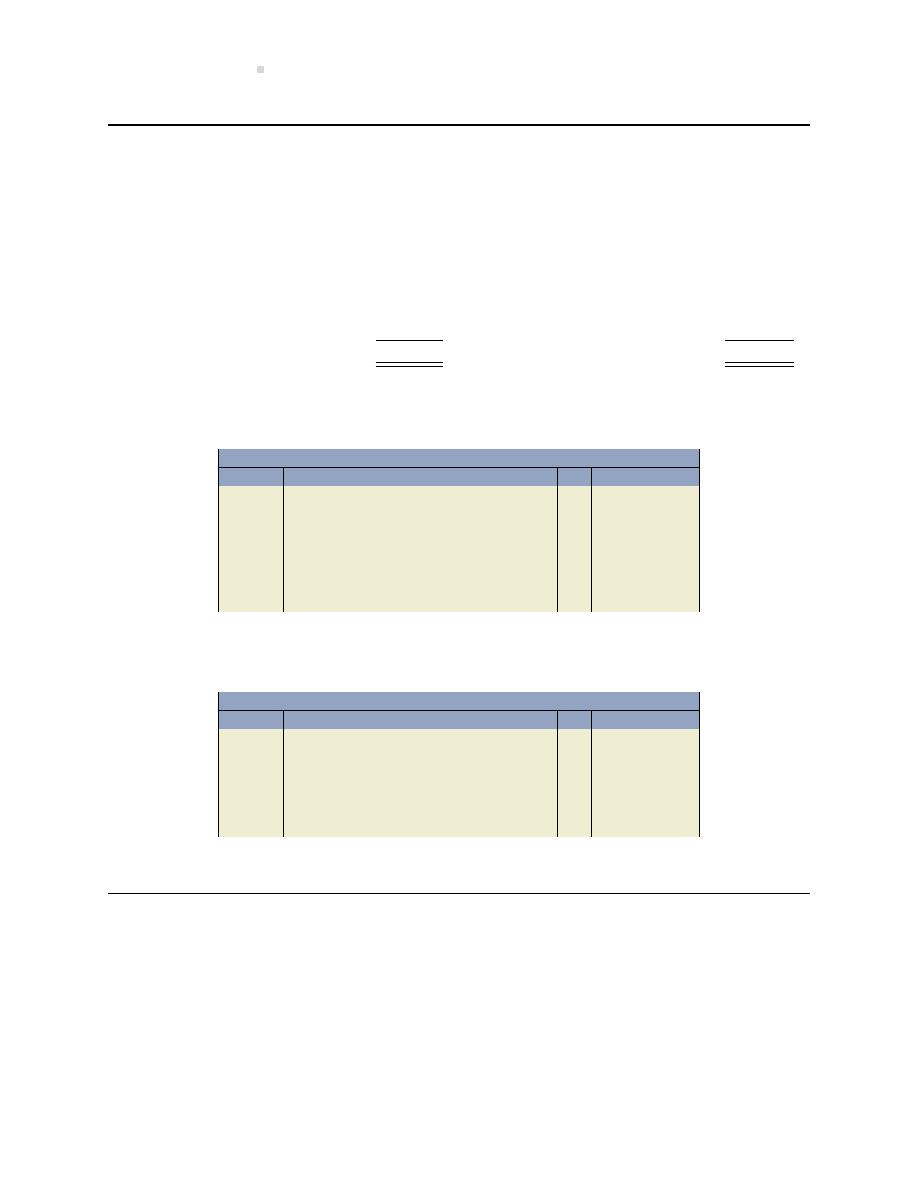
622
Solu ons To Exercises
EXERCISE 7–2
Ferguson Corp.
Bank Reconcilia on
At December 31, 2016
Cash per general ledger, Dec. 31
$5,005
Cash per bank statement, Dec. 31
$7,000
Add:
Note collected by bank
1,300
Add:
Error Fluet Inc. cheque
200
Interest on note
25
Outstanding deposit
700
Less:
Bank service charges
(30)
Less: Outstanding cheques
(1,600)
Adjusted Cash balance, Dec. 31
$6,300
Adjusted Cash balance, Dec. 31
$6,300
Adjus ng entries resul ng from bank reconcilia on:
General Journal
Date
Account/Explana on
PR
Debit
Credit
Dec. 31
Cash . . . . . . . . . . . . . . . . . . . . . . . . . . . . . . . . . .
1,325
Note Receivable . . . . . . . . . . . . . . . . . . . .
1,300
Interest Earned . . . . . . . . . . . . . . . . . . . . .
25
To record the note collected by the bank.
31
Interest and Bank Charges Expense . . . . . .
30
Cash . . . . . . . . . . . . . . . . . . . . . . . . . . . . . . .
30
To record service charges from the bank.
OR
General Journal
Date
Account/Explana on
PR
Debit
Credit
Dec. 31
Cash . . . . . . . . . . . . . . . . . . . . . . . . . . . . . . . . . .
1,295
Interest and Bank Charges Expense . . . . . .
30
Note Receivable . . . . . . . . . . . . . . . . . . . .
1,300
Interest Earned . . . . . . . . . . . . . . . . . . . . .
25
To record bank service charges and note
collected by the bank.
EXERCISE 7–3
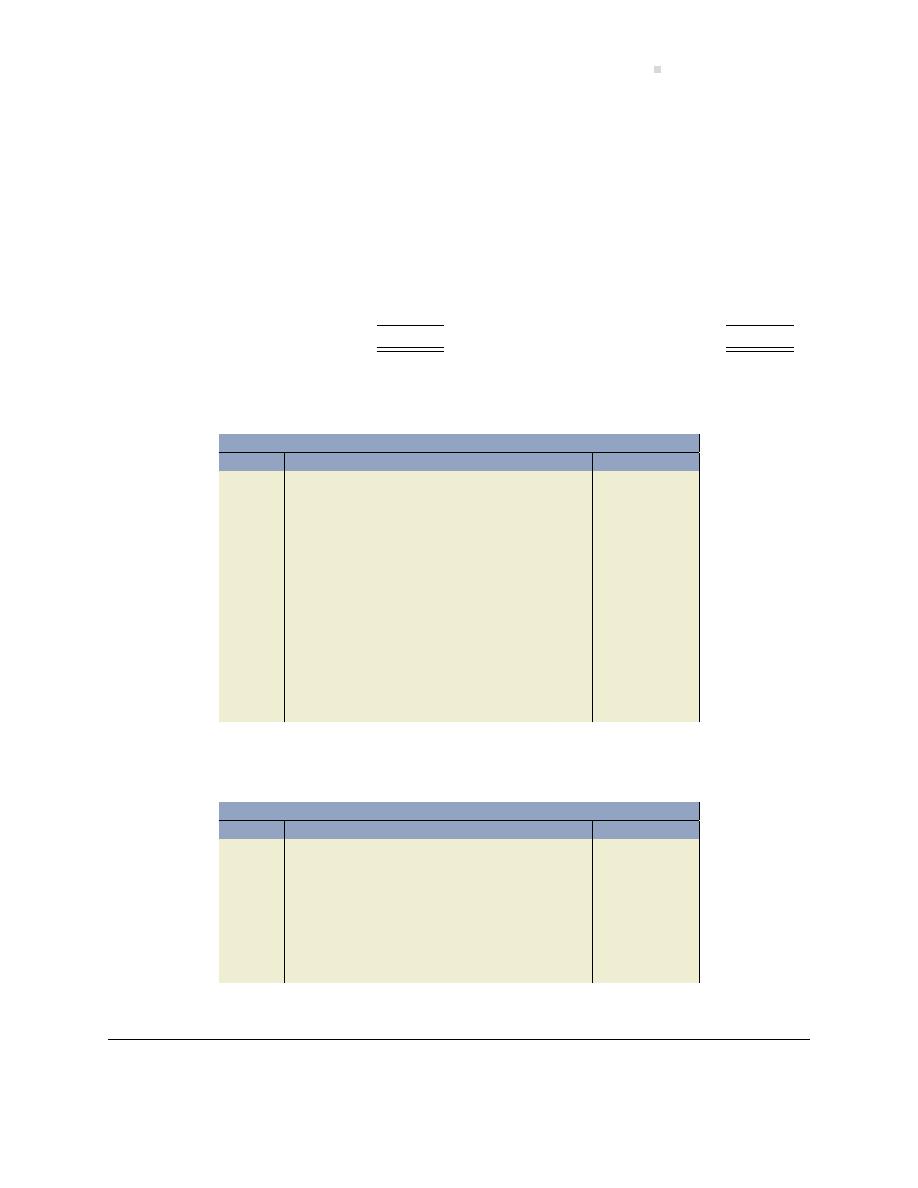
Chapter 7 Solu ons
623
Gladstone Ltd.
Bank Reconcilia on
At March 31, 2018
Cash per general ledger, Mar. 31
$2,531
Cash per bank statement, Mar. 31
$1,500
Add:
Error cheque No. 4302
27
Add:
Outstanding deposit
1,000
Note receivable
250
Error re. Global
250
Interest on note
50
Less:
Service charges – March
(20)
Less: Outstanding cheques
(622)
Service charges – Note
(10)
NSF cheque
(700)
Adjusted Cash balance, Mar. 31
$2,128
Adjusted Cash balance, Mar. 31
$2,128
Adjus ng entries:
General Journal
Date
Account/Explana on
PR
Debit
Credit
Mar. 31
Cash . . . . . . . . . . . . . . . . . . . . . . . . . . . . . . . . . .
27
Office Supplies Expense . . . . . . . . . . . . .
27
To correct ck. no. 4302
Cash . . . . . . . . . . . . . . . . . . . . . . . . . . . . . . . . . .
290
Interest and Bank Charges Expense . . . . . .
10
Note Receivable . . . . . . . . . . . . . . . . . . . .
250
Interest Earned . . . . . . . . . . . . . . . . . . . . .
50
To record note collected by the bank.
Interest and Bank Charges Expense . . . . . .
20
Cash . . . . . . . . . . . . . . . . . . . . . . . . . . . . . . .
20
To record service charges for March.
Accounts Receivable . . . . . . . . . . . . . . . . . . .
700
Cash . . . . . . . . . . . . . . . . . . . . . . . . . . . . . . .
700
To record NSF cheque returned.
OR
General Journal
Date
Account/Explana on
PR
Debit
Credit
Mar. 31
Interest and Bank Charges Expense . . . . . .
30
Accounts Receivable . . . . . . . . . . . . . . . . . . .
700
Office Supplies Expense . . . . . . . . . . . . .
27
Note Receivable . . . . . . . . . . . . . . . . . . . .
250
Interest Earned . . . . . . . . . . . . . . . . . . . . .
50
Cash . . . . . . . . . . . . . . . . . . . . . . . . . . . . . . .
403
To record adjustments resul ng from
March 31, 2018 bank rec.
EXERCISE 7–4
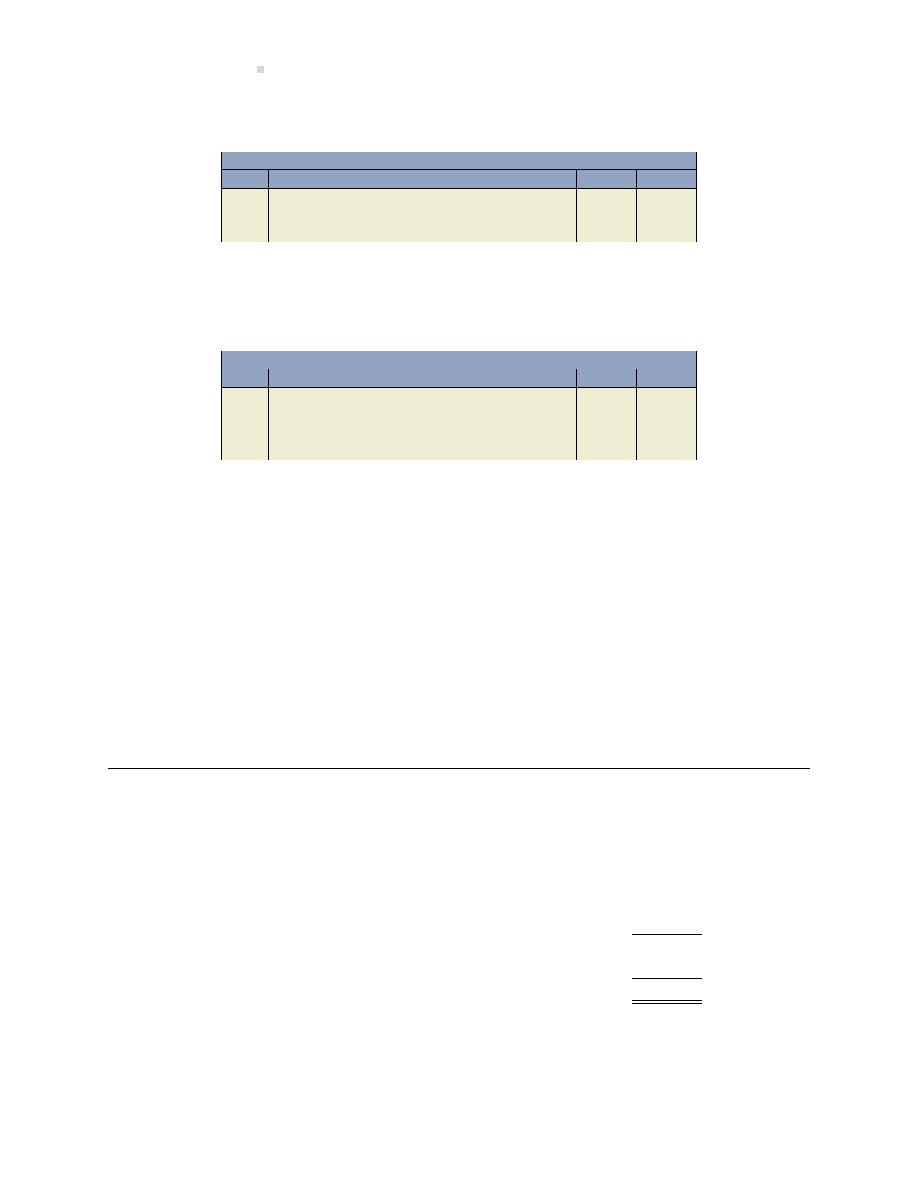
624
Solu ons To Exercises
a.
i. Entry to record the es mated uncollec ble accounts at December 31, 2015:
General Journal
Date
Account/Explana on
PR
Debit
Credit
Bad Debt Expense . . . . . . . . . . . . . . . . . . . . . .
15,000
Allowance for Doub ul Accounts . . . . .
15,000
(2%
× 750,000 = 15,000)
ii. Allowance for Doub ul Accounts = 3,000 + 15,000 = 18,000
b.
i. Entry to record the es mated uncollec ble accounts at December 31, 2015:
General Journal
Date
Account/Explana on
PR
Debit
Credit
Bad Debt Expense . . . . . . . . . . . . . . . . . . . . . .
11,700
Allowance for Doub ul Accounts . . . . .
11,700
[10%
× 147,000] = 14,700 − 3,000 =
11,700
ii. Allowance for Doub ul Accounts = 3,000 + 11,700 = 14,700
(or 10%
× 147,000)
c. There is a difference in the es mates because different methods are used. The first method
is based on a percentage of sales; the second on percentage of accounts receivable, a sim-
plified balance sheet method.
d. The calcula on made in part (a) above be er matches revenues and expenses: the revenues
(sales) is directly related to the amount that is wri en off as bad debt expense. The calcu-
la on made in part (b) above be er matches accounts receivable to allowance for doub ul
accounts and thus produces a be er balance sheet valua on.
EXERCISE 7–5
a. Amount of bad debt expense in 2019:
Allowance for doub ul accounts, Dec. 31, 2018
$8,000
Wri en off in 2019
(2,400)
5,600
Allowance for doub ul accounts, Dec. 31, 2019
(9,000)
Bad debt expense for 2019
$3,400
OR
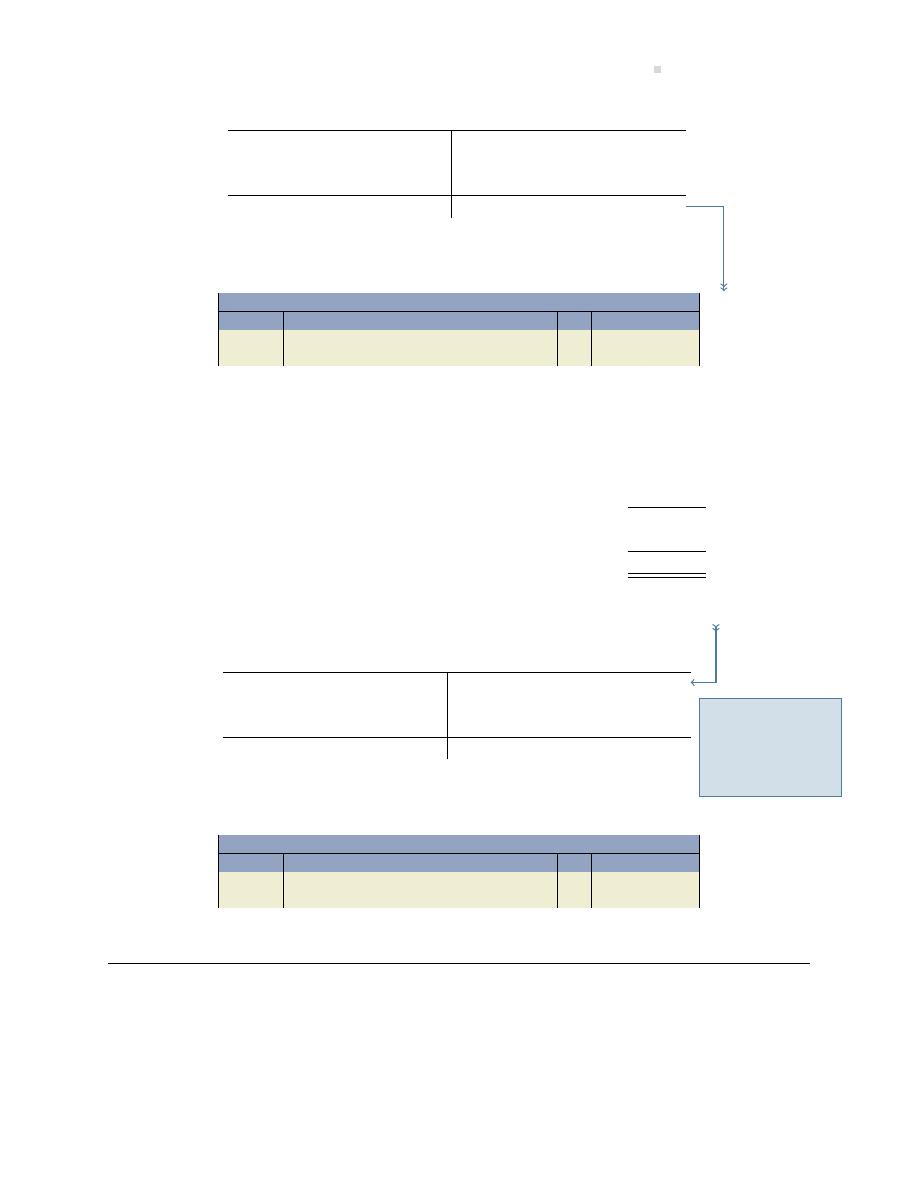
Chapter 7 Solu ons
625
Allowance for Doub ul Accounts
8,000
Dec. 31/18 Adj. Bal
2019 A/R Write-Offs 2,400
?
Adj. Entry Dec. 31/19
9,000
Dec. 31/19 Adj. Bal.
b. Entry recorded at December 31, 2019 to account for bad debts:
General Journal
Date
Account/Explana on
PR
Debit
Credit
Dec. 31
Bad Debt Expense . . . . . . . . . . . . . . . . . . . . . .
3,400
Allowance for Doub ul Accounts . . . . .
3,400
c. Amount of bad debt expense in 2020:
Allowance for doub ul accounts, Dec. 31, 2019
$ 9,000
Wri en off in 2020
(1,000)
Recovered in 2020
300
8,300
Allowance for doub ul accounts, Dec. 31, 2020
(10,000)
Bad debt expense for 2020
$ 1,700
OR
Allowance for Doub ul Accounts
9,000
Dec. 31/19 Adj. Bal.
2020 A/R Write-Offs 1,000
300
2020 Recovery
?
Adj. Entry Dec. 31/20
10,000
Dec. 31/20 Adj. Bal.
Recall that the
ending balance
in one period
becomes the be-
ginning balance in
the next.
d. Entry recorded at December 31, 2020 to account for bad debts:
General Journal
Date
Account/Explana on
PR
Debit
Credit
Dec. 31
Bad Debt Expense . . . . . . . . . . . . . . . . . . . . . .
1,700
Allowance for Doub ul Accounts . . . . .
1,700
EXERCISE 7–6
Part a:
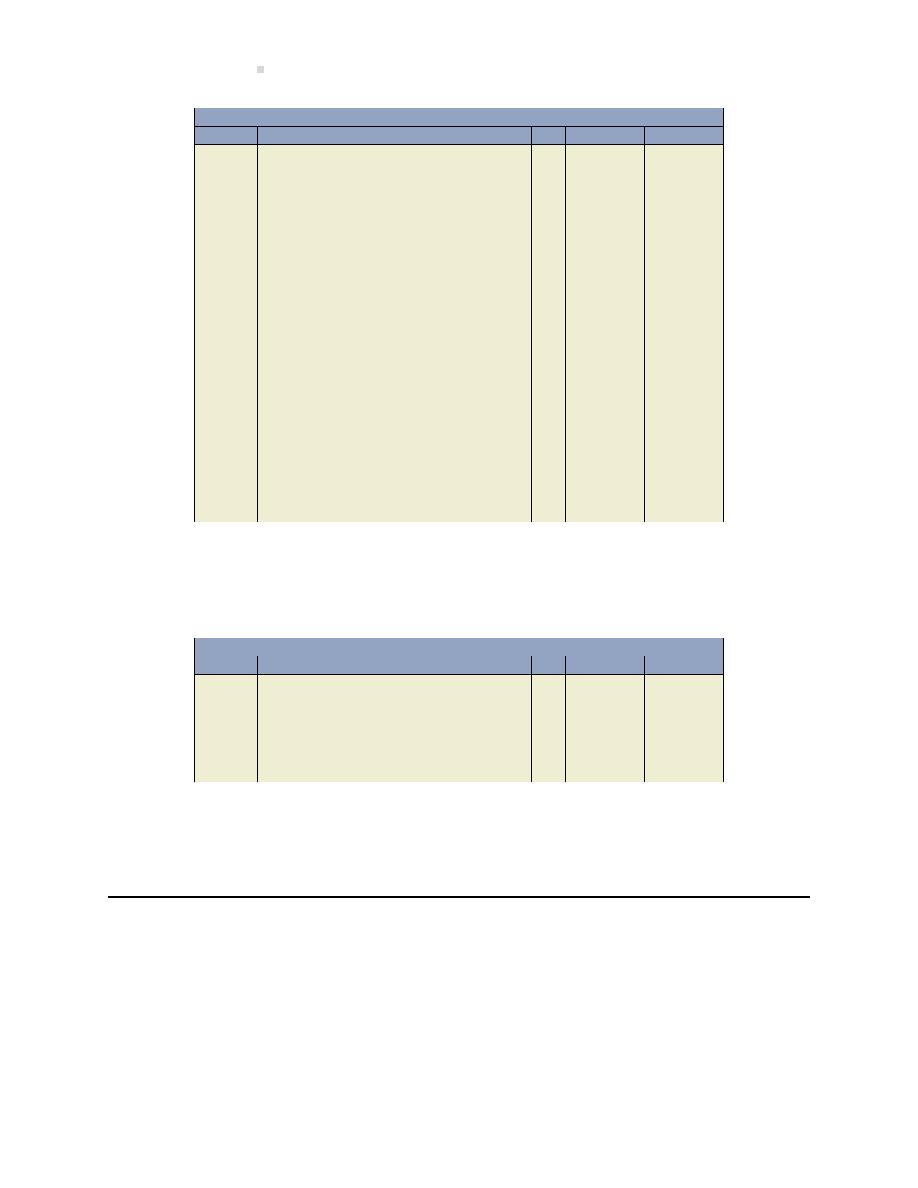
626
Solu ons To Exercises
General Journal
Date
Account/Explana on
PR
Debit
Credit
Mar. 1
Notes Receivable – West Corp. . . . . . . . . . .
40,000.00
Accounts Receivable – West Corp. . . . .
40,000.00
To record 90-day, 3% note receivable.
31
Interest Receivable . . . . . . . . . . . . . . . . . . . . .
98.63
Interest Revenue (or Interest Earned) .
98.63
To record accrued interest; 40,000
× 3%
× 30/365.
May 30
Cash . . . . . . . . . . . . . . . . . . . . . . . . . . . . . . . . . .
40,295.89
Interest Receivable . . . . . . . . . . . . . . . . . .
98.63
Interest Revenue (or Interest Earned) .
197.26
Notes Receivable – West Corp. . . . . . . .
40,000.00
To record collec on; 40,000
× 3% ×
60/365 = 197.26.
Jun. 15
Notes Receivable – Jill Monte . . . . . . . . . . .
50,000.00
Accounts Receivable – Jill Monte . . . . .
50,000.00
To record 45-day, 3% note receivable.
Jul.30*
Cash . . . . . . . . . . . . . . . . . . . . . . . . . . . . . . . . . .
50,184.93
Notes Receivable – Jill Monte . . . . . . . .
50,000.00
Interest Revenue (or Interest Earned) .
184.93
To record collec on; 50,000
× 3% ×
45/365.
*July 30 is determined by: June 30
− June 15 = 15 days + 30 days in July = 45 days.
Part b:
General Journal
Date
Account/Explana on
PR
Debit
Credit
May 30
Notes Receivable – West Corp.* . . . . . . . . .
40,295.89
Interest Receivable . . . . . . . . . . . . . . . . . .
98.63
Interest Revenue (or Interest Earned) .
197.26
Notes Receivable – West Corp. . . . . . . .
40,000.00
To record dishonoured note; 40,000
× 3%
× 60/365 = 197.26.
*When a note is dishonoured, a ‘new’ note is recorded that includes the interest and principal to
be recovered.
EXERCISE 7–7
a. Acid test ra o
2017: (30,000 + 20,000)/(12,000 + 8,000 + 9,000) = 1.72
2018: (42,000 + 25,000)/(14,000 + 9,000 + 11,000 + 17,000) = 1.31
Accounts receivable turnover ra o

Chapter 8 Solu ons
627
2017: 367,000/[(20,000 + 14,000)/2] = 21.59
2018: 375,000/[(25,000 + 20,000)/2] = 16.67
b. The change in both the acid-test and accounts receivable turnover ra os was unfavourable.
Although Salzl Corp.’s acid-test is greater than one indica ng that it has sufficient quick cur-
rent assets to cover current liabili es as they come due, that amount decreased from 2017
to 2018. The decrease in the accounts receivable turnover indicates that Salzl Corp. Is col-
lec ng receivables at a much slower rate in 2018 than in 2017 which is unfavourable. Re-
ceivables should be collected as quickly as possible so the accounts receivable turnover ra o
should be as high as possible.
Chapter 8 Solu ons
EXERCISE 8–1
f
Ba ery purchased for truck.
a
Commission paid to real estate agent to purchase land.
c
Cost of equipment test runs.
b
Cost to remodel building.
b or c
Cost to replace manual elevator with automa c elevator.
a
Cost of sewage system.
c
Equipment assembly expenditure.
c
Expenditures for debugging new equipment and ge ng it ready for use.
e
Installa on of air-condi oner in automobile.
b
Insurance paid during construc on of building.
a
Legal fees associated with purchase of land.
f
Oil change for truck.
a
Payment for landscaping.
a
Expenditures for removal of derelict structures.
f
Repair made to building a er moving in.
f
Repair of collision damage to truck.
f
Repair of torn seats in automobile.
e
Replacement of engine in automobile.
c
Special floor founda ons for installa on of new equipment.
f
Tires purchased for truck.
c
Transporta on expenditures to bring newly purchased equipment to plant.
EXERCISE 8–2

628
Solu ons To Exercises
General Journal
Date
Account/Explana on
PR
Debit
Credit
Land . . . . . . . . . . . . . . . . . . . . . . . . . . . . . . . . . .
75,000
Building . . . . . . . . . . . . . . . . . . . . . . . . . . . . . . .
225,000
Cash . . . . . . . . . . . . . . . . . . . . . . . . . . . . . . .
300,000
Land = $100,000/$400,000
× $300,000
=
$75,000.
Building
=
$300,000/$400,000
×
$300,000 = $225,000.
EXERCISE 8–3
a. Cost = $3,575 + $100 + $350 = $4,025.
b. Straight-Line Method:
Year
Straight-Line
Double-Declining Balance
1
$755*
$4,025
× 40%** = $1,610
2
$755
2,415
× 40% = 966
3
$755
1,449
× 40% = 580
4
$755
869
× 40% = 348
5
$755
521
× 40% = 208
* ($4,025
− 250)/5 years = $755
** (Rate = 2/n where n = useful life; 2/5yrs. = .40 or 40%)
Under the straight-line method, each period is assumed to receive equal benefits from the
use of the asset. Under the double-declining balance method, each period is charged a
diminishing amount. The straight-line method would be more appropriate if the economic
benefits would be used about equally over the years. The double-declining balance method
would be be er to use if the economic benefits were used up more in the first few years. The
DDB method is likely the be er choice, given the probability of technological obsolescence
of this type of asset.
EXERCISE 8–4
a. Straight-Line Method:
($240,000
− 40,000)/5 years = $40,000 per year

Chapter 8 Solu ons
629
2019 deprecia on
=
$40,000
2020 deprecia on
=
40,000
2021 deprecia on
=
40,000
2022 deprecia on
=
40,000
2023 deprecia on
=
40,000
Total deprecia on
=
$200,000*
*Maximum allowable deprecia on = Cost
− Residual which is $240,000 − $40,000 = $200,000.
b. Double-Declining Balance Method:
Rate = 2/n = 2/5 = 0.40 or 40%
2019 deprecia on = $240,000
× 40% =
$ 96,000
2020 deprecia on = ($240,000
− 96,000) × 40% =
57,600
2021 deprecia on = ($240,000
− 96,000 − 57,600) × 40% =
34,560
2022 deprecia on =
11,840*
2023 deprecia on =
0
Total deprecia on =
$200,000
*Maximum allowable deprecia on = $200,000 which is Cost
− Residual. Therefore, al-
though the calcula on of deprecia on for 2022 is:
2022 deprecia on = ($240,000
− 96,000 − 57,600 − 34,560) × 40% = 20,736
taking this amount would exceed the maximum allowable total deprecia on of $200,000.
Therefore, only $11,840 of deprecia on can be recorded in 2022. This is calculated as
$200,000 maximum allowable
− $96,000 deprecia on in 2019 − $57,600 deprecia on in
2020
− $34,560 deprecia on taken in 2021 = $11,840.
EXERCISE 8–5
a. Straight-Line Method:
($110,000
− 40,000)/4 years = $17,500 per year
2019 deprecia on
=
$17,500
2020 deprecia on
=
17,500
2021 deprecia on
=
17,500
2022 deprecia on
=
17,500
Total deprecia on
=
$70,000*
*Maximum allowable deprecia on = Cost
− Residual which is $110,000 − $40,000 = $70,000.

630
Solu ons To Exercises
b. Double-Declining Balance Method:
Rate = 2/n = 2/4 = 0.50 or 50%
2019 deprecia on = $110,000
× 50% = $55,000
2020 deprecia on =
15,000*
2021 deprecia on =
0
2022 deprecia on =
0
Total deprecia on =
$70,000
*Maximum allowable deprecia on = $70,000 which is Cost
− Residual. Therefore, although
the calcula on of deprecia on for 2020 is:
2020 deprecia on = ($110,000
− 55,000) × 50% = $27,500
taking this amount would exceed the maximum allowable total deprecia on of $70,000.
Therefore, only $15,000 of deprecia on can be recorded in 2020. This is calculated as
$70,000 maximum allowable
− $55,000 deprecia on in 2019 = $15,000.
EXERCISE 8–6
a.
i. Straight-Line Method:
($25,000
− 5,000)/5 years = $4,000 per year
2019 deprecia on = $4,000
× 1/2 = $2,000
2020 deprecia on = $4,000
ii. Units-of-Produc on Method:
($25,000
− 5,000)/500,000 km. = $0.04/km.
2019 deprecia on = 120,000 km.
× $0.04 = $4,800*
2020 deprecia on = 150,000 km.
× $0.04 = $6,000
*The 1/2 year rule does not apply under usage methods of calcula ng deprecia on since
deprecia on is based on units produced and not me.
iii. Double-Declining-Balance Method:
2/n = 2/5 = 0.40 or 40% per year
2019 deprecia on = $25,000
× 40% = $10,000 × 1/2 yr. = $5,000
2020 deprecia on = ($25,000
− 5,000) × 40% = $8,000
b.
i. Straight-Line Method:
($25,000
− 5,000)/5 years = $4,000 per year
2019 deprecia on = $4,000
× 10/12 = $3,333
2020 deprecia on = $4,000
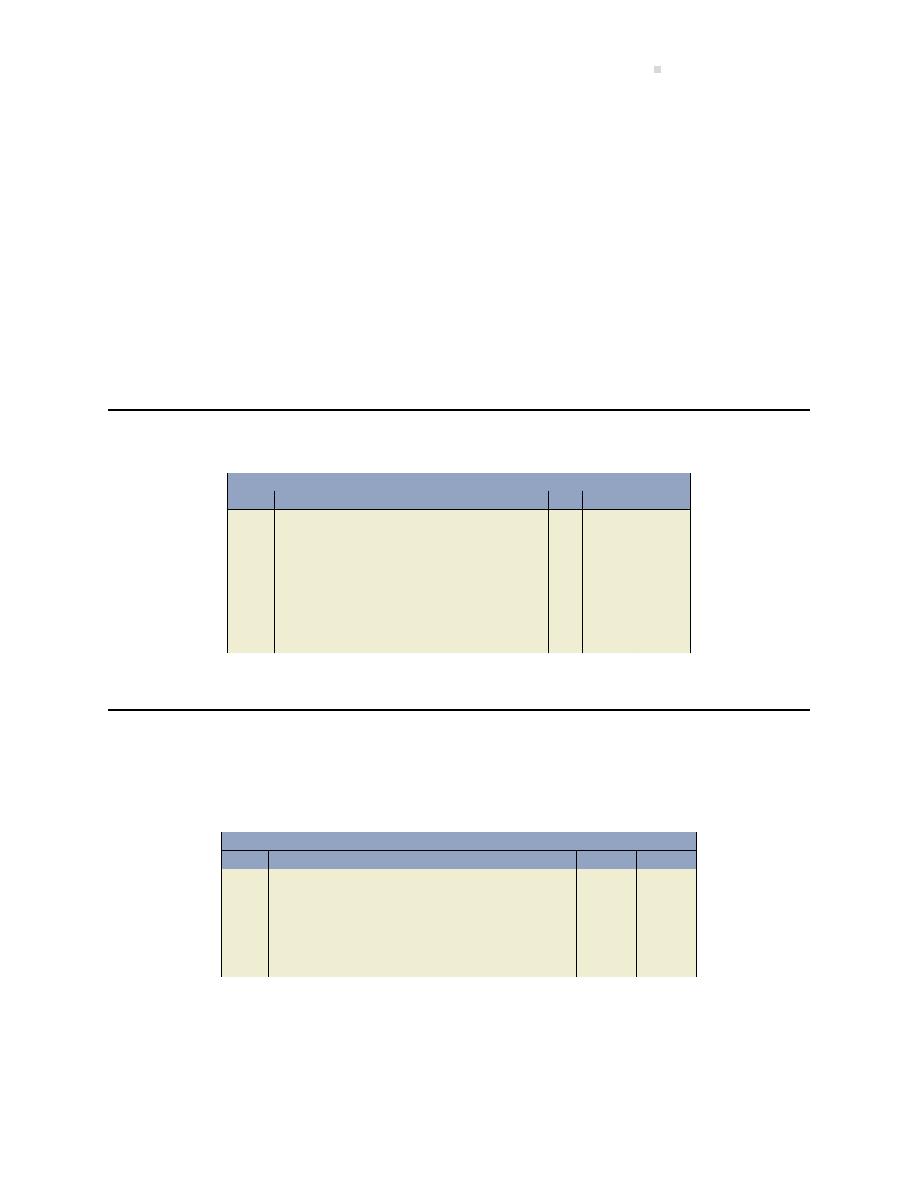
Chapter 8 Solu ons
631
ii. Units-of-Produc on Method:
($25,000
− 5,000)/500,000 km. = $0.04/km.
2019 deprecia on = 120,000 km.
× $0.04 = $4,800*
2020 deprecia on = 150,000 km.
× $0.04 = $6,000
*The 1/2 year rule does not apply under usage methods of calcula ng deprecia on since
deprecia on is based on units produced and not me.
iii. Double-Declining-Balance Method:
2/n = 2/5 = 0.40 or 40% per year
2019 deprecia on = $25,000
× 40% = $10,000 × 10/12 = $8,333
2020 deprecia on = ($25,000
− 8,333) × 40% = $6,667
EXERCISE 8–7
General Journal
Date
Account/Explana on
PR
Debit
Credit
Deprecia on Expense – Machinery . . . . . .
3,333
Accumulated Deprecia on – Machin-
ery . . . . . . . . . . . . . . . . . . . . . . . . . . . . . . . . . . .
3,333
To record revised deprecia on at Dec.
31, 2021; (60,000
− 0)/3 years = 20,000
deprecia on for each of 2019 and 2020;
(60,000
− 20,000 − 20,000 − 10,000)/(5
− 2) = 3,333 revised deprecia on 2021
EXERCISE 8–8
a. General journal entry to record deprecia on for the year ended December 31, 2019:
General Journal
Date
Account/Explana on
PR
Debit
Credit
Deprecia on Expense – Machinery . . . . . .
28,000
Accumulated Deprecia on – Machin-
ery . . . . . . . . . . . . . . . . . . . . . . . . . . . . . . . . . . .
28,000
To record deprecia on at Dec. 31, 2019;
(140,000
− 0)/5 years = 28,000 deprecia-
on for December 31, 2019
b. General journal entry to record revised deprecia on for the year ended December 31, 2020:
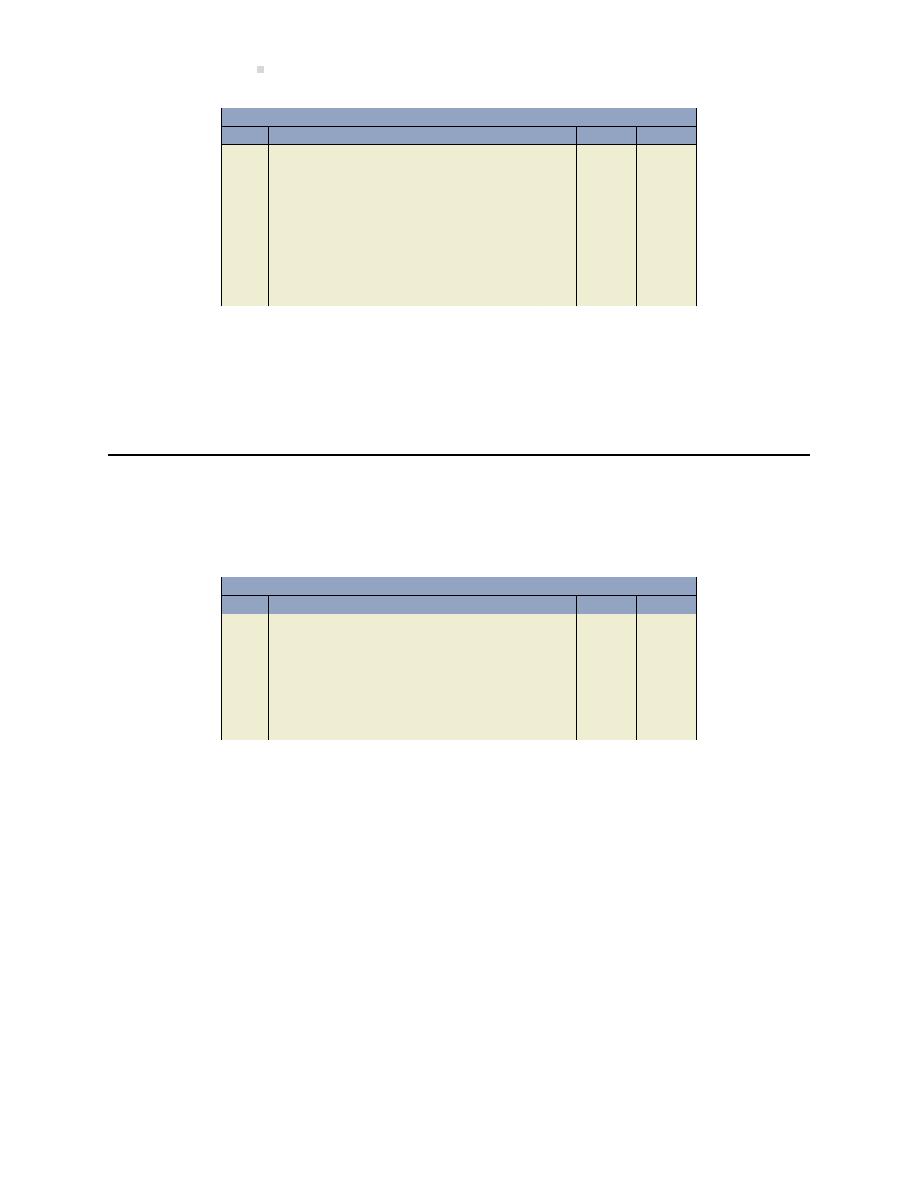
632
Solu ons To Exercises
General Journal
Date
Account/Explana on
PR
Debit
Credit
Deprecia on Expense – Machinery . . . . . .
40,500
Accumulated Deprecia on – Machin-
ery . . . . . . . . . . . . . . . . . . . . . . . . . . . . . . . . . . .
40,500
To record revised deprecia on at Dec. 31,
2020; Original Machinery: (140,000
− 0)/5
years = 28,000 deprecia on; New Compo-
nent: (50,000
− 0)/4 years = 12,500 de-
precia on; 28,000 + 12,500 = 40,500 to-
tal deprecia on at December 31, 2020
NOTE: Because of componen za on, deprecia on will likely be recorded on the machinery
and the new component separately. Therefore, it is acceptable to record two journal entries
instead of one.
EXERCISE 8–9
a. General journal entry to record any impairment losses at December 31, 2019:
General Journal
Date
Account/Explana on
PR
Debit
Credit
Impairment Loss . . . . . . . . . . . . . . . . . . . . . . .
22,917
Machinery . . . . . . . . . . . . . . . . . . . . . . . . .
22,917
To record impairment at Dec. 31, 2019;
($400,000 Cost
− $27,083 Accum. Dep.
=
$372,917 Carrying or Book Value)
−
$350,000 Recoverable Amount = $22,917
Impairment Loss
The land’s recoverable amount of $115,000 is greater than its carrying or book value of
$100,000 therefore there is no impairment.
The building’s recoverable amount of $870,000 is greater than its carrying or book value of
$855,333 ($890,000
− $34,667) therefore there is no impairment.
b. General journal entry to record deprecia on for the year ended December 31, 2020:
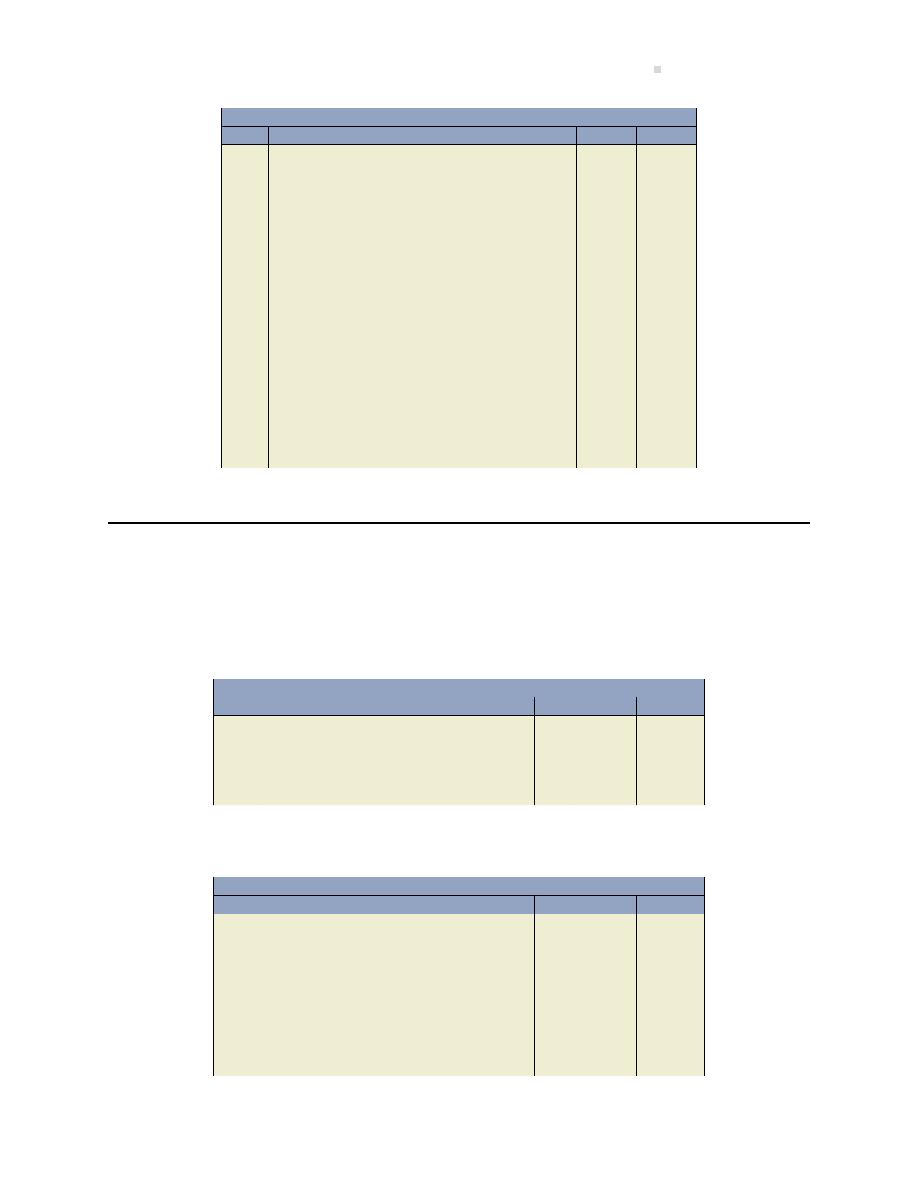
Chapter 8 Solu ons
633
General Journal
Date
Account/Explana on
PR
Debit
Credit
Deprecia on Expense – Building . . . . . . . . .
32,000
Accumulated Deprecia on – Building .
32,000
To record deprecia on at Dec. 31, 2020;
calculated as ($890,000
− $250,000)/20
years = $32,000
Deprecia on Expense – Machinery . . . . . .
22,430
Accumulated Deprecia on – Machin-
ery . . . . . . . . . . . . . . . . . . . . . . . . . . . . . . . . . . .
22,430
To record deprecia on at Dec. 31, 2020;
calculated as ($400,000
− $150,000 −
$27,083
− $22,917)/(10 − 1 1/12 = 8
11/12 years) = $22,430. Note that the Ac-
cum. Dep. of $27,083 represents 1 year
and 1 month of deprecia on (1 month in
2018 + 12 months in 2019). Therefore,
the remainder over which the machinery’s
cost must be depreciated is the original 10
years less the 1 year and 1 month.
EXERCISE 8–10
a. Journal entries to record the exchange on the books of:
i. Freeman:
General Journal
Date
Account/Explana on
PR
Debit
Credit
Equipment . . . . . . . . . . . . . . . . . . . . . . . . . . . .
200,000
Land . . . . . . . . . . . . . . . . . . . . . . . . . . . . . . .
125,000
Gain on Disposal . . . . . . . . . . . . . . . . . . . .
75,000
The equipment is valued at the fair value
of the asset given up.
ii. The developer:
General Journal
Date
Account/Explana on
PR
Debit
Credit
Land . . . . . . . . . . . . . . . . . . . . . . . . . . . . . . . . . .
240,000
Equipment . . . . . . . . . . . . . . . . . . . . . . . . .
325,000
Accumulated Deprecia on – Equipment . .
80,000
Loss on Disposal . . . . . . . . . . . . . . . . . . . . . . .
5,000
To record loss on disposal calculated
as: [$325,000 Cost
− $80,000 Accumu-
lated Deprecia on = $245,000 Carrying
Amount]
− [$240,000 Proceeds [fair value
of equipment)] = $5,000.
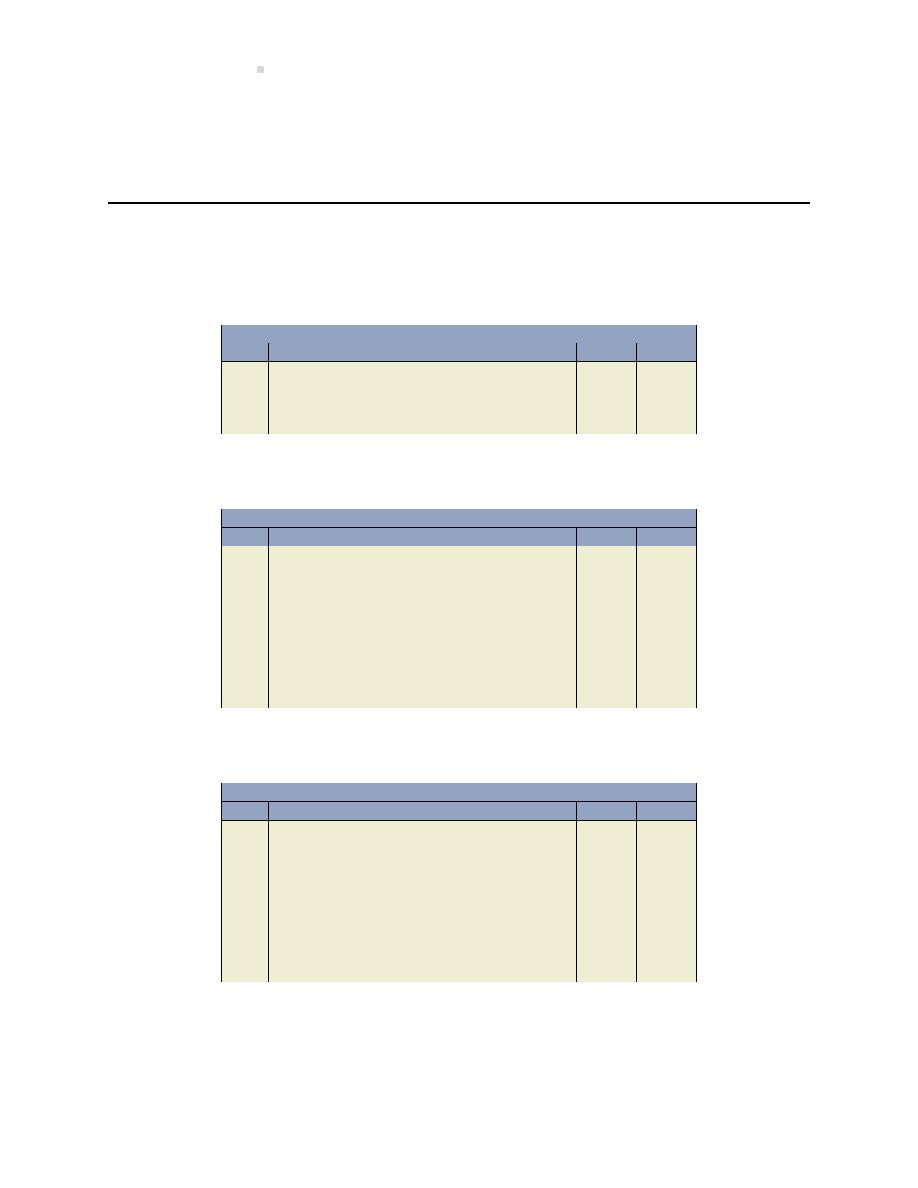
634
Solu ons To Exercises
b. The developer may be specula ng that the land will increase in value in the future beyond
the current fair value of the equipment exchanged for the land.
EXERCISE 8–11
a. Equipment sold for $20,000:
General Journal
Date
Account/Explana on
PR
Debit
Credit
Cash . . . . . . . . . . . . . . . . . . . . . . . . . . . . . . . . . .
20,000
Accumulated Deprecia on – Equipment . .
40,000
Equipment . . . . . . . . . . . . . . . . . . . . . . . . .
60,000
To record sale of equipment for $20,000.
b. Equipment sold for $30,000:
General Journal
Date
Account/Explana on
PR
Debit
Credit
Cash . . . . . . . . . . . . . . . . . . . . . . . . . . . . . . . . . .
30,000
Accumulated Deprecia on . . . . . . . . . . . . . .
40,000
Equipment . . . . . . . . . . . . . . . . . . . . . . . . .
60,000
Gain on Disposal . . . . . . . . . . . . . . . . . . . .
10,000
To record gain on disposal calculated as:
[$60,000 Cost of Equipment
− $40,000 Ac-
cumulated Deprecia on = $20,000 Carry-
ing Amount (or net book value)]
− $30,000
Proceeds of Disposal = $(10,000).
c. Equipment sold for $5,000:
General Journal
Date
Account/Explana on
PR
Debit
Credit
Cash . . . . . . . . . . . . . . . . . . . . . . . . . . . . . . . . . .
5,000
Accumulated Deprecia on . . . . . . . . . . . . . .
40,000
Loss on Disposal . . . . . . . . . . . . . . . . . . . . . . .
15,000
Equipment . . . . . . . . . . . . . . . . . . . . . . . . .
60,000
To record loss on disposal calculated as:
[$60,000 Cost of Equipment
− $40,000 Ac-
cumulated Deprecia on = $20,000 Carry-
ing Amount (or net book value)]
− $5,000
Proceeds of Disposal = $15,000.
To record loss on disposal calculated as:
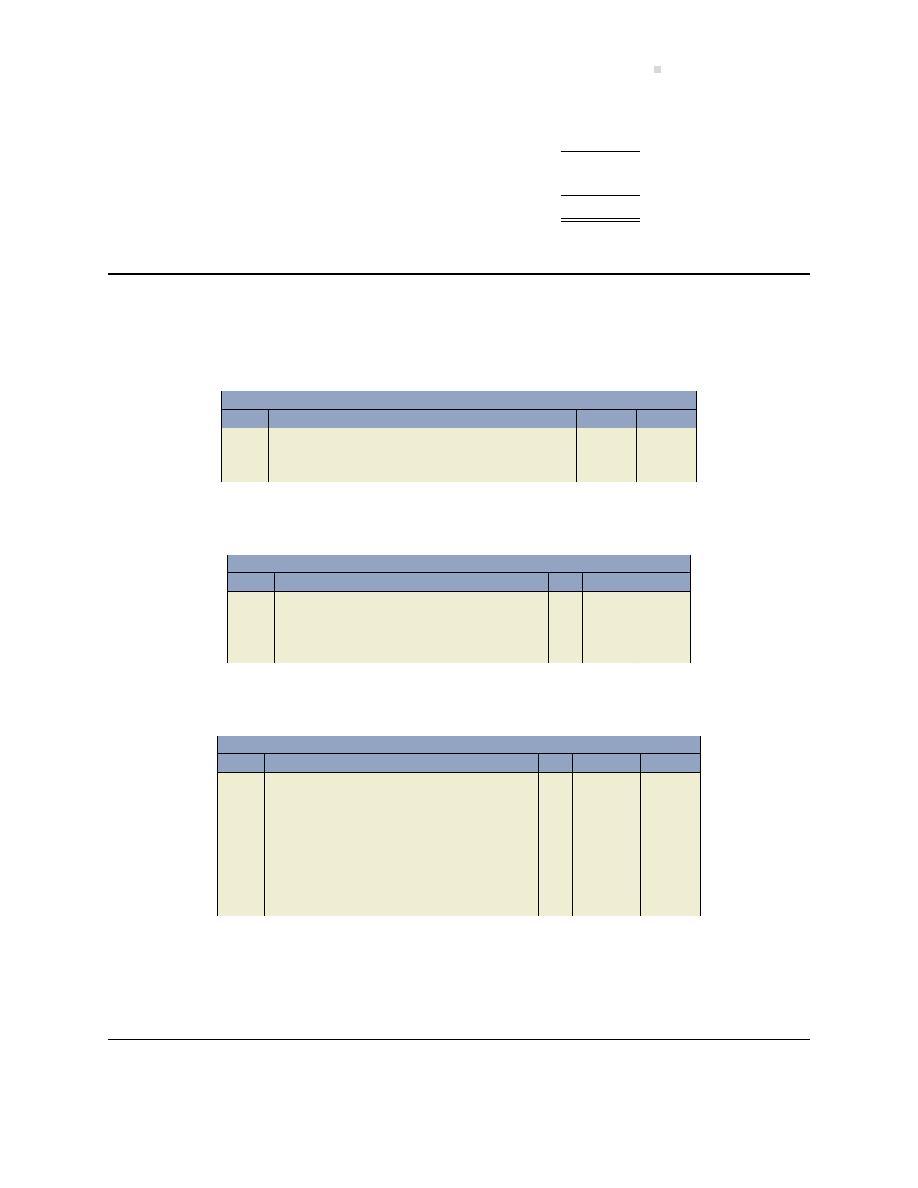
Chapter 9 Solu ons
635
Cost of equipment
$60,000
Accumulated deprecia on
(40,000)
Carrying amount (or net book value)
20,000
Proceeds of disposal
(5,000)
Loss on disposal
$15,000
EXERCISE 8–12
a. March 1, 2019 to record the purchase of the copyright:
General Journal
Date
Account/Explana on
PR
Debit
Credit
Copyright . . . . . . . . . . . . . . . . . . . . . . . . . . . . .
50,000
Cash . . . . . . . . . . . . . . . . . . . . . . . . . . . . . . .
50,000
To record purchase of copyright.
b. December 31, 2019, Willis’s year-end, to record amor za on of the copyright:
General Journal
Date
Account/Explana on
PR
Debit
Credit
Amor za on Expense . . . . . . . . . . . . . . . . . .
8,333
Accumulated Amor za on – Copyright
8,333
To record amor za on;
50,000/5 =
10,000
× 10/12 = 8,333.
c. October 1, 2021, Willis’s sale of the copyright to a movie producer for $100,000:
General Journal
Date
Account/Explana on
PR
Debit
Credit
Cash . . . . . . . . . . . . . . . . . . . . . . . . . . . . . . . . . .
100,000
Accumulated Amor za on – Copyright . . .
25,833
Copyright . . . . . . . . . . . . . . . . . . . . . . . . . .
50,000
Gain on Disposal . . . . . . . . . . . . . . . . . . . .
75,833
To record sale of copyright at a gain; Ac-
cumulated amor za on = 8,333 for 2019
+
10,000 for 2020 + 7,500 for 2021 =
25,833.
Chapter 9 Solu ons
EXERCISE 9–1
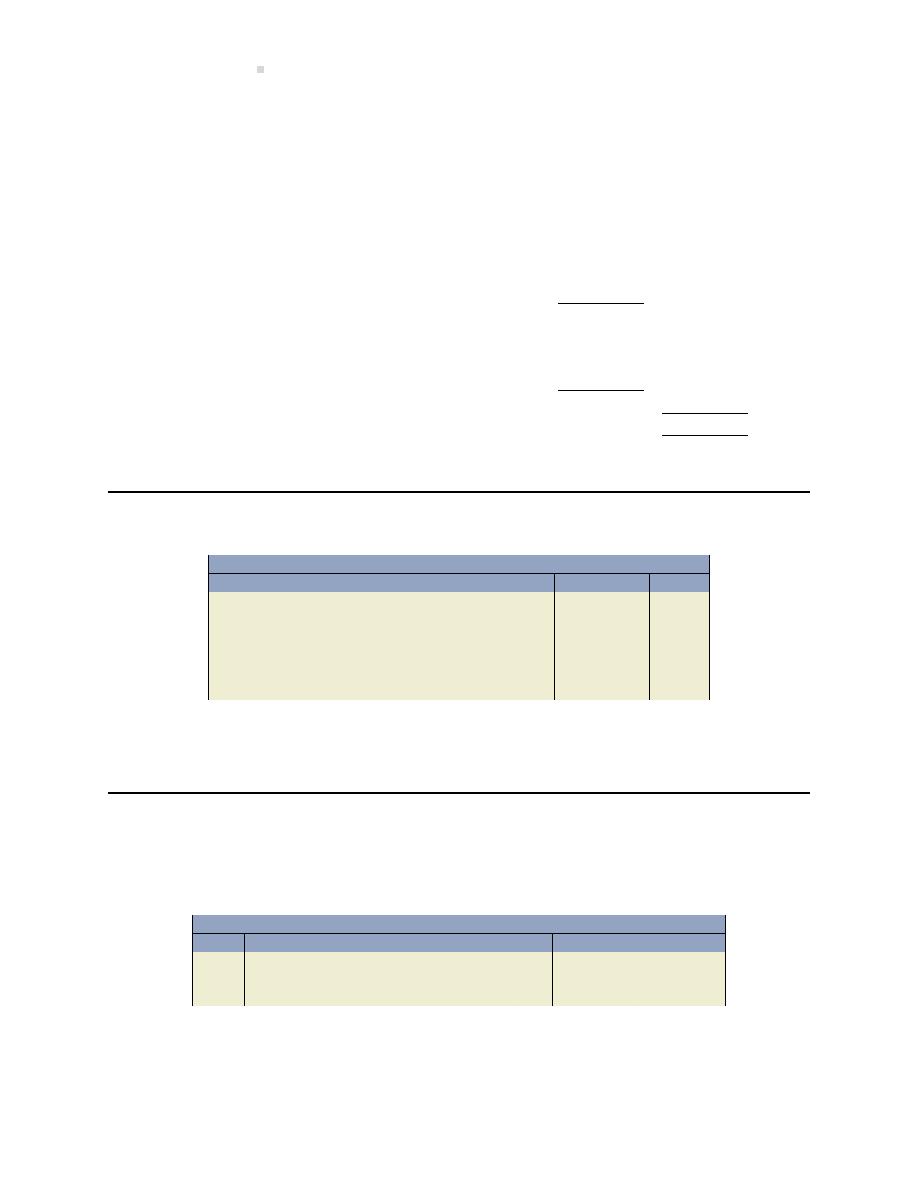
636
Solu ons To Exercises
Ajam Inc.
Par al Balance Sheet
March 31, 2019
Current liabili es:
Accounts payable
$58,000
Wages payable
102,000
Income taxes payable
92,000
Note payable, due November 30, 2019
64,000
Current por on of mortgage payable
80,000
Total current liabili es
$396,000
Long-term liabili es:
Note payable, due May 15, 2021
$108,000
Long-term por on of mortgage payable
240,000
Total long-term liabili es
348,000
Total liabili es
$744,000
EXERCISE 9–2
General Journal
Date
Account/Explana on
PR
Debit
Credit
June 7
Accounts Receivable . . . . . . . . . . . . . . . . . . .
56,000
PST Payable . . . . . . . . . . . . . . . . . . . . . . . .
3,500
GST Payable . . . . . . . . . . . . . . . . . . . . . . . .
2,500
Service Revenue . . . . . . . . . . . . . . . . . . . .
50,000
June 27*
Cash . . . . . . . . . . . . . . . . . . . . . . . . . . . . . . . . . .
56,000
Accounts Receivable . . . . . . . . . . . . . . . .
56,000
* The PST and GST collected on June 27 will be paid when due and recorded in a separate entry.
EXERCISE 9–3
a. Entry to record the issuance of the note on July 1, 2019:
General Journal
Date
Account/Explana on
PR
Debit
Credit
July 1
Cash . . . . . . . . . . . . . . . . . . . . . . . . . . . . . . . . . .
300,000.00
Notes Payable . . . . . . . . . . . . . . . . . . . . . .
300,000.00
To record 45-day, 3.5% note issued July 1.
b. Entry to accrue interest on July 31, 2019:
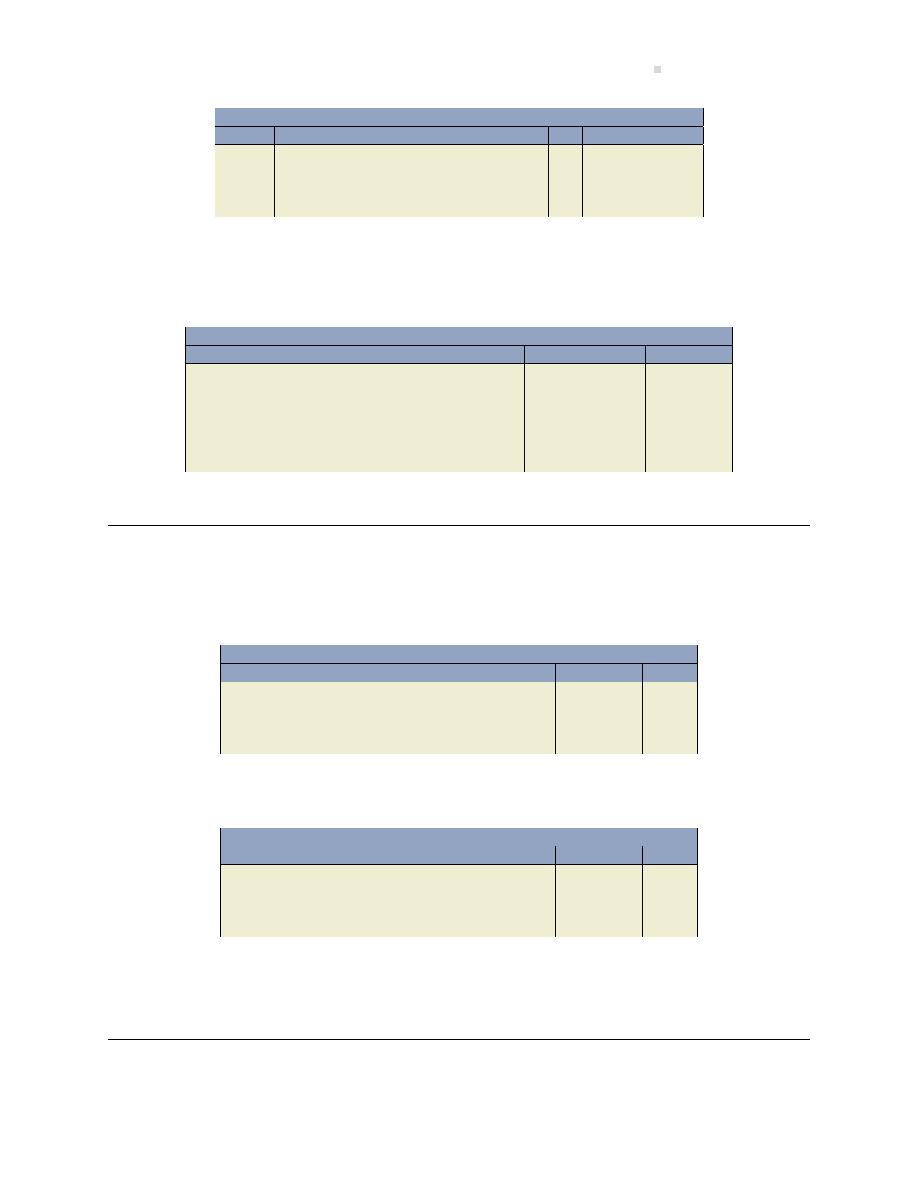
Chapter 9 Solu ons
637
General Journal
Date
Account/Explana on
PR
Debit
Credit
July 31
Interest Expense . . . . . . . . . . . . . . . . . . . . . . .
863.01
Interest Payable . . . . . . . . . . . . . . . . . . . .
863.01
To record accrued interest; 300,000
×
3.5%
× 30/365.
c. August 15, 2019 (July 31
− July 1 = 30 days + August 15 = 45 days)
d. Entry to record the payment of the note on the due date:
General Journal
Date
Account/Explana on
PR
Debit
Credit
Aug. 15
Notes Payable . . . . . . . . . . . . . . . . . . . . . . . . .
300,000.00
Interest Payable . . . . . . . . . . . . . . . . . . . . . . . .
863.01
Interest Expense . . . . . . . . . . . . . . . . . . . . . . .
431.51
Cash . . . . . . . . . . . . . . . . . . . . . . . . . . . . . . .
301,294.52
To record payment of note; 300,000
×
15/365
× 3.5% = 431.51.
EXERCISE 9–4
a. Entry to record the es mated warranty liability for January:
General Journal
Date
Account/Explana on
PR
Debit
Credit
Jan. 23
Warranty Expense . . . . . . . . . . . . . . . . . . . . . .
1,640
Es mated Warranty Liability . . . . . . . . .
1,640
To record es mated warranty liability; 2%
× $82,000 = $1,640.
b. Entry to record the warranty expense incurred in January:
General Journal
Date
Account/Explana on
PR
Debit
Credit
Jan. 29
Es mated Warranty Liability . . . . . . . . . . . .
2,000
Merchandise Inventory . . . . . . . . . . . . . .
2,000
To record replacement of furniture cov-
ered by warranty.
c. $380 (calculated as: $740 + 1,640
− 2,000).
EXERCISE 9–5
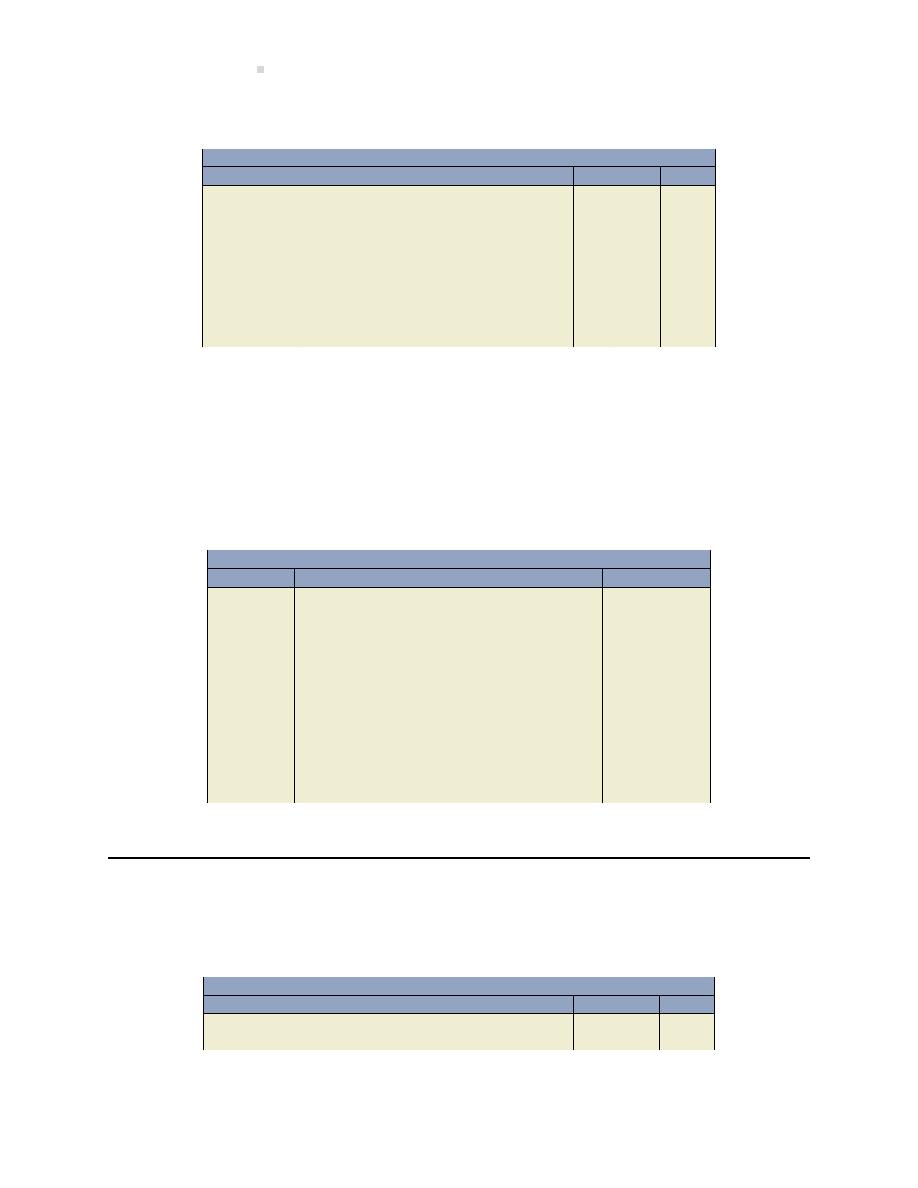
638
Solu ons To Exercises
a.
General Journal
Date
Account/Explana on
PR
Debit
Credit
Dec 31, 2018
Salaries Expense . . . . . . . . . . . . . . . . . . . . . . .
2,000
Employment Insurance Expense . . . . . . . . .
56
Government Pension Expense . . . . . . . . . . .
80
Employee Income Taxes Payable . . . . . .
500
Employment Insurance Payable . . . . . .
96
Government Pension Payable . . . . . . . .
160
Salaries Payable . . . . . . . . . . . . . . . . . . . .
1,380
To record unpaid salary and benefits for J.
Smith at December 31.
Calcula ons:
Employment Insurance Expense: $2,000
× 2% = 40 × 1.4 mes = $56
Government Pension Expense: $2,000
× 4% = $80
Employment Insurance Payable: $40 + 56 = $96
Government Pension Payable: $80 + 80 = $160
b.
General Journal
Date
Account/Explana on
PR
Debit
Credit
Jan 5, 2019
Salaries Payable . . . . . . . . . . . . . . . . . . . . . . . .
1,380
Cash . . . . . . . . . . . . . . . . . . . . . . . . . . . . . . .
1,380
To record payment of Dec 31 salary
payable to J. Smith.
Jan 5, 2019
Employee Income Taxes Payable . . . . . . . . .
500
Employment Insurance Payable . . . . . . . . .
96
Government Pension Payable . . . . . . . . . . .
160
Cash . . . . . . . . . . . . . . . . . . . . . . . . . . . . . . .
756
To record payment of amounts owing at
Dec 31 to Government of Canada for J.
Smith.
EXERCISE 9–6
a.
General Journal
Date
Account/Explana on
PR
Debit
Credit
Feb 15, 2018
Corporate Income Taxes Payable . . . . . . . . .
500
Cash . . . . . . . . . . . . . . . . . . . . . . . . . . . . . . .
500
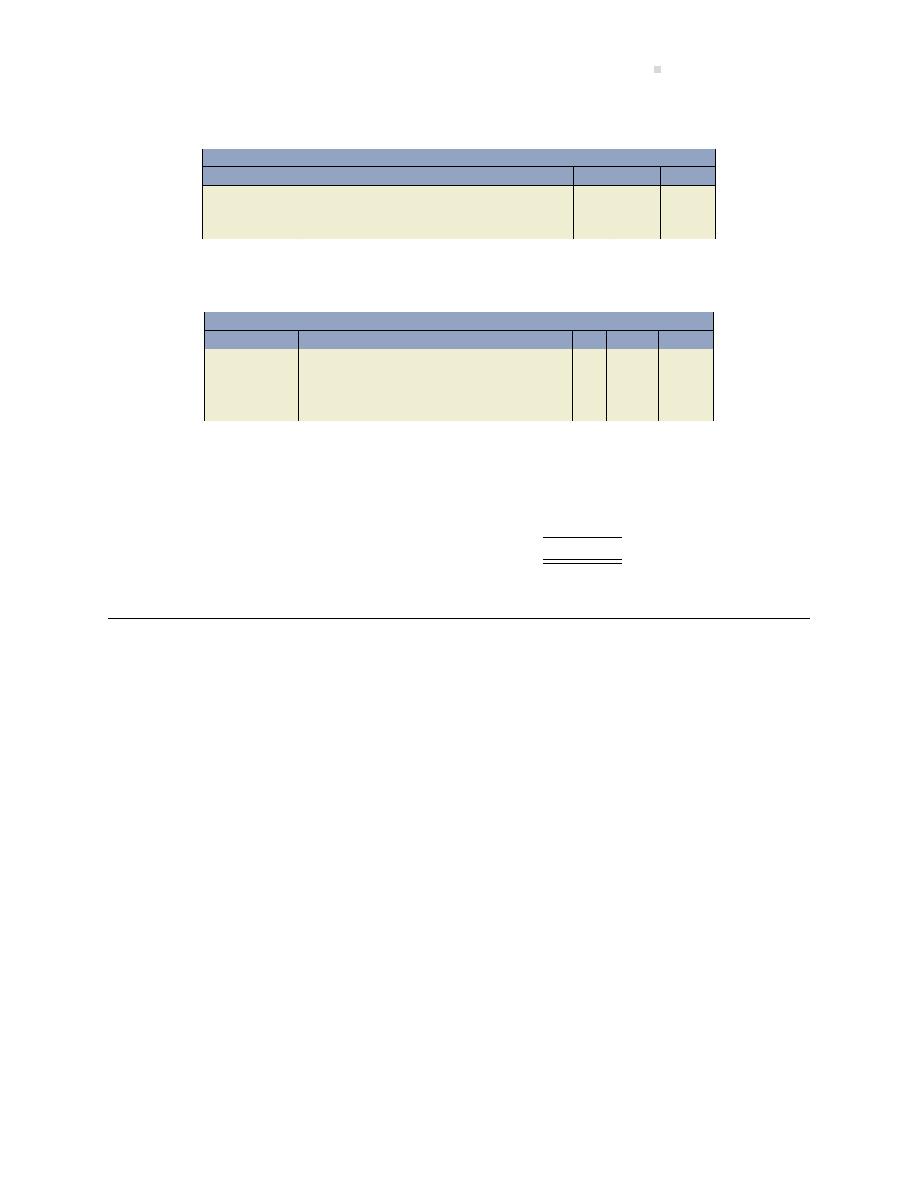
Chapter 9 Solu ons
639
b.
General Journal
Date
Account/Explana on
PR
Debit
Credit
Dec 31, 2018
Corporate Income Taxes Expense . . . . . . . .
6,000
Corporate Income Taxes Payable . . . . .
6,000
($15,000
× 40% = $6,000)
c.
General Journal
Date
Account/Explana on
PR
Debit
Credit
Jan 31, 2019
Corporate Income Taxes Payable . . . . . . . . .
500
Cash . . . . . . . . . . . . . . . . . . . . . . . . . . . . . . .
500
To record payment of 2018 corporate in-
come taxes owing.
Calcula on:
2018 expense
$ 6,000
Instalments paid (11
× $500)
(5,500)
Owing
$
500
EXERCISE 9–7

640
Soluons
To
Ex
er
cises
CASE A
CASE B
CASE C
A. Investors purchase the bonds at par
B. Investors purchase the bonds at a
premium
C. Investors purchase the bonds at a
discount
a.
The corpora on receives $100,000 cash
for the bonds.
The corpora on receives $112,000 cash
for the bonds.
The corpora on receives $88,000 cash
for the bonds.
b.
The corpora on pays $12,000 annual
interest on the $100,000 face value of
the bonds.
The corpora on pays $12,000 annual
interest on the $100,000 face value of
the bonds.
The corpora on pays $12,000 annual
interest on the $100,000 face value of
the bonds.
c.
The following journal entry records the
sale of the bonds.
Cash . . . . . . . . . . . . . . . . . . 100,000
Bonds Payable . . . . . . . . . . . . . . 100,000
The following journal entry records the
sale of the bonds.
Cash . . . . . . . . . . . . . . . . . . 112,000
Premium on Bonds . . . . . . . . . . . 12,000
Bonds Payable . . . . . . . . . . . . . . 100,000
The following journal entry records the
sale of the bonds.
Cash . . . . . . . . . . . . . . . . . . . 88,000
Discount on Bonds . . . . . . 12,000
Bonds Payable . . . . . . . . . . . . . . 100,000
d.
June 30, 2017
The interest payment is recorded as
follows:
Interest Expense . . . . . . . . . . 6,000
Cash . . . . . . . . . . . . . . . . . . . . . . . . . 6,000
June 30, 2017
The interest payment is recorded as
follows:
Interest Expense . . . . . . . . . . 6,000
Cash . . . . . . . . . . . . . . . . . . . . . . . . . 6,000
Amor za on is recorded as follows:
Premium on Bonds . . . . . . . 2,000
Interest Expense . . . . . . . . . . . . . . 2,000
June 30, 2017
The interest payment is recorded as
follows:
Interest Expense . . . . . . . . . . 6,000
Cash . . . . . . . . . . . . . . . . . . . . . . . . . 6,000
Amor za on is recorded as follows:
Interest Expense . . . . . . . . . . 2,000
Discount on Bonds . . . . . . . . . . . . 2,000
December 31, 2017
The interest payment is recorded as
follows:
Interest Expense . . . . . . . . . . 6,000
Cash . . . . . . . . . . . . . . . . . . . . . . . . . 6,000
December 31, 2017
The interest payment is recorded as
follows:
Interest Expense . . . . . . . . . . 6,000
Cash . . . . . . . . . . . . . . . . . . . . . . . . . 6,000
Amor za on is recorded as follows:
Premium on Bonds . . . . . . . 2,000
Interest Expense . . . . . . . . . . . . . . 2,000
December 31, 2017
The interest payment is recorded as
follows:
Interest Expense . . . . . . . . . . 6,000
Cash . . . . . . . . . . . . . . . . . . . . . . . . . 6,000
Amor za on is recorded as follows:
Interest Expense . . . . . . . . . . 2,000
Discount on Bonds . . . . . . . . . . . . 2,000
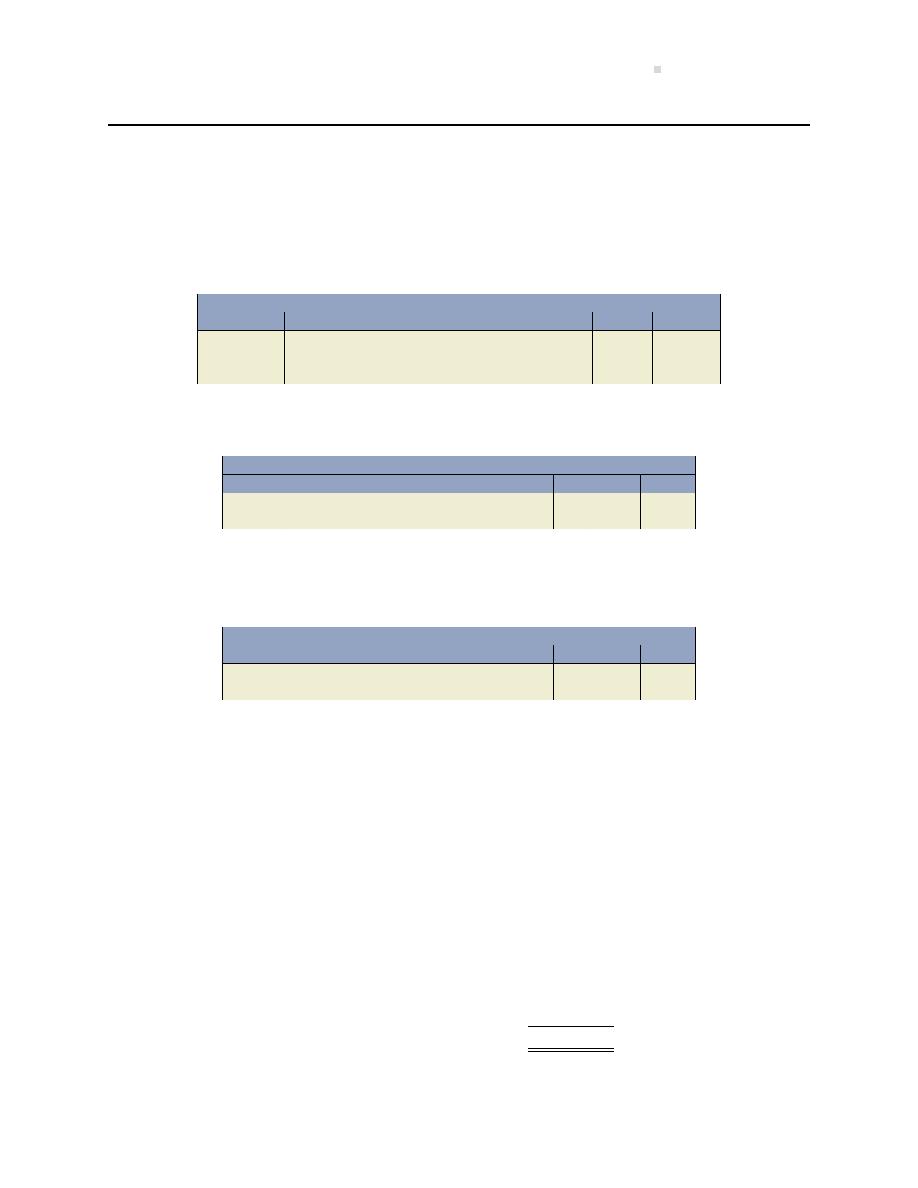
Chapter 9 Solu ons
641
EXERCISE 9–8
a.
i. The issuance of bonds:
Cash = $100,000
× 94% = $94,000
Discount = $100,000
− $94,000 = $6,000
General Journal
Date
Account/Explana on
PR
Debit
Credit
Jan 1, 2017
Cash . . . . . . . . . . . . . . . . . . . . . . . . . . . . . . . . . .
94,000
Discount on Bonds . . . . . . . . . . . . . . . . . . . . .
6,000
Bonds Payable . . . . . . . . . . . . . . . . . . . . . .
100,000
ii. The interest payment:
General Journal
Date
Account/Explana on
PR
Debit
Credit
Jun 30
Interest Expense . . . . . . . . . . . . . . . . . . . . . . .
6,000
Cash . . . . . . . . . . . . . . . . . . . . . . . . . . . . . . .
6,000
iii. The amor za on of the discount:
Discount = $6,000
÷ 3 years × 6 ÷ 12 = $1,000
General Journal
Date
Account/Explana on
PR
Debit
Credit
Jun 30
Interest Expense . . . . . . . . . . . . . . . . . . . . . . .
1,000
Discount on Bonds . . . . . . . . . . . . . . . . . .
1,000
b. Interest paid in cash = $100,000
× 12% = $12,000
Interest expense for 2017 = Interest + amor za on for the year = $12,000 + $2,000 =
$14,000
c.
Nevada Inc.
Balance Sheet
At December 31, 2017
Liabili es
Non-current*
Bonds payable (Note X)
$100,000
Discount on bonds
(4,000)
Carrying amount
$ 96,000
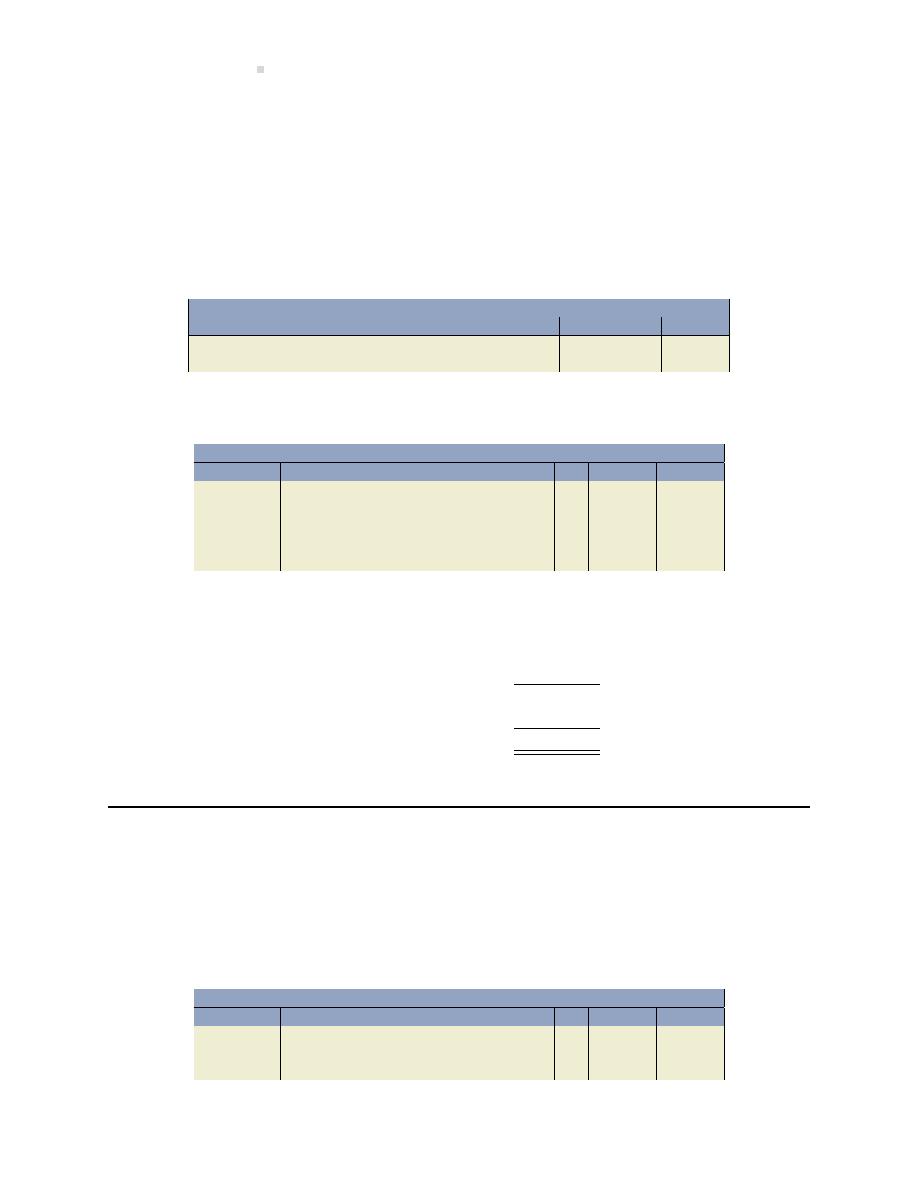
642
Solu ons To Exercises
Note X would disclose per nent informa on of the bond indenture including details of the
face value and unamor zed bond discount. Just the carrying amount is shown on the bal-
ance sheet.
* If it was likely that the bonds would be called on January 1, 2018, they would be classified
as current liabili es. If so, details of the redemp on should be disclosed in a note to the
December 31, 2017 financial statements.
d. Re rement of the bonds:
General Journal
Date
Account/Explana on
PR
Debit
Credit
Dec 31, 2019
Bonds Payable . . . . . . . . . . . . . . . . . . . . . . . . .
100,000
Cash . . . . . . . . . . . . . . . . . . . . . . . . . . . . . . .
100,000
e. Calling of the bonds:
General Journal
Date
Account/Explana on
PR
Debit
Credit
Jan 1, 2019
Bonds Payable . . . . . . . . . . . . . . . . . . . . . . . . .
100,000
Loss on Bond Re rement . . . . . . . . . . . . . . .
6,000
Discount on Bonds . . . . . . . . . . . . . . . . . .
4,000
Cash . . . . . . . . . . . . . . . . . . . . . . . . . . . . . . .
102,000
To record re rement of bonds.
Calcula on for bonds at 102:
Face value
$100,000
Unamor zed discount
(4,000)
Carrying amount
96,000
Cash paid
102,000
Loss on re rement
$ (6,000)
EXERCISE 9–9
a. Prepare the journal entries to record the following transac ons:
i. The issuance of the bonds:
Cash = $200,000
× 112% = $224,000
General Journal
Date
Account/Explana on
PR
Debit
Credit
Jan 1, 2019
Cash . . . . . . . . . . . . . . . . . . . . . . . . . . . . . . . . . .
224,000
Premium on Bonds. . . . . . . . . . . . . . . . . .
24,000
Bonds Payable . . . . . . . . . . . . . . . . . . . . . .
200,000
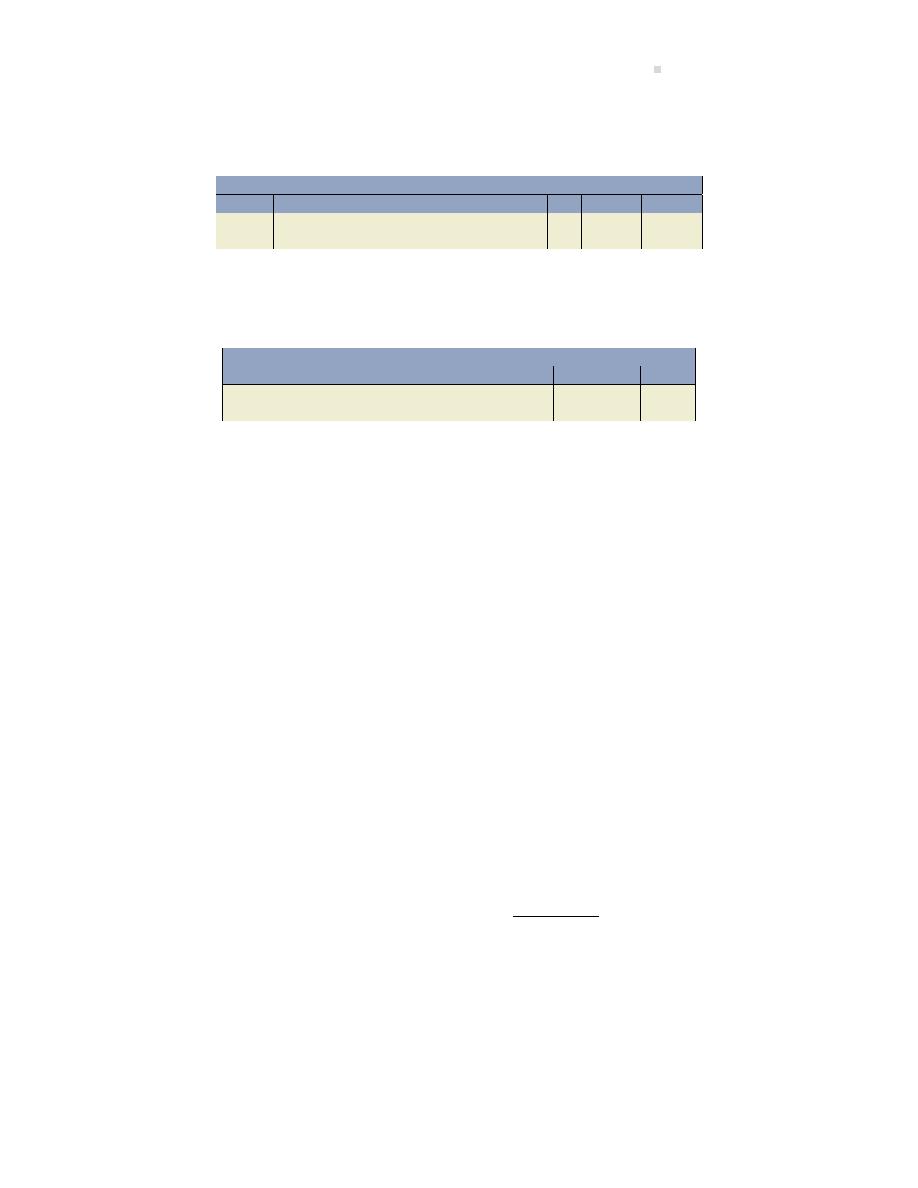
Chapter 9 Solu ons
643
ii. The interest payment:
Interest = $200,000
× 12% × 6 ÷ 12 = $12,000
General Journal
Date
Account/Explana on
PR
Debit
Credit
Jun 30
Interest Expense . . . . . . . . . . . . . . . . . . . . . . .
12,000
Cash . . . . . . . . . . . . . . . . . . . . . . . . . . . . . . .
12,000
iii. The amor za on of the premium:
Premium = ($24,000
÷ 3 years) × 6 ÷ 12 = $4,000
General Journal
Date
Account/Explana on
PR
Debit
Credit
Jun 30
Premium on Bonds . . . . . . . . . . . . . . . . . . . . .
4,000
Interest Expense . . . . . . . . . . . . . . . . . . . .
4,000
b. Interest paid in cash = $200,000
× 12% = $24,000
Interest expense for 2019 = Interest
− amor za on for the year
=
$24,000
− ($24,000 ÷ 3 years)
=
$24,000
− $8,000
=
$16,000
These amounts are different because the amor za on of the premium, which reduces In-
terest Expense, does not require cash.
c.
Sydney Corp.
Balance Sheet
At December 31, 2019
Liabili es
Non-current
Bonds payable
$200,000
Premium on bonds
16,000
Carrying amount
$216,000
d. Calling of the bonds:
Cash paid = $200,000
× 106% = $212,000
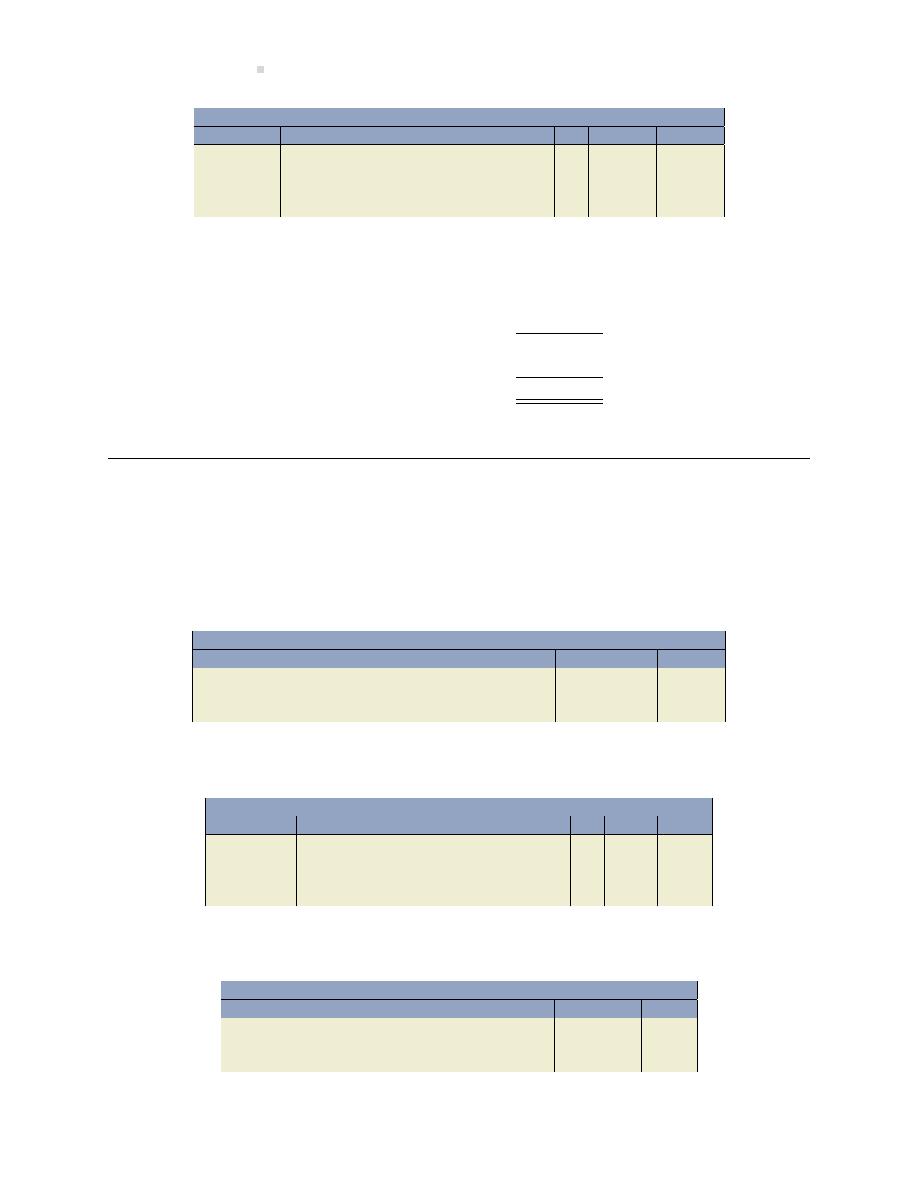
644
Solu ons To Exercises
General Journal
Date
Account/Explana on
PR
Debit
Credit
Jan 1, 2022
Bonds Payable . . . . . . . . . . . . . . . . . . . . . . . . .
200,000
Premium on Bonds . . . . . . . . . . . . . . . . . . . . .
8,000
Loss on Bond Re rement . . . . . . . . . . . . . . .
4,000
Cash . . . . . . . . . . . . . . . . . . . . . . . . . . . . . . .
212,000
To record re rement of bonds at 106 as follows:
Face value
$200,000
Unamor zed premium
(8,000)
Carrying amount
208,000
Cash paid
212,000
Loss on re rement
$ (4,000)
EXERCISE 9–10
a. The issuance of bonds:
Interest paid from last interest payment date ($100,000
× 8% × 4 ÷ 12 May 1 to Sep 1) =
$2,667 (rounded)
General Journal
Date
Account/Explana on
PR
Debit
Credit
Sep 1, 2017
Cash . . . . . . . . . . . . . . . . . . . . . . . . . . . . . . . . . .
102,667
Interest payable . . . . . . . . . . . . . . . . . . . .
2,667
Bonds payable . . . . . . . . . . . . . . . . . . . . . .
100,000
b. The interest payment for 2018:
General Journal
Date
Account/Explana on
PR
Debit
Credit
Nov 1, 2018
Interest expense . . . . . . . . . . . . . . . . . . . . . . .
1,333
Interest payable . . . . . . . . . . . . . . . . . . . . . . .
2,667
Cash* . . . . . . . . . . . . . . . . . . . . . . . . . . . . . .
4,000
* ($100,000
× 8% × 6 ÷ 12)
Accrued interest at December 31, 2018:
General Journal
Date
Account/Explana on
PR
Debit
Credit
Dec 31
Interest expense . . . . . . . . . . . . . . . . . . . . . . .
1,333
Interest payable . . . . . . . . . . . . . . . . . . . .
1,333
($100,000
× 8% × 2 ÷ 12)
Chapter 9 Solu ons
645
c. Bond at Maturity:
General Journal
Date
Account/Explana on
PR
Debit
Credit
Sep 1, 2027
Bonds Payable . . . . . . . . . . . . . . . . . . . . . . . . .
100,000
Cash . . . . . . . . . . . . . . . . . . . . . . . . . . . . . . .
100,000
d.
Harvort Inc.
Balance Sheet
At December 31, 2018
Liabili es
Current
Interest payable
$
1,333
Non-current*
Bonds payable (Note X)
$100,000
Note X would disclose per nent informa on of the bond indenture including details of the
face value and unamor zed bond premium or discount if any. Just the carrying amount is
shown on the balance sheet.
EXERCISE 9–11
a. Prepare the journal entries to record the following transac ons:
i.
General Journal
Date
Account/Explana on
PR
Debit
Credit
Jan 1, 2021
Cash . . . . . . . . . . . . . . . . . . . . . . . . . . . . . . . . . .
50,000
Loan Payable . . . . . . . . . . . . . . . . . . . . . . .
50,000
To record loan from Second Capital Bank.
ii.
General Journal
Date
Account/Explana on
PR
Debit
Credit
Jan 1
Equipment . . . . . . . . . . . . . . . . . . . . . . . . . . . .
48,000
Cash . . . . . . . . . . . . . . . . . . . . . . . . . . . . . . .
48,000
To record the purchase of equipment.
646
Solu ons To Exercises
b.
Rosedale Corp.
Loan Repayment Schedule
A
B
C
D
E
(D
− B)
(A
− C)
Year
Beginning
(A
× 6%) Reduc on
Total
Ending
ended
loan
Interest
of loan
loan
loan
Dec 31
balance
expense
payable
payment
balance
2021
$50,000
$3,000
$15,705
$18,705
$34,295
2022
34,295
2,058
16,647
18,705
17,648
2023
17,648
1,057
17,648
18,705
-0-
c.
General Journal
Date
Account/Explana on
PR
Debit
Credit
Dec 31, 2021
Interest Expense . . . . . . . . . . . . . . . . . . . . . . .
3,000
Loan Payable . . . . . . . . . . . . . . . . . . . . . . . . . .
15,705
Cash . . . . . . . . . . . . . . . . . . . . . . . . . . . . . . .
18,705
To record loan payment to Second Capital
Bank.
d.
Rosedale Corp.
Balance Sheet
At December 31, 2021
Liabili es
Current liabili es
Loan payable, current por on*
$16,647
Long-term liabili es
Loan payable, 6%, instalments
payable over three years**
17,648
* Current por on is the principal amount of the liability owing for one year a er the report-
ing date. Refer to the loan schedule above.
** ($34,295
− 16,647 current por on)
EXERCISE 9–12
a. discount
Chapter 9 Solu ons
647
b. premium
c. discount
d. premium
e. premium
f. discount
EXERCISE 9–13
Cash = $100,000
× 94% = $94,000
Discount = $100,000
− $94,000 = $6,000
General Journal
Date
Account/Explana on
PR
Debit
Credit
Jan. 1
Cash . . . . . . . . . . . . . . . . . . . . . . . . . . . . . . . . . .
94,000
Discount on Bonds . . . . . . . . . . . . . . . . . . . . .
6,000
Bonds Payable . . . . . . . . . . . . . . . . . . . . . .
100,000
EXERCISE 9–14
Cash = $200,000
× 112% = $224,000
Premium = $224,000
− $200,000 = $24,000
General Journal
Date
Account/Explana on
PR
Debit
Credit
Jan. 1
Cash . . . . . . . . . . . . . . . . . . . . . . . . . . . . . . . . . .
224,000
Premium on Bonds. . . . . . . . . . . . . . . . . .
24,000
Bonds Payable . . . . . . . . . . . . . . . . . . . . . .
200,000
EXERCISE 9–15
a.
(a) Entry to record receipt of loan proceeds from the bank:
General Journal
Date
Account/Explana on
PR
Debit
Credit
Jan. 1
Cash . . . . . . . . . . . . . . . . . . . . . . . . . . . . . . . . . .
50,000
Loan Payable . . . . . . . . . . . . . . . . . . . . . . .
50,000
To record loan from Second Capital Bank.
648
Solu ons To Exercises
(b) Entry to record purchase of the equipment:
General Journal
Date
Account/Explana on
PR
Debit
Credit
Jan. 1
Equipment . . . . . . . . . . . . . . . . . . . . . . . . . . . .
48,000
Cash . . . . . . . . . . . . . . . . . . . . . . . . . . . . . . .
48,000
To record the purchase of the equipment.
b. The loan repayment schedule is as follows:
Rosedale Corp.
Loan Repayment Schedule
A
B
C
D
E
(D
− B)
(A
− C)
Year
Beginning
(A
× 6%)
Reduc on
Total
Ending
Ended
Loan
Interest
of Loan
Loan
Loan
Dec. 31
Balance
Expense
Payable
Payment
Balance
2014
$50,000
$3,000
$15,705
$18,705
$34,295
2015
34,295
2,058
16,647
18,705
17,648
2016
17,648
1,057*
17,648
18,705
-0-
$50,000
* Adjusted for rounding
c. Entry to record the first loan payment:
General Journal
Date
Account/Explana on
PR
Debit
Credit
Dec. 31
Interest Expense . . . . . . . . . . . . . . . . . . . . . . .
3,000
Loan Payable . . . . . . . . . . . . . . . . . . . . . . . . . .
15,705
Cash . . . . . . . . . . . . . . . . . . . . . . . . . . . . . . .
18,705
To record loan payment to Second Capital
Bank.
Chapter 10 Solu ons
EXERCISE 10–1
a. The completed schedule is as follows:
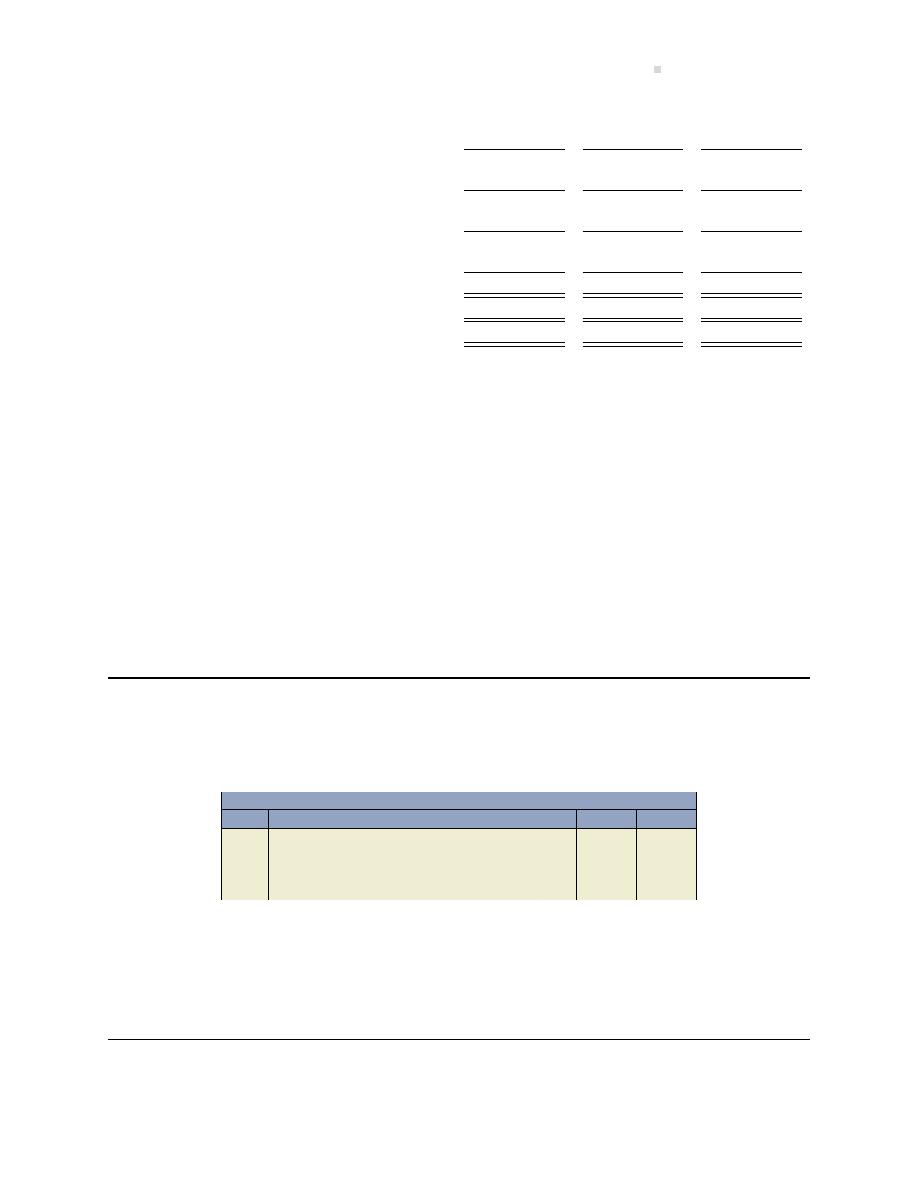
Chapter 10 Solu ons
649
12%
Preferred
Common
Bonds
Shares
Shares
Income before interest and income taxes
$12,000,000
$12,000,000
$12,000,000
Less: Interest expense
4,800,000
1
-0-
-0-
Income before taxes
7,200,000
12,000,000
12,000,000
Less: Income taxes at 50%
3,600,000
6,000,000
6,000,000
Net income
3,600,000
6,000,000
6,000,000
Less: Preferred dividends
-0-
4,000,000
2
-0-
Net income available to common shareholders (a)
$3,600,000
$2,000,000
$6,000,000
Number of common shares outstanding (b)
200,000
200,000
400,000
Earnings per common share (a/b)
$18
$10
$15
1
$40,000,000
× 12% = $4,800,000
2
400,000
× $10 = $4,000,000
b. Issuing bonds is the financing op on that is most advantageous to the common sharehold-
ers, all other factors being considered equal. It results in higher earnings per common share.
A second advantage of issuing bonds is that it does not disrupt current shareholder control.
The op on to issue more shares would distribute control over a larger number of sharehold-
ers causing the control held by the present shareholders to be diluted. A third advantage
of issuing bonds is that interest expense is deduc ble for tax purposes, while dividends are
paid out of a er-tax dollars. One disadvantage of issuing bonds, which may make one of the
other op ons more advantageous, is that interest expense is fixed. Issuing bonds increases
interest expense and the company must earn enough income to cover the interest expense
in any given year.
EXERCISE 10–2
a. Entry to record the transac on:
General Journal
Date
Account/Explana on
PR
Debit
Credit
Land . . . . . . . . . . . . . . . . . . . . . . . . . . . . . . . . . .
50,000
Preferred Shares . . . . . . . . . . . . . . . . . . . .
50,000
To record the purchase of a tract of land
in exchange for preferred shares.
b. The credit part of the transac on would be classified on the balance sheet in the equity
sec on as part of share capital. The debit part of the transac on would be recorded as an
asset in the property, plant, and equipment sec on.
EXERCISE 10–3
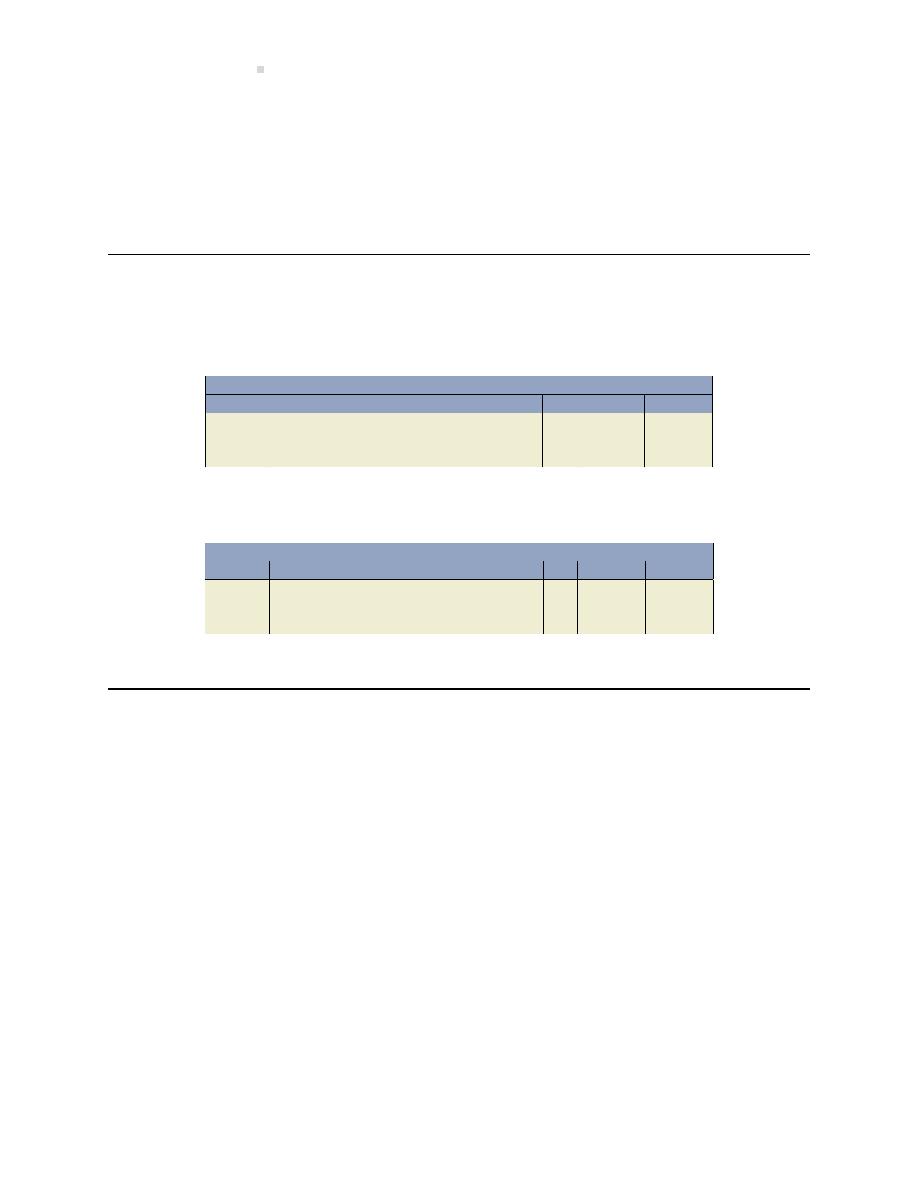
650
Solu ons To Exercises
a. The average price received for each issued preferred share is $54 ($3,456/64).
b. The average price received for each issued common share is $2.10 ($1,680/800).
c. The total contributed capital is $5,136 ($3,456 + 1,680).
EXERCISE 10–4
a. Entry to record the declara on of the dividend:
General Journal
Date
Account/Explana on
PR
Debit
Credit
May 25
Dividends Declared. . . . . . . . . . . . . . . . . . . . .
100,000
Dividends Payable . . . . . . . . . . . . . . . . . .
100,000
To record the declara on of the dividend.
b. Entry to record the payment of the dividend:
General Journal
Date
Account/Explana on
PR
Debit
Credit
June 26
Dividends Payable . . . . . . . . . . . . . . . . . . . . . .
100,000
Cash . . . . . . . . . . . . . . . . . . . . . . . . . . . . . . .
100,000
To record the payment of the dividend.
EXERCISE 10–5
a. Since the preferred shareholders have cumula ve shares, they must receive all dividends in
arrears and the current dividend before the common shareholders receive any dividends.
Dividends received by preferred shareholders (1,000 shares
× $5/share = $5,000/year div-
idend en tlement):
=
Dividends in arrears for one year + Dividends for current year
=
$5,000 + 5,000 = $10,000
Common shareholders receive the balance, or $4,000 ($14,000
− $10,000).
b. Preferred shareholders receive dividends before the common shareholders. Since the pre-
ferred shareholders are not cumula ve shares, they receive only the current dividend or
$5,000.
Common shareholders receive the balance, or $9,000 ($14,000
− $5,000).
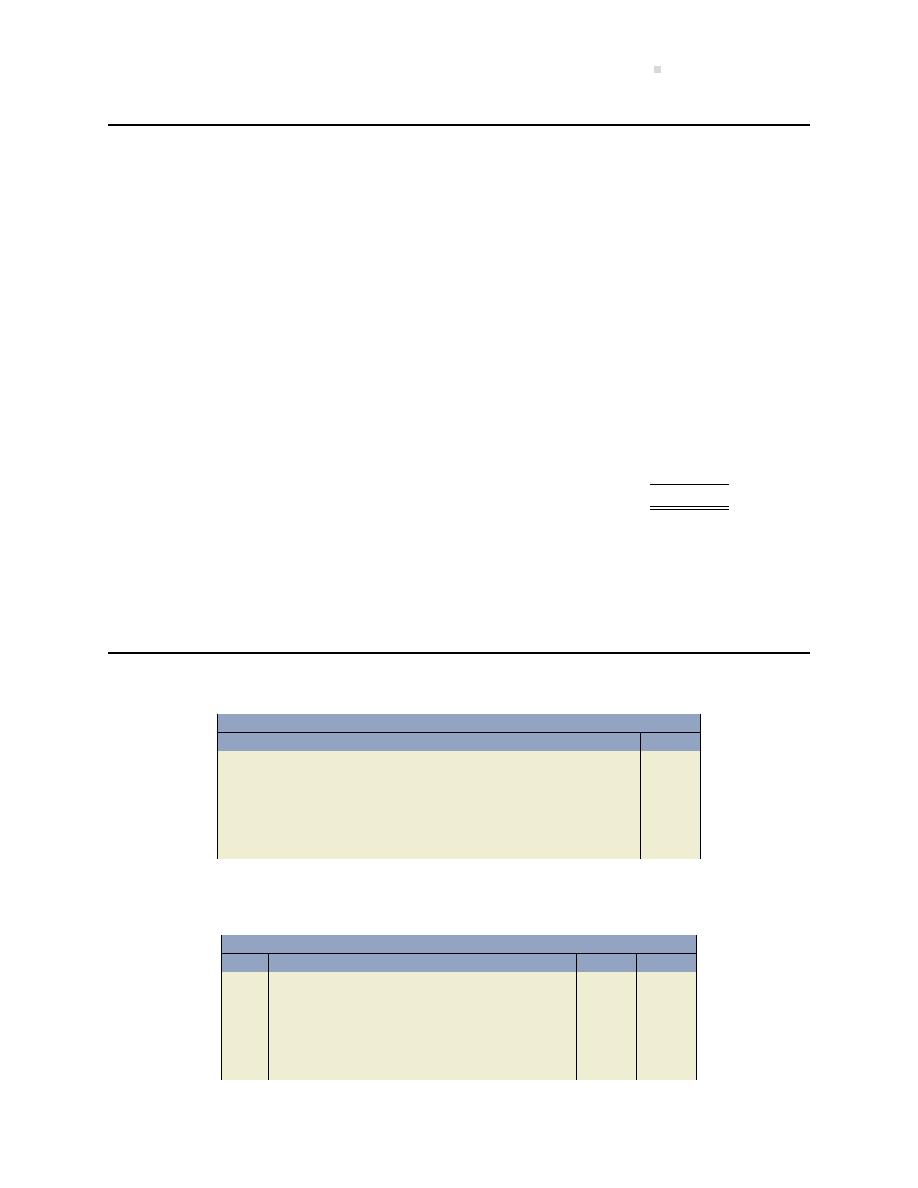
Chapter 10 Solu ons
651
EXERCISE 10–6
a. The $15,000 of dividends in arrears at December 31, 2019 does not appear as a liability.
Although the dividends pertain to cumula ve shares, no liability exists un l the board of
directors declares a dividend. However, disclosure of dividends in arrears would be made in
a note to the financial statements.
b. The company may have sufficient retained earnings but may not have sufficient cash to pay
the dividends, taking into considera on other needs of the company.
c. The amount available for dividends to the common shareholders is calculated as follows:
Amount available for all dividends (1/2
× $35,000)
$17,500
Priority given to cumula ve preferred shareholders
Arrears to December, 2019
(15,000)
Preferred dividends for 2020
(5,000)
Deficiency
$(2,500)
The $2,500 deficiency in 2020 preferred dividends has to be paid in the future before any
dividends are paid to common shareholders. There will be no dividends available for com-
mon shareholders at December 31, 2020 based on the projec ons.
EXERCISE 10–7
General Journal
Date
Account/Explana on
PR
Debit
Credit
Apr. 1
Share Dividend Declared . . . . . . . . . . . . . . . .
15,000
Common Share Dividend To Be Dis-
tributed . . . . . . . . . . . . . . . . . . . . . . . . . . . . . . .
15,000
To record the declara on of the share div-
idend. (10,000 shares
× 10% = 1,000
shares
× $15)
OR
General Journal
Date
Account/Explana on
PR
Debit
Credit
Retained Earnings . . . . . . . . . . . . . . . . . . . . . .
15,000
Common Share Dividend To Be Dis-
tributed . . . . . . . . . . . . . . . . . . . . . . . . . . . . . . .
15,000
To record the declara on of the share div-
idend. (10,000 shares
× 10% = 1,000
shares
× $15)
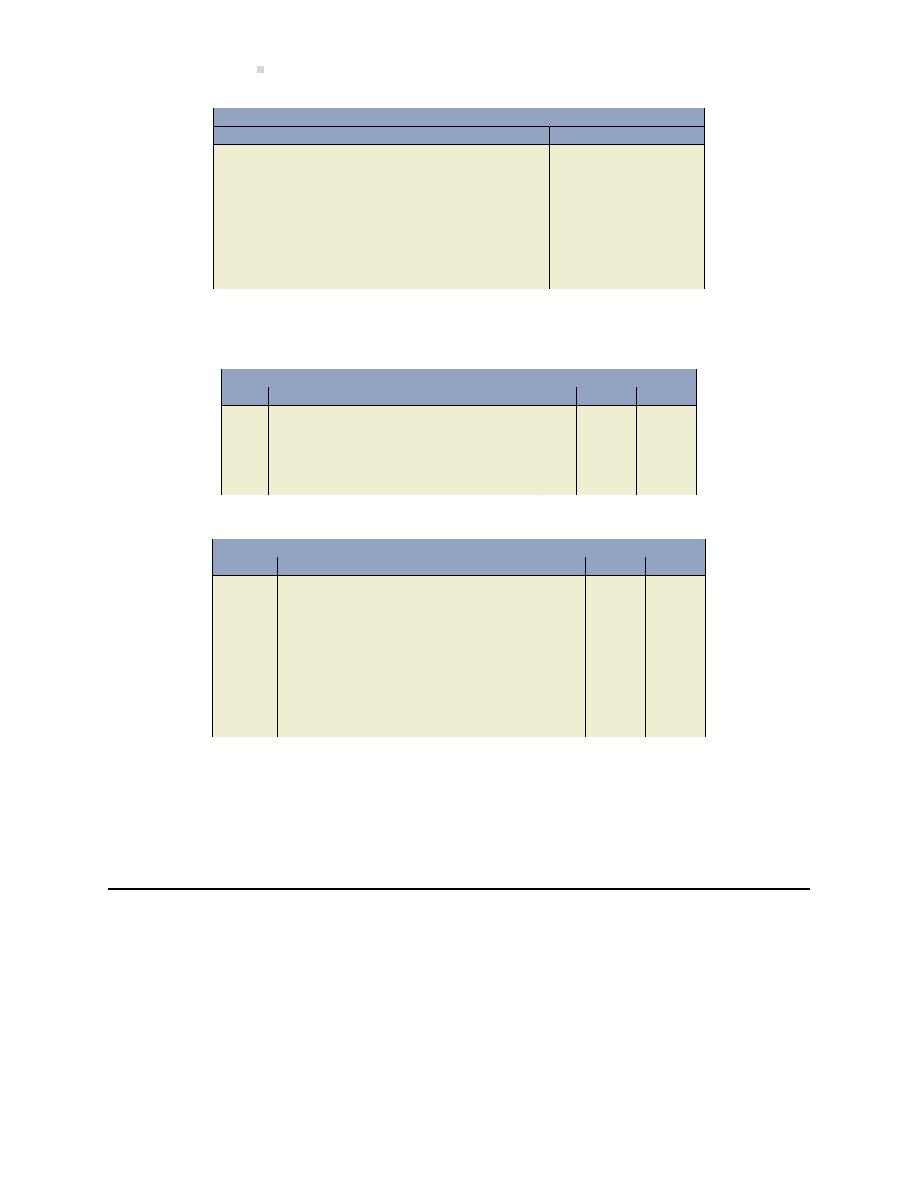
652
Solu ons To Exercises
General Journal
Date
Account/Explana on
PR
Debit
Credit
Apr. 15
Common Share Dividend To Be Distributed
15,000
Common Shares . . . . . . . . . . . . . . . . . . . .
15,000
To record the distribu on of the dividend.
Jun. 1
Cash Dividends Declared . . . . . . . . . . . . . . . .
22,000
Dividends Payable . . . . . . . . . . . . . . . . . .
22,000
To record the declara on of the cash div-
idend. [(10,000 shares + 1,000 shares)
×
$2]
OR
General Journal
Date
Account/Explana on
PR
Debit
Credit
Retained Earnings . . . . . . . . . . . . . . . . . . . . . .
22,000
Dividends Payable . . . . . . . . . . . . . . . . . .
22,000
To record the declara on of the cash div-
idend. [(10,000 shares + 1,000 shares)
×
$2]
General Journal
Date
Account/Explana on
PR
Debit
Credit
Jun. 30
Dividends Payable . . . . . . . . . . . . . . . . . . . . . .
22,000
Cash . . . . . . . . . . . . . . . . . . . . . . . . . . . . . . .
22,000
To record payment of the cash dividend.
Dec. 31
Retained Earnings . . . . . . . . . . . . . . . . . . . . . .
37,000
Share Dividend Declared . . . . . . . . . . . .
15,000
Cash Dividend Declared . . . . . . . . . . . . .
22,000
To close the Dividends Declared general
ledger account to the Retained Earnings
account.
OR
If Retained Earnings was debited on April 1 (instead of Share Dividends Declared) and June 1 (in-
stead of Cash Dividends Declared), then no closing entry is required on December 31.
EXERCISE 10–8
a.
i. Book value per preferred share = ($300 + 30)/300 shares = $1.10 per share
ii. Book value per common share = ($992
− 330)/20 shares = $33.10 per share
b. Book value per common share a er split = $662/40 shares = $16.55 per share
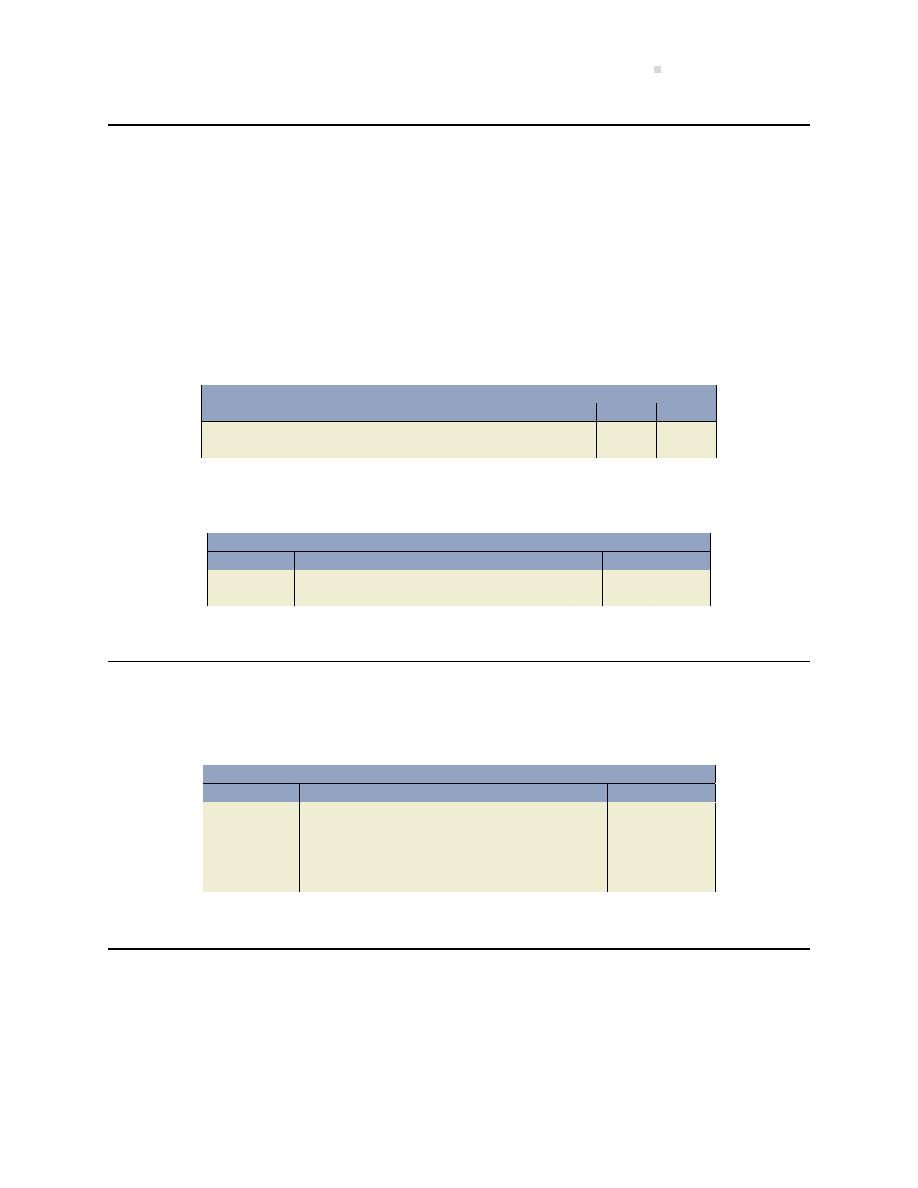
Chapter 10 Solu ons
653
EXERCISE 10–9
a. No journal entry.
Authoriza on of share issue:
Memorandum
The company is authorized under the [name of legisla on] to issue an unlimited number of
common shares and 10,000, 4% preferred shares.
b. Issue of 10,000 common shares:
General Journal
Date
Account/Explana on
PR
Debit
Credit
Jan 2, 2018
Intangible Assets . . . . . . . . . . . . . . . . . . . . . . .
10,000
Common Shares . . . . . . . . . . . . . . . . . . . .
10,000
c. Issue of 1,000 preferred shares:
General Journal
Date
Account/Explana on
PR
Debit
Credit
Jan 2, 2018
Cash . . . . . . . . . . . . . . . . . . . . . . . . . . . . . . . . . .
3,000
Preferred Shares . . . . . . . . . . . . . . . . . . . .
3,000
EXERCISE 10–10
Common share dividend to be issued = (5,000 shares
× 10%) × $10 = $5,000
General Journal
Date
Account/Explana on
PR
Debit
Credit
Jan 15, 2018
Retained Earnings . . . . . . . . . . . . . . . . . . . . . .
5,000
Common Share Dividend to be Issued .
5,000
Feb 15, 2018
Common Share Dividend to be Issued . . . .
5,000
Common Shares . . . . . . . . . . . . . . . . . . . .
5,000
EXERCISE 10–11
a.

654
Solu ons To Exercises
General Journal
Date
Account/Explana on
PR
Debit
Credit
Jan 5, 2018
Cash . . . . . . . . . . . . . . . . . . . . . . . . . . . . . . . . . .
150
Common Shares . . . . . . . . . . . . . . . . . . . .
150
To record issue of 10 common shares for
cash.
Jan 12
Land . . . . . . . . . . . . . . . . . . . . . . . . . . . . . . . . . .
50
Buildings . . . . . . . . . . . . . . . . . . . . . . . . . . . . . .
100
Machinery . . . . . . . . . . . . . . . . . . . . . . . . . . . .
100
Common Shares . . . . . . . . . . . . . . . . . . . .
250
To record issue of 50 common shares in
exchange for assets.
Feb 28
Share Dividend Declared . . . . . . . . . . . . . . . .
42
Common Share Dividend to be Issued .
42
To record the share dividend: [(10+50)
×
10% = 6 shares
× $7] (An entry to record
net income to date could be made, but is
not necessary.)
Mar 15
Common Share Dividend to be Issued . . . .
42
Common Shares . . . . . . . . . . . . . . . . . . . .
42
To record issue of dividend on common
shares.
Dec 31
Income Summary . . . . . . . . . . . . . . . . . . . . . .
200
Retained Earnings . . . . . . . . . . . . . . . . . . .
200
To close the income summary account.
Dec 31
Cash Dividend Declared. . . . . . . . . . . . . . . . .
66
Dividends Payable . . . . . . . . . . . . . . . . . .
66
To record the cash dividend declared:
[(10 + 50 + 6)
× $1]
Dec 31
Retained Earnings . . . . . . . . . . . . . . . . . . . . . .
108
Share Dividend Declared . . . . . . . . . . . .
42
Cash Dividend Declared . . . . . . . . . . . . .
66
To close 2018 dividends to retained earn-
ings.
b.
i.

Chapter 10 Solu ons
655
Blitz Power Tongs Inc.
Par al Statement of Financial Posi on
At January 31, 2018
Shareholders’ Equity
Common shares, stated value $6.67 per share
Authorized–unlimited shares
Issued and outstanding–60 shares
$400
ii.
Blitz Power Tongs Inc.
Par al Statement of Financial Posi on
At February 28, 2018
Shareholders’ Equity
Common shares, stated value $6.70 per share
Authorized—unlimited shares
Issued and outstanding – 60 shares
$400
Common share dividend to be issued – 6 shares
42
$442
Retained earnings*
18
Total shareholders’ equity
$460
* ($60 net income
− 42 dividends declared)
Blitz Power Tongs Inc.
Par al Statement of Financial Posi on
At December 31, 2018
Shareholders’ Equity
Common shares, stated value $7.37 per share
Authorized – unlimited shares
Issued and outstanding – 60 shares
$442
Retained earnings*
92
Total shareholders’ equity
$534
iii. * ($200 net income
− 66 dividends declared − 42 dividends declared)

656
Solu ons To Exercises
EXERCISE 10–12
a.
10%
Preferred
Common
bonds
shares
shares
Income before interest and income taxes
$750,000
$750,000
$750,000
Less: Interest expense
150,000 *
-0-
-0-
Income before income taxes
900,000
750,000
750,000
Less: Income taxes at 30%
270,000
225,000
225,000
630,000
525,000
525,000
Less: Preferred dividends
-0-
160,000
**
-0-
Net Available to common shareholders
$630,000
$365,000
$250,000
Number of common shares outstanding
20,000
20,000
50,000
Earnings per common share
$
31.50
$
18.25
$
5.00
* $1,500,000 x 10% = $150,000
** 15,000 x $10 = $160,000
b. From a common shareholders perspec ve, issuing bonds is the best op on, since it max-
imizes net income (net income is available as poten al dividends) and their earnings per
share ra o.
EXERCISE 10–13
a.
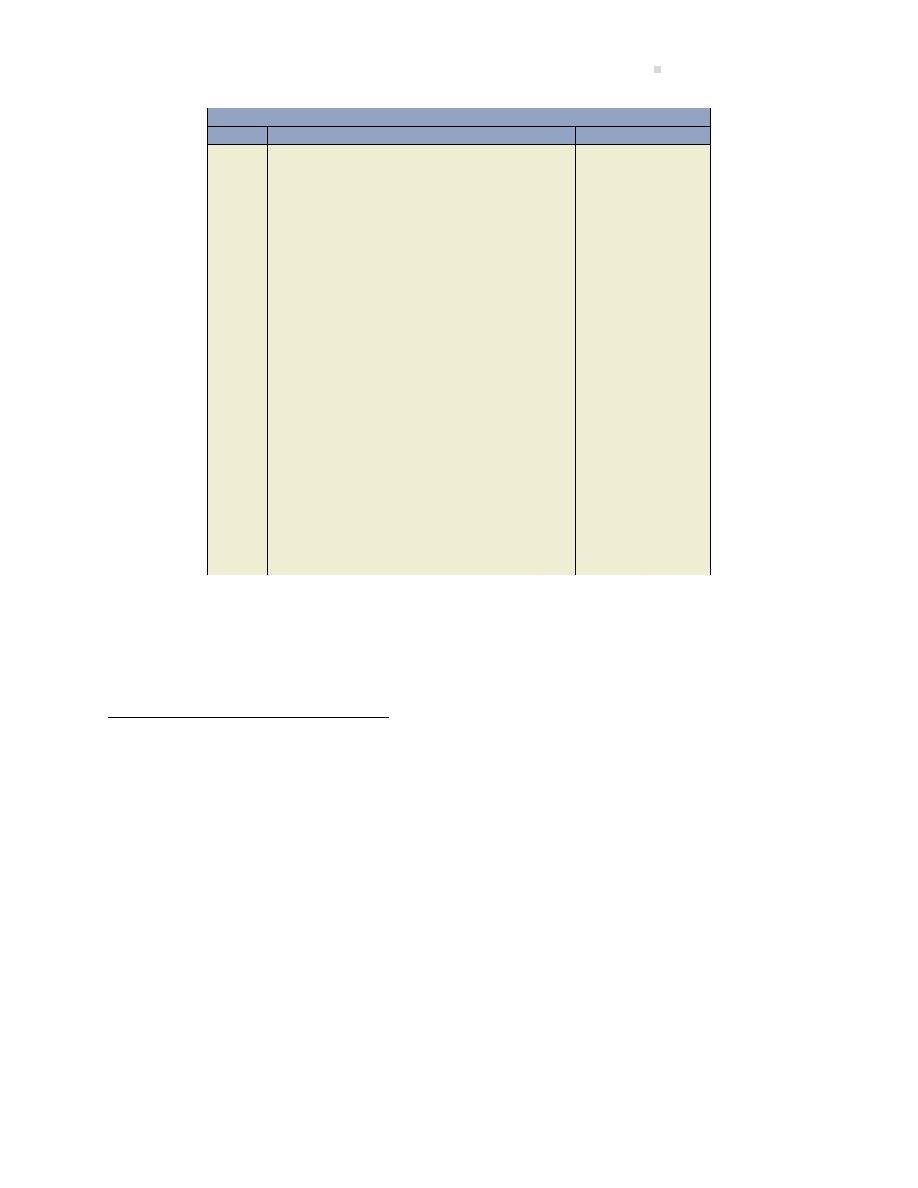
Chapter 10 Solu ons
657
General Journal
Date
Account/Explana on
PR
Debit
Credit
Feb 20
Cash Dividends Declared . . . . . . . . . . . . . . . .
50,000
Dividends Payable – Preferred Shares .
50,000
(100,000
× $0.50)
Mar 1
Dividends Payable – Preferred Shares . . . .
50,000
Cash . . . . . . . . . . . . . . . . . . . . . . . . . . . . . . .
50,000
Apr 15
Cash Dividends Declared . . . . . . . . . . . . . . . .
750,000
Dividends Payable – Common Shares .
750,000
(1,250,000
× $0.60)
Jun 10
Dividends Payable – Common Shares . . . .
750,000
Cash . . . . . . . . . . . . . . . . . . . . . . . . . . . . . . .
750,000
Aug 1
Cash . . . . . . . . . . . . . . . . . . . . . . . . . . . . . . . . . .
250,000
Common Shares . . . . . . . . . . . . . . . . . . . .
250,000
Dec 31
Cash Dividends – preferred shares
. . . . . .
50,000
Cash dividends – common shares . . . . . . . .
375,000
Cash . . . . . . . . . . . . . . . . . . . . . . . . . . . . . . .
425,000
($425,000
−
$50,000 preferred dividends*) = $375,000
to common shareholders
* Remaining cumula ve dividends on preferred shares not yet declared for the current fis-
cal year; 100,000 shares
× ($1.00 − $.50 declared Feb 20) = $50,000 to be allocated to
preferred class before any alloca on to common shareholders.
b.
1
No preferred share dividends were declared on Dec. 15, but these are cumula ve and only 50% was paid in the
current fiscal year.

658
Solu ons To Exercises
Belfast Steel Ltd.
Statement of Changes in Equity
For the Year Ended December 31, 2019
(’000s)
Common
Preferred
Retained
Total
shares
shares
Earnings
equity
Balance at Jan 1, 2019
$ 25,000
$
1,000 $
4,000 $ 30,000
Common shares Issued
250
250
Net income
500
500
Dividends
Preferred
(100)*
(100)
Common
(1,125)**
(1,125)
Balance at Dec 31, 2019
$ 25,250
$
1,000 $
3,275
$ 29,525
* Feb 20 dividends
$
50,000
Dec 31 cumula ve dividends allocated
50,000
Total
$ 100,000
** Apr 15 dividends
$ 750,000
Dec 31 dividends
375,000
Total
$1,125,000
EXERCISE 10–14
a.
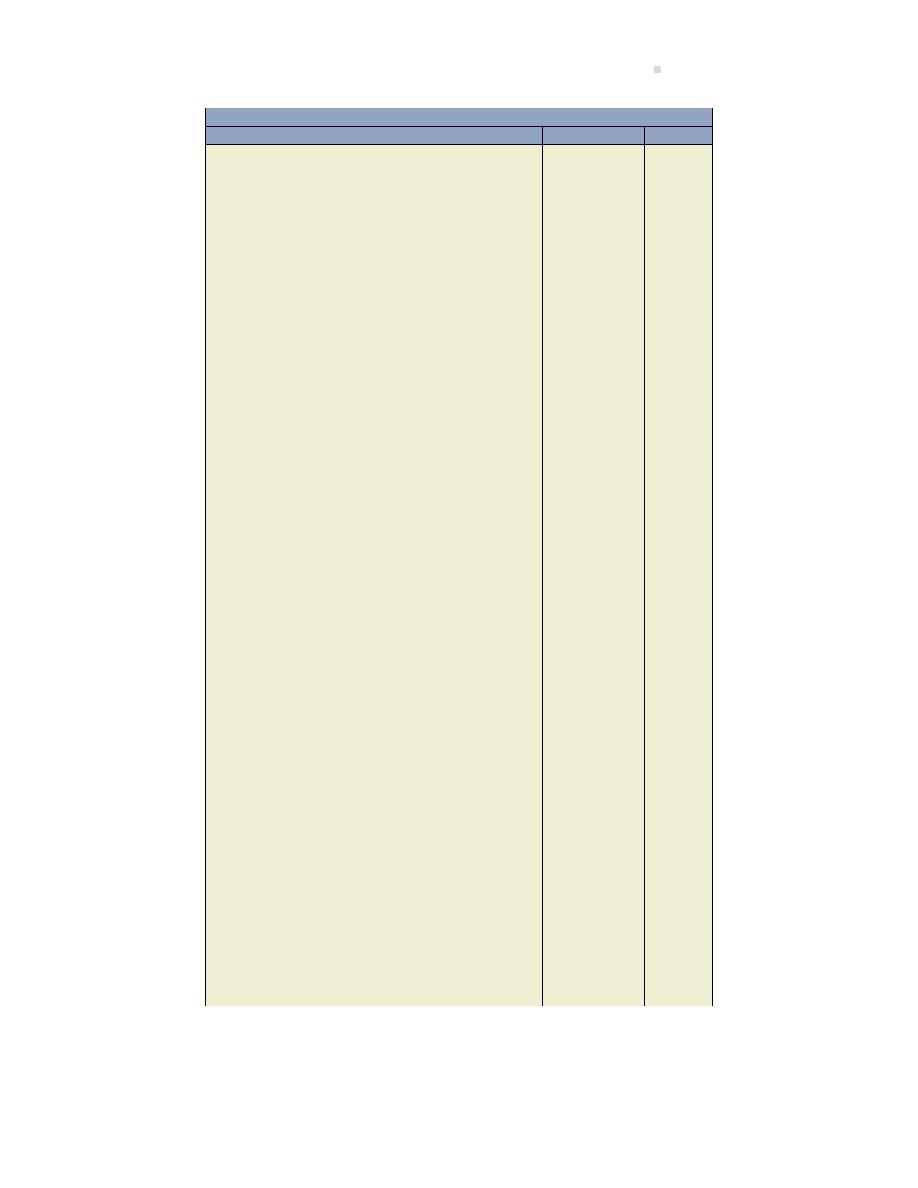
Chapter 10 Solu ons
659
General Journal
Date
Account/Explana on
PR
Debit
Credit
Jan 15
Organiza on Expenses . . . . . . . . . . . . . . . . . .
15,000
Common Shares . . . . . . . . . . . . . . . . . . . .
15,000
Issued common shares to promoters.
Feb 20
Cash . . . . . . . . . . . . . . . . . . . . . . . . . . . . . . . . . .
90,000
Common Shares . . . . . . . . . . . . . . . . . . . .
90,000
Issued
common
shares
for
cash:
15,000 shares
× $6/share
Mar 7
Cash . . . . . . . . . . . . . . . . . . . . . . . . . . . . . . . . . .
90,000
Preferred Shares . . . . . . . . . . . . . . . . . . . .
90,000
Issued preferred shares for cash.
Apr 9
Land . . . . . . . . . . . . . . . . . . . . . . . . . . . . . . . . . .
300,000
Building . . . . . . . . . . . . . . . . . . . . . . . . . . . . . . .
120,000
Common Shares . . . . . . . . . . . . . . . . . . . .
420,000
Issued common shares in exchange for
land and building.
May 1
Cash . . . . . . . . . . . . . . . . . . . . . . . . . . . . . . . . . .
63,000
Preferred Shares . . . . . . . . . . . . . . . . . . . .
63,000
Issued preferred shares: 3,500
× 18
May 15
Cash dividends* – preferred (4,500 +
3,500
× $2) . . . . . . . . . . . . . . . . . . . . . . . . . . .
16,000
Cash dividends* – common ($50,000
−
16,000) . . . . . . . . . . . . . . . . . . . . . . . . . . . . . . .
34,000
Cash . . . . . . . . . . . . . . . . . . . . . . . . . . . . . . .
50,000
Jun 5
Cash . . . . . . . . . . . . . . . . . . . . . . . . . . . . . . . . . .
112,000
Common Shares . . . . . . . . . . . . . . . . . . . .
112,000
Issued common shares.
Jul 15
Cash . . . . . . . . . . . . . . . . . . . . . . . . . . . . . . . . . .
185,000
Preferred Shares . . . . . . . . . . . . . . . . . . . .
35,000
Common Shares . . . . . . . . . . . . . . . . . . . .
150,000
Issued preferred and common shares:
2,000
×17.50 = 132,000; 20,000×7.50 =
150,000
Dec 31
Retained Earnings . . . . . . . . . . . . . . . . . . . . . .
25,000
Income Summary . . . . . . . . . . . . . . . . . . .
25,000
Closed the net loss to Retained Earnings.
Dec 31
Retained Earnings . . . . . . . . . . . . . . . . . . . . . .
50,000
Cash dividends . . . . . . . . . . . . . . . . . . . . .
50,000
Closed the temporary dividends account
to Retained Earnings.
* Debit dividends directly to retained earnings is also acceptable.

660
Solu ons To Exercises
b.
Bray Co.
Equity Sec on of the Balance Sheet
December 31, 2011
Contributed Capital:
Preferred Shares, $2.00; 10,000 shares authorized;
10,000 shares issued and outstanding
$ 188,000*
Common Shares
unlimited shares authorized;
114,000 shares issued and outstanding
787,000**
Total contributed capital
$ 471,000
Deficit***
75,000
Total equity
$ 396,000
Calcula ons:
* Preferred Shares:
Shares
Dollars
Mar 7
Issued 4,500 shares
4,500
$ 90,000
May 1
Issued 3,500 shares
3,500
63,000
Jul 15
Issued 2,000 shares
2,000
35,000
Totals
10,000
$188,000
** Common Shares:
Jan 15
Issued 3,000 shares
3,000
$ 15,000
Feb 20
Issued 15,000 shares
15,000
90,000
Apr 9
Issued 60,000 shares
60,000
420,000
Jun 5
Issued 16,000 shares
16,000
112,000
Jul 15
Issued 20,000 shares
20,000
150,000
Totals
114,000
$787,000
*** Retained earnings/(deficit): $25,000 deficit
− dividends declared $50,000 = $75,000
deficit balance
EXERCISE 10–15
a.
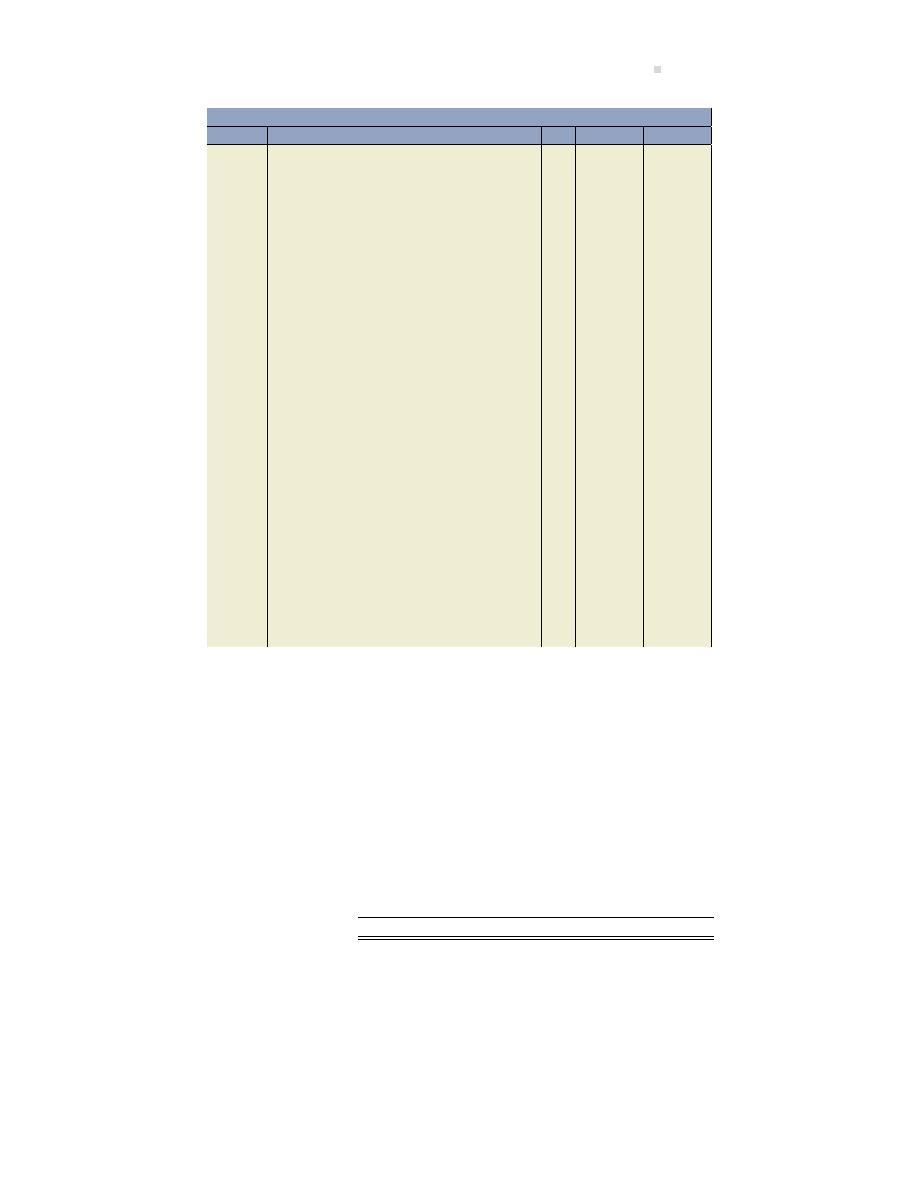
Chapter 10 Solu ons
661
General Journal
Date
Account/Explana on
PR
Debit
Credit
Jan 4
Cash . . . . . . . . . . . . . . . . . . . . . . . . . . . . . . . . . .
165,000
Common shares . . . . . . . . . . . . . . . . . . . .
165,000
Issued 15,000 common shares at $11.
Jan 8
Cash Dividends or Retained Earnings . . . . .
57,500
Preferred Dividend Payable . . . . . . . . . .
45,000
Common Dividend Payable . . . . . . . . . .
12,500
Declared dividend on preferred shares:
(10,000
× $1.50 × 3 years) and common
shares (57,500
− 45,000)
Jan 31
Preferred Dividend Payable . . . . . . . . . . . . .
45,000
Common Dividend Payable . . . . . . . . . . . . . .
12,500
Cash . . . . . . . . . . . . . . . . . . . . . . . . . . . . . . .
57,500
Paid cash dividends.
Jul 1
Cash . . . . . . . . . . . . . . . . . . . . . . . . . . . . . . . . . .
77,500
Preferred Shares . . . . . . . . . . . . . . . . . . . .
77,500
Issued preferred shares.
Aug 7
Cash Dividends or Retained Earnings . . . . .
40,000
Common Dividend Payable . . . . . . . . . .
40,000
Declared dividend on common shares:
($1.00
× 40,000)
Aug 31
Common Dividend Payable . . . . . . . . . . . . . .
40,000
Cash . . . . . . . . . . . . . . . . . . . . . . . . . . . . . . .
40,000
Paid cash dividends declared.
b.
Carman Corp.
Statement of Changes in Equity
For Year Ended December 31, 2017
Preferred
Common
Retained
Total
Shares
Shares
Earnings
Equity
Balance, January 1
$150,000
$250,000
$ 250,000
$ 650,000
Issuance of shares
77,500
165,000
242,500
Net income (loss)**
(50,000)
(50,000)
Dividends*
(97,500)
(97,500)
Balance, December 31
$227,500
$415,000
$102,500
$ 745,000
* ($57,500 + 40,000)
** ($102,500
− 250,000 + 97,500) = (50,000) loss
c.

662
Solu ons To Exercises
Carman Corp.
Equity Sec on of the Balance Sheet
December 31, 2017
Contributed Capital:
Preferred shares, $1.50 cumula ve, unlimited shares authorized,
15,000 shares issued and outstanding
$227,500
Common shares, unlimited shares authorized
40,000 shares issued and outstanding
415,000
Total contributed capital
$642,500
Retained earnings
102,500
Total equity
$745,000
Calcula ons:
Preferred Shares:
Shares
Dollars
Jan 1
Opening balance
10,000
$150,000
Jul 1
Issued 5,000 shares ($77,500
÷ $15.50)
5,000
77,500
Totals
15,000
$227,500
Common Shares:
Jan 1
Opening balance
25,000
$250,000
Jan 4 Issued 15,000 shares
15,000
$165,000
Totals
40,000
$415,000
d.
2016:
Book value per preferred share =
Paid-in capital for preferred shares + dividends in arrears
Number of preferred shares outstanding
=
$150,000 + 30,000*
10,000
=
$18,00 per share
* ($1.50
× 10,000 shares × 2 years)
2017:
Book value per preferred share =
$227,500 + 0
15,000
=
$15.17
2016:

Chapter 11 Solu ons
663
Book value
per common share
=
Total equity minus preferred
shares paid-in capital
+
dividends in arrears
Number of common shares outstanding
=
$650,000
− 180,000
25,000
=
$18,80 per share
2017:
Book value per common share =
$745,000
− 227,500
40,000
=
$12.94
Chapter 11 Solu ons
EXERCISE 11–1
F
A payment of $5,000 was made on a bank loan.
O
Deprecia on expense for equipment was $1,000.
F
$10,000 of share capital was issued for cash.
F
Cash dividends of $2,500 were declared and paid to shareholders.
NC
Bonds were issued in exchange for equipment cos ng $7,000.
I
Land was purchased for $25,000 cash.
O
$750 of accrued salaries was paid.
O
$10,000 of accounts receivable was collected.
NC & I
A building was purchased for $80,000: $30,000 was paid in cash
and the rest was borrowed.
I
A long-term investment in shares of another company was sold
for $50,000 cash.
O & I
Equipment was sold for $6,000. The related accumula on
deprecia on was $3,000 with an original cost of $10,000.
O
$1,200 was paid for a 12-month insurance policy in effect next
year.
O
A patent was amor zed for $500.
F
Bonds were issued for $50,000 cash.
EXERCISE 11–2
a. The reconstructed entry to record the sale of the machinery:
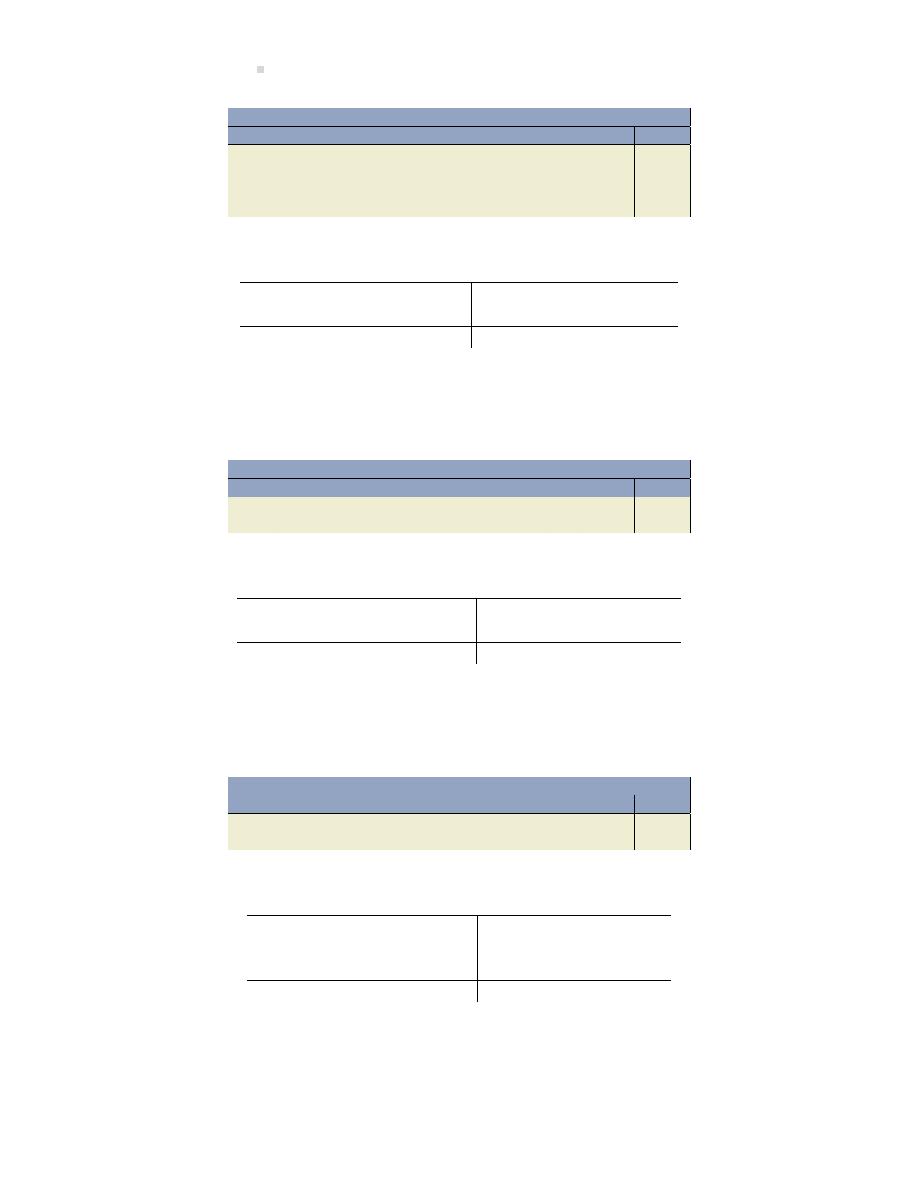
664
Solu ons To Exercises
General Journal
Date
Account/Explana on
PR
Debit
Credit
Accumulated Deprecia on . . . . . . . . . . . . . .
?
Cash . . . . . . . . . . . . . . . . . . . . . . . . . . . . . . . . . .
?
Loss on Sale of Machinery (given) . . . . . . . .
3
Machinery (given) . . . . . . . . . . . . . . . . . .
20
Accumulated Deprecia on
42
Dec. 31, Year 4 bal.
Debit regarding sale
? = 12
25 Dep. Expense, Year 5
55
Dec. 31, Year 5 bal.
Therefore, the debit to cash in the journal entry must be 5 (20-12-3).
b. The reconstructed entry to record the purchase of machinery:
General Journal
Date
Account/Explana on
PR
Debit
Credit
Machinery . . . . . . . . . . . . . . . . . . . . . . . . . . . .
?
Cash . . . . . . . . . . . . . . . . . . . . . . . . . . . . . . .
?
Machinery
Dec. 31, Year 4 bal.
138
Debit regarding purch. ? = 7
20 Credit regarding sale
Dec. 31, Year 5 bal.
125
Therefore, the debit to Machinery and credit to Cash in the entry must be 7 (138-20-125).
c. The reconstructed entry to record the declara on of dividends:
General Journal
Date
Account/Explana on
PR
Debit
Credit
Dividends or Retained Earnings . . . . . . . . . .
?
Dividends Payable . . . . . . . . . . . . . . . . . .
?
Retained Earnings
81 Dec. 31, Year 4 bal.
Year 5 Net loss
2
Year 5 Div. Declared ? = 35
44 Dec. 31, Year 5 bal.
Therefore, the debit to Dividends or Retained Earnings is 35 and credit to Dividends Payable
35 (81-2-44).
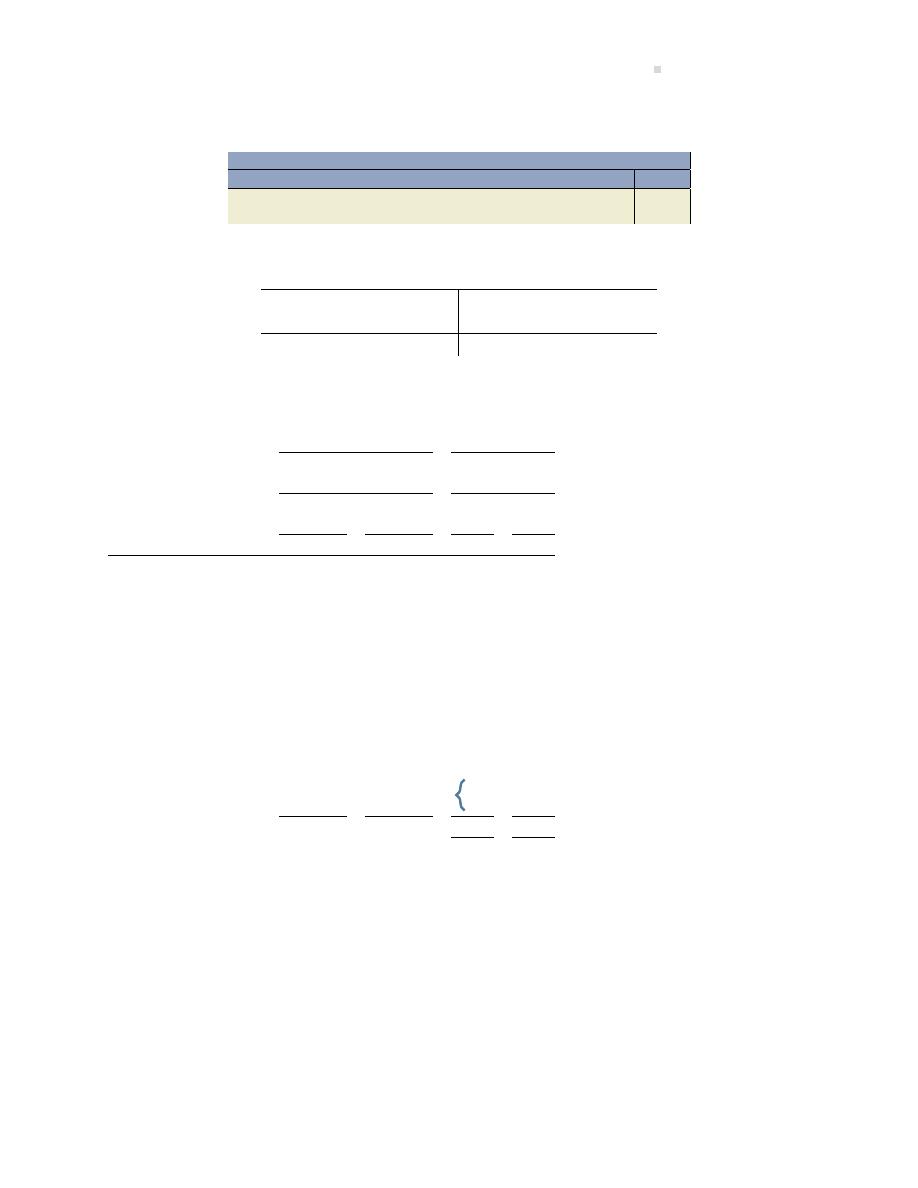
Chapter 11 Solu ons
665
d. The reconstructed entry to record the payment of dividends:
General Journal
Date
Account/Explana on
PR
Debit
Credit
Dividends Payable . . . . . . . . . . . . . . . . . . . . . .
?
Cash . . . . . . . . . . . . . . . . . . . . . . . . . . . . . . .
?
Dividends Payable
5
Dec. 31, Year 4 bal.
Div. Paid Year 5
? = 39
35
Div. Declared Year 5
1
Dec. 31, Year 5 bal.
Therefore, the debit to Dividends Payable is 39 and the credit to Cash 39 (5+35-1).
Calcula ons:
Balance
($000s)
Change
Explana on of Change
Year 5
Year 4
Account
Dr. (Cr.)
Dr. (Cr.)
Dr.
Cr.
Cash
40
22
18
Accounts receivable
34
39
5
Decrease in accounts receivable
Merchandise inventory
150
146
4
Increase in merchandise inventory
Prepaid expenses
3
2
1
Increase in prepaids
Machinery
125
138
7
20
Purchase in machinery for cash of 7; Sold ma-
chinery
for cash of 5; Loss on sale 3
Accumulated dep.
-55
-42
12
25
Deprecia on expense 25
Accounts payable
-29
-31
2
Decrease in accounts payable
Dividends payable
-1
-5
39
35
Paid dividends of 39
Bonds payable
-15
-38
23
Paid bonds 23
Common shares
-208
-150
58
Issued common shares 58
2
Net loss 2
Retained earnings
-44
-81
35
Total
125
143
Change in cash
18
Net increase in cash of 18
e. The statement of cash flows is as follows:

666
Solu ons To Exercises
Larriet Inc.
Statement of Cash Flows
Year Ended December 31, Year 5
Cash flows from opera ng ac vi es:
Net loss
$(2)
Adjustments to reconcile net loss
to cash provided by opera ng ac vi es:
Decrease in accounts receivable
5
Increase in merchandise inventory
(4)
Increase in prepaids
(1)
Decrease in accounts payable
(2)
Deprecia on expense
25
Loss on sale of machinery
3
Net cash inflow from opera ng ac vi es
$24
Cash flows from inves ng ac vi es:
Purchase of machinery
$(7)
Sale of machinery
5
Net cash ou low from inves ng ac vi es
(2)
Cash flows from financing ac vi es:
Issued common shares
$58
Paid bonds
(23)
Paid dividends
(39)
Net cash ou low from financing ac vi es
(4)
Net increase in cash
$18
Cash at beginning of year
22
Cash at end of year
$40
EXERCISE 11–3
a.
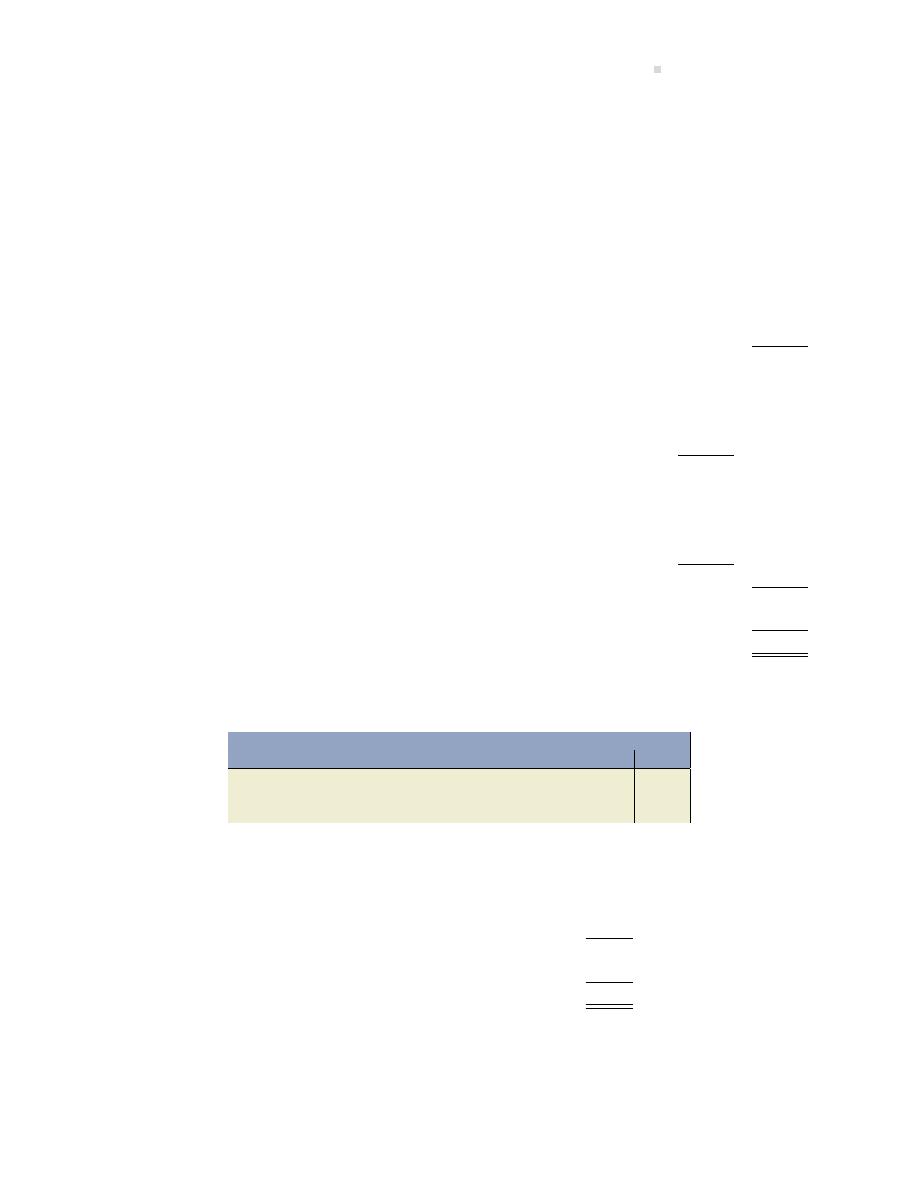
Chapter 11 Solu ons
667
Glacier Corpora on
Statement of Cash Flows
For the Year Ended December 31, 2019
Opera ng ac vi es
Net income
$ 14
Items not affec ng cash flow
Deprecia on expense
6
Gain on sale of equipment (note 2)
(1)
Loss on sale of land (note 1)
4
Net changes in non-cash working capital:
Accounts receivable, inventory and accounts payable ($4
− 8 − 4)
(8)
Cash flow from opera ng ac vi es
15
Inves ng ac vi es
Proceeds from sale of equipment (note 2)
$
6
Proceeds from sale of land
10
Purchase of property, plant, and equipment
(41)
Cash flow used by inves ng ac vi es
(25)
Financing ac vi es
Proceeds from borrowings
8
Common shares issued
10
Payment of dividends
(6)
Cash flow from financing ac vi es
12
Net increase in cash
2
Cash at beginning of year
8
Cash at end of year
$ 10
Note 1: The journal entry to record the sale of the land would be:
General Journal
Date
Account/Explana on
PR
Debit
Credit
Cash . . . . . . . . . . . . . . . . . . . . . . . . . . . . . . . . . .
10
Loss on Disposal . . . . . . . . . . . . . . . . . . . . . . .
4
Land . . . . . . . . . . . . . . . . . . . . . . . . . . . . . . .
14
Note 2:
Cost of equipment sold (given)
$ 7
Accumulated deprecia on (derived)
(2)
Carrying amount (given)
5
Cash proceeds (derived)
(6)
Gain on sale (per income statement)
$ 1
b. Cash flow from opera ng ac vi es is almost iden cal to net income ($15 vs $14). The com-
pany appears to be embarking on a re-capitaliza on project, selling equipment and inves ng

668
Solu ons To Exercises
in new property, plant, and equipment. Most of this ($8 + 10) has been financed by issuing
debt and common shares. Opening and ending cash balances are almost iden cal ($8 vs
$10).
EXERCISE 11–4
a.
Lelei Ltd.
Statement of Cash Flows
For the Year Ended December 31, 2019
($000s)
Opera ng ac vi es
Income from opera ons(225
− 44 − 100 − 28 − 10 + 15)
$
58
Items not affec ng cash flow
Deprecia on expense
44
Gain on sale of patent
(15)
Net changes in non-cash working capital:
Increase in accounts receivable
(100)
Increase in inventory
(60)
Increase in prepaid rent
(10)
Increase in accounts payable
50
Increase in income taxes payable
8
(83)
Cash flow used by opera ng ac vi es
(25)
Inves ng ac vi es
Proceeds from sale of patent
$
45
Purchase of equipment
(120)
Purchase of patent
(30)
Cash flow used by inves ng ac vi es
(105)
Financing ac vi es
Proceeds from non-current borrowings
100
Common shares issued (140
− 40 non-cash)
100
Repayment of non-current borrowings (100
− 80)
(20)
Dividends (20
− 10 dividend payable)
(10)
Cash flow from financing ac vi es
170
Net increase in cash
40
Cash at beginning of year
-0-
Cash at end of year
$
40
b. The statement of cash flows shows that the company used debt and equity to finance its
opera ons, purchase equipment, and pay dividends. The company generated more cash

Chapter 11 Solu ons
669
than it used ($40), from solely its financing ac vi es. The cash flow used by opera ng ac-
vi es ($25) is a concern, but on the other hand, this may be acceptable in the first year of
opera ons.
EXERCISE 11–5
a.
ZZ Corp.
Statement of Cash Flows
For the Year Ended December 31, 2019
Opera ng ac vi es
Income from opera ons
$ 40,000
Items not affec ng cash flow:
Deprecia on expense
27,000
Loss on sale of equipment
11,000
Gain on sale of land
(4,000)
Net changes in non-cash working capital:
Income taxes paid
(4,000)
Increase in accounts receivable
(10,000)
Decrease in inventory
4,000
Decrease in prepaid expenses
2,000
Decrease in accounts payable
(2,000)
24,000
Cash flow used by opera ng ac vi es
64,000
Inves ng ac vi es
Proceeds from sale of land
$ 26,000
Proceeds from sale of equipment
15,000
Building addi on
(60,000)
Purchase of equipment
(15,000)
Cash flow used by inves ng ac vi es
(34,000)
Financing ac vi es
Payment of dividends
(20,000)
Cash flow from financing ac vi es
(20,000)
Net increase in cash
10,000
Cash at beginning of year
30,000
Cash at end of year
$ 40,000
b. ZZ Corp. has generated cash inflow of $64,000 from opera ng ac vi es, which is good. The
company is advised to watch its management of accounts receivable as it has increased from
$30,000 to $40,000 or 33% in one year. Management needs to ensure that it is collec ng

670
Solu ons To Exercises
the accounts receivable as efficiently as possible. In terms of inves ng ac vi es, it has sold
land and equipment, but overall there has been a cash ou low of $34,000 because of the
purchase of new equipment and the building addi on. The company was able to pay its
shareholders dividends of $20,000. Overall, the company added $10,000 more cash to its
cash balance at the end of the year.
EXERCISE 11–6
a.
Egglestone Vibe Inc.
Statement of Cash Flows
For the Year Ended December 31, 2016
Cash flows from opera ng ac vi es
Net income
$ 24,700
Items not affec ng cash flow:
Deprecia on expense
$ 55,900
Loss on sale of equipment (Note 1)
10,100
Gain on sale of land (Note 2)
(38,200)
Impairment loss – goodwill
63,700
Net changes in non-cash working capital:
Increase in accounts receivable
(36,400)
Increase in inventory
(67,600)
Decrease in accounts payable
(28,200)
(40,700)
Net cash used by opera ng ac vi es
(16,000)
Cash flows from inves ng ac vi es
Proceeds from sale of equipment
27,300
Purchase of land
(62,400)
Proceeds from sale of land
150,000
Net cash provided by inves ng ac vi es
114,900
Cash flows used by financing ac vi es
Payment of cash dividends (Note 3)
(89,900)
Issuance of notes payable
10,500
Net cash used by financing ac vi es
(79,400)
Net increase in cash
19,500
Cash at beginning of year
146,900
Cash at end of year
$166,400
Notes:
1. $27,300
− ($53,000 − $15,600)

Chapter 11 Solu ons
671
2. $150,000
− $111,800
3. $430,000 + 24,700 net income
− 386,900 = 67,800 dividends declared
$41,600 + 67,800
− 19,500 = $89,900
b. Nega ve cash flows from opera ng ac vi es may signal trouble ahead with regard to Eggle-
stone’s daily opera ons. Current assets such as accounts receivable, inventory, and ac-
counts payable all increased the cash ou lows over the year. The only posi ve cash flows
was from the inves ng ac vi es. Specifically, proceeds from the sale of equipment and
land were used to fund opera ng and pay dividends. This may be cause for concern if the
assets sold were actually s ll being used to earn revenues and generate net income. Share-
holders did receive cash dividends, but was that appropriate, given the net cash ou lows
from opera ons? All this increases the pressure on the company to find ways to improve its
profitability as well as its management of receivables, payables, and inventory.
EXERCISE 11–7

672
Solu ons To Exercises
Neuton Ltd.
Statement of Cash Flows
For Year Ended June 30, 2016
Cash flows from opera ng ac vi es:
Net income
$ 44,380
Items not affec ng cash flow:
Deprecia on expense
58,600
Net changes in non-cash working capital:
Increase in accounts receivable
(18,000)
Decrease in merchandise inventory
30,000
Increase in prepaid expenses
(200)
Decrease in accounts payable
(26,000)
Decrease in wages payable
(9,000)
Decrease in income taxes payable
(1,200)
Gain on sale of equipment
(2,000)
Net cash inflow from opera ng ac vi es
$ 76,580
Cash flows from inves ng ac vi es:
Cash received from sale of old equipment (Note 1)
$ 10,000
Cash paid for new equipment
(58,600)
Net cash ou low from inves ng ac vi es
(48,600)
Cash flows from financing ac vi es:
Cash received from issuance of common shares
$ 50,000
Cash paid to re re notes payable
(30,000)
Cash paid for dividends (Note 2)
(27,180)
Net cash ou low from financing ac vi es
(7,180)
Net increase in cash
$ 20,800
Cash balance at beginning of year
35,000
Cash balance at end of year
$ 55,800
Note 1:
Cash Proceeds from Sale of Equipment:
Cost of equipment sold
$ 48,600
Accumulated deprecia on of equipment sold (see below)
(40,600)
Book value of equipment sold
8,000
Gain on sale of equipment
2,000
Cash receipt from sale of equipment
$ 10,000

Chapter 11 Solu ons
673
Equipment
Accum. Deprecia on, Equipment
Bal 30/6/15 120,000
10,000 Bal 30/6/15
Purchase
58,600
48,600 Sale
Sale 40,600
58,600 Deprec. Exp
Bal 30/6/16 130,000
28,000 Bal 30/6/16
Note 2: Opening retained earnings + net income – dividends declared = Closing retained earnings
$7,400 + 44,380
− dividends = 24,600
Dividends = 24,600
− 7,400 − 44,380 = 27,180
EXERCISE 11–8
Yuco n Corp.
Statement of Cash Flows
For Year Ended December 31, 2016
Cash flows from opera ng ac vi es:
Net income
$ 134,000
Items not affec ng cash flow:
Deprecia on
36,000
Net changes in non-cash working capital:
Increase in accounts receivable
(8,000)
Increase in inventory
(145,000)
Decrease in accounts payable
(18,000)
Increase in income taxes payable
2,000
Net cash inflow from opera ng ac vi es
$
1,000
Cash flows from inves ng ac vi es:
Equipment purchase
(24,000)
Cash flows from financing ac vi es:
Common shares issued
$
40,000
Dividends
(37,000)
Net cash ou low from financing ac vi es
(3,000)
Net increase in cash
$(20,000)
Cash, beginning balance
268,000
Cash, ending balance
$248,000
EXERCISE 11–9
a. Opening retained earnings + net income – dividends declared = closing retained earnings
Dividends declared = 115,200
− 68,800 − 86,400 = $40,000

674
Solu ons To Exercises
Cash dividends paid = opening dividends payable+dividends declared
−closing dividends payable
Cash dividends paid = 500 + 40,000
− 1,000 = $39,500
b.
Tubric Corp.
Statement of Cash Flows
For Year Ended December 31, 2016
Cash flows from opera ng ac vi es:
Net income
$ 86,400
Items not affec ng cash flow:
Deprecia on expense
34,400
Loss on sale of equipment
3,200
Gain on sale of long-term investment
(9,600)
Net changes in non-cash working capital:
Increase in accounts receivable
(42,400)
Increase in inventory
(25,600)
Decrease in accounts payable
(14,900)
Net cash inflow from opera ng ac vi es
$ 31,500
Cash flows from inves ng ac vi es:
Proceeds from sale of long-term investment
$ 24,000
Proceeds from sale of equipment
5,600
Purchase of equipment
(16,000)
Net cash inflow from inves ng ac vi es
13,600
Cash flows from financing ac vi es:
Issuance of bonds payable
$ 20,000
Payment of dividend (from part a above)
(39,500)
Net cash ou low from financing ac vi es
(19,500)
Net increase in cash and cash equivalents
$ 25,600
Cash and cash equivalents, January 1, 2016
28,800
Cash and cash equivalents, December 31, 2016
$ 54,400
EXERCISE 11–10
a.

Chapter 11 Solu ons
675
Rorrow Ltd.
Balance Sheet
as at December 31, 2015
2015
2014
Total W/C accounts except Cash*
Net
Change
Current assets
Cash
$ 152,975
$
86,000
Accounts receivable (net)
321,640
239,080
Inventory
801,410
855,700
1,160,890
1,124,880
(36,010)
Prepaid insurance expenses
37,840
30,100
Equipment
2,564,950
2,156,450
Accumulated deprecia on,
equipment
(625,220)
(524,600)
Total assets
$3,253,595
$2,842,730
Current liabili es
Accounts payable
$ 478,900
$ 494,500
Salaries and wages payable
312,300
309,600
897,410
901,280
(3,870)
Accrued interest payable
106,210
97,180
Bonds payable, due July 31,
2023
322,500
430,000
Common shares
1,509,300
1,204,000
Retained earnings
524,385
307,450
Total liabili es and
shareholders’ equity
$3,253,595
2,842,730
Net change
(39,880)
* exclude current por on of long-term
debt as this account is not a working
capital account

676
Solu ons To Exercises
Rorrow Ltd.
Income Statement
For the year ended December 31, 2015
Sales
$ 5,258,246
Expenses
Cost of goods sold
3,150,180
Salaries and benefits expense
754,186
Deprecia on expense
100,620
Interest expense
258,129
Insurance expense
95,976
Income tax expense
253,098
4,612,189
Net income
$
646,057
Rorrow Ltd.
SCF – Direct Method Worksheet
Changes to
Working
Net
Capital
Cash Flow
I/S Accounts
Accounts
In (Out)
Cash received from sales
$ 5,258,246
$
(82,560)
$ 5,175,686
Cash paid for goods and services
(3,150,180)
54,290
(95,976)
(7,740)
(15,600)
(3,215,206)
Cash paid to or on behalf of employees
(754,186)
2,700
(751,486)
Cash paid for interest
(258,129)
9,030
(249,099)
Cash paid for income taxes
(253,098)
(253,098)
Memo items:
Deprecia on expense
(100,620)
Net cash flows from opera ng ac vi es
$
646,057
$
(39,880)
$
706,797
This amount
balances to
net change
in the balance
sheet shown
above
b.

Chapter 11 Solu ons
677
Rorrow Ltd.
Statement of Cash Flows – Opera ng Ac vi es
For the Year Ended December 31, 2015
Cash flows from opera ng ac vi es
Cash received from sales
$5,175,686
Cash paid for goods and services
3,215,206
Cash paid to or on behalf of employees
751,486
Cash paid for interest
249,099
Cash paid for income taxes
253,098
Net cash flows from opera ng ac vi es
$ 706,797
EXERCISE 11–11
a. Worksheet for opera ng ac vi es, direct method:
Lelie Ltd.
Opera ng Ac vi es
Income
Changes to
Net
Statement Working Capital Cash Flow
Accounts
Accounts
Cash received from sales
225,000
(100,000)
125,000
Cash paid for goods and services
(100,000)
(60,000)
(28,000)
(10,000)
50,000
(148,000)
Cash paid to employees
N/A
N/A
Cash received for interest income
N/A
N/A
Cash paid for interest
N/A
N/A
Cash paid for income taxes
(10,000)
8,000
(2,000)
Memo Items:
Deprecia on expense
(44,000)
Gain on sale of buildings
15,000
Dividend payable – financing ac vity
10,000
therefore not a W/C account;
Net cash flows from opera ng ac vi es
58,000
(102,000)
(25,000)

678
Solu ons To Exercises
Note: Dividend payable and current por on of long-term debt are two accounts classified as
a current liability for repor ng purposes, but they are not sources of working capital because
they relate to financing ac vi es.
Lelei Ltd.
Statement of Cash Flows
For the Year Ended December 31, 2019
($000s)
Opera ng ac vi es
Cash received from sales
$ 125
Cash paid to supplier for goods and services
(148)
Cash paid for income taxes
(2)
Cash flow used by opera ng ac vi es
$ (25)
Inves ng ac vi es
Proceeds from sale of patent
$
45
Purchase of equipment
(120)
Purchase of patent
(30)
Cash flow used by inves ng ac vi es
(105)
Financing ac vi es
Proceeds from non-current borrowings
100
Common shares issued (140
− 40 non-cash)
100
Repayment of non-current borrowings (100
− 80)
(20)
Dividends (20
− 10 dividend payable)
(10)
Cash flow from financing ac vi es
170
Net increase in cash
40
Cash at beginning of year
-0-
Cash at end of year
$
40
NOTE: To see solu on details for the Inves ng and Financing ac vi es, refer to the Exer-
cise
solu on from the main chapter solu ons.
b. The statement of cash flows shows that the company used debt and equity to finance its
opera ons, purchase equipment, and pay dividends. The company generated more cash
than it used ($40), from solely its financing ac vi es. The cash flow used by opera ng ac-
vi es ($25) is a concern, but on the other hand, this may be acceptable in the first year of
opera ons.
EXERCISE 11–12
Worksheet for opera ng ac vi es, direct method:

Chapter 11 Solu ons
679
Nueton Ltd.
Opera ng Ac vi es
Income
Changes to
Net Cash
Statement Working Capital Flow In/(Out)
Accounts
Accounts
Cash received from sales
500,000
(18,000)
482,000
Cash paid for goods and services
(300,000)
30,000
(45,000)*
30,000
(26,000)
(341,200)
Cash paid to employees
(30,000)
(9,000)
(39,000)
Cash received for interest income
N/A
N/A
Cash paid for interest
(5,000)*
(5,000)
Cash paid for income taxes
(19,200)
(1,200)
(20,220)
Memo Items:
Deprecia on expense
(58,600)
Gain on sale of land*
2,000
Net cash flows from opera ng ac vi es
44,380
(24,400)
(76,580)
* Other expenses are separated into $30,000 for salaries, $5,000 for interest expense and $45,000
for goods and services.

680
Solu ons To Exercises
Neuton Ltd.
Statement of Cash Flows
For Year Ended June 30, 2016
Cash flows from opera ng ac vi es:
Cash received from sales
$ 482,000
Cash paid for goods and services
(341,200)
Cash paid to employees
(39,000)
Cash paid for interest expense
(5,000)
Cash paid for income taxes
(20,220)
Net cash inflow from opera ng ac vi es
$ 76,580
Cash flows from inves ng ac vi es:
Cash received from sale of old equipment (Note 1)
$
10,000
Cash paid for new equipment
(58,600)
Net cash ou low from inves ng ac vi es
(48,600)
Cash flows from financing ac vi es:
Cash received from issuance of common shares
$
50,000
Cash paid to re re notes payable
(30,000)
Cash paid for dividends (Note 2)
(27,180)
Net cash ou low from financing ac vi es
(7,180)
Net increase in cash
$ 20,800
Cash balance at beginning of year
35,000
Cash balance at end of year
$ 55,800
NOTE: To see solu on details for the Inves ng and Financing ac vi es refer to the Exercise
solu on from the main chapter solu ons.
Chapter 12 Solu ons
EXERCISE 12–1
The calcula on of ra os as shown by the financial statements of Stockwell Inc. for each of the
three years is as follows:
a. Liquidity ra os

Chapter 12 Solu ons
681
2015
2014
2013
Current ra o
1.2:1
1.0:1
1.4:1
Acid-test ra o
0.59:1
0.48:1
0.74:1
Sales
210 (a)
120
100
Accounts receivable
–opening
30
20
20
–closing
38
30
20
–average
34 (b)
25
20
Accounts receivable
Collec on period (b/a
× 365)
59 days
76 days
73 days
Cost of goods sold
158 (c)
80
55
Merchandise inventory
–opening
40
30
20
–closing
60
40
30
–average
50 (d)
35
25
Number of days of sales
in inventory (d/c
× 365)
116 days
160 days
166 days
Revenue opera ng cycle
175 days
236 days
239 days
• The company’s working capital posi on does not appear to be sa sfactory, since the
liquid assets appear to be insufficient to meet current obliga ons. The acid-test ra o is
quite low, well below 1:1. The company could obtain addi onal cash by issuing shares
or acquiring long-term debt. Alternately, it may need to seek short-term financing like
an opera ng loan from a bank to provide cash to pay liabili es as they become due.
• Control over accounts receivable and inventories has improved. Even though the dollar
value of both of these items has increased, average sales and collec on periods have
declined in 2015. The liquidity ra os for 2014 as compared with 2015 and 2013 suggest
that not enough a en on was given during that year to investments in inventories and
to the collec on of accounts receivable. However, the improvements shown in 2015
indicate that be er control is now being exercised over these current assets.
b.
i. Financial structure
2015
2014
2013
Debt to equity ra o $150/230
$130/100
$50/96
=
0.65:1
=
1.30:1
=
0.52:1
The appropriate financial structure for Stockwell Inc. cannot be adequately determined
without knowledge of its industry, for instance. With the excep on of 2014, Stockwell
Inc.’s debt to equity ra o indicates a reliance on equity rather than debt financing due
to the 2015 share issue. In 2014, however, a bond issue temporarily changed the finan-
cial structure. Market rates of interest for debt would need to be evaluated to see if
there is poten al for leverage (that is, if interest rates are lower than current return on

682
Solu ons To Exercises
total assets). If not, it is less likely that any poten al for posi ve leverage exists. In this
circumstance a weigh ng toward equity is reasonable.
ii. The propor on of assets provided by creditors is as follows: 2013 – 34.3% (50/146);
2014 – 56.5% (130/230), and 2015 – 39.5% (150/380).
iii. A dispropor onately high percentage of debt, over 60% in both 2014 and 2015, is in
current liabili es.
c. Other observa ons:
• The gross profit ra o has declined over the past year, even though sales have more than
doubled (2015: $52/210 = 25%; 2014: $40/120 = 33%). The decrease in this ra o
suggests either that selling prices were reduced in order to dispose of the increased
produc on or that the expansion in produc on facili es resulted in a higher unit cost;
possibly there was a combina on of both.
• All funds derived from earnings during the last two years have been retained within the
business, since no dividends have been paid. However, the investment in property,
plant and equipment assets of $190 ($260
− 70) exceeds the $170 received on the
issue of bonds and shares [$50 + (200
− 80)]. It appears that a substan al part of the
funds derived from earnings have been used to finance addi ons to property, plant
and equipment assets rather than to provide working capital. This has weakened the
liquidity ra os.
(Other relevant observa ons are acceptable.)
EXERCISE 12–2
Price-earnings ra o =
Market price per share
Earnings per share
This ra o indicates the stock market’s expecta ons of profitability for the company. A higher P/E
ra o indicates that the market expects the company to be profitable despite rela vely lower net
income at present. On this basis, company C is preferred.
A: $35/11 = 3.2
B: $40/5 = 8
C: $90/10 = 9
Dividend yield
=
Dividends per share
Market price per share

Chapter 12 Solu ons
683
This ra o indicates what short-term cash return shareholders might expect on their investment in
common shares of the company.
A: 0
B: $4/40 = 0.1 or 10%
C: $6/90 = 0.067 or 6.7%
The stock market indicates that company C is expected to be rela vely more profitable than A or B
in the future. However, if dividend yield is important to the shareholder, then company B should
be chosen. On either basis, company A does not appear to be a good investment.
EXERCISE 12–3
a. Current ra o
=
Current assets
Current liabili es
=
Cash + accounts receivable + inventory + prepaid expenses
Current liabili es
=
$300/60
=
5:1
b. Return on total assets
=
Income from opera ons
Average total assets
=
$46/620
=
7.4%
c. Sales to total assets ra o
=
Net sales
Average total assets
=
$240/620
=
38/7%
d. Acid-test ra o
=
Quick assets
Current liabili es
=
Cash + accounts receivable
Current liabili es
=
($72 + 88)/60
=
2.7:1
e. Times interest earned ra o

684
Solu ons To Exercises
=
Income from opera ons
Interest expense
=
$46/8
=
5.75:1
f. Earnings per common share
=
Net income
− preferred share dividends
Number of common shares outstanding
=
[$20
− ($60 × 10%)]/10 shares
=
$1.40 per share
g. Accounts receivable collec on period
=
Average accounts receivable
× 365 days
Net credit sales
=
$88/(80%
× $240) × 365 days
=
167 days
h. Return on equity
=
Net income
Equity
=
Net income
Preferred shares + Common shares + Retained earnings
=
$20/(60 + 250 + 100)
=
4.9%
EXERCISE 12–4
a. Horizontal analysis:
Change
2012
2011
Amount
Percentage
(a)
(b)
(a
− b)
(a
− b)/b
Sales
$2,520
$1,440
$+1,080
+
75%
Cost of Goods Sold
1,890
960
+
930
+
96.9%
Gross Profit
630
480
+
150
+
31.3%
Other Expenses
510
430
+
80
+
18.6%
Net Income
$120
$50
+
70
+
140%
b. Although sales have increased, cost of goods sold has increased at a faster pace. However,
opera ng expenses have increased at a slower pace, resul ng in a substan ally higher net
income.

Chapter 12 Solu ons
685
EXERCISE 12–5
a. Ver cal analysis:
Escalade Corpora on
Ver cal Analysis of the Income Statements
For the Years Ending December 31, 2010–2012
Common–Size Percentages
2012
2011
2010
Sales
100.0
100.0
100.0
Cost of Goods Sold
76.0
66.7
50.0
Gross Profit
24.0
33.3
50.0
Other Expenses
14.0
22.7
29.2
Net Income
10.0
10.6
20.8
b. Escalade’s gross profit ra o has significantly declined over the past three years. This could
be owing to the ini al inefficiency of a larger plant or because of selling an increased num-
ber of units at a greatly reduced price to obtain a larger share of the market. At any rate,
the reasons for this decline should be inves gated further. Since other expenses have not
increased propor onately, perhaps more money could be put into sales promo on to in-
crease the number of units sold.
EXERCISE 12–6
a.
Current ra o =
Current assets
Current liabili es
The current ra o indicates how many dollars of current assets exist to pay a dollar of current
liabili es. A ra o of 2 to 1 is o en appropriate but this depends on the type of industry.
2018: ($10 + 35 + 200 + 600)
÷ 745 = $1.13 to 1
2017: ($15 + 35 + 150 + 400)
÷ 580 = $1.03 to 1
b.
Acid-test ra o =
Quick assets
Current liabili es
The acid-test ra o indicates how many dollars of current assets excluding inventory and
prepaid expenses exist to pay a dollar of current liabili es. A ra o of at least 1 to 1 is o en
appropriate but this depends on the type of industry.
2018: ($10 + 35 + 200)
÷ 745 = $0.33 to 1
2017: ($15 + 35 + 150)
÷ 580 = $0.34 to 1
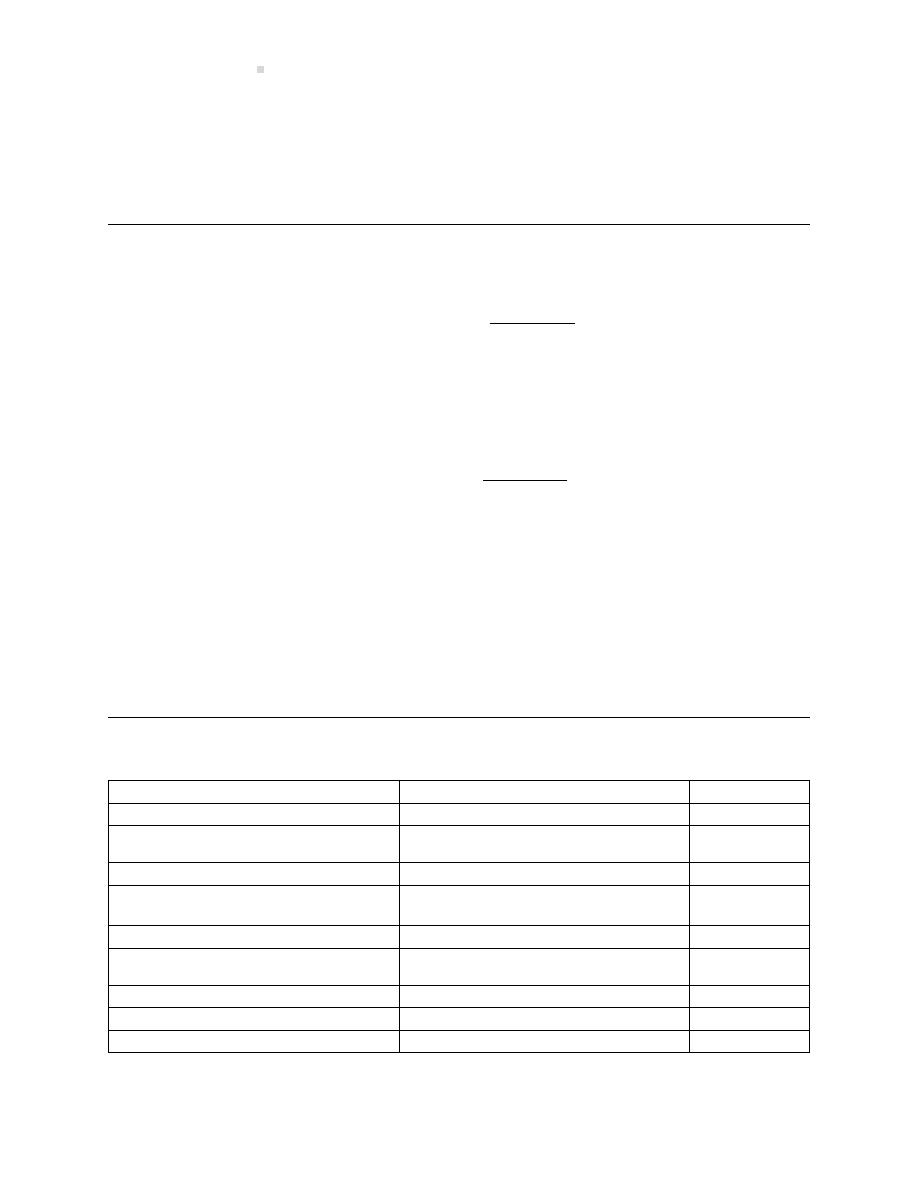
686
Solu ons To Exercises
c. Both the current and acid-test ra os are below the suggested guidelines. The company’s
con nuing low acid-test ra o in par cular suggests that it will likely have problems mee ng
its liabili es as they become due, and that the company may be at risk of bankruptcy.
EXERCISE 12–7
Gross profit ra o =
Gross profit
Net sales
2019: $63
÷ 252 = 25%
2018: $48
÷ 141 = 34%
2017: $54
÷ 120 = 45%
Net profit ra o =
Net income
Net sales
2019: $12
÷ 252 = 4.7%
2018: $5
÷ 141 = 3.6%
2017: $15
÷ 120 = 12.5%
This company has a decreasing gross profit ra o. This significantly affects net income and the
net profit ra o. Net income and the net profit ra o dipped significantly in 2018, but both have
rebounded somewhat in 2019. The company may be facing significant compe
on in recent years;
hence the overall decline in the gross profit and net profit ra os.
EXERCISE 12–8
Transac on
Ra o
Effect on ra o
Declared a cash dividend
Current ra o
D
Wrote-off an uncollec ble account
receivable
Accounts receivable collec on period
I
Purchased inventory on account
Acid-test ra o
D
Issued 10-year bonds to acquire
property, plant, and equipment
Return on total assets
D
Issued addi onal shares for cash
Debt to shareholders’ equity ra o
D
Declared a share dividend on
common shares
Earnings per share
NC
Purchased supplies on account
Current ra o
D
Paid a current creditor in full
Acid-test ra o
I
Paid an account payable
Number of days of sales in inventory
NC

Chapter 12 Solu ons
687
EXERCISE 12–9
a.
i. Return on total assets
= Income from opera ons
Average total assets
= ($36/220)
= 16.4%
ii. Return on shareholders’ equity
=
Net income
Average shareholders’ equity
= $20/(80 + 60)
= 14.3%
iii. Times interest earned ra o
= Income from opera ons
Interest expense
= $36/6
= 6 mes
iv. Earnings per share
=
Net income
Number of common shares outstanding
= $20/8 shares
= $2.50
v. Number of days of sales in inventory
= Average inventory
Cost of goods sold × 365 days
= $40/50
× 365 days
= 292 days
vi. Accounts receivable collec on period
= Accounts receivable
Net credit sales
× 365 days
= $20/100
× 365 days
= 73 days
vii. Sales to total assets ra o
=
Net sales
Average total assets
= $100/220
= 45%
viii. Current ra o
= Current assets
Current liabili es
= ($20 + 20 + 40)/20
= 4:1
ix. Acid-test ra o
=
Quick assets
Current liabili es
= ($20 + 20)/20
= 2:1

688
Solu ons To Exercises
x. Debt to shareholders’ equity ra o
=
Total liabili es
Shareholders’ equity
= $(20 + 60)/140)
= 0.57:1
b. The following ra os are measures of liquidity:
v. Number of days of sales in inventory
vi. Accounts receivable collec on period
viii. Current ra o
ix. Acid-test ra o
EXERCISE 12–10
a. Current assets + capital assets = Total liabili es + shareholders’ equity
Current assets + $90 = $40 + 140
Current assets = $90
Current ra o = Current assets
Current liabili es
2.5 = $90/Current liabili es
Current liabili es = $36
b. From above: Current assets = $90; Current liabili es = $36
Acid-test Ra o = Quick current assets
Current liabili es
Since the Acid-test Ra o is 1:1,
Inventory = $90
−
inventory
+
0
$36
Inventory = $90 – 36
Inventory = $54
c. Accounts receivable = Quick current assets – (cash + short-term investments)
$36 – 6 = 30
Accounts rec. collec on period = Average accounts receivable
Net credit sales
× 365 days
= $30/300
× 365 days
= 37 days
d. If gross profit is 30 per cent of sales, the cost of goods sold is 70 per cent of sales (70%
×
$420 = $294). From above, inventory = $54
Number of days of sales in inventory = Average inventory
Net credit sales × 365 days
= $54/294
× 365 days
= 12 days
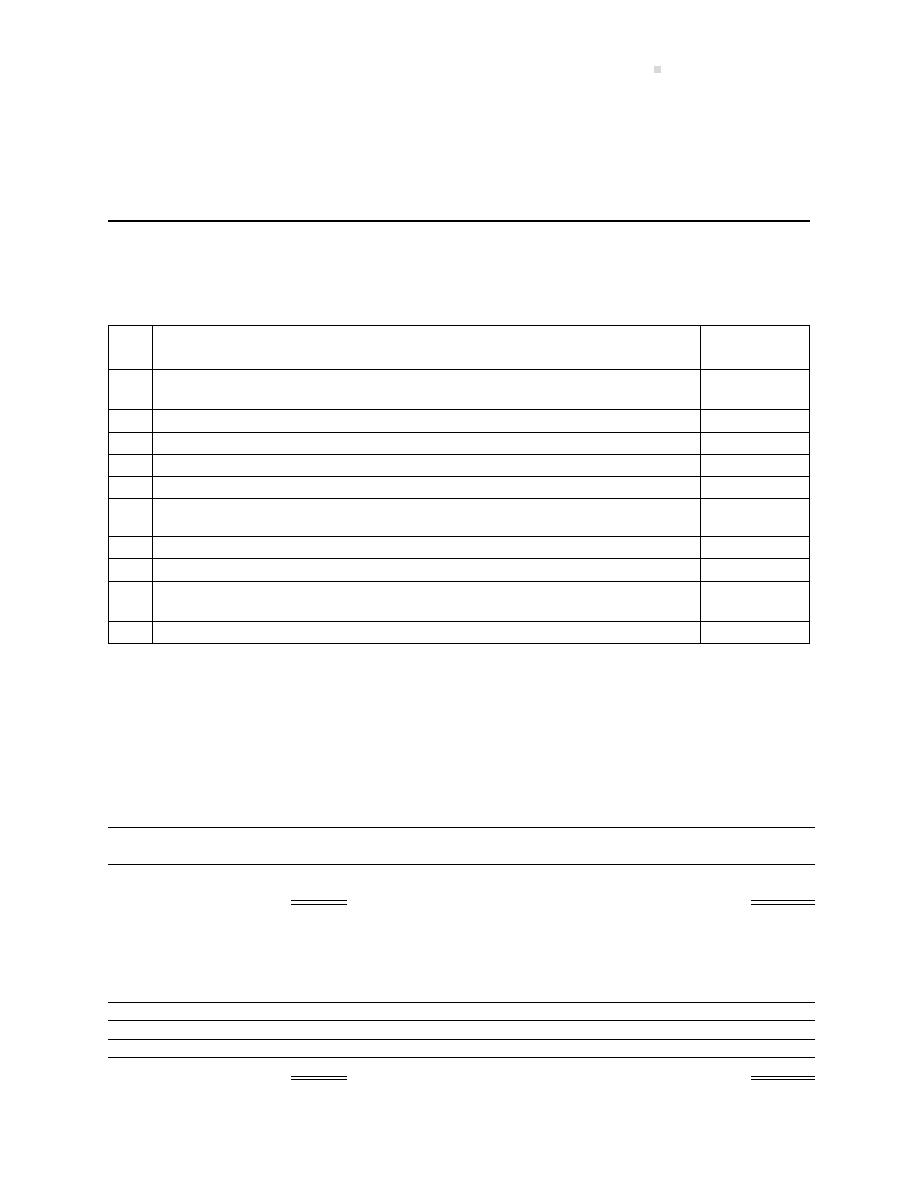
Chapter 12 Solu ons
689
e. Revenue opera ng cycle = Accounts receivable collec on period + number of days of sales
in inventory
= 77 + 12 = 49 days
EXERCISE 12–11
a.
Effect on
Transac on
current ra o
i.
Bought $20,000 of merchandize on account (the company uses a
perpetual inventory system)
D
ii.
Sold for $10,000 cash, merchandize that cost $5,000
I
iii.
Collected a $2,500 account receivable
NC
iv.
Paid a $10,000 account payable
I
v.
Wrote off a $1,500 bad debt against the allowance for doub ul accounts
NC*
vi.
Declared a $1 per-share cash dividend on the 10,000 outstanding
common shares
D
vii.
Paid the dividend declared above
I
viii.
Borrowed $10,000 from a bank by assuming a 60-day, 10-per cent loan
D
ix.
Borrowed $25,000 from a bank by placing a 10-year mortgage on the
plant
I
x.
Used the $25,000 proceeds of the mortgage to buy addi onal machinery
D
* The journal entry is a debit from Allowance for Doub ul Accounts and a credit to Accounts
Receivable.
b. At the end of May,
The current ra o was 2.15 to 1, calculated as follows:
Bal
Bal
In thousands of dollars
May 1
i
ii
iii
iv
v
vi
vii
vii
ix
x
May 31
Current assets
x
200
+20
+10
+2.5
-10
+1.5
–
-10
+10
+25
-25
215
-5
-2.5
-1.5
Current liabili es
y
80
+20
–
–
-10
–
+10
-10
+10
–
–
100
Current ra o
x/y
2.5
2.15
The acid-test ra o was 1 to 1 calculated as follows:
Bal
Bal
In thousands of dollars
May 1
i
ii
iii
iv
v
vi
vii
viii
ix
x
May 31
Quick assets
x
100
–
+10
+2.5
-10
+1.5
–
-10
+10
+25
-25
100
-2.5
-1.5
Current liabili es
y
80
+20
–
–
-10
–
+10
-10
+10
–
–
100
Acid-test ra o
x/y
1.25
1.0

690
Solu ons To Exercises
Chapter 13 Solu ons
EXERCISE 13–1
a. The income statement is as follows:
B. White and C. Green Partnership
Income Statement
For the Year Ended December 31, 2015
Sales
$322,000
Cost of Goods Sold
160,500
Gross Profit
161,500
Opera ng Expenses
Rent
36,000
Adver sing
27,200
Delivery
9,600
Office
12,800
U li es
23,300
108,900
Net Income
$ 52,600
b. The statement of changes in equity is as follows:
B. White and C. Green Partnership
Statement of Changes in Equity
For the Year Ended December 31, 2015
White
Green
Total
Opening Balance
$20,000
$10,000
$30,000
Investments
10,000
10,000
20,000
Net Income
26,300
26,300
52,600
56,300
46,300
102,600
Less: Withdrawals
7,000
5,000
12,000
Ending Balance
$49,300
$41,300
$90,600
c. The balance sheet is as follows:
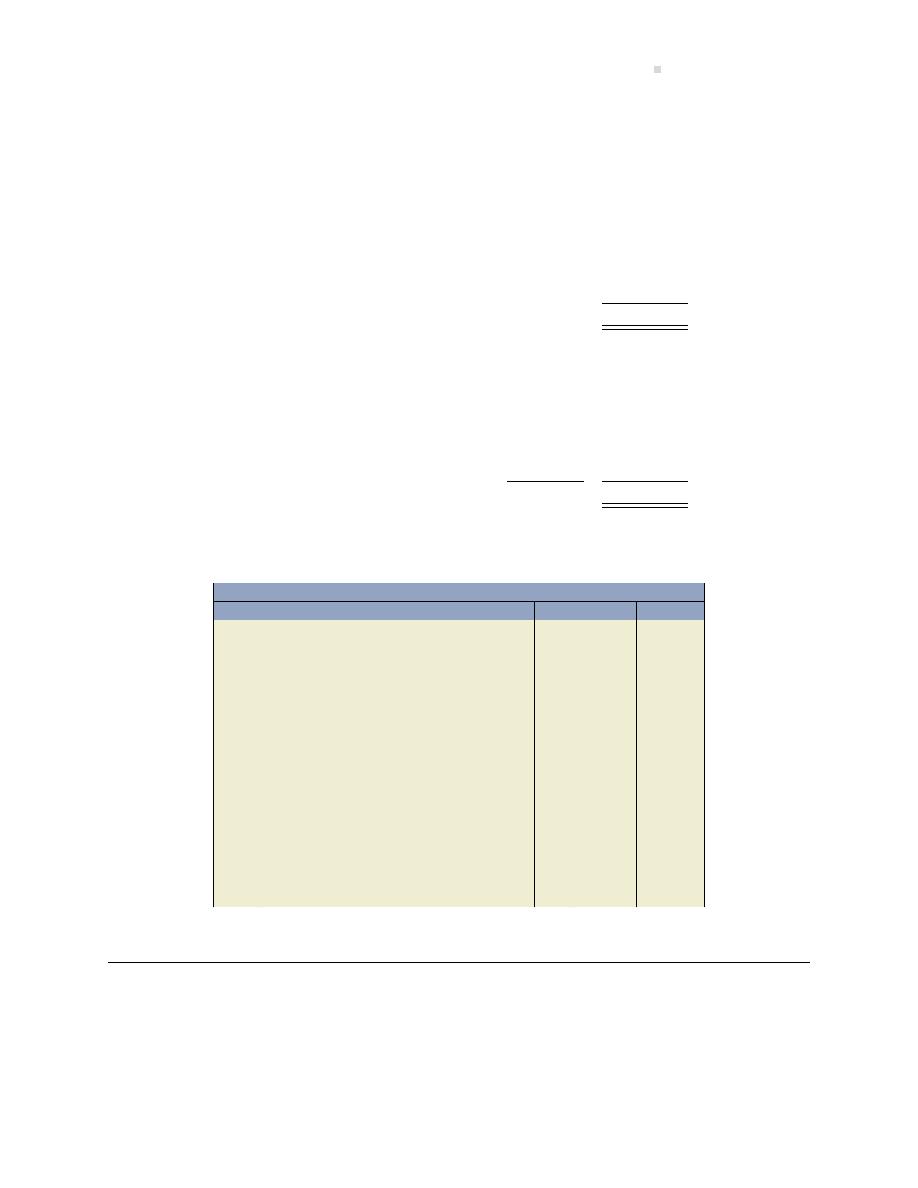
Chapter 13 Solu ons
691
B. White and C. Green Partnership
Balance Sheet
At December 31, 2015
Assets
Current
Cash
$41,000
Accounts Receivable
68,400
Inventory
27,000
Total Assets
$136,400
Liabili es
Current
Accounts Payable
$45,800
Equity
B. White, Capital
$49,300
C. Green, Capital
41,300
90,600
Total Liabili es and Equity
$136,400
d. The closing entries for the year are as follows:
General Journal
Date
Account/Explana on
PR
Debit
Credit
Sales . . . . . . . . . . . . . . . . . . . . . . . . . . . . . . . . . .
322,000
Income Summary . . . . . . . . . . . . . . . . . . .
322,000
Income Summary . . . . . . . . . . . . . . . . . . . . . .
269,400
Cost of Goods Sold . . . . . . . . . . . . . . . . . .
160,500
Rent . . . . . . . . . . . . . . . . . . . . . . . . . . . . . . .
36,000
Adver sing . . . . . . . . . . . . . . . . . . . . . . . . .
27,200
Delivery. . . . . . . . . . . . . . . . . . . . . . . . . . . .
9,600
Office . . . . . . . . . . . . . . . . . . . . . . . . . . . . . .
12,800
U li es . . . . . . . . . . . . . . . . . . . . . . . . . . . .
23,300
Income Summary . . . . . . . . . . . . . . . . . . . . . .
52,600
B. White, Capital . . . . . . . . . . . . . . . . . . . .
26,300
C. Green, Capital . . . . . . . . . . . . . . . . . . . .
26,300
B. White, Capital . . . . . . . . . . . . . . . . . . . . . . .
7,000
B. White, Withdrawals . . . . . . . . . . . . . .
7,000
C. Green, Capital . . . . . . . . . . . . . . . . . . . . . . .
5,000
C. Green, Withdrawals . . . . . . . . . . . . . .
5,000
EXERCISE 13–2
a. The statement of changes in equity for White’s is as follows:
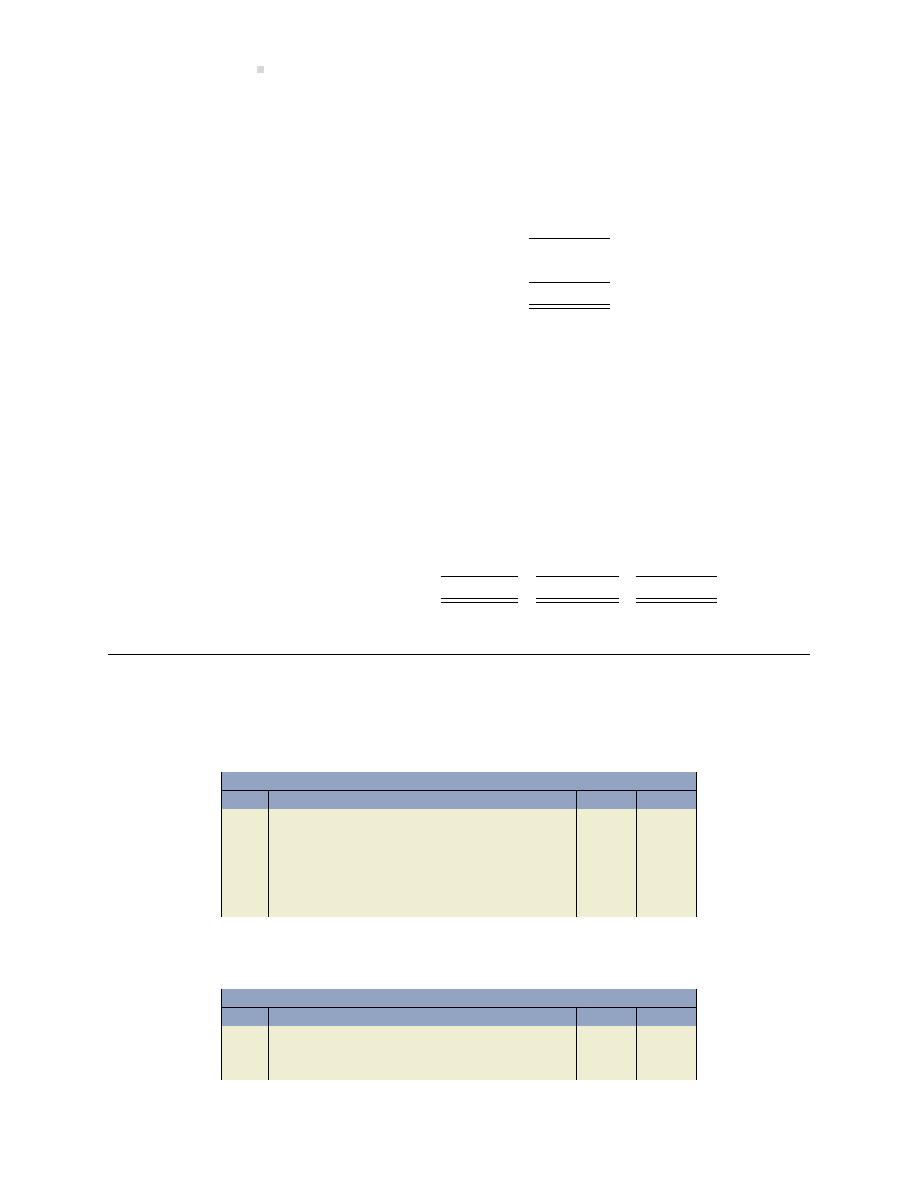
692
Solu ons To Exercises
White’s
Statement of Changes in Equity
For the Year Ended December 31, 2015
Opening Balance
$ 30,000
Investments
20,000
Net Income
52,600
102,600
Less: Withdrawals
12,000
Ending Balance
$ 90,600
b. The statement in changes in equity for BW and CG Ltd. is as follows:
BW and CG Ltd.
Statement of Changes in Equity
For the Year Ended December 31, 2015
Share
Retained
Capital
Earnings
Total
Opening Balance
$200
$29,800
$30,000
Common Shares Issued
20,000
20,000
Net Income
52,600
52,600
Dividends Declared
(12,000)
(12,000)
Ending Balance
$20,200
$70,400
$ 90,600
EXERCISE 13–3
a. The journal entry is as follows:
General Journal
Date
Account/Explana on
PR
Debit
Credit
Income Summary . . . . . . . . . . . . . . . . . . . . . .
52,600
B. White, Capital . . . . . . . . . . . . . . . . . . . .
32,875
C. Green, Capital . . . . . . . . . . . . . . . . . . . .
19,725
To allocate net income as follows: White
($52,600
× 5/8) + Green ($52,600 × 3/8)
=
$32,875 + 19,725 = $52,600
b. The journal entry is as follows:
General Journal
Date
Account/Explana on
PR
Debit
Credit
Income Summary . . . . . . . . . . . . . . . . . . . . . .
52,600
B. White, Capital . . . . . . . . . . . . . . . . . . . .
37,760
C. Green, Capital . . . . . . . . . . . . . . . . . . . .
14,840
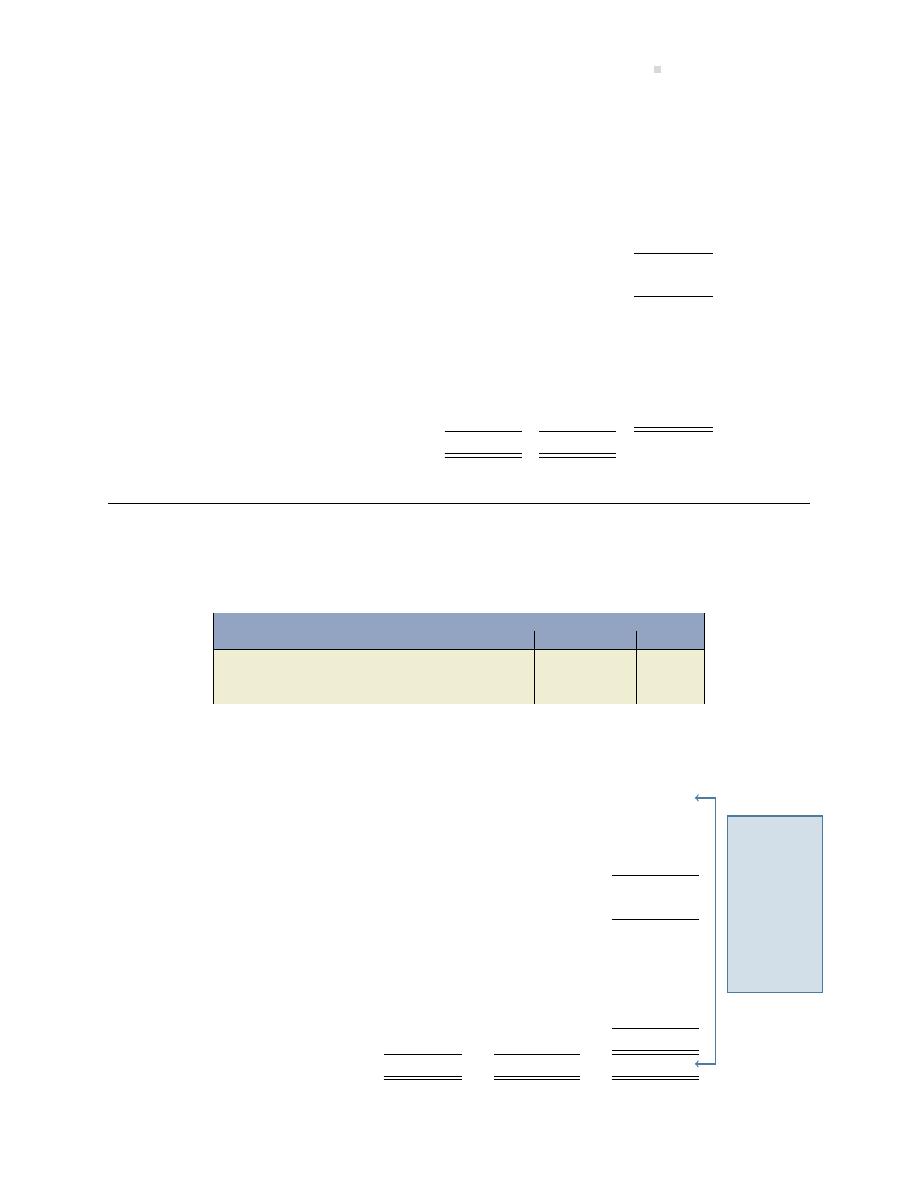
Chapter 13 Solu ons
693
To allocate net income as follows:
White
Green
Total
Profit to be allocated
$52,600
Interest alloca on:
White: $20,000
× 10%
$ 2,000
Green: $10,000
× 10%
$1,000
(3,000)
Balance
49,600
Salary alloca on:
30,000
10,000
(40,000)
Balance
9,600
Balance allocated in profit and
loss sharing ra o:
White: $9,600
× 3/5
5,760
Green: $9,600
× 2/5
3,840
(9,600)
Balance
$ -0-
Total allocated to partners
$37,760
$14,840
EXERCISE 13–4
a. The journal entry is as follows:
General Journal
Date
Account/Explana on
PR
Debit
Credit
Income Summary . . . . . . . . . . . . . . . . . . . . . .
210,000
Walsh, Capital . . . . . . . . . . . . . . . . . . . . . .
85,250
Abraham, Capital . . . . . . . . . . . . . . . . . . .
124,750
Calcula ons to allocate net income:
Walsh
Abraham
Total
Net income to be allocated
$210,000
Interest alloca on:
Walsh: $320,000
× 10%
$32,000
Abraham: $400,000
× 10%
$40,000
(72,000)
Balance
138,000
Salary alloca on:
75,000
150,000
(225,000)
Balance
(87,000)
Balance allocated in profit and
loss sharing ra o:
Walsh: ($87,000)
× 1/4
(21,750)
Abraham: ($87,000)
× 3/4
(65,250)
87,000
Balance
$
-0-
Total allocated to partners
$85,250 +
$124,750 =
$210,000
The total
actually al-
located of
$210,000
must equal
the net
income
ini ally re-
quired to
be allo-
cated of
$210,000.
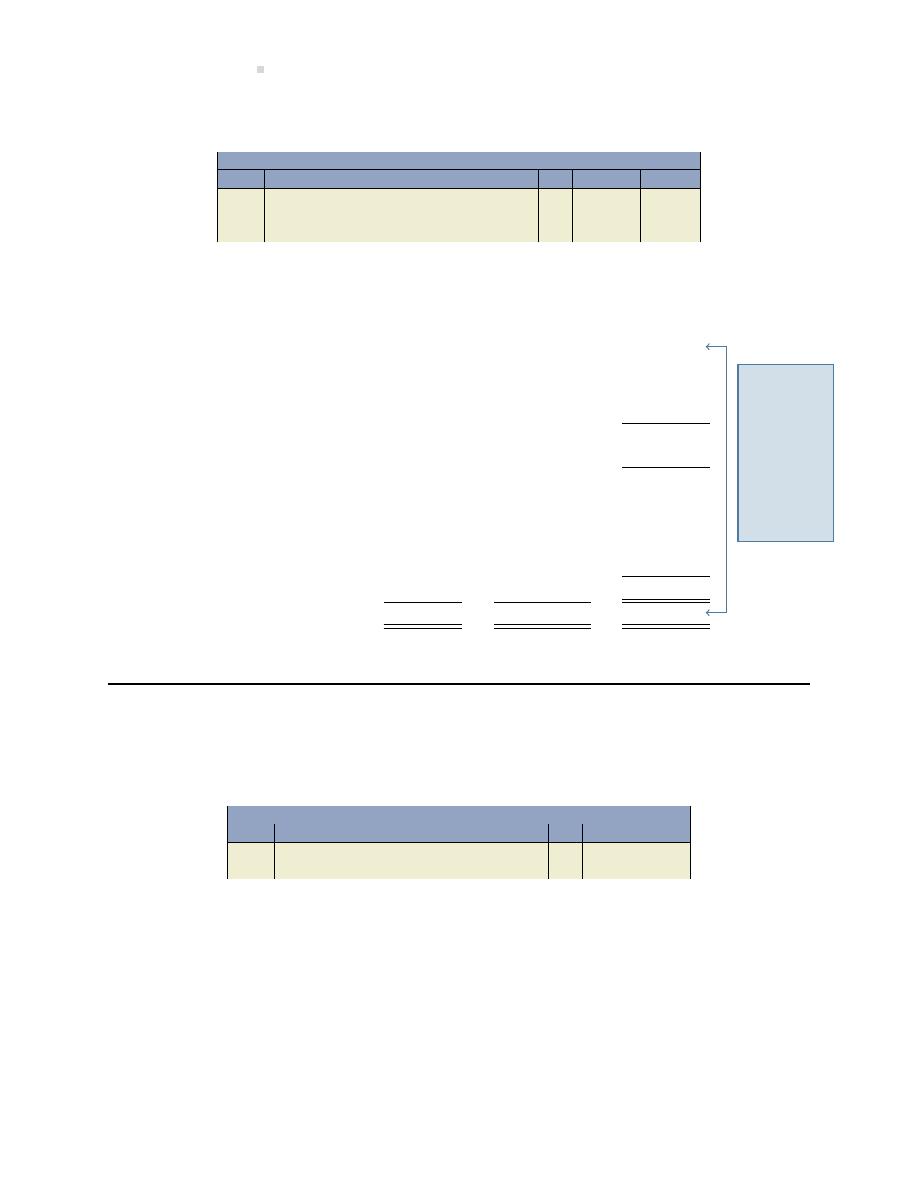
694
Solu ons To Exercises
b. The journal entry is as follows:
General Journal
Date
Account/Explana on
PR
Debit
Credit
C. Abraham, Capital . . . . . . . . . . . . . . . . . . . .
104,000
B. Walsh, Capital . . . . . . . . . . . . . . . . . . . .
9,000
Income Summary . . . . . . . . . . . . . . . . . . .
95,000
Calcula ons to allocate net loss:
Walsh
Abraham
Total
Net income to be allocated
$(95,000)
Interest alloca on:
Walsh: $320,000
× 10%
$32,000
Abraham: $400,000
× 10%
$40,000
(72,000)
Balance
(167,000)
Salary alloca on:
75,000
150,000
(225,000)
Balance
(392,000)
Balance allocated in profit and
loss sharing ra o:
Walsh: ($392,000)
× 1/4
(98,000)
Abraham: ($392,000)
× 3/4
(294,000)
392,000
Balance
$ -0-
Total allocated to partners
$9,000 +
$(104,000) =
$(95,000)
The total
actually al-
located of
$210,000
must equal
the net
income
ini ally re-
quired to
be allo-
cated of
$210,000.
EXERCISE 13–5
a. An adjus ng entry is needed to reallocate personal income taxes:
General Journal
Date
Account/Explana on
PR
Debit
Credit
Proprietor’s Withdrawals . . . . . . . . . . . . . . .
5,000
Income Taxes Expense . . . . . . . . . . . . . . .
5,000
The statement of profit and loss would then appear as follows:

Chapter 13 Solu ons
695
R. Black Proprietorship
Income Statement
For the Year Ended December 31, 2018
Sales
$ 166,000
Cost of goods sold
100,000
Gross profit
66,000
Opera ng expenses
Rent
24,000
Net income
$ 42,000
b.
R. Black Proprietorship
Statement of Proprietor’s Capital
For the Year Ended December 31, 2018
Balance at Jan 1, 2018 (derived)
$
-0-
Contribu ons
5,000
Net income
42,000
Withdrawals
(12,000)
Balance at Dec 31, 2018
$ 35,000
c.
R. Black Proprietorship
Balance Sheet
At December 31, 2018
Assets
Current
Cash
$10,000
Accounts receivable
20,000
Inventory
30,000
Total assets
$60,000
Liabili es
Current
Accounts payable
$25,000
Proprietor’s Capital
R. Black, capital
35,000
Total liabili es and proprietor’s capital
$60,000
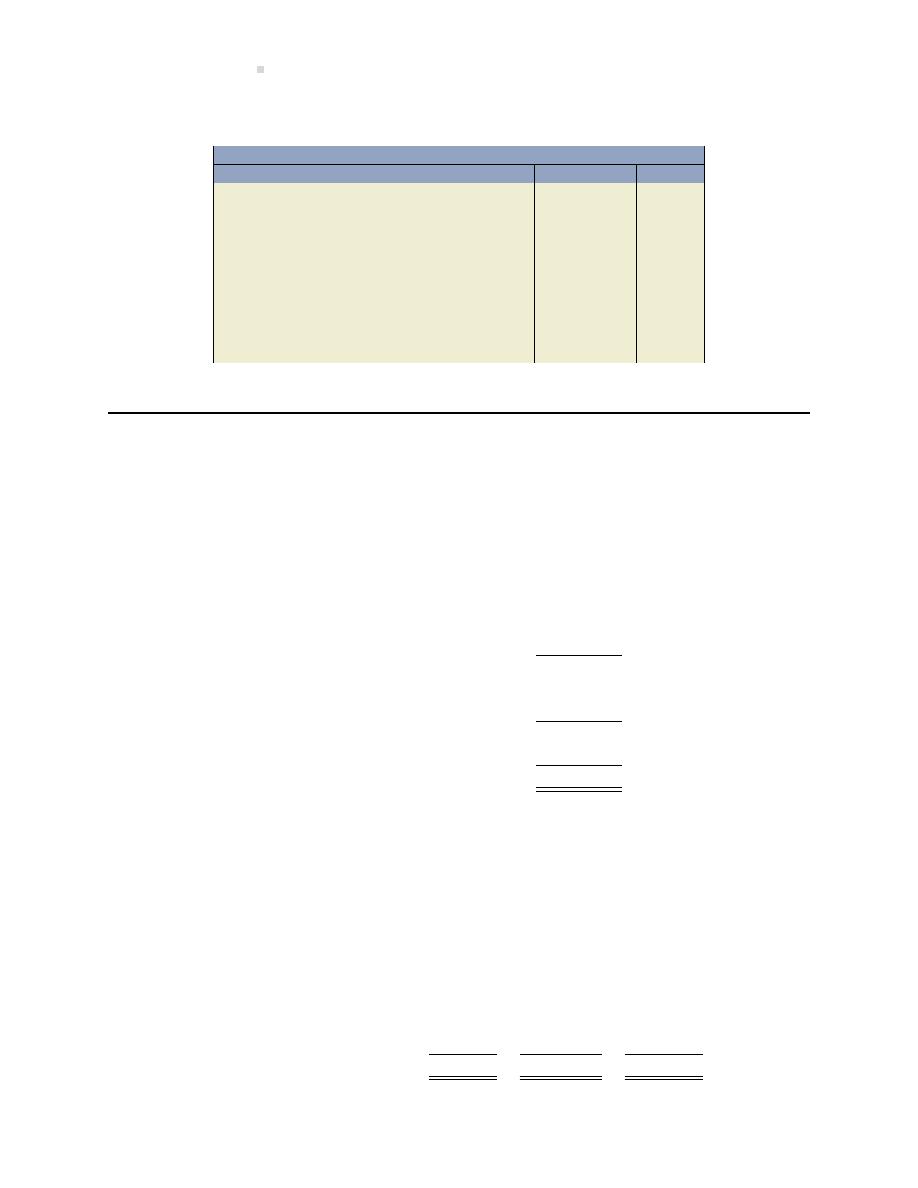
696
Solu ons To Exercises
d.
General Journal
Date
Account/Explana on
PR
Debit
Credit
Sales . . . . . . . . . . . . . . . . . . . . . . . . . . . . . . . . . .
166,000
Cost of Goods Sold . . . . . . . . . . . . . . . . . .
100,000
Rent Expense . . . . . . . . . . . . . . . . . . . . . . .
24,000
Income Summary . . . . . . . . . . . . . . . . . . .
42,000
Income Summary . . . . . . . . . . . . . . . . . . . . . .
42,000
R. Black, Capital . . . . . . . . . . . . . . . . . . . .
42,000
R. Black, Capital . . . . . . . . . . . . . . . . . . . . . . . .
12,000
R. Black, Withdrawals . . . . . . . . . . . . . . .
12,000
EXERCISE 13–6
a.
R. Black Ltd.
Income Statement
For the Year Ended December 31, 2018
Sales
$166,000
Cost of goods sold
100,000
Gross profit
66,000
Opera ng expenses
Rent
24,000
Income before income taxes
42,000
Income taxes
5,000
Net income
$ 37,000
b.
R. Black Ltd.
Statement of Changes in Equity
For the Year Ended December 31, 2018
Share
Retained
Total
Capital
Earnings
Equity
Balance at Jan 1, 2018
$5,000
$
-0-
$ 5,000
Net income
37,000
37,000
Dividends
(7,000)
(7,000)
Balance at Dec 31, 2018
$5,000
$ 30,000
$35,000
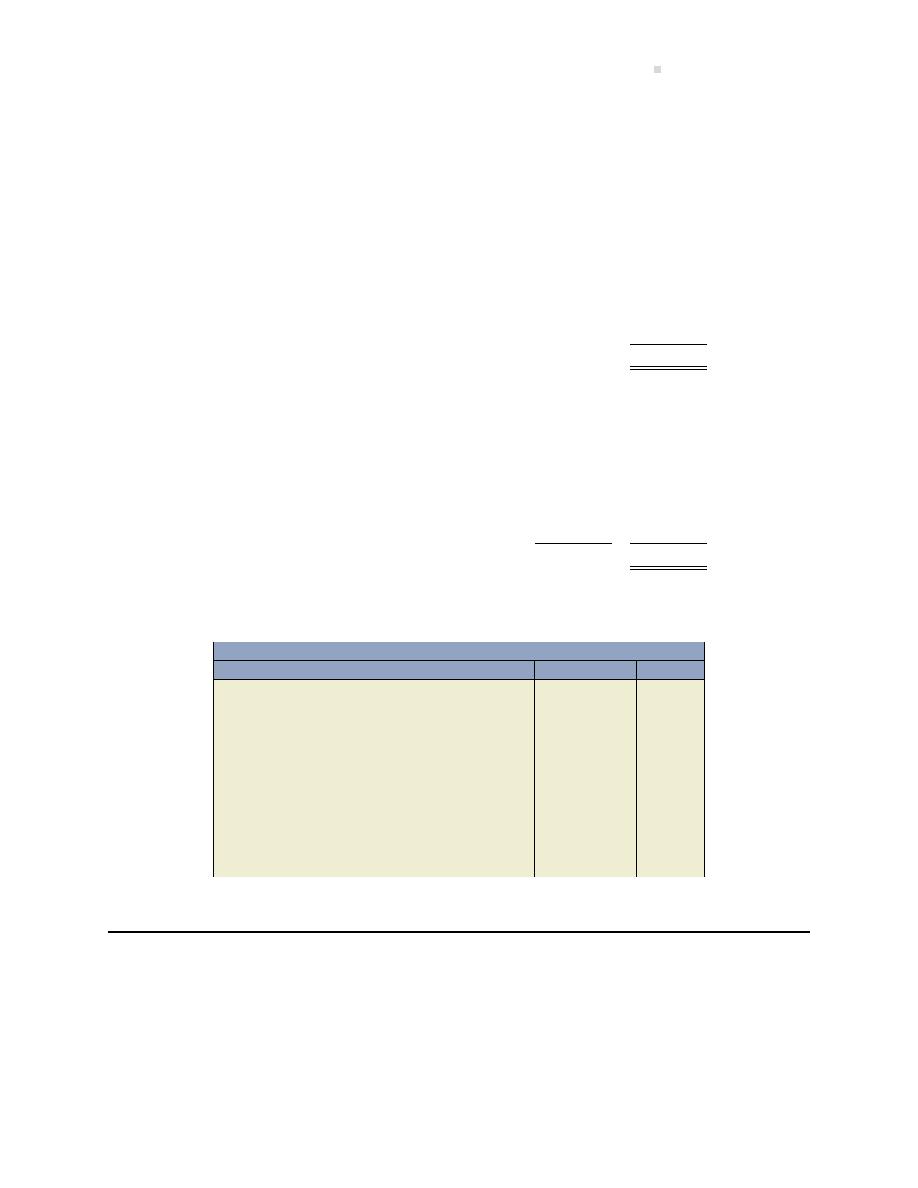
Chapter 13 Solu ons
697
c.
R. Black Ltd.
Balance Sheet
At December 31, 2018
Assets
Current
Cash
$10,000
Accounts receivable
20,000
Inventory
30,000
Total assets
$60,000
Liabili es
Current
Accounts payable
$25,000
Shareholders’ Equity
Share capital
$ 5,000
Retained earnings
30,000
35,000
Total liabili es and shareholders’ equity
$60,000
d.
General Journal
Date
Account/Explana on
PR
Debit
Credit
Sales . . . . . . . . . . . . . . . . . . . . . . . . . . . . . . . . . .
166,000
Cost of Goods Sold . . . . . . . . . . . . . . . . . .
100,000
Rent Expense . . . . . . . . . . . . . . . . . . . . . . .
24,000
Income Taxes Expense . . . . . . . . . . . . . . .
5,000
Income Summary . . . . . . . . . . . . . . . . . . .
37,000
Income Summary . . . . . . . . . . . . . . . . . . . . . .
37,000
Retained Earnings . . . . . . . . . . . . . . . . . . .
37,000
Income Summary . . . . . . . . . . . . . . . . . . . . . .
7,000
Dividends . . . . . . . . . . . . . . . . . . . . . . . . . .
7,000
EXERCISE 13–7
a.
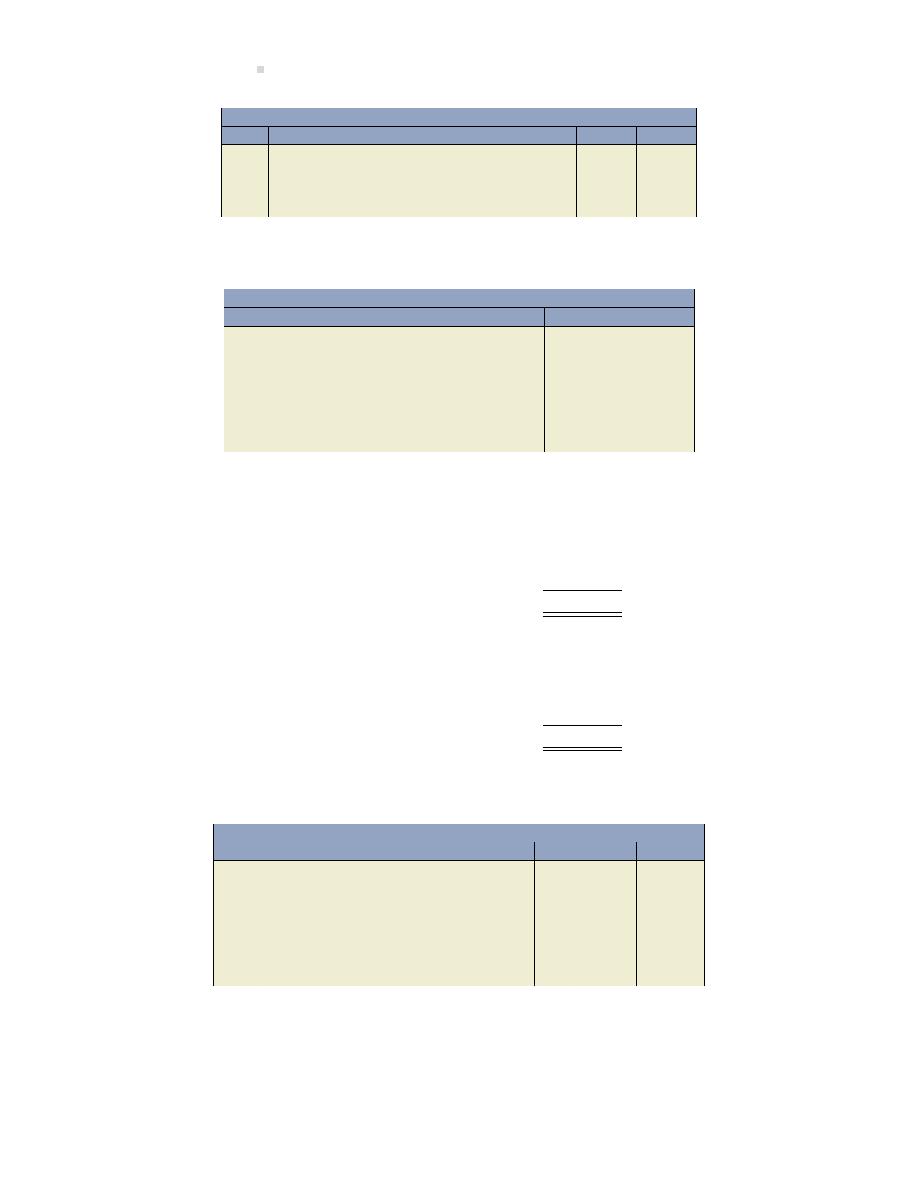
698
Solu ons To Exercises
General Journal
Date
Account/Explana on
PR
Debit
Credit
G, Capital . . . . . . . . . . . . . . . . . . . . . . . . . . . . .
30,000
I, Capital . . . . . . . . . . . . . . . . . . . . . . . . . . .
30,000
To record transfer of G’s partnership inter-
est to new partner I.
b.
General Journal
Date
Account/Explana on
PR
Debit
Credit
G, Capital ($30,000
− 17,100) . . . . . . . . . . .
12,900
H, Capital ($10,000
− 17,100) . . . . . . . .
7,100
I, Capital . . . . . . . . . . . . . . . . . . . . . . . . . . .
3,800
Cash . . . . . . . . . . . . . . . . . . . . . . . . . . . . . . .
2,000
To record payment of bonus to new part-
ner I and realloca on of partnership inter-
est.
Interest calcula ons:
G, Capital
$30,000
H, Capital
10,000
Bonus payment
(2,000)
Capital of new partnership
$38,000
Allocated as:
G (45%)
$17,100
H (45%)
17,100
I (10%)
3,800
$38,000
c.
General Journal
Date
Account/Explana on
PR
Debit
Credit
Land . . . . . . . . . . . . . . . . . . . . . . . . . . . . . . . . . .
100,000
G, Capital ($30,000
− 28,000) . . . . . . . . . . .
2,000
H, Capital ($10,000
− 7,000) . . . . . . . . . . . .
3,000
I, Capital . . . . . . . . . . . . . . . . . . . . . . . . . . .
105,000
To record contribu on of assets by new
partner I and realloca on of partnership
interest.
Interest calcula ons:
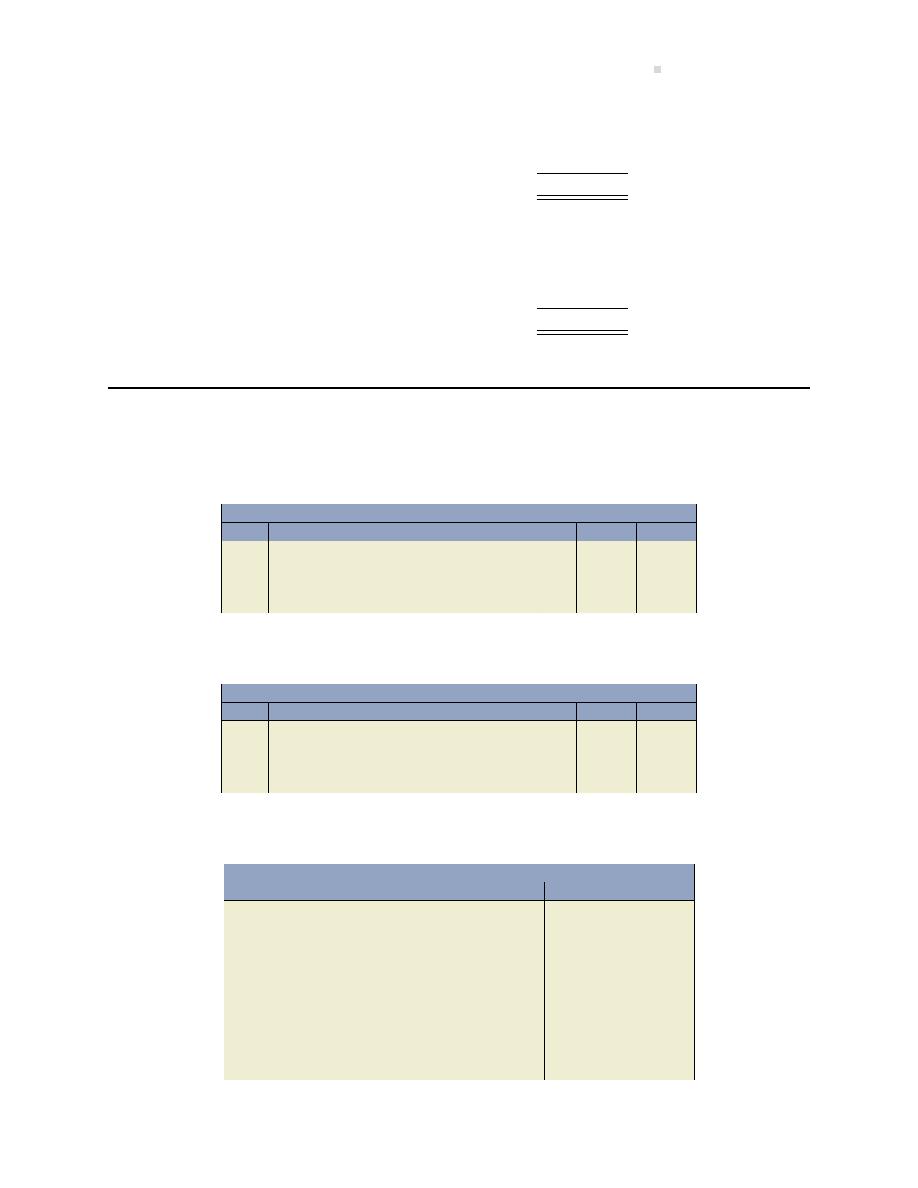
Chapter 13 Solu ons
699
G, Capital
$ 30,000
H, Capital
10,000
I, Investment
100,000)
Capital of new partnership
$ 140,000
Allocated as:
G (20%)
$ 28,000
H (5%)
7,000
I (75%)
105,000
$ 140,000
EXERCISE 13–8
a.
General Journal
Date
Account/Explana on
PR
Debit
Credit
X, Capital . . . . . . . . . . . . . . . . . . . . . . . . . . . . . .
10,000
T, Capital . . . . . . . . . . . . . . . . . . . . . . . . . . .
10,000
To record transfer of X’s partnership inter-
est to new partner T.
b.
General Journal
Date
Account/Explana on
PR
Debit
Credit
X, Capital . . . . . . . . . . . . . . . . . . . . . . . . . . . . . .
10,000
Y, Capital . . . . . . . . . . . . . . . . . . . . . . . . . . .
10,000
To record transfer of X’s partnership inter-
est to exis ng partner Y.
c.
General Journal
Date
Account/Explana on
PR
Debit
Credit
X, Capital . . . . . . . . . . . . . . . . . . . . . . . . . . . . . .
10,000
Accounts Payable . . . . . . . . . . . . . . . . . . . . . .
2,000
Y, Capital . . . . . . . . . . . . . . . . . . . . . . . . . . .
1,200
Z, Capital . . . . . . . . . . . . . . . . . . . . . . . . . . .
800
Cash . . . . . . . . . . . . . . . . . . . . . . . . . . . . . . .
5,000
Inventory . . . . . . . . . . . . . . . . . . . . . . . . . .
5,000
To record dispersal of partnership net as-
sets to withdrawing partner X and transfer
of X’s partnership interest to exis ng part-
ners Y and Z.
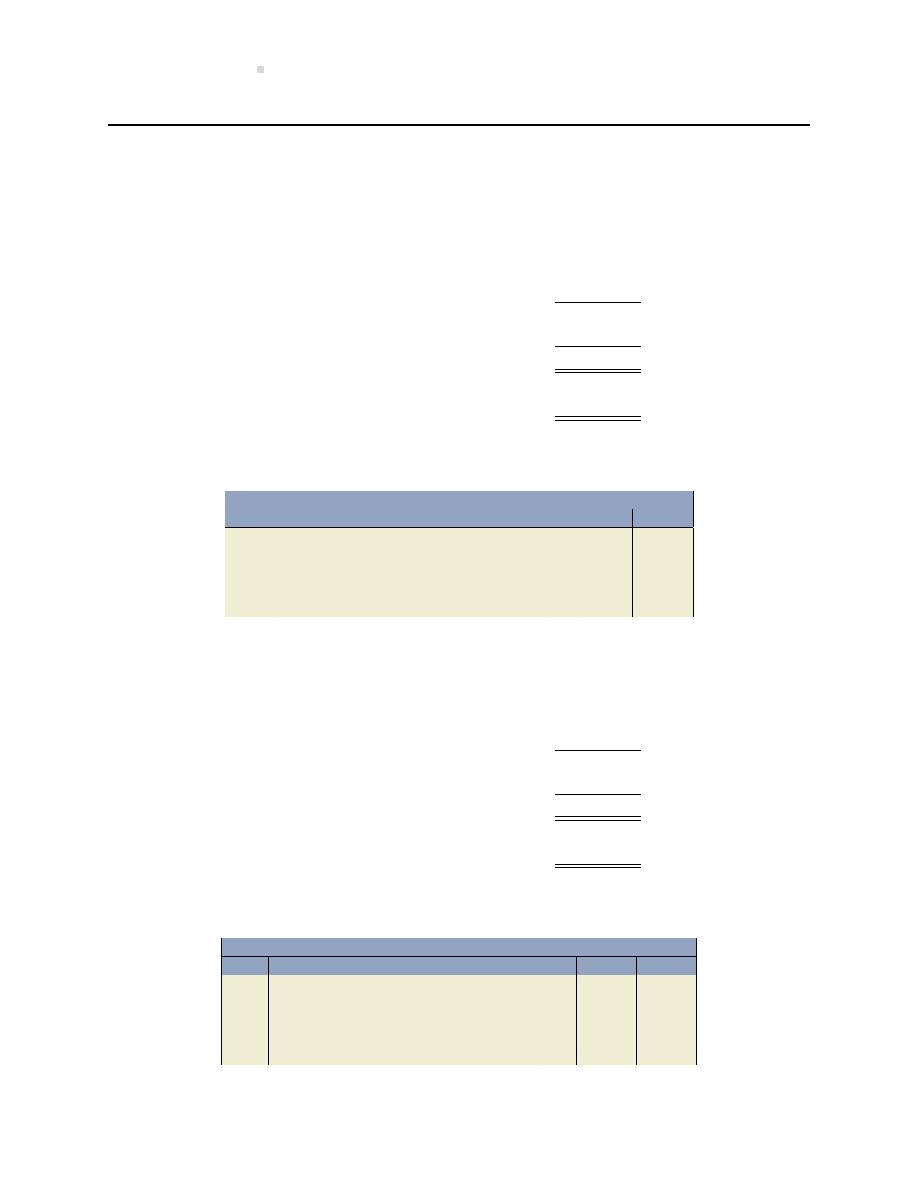
700
Solu ons To Exercises
EXERCISE 13–9
a.
Smith, capital
$ 50,000
Jones, capital
40,000
Black, capital
10,000
Exis ng capital
100,000
Investment by Gray
5,000
Capital of new partnership (a)
$105,000
Mood’s capital ($105,000
× 25%)
$ 26,250
The new partner’s bonus is recorded as:
General Journal
Date
Account/Explana on
PR
Debit
Credit
Cash . . . . . . . . . . . . . . . . . . . . . . . . . . . . . . . . . .
5,000
Smith, Capital. . . . . . . . . . . . . . . . . . . . . . . . . .
7,083
Jones, Capital . . . . . . . . . . . . . . . . . . . . . . . . . .
7,083
Black, Capital . . . . . . . . . . . . . . . . . . . . . . . . . .
7,084
Gray, Capital . . . . . . . . . . . . . . . . . . . . . . . .
26,250
b.
Smith, capital
$ 50,000
Jones, capital
40,000
Black, capital
10,000
Exis ng capital
100,000
Investment by Gray
60,000
Capital of new partnership (a)
$160,000
Mood’s capital ($160,000
× 25%)
$ 40,000
The bonus to exis ng partners is recorded as:
General Journal
Date
Account/Explana on
PR
Debit
Credit
Cash . . . . . . . . . . . . . . . . . . . . . . . . . . . . . . . . . .
60,000
Smith, Capital . . . . . . . . . . . . . . . . . . . . . .
6,667
Jones, Capital . . . . . . . . . . . . . . . . . . . . . .
6,667
Black, Capital . . . . . . . . . . . . . . . . . . . . . . .
6,666
Gray, Capital . . . . . . . . . . . . . . . . . . . . . . . .
40,000

Solu ons To Problems
Chapter 1 Solu ons
PROBLEM 1–1
Dumont Inc.
Balance Sheet
Dumont Inc.
At January 31, 2015
Income Statement
For the Month Ended January 31, 2015
Assets
Cash
$1,300
Revenue
Accounts receivable
2,400
Service revenue
$7,500
Prepaid expenses
550
Unused supplies
750
Expenses
Truck
9,000
Adver sing expense
$500
Total assets
$14,000
Commissions expense
720
Insurance expense
50
Interest expense
80
Liabili es
Rent expense
400
Bank loan
$8,000
Supplies expense
100
Accounts payable
1,000
Telephone expense
150
Total liabili es
9,000
Wages expense
2,500
Equity
Total expenses
4,500
Share capital
$2,000
Net income
$3,000
Retained earnings
3,000
Total equity
5,000
Total liabili es and equity
$14,000
Dumont Inc.
Statement of Changes in Equity
For the Month Ended January 31, 2015
Share
Retained
Total
Capital
Earnings
Equity
Opening balance
$
-0-
$
-0-
$
-0-
Shares issued
2,000
-0-
2,000
Net income
-0-
3,000
3,000
Ending balance
$2,000
$3,000
$5,000
701

702
Solu ons To Problems
PROBLEM 1–2
1. The income statement and statement of changes in equity are as follows:
Laberge Sheathing Inc.
Balance Sheet
August 31, 2015
Laberge Sheathing Inc.
Income Statement
Assets
For the Month Ended August 31, 2015
Cash
$400
Accounts receivable
3,800
Revenue
Unused supplies
100
Service revenue
$2,000
Equipment
8,700
Total assets
$13,000
Expenses
Adver sing expense
$300
Interest expense
500
Liabili es
Maintenance expense
475
Accounts payable
$7,800
Supplies expense
125
Wages expense
2,600
Equity
Total expenses
4,000
Share capital
3,200
Net loss
$2,000
Retained earnings
2,000
5,200
Total liabili es and equity
$13,000
Laberge Sheathing Inc.
Statement of Changes in Equity
Month Ended August 31, 2015
Share
Retained
Total
Capital
Earnings
Equity
Opening balance
$3,200
$4,000
$7,200
Net loss
-0-
(2,000)
(2,000)
Ending balance
$3,200
$2,000
$5,200
2. The percentage of assets financed by equity is 40% calculated as (5,200/13,000)
× 100.
Although part 2 of this ques on did not require that the percentage of assets financed by
debt be calculated, it is 60% calculated as 100%
− 40%.
PROBLEM 1–3
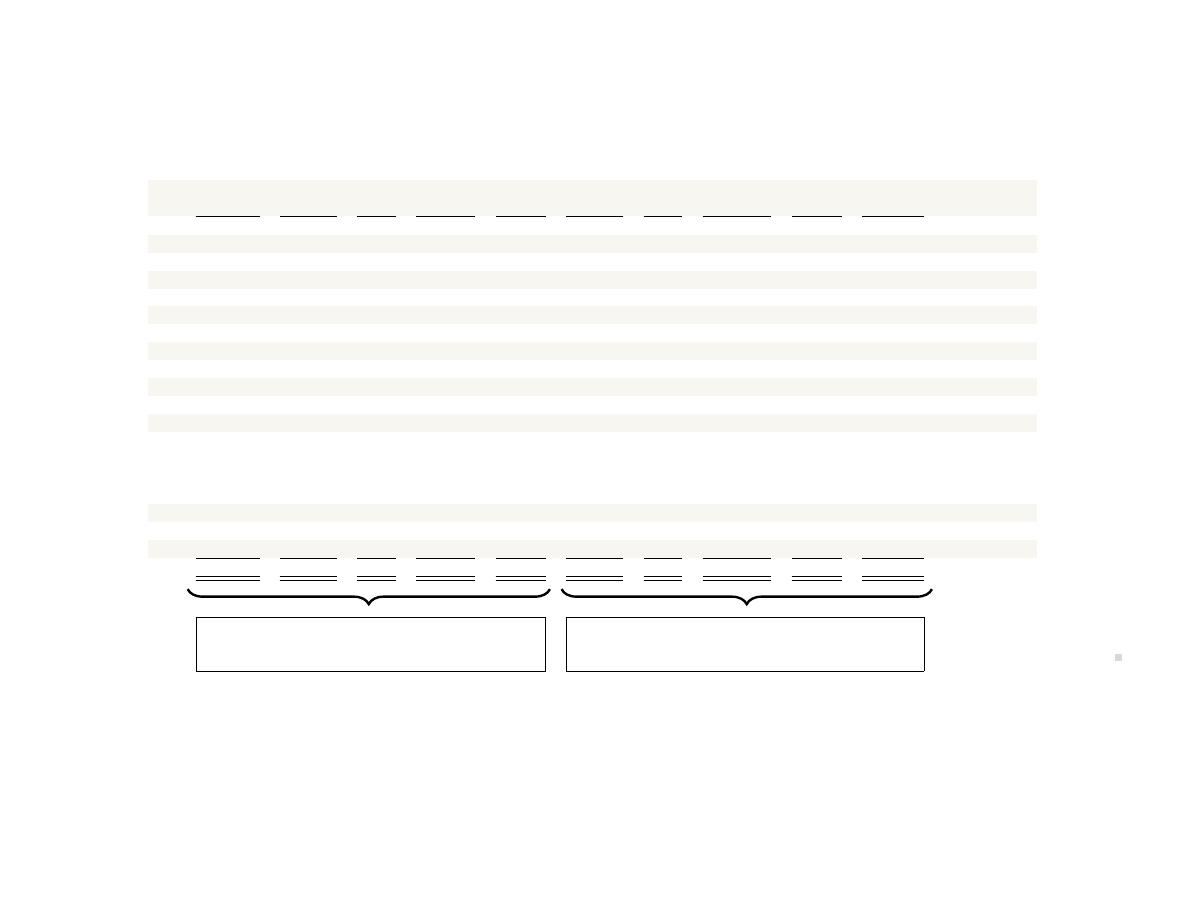
Chap
ter
1
Soluons
703
Larson Services Inc.
Transac ons Worksheet
At August 31, 2015
ASSETS
=
LIABILITIES
+
EQUITY
Acct.
Ppd.
Unused
Bank
Acct.
Unearned
Share
Retained
Cash
+
Rec.
+
Exp. + Supplies + Truck =
Loan
+
Pay + Revenue + Capital + Earnings
Aug. 1
+3,000
+3,000
1 +10,000
+10,000
1
-8,000
+8,000
3 No effect
4
-600
+600
5
+2,000
+2,000
7
+5,000
+5,000 Fees earned
9
-250
-250
Supplies expense
12
+500
+500
15
+1,000
-1,000
16
-200
-200
Adver sing
20
-250
-250
25
-2,800
-350
Rent expense
-2,150
Salaries
-50
Telephone
-250
Truck opera on
28 No Effect
29
+6,000
+6,000 Fees earned
31
-500
+500
Fees earned
$3,900
+
$10,000 + $600 +
$500
+
$8,000 = $10,000 + $250 +
$1,500
+
$3,000 + $8,250
Assets = $23,000
Liabili es + Equity = $23,000

704
Solu ons To Problems
PROBLEM 1–4
Larson Services Inc.
Balance Sheet
At August 31, 2015
Larson Services Inc.
Income Statement
Assets
For the Month Ended August 31, 2015
Cash
$3,900
Accounts receivable
10,000
Prepaid expenses
600
Revenues
Unused supplies
500
Fees earned
$11,500
Truck
8,000
Total assets
$23,000
Expenses
Adver sing expense
$200
Liabili es
Rent expense
350
Bank loan
$10,000
Salaries expense
2,150
Accounts payable
250
Supplies expense
250
Unearned revenue
1,500
Telephone expense
50
Total liabili es
11,750
Truck opera on expense
250
Total expenses
3,250
Equity
Net income
$8,250
Share capital
3,000
Retained earnings
8,250
Total equity
11,250
Total liabili es and equity
$23,000
Larson Services Inc.
Statement of Changes in Equity
For the Month Ended August 31, 2015
Share
Retained
Total
Capital
Earnings
Equity
Opening balance
$ -0-
$
-0-
$
-0-
Shares issued
3,000
-0-
3,000
Net income
-0-
8,250
8,250
Ending balance
$3,000
$8,250
$11,250
PROBLEM 1–5
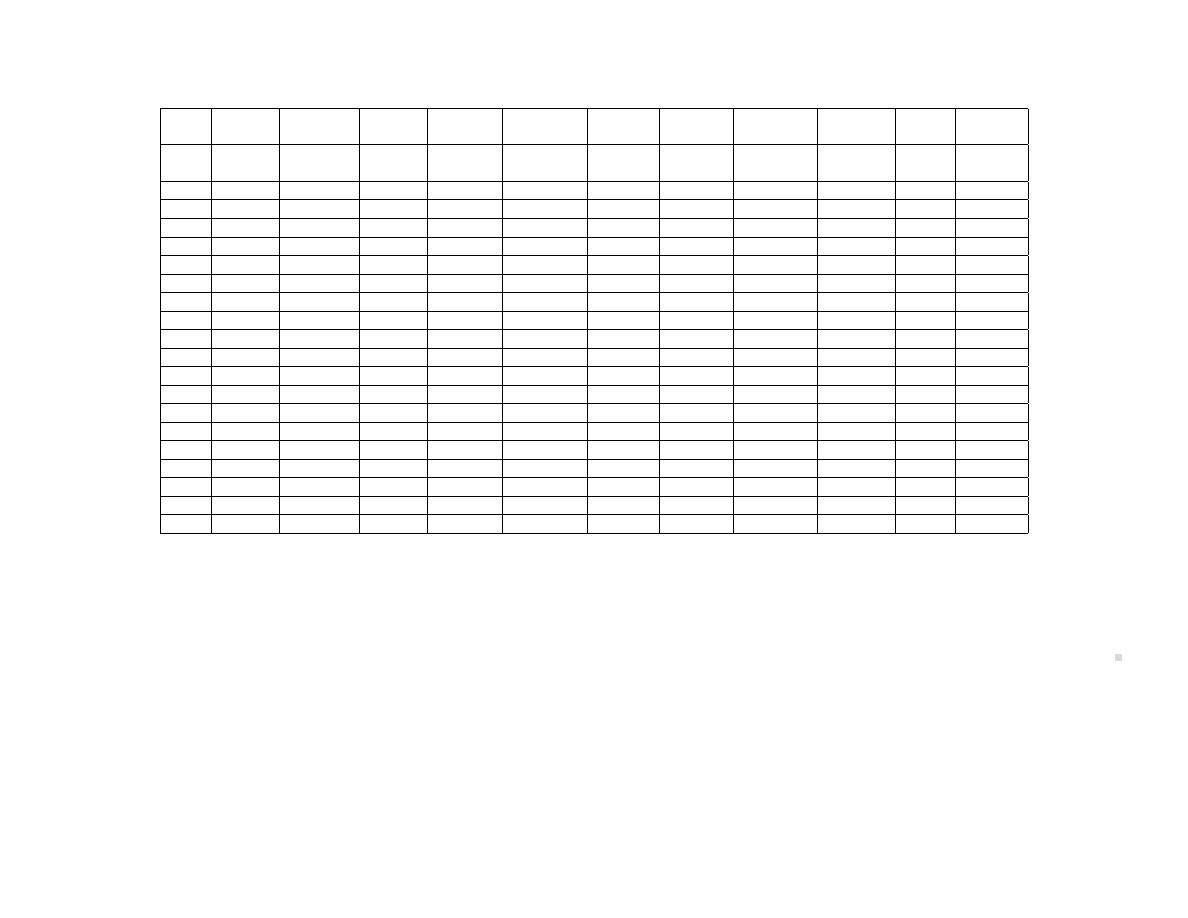
Chap
ter
1
Soluons
705
Cash
Accounts
Office
Prepaid
Equipment
Office
Accounts
Note/Loan
Unearned
Share
Retained
receivable
supplies
expenses
furniture
payable
payable
revenue
capital
earnings
Open
+10,000
+25,000
+2,000
0
+25,000
+15,000
+35,000
0
0
+8,000
+34,000
Bal
1
+5,000
+5,000
2
-5,000
-5,000
3
+3,000
+3,000
4
+27,000
+27,000
5
+3,000
+3,000
6
7
+300
-300
8
+20,000
+20,000
9
-8,000
-8,000
10
-3,000
-3,000
11
+25,000
+25,000
12
+25,000
-25,000
13
14
15
-3,500
-3,500
16
-5,000
+5,000
17
-50
-50
18
+3,000
+3,000
Bal
+35,450
+52,000
+5,000
+5,000
+28,000
+18,000
+33,300
+23,000
+5,000
+8,000
+74,150

706
Solu ons To Problems
PROBLEM 1–6
Olivier Bondar Ltd.
Balance Sheet
At May 31, 2016
Assets
Liabili es
Cash
$ 35,450
Accounts payable
$33,300
Accounts receivable
52,000
Note/Loan payable
23,000
Unearned revenue
5,000
Office supplies
5,000
Total liabili es
$ 61,300
Prepaid expenses
5,000
Equipment
28,000
Equity
Office furniture
18,000
Share capital
$ 8,000
Retained earnings
74,150
Total equity
82,150
Total assets
$143,450
Total liabili es and equity
$143,450
Chapter 2 Solu ons
PROBLEM 2–1
1. The trial balance is as follows:

Chapter 2 Solu ons
707
Fox Creek Service Limited
Trial Balance
At October 31, 2015
Account Balances
Debit
Credit
Cash
$1,000
Accounts Receivable
6,000
Equipment
7,000
Truck
9,000
Bank Loan
$5,000
Accounts Payable
9,000
Wages Payable
1,500
Share Capital
2,000
Repair Revenue
19,000
Adver sing Expense
2,200
Commissions Expense
4,500
Insurance Expense
500
Supplies Expense
800
Telephone Expense
250
Truck Opera on Expense
1,250
Wages Expense
4,000
$36,500
$36,500
2. The income statement and statement of changes in equity are as follows:
Fox Creek Service Limited
Income Statement
For the Year Ended October 31, 2015
Revenue
Repair revenue
$19,000
Expenses
Adver sing expense
$2,200
Commissions expense
4,500
Insurance expense
500
Supplies expense
800
Telephone expense
250
Truck opera on expense
1,250
Wages expense
4,000
Total expenses
13,500
Net income
$ 5,500

708
Solu ons To Problems
Fox Creek Service Limited
Statement of Changes in Equity
For the Year Ended October 31, 2015
Share
Retained
Total
Capital
Earnings
Equity
Opening Balance
$
-0-
$
-0-
$
-0-
Shares Issued
2,000
-0-
2,000
Net Income
-0-
5,500
5,500
Ending Balance
$2,000
$5,500
$7,500
3. The balance sheet is as follows:
Fox Creek Service Limited
Balance Sheet
At October 31, 2015
Assets
Cash
$ 1,000
Accounts receivable
6,000
Equipment
7,000
Truck
9,000
Total assets
$23,000
Liabili es
Bank loan
$5,000
Accounts payable
9,000
Wages payable
1,500
15,500
Equity
Share capital
2,000
Retained earnings
5,500
7,500
Total liabili es and equity
$23,000
PROBLEM 2–2
1. The general journal is as follows:
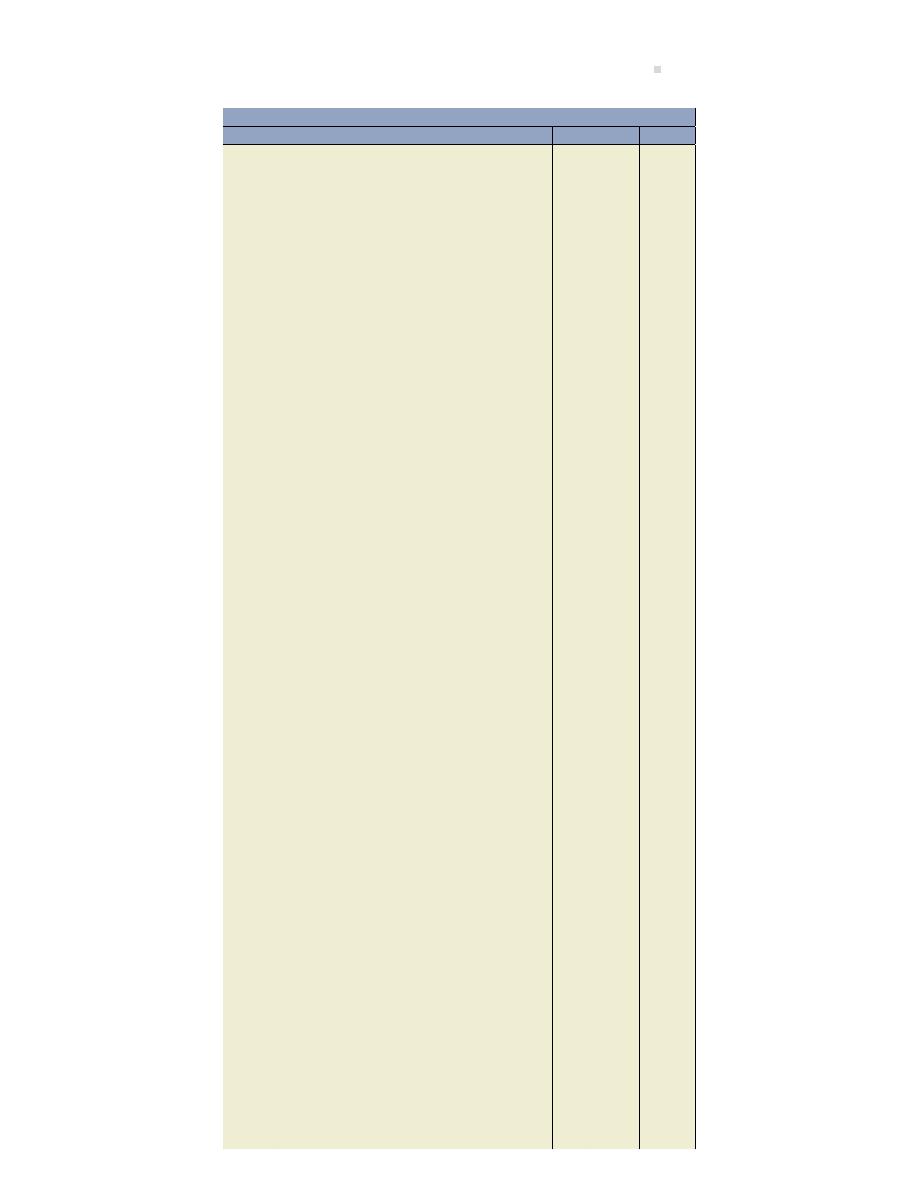
Chapter 2 Solu ons
709
General Journal
Date
Account/Explana on
PR
Debit
Credit
May 1
Cash . . . . . . . . . . . . . . . . . . . . . . . . . . . . . . . . . .
5,000
Share Capital . . . . . . . . . . . . . . . . . . . . . . .
5,000
To record issuance of share capital.
5
Accounts Receivable . . . . . . . . . . . . . . . . . . .
3,000
Service Revenue . . . . . . . . . . . . . . . . . . . .
3,000
To record billings to customers.
6
Cash . . . . . . . . . . . . . . . . . . . . . . . . . . . . . . . . . .
2,000
Service Revenue . . . . . . . . . . . . . . . . . . . .
2,000
To record cash payment by customers for
work completed.
10
Cash . . . . . . . . . . . . . . . . . . . . . . . . . . . . . . . . . .
1,500
Accounts Receivable . . . . . . . . . . . . . . . .
1,500
To record collec ons on account.
11
Equipment . . . . . . . . . . . . . . . . . . . . . . . . . . . .
2,000
Cash . . . . . . . . . . . . . . . . . . . . . . . . . . . . . . .
1,000
Accounts Payable . . . . . . . . . . . . . . . . . . .
1,000
To record purchase of equipment par ally
paid by cash, remainder on account.
15
Cash . . . . . . . . . . . . . . . . . . . . . . . . . . . . . . . . . .
1,200
Accounts Receivable . . . . . . . . . . . . . . . .
1,200
To record payment received on account.
16
Prepaid Adver sing . . . . . . . . . . . . . . . . . . . .
500
Cash . . . . . . . . . . . . . . . . . . . . . . . . . . . . . . .
500
To record payment of adver sing in ad-
vance.
18
Accounts Receivable . . . . . . . . . . . . . . . . . . .
2,500
Service Revenue . . . . . . . . . . . . . . . . . . . .
2,500
To record billings to customers.
20
Unused Supplies . . . . . . . . . . . . . . . . . . . . . . .
300
Cash . . . . . . . . . . . . . . . . . . . . . . . . . . . . . . .
300
To record purchase of supplies for inven-
tory.
21
Cash . . . . . . . . . . . . . . . . . . . . . . . . . . . . . . . . . .
800
Equipment . . . . . . . . . . . . . . . . . . . . . . . . .
800
To record sale of equipment at cost.
22
Accounts Payable . . . . . . . . . . . . . . . . . . . . . .
600
Cash . . . . . . . . . . . . . . . . . . . . . . . . . . . . . . .
600
To record payment of amounts owing.
23
Telephone Expense . . . . . . . . . . . . . . . . . . . . .
150
Accounts Payable . . . . . . . . . . . . . . . . . . .
150
To record receipt of telephone bill.
24
Commissions Expense . . . . . . . . . . . . . . . . . .
1,100
Accounts Payable . . . . . . . . . . . . . . . . . . .
1,100
To record receipt of commissions bill.
28
Rent Expense . . . . . . . . . . . . . . . . . . . . . . . . . .
400
Cash . . . . . . . . . . . . . . . . . . . . . . . . . . . . . . .
400
To record payment of rent for May.
29
Salaries Expense . . . . . . . . . . . . . . . . . . . . . . .
3,500
Cash . . . . . . . . . . . . . . . . . . . . . . . . . . . . . . .
3,500
To record payment of wages incurred.
30
Supplies Expense . . . . . . . . . . . . . . . . . . . . . .
100
Unused Supplies . . . . . . . . . . . . . . . . . . . .
100
To record supplies used during the month.
31
Adver sing Expense . . . . . . . . . . . . . . . . . . . .
250
Prepaid Adver sing . . . . . . . . . . . . . . . . .
250
To record expiry of prepaid adver sing.

710
Solu ons To Problems
2. The Trial Balance is as follows:
Davidson Tools Rentals Corpora on
Trial Balance
May 31, 2015
Account Balances
Debit
Credit
Cash
$4,200
Accounts Receivable
2,800
Prepaid Adver sing
250
Unused Supplies
200
Equipment
1,200
Accounts Payable
$1,650
Share Capital
5,000
Service Revenue
7,500
Adver sing Expense
250
Commissions Expense
1,100
Rent Expense
400
Supplies Expense
100
Salaries Expense
3,500
Telephone Expense
150
–
$14,150
$14,150
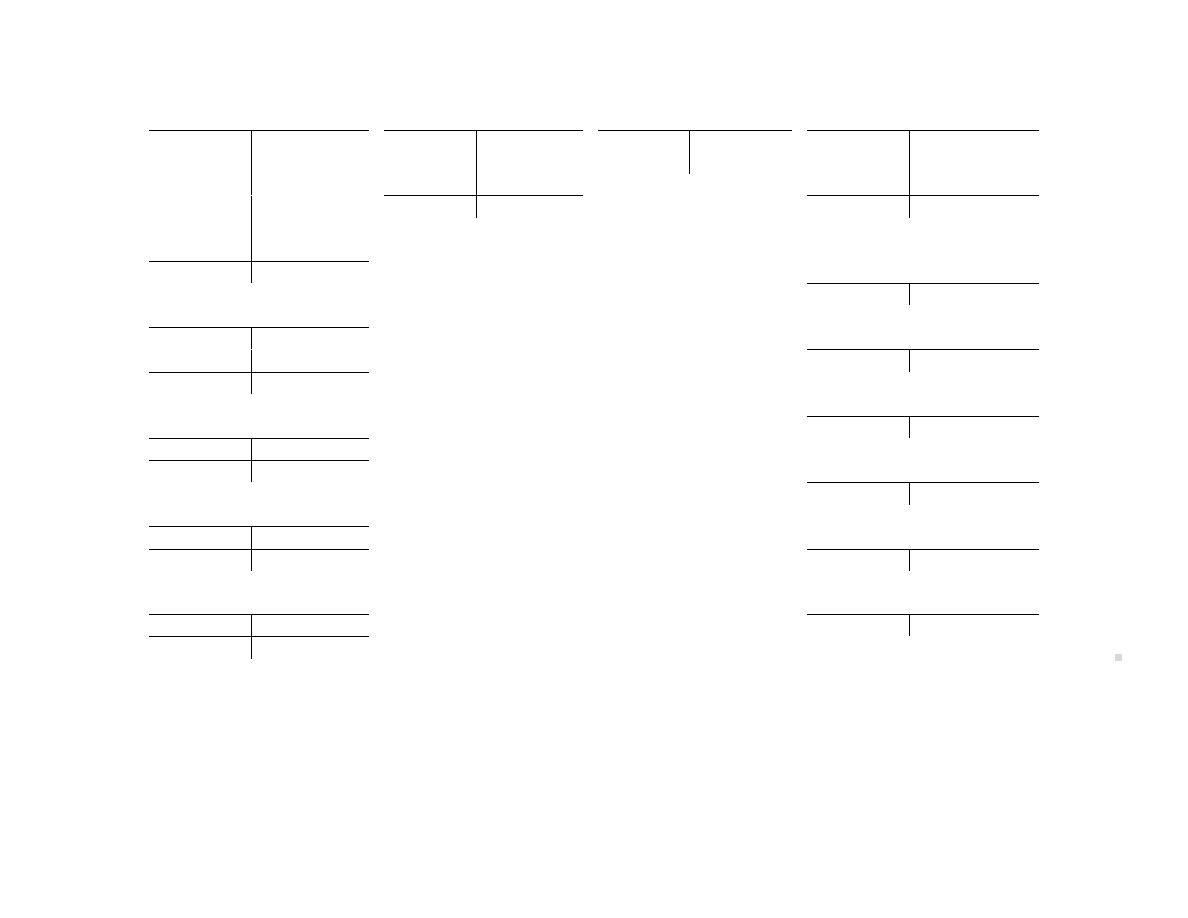
Chap
ter
2
Soluons
711
Cash
101
Accounts Payable
210
Share Capital
320
Service Revenue
460
5,000
1,000
600
1,000
5,000
3,000
2,000
500
150
2,000
1,500
300
1,100
2,500
1,200
600
Bal.
1,650
Bal.
7,500
800
400
–
3,500
Bal.
4,200
Adver sing Expense
610
250
Accounts Receivable
110
3,000
1,500
Commissions Expense
615
2,500
1,200
1,100
Bal.
2,800
Rent Expense
654
Prepaid Adver sing
160
400
500
250
Bal.
250
Salaries Expense
656
3,500
Unused Supplies
173
300
100
Supplies Expense
668
Bal.
200
100
Equipment
183
Telephone Expense
669
2,000
800
150
Bal.
1,200
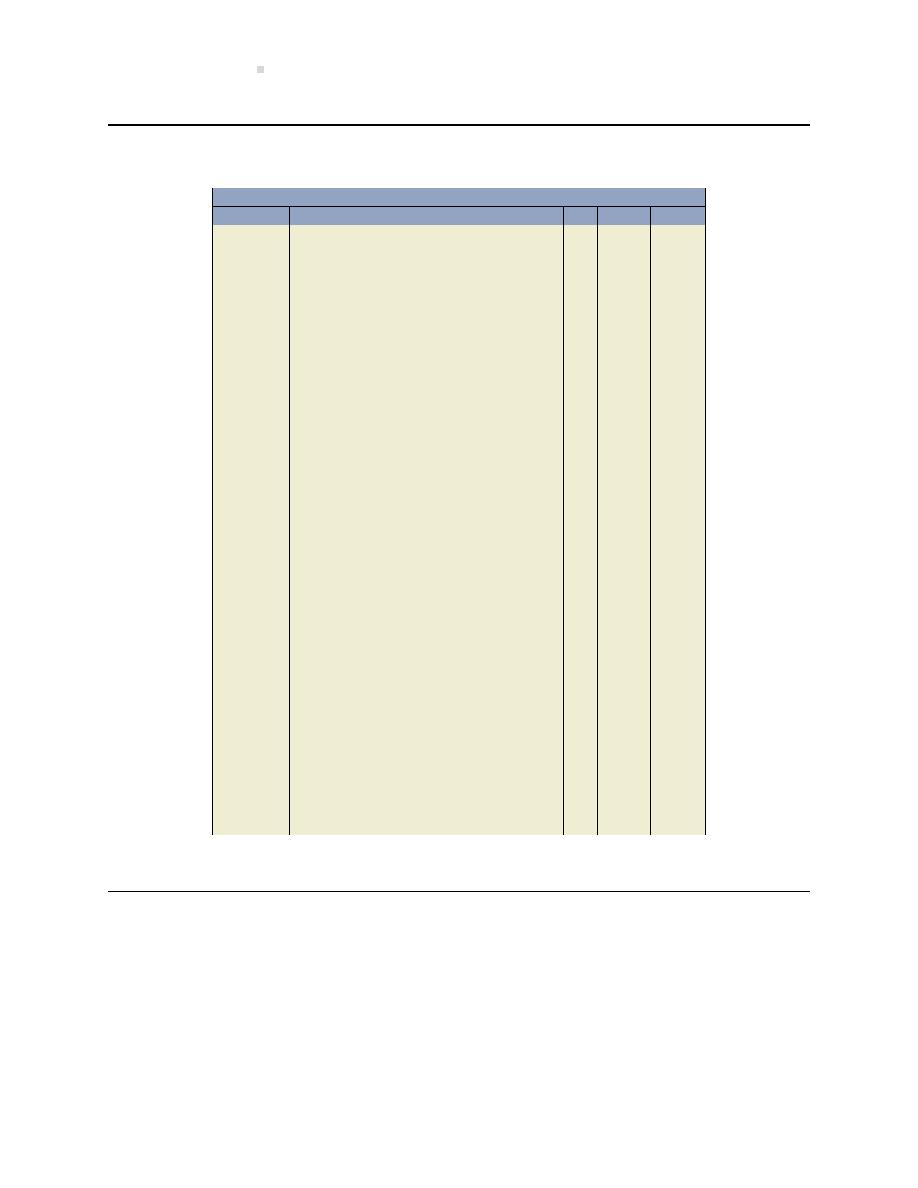
712
Solu ons To Problems
PROBLEM 2–3
General Journal
Date
Account/Explana on
PR
Debit
Credit
Apr. 2015
Cash . . . . . . . . . . . . . . . . . . . . . . . . . . . . . . . . . .
2,000
Accounts receivable . . . . . . . . . . . . . . . . .
2,000
(a) To record a collec on on account.
Accounts Receivable . . . . . . . . . . . . . . . . . . .
3,000
Service Revenue . . . . . . . . . . . . . . . . . . . .
3,000
(b) To record billings to customers.
Adver sing Expense . . . . . . . . . . . . . . . . . . . .
300
Salaries Expense . . . . . . . . . . . . . . . . . . . . . . .
2,000
Telephone Expense . . . . . . . . . . . . . . . . . . . . .
100
Cash . . . . . . . . . . . . . . . . . . . . . . . . . . . . . . .
2,400
(c) To record payment of expenses in-
curred.
Accounts payable . . . . . . . . . . . . . . . . . . . . . .
1,000
Cash . . . . . . . . . . . . . . . . . . . . . . . . . . . . . . .
1,000
(d) To record payment made on account.
Truck Opera on Expense . . . . . . . . . . . . . . .
500
Accounts Payable . . . . . . . . . . . . . . . . . . .
500
(e) To record bill received for truck repair
expense.
Cash . . . . . . . . . . . . . . . . . . . . . . . . . . . . . . . . . .
2,500
Accounts Receivable . . . . . . . . . . . . . . . .
2,500
(f) To record payment received on ac-
count.
Accounts Receivable . . . . . . . . . . . . . . . . . . .
1,500
Service revenue . . . . . . . . . . . . . . . . . . . .
1,500
(g) To record billings to customers.
Rent Expense . . . . . . . . . . . . . . . . . . . . . . . . . .
500
Prepaid Rent . . . . . . . . . . . . . . . . . . . . . . .
500
(h) To record expiry of a por on of prepaid
rent.
Supplies Expense . . . . . . . . . . . . . . . . . . . . . .
150
Unused Supplies . . . . . . . . . . . . . . . . . . . .
150
(i) To record supplies used, based on count
of unused supplies at end of month.
PROBLEM 2–4
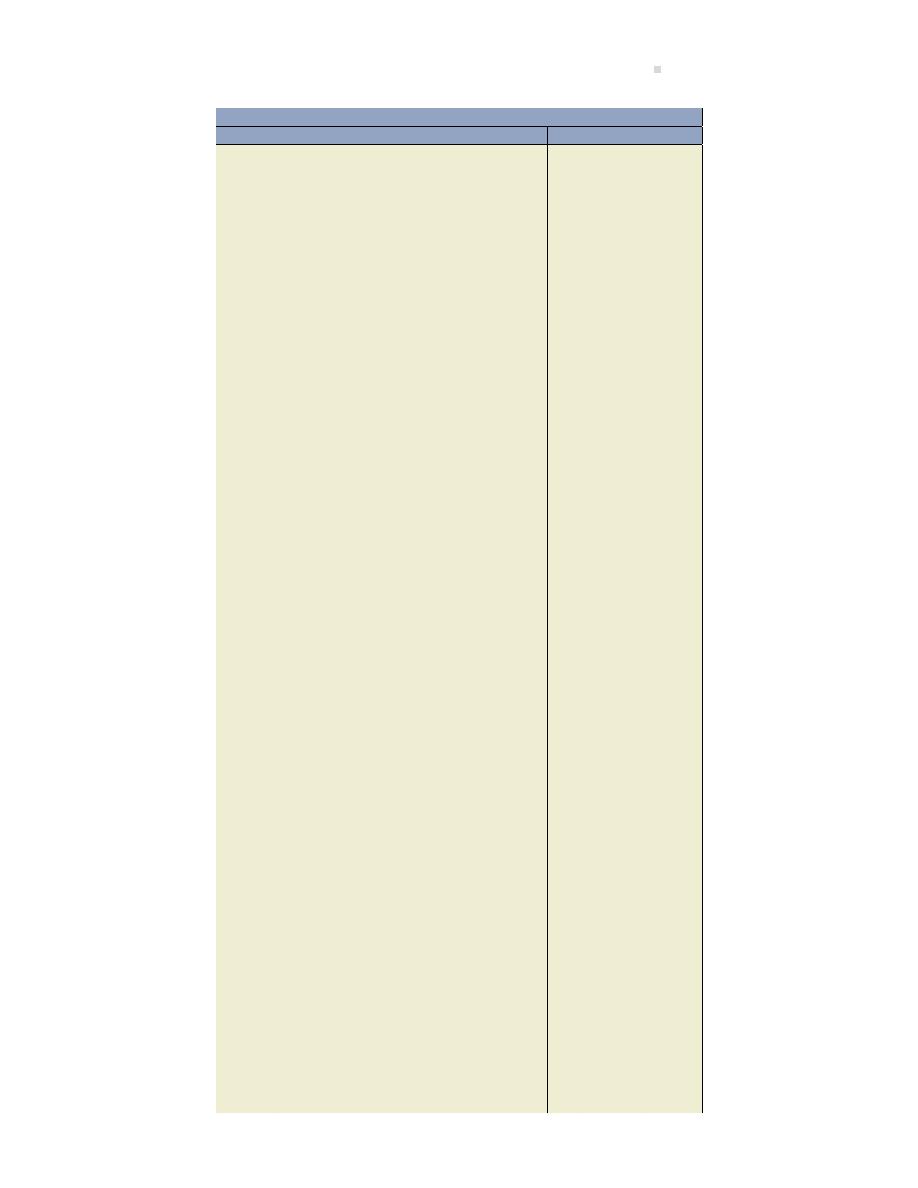
Chapter 2 Solu ons
713
General Journal
Date
Account/Explana on
PR
Debit
Credit
Aug. 1
Cash . . . . . . . . . . . . . . . . . . . . . . . . . . . . . . . . . .
3,000
Share Capital . . . . . . . . . . . . . . . . . . . . . . .
3,000
To record issuance of share capital.
1
Cash . . . . . . . . . . . . . . . . . . . . . . . . . . . . . . . . . .
10,000
Bank Loan . . . . . . . . . . . . . . . . . . . . . . . . . .
10,000
To record amount borrowed from bank.
1
Truck . . . . . . . . . . . . . . . . . . . . . . . . . . . . . . . . .
8,000
Cash . . . . . . . . . . . . . . . . . . . . . . . . . . . . . . .
8,000
To record purchase of a used truck.
4
Prepaid Insurance . . . . . . . . . . . . . . . . . . . . . .
600
Cash . . . . . . . . . . . . . . . . . . . . . . . . . . . . . . .
600
To record payment of a one-year insur-
ance policy.
5
Cash . . . . . . . . . . . . . . . . . . . . . . . . . . . . . . . . . .
2,000
Fees Earned . . . . . . . . . . . . . . . . . . . . . . . .
2,000
To record collec on of cash fees from a
customer.
7
Accounts Receivable . . . . . . . . . . . . . . . . . . .
5,000
Fees Earned . . . . . . . . . . . . . . . . . . . . . . . .
5,000
To record billings to customers.
9
Supplies Expense . . . . . . . . . . . . . . . . . . . . . .
250
Cash . . . . . . . . . . . . . . . . . . . . . . . . . . . . . . .
250
To record payment of supplies used.
12
Unused Supplies . . . . . . . . . . . . . . . . . . . . . . .
500
Accounts Payable . . . . . . . . . . . . . . . . . . .
500
To record purchase of supplies on ac-
count.
15
Cash . . . . . . . . . . . . . . . . . . . . . . . . . . . . . . . . . .
1,000
Accounts Receivable . . . . . . . . . . . . . . . .
1,000
To record collec on of customer accounts.
16
Adver sing Expense . . . . . . . . . . . . . . . . . . . .
200
Cash . . . . . . . . . . . . . . . . . . . . . . . . . . . . . . .
200
To record payment of adver sing ex-
pense.
20
Accounts Payable . . . . . . . . . . . . . . . . . . . . . .
250
Cash . . . . . . . . . . . . . . . . . . . . . . . . . . . . . . .
250
To record payment made on account.
25
Rent Expense . . . . . . . . . . . . . . . . . . . . . . . . . .
350
Salaries Expense . . . . . . . . . . . . . . . . . . . . . . .
2,150
Telephone Expense . . . . . . . . . . . . . . . . . . . . .
50
Truck Opera on Expense . . . . . . . . . . . . . . .
250
Cash . . . . . . . . . . . . . . . . . . . . . . . . . . . . . . .
2,800
To record cash payment of expenses.
29
Accounts Receivable . . . . . . . . . . . . . . . . . . .
6,000
Fees Earned . . . . . . . . . . . . . . . . . . . . . . . .
6,000
To record billings to customers.
31
Insurance Expense . . . . . . . . . . . . . . . . . . . . .
50
Prepaid Insurance. . . . . . . . . . . . . . . . . . .
50
To record insurance expired for August
($600/12 months).
31
Supplies Expense . . . . . . . . . . . . . . . . . . . . . .
400
Unused Supplies . . . . . . . . . . . . . . . . . . . .
400
To record supplies used; $500 purchased
on Aug. 12 less $100 s ll on hand.
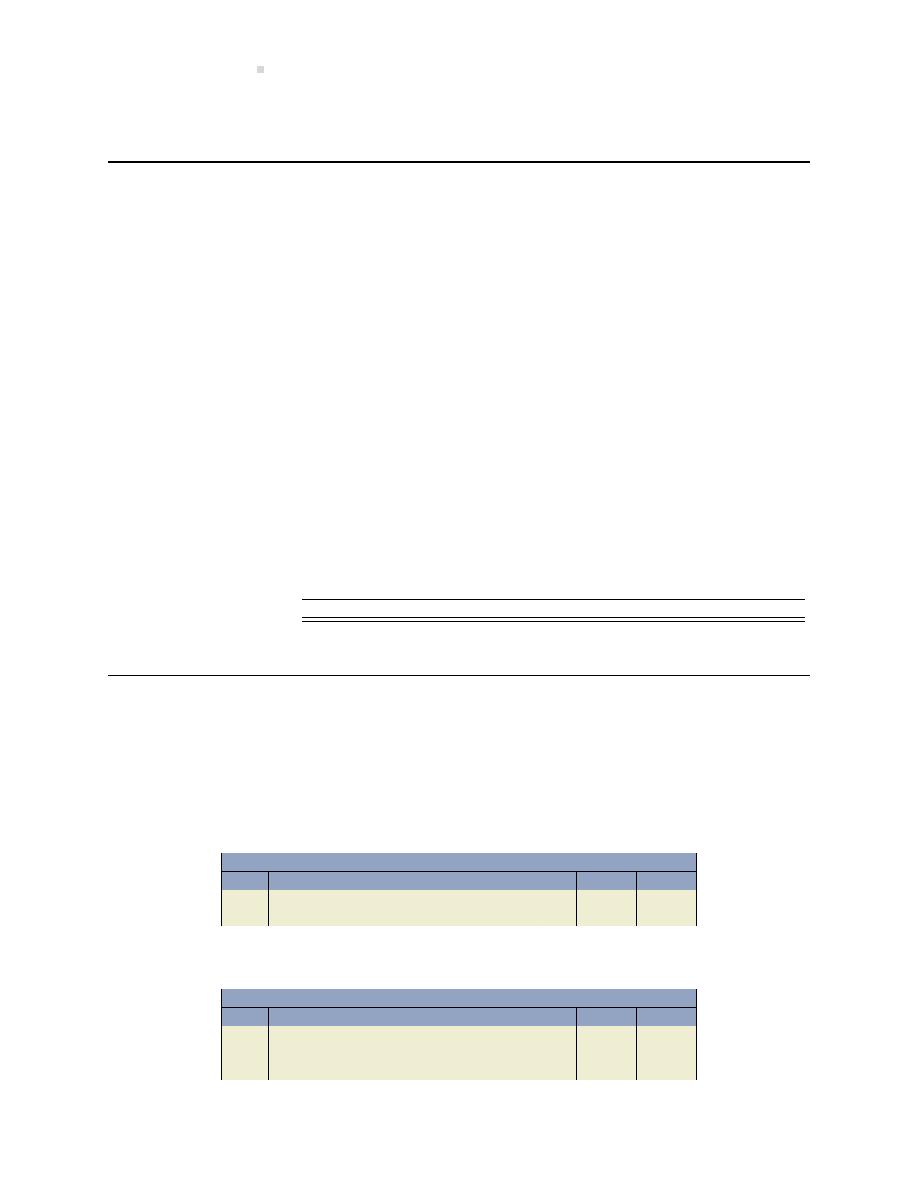
714
Solu ons To Problems
NOTE: No entry is recorded for August 28 because a transac on did not occur.
PROBLEM 2–5
Cushio Corp.
Trial Balance
At August 31, 2016
Incorrect
Adjustments
Correct Balance
Debit
Credit
Debit
Credit
Debit
Credit
Cash
102,000
102,000
Accounts receivable
59,730
3
270
1
5,000
55,000
Prepaid expenses
2,000
6
6,000
8,000
Office supplies inventory
5,500
5,500
Equipment
115,000
5
10,000
125,000
Accounts payable
74,500
4
500
85,000
5
10,000
Unearned revenue
50,000
2
5,000
45,000
Share capital
25,000
25,000
Retained earnings
50,500
50,500
Revenue
245,000
2
5,000
250,000
Repairs expense
1,000
4
500
1,500
Rent expense
25,000
25,000
Adver sing expense
24,500
6
6,000
18,500
Salaries expense
115,000
115,000
449,730
445,000
21,770
26,500
455,500
455,500
PROBLEM 2–6
1.
a. No entry
b.
General Journal
Date
Account/Explana on
PR
Debit
Credit
Prepaid expense . . . . . . . . . . . . . . . . . . . . . . .
12,000
Cash . . . . . . . . . . . . . . . . . . . . . . . . . . . . . . .
12,000
c.
General Journal
Date
Account/Explana on
PR
Debit
Credit
Accounts payable . . . . . . . . . . . . . . . . . . . . . .
57,500
Cash . . . . . . . . . . . . . . . . . . . . . . . . . . . . . . .
57,500
($115,000
× 50%)
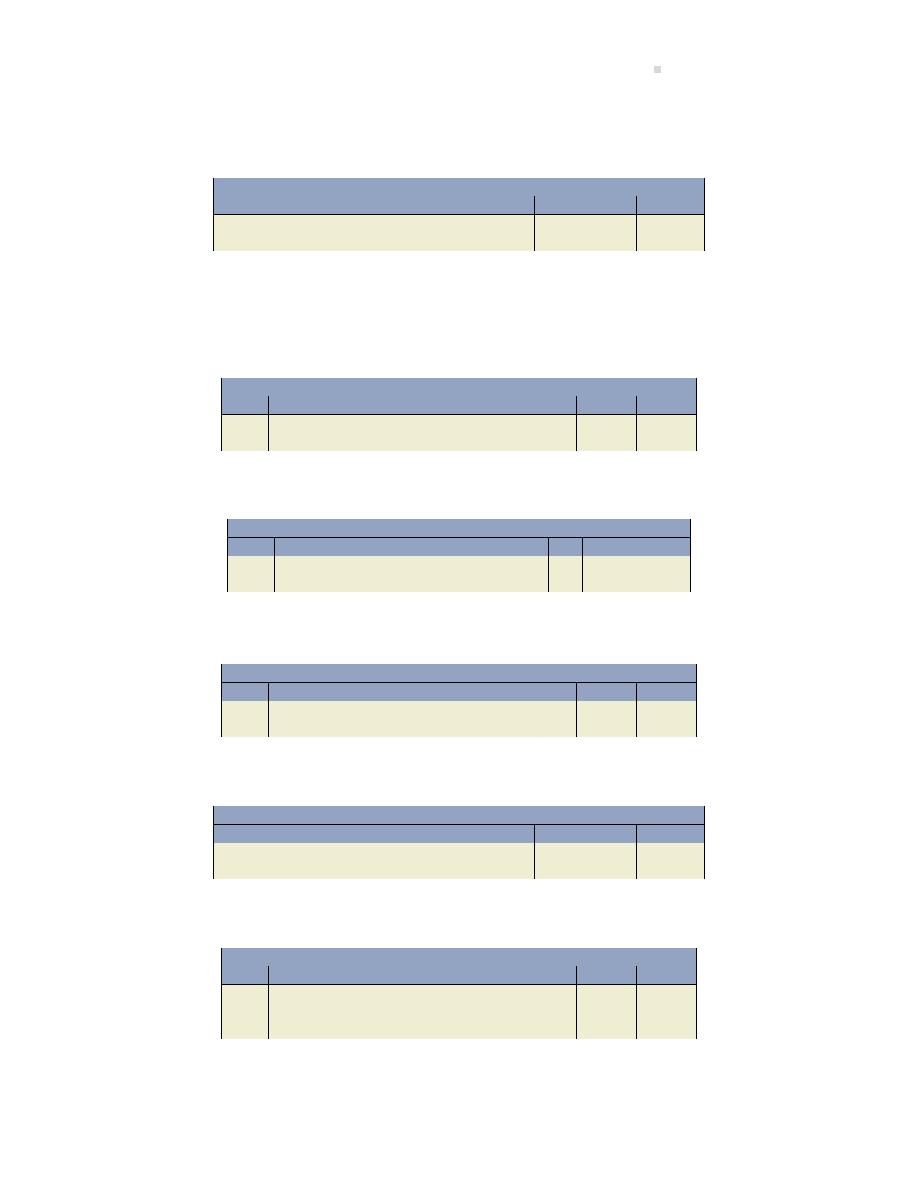
Chapter 2 Solu ons
715
d. No entry
e.
General Journal
Date
Account/Explana on
PR
Debit
Credit
Cash . . . . . . . . . . . . . . . . . . . . . . . . . . . . . . . . . .
200,000
Unearned service revenue . . . . . . . . . . .
200,000
f. No entry
g. No entry
h.
General Journal
Date
Account/Explana on
PR
Debit
Credit
Accounts receivable . . . . . . . . . . . . . . . . . . . .
12,000
Service revenue . . . . . . . . . . . . . . . . . . . .
12,000
i.
General Journal
Date
Account/Explana on
PR
Debit
Credit
Cash . . . . . . . . . . . . . . . . . . . . . . . . . . . . . . . . . .
6,000
Accounts receivable . . . . . . . . . . . . . . . . .
6,00
j.
General Journal
Date
Account/Explana on
PR
Debit
Credit
Cash . . . . . . . . . . . . . . . . . . . . . . . . . . . . . . . . . .
20,000
Unearned service revenue . . . . . . . . . . .
20,000
k.
General Journal
Date
Account/Explana on
PR
Debit
Credit
Cash . . . . . . . . . . . . . . . . . . . . . . . . . . . . . . . . . .
150,000
Note payable . . . . . . . . . . . . . . . . . . . . . . .
150,000
l.
General Journal
Date
Account/Explana on
PR
Debit
Credit
Cash . . . . . . . . . . . . . . . . . . . . . . . . . . . . . . . . . .
30,000
Equipment . . . . . . . . . . . . . . . . . . . . . . . . . . . .
10,000
Share capital . . . . . . . . . . . . . . . . . . . . . . .
40,000
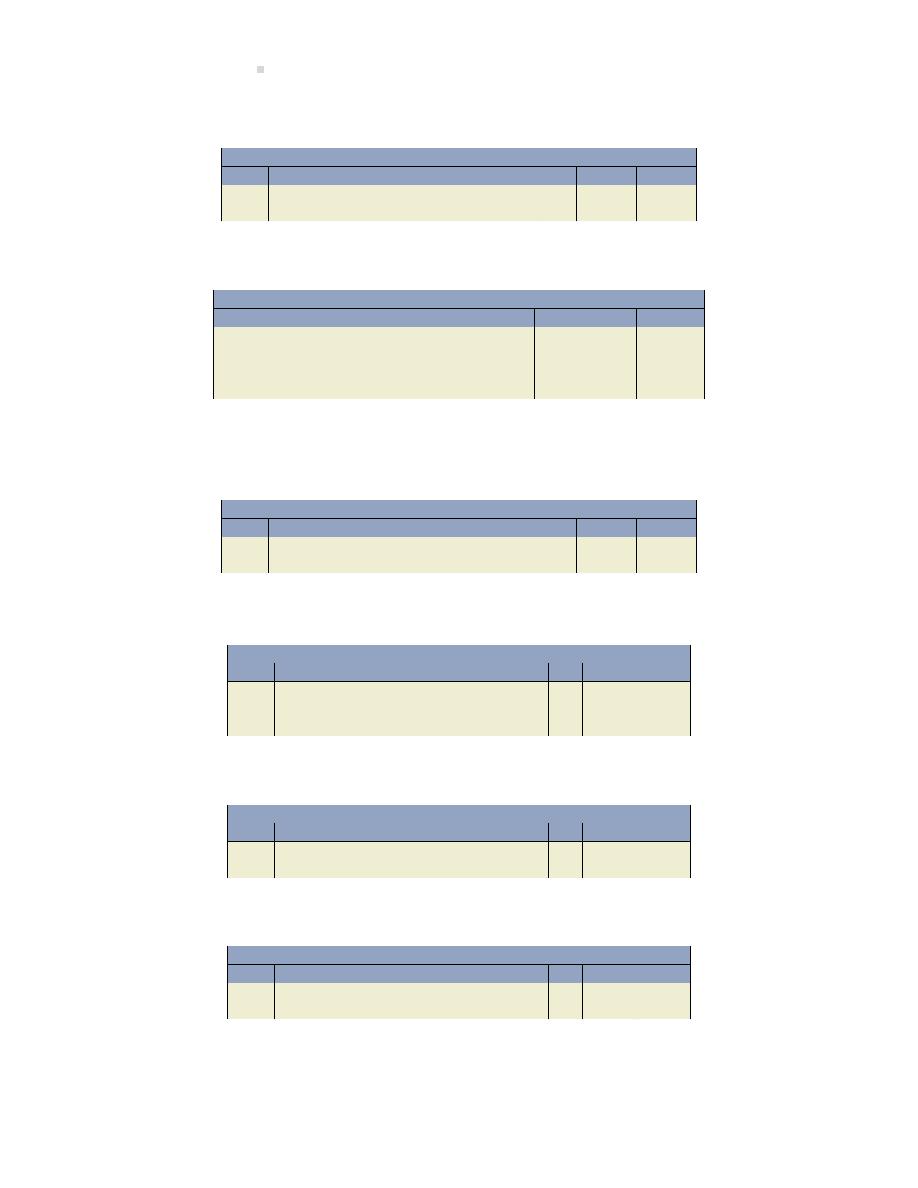
716
Solu ons To Problems
m.
General Journal
Date
Account/Explana on
PR
Debit
Credit
Prepaid rent . . . . . . . . . . . . . . . . . . . . . . . . . . .
18,000
Cash . . . . . . . . . . . . . . . . . . . . . . . . . . . . . . .
18,000
n.
General Journal
Date
Account/Explana on
PR
Debit
Credit
Land . . . . . . . . . . . . . . . . . . . . . . . . . . . . . . . . . .
250,000
Building/Warehouse . . . . . . . . . . . . . . . . . . .
60,000
Note payable . . . . . . . . . . . . . . . . . . . . . . .
260,000
Cash . . . . . . . . . . . . . . . . . . . . . . . . . . . . . . .
50,000
o. No entry
p.
General Journal
Date
Account/Explana on
PR
Debit
Credit
Accounts receivable . . . . . . . . . . . . . . . . . . . .
30,000
Service revenue . . . . . . . . . . . . . . . . . . . .
30,000
q.
General Journal
Date
Account/Explana on
PR
Debit
Credit
Equipment . . . . . . . . . . . . . . . . . . . . . . . . . . . .
8,000
Equipment . . . . . . . . . . . . . . . . . . . . . . . . .
3,000
Cash . . . . . . . . . . . . . . . . . . . . . . . . . . . . . . .
5,000
r.
General Journal
Date
Account/Explana on
PR
Debit
Credit
Retained earnings . . . . . . . . . . . . . . . . . . . . . .
1,000
Cash . . . . . . . . . . . . . . . . . . . . . . . . . . . . . . .
1,000
s.
General Journal
Date
Account/Explana on
PR
Debit
Credit
Service revenue . . . . . . . . . . . . . . . . . . . . . . . .
2,000
Accounts receivable . . . . . . . . . . . . . . . . .
2,000
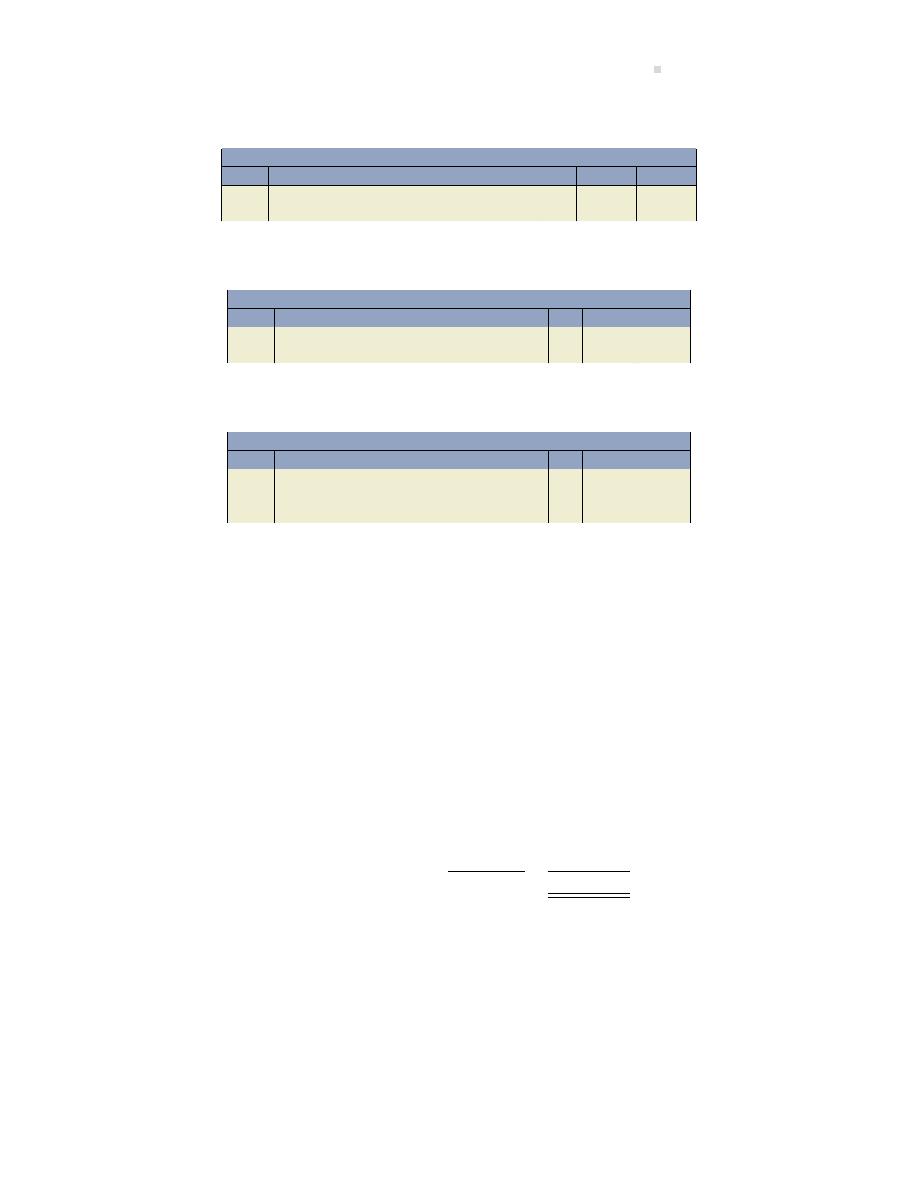
Chapter 2 Solu ons
717
t.
General Journal
Date
Account/Explana on
PR
Debit
Credit
Salaries expense . . . . . . . . . . . . . . . . . . . . . . .
35,000
Cash . . . . . . . . . . . . . . . . . . . . . . . . . . . . . . .
35,000
u.
General Journal
Date
Account/Explana on
PR
Debit
Credit
U li es expense . . . . . . . . . . . . . . . . . . . . . . .
1,800
Accounts payable . . . . . . . . . . . . . . . . . . .
1,800
v.
General Journal
Date
Account/Explana on
PR
Debit
Credit
Office equipment . . . . . . . . . . . . . . . . . . . . . .
5,000
Office supplies . . . . . . . . . . . . . . . . . . . . . . . . .
2,000
Accounts payable . . . . . . . . . . . . . . . . . . .
7,000
w. No entry
2.
Stellar Services Ltd.
Income Statement
For the Two Months Ended January 31, 2016
Revenues
Service revenue
$ 65,000
Expenses
Repairs expense
$
500
Salaries expense
67,000
U l es expense
6,300
73,800
Net loss
$ (8,800)

718
Solu ons To Problems
Stellar Services Ltd.
Statement of Changes in Equity
For the Two Months Ended January 31, 2016
Share
Retained
Total
Capital
Earnings
Equity
Opening balance, December 31, 2015
$108,000
$ 90,000
$198,000
Shares issued
40,000
40,000
Net loss
(8,800)
(8,800)
Dividends***
(1,000)
(1,000)
Ending balance
$148,000
$ 80,200
$228,200
Stellar Services Ltd.
Balance Sheet
At January 31, 2016
Assets
Liabili es
Cash
$377,500
Accounts payable
$ 66,300
Accounts receivable
119,000
Note payable
430,000
Office supplies
9,000
Unearned consul ng fees
220,000
Prepaid expenses
30,000
Total liabili es
$716,300
Land
250,000
Building/Warehouse
60,000
Equipment
60,000
Equity
Office equipment
5,000
Share capital
$148,000
Furniture
15,000
Retained earnings
80,200
Vehicle
19,000
Total equity
Total liabili es and equity
228,200
Total assets
$944,500
$944,500
PROBLEM 2–7
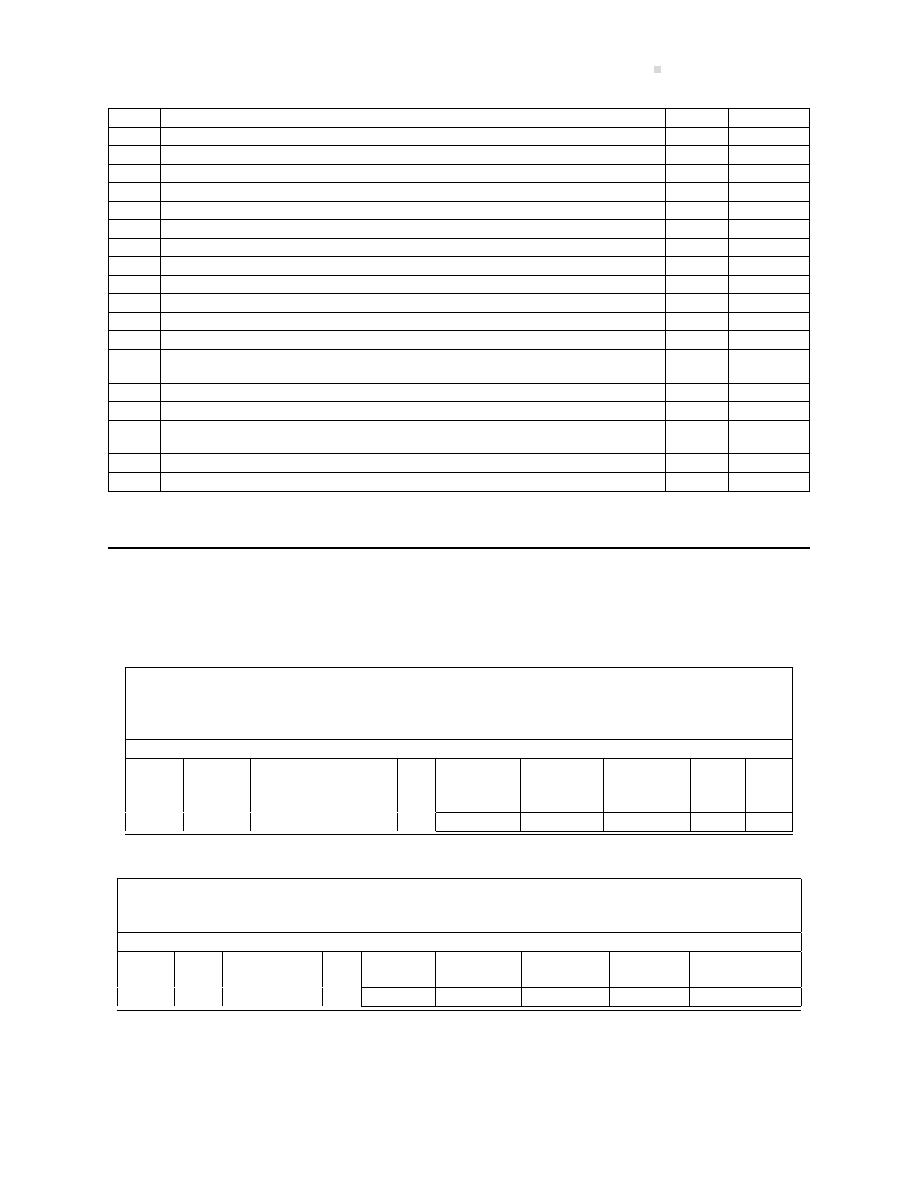
Chapter 2 Solu ons
719
Date
Transac on
Journal
Subledger
Dec 1
Issued shares to the company’s founder for cash
CR
1
Issued a cheque for rent to the building owner
CD
2
Purchased 100 books on credit from the publisher
P
AP and MI
4
Borrowed money from bank (i.e. a note payable)
CR
5
Purchased office furniture on account
P
AP
6
Return 5 books to the publisher due to missing pages
P
AP and MI
12
Sold 20 books to Fred’s Cigar Store on account (credit)
S
AR and MI
13
Paid cash for a two-year insurance policy effec ve immediately
CD
15
Paid cash for some office supplies
CD
19
Issued a cheque to the bank for the note payable interest
CD
20
Hired an employee and paid her first week’s salary in cash
CD
22
Sold 10 books for cash
CR
MI
27
Fred’s Cigar Store returned five of the books purchased earlier and the amount
owing was adjusted (accounts receivable)
S
AR and MI
27
Received cash from Fred’s Cigar Store for amount owing
CR
AR
28
Found an error in the accoun ng records and recorded a correc ng entry
GJ
29
Received cash from a customer for 100 books. 50% of the books will be sent
immediately and the remained to be sent in January
CR
MI
30
A cheque was issued for rent for January, 2018
CD
30
Dividends were paid in cash to the company founder
CD
PROBLEM 2–8
1.
Credit Sales Journal
S1
Consul ng
Vintage
Accounts
Services
Model
Date
Billing #
Customer
Ref
Receivable
Revenue
Plane Sales
Other
Desc
Debit
Credit
Credit
Jun 2
17001
Cooper Co.
$
8,000
$
8,000
Jun 6
17002
Mr. F. Sco
12,500
$
12,500
Jun 25
17003
Boyzee Villages Corp.
35,000
35,000
Totals
$
55,500
$
43,000
$
12,500
Credit Purchases Journal
P1
Accounts
Equipment
Adver sing
Other
Date
Inv #
Creditor
Ref
Payable
Purchases
Expense
Purchases
Desc
Credit
Debit
Debit
Debit
Jun 1
Bradley & Co.
$ 12,000
$
12,000
Equipment
Jun 10
Daily Gaze e
1,200
$
1,200
Adver sing exp
Totals
$ 13,200
$
12,000
$
1,200
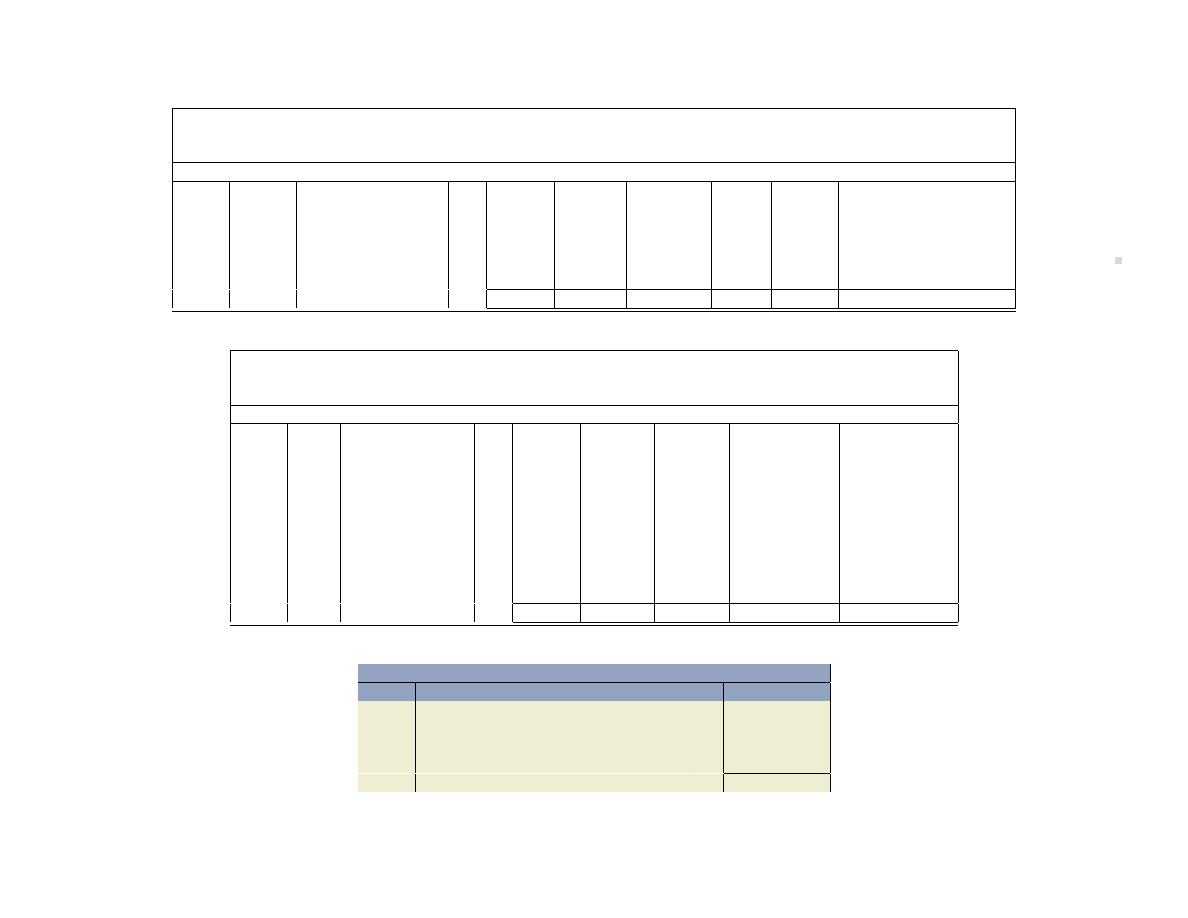
720
Soluons
To
Pr
oblems
Cash Receipts Journal
CR1
Sales
Accounts
Cash
Date
Billing #
Customer
Ref
Cash
Discount
Receivable
Sales
Other
Desc
Debit
Debit
Credit
Credit
Credit
Jun 7
Cash sale
$ 2,000
$2,000
Jun 8
17001
Cooper Co.
7,920
$
80
$
8,000
Jun 11
Dep
Ft Robbins Br Builders
5,000
$ 5,000
Unearned Consul ng Fees
Jun 14
Bank of Trust
10,000
10,000
Note Payable
Jun 18
17002
F. Sco
5,000
5,000
Jun 22
Shares Issued
5,000
5,000
Share Capital
Totals
$34,920
$
80
$
13,000
$2,000
$20,000
Cash Disbursements Journal
CD1
Purchase
Accounts
Other
Date
Chq #
Payee
Ref
Cash
Discount
Payable
Disbursements
Desc
Credit
Credit
Debit
Debit
Jun 3
601
LRS Proper es Ltd.
$ 3,500
$
3,500
Rent expense
Jun 4
602
Office Supplies Ltd.
1,240
1,240
Office supplies
Jun 9
603
Salary
1,400
1,400
Salary expense
Jun 10
604
Bradley & Co.
2,400
$ 2,400
Jun 23
605
HTC Power Corp.
350
350
U li es expense
Jun 28
606
Daily Gaze e
1,188
$
12
1,200
Jun 29
607
Bill Sloan
200
200
Cash dividends
Jun 30
608
Bank of Trust
1,000
30
Interest expense
970
Note payable
Jun 30
609
Salary
1,600
1,600
Salary expense
Totals
$12,878
$
12
$ 3,600
$
9,290
General Journal
GJ1
Date
Account/Explana on
PR
Debit
Credit
Jun 30
Interest expense . . . . . . . . . . . . . . . . . . . . . . .
5
Note payable . . . . . . . . . . . . . . . . . . . . . . .
5
Correc on to Interest expense for the
bank loan
Totals
5
5
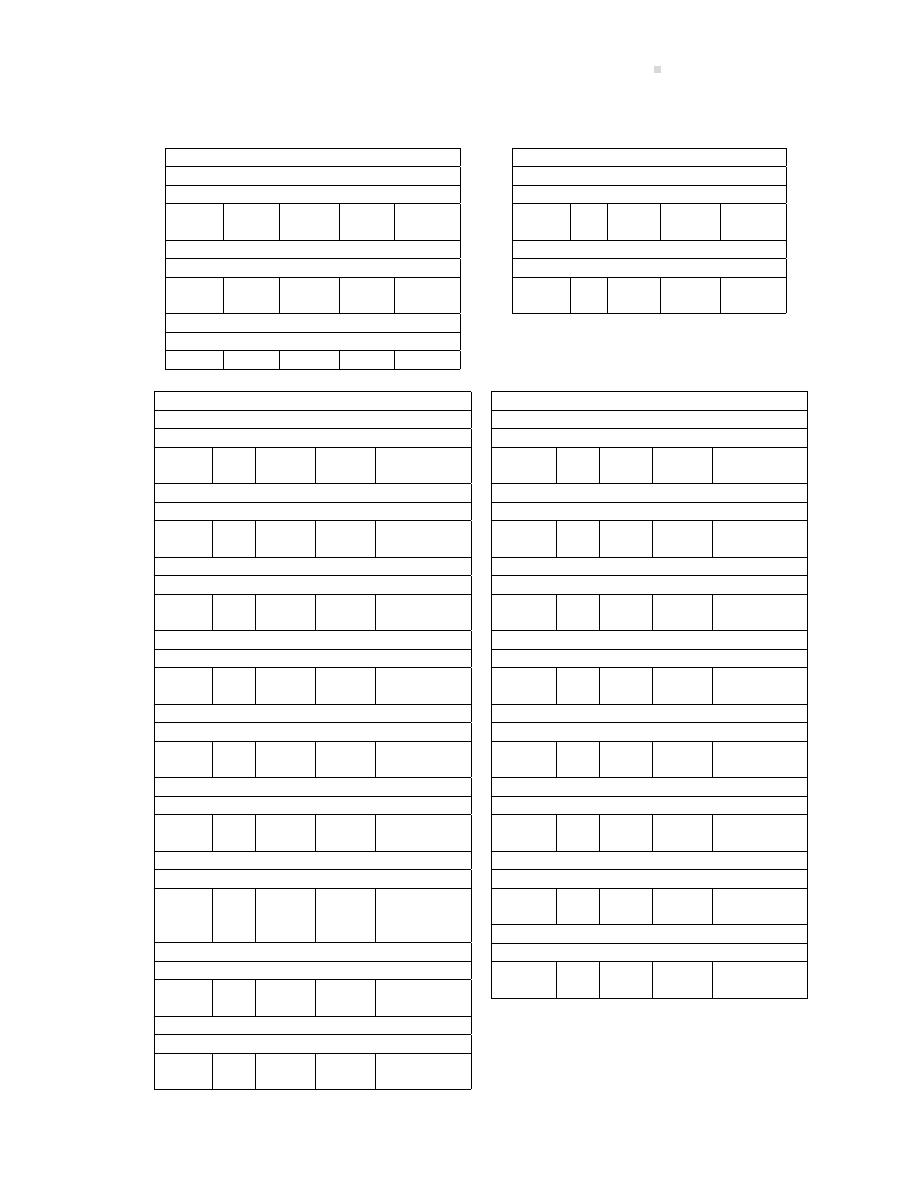
Chapter 2 Solu ons
721
2.
Accounts Receivable Subledger
Name: Cooper Co.
Date
Ref
Debit
Credit
Balance
Jun 2
17001
8,000
8,000
Jun 8
17001
8,000
–
Name: Mr. F. Sco
Date
Ref
Debit
Credit
Balance
Jun 6
17002
12,500
12,500
Jun 18
17002
5,000
7,500
Name: Boyzee Villages Corp.
Date
Ref
Debit
Credit
Balance
Jun 25
17003
35,000
35,000
Accounts Payable Subledger
Name: Bradley & Co.
Date
Ref
Debit
Credit
Balance
Jun 1
12,000
12,000
Jun 10
2,400
9,600
Name: Daily Gaze e
Date
Ref
Debit
Credit
Balance
Jun 10
1,200
1,200
Jun 28
1,200
–
General Ledger
Name: Cash
Date
Ref
Debit
Credit
Balance
Jun 30
CR1
34,920
DR
34,920
Jun 30
CD1
12,878
DR
22,042
Name: Accounts Receivable
Date
Ref
Debit
Credit
Balance
Jun 30
S1
55,500
DR
55,500
Jun 30
CR1
13,000
DR
42,500
Name: Office Supplies
Date
Ref
Debit
Credit
Balance
Jun 30
CD1
1,240
DR
1,240
Name: Equipment
Date
Ref
Debit
Credit
Balance
Jun 30
P1
12,000
DR
12,000
Name: Accounts Payable
Date
Ref
Debit
Credit
Balance
Jun 30
P1
13,200
CR
13,200
Jun 30
CD1
3,600
CR
9,600
Name: Unearned Consul ng Fees
Date
Ref
Debit
Credit
Balance
Jun 30
CR1
5,000
CR
5,000
Name: Note Payable
Date
Ref
Debit
Credit
Balance
Jun 30
CR1
10,000
CR
10,000
Jun 30
CD1
970
CR
9,030
Jun 30
GJ1
5
CR
9,035
Name: Share Capital
Date
Ref
Debit
Credit
Balance
Jun 30
CR1
5,000
CR
5,000
Name: Cash Dividends
Date
Ref
Debit
Credit
Balance
Jun 30
CD1
200
DR
200
General Ledger
Name: Consul ng Services Revenue
Date
Ref
Debit
Credit
Balance
Jun 30
S1
43,000
CR
43,000
Name: Vintage Model Plane Sales
Date
Ref
Debit
Credit
Balance
Jun 30
S1
12,500
CR
12,500
Jun 30
CR1
2,000
CR
14,500
Name: Sales Discount
Date
Ref
Debit
Credit
Balance
Jun 30
CR1
80
DR
80
Name: Adver sing Expenses
Date
Ref
Debit
Credit
Balance
Jun 30
P1
1,200
DR
1,200
Jun 30
CD1
12
DR
1,188
Name: Rent Expense
Date
Ref
Debit
Credit
Balance
June 30
CD1
3,500
DR
3,500
Name: Salary Expense
Date
Ref
Debit
Credit
Balance
Jun 30
CD1
3,000
DR
3,000
Name: U li es Expense
Date
Ref
Debit
Credit
Balance
Jun 30
CD1
350
DR
350
Name: Interest Expense
Date
Ref
Debit
Credit
Balance
Jun 30
CD1
30
DR
30
Jun 30
GJ1
5
DR
35

722
Solu ons To Problems
3.
Harmand Ltd.
Trial Balance
As at June 30th, 20XX
Debit
Credit
Cash
$22,042
Accounts receivable
42,500
Office supplies
1,240
Equipment
12,000
Accounts payable
9,600
Unearned consul ng fees
5,000
Note payable
9,035
Share capital
5,000
Cash dividends
200
Consul ng services revenue
43,000
Vintage Model Plane Sales
14,500
Sales discount
80
Adver sing expense
1,188
Rent expense
3,500
Salary expense
3,000
U li es expense
350
Interest expense
35
$86,135
$86,135
4.
Harmand Ltd.
Income Statement
For the Month Ended June 30, 20XX
Revenues
Consul ng services revenue
$43,000
Vintage Model Plane Sales
14,500
$57,500
Expenses
Sales discount
$
80
Adver sing expense
1,188
Rent expense
3,500
Salary expense
3,000
U li es expense
350
Interest expense
35
8,153
Net income
$49,347

Chapter 3 Solu ons
723
Harmand Ltd.
Statement of Changes in Equity
For the Month Ended June 30, 20XX
Share
Retained
Total
Capital
Earnings
Equity
Balance, beginning of period
$
–
$
–
$
–
Shares Issued
5,000
5,000
Net Income
49,347
49,347
Dividends
(200)
(200)
Ending Balance
$5,000
$49,147
$54,147
Harmand Ltd.
Balance Sheet
At June 30, 20XX
Assets
Cash
$22,042
Accounts receivable
42,500
Office supplies
1,240
Equipment
12,000
Total assets
$77,782
Liabili es
Accounts payable
$ 9,600
Unearned consul ng fees
5,000
Note payable
9,035
Total liabili es
23,635
Equity
Share capital
$ 5,000
Retained earnings
49,147
Total equity
54,147
Total liabili es and equity
$77,782
Chapter 3 Solu ons
PROBLEM 3–1
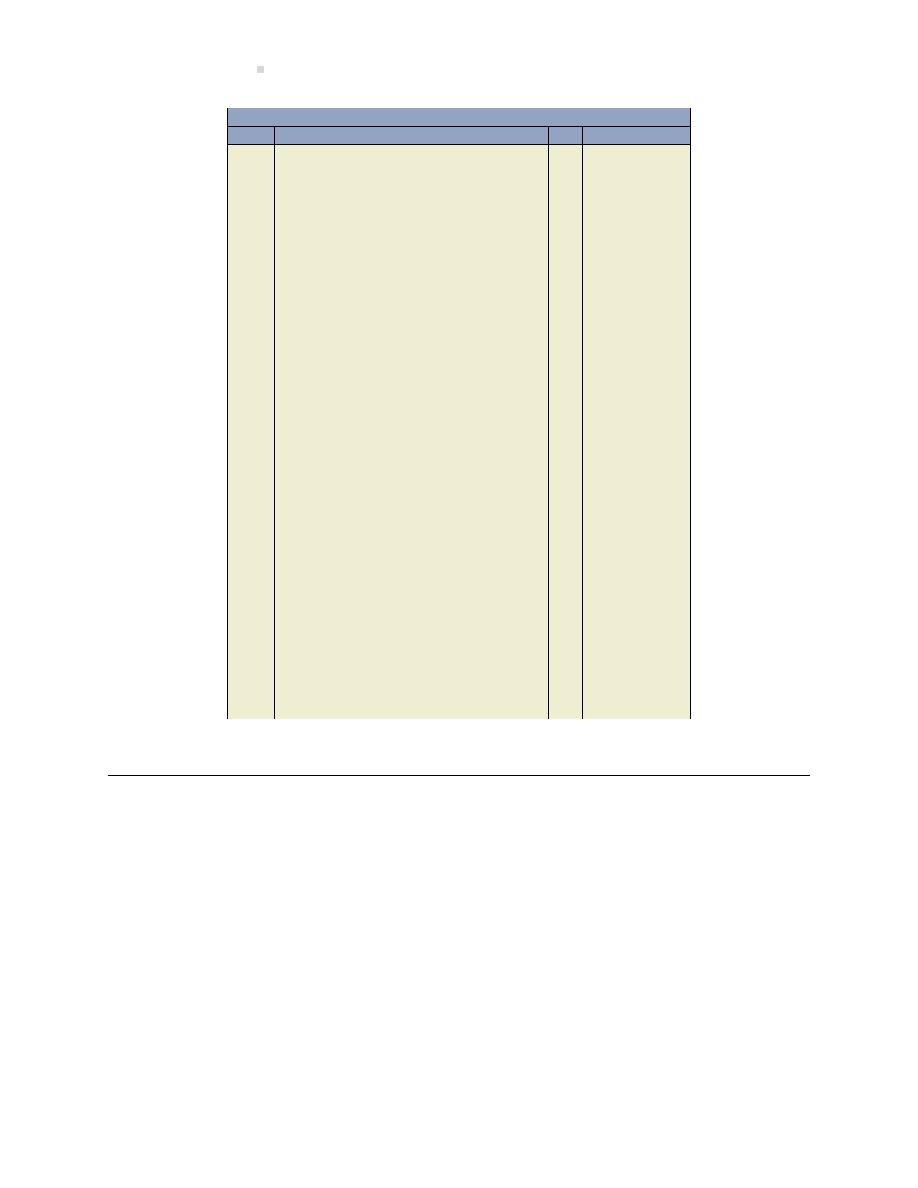
724
Solu ons To Problems
General Journal
Date
Account/Explana on
PR
Debit
Credit
Rent Expense . . . . . . . . . . . . . . . . . . . . . . . . . .
300
Prepaid Rent . . . . . . . . . . . . . . . . . . . . . . .
300
(a) To record rent expense at year end.
Wages Expense . . . . . . . . . . . . . . . . . . . . . . . .
200
Wages Payable . . . . . . . . . . . . . . . . . . . . .
200
(b) To record accrued wages at year-end.
Income Taxes Expense . . . . . . . . . . . . . . . . . .
1,000
Income Taxes Payable . . . . . . . . . . . . . . .
1,000
(c) To record income taxes.
Unearned Commissions Revenue . . . . . . . .
1,000
Commissions Earned . . . . . . . . . . . . . . . .
1,000
(d) To record commissions earned at year-
end.
Other Unearned Revenue . . . . . . . . . . . . . . .
5,000
Revenue . . . . . . . . . . . . . . . . . . . . . . . . . . .
5,000
(e) To adjust unearned revenue to actual
at year end.
Prepaid Adver sing . . . . . . . . . . . . . . . . . . . .
1,500
Adver sing Expense . . . . . . . . . . . . . . . . .
1,500
(f) To correct adver sing expense and
record prepaid adver sing at year-end.
Deprecia on Expense – Equipment . . . . . .
500
Accumulated Deprecia on – Equip-
ment . . . . . . . . . . . . . . . . . . . . . . . . . . . . . . . . .
500
(g) To record deprecia on expense.
Unused Supplies . . . . . . . . . . . . . . . . . . . . . . .
225
Supplies Expense . . . . . . . . . . . . . . . . . . .
225
(h) To correct supplies expense and adjust
for unused supplies.
Truck Expense . . . . . . . . . . . . . . . . . . . . . . . . .
500
Accounts Payable . . . . . . . . . . . . . . . . . . .
500
(i) To record accounts payable at year-end.
PROBLEM 3–2

Chapter 3 Solu ons
725
General Journal
Date
Account/Explana on
PR
Debit
Credit
Unused Supplies . . . . . . . . . . . . . . . . . . . . . . .
100
Supplies Expense . . . . . . . . . . . . . . . . . . .
100
(a)
Telephone Expense . . . . . . . . . . . . . . . . . . . . .
75
Accounts Payable . . . . . . . . . . . . . . . . . . .
75
(b)
Wages Expense . . . . . . . . . . . . . . . . . . . . . . . .
125
Wages Payable . . . . . . . . . . . . . . . . . . . . .
125
(c)
Deprecia on Expense – Equipment . . . . . .
100
Accumulated Deprecia on – Equip-
ment . . . . . . . . . . . . . . . . . . . . . . . . . . . . . . . . .
100
(d)
Rent Expense . . . . . . . . . . . . . . . . . . . . . . . . . .
500
Prepaid Rent . . . . . . . . . . . . . . . . . . . . . . .
500
(e)
Unearned Adver sing Revenue . . . . . . . . . .
500
Other Revenue . . . . . . . . . . . . . . . . . . . . .
500
(f)
Prepaid Insurance* . . . . . . . . . . . . . . . . . . . . .
525
Insurance Expense . . . . . . . . . . . . . . . . . .
525
(g)
*$900/12 months = $75/month; 5 months have been used (August 1 to December 31 = 5 months);
therefore 7 months
× $75/month = $525 remains unused.
PROBLEM 3–3
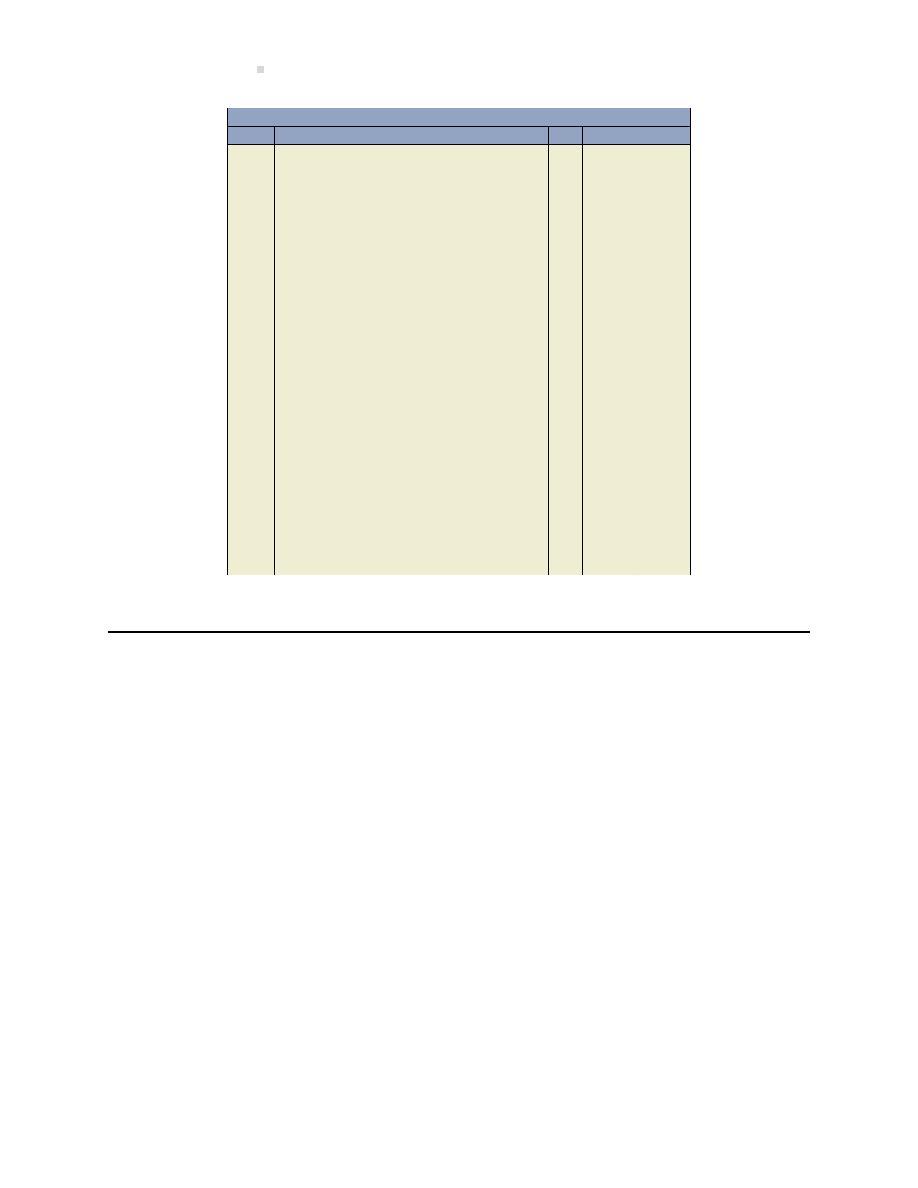
726
Solu ons To Problems
General Journal
Date
Account/Explana on
PR
Debit
Credit
Interest Receivable . . . . . . . . . . . . . . . . . . . . .
250
Interest Earned . . . . . . . . . . . . . . . . . . . . .
250
(a)
Insurance Expense . . . . . . . . . . . . . . . . . . . . .
200
Prepaid Insurance. . . . . . . . . . . . . . . . . . .
200
(b)
Supplies Expense . . . . . . . . . . . . . . . . . . . . . .
200
Unused Supplies . . . . . . . . . . . . . . . . . . . .
200
(c)
Interest Expense . . . . . . . . . . . . . . . . . . . . . . .
25
Interest Payable . . . . . . . . . . . . . . . . . . . .
25
(d)
Subscrip on Revenue . . . . . . . . . . . . . . . . . .
7,500
Unearned Subscrip on Revenue . . . . .
7,500
(e) ($9,000
× 5/6 mos. = $7,500)
Salaries Expense . . . . . . . . . . . . . . . . . . . . . . .
300
Salaries Payable . . . . . . . . . . . . . . . . . . . .
300
(f)
Prepaid Rent . . . . . . . . . . . . . . . . . . . . . . . . . .
300
Rent Expense . . . . . . . . . . . . . . . . . . . . . . .
300
(g)
Truck Opera on Expense . . . . . . . . . . . . . . .
400
Accounts Payable . . . . . . . . . . . . . . . . . . .
400
(h)
PROBLEM 3–4

Chapter 3 Solu ons
727
General Journal
Date
Account/Explana on
PR
Debit
Credit
Deprecia on Expense – Truck . . . . . . . . . . .
150
Accumulated Deprecia on – Truck. . . .
150
(a) ($6,000
× 6/48 mos. = $750 − 600 =
$150)
(b) No Entry Required
Unused Supplies . . . . . . . . . . . . . . . . . . . . . . .
300
Supplies Expense . . . . . . . . . . . . . . . . . . .
300
(c)
Rent Expense . . . . . . . . . . . . . . . . . . . . . . . . . .
400
Prepaid Rent . . . . . . . . . . . . . . . . . . . . . . .
400
(d)
Wages Expense . . . . . . . . . . . . . . . . . . . . . . . .
250
Wages Payable . . . . . . . . . . . . . . . . . . . . .
250
(e)
Interest Expense . . . . . . . . . . . . . . . . . . . . . . .
200
Interest Payable . . . . . . . . . . . . . . . . . . . .
200
(f) ($8,000
× 10% = $800 − 600 = $200)
U li es Expense . . . . . . . . . . . . . . . . . . . . . . .
150
U li es Payable . . . . . . . . . . . . . . . . . . . .
150
(g)
Insurance Expense . . . . . . . . . . . . . . . . . . . . .
500
Prepaid Insurance. . . . . . . . . . . . . . . . . . .
500
(h) ($1,200
× 1/12 mos. = $100 prepaid;
$600
− 100 = $500)
Unearned Rent Revenue . . . . . . . . . . . . . . . .
600
Rent Earned . . . . . . . . . . . . . . . . . . . . . . . .
600
(i)
Commissions Earned . . . . . . . . . . . . . . . . . . .
2,000
Other Unearned Revenue. . . . . . . . . . . .
2,000
(j)
PROBLEM 3–5
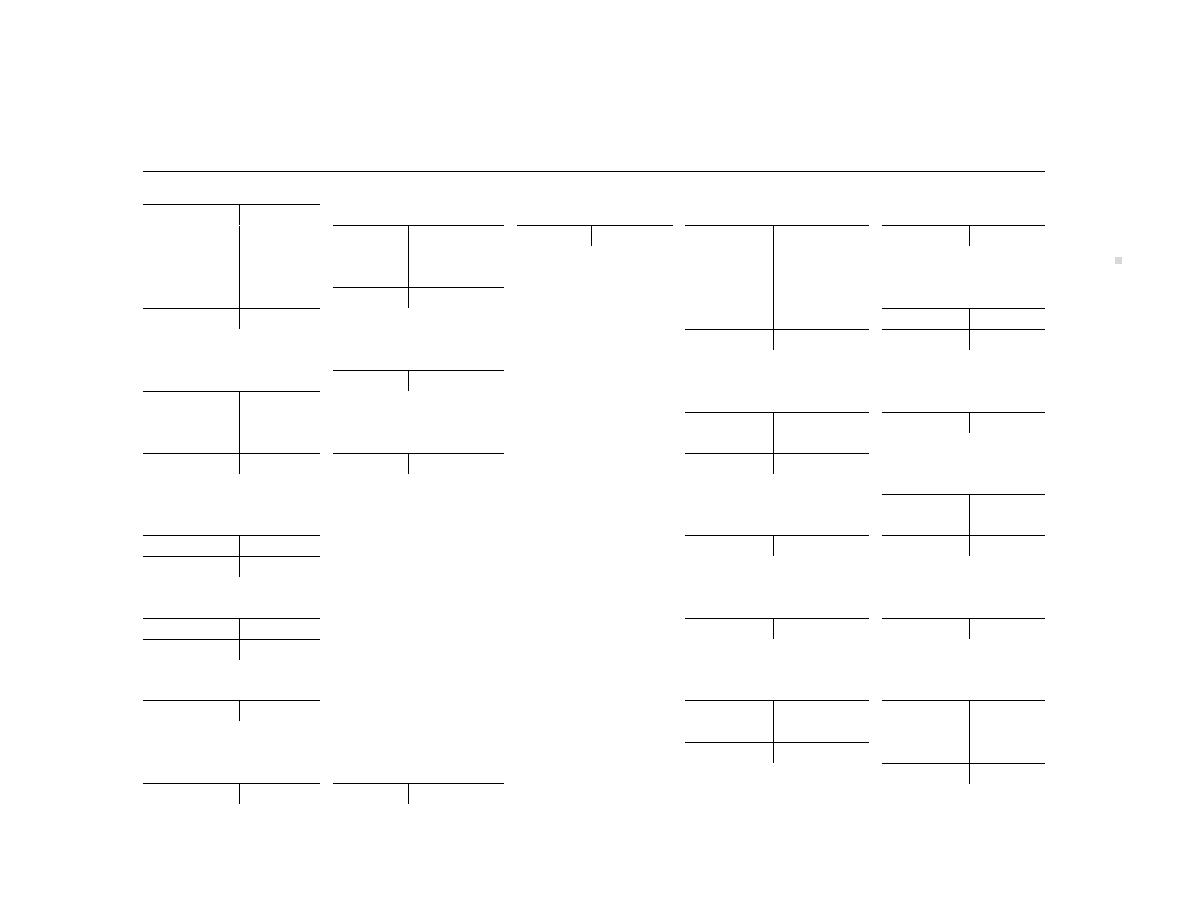
728
Soluons
To
Pr
oblems
1., 3., 4., and 6.
Roth Contractors Corpora on
Cash
101
Accounts
Share
Repair
Rent
(a)
5,000 (b) 1,200
Payable
210
Capital
320
Revenue
450
Expense
654
(g)
800 (e) 1,800
(c)
10,000
(a) 5,000
(r)
2,000 (f)
4,500
(p)
400
(i)
2,000 (h) 3,450
(d)
1,000
(g)
800
(m)
2,000 (l)
3,225
(n)
100
(j)
6,500
Supplies
Bal. 11,100
(m)
2,000
Expense
668
Bal.
125
(d)
1,000 (q)
350
Wages
Bal. 11,800
Bal.
650
Accounts
Payable
237
Receivable
110
(s)
1,500
Adver sing
Telephone
(f)
4,500 (i)
2,000
Expense
610
Expense
669
(j)
6,500
Unearned
(h)
350
(h)
75
Revenue
249
(l)
200
Bal.
9,000
(r)
2,000
Bal.
550
Truck Opera on
Expense
670
Prepaid
Deprecia on
(h)
425
Insurance
161
Expense – Truck
624
(l)
375
(e)
1,800 (o)
150
(t)
208
Bal.
800
Bal.
1,650
Insurance
U li es
Prepaid Rent
162
Expense
631
Expense
676
(b)
1,200 (p)
400
(o)
150
(n)
100
Bal.
800
Interest
Wages
Supplies
173
Expense
632
Expense
677
(q)
350
(h)
100
(h)
2,500
(l)
150
(l)
2,500
Accum. Dep’n
Bal.
250
(s)
1,500
Truck
184
Truck
194
Bal. 6,500
(c)
10,000
(t)
208
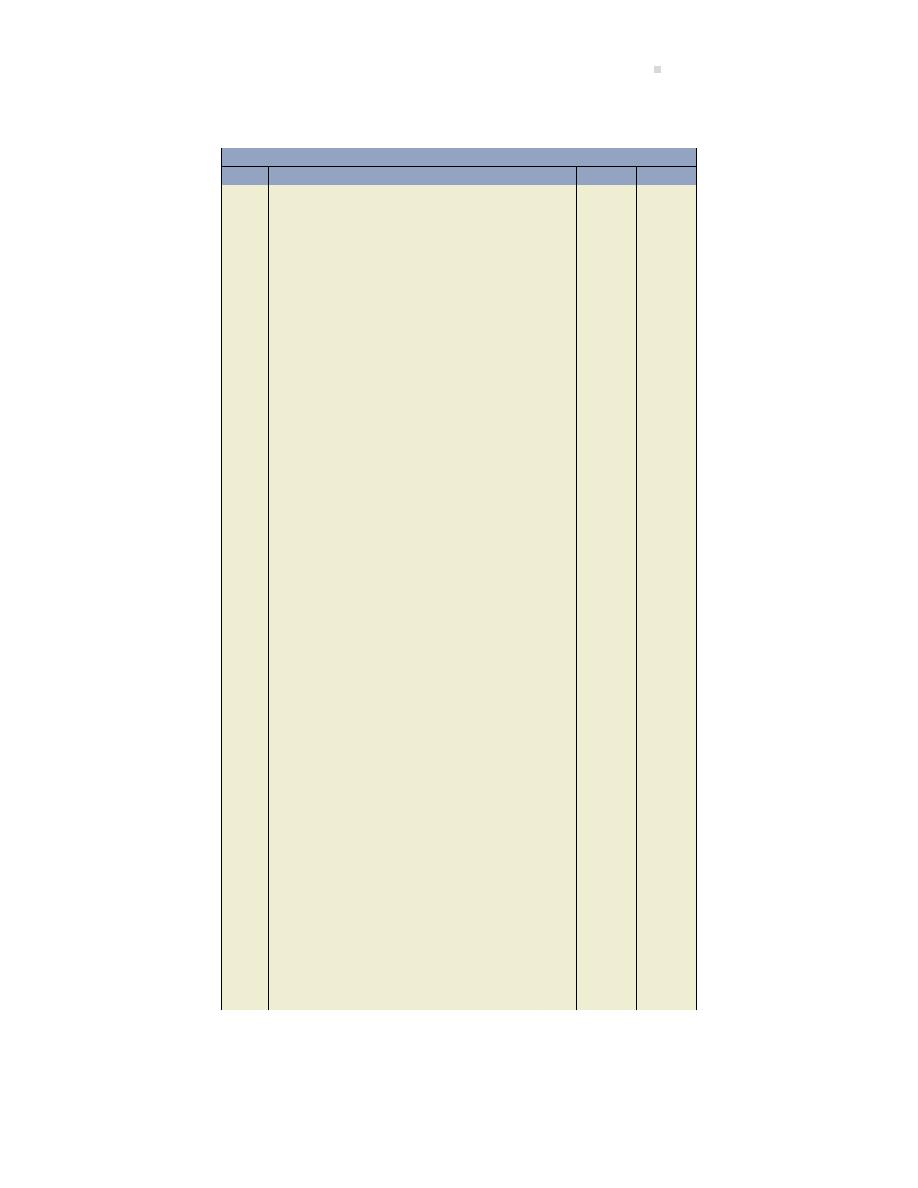
Chapter 3 Solu ons
729
2.
General Journal
Date
Account/Explana on
PR
Debit
Credit
Cash . . . . . . . . . . . . . . . . . . . . . . . . . . . . . . . . . .
5,000
Share Capital . . . . . . . . . . . . . . . . . . . . . . .
5,000
(a)
Prepaid Rent . . . . . . . . . . . . . . . . . . . . . . . . . .
1,200
Cash . . . . . . . . . . . . . . . . . . . . . . . . . . . . . . .
1,200
(b)
Truck . . . . . . . . . . . . . . . . . . . . . . . . . . . . . . . . .
10,000
Accounts Payable . . . . . . . . . . . . . . . . . . .
10,000
(c)
Supplies Expense . . . . . . . . . . . . . . . . . . . . . .
1,000
Accounts Payable . . . . . . . . . . . . . . . . . . .
1,000
(d)
Prepaid Insurance . . . . . . . . . . . . . . . . . . . . . .
1,800
Cash . . . . . . . . . . . . . . . . . . . . . . . . . . . . . . .
1,800
(e)
Accounts Receivable . . . . . . . . . . . . . . . . . . .
4,500
Repair Revenue . . . . . . . . . . . . . . . . . . . . .
4,500
(f)
Cash . . . . . . . . . . . . . . . . . . . . . . . . . . . . . . . . . .
800
Repair Revenue . . . . . . . . . . . . . . . . . . . . .
800
(g)
Adver sing Expense . . . . . . . . . . . . . . . . . . . .
350
Interest Expense . . . . . . . . . . . . . . . . . . . . . . .
100
Telephone Expense . . . . . . . . . . . . . . . . . . . . .
75
Truck Opera on Expense . . . . . . . . . . . . . . .
425
Wages Expense . . . . . . . . . . . . . . . . . . . . . . . .
2,500
Cash . . . . . . . . . . . . . . . . . . . . . . . . . . . . . . .
3,450
(h)
Cash . . . . . . . . . . . . . . . . . . . . . . . . . . . . . . . . . .
2,000
Accounts Receivable . . . . . . . . . . . . . . . .
2,000
(i)
Accounts Receivable . . . . . . . . . . . . . . . . . . .
6,500
Repair Revenue . . . . . . . . . . . . . . . . . . . . .
6,500
(j)
Adver sing Expense . . . . . . . . . . . . . . . . . . . .
200
Interest Expense . . . . . . . . . . . . . . . . . . . . . . .
150
Truck Opera on Expense . . . . . . . . . . . . . . .
375
Wages Expense . . . . . . . . . . . . . . . . . . . . . . . .
2,500
Cash . . . . . . . . . . . . . . . . . . . . . . . . . . . . . . .
3,225
(l)
Cash . . . . . . . . . . . . . . . . . . . . . . . . . . . . . . . . . .
2,000
Repair Revenue . . . . . . . . . . . . . . . . . . . . .
2,000
(m)
U li es Expense . . . . . . . . . . . . . . . . . . . . . . .
100
Accounts Payable . . . . . . . . . . . . . . . . . . .
100
(n)
5.

730
Solu ons To Problems
General Journal
Date
Account/Explana on
PR
Debit
Credit
Insurance Expense . . . . . . . . . . . . . . . . . . . . .
150
Prepaid Insurance. . . . . . . . . . . . . . . . . . .
150
(o)
Rent Expense . . . . . . . . . . . . . . . . . . . . . . . . . .
400
Prepaid Rent . . . . . . . . . . . . . . . . . . . . . . .
400
(p)
Supplies . . . . . . . . . . . . . . . . . . . . . . . . . . . . . . .
350
Supplies Expense . . . . . . . . . . . . . . . . . . .
350
(q)
Repair Revenue . . . . . . . . . . . . . . . . . . . . . . . .
2,000
Unearned Revenue . . . . . . . . . . . . . . . . .
2,000
(r)
Wages Expense . . . . . . . . . . . . . . . . . . . . . . . .
1,500
Wages Payable . . . . . . . . . . . . . . . . . . . . .
1,500
(s)
Deprecia on Expense – Truck . . . . . . . . . . .
208
Accumulated Deprecia on – Truck. . . .
208
(t) $10,000/48 mos. = $208 per month*
*Recall that deprecia on is always rounded to the nearest whole dollar because it is not ‘exact’;
deprecia on is based on es mated useful life and es mated residual value.
7.

Chapter 3 Solu ons
731
Roth Contractors Corpora on
Adjusted Trial Balance
December 31, 2015
Account Balances
Debit
Credit
Cash
$ 125
Accounts Receivable
9,000
Prepaid Insurance
1,650
Prepaid Rent
800
Supplies
350
Truck
10,000
Accumulated Deprecia on – Truck
$ 208
Accounts Payable
11,100
Wages Payable
1,500
Unearned Revenue
2,000
Share Capital
5,000
Repair Revenue
11,800
Adver sing Expense
550
Deprecia on Expense – Truck
208
Insurance Expense
150
Interest Expense
250
Rent Expense
400
Supplies Expense
650
Telephone Expense
75
Truck Expense
800
U li es Expense
100
Wages Expense
6,500
Totals
$31,608
$31,608
PROBLEM 3–6
1. The general journal is as follows:
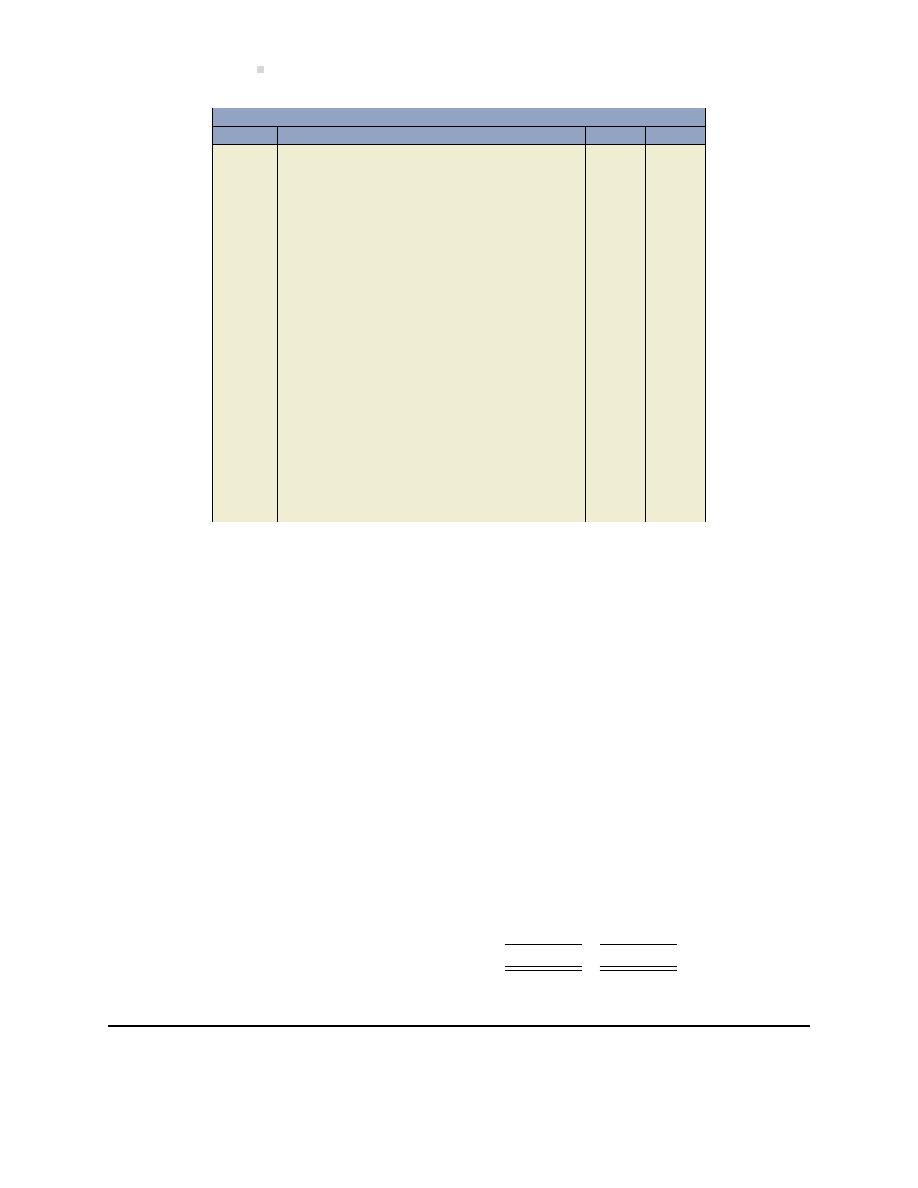
732
Solu ons To Problems
General Journal
Date
Account/Explana on
PR
Debit
Credit
Dec. 31
Repair Revenue . . . . . . . . . . . . . . . . . . . . . . . .
11,800
Income Summary . . . . . . . . . . . . . . . . . . .
11,800
To close revenue account to income sum-
mary.
31
Income Summary . . . . . . . . . . . . . . . . . . . . . .
9,683
Adver sing Expense . . . . . . . . . . . . . . . . .
550
Deprecia on Expense – Truck . . . . . . . .
208
Insurance Expense . . . . . . . . . . . . . . . . . .
150
Interest Expense . . . . . . . . . . . . . . . . . . . .
250
Rent Expense . . . . . . . . . . . . . . . . . . . . . . .
400
Supplies Expense . . . . . . . . . . . . . . . . . . .
650
Telephone Expense . . . . . . . . . . . . . . . . .
75
Truck Expense . . . . . . . . . . . . . . . . . . . . . .
800
U li es Expense . . . . . . . . . . . . . . . . . . . .
100
Wages Expense . . . . . . . . . . . . . . . . . . . . .
6,500
To close expense accounts to income sum-
mary.
31
Income Summary . . . . . . . . . . . . . . . . . . . . . .
2,117
Retained Earnings . . . . . . . . . . . . . . . . . . .
2,117
To close net income in income summary
to retained earnings.
2. The post-closing trial balance is as follows:
Roth Contractors Corpora on
Post-Closing Trial Balance
December 31, 2015
Debits
Credits
Cash
$
125
Accounts receivable
9,000
Prepaid insurance
1,650
Prepaid rent
800
Supplies
350
Truck
10,000
Accumulated deprecia on – truck
$ 208
Accounts payable
11,100
Wages payable
1,500
Unearned revenue
2,000
Share capital
5,000
Retained earnings
2,117
Totals
$21,925
$21,925
PROBLEM 3–7
Chap
ter
3
Soluons
733
1., 3., 6., and 8.
Packer Corpora on
Cash
101
Furniture
182
Accounts
Share
Commissions
Insurance
12,000
3,000
Payable
210
Capital
320
Earned
410
Expense
631
4,400
52,100
37,900
1,800 (a)
900
Accounts
Equipment
183
(g)
750
Bal.
900
Receivable
110
20,000
Interest
Retained
(j)
38,650 Bal. 38,650
(k)
900
3,600
Payable
222
Earnings
340
Bal.
0
Bal.
0
Accumulated
(f)
208
(l)
6,967
Prepaid
Deprecia on
Subscrip on
Interest
Insurance
161
– Building
191
Salaries
Income
Revenue
480
Expense
632
(a)
900
(c) 1,200
Payable
226
Summary
360
(h)
2,000
32,700
2,365
(i)
325
(k) 62,383 (j)
69,350
Bal. 30,700
(f)
208
Accumulated
(l)
6,967
(j)
30,700
Bal.
2,573
Supplies
173
Deprecia on
Unearned Commissions
Bal.
0
(k)
2,573
2,500
– Furniture
192
Revenue
242
Bal.
0
Bal.
0
(b)
350
(d)
300
(g)
750
1,200
Adver sing
Bal.
2,850
Bal.
450
Expense
610
Salaries
Accumulated
4,300 (k)
4,300
Expense
656
Land
180
Deprecia on
Unearned Subscrip ons
Bal.
0
33,475
15,000
– Equipment
193
Revenue
250
(i)
325
(e) 1,000
800
Deprecia on Expense
Bal. 33,800
Building
181
(h)
2,000
– Building
621
(k) 33,800
60,000
Bal.
2,800
(c)
1,200 (k)
1,200
Bal.
0
Bal.
0
Bank Loan
Supplies
Long Term
271
Deprecia on Expense
Expense
668
47,600
– Furniture
622
15,800 (b)
350
(d)
300 (k)
300
Bal. 15,450
Bal.
0
(k) 15,450
Bal.
0
Deprecia on Expense
Equipment
623
U li es
(e)
1,000 (k)
1,000
Expense
676
Bal.
0
2,860 (k)
2,860
Bal.
0
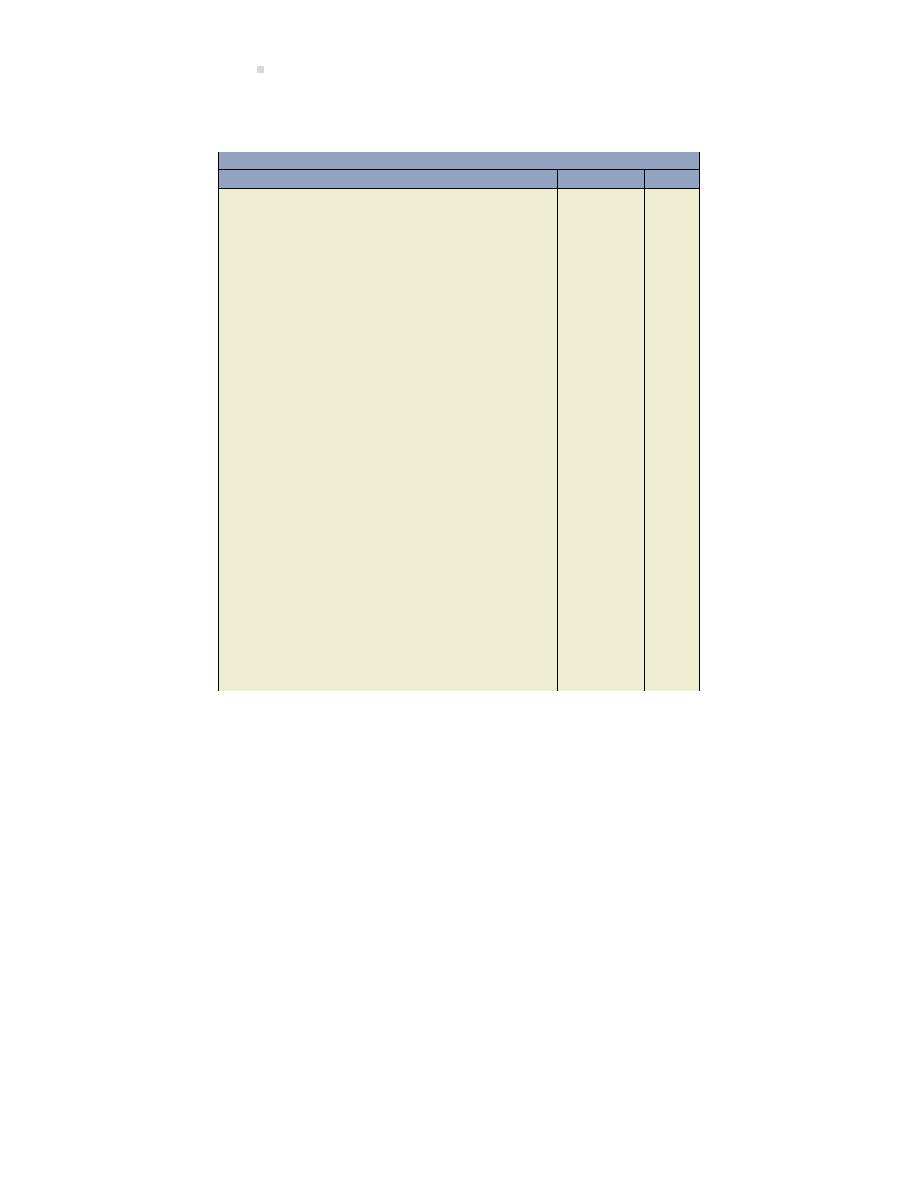
734
Solu ons To Problems
2. Adjus ng entries:
General Journal
Date
Account/Explana on
PR
Debit
Credit
Aug. 31
Prepaid Insurance . . . . . . . . . . . . . . . . . . . . . .
900
Insurance Expense . . . . . . . . . . . . . . . . . .
900
(a) ($1,800
× 6/12 mos. = $900)
31
Supplies . . . . . . . . . . . . . . . . . . . . . . . . . . . . . . .
350
Supplies Expense . . . . . . . . . . . . . . . . . . .
350
(b)
31
Deprecia on Expense – Building . . . . . . . . .
1,200
Accumulated Deprecia on – Building .
1,200
(c) ($60,000
× 12/600 mos. = $1,200)
31
Deprecia on Expense – Furniture . . . . . . . .
300
Accumulated Deprecia on – Furniture
300
(d) ($3,000
× 12/120 mos. = $300)
31
Deprecia on Expense – Equipment . . . . . .
1,000
Accumulated Deprecia on – Equip-
ment . . . . . . . . . . . . . . . . . . . . . . . . . . . . . . . . .
1,000
(e) ($20,000
× 12/240 mos. = $1,000)
31
Interest Expense . . . . . . . . . . . . . . . . . . . . . . .
208
Interest Payable . . . . . . . . . . . . . . . . . . . .
208
(f)
31
Unearned Commissions Revenue . . . . . . . .
750
Commissions Earned . . . . . . . . . . . . . . . .
750
(g)
31
Subscrip on Revenue . . . . . . . . . . . . . . . . . .
2,000
Unearned Subscrip ons Revenue . . . . .
2,000
(h)
31
Salaries Expense . . . . . . . . . . . . . . . . . . . . . . .
325
Salaries Payable . . . . . . . . . . . . . . . . . . . .
325
(i)
4. The adjusted trial balance is as follows:

Chapter 3 Solu ons
735
Packer Corpora on
Adjusted Trial Balance
August 31, 2015
Account Balances
Debit
Credit
Cash
$ 12,000
Accounts Receivable
3,600
Prepaid Insurance
900
Supplies
2,850
Land
15,000
Building
60,000
Furniture
3,000
Equipment
20,000
Accumulated Deprecia on – Building
$ 1,200
Accumulated Deprecia on – Furniture
300
Accumulated Deprecia on – Equipment
1,000
Accounts Payable
4,400
Interest Payable
208
Salaries Payable
325
Unearned Commissions Revenue
450
Unearned Subscrip ons Revenue
2,800
Bank Loan- Long Term
47,600
Share Capital
52,100
Commissions Earned
38,650
Subscrip on Revenue
30,700
Adver sing Expense
4,300
Deprecia on Expense – Building
1,200
Deprecia on Expense – Furniture
300
Deprecia on Expense – Equipment
1,000
Insurance Expense
900
Interest Expense
2,573
Salaries Expense
33,800
Supplies Expense
15,450
U li es Expense
2,860
$179,733
$179,733
5. The income statement, statement of changes in equity, and balance sheet are as follows:

736
Solu ons To Problems
Packer Corpora on
Income Statement
For the Year Ended August 31, 2015
Revenue
Commissions
$38,650
Subscrip ons
30,700
Total Revenue
$69,350
Expenses
Adver sing
4,300
Deprecia on – Building
1,200
Deprecia on – Furniture
300
Deprecia on – Equipment
1,000
Insurance
900
Interest
2,573
Salaries
33,800
Supplies
15,450
U li es
2,860
Total Expenses
62,383
Net Income
$ 6,967
Packer Corpora on
Statement of Changes in Equity
For the Year Ended August 31, 2015
Share
Retained
Total
Capital
Earnings
Equity
Opening Balance
$
-0-
$
-0-
$
-0-
Shares Issued
52,100
-0-
52,100
Net Income
-0-
6,967
6,967
Ending Balance
$52,100
$6,967
$59,067

Chapter 3 Solu ons
737
Packer Corpora on
Balance Sheet
At August 31, 2015
Assets
Cash
$12,000
Accounts Receivable
3,600
Prepaid Insurance
900
Supplies
2,850
Land
15,000
Buildings
$60,000
Less: Accum. Deprecia on
1,200
58,800
Furniture
$3,000
Less: Accum. Deprecia on
300
2,700
Equipment
$20,000
Less: Accum. Deprecia on
1,000
19,000
Total Assets
$114,850
Liabili es
Accounts Payable
$4,400
Interest Payable
208
Salaries Payable
325
Unearned Commissions Revenue
450
Unearned Subscrip ons
2,800
Bank Loan – Long-Term
47,600
Total Liabili es
55,783
Equity
Share Capital
$52,100
Retained Earnings
6,967
Total Equity
59,067
Total Liabili es and Equity
$114,850
6. Closing entries:

738
Solu ons To Problems
General Journal
Date
Account/Explana on
PR
Debit
Credit
Aug. 31
Commissions Earned . . . . . . . . . . . . . . . . . . .
38,650
Subscrip on Revenue . . . . . . . . . . . . . . . . . .
30,700
Income Summary . . . . . . . . . . . . . . . . . . .
69,350
(j)
31
Income Summary . . . . . . . . . . . . . . . . . . . . . .
62,383
Adver sing Expense . . . . . . . . . . . . . . . . .
4,300
Deprecia on Expense – Building . . . . .
1,200
Deprecia on Expense – Furniture . . . .
300
Deprecia on Expense – Equipment . . .
1,000
Insurance Expense . . . . . . . . . . . . . . . . . .
900
Interest Expense . . . . . . . . . . . . . . . . . . . .
2,573
Salaries Expense . . . . . . . . . . . . . . . . . . . .
33,800
Supplies Expense . . . . . . . . . . . . . . . . . . .
15,450
U li es Expense . . . . . . . . . . . . . . . . . . . .
2,860
(k)
31
Income Summary . . . . . . . . . . . . . . . . . . . . . .
6,967
Retained Earnings . . . . . . . . . . . . . . . . . . .
6,967
(l)
Note: The closing entries were posted into the T-accounts as (j), (k), and (l).
7. The post-closing trial balance:
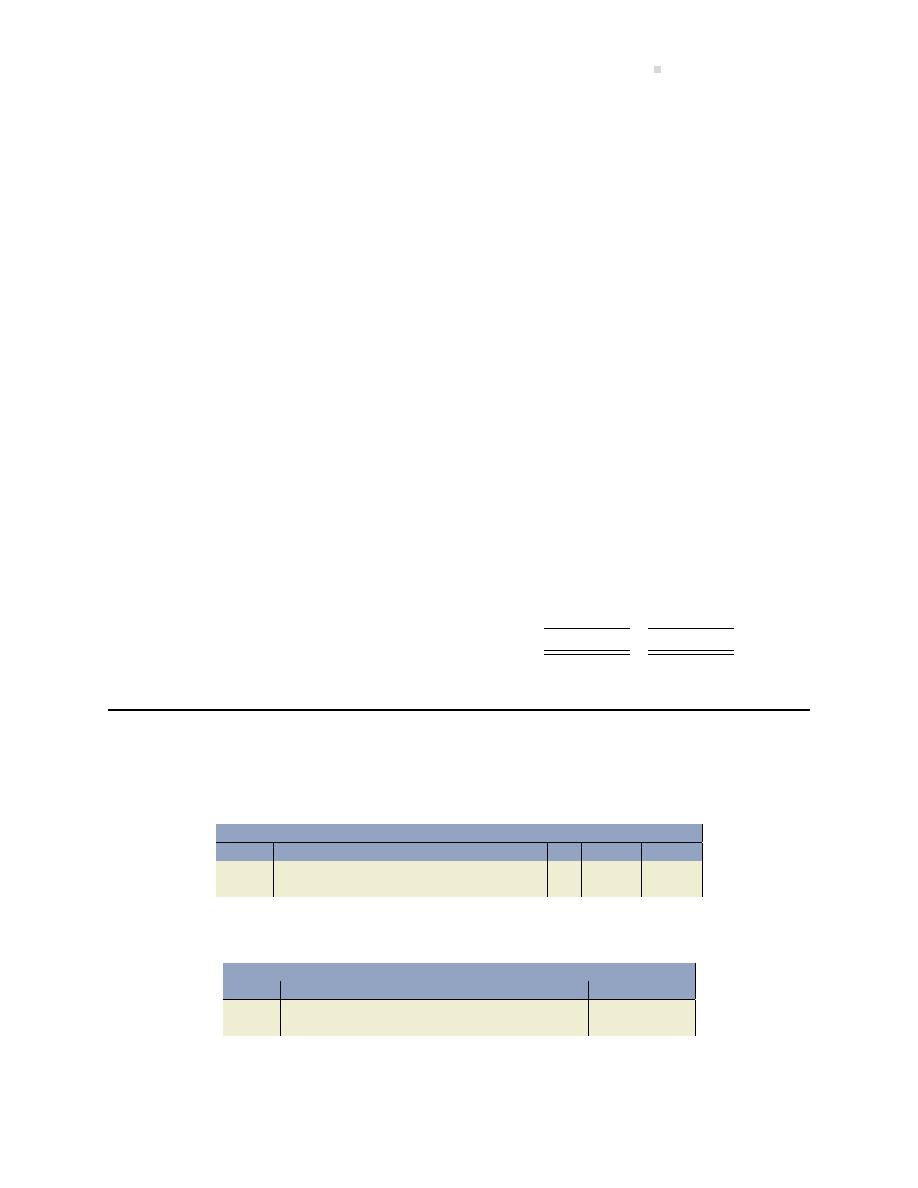
Chapter 3 Solu ons
739
Packer Corpora on
Post-Closing Trial Balance
August 31, 2015
Account Balances
Debit
Credit
Cash
$ 12,000
Accounts Receivable
3,600
Prepaid Insurance
900
Unused Supplies
2,850
Land
15,000
Building
60,000
Furniture
3,000
Equipment
20,000
Accumulated Deprecia on – Building
$ 1,200
Accumulated Deprecia on – Furniture
300
Accumulated Deprecia on – Equipment
1,000
Accounts Payable
4,400
Interest Payable
208
Salaries Payable
325
Unearned Commissions Revenue
450
Unearned Subscrip ons Revenue
2,800
Bank Loan – Long-Term
47,600
Share Capital
52,100
Retained Earnings
6,967
$117,350
$117,350
PROBLEM 3–8
1. a.
General Journal
Date
Account/Explana on
PR
Debit
Credit
Jun 30
Accounts receivable . . . . . . . . . . . . . . . . . . . .
45,000
Service revenue . . . . . . . . . . . . . . . . . . . .
45,000
b.
General Journal
Date
Account/Explana on
PR
Debit
Credit
Jun 30
Adver sing expense . . . . . . . . . . . . . . . . . . . .
500
Prepaid adver sing expense . . . . . . . . .
500
c.
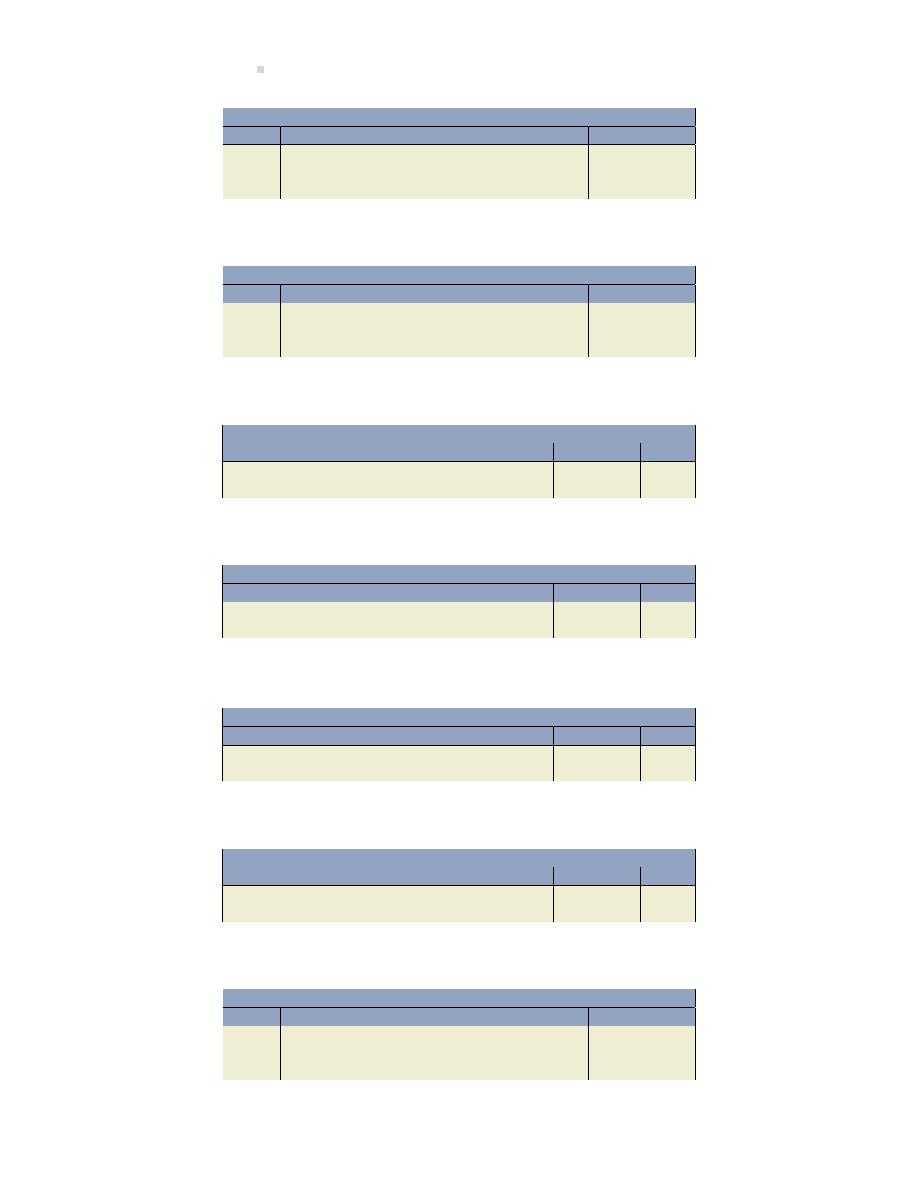
740
Solu ons To Problems
General Journal
Date
Account/Explana on
PR
Debit
Credit
Jun 30
Shop supplies expense . . . . . . . . . . . . . . . . .
300
Shop supplies . . . . . . . . . . . . . . . . . . . . . .
300
($1,500
− $1,200)
d.
General Journal
Date
Account/Explana on
PR
Debit
Credit
Jun 30
Deprecia on expense . . . . . . . . . . . . . . . . . .
79
Accumulated deprecia on, equipment
79
(
$10,000
− $500) ÷ 120 months
e.
General Journal
Date
Account/Explana on
PR
Debit
Credit
Jun 30
Unearned service revenue . . . . . . . . . . . . . .
5,000
Service revenue . . . . . . . . . . . . . . . . . . . .
5,000
f.
General Journal
Date
Account/Explana on
PR
Debit
Credit
Jun 30
Salaries expense . . . . . . . . . . . . . . . . . . . . . . .
5,800
Accrued salaries payable . . . . . . . . . . . .
5,800
g.
General Journal
Date
Account/Explana on
PR
Debit
Credit
Jun 30
U li es expense . . . . . . . . . . . . . . . . . . . . . . .
3,500
Accounts payable . . . . . . . . . . . . . . . . . . .
3,500
h.
General Journal
Date
Account/Explana on
PR
Debit
Credit
Jun 30
Cash . . . . . . . . . . . . . . . . . . . . . . . . . . . . . . . . . .
7,800
Accounts receivable . . . . . . . . . . . . . . . . .
7,800
i.
General Journal
Date
Account/Explana on
PR
Debit
Credit
Jun 30
Deprecia on expense . . . . . . . . . . . . . . . . . .
107
Accumulated deprecia on, building . .
107
(
$74,000
− $10,000) ÷ 600 months
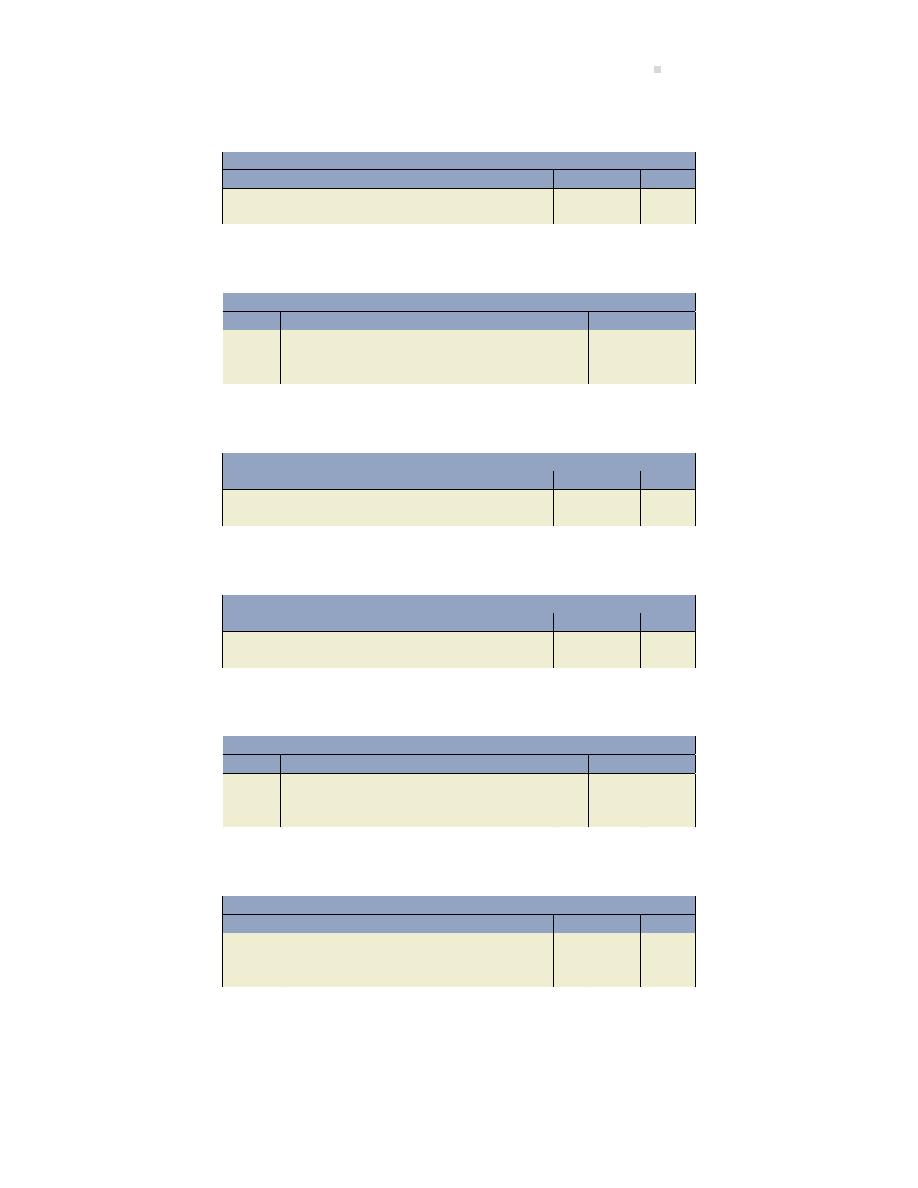
Chapter 3 Solu ons
741
j.
General Journal
Date
Account/Explana on
PR
Debit
Credit
Jun 30
Prepaid rent expense . . . . . . . . . . . . . . . . . . .
5,000
Rent expense . . . . . . . . . . . . . . . . . . . . . . .
5,000
k.
General Journal
Date
Account/Explana on
PR
Debit
Credit
Jun 30
Interest expense . . . . . . . . . . . . . . . . . . . . . . .
100
Interest payable . . . . . . . . . . . . . . . . . . . .
100
($20,000
× 6% × 1 ÷ 12)
l.
General Journal
Date
Account/Explana on
PR
Debit
Credit
Jun 30
Income tax expense . . . . . . . . . . . . . . . . . . . .
3,000
Income taxes payable . . . . . . . . . . . . . . .
3,000
m.
General Journal
Date
Account/Explana on
PR
Debit
Credit
Jun 30
Accounts receivable . . . . . . . . . . . . . . . . . . . .
9,000
Service revenue . . . . . . . . . . . . . . . . . . . .
9,000
n.
General Journal
Date
Account/Explana on
PR
Debit
Credit
Jun 30
Insurance expense . . . . . . . . . . . . . . . . . . . . .
75
Prepaid insurance . . . . . . . . . . . . . . . . . . .
75
($1,800
× 1 ÷ 24)
o.
General Journal
Date
Account/Explana on
PR
Debit
Credit
Jun 30
Insurance expense . . . . . . . . . . . . . . . . . . . . .
2,400
Prepaid insurance . . . . . . . . . . . . . . . . . . .
2,400
(
$4,500
− $1,800) = $2,700 − $300
2.

742
Soluons
To
Pr
oblems

Chap
ter
3
Soluons
743
Quer n Quick Fix Ltd.
Trial Balance
At October 31, 2016
Unadjusted Trial Balance
Adjustments
Adjusted Trial Balance
Debit
Credit
Debit
Credit
Debit
Credit
Cash
$ 50,400
$ 7800
$ 58,200
Accounts receivable
25,000
45,000
7,800
71,200
9,000
Shop supplies
1,500
300
1,200
Prepaid insurance expense
4,500
75
2,025
2,400
Prepaid adver sing expense
2,000
500
1,500
Prepaid rent expense
–
5,000
5,000
Building
74,000
74,000
Accumulated deprecia on, building
–
107
107
Equipment
10,000
10,000
Accumulated deprecia on, equipment
$
2,000
79
2,079
Accounts payable
12,000
3,500
15,500
Accrued salaries payable
–
5,800
5,800
Interest payable
–
100
100
Income taxes payable
–
3,000
3,000
Notes payable
20,000
20,000
Unearned service revenue
30,000
5,000
25,000
Share capital
1,000
1,000
Retained earnings
40,400
40,400
Service revenue
125,000
45,000
184,000
5,000
9,000
Salaries expense
22,000
5,800
27,800
Insurance expense
–
75
2,475
2,400
Interest expense
–
100
100
Shop supplies expense
200
300
500
Adver sing expense
2,200
500
2,700
Deprecia on expense
1,400
79
1,586
107
Maintenance service expenses
5,200
5,200
Rent expense
20,000
5,000
15,000
Income tax expense
–
3,000
3,000
U li es expense
12,000
3,500
15,500
$230,400
$230,400
$87,661
$87,661
$296,986
$296,986

744
Solu ons To Problems
PROBLEM 3–9
Smith and Smith Co.
Income Statement
For the Month Ended June 30, 2016
Revenues
Service revenue
$184,000
Expenses
Salaries expense
$27,800
Insurance expense
2,475
Interest expense
100
Shop supplies expense
500
Adver sing expense
2,700
Deprecia on expense
1,586
Maintenance service expense
5,200
Rent expense
15,000
Income tax expense
3,000
U li es expense
15,500
73,861
Net loss
$110,139
Smith and Smith Co.
Statement of Changes in Equity
For the Month Ended June 30, 2016
Share
Retained
Total
Capital
Earnings
Equity
Opening balance, June 1, 2016
$1,000
$ 40,400
$ 41,400
Net income
110,139
110,139
Ending balance
$1,000
$150,539
$151,539
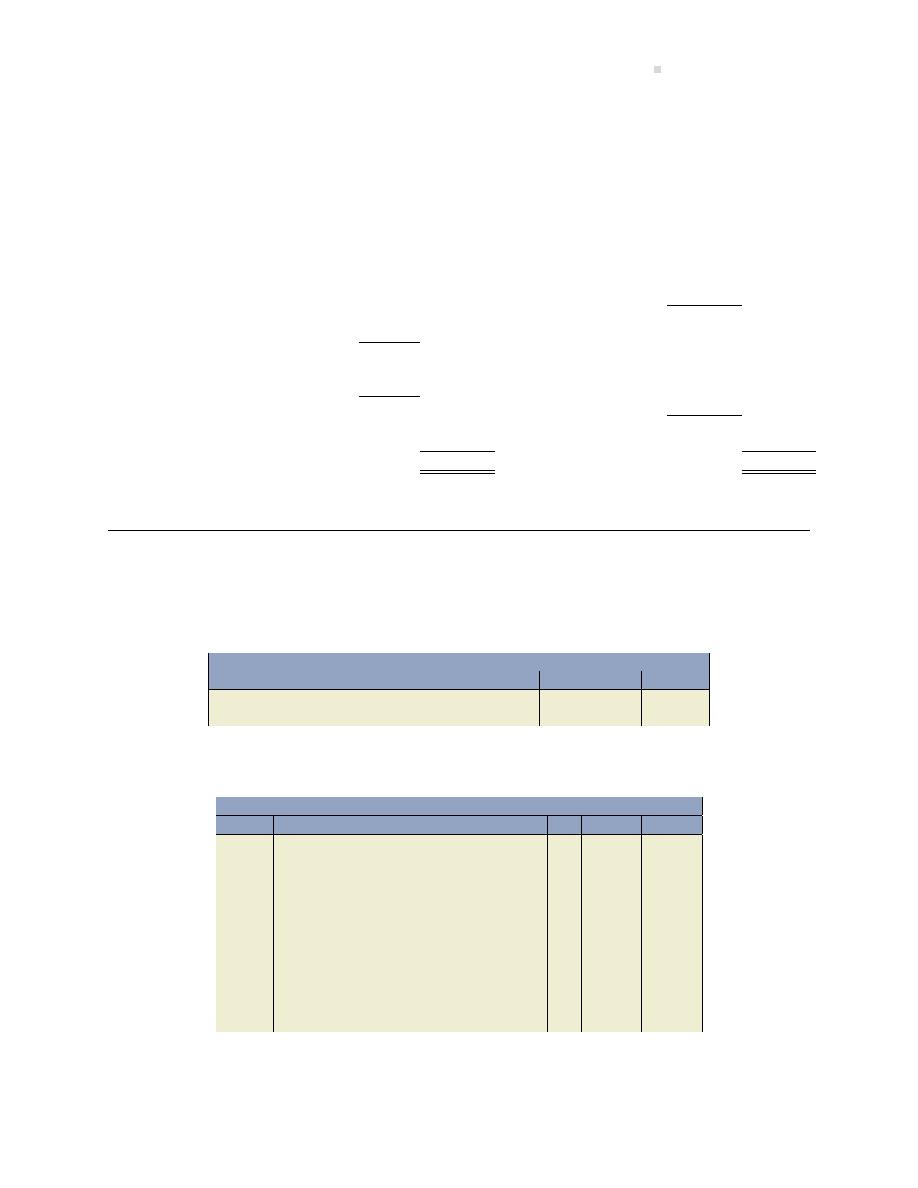
Chapter 3 Solu ons
745
Smith and Smith Co.
Balance Sheet
At June 30, 2016
Assets
Liabili es
Cash
$ 58,200
Accounts payable
$ 15,500
Accounts receivable
71,200
Accrued salaries
5,800
Shop supplies
1,200
Interest payable
100
Prepaid insurance expense
2,025
Income taxes payable
3,000
Prepaid adver sing expense
1,500
Note payable
20,000
Repaid rent expense
5,000
Unearned consul ng fees
25,000
Building
74,000
Total liabili es
$ 69,400
Accumulated deprecia on, building
(107)
73,893
Equipment
10,000
Equity
Accumulated deprecia on, equipment
(2,079)
7,921
Share capital
$
1,000
Retained earnings
150,539
Total equity
Total liabili es and equity
151,539
Total assets
$220,939
$220,939
PROBLEM 3–10
a. 1. Close revenue accounts to income summary account.
General Journal
Date
Account/Explana on
PR
Debit
Credit
Jun 30
Services revenue . . . . . . . . . . . . . . . . . . . . . . .
184,000
Income summary . . . . . . . . . . . . . . . . . . .
184,000
2. Close expense accounts to income summary account.
General Journal
Date
Account/Explana on
PR
Debit
Credit
Jun 30
Income summary . . . . . . . . . . . . . . . . . . . . . .
73,861
Salaries expense . . . . . . . . . . . . . . . . . . . .
27,800
Insurance expense . . . . . . . . . . . . . . . . . .
2,475
Interest expense . . . . . . . . . . . . . . . . . . . .
100
Shop supplies expense . . . . . . . . . . . . . .
500
Adver sing expense . . . . . . . . . . . . . . . . .
2,700
Deprecia on expense . . . . . . . . . . . . . . .
1,586
Maintenance service expenses . . . . . . .
5,200
Rent expense . . . . . . . . . . . . . . . . . . . . . . .
15,000
Income tax expense . . . . . . . . . . . . . . . . .
3,000
U li es expense . . . . . . . . . . . . . . . . . . . .
15,500
3. Close the income summary account to retained earnings.

746
Solu ons To Problems
General Journal
Date
Account/Explana on
PR
Debit
Credit
Jun 30
Income summary . . . . . . . . . . . . . . . . . . . . . .
110,139
Retained earnings . . . . . . . . . . . . . . . . . .
110,139
4. Close dividends to retained earnings: No entry required.
b.
Smith and Smith Co.
Trial Balance
At June 30, 2016
Post-Closing Trial Balance
Debit
Credit
Cash
$ 58,200
Accounts receivable
71,200
Shop supplies
1,200
Prepaid insurance expense
2,025
Prepaid adver sing expense
1,500
Prepaid rent expense
5,000
Building
74,000
Accumulated deprecia on, building
$
107
Equipment
10,000
Accumulated deprecia on, equipment
2,079
Accounts payable
15,500
Accrued salaries payable
5,800
Interest payable
100
Income taxes payable
3,000
Notes payable
20,000
Unearned service revenue
25,000
Share capital
1,000
Retained earnings
150,539
$223,125
$223,125
Chapter 4 Solu ons
PROBLEM 4–1

Chapter 4 Solu ons
747
Norman Company Ltd.
Balance Sheet
At December 31, 2015
Assets
Current
Cash
$250
Accounts Receivable
138
Notes Receivable
18
Prepaid Insurance
12
Unused Office Supplies
70
Total Current Assets
$488
Property, Plant, and Equipment
Land
115
Building
400
Equipment
140
Net Property, Plant, and Equipment
655
Total Assets
$1,143
Liabili es
Current
Accounts Payable
$125
Bank Loan
110
Salaries Payable
14
Total Current Liabili es
$249
Non-current
Mortgage Payable
280
Total Liabili es
529
Equity
Share Capital
400
Retained Earnings
214
Total Equity
614
Total Liabili es and Equity
$1,143
PROBLEM 4–2
1. Calcula on of net income:

748
Solu ons To Problems
Revenue
$80,000
Salaries Expense
(39,000)
Deprecia on
(1,100)
Interest
(1,300)
Income Taxes
(2,300)
Adver sing
(7,200)
Insurance
(1,200)
U li es
(3,600)
Telephone
(1,100)
Rent
(17,950)
Net Income
$5,250
2. The statement of changes in equity is as follows:
Dark Edge Sports Inc.
Statement of Changes in Equity
For the Year Ended December 31, 2015
Share
Retained
Total
Capital
Earnings
Equity
Opening Balance
$3,000
$2,000
$5,000
Net Income
5,250
5,250
Dividends
(600)
(600)
Ending Balance
$3,000
$6,650
$9,650
3. The balance sheet is as follows:

Chapter 4 Solu ons
749
Dark Edge Sports Inc.
Balance Sheet
At December 31, 2015
Assets
Current
Cash
$1,500
Accounts Receivable
18,700
Prepaid Expenses (1,300 + 600)
1,900
Total Current Assets
22,100
Property, Plant, and Equipment
Equipment
$12,500
Less: Accumulated Deprecia on
2,000
Net Property, Plant, and Equipment
10,500
Total Assets
$32,600
Liabili es
Current
Bank Loan*
$10,000
Accounts Payable
8,350
Income Taxes Payable
4 ,600
Total Current Liabili es
$22,950
Equity Share Capital
3,000
Retained Earnings
6,650
Total Equity
9,650
Total Liabili es and Equity
$32,600
*Alternately, with appropriate disclosure, “Borrowings”
4. Amount by which total current liabili es exceed total current assets:
Current Assets
$22,100
Current Liabili es
22,950
Difference
$ 850
5. A er the $5,000 bank loan is received, both current assets and current liabili es will increase
by the same amount (Debit to Cash; credit to Bank Loan). The difference will remain $850.
6. The company appears to have nega ve working capital (current assets less current liabili es)
with or without the loan. More informa on should be requested, such as why the loan is
needed. If it will be used to purchase a non-current asset like more equipment, perhaps the
loan repayment terms should be extended by several years in which case the loan would be
classified as a long-term liability causing working capital to be posi ve instead of nega ve
as a result of the loan.
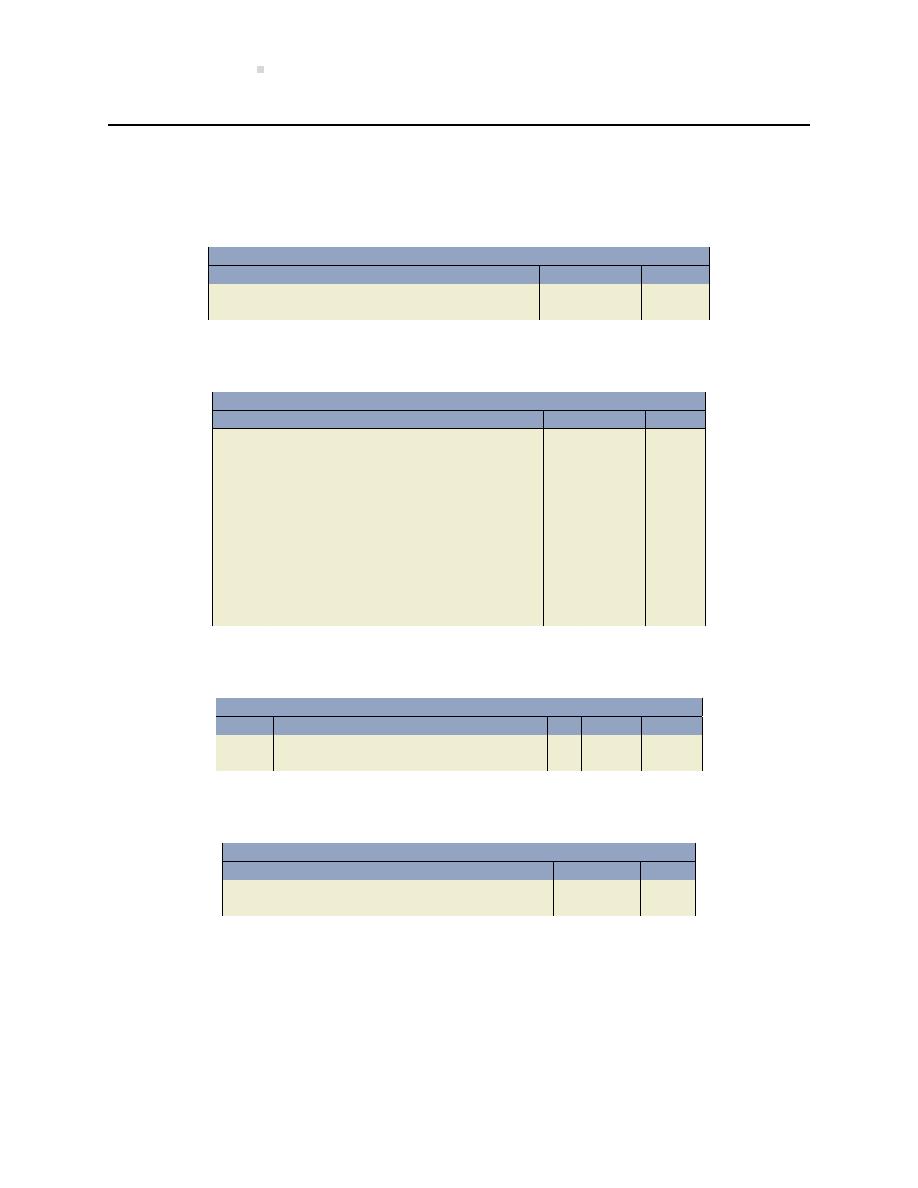
750
Solu ons To Problems
PROBLEM 4–3
1. 1. Close revenue accounts to income summary account.
General Journal
Date
Account/Explana on
PR
Debit
Credit
Jun 30
Revenue . . . . . . . . . . . . . . . . . . . . . . . . . . . . . .
135,000
Income summary . . . . . . . . . . . . . . . . . . .
135,000
2. Close expense accounts to income summary account.
General Journal
Date
Account/Explana on
PR
Debit
Credit
Jun 30
Income summary . . . . . . . . . . . . . . . . . . . . . .
155,092
Adver sing expense . . . . . . . . . . . . . . . . .
5,670
Deprecia on expense . . . . . . . . . . . . . . .
3,332
Income tax expense . . . . . . . . . . . . . . . . .
6,300
Insurance expense . . . . . . . . . . . . . . . . . .
5,180
Interest expense . . . . . . . . . . . . . . . . . . . .
210
Rent expense . . . . . . . . . . . . . . . . . . . . . . .
31,500
Salaries expense . . . . . . . . . . . . . . . . . . . .
58,380
Shop supplies expense . . . . . . . . . . . . . .
1,050
U li es expense . . . . . . . . . . . . . . . . . . . .
32,550
Repairs expense . . . . . . . . . . . . . . . . . . . .
10,920
3. Close the income summary account to retained earnings.
General Journal
Date
Account/Explana on
PR
Debit
Credit
Jun 30
Retained earnings . . . . . . . . . . . . . . . . . . . . . .
20,092
Income summary . . . . . . . . . . . . . . . . . . .
20,092
4. Close dividends to retained earnings.
General Journal
Date
Account/Explana on
PR
Debit
Credit
Jun 30
Retained earnings . . . . . . . . . . . . . . . . . . . . . .
7,000
Cash dividends . . . . . . . . . . . . . . . . . . . . .
7,000
2.

Chap
ter
4
Soluons
751
MayBee Services Ltd.
Balance Sheet
At June 30, 2016
Assets
Liabili es
Cash
$122,220
Accounts payable
$ 32,550
Accounts receivable
149,520
Accrued salaries payable
12,180
Office supplies
2,520
Income taxes payable
6,300
Prepaid insurance expense
17,906
Interest payable
210
Total current assets
292,166
Current por on of long-term debt
14,000
Unearned revenue
52,500
Property, Plant and Equipment
Total current liabili es
117,740
Building
$145,400
Accumulated deprecia on, building
(280)
$145,120
Long-term Liabili es
Equipment
21,000
Notes payable
28,000
Accumulated deprecia on, equipment
(4,480)
16,520
161,640
Total liabili es
145,740
Intangible assets
Equity
Trademark
10,000
Share capital
$
2,100
Retained earnings
315,966*
Total equity
318,066
Total assets
$463,806
Total liabili es and equity
$463,806
* Retained earnings ($343,058
− 7,000 − 20,092) = $315,966

752
Solu ons To Problems
3.
MayBee Services Ltd.
Post-closing Trial Balance
At June 30, 2016
Debit
Credit
Cash
$122,220
Accounts receivable
149,520
Office supplies
2,520
Prepaid insurance expense
17,906
Building
145,400
Accumulated deprecia on, building
$
280
Equipment
21,000
Accumulated deprecia on, equipment
4,480
Trademark
10,000
Accounts payable
32,550
Accrued salaries payable
12,180
Income taxes payable
6,300
Interest payable
210
Unearned revenue
52,500
Notes payable*
42,000
Share capital
2,100
Retained earnings
315,966
$468,566
$468,566
* The notes payable account is not separated into two accounts for current and long-term
por ons. The disclosure of the current and long-term por ons is for repor ng purposes
only.
PROBLEM 4–4
1.
2.

Chapter 4 Solu ons
753
Jenne e Ltd.
Adjusted Trial Balance
At September 30, 2016
Unadjusted Trial Balance
Adjustments
Adjusted Trial Balance
Debit
Credit
Debit
Credit
Debit
Credit
Accounts payable
$
39,983
$
39,983
Accounts receivable
$ 321,468
$20,000
$ 341,468
Accrued salaries payable
21,909
$ 2,500
24,409
Accumulated deprecia on, building
9,632
8,504
18,136
Accumulated deprecia on, vehicle
602
3,000
3,602
Adver sing expense
12,191
12,191
Building
312,610
312,610
Cash
262,773
262,773
Cash dividends
15,050
15,050
Copyright
21,500
21,500
Deprecia on expense
7,164
8,504
18,668
3,000
Income tax expense
13,545
13,545
Income taxes payable
13,545
13,545
Insurance expense
11,137
4,249
15,386
Interest expense
452
452
Interest payable
4,730
4,730
Mortgage payable, due 2019
90,300
90,300
Office supplies
5,418
5,418
Prepaid insurance expense
8,498
4,249
4,249
Prepaid rent expense
5,150
5,150
Rent expense
67,725
5,150
62,575
Repairs expense
23,478
23,478
Retained earnings
737,575
737,575
Revenue
290,250
20,000
360,250
50,000
Salaries expense
155,517
2,500
158,017
Share capital
4,515
4,515
Shop supplies expense
2,259
2,259
Unearned revenue
112,875
50,000
62,875
U li es expense
39,981
39,981
Vehicle
45,150
45,150
$1,325,916
$1,325,916
$93,403
$93,403
$1,359,920
$1,359,920
3.

754
Soluons
To
Pr
oblems
Jenne e Ltd.
Balance Sheet
At September 30, 2016
Assets
Liabili es
Cash
$262,773
Accounts payable
$ 39,983
Accounts receivable
341,468
Accrued salaries payable
24,409
Office supplies
5,418
Income taxes payable
13,545
Prepaid insurance expense
4,249
Interest payable
4,730
Prepaid rent expense
5,150
Current por on of long-term debt
30,000
Total current assets
619,058
Unearned revenue
62,875
Total current liabili es
175,542
Property, Plant and Equipment
Building
$312,610
Long-term Liabili es
Accumulated deprecia on, building
(18,136)
$294,474
Notes payable
60,300
Vehicle
45,150
Total liabili es
235,842
Accumulated deprecia on, vehicle
(3,602)
41,548
336,022
Equity
Intangible assets
Share capital
$
4,515
Copyright
21,500
Retained earnings
736,223*
Total equity
740,738
Total assets
$976,580
Total liabili es and equity
$976,580
Net income (360,250
− 12,191 − 18,668 − 13,545 − 15,386 − 452 − 62,575 − 23,478 −
158,017
− 2,259 − 39,981) = 13,698
* Retained earnings ($737,575 + 13,698
− 15,050) = 736,223
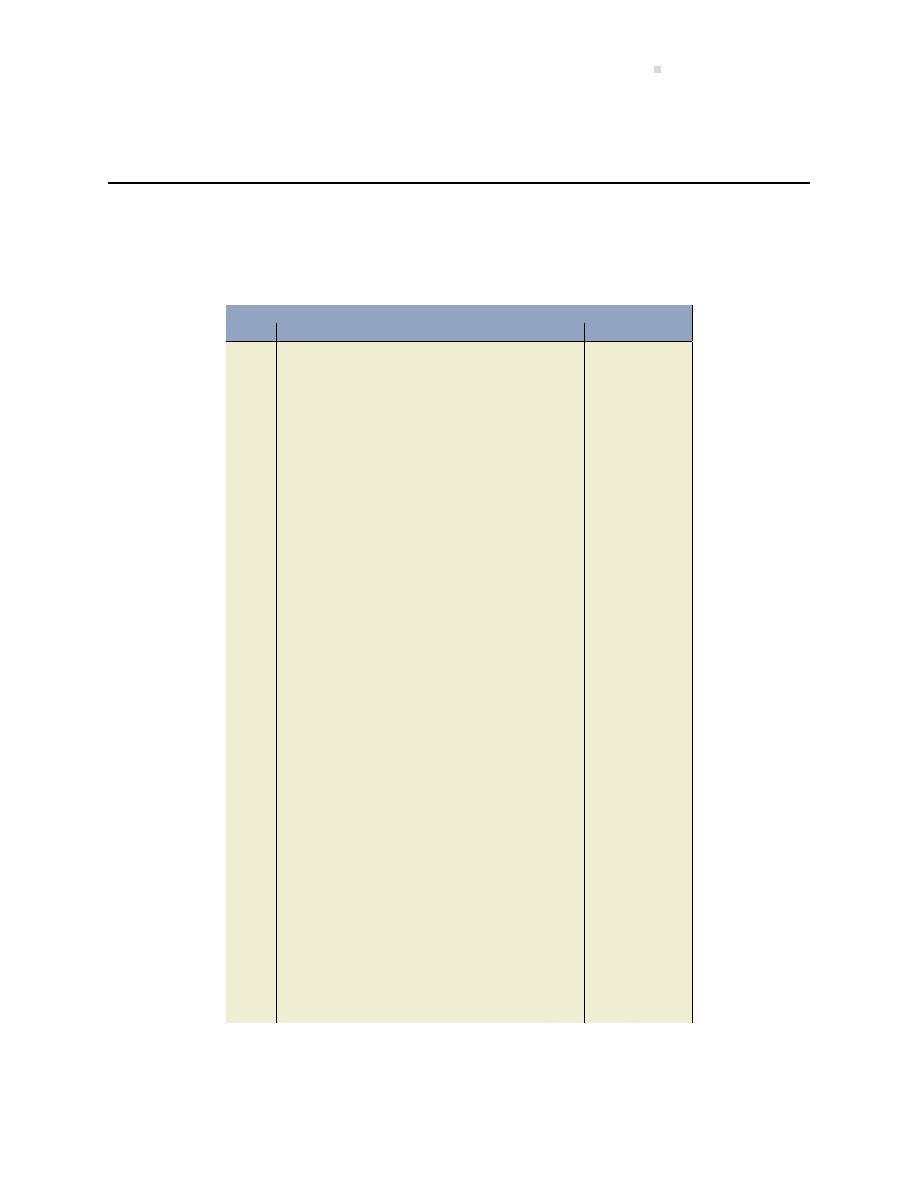
Chapter 5 Solu ons
755
Chapter 5 Solu ons
PROBLEM 5–1
1. The Salem Corp. general journal is as follows:
General Journal
Date
Account/Explana on
PR
Debit
Credit
Jul. 2
Cash . . . . . . . . . . . . . . . . . . . . . . . . . . . . . . . . . .
5,000
Share Capital . . . . . . . . . . . . . . . . . . . . . . .
5,000
To record the issue of common shares.
2
Merchandise Inventory . . . . . . . . . . . . . . . . .
3,500
Accounts Payable . . . . . . . . . . . . . . . . . . .
3,500
To record Purchases on credit 2/10, n/30,
from Blic Pens, Ltd.
2
Accounts Receivable . . . . . . . . . . . . . . . . . . .
2,000
Sales . . . . . . . . . . . . . . . . . . . . . . . . . . . . . .
2,000
To record sale to Spellman Chair Rentals,
Inc.; terms 2/10, n/30.
Cost of Goods Sold . . . . . . . . . . . . . . . . . . . . .
1,200
Merchandise Inventory . . . . . . . . . . . . . .
1,200
To record the cost of sales.
3
Rent Expense . . . . . . . . . . . . . . . . . . . . . . . . . .
500
Cash . . . . . . . . . . . . . . . . . . . . . . . . . . . . . . .
500
To record July rent payment.
5
Equipment . . . . . . . . . . . . . . . . . . . . . . . . . . . .
1,000
Cash . . . . . . . . . . . . . . . . . . . . . . . . . . . . . . .
1,000
To record purchase of equipment.
8
Cash . . . . . . . . . . . . . . . . . . . . . . . . . . . . . . . . . .
200
Sales . . . . . . . . . . . . . . . . . . . . . . . . . . . . . .
200
To record cash sale to Ethan Ma hews
Furniture Ltd.
Cost of Goods Sold . . . . . . . . . . . . . . . . . . . . .
120
Merchandise Inventory . . . . . . . . . . . . . .
120
To record the cost of sales.
8
Merchandise Inventory . . . . . . . . . . . . . . . . .
2,000
Accounts Payable . . . . . . . . . . . . . . . . . . .
2,000
To record purchase of merchandise inven-
tory; terms 2/15, n/30, from Shaw Distrib-
utors, Inc.
9
Cash . . . . . . . . . . . . . . . . . . . . . . . . . . . . . . . . . .
1,960
Sales Discount . . . . . . . . . . . . . . . . . . . . . . . . .
40
Accounts Receivable . . . . . . . . . . . . . . . .
2,000
To record receipt of amount due from
Spellman Chair Rentals, Inc. less the dis-
count.
756
Solu ons To Problems
General Journal
Date
Account/Explana on
PR
Debit
Credit
10
Accounts Payable . . . . . . . . . . . . . . . . . . . . . .
3,500
Cash . . . . . . . . . . . . . . . . . . . . . . . . . . . . . . .
3,430
Merchandise Inventory . . . . . . . . . . . . . .
70
To record payment to Blic Pens Ltd. less
the discount.
10
Merchandise Inventory . . . . . . . . . . . . . . . . .
200
Accounts Payable . . . . . . . . . . . . . . . . . . .
200
To record purchase of merchandise inven-
tory from Peel Products, Inc.; terms n/30.
Jul. 15
Accounts Receivable . . . . . . . . . . . . . . . . . . .
2,000
Sales . . . . . . . . . . . . . . . . . . . . . . . . . . . . . .
2,000
To record sale to Eagle Products Corp.
2/10, n/30.
Cost of Goods Sold . . . . . . . . . . . . . . . . . . . . .
1,300
Merchandise Inventory . . . . . . . . . . . . . .
1,300
To record the cost of sales.
15
Merchandise Inventory . . . . . . . . . . . . . . . . .
1,500
Accounts Payable . . . . . . . . . . . . . . . . . . .
1,500
To record purchase of merchandise inven-
tory from Bevan Door, Inc.; terms 2/10,
n/30.
15
Accounts Payable . . . . . . . . . . . . . . . . . . . . . .
100
Merchandise Inventory . . . . . . . . . . . . . .
100
To record credit memo from Shaw Distrib-
utors, Inc.
16
Sales Returns and Allowances . . . . . . . . . . .
200
Accounts Receivable . . . . . . . . . . . . . . . .
200
To record return of defec ve items sold to
Eagle Products Corp.; inventory scrapped.
20
Accounts Receivable . . . . . . . . . . . . . . . . . . .
3,500
Sales . . . . . . . . . . . . . . . . . . . . . . . . . . . . . .
3,500
To record sale to Aspen Promo ons, Ltd.
2/10, n/30.
Cost of Goods Sold . . . . . . . . . . . . . . . . . . . . .
2,700
Merchandise Inventory . . . . . . . . . . . . . .
2,700
To record the cost of sales.
20
Accounts Payable . . . . . . . . . . . . . . . . . . . . . .
950
Cash . . . . . . . . . . . . . . . . . . . . . . . . . . . . . . .
931
Merchandise Inventory . . . . . . . . . . . . . .
19
To record payment of half of the amount
due to Shaw Distributors, Inc. less memo
and less discount.
24
Cash . . . . . . . . . . . . . . . . . . . . . . . . . . . . . . . . . .
882
Sales Discounts . . . . . . . . . . . . . . . . . . . . . . . .
18
Accounts Receivable . . . . . . . . . . . . . . . .
900
To record receipt of half of the amount
due from Eagle Products Corp.; 2,000
−
200 return = 1,800/2 = 900.
24
Accounts Payable . . . . . . . . . . . . . . . . . . . . . .
1,500
Cash . . . . . . . . . . . . . . . . . . . . . . . . . . . . . . .
1,470
Merchandise Inventory . . . . . . . . . . . . . .
30
To record payment made to Bevan Door,
Inc. less discount.
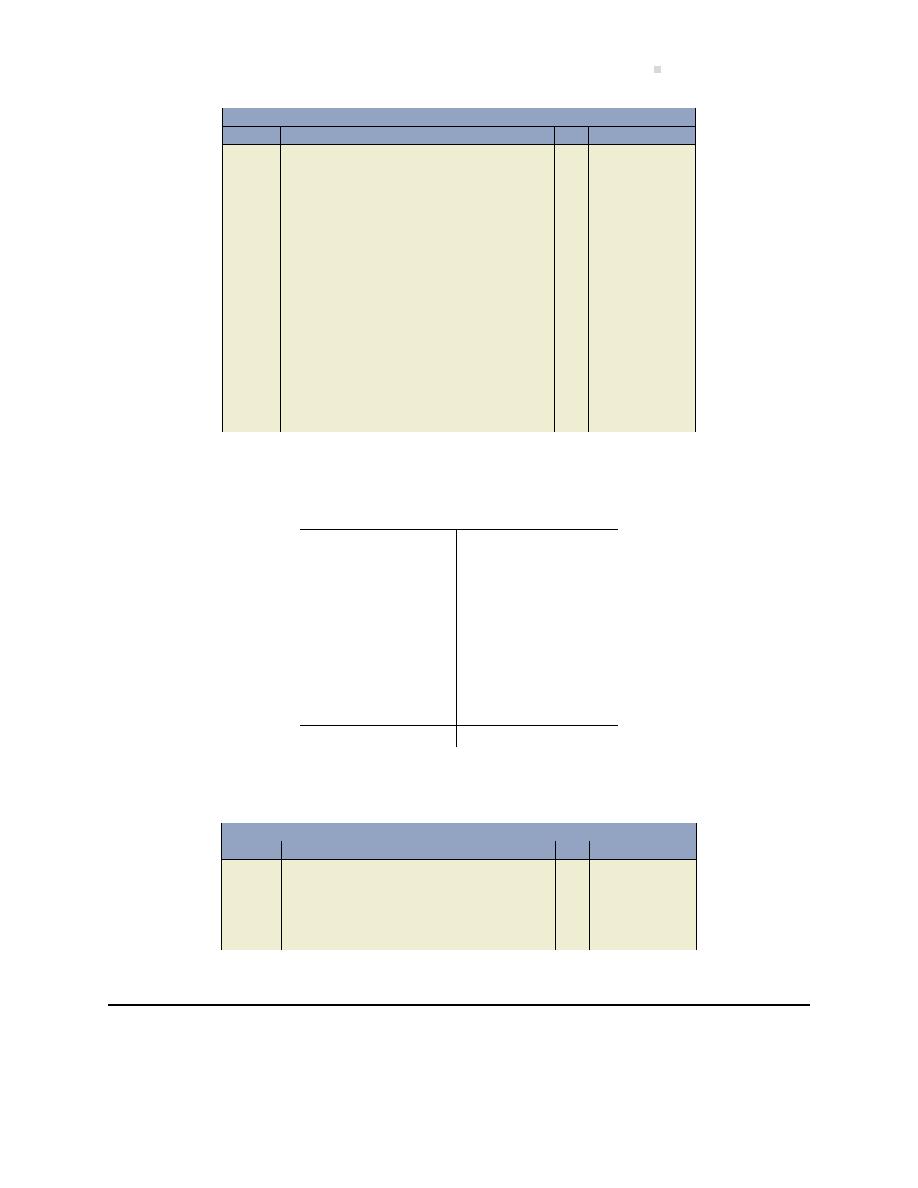
Chapter 5 Solu ons
757
General Journal
Date
Account/Explana on
PR
Debit
Credit
26
Accounts Receivable . . . . . . . . . . . . . . . . . . .
600
Sales . . . . . . . . . . . . . . . . . . . . . . . . . . . . . .
600
To record sale to Longbeach Sales, Ltd. for
terms 2/10, n/30.
Cost of Goods Sold . . . . . . . . . . . . . . . . . . . . .
400
Merchandise Inventory . . . . . . . . . . . . . .
400
To record the cost of sales.
Jul. 26
Merchandise Inventory . . . . . . . . . . . . . . . . .
800
Accounts Payable . . . . . . . . . . . . . . . . . . .
800
To record purchase from Silverman Co. for
terms 2/10, n/30.
31
Merchandise Inventory . . . . . . . . . . . . . . . . .
350
Cash . . . . . . . . . . . . . . . . . . . . . . . . . . . . . . .
350
To record payment to Speedy Transport
Co. for July transport of inventory to ware-
house.
2. The unadjusted ending balance in merchandise inventory is as follows:
Merchandise Inventory
2-Jul
3,500
1,200
2-Jul
8-Jul
2,000
120
8-Jul
10-Jul
200
70
10-Jul
15-Jul
1,500
1,300
15-Jul
26-Jul
800
100
15-Jul
31-Jul
350
2,700
20-Jul
19
20-Jul
30
24-Jul
400
26-Jul
Unadj. Bal.
2,411
3. The general journal entry is as follows:
General Journal
Date
Account/Explana on
PR
Debit
Credit
July 31
Cost of Goods Sold . . . . . . . . . . . . . . . . . . . . .
11
Merchandise Inventory . . . . . . . . . . . . . .
11
To record adjustment to merchandise in-
ventory calculated as $2,411
− $2,400 =
$11.
PROBLEM 5–2

758
Solu ons To Problems
Sales
$37,800
Less: Sales Returns and Allowances
690
Sales Discounts
310
Net Sales
$36,800
Cost of Goods Sold
26,800
Gross Profit
$10,000
PROBLEM 5–3
1. The income statement and statement of changes in equity are as follows:

Chapter 5 Solu ons
759
Acme Automo ve Inc.
Income Statement
Year Ended December 31, 2015
Sales
$310,000
Less: Sales returns and allowances
$2,900
Sales discounts
1,300
4,200
Net sales
$305,800
Cost of goods sold
126,000
Gross profit
$179,800
Opera ng expenses:
Selling expenses:
Adver sing expense
$14,000
Commissions expense
29,000
Delivery expense
14,800
Rent expense
19,440
Sales salaries expense
26,400
Total selling expenses
$103,640
General and administra ve expenses:
Deprecia on expense
$12,000
Insurance expense
10,400
Office supplies expense
3,100
Rent expense
12,960
Telephone expense
1,800
U li es expense
4,200
Wages expense – office
14,300
Total general and administra ve expenses
58,760
Total opera ng expenses
162,400
Income from opera ons
$17,400
Other revenues and expenses:
Rent revenue
$19,200
Interest expense
(840)
18,360
Income before tax
$35,760
Income tax expense
4,200
Net income
$31,560
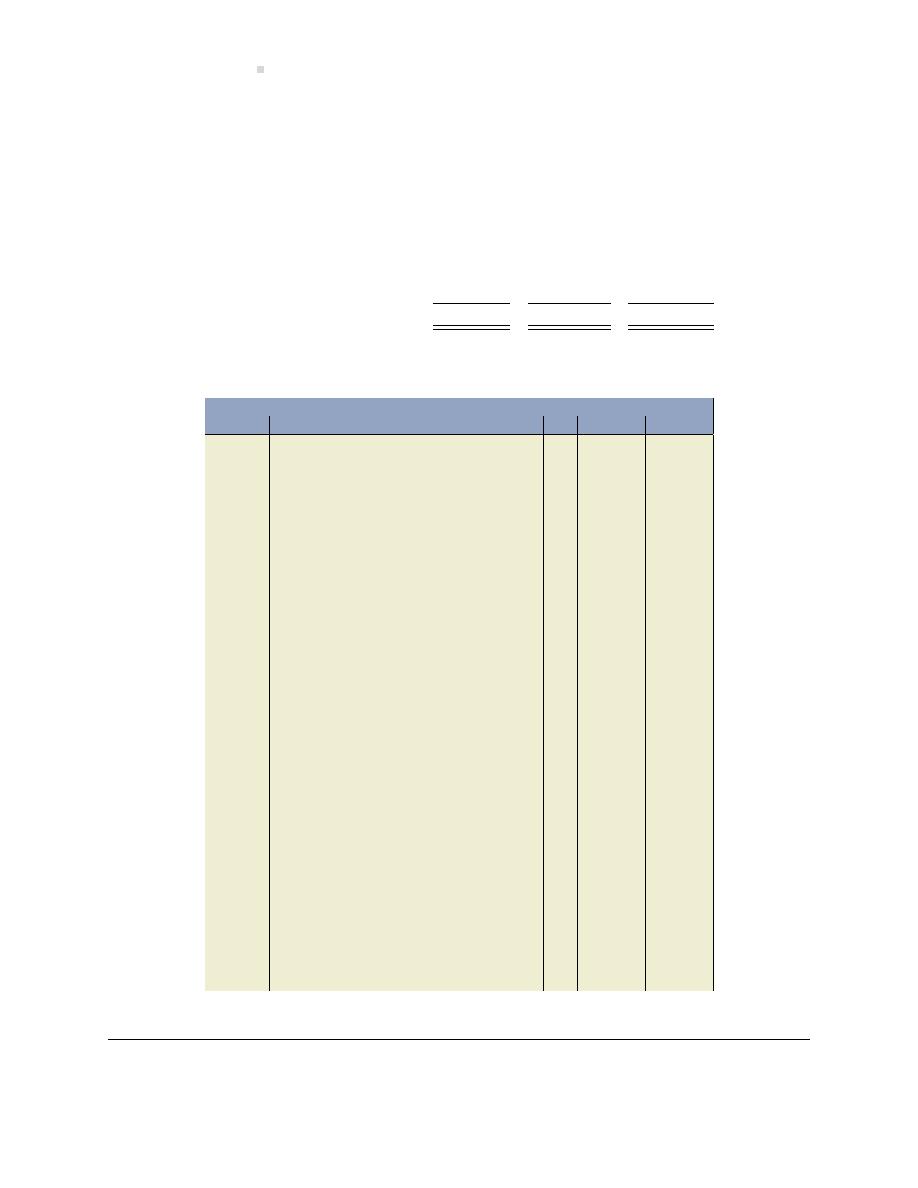
760
Solu ons To Problems
Acme Automo ve Inc.
Statement of Changes in Equity
Year Ended December 31, 2015
Share
Retained
Total
Capital
Earnings
Equity
Opening balance
$50,000
$12,440
$62,440
Shares issued
20,000
20,000
Net income
31,560
31,560
Dividends
(11,000)
(11,000)
Ending balance
$70,000
$33,000
$103,000
2. Closing entries:
General Journal
Date
Account/Explana on
PR
Debit
Credit
Dec. 31
Sales . . . . . . . . . . . . . . . . . . . . . . . . . . . . . . . . . .
310,000
Rent Sales . . . . . . . . . . . . . . . . . . . . . . . . . . . . .
19,200
Income Summary . . . . . . . . . . . . . . . . . . .
329,200
(to close credit balance temporary ac-
counts)
31
Income Summary . . . . . . . . . . . . . . . . . . . . . .
297,640
Sales Returns and Allowances . . . . . . . .
2,900
Sales Discounts . . . . . . . . . . . . . . . . . . . . .
1,300
Cost of Goods Sold . . . . . . . . . . . . . . . . . .
126,000
Adver sing Expense . . . . . . . . . . . . . . . . .
14,000
Commissions Expense . . . . . . . . . . . . . . .
29,000
Delivery Expense . . . . . . . . . . . . . . . . . . .
14,800
Rent Expense . . . . . . . . . . . . . . . . . . . . . . .
32,400
Sales Salaries Expense . . . . . . . . . . . . . . .
26,400
Deprecia on Expense . . . . . . . . . . . . . . .
12,000
Insurance Expense . . . . . . . . . . . . . . . . . .
10,400
Office Supplies Expense . . . . . . . . . . . . .
3,100
Telephone Expense . . . . . . . . . . . . . . . . .
1,800
U li es Expense . . . . . . . . . . . . . . . . . . . .
4,200
Wages Expense – Office . . . . . . . . . . . . .
14,300
Interest Expense . . . . . . . . . . . . . . . . . . . .
840
Income Tax Expense . . . . . . . . . . . . . . . . .
4,200
(to close debit balance temporary ac-
counts)
31
Income Summary . . . . . . . . . . . . . . . . . . . . . .
31,560
Retained Earnings . . . . . . . . . . . . . . . . . . .
31,560
(to close Income Summary to Retained
Earnings)
31
Retained Earnings . . . . . . . . . . . . . . . . . . . . . .
11,000
Dividends . . . . . . . . . . . . . . . . . . . . . . . . . .
11,000
(to close Dividends to Retained Earnings)
PROBLEM 5–4
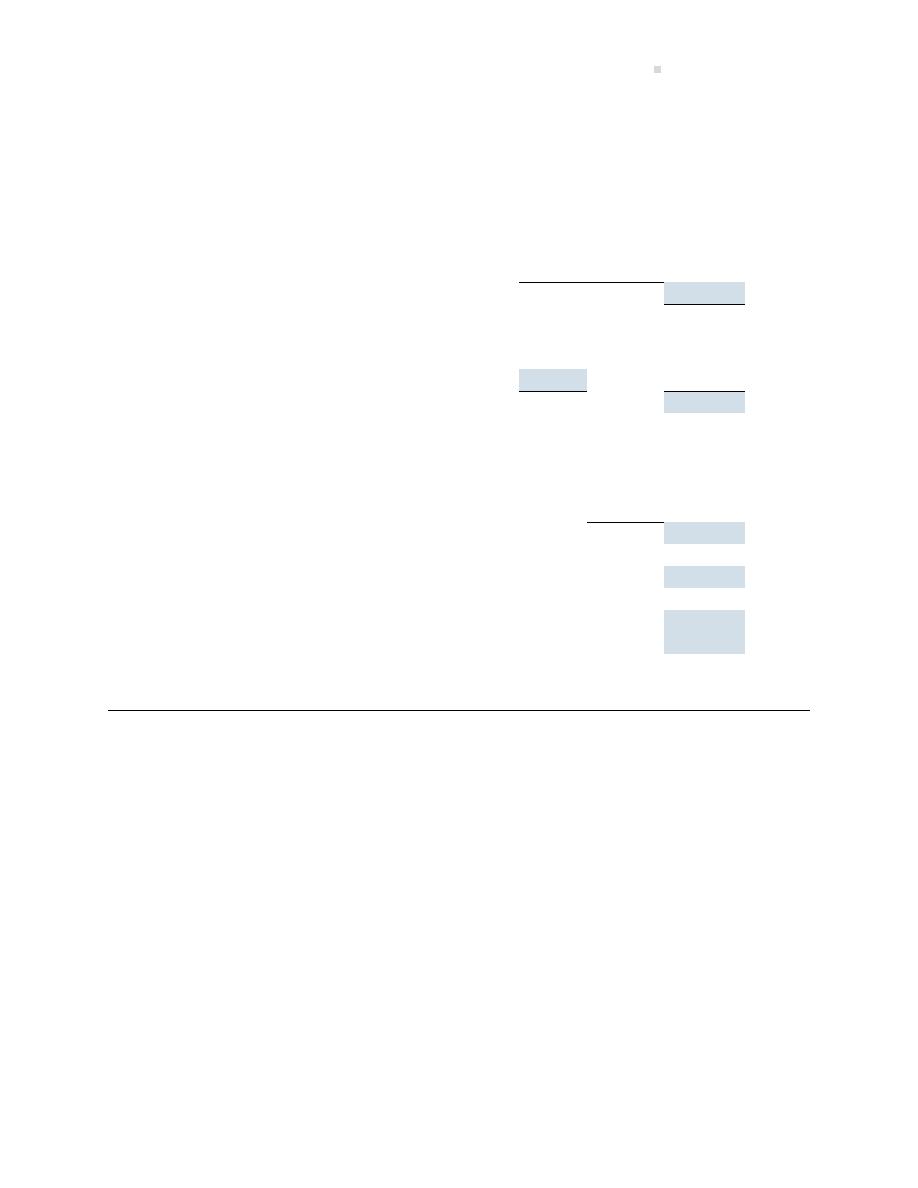
Chapter 5 Solu ons
761
Answers for the missing boxes are in the colored cells.
Inventory, opening balance
55,000
Plus: purchases
250,000
Plus: sales returns to inventory
100
Plus: purchase shipping costs
500
Less: Purchase returns and allowances
200
Less: Purchase discounts
3,500
3,100
Net purchases
246,900
Total goods available for sale
301,900
Ending inventory, per GL
90,000
Less shrinkage adjustment (90,000
− 88,500)
1,500
88,500
Cost of goods sold
213,400
Sales
580,000
Less: sales discounts
200
Less: sales returns
200
Less: sales allowances
600
1,000
Net sales
579,000
Gross profit
365,600
Less: opera ng expenses
250,000
Net income/(loss)
115,600
Gross profit/sales (%) (365,600
÷ 579,000)
63.14%
PROBLEM 5–5
1.

762
Solu ons To Problems
Turret Retail Ltd.
Income Statement
For the Year Ended December 31, 2016
Sales
$360,000
Less: Sales discounts
$ 3,600
Sales returns and allowances
9,600
13,200
Net sales
346,800
Cost of goods sold
240,000
Gross profit from sales
106,800
Opera ng expenses
Salaries expense
57,000
Insurance expense
5,000
Shop supplies expense
1,000
Deprecia on expense
3,200
Rent expense
30,240
Travel expense
2,100
U li es expense
7,300
Total opera ng expenses
105,840
Income from opera ons
960
Other revenue and expenses
Rental income
6000
Interest expense
200
5,800
Income before tax
6,760
Income tax expense
2,028
Net income
$
4,732
2.
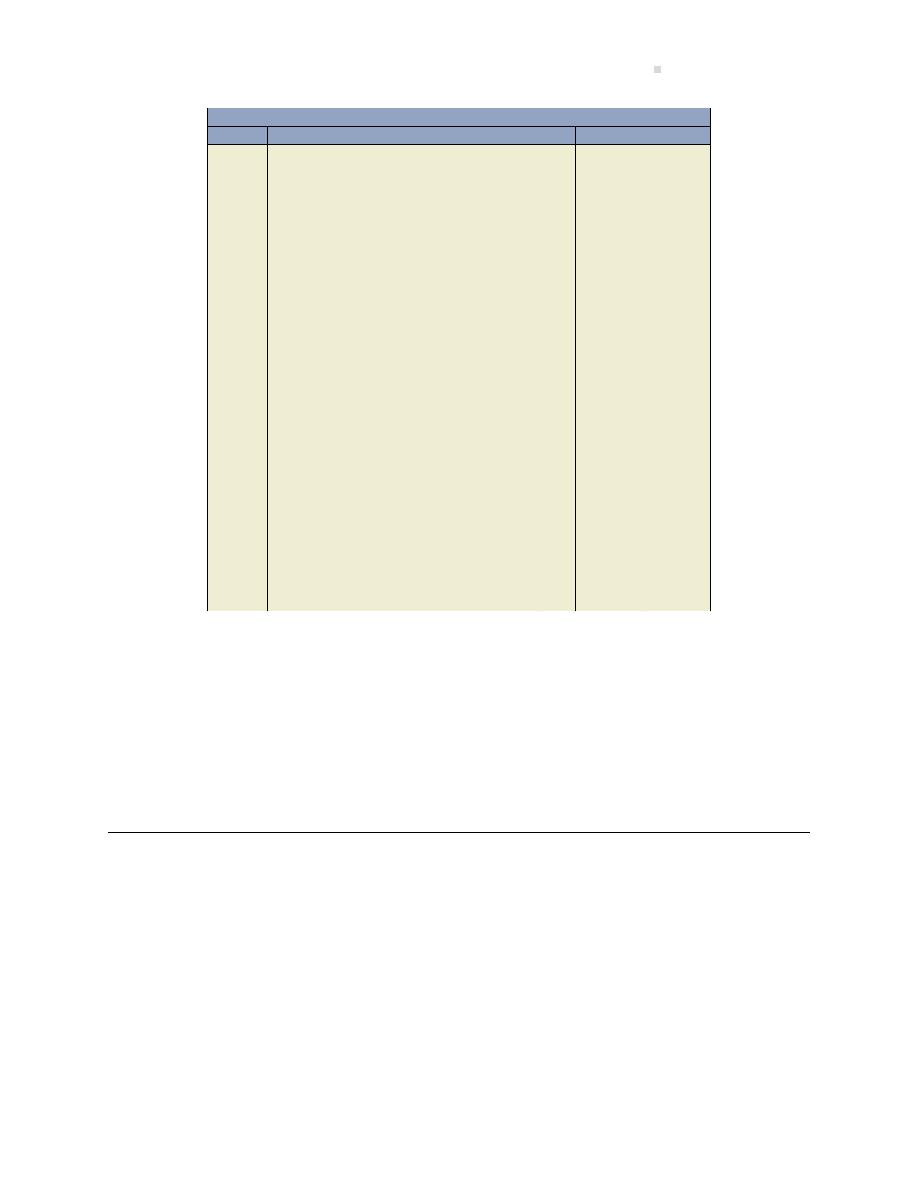
Chapter 5 Solu ons
763
General Journal
Date
Account/Explana on
PR
Debit
Credit
Dec 31
Rental income . . . . . . . . . . . . . . . . . . . . . . . . .
6,000
Sales . . . . . . . . . . . . . . . . . . . . . . . . . . . . . . . . . .
360,000
Income summary . . . . . . . . . . . . . . . . . . .
366,000
To close temporary revenue accounts.
Dec 31
Income summary . . . . . . . . . . . . . . . . . . . . . .
108,068
Salaries expense . . . . . . . . . . . . . . . . . . . .
57,000
Insurance expense . . . . . . . . . . . . . . . . . .
5,000
Shop supplies expense . . . . . . . . . . . . . .
1,000
Deprecia on expense . . . . . . . . . . . . . . .
3,200
Rent expense . . . . . . . . . . . . . . . . . . . . . . .
30,240
Travel expense. . . . . . . . . . . . . . . . . . . . . .
2,100
U li es expense . . . . . . . . . . . . . . . . . . . .
7,300
Interest expense . . . . . . . . . . . . . . . . . . . .
200
Income tax expense . . . . . . . . . . . . . . . . .
2,028
To close temporary expense accounts.
Dec 31
Income Summary . . . . . . . . . . . . . . . . . . . . . .
4,732
Retained earnings . . . . . . . . . . . . . . . . . .
4,732
To close income summary to retained
earnings.
Dec 31
Retained earnings . . . . . . . . . . . . . . . . . . . . . .
10,000
Cash dividends . . . . . . . . . . . . . . . . . . . . .
10,000
To close temporary cash dividend ac-
count.
3. Gross profit ra o = gross profit/Net sales = $106,800
÷ 346,800 = 30.8%
This ra o means that for every $100 of sales, the company has $30.8 le to cover opera ng
expenses a er deduc ng cost of goods sold. This ra o can be compared to other companies
in the same industry or to historical trends within the same company. A small fluctua on
in the ra o can o en cause a large increase/decrease in gross profit, if inventory and sales
dollar amounts are o en the largest amounts reported on the income statement.
PROBLEM 5–6
1.

764
Solu ons To Problems
Yuba Yabi Enterprises Ltd.
Trial Balance
March 31, 2017
Unadjusted Trial Balance
Adjustments
Adjusted Trial Balance
Debit
Credit
Debit
Credit
Debit
Credit
Accounts payable
$
68,750
$
68,750
Accounts receivable
$ 308,000
$ 308,000
Accrued salaries and
benefits payable
26,400
$
12,000
38,400
Accumulated deprecia on,
furniture
9,460
9,460
Cash
46,200
46,200
Cash dividends
22,000
22,000
Cost of goods sold
528,000
$
7,800
535,800
Adver sing expense
9,900
9,900
Bank loan payable (long-term)
88,704
88,704
Deprecia on expense
7,040
7,040
Copyright
44,000
44,000
Franchise
66,000
66,000
Furniture
44,000
44,000
Income tax expense
–
149,872*
229,481
Income taxes payable
17,600
149,872*
247,081
Insurance expense
11,000
5,000
16,000
Interest expense
440
5,600
6,040
Interest payable
1,210
5,600
6,810
Land
308,000
308,000
Merchandise inventory
264,000
7,800
256,200
Prepaid insurance expense
13,200
5,000
8,200
Prepaid adver sing expense
8,800
8,800
Rent expense
66,528
66,528
Rental income
13,200
13,200
Retained earnings
265,364
265,364
Salaries expense
125,400
12,000
137,400
Sales
792,000
792,000
Sales discounts
7,920
7,920
Sales returns and allowances
21,120
21,120
Service revenue
495,000
30,000
525,000
Share capital
44,000
44,000
Shop supplies
8,360
8,360
Shop supplies expense
2,200
2,200
Travel expense
4,620
4,620
Unearned service revenue
111,100
30,000
81,100
U li es expense
16,060
16,060
$1,932,788
$1,932,788
$ 210,272
$ 210,272
$2,179,869
$2,179,869
* Income tax expense calcula on:

Chapter 5 Solu ons
765
Cost of goods sold
$535,800
Adver sing expense
9,900
Deprecia on expense
7,040
Insurance expense
16,000
Interest expense
6,040
Rent expense
66,528
Rental income
$
13,200
Salaries expense
137,400
Sales
792,000
Sales discounts
7,920
Sales returns and allowances
21,120
Service revenue
525,000
Shop supplies expense
2,200
Travel expense
4,620
U li es expense
16,060
$830,628
$1,330,200
Net income before taxes
499,572
Income taxes @ 30%
$ 149,872
adjus ng entry
2.

766
Solu ons To Problems
Turret Retail Ltd.
Income Statement
For the Year Ended December 31, 2016
Sales
$792,000
Less: Sales discounts
$
7,920
Sales returns and allowances
21,120
29,040
Net sales
762,960
Cost of goods sold
535,800
Gross profit from sales
227,160
Service revenue
525,000
752,160
Opera ng expenses
Salaries expense
137,400
Insurance expense
16,000
Adver sing expense
9,900
Shop supplies expense
2,200
Deprecia on expense
7,040
Rent expense
66,528
Travel expense
4,620
U li es expense
16,060
Total opera ng expenses
259,748
Income from opera ons
492,412
Other revenue and expenses
Rental income
13,200
Interest expense
6,040
7,160
Income before tax
499,572
Income tax expense
149,872
Net income
$349,700
Chapter 6 Solu ons
PROBLEM 6–1
1. Weighted Average Cost Flow Assump on:

Chapter 6 Solu ons
767
Product A
Purchased (Sold)
Balance
Unit
Unit
Total
Date
Units
Cost
COGS
Units
Cost
Cost
Jan. 1
Opening Inventory
4,000
× $11.90 = $47,600
Jan. 7
Purchase #1
8,000
× $12.00
12,000
× 11.97
1
=
143,600
Mar. 30 Sale #1
(9,000)
× 11.97 = ($107,730)
3,000
×
=
35,870
May 10 Purchase #2
12,000
× 12.10
15,000
× 12.07
2
=
181,070
Jul. 4
Sale #2
(14,000)
× 12.07 = (168,980)
1,000
×
=
$12,090
1
[$47,600 + (8,000
× $12)]/(4,000 + 8,000) = $11.97/unit (rounded)
2
[$35,870 + (12,000
× $12.10)]/(3,000 + 12,000) = $12.07/unit (rounded)
Product B
Purchased (Sold)
Balance
Unit
Unit
Total
Date
Units
Cost
COGS
Units
Cost
Cost
Jan. 1
Opening Inventory
2,000
× $13.26 = $26,520
Jan. 13 Purchase #1
5,000
× $13.81
7,000
× 13.65
3
=
95,570
Jul. 15 Sale #1
(1,000)
× 13.65 = ($13,650)
6,000
×
=
81,920
May 10 Purchase #2
7,000
× 14.21
13,000
× 13.95
4
=
181,390
Dec. 14 Sale #2
(8,000)
× 13.95 = (111,600)
5,000
×
=
$69,790
3
[$26,520 + (5,000
× $13.81)]/(2,000 + 5,000) = $13.65/unit (rounded)
4
[$81,920 + (7,000
× $14.21)]/(6,000 + 7,000) = $13.95/unit (rounded)
2. Total ending inventory at December 31, 2020:
Product A
$12,090
Product B
69,790
Total
$81,880
3. Gross profit percentage earned:
Product A
Product B
Mar. 30 Sale
144,000
Jul. 15 Sale
20,000
Jul. 04 Sale
238,000
Dec. 14 Sale
168,000
Total Sales
382,000
Total Sales
188,000
COGS
276,710
COGS
125,250
Gross Profit
105,290
Gross Profit
62,750
Gross Profit %
27.56
Gross Profit %
33.38

768
Solu ons To Problems
PROBLEM 6–2
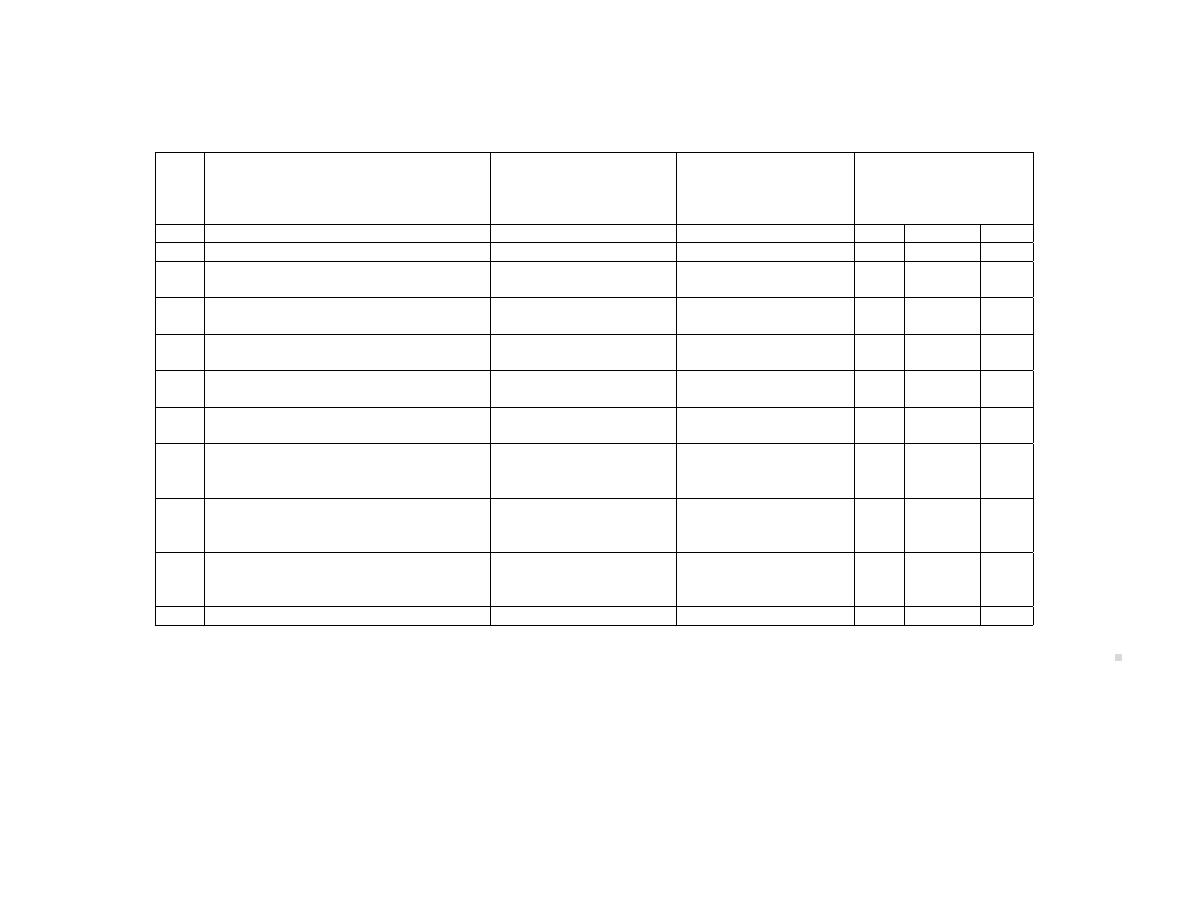
Chap
ter
6
Soluons
769
1. Inventory Record – FIFO
Purchases/Shipping costs/
Purchase returns, discounts
Cost of Goods Sold/
Balance in Inventory
and allowances
Returns to Inventory
Date
Descrip on
Units
Cost/Unit
Total
Units
Cost/Unit
Total
Units
Cost/Unit
Total
Jan 1
Inventory, opening
500
$ 10
5,000
4
Sale of 100 units @ $20
100
$ 10
1,000
400
$ 10
4,000
400
$ 10
4,000
6
Purchase
200
$ 11
2,200
200
$ 11
2,200
400
$ 10
4,000
8
Purchase return (from Jan 6 purchase)
(10)
$ 11
(110)
190
$ 11
2,090
9
Sale of 200 unit @ $22
200
$ 10
2,000
200
$ 10
2,000
190
$ 11
2,090
10
Sales return from customer from Jan 4 sale
(15)
$10
(150)
215
$ 10
2,150
(returned to inventory)
190
$ 11
2,090
15
Sale of 150 units @ $23
150
$ 10
1,500
65
$ 10
650
190
$ 11
2,090
65
$ 10
650
190
$ 11
2,090
17
Purchase
300
$ 9
2,700
300
$ 9
2,700
19
Sales return from customer from Jan 15 sale
no entry
65
$ 10
650
(beyond repair, disposed)
disposed
190
$ 11
2,090
300
$ 9
2,700
20
Sale of 400 units @ $21
65
$ 10
650
0
$ 10
–
190
$ 11
2,090
0
$ 11
–
145
$ 9
1,305
155
$ 9
1,395
Total
835
8,395
155
$ 9
1,395
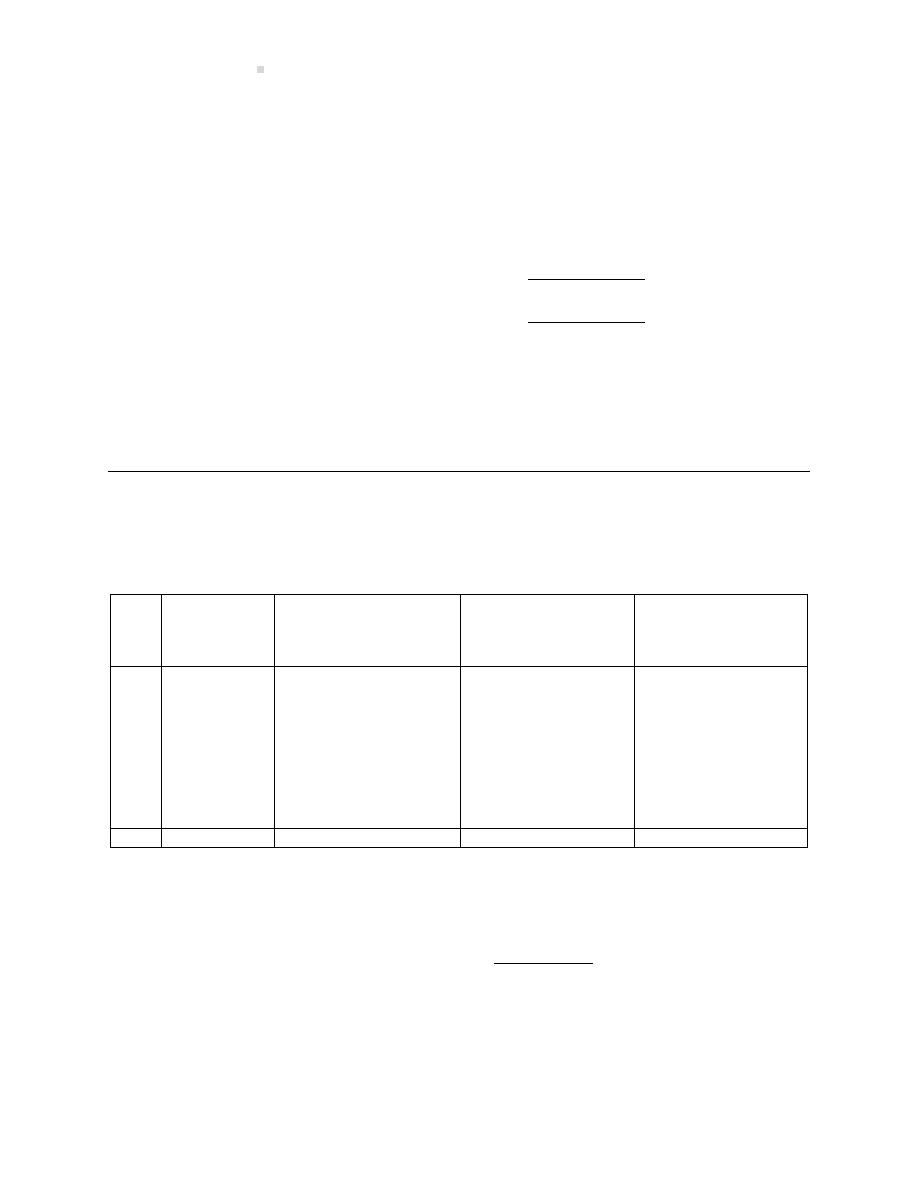
770
Solu ons To Problems
2. Sales:
Sale of 100 units @ $20
$
2,000.00
Sale of 200 unit @ $22
$
4,400.00
Sales return of 15 units @ $20
$
(300.00)
Sale of 150 units @ $23
$
3,450.00
Sales return of 2 units @ $20
$
(40.00)
Sale of 400 units @ $21
$
8,400.00
Total sales
$ 17,910.00
Cost of goods sold
$
8,395.00
Gross profit
$
9,515.00
Gross profit %
53.13%
3. Ending inventory balance, Jan 20, 2016: $1,395.00
PROBLEM 6–3
1. Weighted Average Cost
Purchases/Shipping costs/
Purchase returns, discounts
Cost of Goods Sold/
Balance in Inventory
and allowances
Returns to Inventory
Date
Descrip on
Units
Cost/Unit
Total
Units
Cost/Unit
Total
Units
Cost/Unit
Total
Feb 1 Opening inventory
75
$ 12.00
900
5 Sale
70
$12.00
840
5
$ 12.00
60
7 Purchase
300
$ 11.00
3,300
305
$ 11.02
3,360
12 Sale
180
$11.02
1,984
125
$ 11.01
1,376
14 Purchase return
(10)
$ 11.00
(110)
115
$ 11.01
1,266
from Feb 7
17 Sale
100
$11.01
1,101
15
$ 11.00
165
19 Purchase
400
$ 9.00
3,600
415
$ 9.07
3,765
23 Sale
80
$ 9.07
726
335
$ 9.07
3,039
Total
430
4,651
335
$ 9.07
3,039
2. Sales:
430 units
× $24
$
10,320
Cost of goods sold
$
4,651
Gross profit
$
5,669
Gross profit %
54.93%
3. Ending inventory balance, Jan 20, 2016: $1,395

Chapter 6 Solu ons
771
PROBLEM 6–4
2015
If ending inventory was overstated by $45,000, then COGS is understated causing net income to
be overstated. This will cause equity to also be overstated.
COGS
Net Income
Total Assets
Equity
Unadjusted balance
$ 500,000
$ 250,000
$ 1,500,000 $ 1,400,000
Correc on
45,000
(45,000)
(45,000)
(45,000)
Corrected balance
$ 545,000
$ 205,000
$ 1,455,000
$ 1,355,000
2016
If ending inventory was overstated by $45,000 in 2015, then opening inventory will also be over-
stated in 2016. This will cause COGS to be overstated in 2016 causing net income to be under-
stated. Since equity was overstated in 2015, this overstatement for 2016 will cancel out the pre-
vious year’s error and equity will no longer contain any errors.
COGS Net Income
Total Assets
Equity
Unadjusted balance
$ 660,000
$ 350,000
$ 1,400,000 $ 1,300,000
Correc on
(45,000)
45,000
0
0
Corrected balance
$ 615,000
$ 395,000
$ 1,400,000
$ 1,300,000
PROBLEM 6–5
2015
If ending inventory was understated by $30,000, then COGS is overstated causing net income to
be understated. This will cause equity and total assets to also be understated.
COGS
Net Income
Total Assets
Equity
Unadjusted balance
$ 500,000
$ 250,000
$ 1,500,000 $ 1,400,000
Correc on
(30,000)
30,000
30,000
30,000
Corrected balance
$ 470,000
$ 280,000
$ 1,530,000
$ 1,430,000
2016
If ending inventory was understated by $30,000 in 2015, then opening inventory will also be un-
derstated in 2016. This will cause COGS to be understated in 2016 causing net income to be over-
stated. Since equity was overstated in 2015, this understatement for 2016 will cancel out the
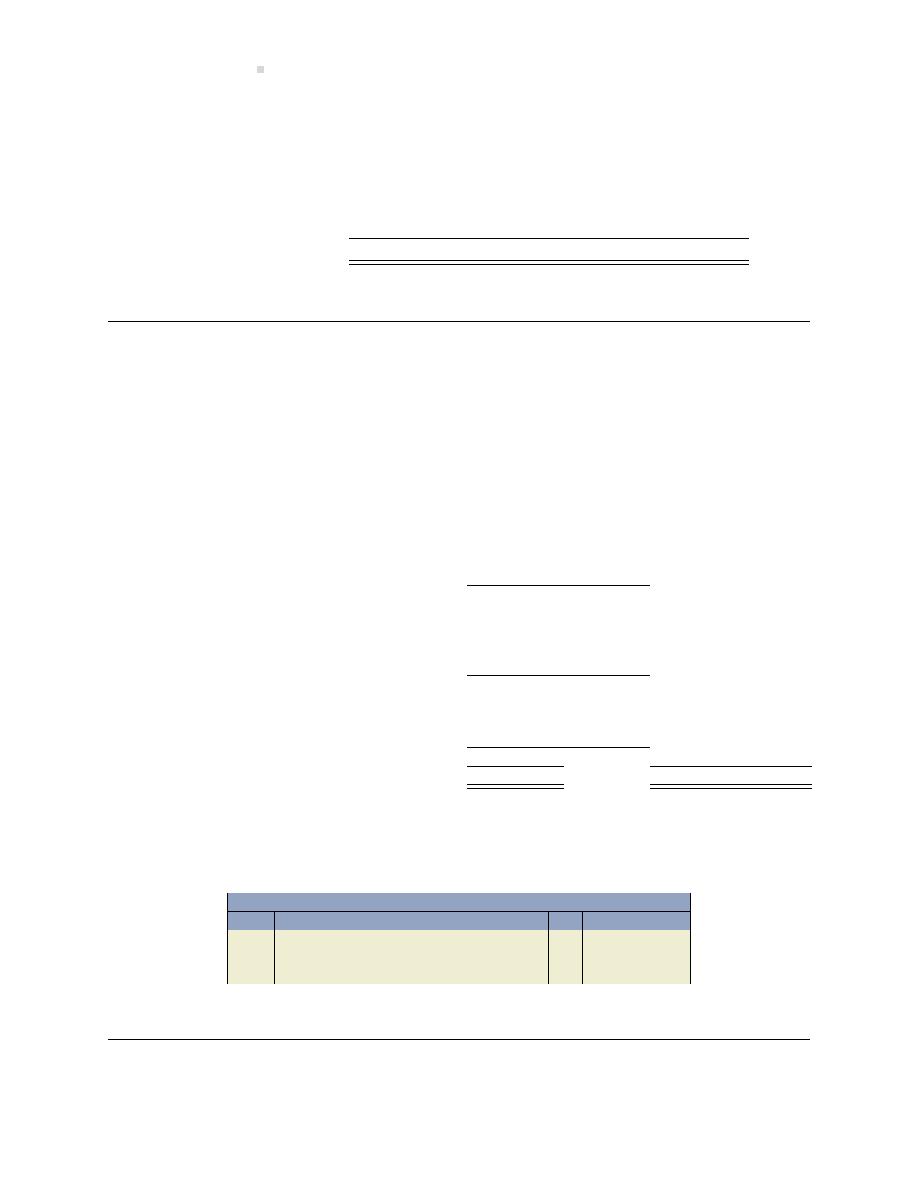
772
Solu ons To Problems
previous year’s error and equity will no longer contain any errors. There are no errors in the end-
ing inventory for 2016, so there are no mis-statements for assets.
COGS
Net Income
Total Assets
Equity
Unadjusted balance
$ 660,000
$ 350,000
$ 1,400,000 $ 1,300,000
Correc on
30,000
(30,000)
0
0
Corrected balance
$ 690,000
$ 320,000
$ 1,400,000
$ 1,300,000
PROBLEM 6–6
1.
2.
LCNRV
LCNRV
Ceramic Wall Tiles:
# of Units
Cost/Unit
NRV/Unit
Total Cost
Total NRV
by Group
by Product
White
1,025
$ 5.00
$ 6.00
$ 5,125.00
$ 6,150.00
5,125
Black
875
4.50
4.25
3,937.50
3,718.75
3,719
Slate
645
7.00
7.11
4,515.00
4,585.95
4,515
Beige
325
2.00
2.25
650.00
731.25
650
14,227.50
15,185.95
$ 14,228
Marble Flooring:
Cordoba
10,000
9.25
9.35
92,500.00
93,500.00
92,500
Carrerra
12,000
10.50
10.50
126,000.00
126,000.00
126,000
Maricha
8,000
11.50
11.45
92,000.00
91,600.00
91,600
310,500.00
311,100.00
310,500
Shower Waterproofing:
Novo
10,035
9.85
9.50
98,844.75
95,332.50
95,333
Deetra
15,000
6.75
7.15
101,250.00
107,250.00
101,250
200,094.75
202,582.50
200,095
Totals
$ 524,822.25
$ 524,822
$ 520,692
3. No entry required by group.
By individual product:
General Journal
Date
Account/Explana on
PR
Debit
Credit
Cost of goods sold . . . . . . . . . . . . . . . . . . . . .
4,130
Merchandise inventory . . . . . . . . . . . . . .
4,130
($524,822
− 520,692)
PROBLEM 6–7

Chapter 6 Solu ons
773
1.
Goods available for sale:
Inventory, opening balance
$ 420,364
Purchases
1,323,280
Purchase returns
(18,270)
Transporta on-in
9,660
1,314,670
Goods available for sale:
$1,735,034
Sales
1,667,610
Sales returns
(13,230)
Net sales
1,654,380
Es mated COGS
($1,654,380
× (1 − 34%))
(1,091,891)
Es mated March 31, 2017 inventory
$ 643,143
2.
Varane Ltd.
Income Statement
for the First Quarter ending March 31, 2017
Sales
$ 1,667,610
Less: Sales returns and allowances
13,230
Net sales
1,654,380
Cost of goods sold
1,091,891
Gross profit from sales
562,489 34%
Opera ng expenses
Total opera ng expenses
130,500
Income before tax
431,989
Income tax expense
129,597
Net income
$ 302,392
PROBLEM 6–8
1.

774
Solu ons To Problems
At Cost
At Retail
Goods available for sale:
Inventory, opening balance
$ 659,890
$ 1,298,010
Purchases
4,660,362
8,958,180
Purchase returns
(73,920)
(167,090)
Goods available for sale:
$ 5,246,332
$ 10,089,100
Sales
$ 7,693,980
Sales returns
(62,440)
$ 7,631,540
Ending inventory at retail
$ 2,457,560
Ra o of Cost to retail ($5,246,332
÷ $10,089,100) × 100
52.00%
Ending inventory at cost
$ 1,277,931
2.
Ceabane Ltd.
Income Statement
for the Six Months ending June 30, 2017
Sales
$ 7,693,980
Less: Sales returns and allowances
62,440
Net sales
7,631,540
Cost of goods sold*
3,968,401
Gross profit from sales
3,663,139
Opera ng expenses
Total opera ng expenses
1,500,000
Income before tax
2,163,139
Income tax expense
648,942
Net income
$ 1,514,197
* $5,246,332
− 1,277,931 = 3,968,401
PROBLEM 6–9
1. Ending inventory for 2016 was overstated by $2,000. Thus, cost of goods sold should have
been $2,000 higher, or $22,000 and gross profit $2,000 lower, or $28,000. Because of this
mistake, the 2017 opening inventory was also overstated by $2,000, causing cost of goods
sold to be overstated by $2,000 and gross profit to be understated by $2,000. Gross profit
should have been $29,000.
2. 2016 total and net assets were overstated by $2,000. 2017 total assets and net assets were
correct.

Chapter 7 Solu ons
775
PROBLEM 6–10
2017
2018
Unit Basis
Unit Basis
Cost
Market
(LCNRV)
Cost
Market
(LCNRV)
Product X
$14,000
$15,000
$14,000
$15,000
$16,000
$15,000
Product Y
12,500
12,000
12,000
12,000
11,500
11,500
Product Z
11,000
11,500
11,000
10,500
10,000
10,000
Total
$37,500
$38,500
$37,000
$37,500
$37,500
$36,500
Chapter 7 Solu ons
PROBLEM 7–1
a
The company has received a $3,000 loan from the bank, that
was deposited into its bank account but was not recorded in
the books of the company.
e
A $250 cheque was not returned with the bank statement
though it was paid by the bank.
d
Cheques amoun ng to $4,290 shown as outstanding on the
November reconcilia on s ll have not been returned by the
bank.
a
A collec on of a note receivable for $1,000 made by the bank
has not been previously reported to Goertzen. This includes
interest earned of $50.
c
The bank has erroneously charged Goertzen with an $1,100
cheque which should have been charged to Gagetown Ltd.
b
A $350 cheque made out by Fynn Company and deposited by
Goertzen has been returned by the bank marked NSF; this is
the first knowledge Goertzen has of this ac on.
a
A cheque for $840 was erroneously recorded as $730 in the
company records.
c
A $600 bank deposit of December 31 does not appear on the
bank statement.
b
Bank service charges amoun ng to $75 were deducted from
the bank statement but not yet from the company records.
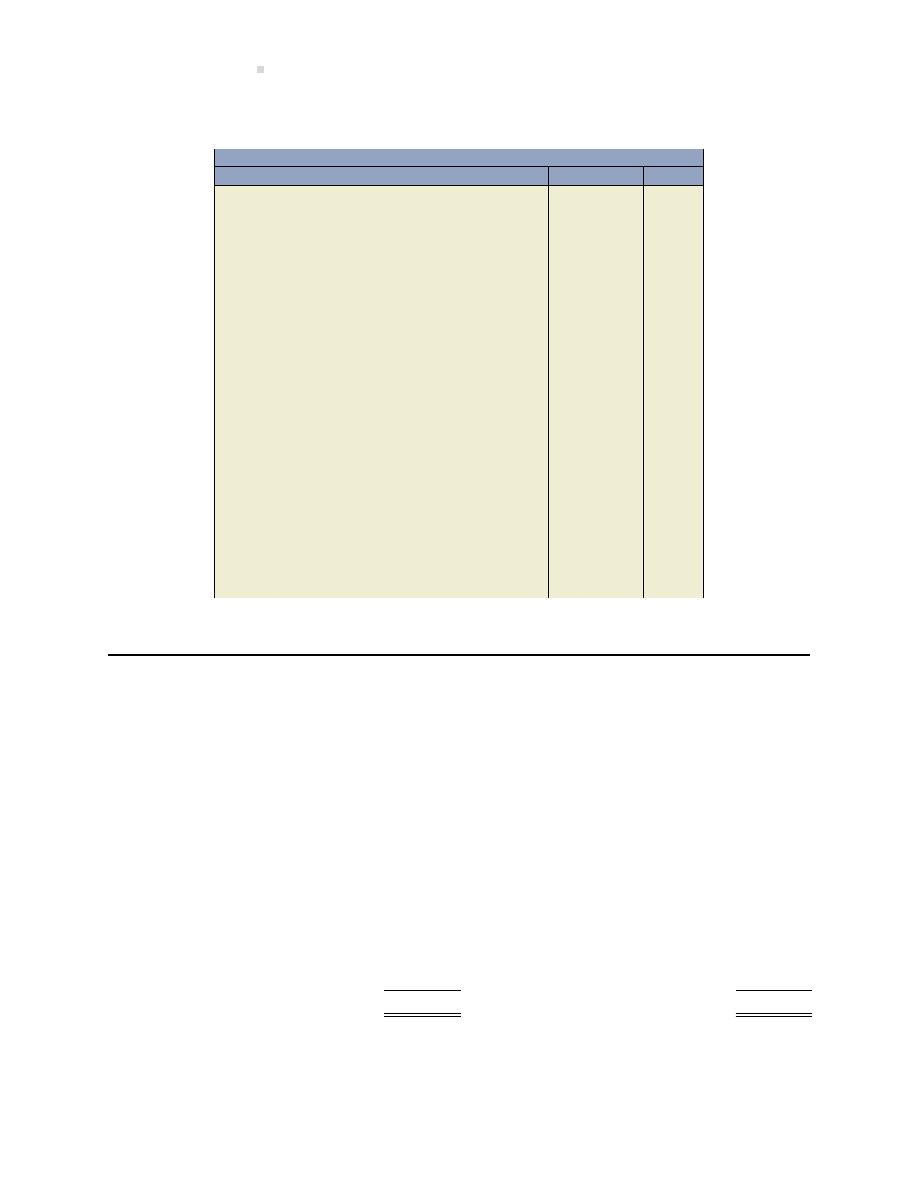
776
Solu ons To Problems
PROBLEM 7–2
General Journal
Date
Account/Explana on
PR
Debit
Credit
Aug 2
Pe y cash . . . . . . . . . . . . . . . . . . . . . . . . . . . . .
500
Cash . . . . . . . . . . . . . . . . . . . . . . . . . . . . . . .
500
To establish a pe y cash fund for $200.
Aug 15
Merchandise inventory . . . . . . . . . . . . . . . . .
20.00
Office supplies expense . . . . . . . . . . . . . . . . .
35.00
Delivery expenses . . . . . . . . . . . . . . . . . . . . . .
32.00
Travel expenses . . . . . . . . . . . . . . . . . . . . . . . .
139.60
Employee recogni on expense . . . . . . . . . .
80.00
Postage . . . . . . . . . . . . . . . . . . . . . . . . . . . . . . .
145.00
Pe y cash . . . . . . . . . . . . . . . . . . . . . . . . . . . . .
300.00
Cash over/short . . . . . . . . . . . . . . . . . . . .
1.60
Cash . . . . . . . . . . . . . . . . . . . . . . . . . . . . . . .
750.00
To replenish pe y cash and increase it to
$800.
Aug 31
Travel expenses . . . . . . . . . . . . . . . . . . . . . . . .
75.80
Shop supplies . . . . . . . . . . . . . . . . . . . . . . . . . .
300.00
Delivery expense . . . . . . . . . . . . . . . . . . . . . . .
56.00
Maintenance expense . . . . . . . . . . . . . . . . . .
345.00
Cash over/short . . . . . . . . . . . . . . . . . . . . . . . .
1.80
Cash . . . . . . . . . . . . . . . . . . . . . . . . . . . . . . .
778.60
To replenish pe y cash.
PROBLEM 7–3
1.
Bank balance, November 30
$30,000
Book balance
$35,598
Bank error on cheque 20
5
Add: Collec on of note
200
Less: NSF cheque from customer
1,475
Plus: Outstanding deposits
4,500
Less: Service charges
20
Service charges
25
Less: Outstanding cheques
Service charges
18
Chq 236
$230
Chq 240
15
245
$34,260
$34,260
2.
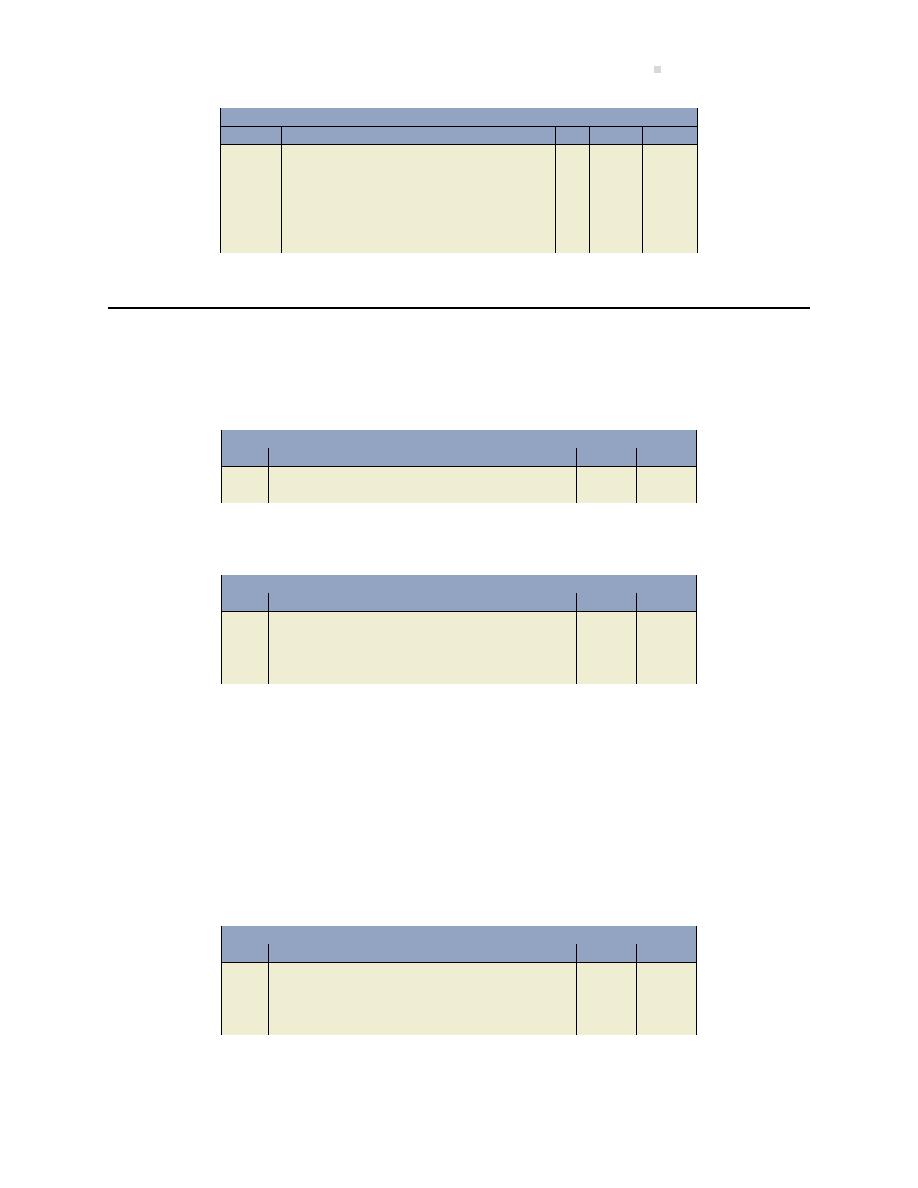
Chapter 7 Solu ons
777
General Journal
Date
Account/Explana on
PR
Debit
Credit
Nov 30
Bank service charges expense . . . . . . . . . . .
63
Accounts receivable . . . . . . . . . . . . . . . . . . . .
1,475
Note receivable . . . . . . . . . . . . . . . . . . . . .
200
Cash . . . . . . . . . . . . . . . . . . . . . . . . . . . . . . .
1,338
To record entries from November 2016
bank reconcilia on.
PROBLEM 7–4
1.
(a) Entry to record the write-off of $25,000:
General Journal
Date
Account/Explana on
PR
Debit
Credit
Allowance for Doub ul Accounts . . . . . . . .
25,000
Accounts Receivable . . . . . . . . . . . . . . . .
25,000
(b) Entry to record the recovery of $15,000:
General Journal
Date
Account/Explana on
PR
Debit
Credit
Accounts Receivable . . . . . . . . . . . . . . . . . . .
15,000
Allowance for Doub ul Accounts . . . . .
15,000
Cash . . . . . . . . . . . . . . . . . . . . . . . . . . . . . . . . . .
15,000
Accounts Receivable . . . . . . . . . . . . . . . .
15,000
2. Allowance for doub ul accounts = ($15,000 Cr.
− $25,000 Dr.) (1a) + $15,000 Cr. (1b) =
$5,000 Cr. balance
3.
(a) The entries required for bad debts based on three per cent of credit sales:
Balance required = 3% of credit sales
=
3%
× 70% × $1,000,000
=
$21,000
General Journal
Date
Account/Explana on
PR
Debit
Credit
Bad Debt Expense . . . . . . . . . . . . . . . . . . . . . .
21,000
Allowance for Doub ul Accounts . . . . .
21,000
To record bad debts using % of sales, the
income statement method.
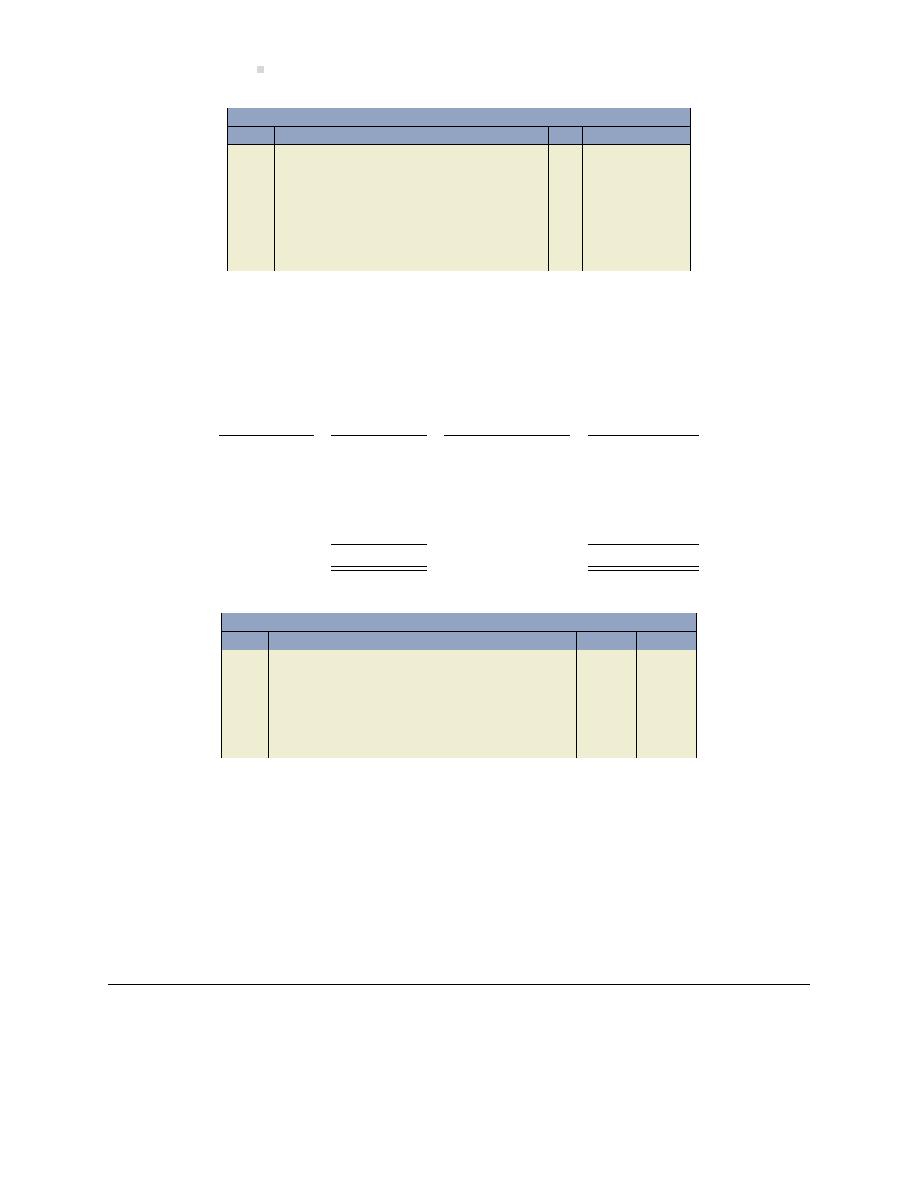
778
Solu ons To Problems
General Journal
Date
Account/Explana on
PR
Debit
Credit
Bad Debt Expense . . . . . . . . . . . . . . . . . . . . . .
7,500
Allowance for Doub ul Accounts . . . . .
7,500
To record bad debts using simplified bal-
ance sheet approach: 5% of receivables
(250,000
× 5% = 12,500 required balance
− 5,000 unadjusted balance = 7,500 re-
quired adjustment).
(b)
(c) Calcula on of uncollec ble amount at December 31, 2012:
Es mated
Accounts
Es mated Loss
Uncollec ble
Age (days)
Receivable
Percentage
Amount
1-30
$100,000
2%
$2,000
31-60
50,000
4%
2,000
61-90
25,000
5%
1,250
91-120
60,000
10%
6,000
Over 120
15,000
50%
7,500
$250,000
$18,750
General Journal
Date
Account/Explana on
PR
Debit
Credit
Bad Debt Expense . . . . . . . . . . . . . . . . . . . . . .
13,750
Allowance for Doub ul Accounts . . . . .
13,750
To record bad debts using aging analy-
sis, a balance sheet approach (18,750 re-
quired balance
− 5,000 unadjusted bal-
ance = 13,750 required adjustment).
4.
(a) December 31, 2018 adjusted AFDA balance = $26,000 (calculated as 5,000 unadjusted
balance + 21,000 adjustment)
(b) December 31, 2018 adjusted AFDA balance = $12,500 (calculated as 5,000 unadjusted
balance + 7,500 adjustment)
(c) December 31, 2018 adjusted AFDA balance = $18,750 (calculated as 5,000 unadjusted
balance + 13,750 adjustment)
PROBLEM 7–5
1.
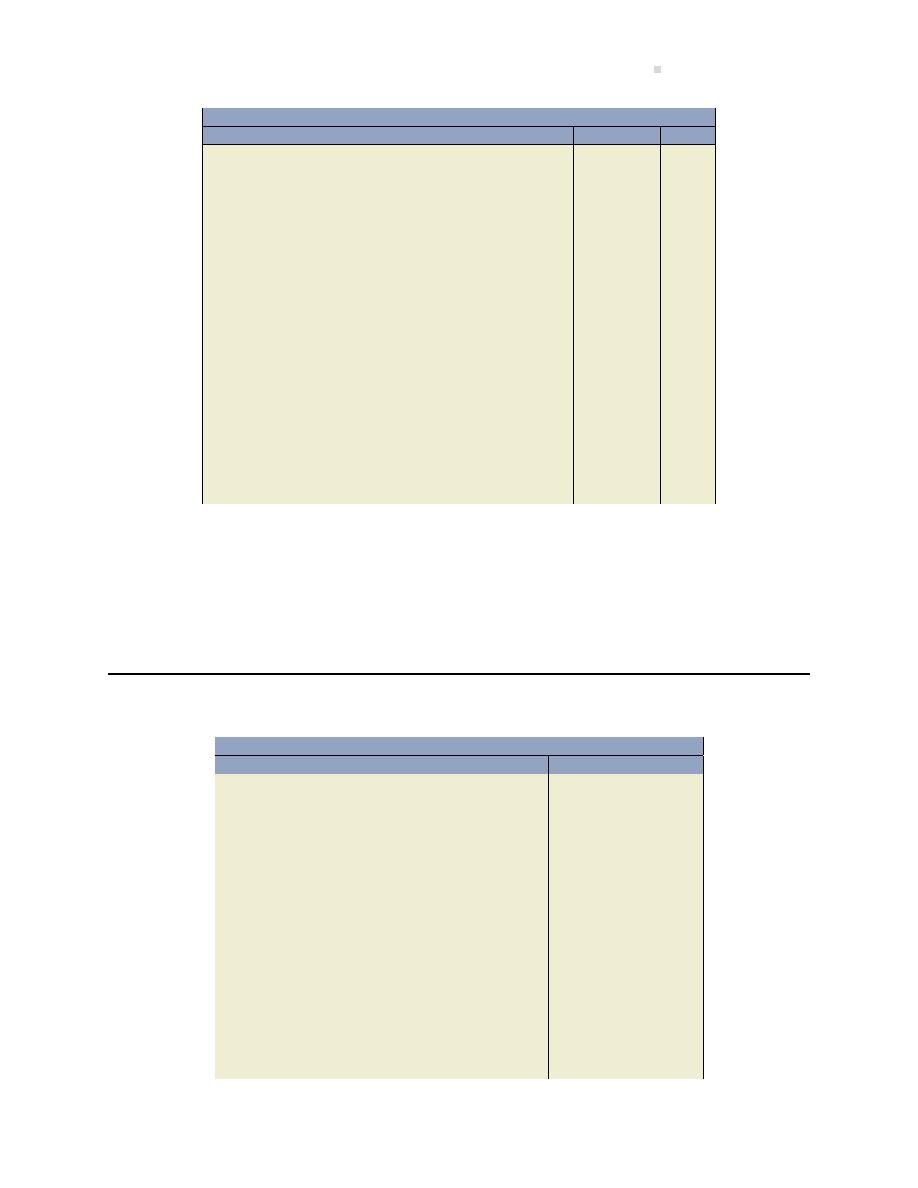
Chapter 7 Solu ons
779
General Journal
Date
Account/Explana on
PR
Debit
Credit
Dec 31, 2017
Bad Debt Expense . . . . . . . . . . . . . . . . . . . . . .
5,000
Allowance for Doub ul Accounts . . . . .
5,000
Apr 15, 2018
Allowance for Doub ul Accounts . . . . . . . .
700
Accounts Receivable . . . . . . . . . . . . . . . .
700
Aug 8, 2018
Allowance for Doub ul Accounts . . . . . . . .
3,000
Accounts Receivable . . . . . . . . . . . . . . . .
3,000
Dec 31, 2018
Bad Debt Expense . . . . . . . . . . . . . . . . . . . . . .
4,000
Allowance for Doub ul Accounts . . . . .
4,000
Mar 6, 2019
Accounts Receivable . . . . . . . . . . . . . . . . . . .
200
Allowance for Doub ul Accounts . . . . .
200
Sep 4, 2019
Allowance for Doub ul Accounts . . . . . . . .
4,000
Accounts Receivable . . . . . . . . . . . . . . . .
4,000
Dec 31, 2019
Bad Debt Expense . . . . . . . . . . . . . . . . . . . . . .
4,500
Allowance for Doub ul Accounts . . . . .
4,500
2. Both methods are es mates and a empt to match expenses with revenues. Over me, the
allowance for doub ul accounts under either method should be approximately the same.
If not, management should review the percentage es mates under each method to ensure
that they are reasonable.
PROBLEM 7–6
General Journal
Date
Account/Explana on
PR
Debit
Credit
Dec 31
Allowance for doub ul accounts. . . . . . . . .
1,000
Accounts receivable . . . . . . . . . . . . . . . . .
1,000
1. To record uncollec ble account.
Dec 31
Bad debt expense . . . . . . . . . . . . . . . . . . . . . .
14,560
Allowance for doub ul accounts . . . . .
14,560
2.
To record year-end adjus ng en-
try for es mated uncollec ble accounts.
(
$750,000
− 22,000) × 2%
Dec 31
Bad debt expense . . . . . . . . . . . . . . . . . . . . . .
6,760
Allowance for doub ul accounts . . . . .
6,760
3.
To record year-end adjus ng en-
try for es mated uncollec ble accounts.
(
$100,000
− 1,000) × 4% = $3,960 credit
(
AFDA $1,800 debit
− $1,000) + 3,960 =
$5,760
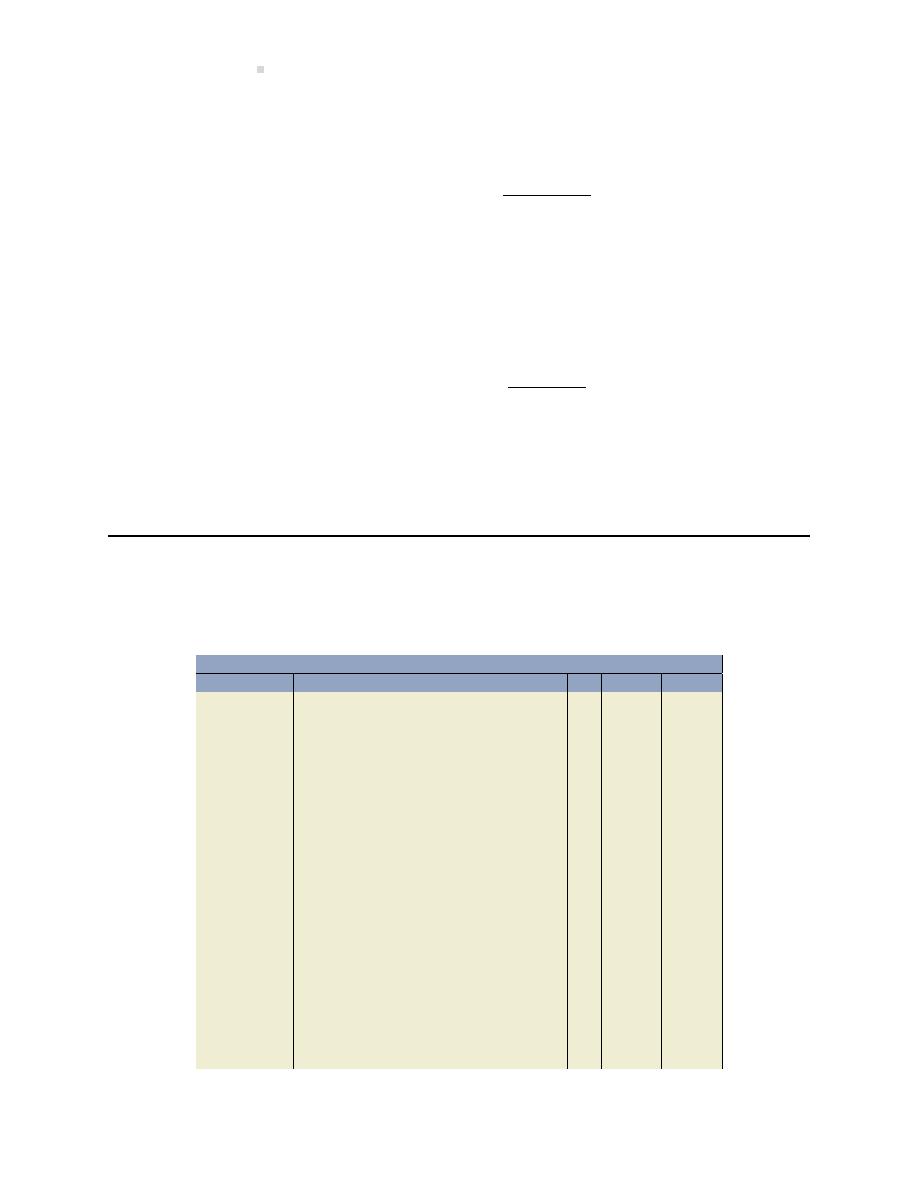
780
Solu ons To Problems
4. For entry from part (2):
Accounts receivable
$ 99,000
Allowance for doub ul accounts
(11,760)
$87,240
($1,800 + 1,000
− 14,560)
Note that no a empt is made to reconcile the AFDA balance to the es mated bad debt
amount when using the income statement method.
For entry from part (3):
Accounts receivable
$ 99,000
Allowance for doub ul accounts
(3,960)
$95,040
($1,800 + 1,000
− 6,760)
Note that the AFDA balance is adjusted so that its ending balance is equal to the es mated
bad debt amount when using the balance sheet method.
PROBLEM 7–7
1.
General Journal
Date
Account/Explana on
PR
Debit
Credit
Dec 12, 2016
Note receivable . . . . . . . . . . . . . . . . . . . . . . . .
20,500
Accounts receivable . . . . . . . . . . . . . . . . .
20,500
To accept a note receivable in exchange
for an overdue accounts receivable.
Dec 31, 2016
Interest receivable . . . . . . . . . . . . . . . . . . . . .
53
Interest revenue . . . . . . . . . . . . . . . . . . . .
53
To record accrued interest on the Dec 12
note receivable. ($20,500
×5%×19÷365)
Dec 31, 2016
Interest revenue . . . . . . . . . . . . . . . . . . . . . . .
53
Income summary . . . . . . . . . . . . . . . . . . .
53
To record the closing entry for interest
revenue to Income Summary.
Jan 12, 2017
Cash . . . . . . . . . . . . . . . . . . . . . . . . . . . . . . . . . .
20,584
Note receivable . . . . . . . . . . . . . . . . . . . . .
20,500
Interest receivable . . . . . . . . . . . . . . . . . .
53
Interest income . . . . . . . . . . . . . . . . . . . . .
31
To record payment of note receivable.
(
$20,500
× 5% × 30 ÷ 365) + $20,500

Chapter 7 Solu ons
781
General Journal
Date
Account/Explana on
PR
Debit
Credit
Jan 14, 2017
Note receivable . . . . . . . . . . . . . . . . . . . . . . . .
12,000
Cost of goods sold . . . . . . . . . . . . . . . . . . . . .
7,500
Sales . . . . . . . . . . . . . . . . . . . . . . . . . . . . . .
12,000
Merchandise inventory . . . . . . . . . . . . . .
7,500
To record receipt of note receivable for
a merchandise inventory sale according to
company credit policy.
Jan 31, 2017
Interest receivable . . . . . . . . . . . . . . . . . . . . .
34
Interest income . . . . . . . . . . . . . . . . . . . . .
34
To record accrued interest on the Jan 14
note receivable. ($12,000
×6%×17÷365)
Feb 10, 2017
Note receivable . . . . . . . . . . . . . . . . . . . . . . . .
6,600
Accounts receivable . . . . . . . . . . . . . . . . .
6,600
To accept a note receivable in exchange
for an overdue accounts receivable.
Feb 28, 2017
Interest receivable . . . . . . . . . . . . . . . . . . . . .
55
Interest income . . . . . . . . . . . . . . . . . . . . .
55
To record accrued interest on the Jan 14
and Feb 10 notes receivable. ($12,000
×
6%
×28÷365)+($6,600×9%×18÷365)
Mar 15, 2017
Cash . . . . . . . . . . . . . . . . . . . . . . . . . . . . . . . . . .
12,118
Note receivable . . . . . . . . . . . . . . . . . . . . .
12,000
Interest receivable . . . . . . . . . . . . . . . . . .
89
Interest income . . . . . . . . . . . . . . . . . . . . .
29
To record payment of note receivable.
(
$12,000
× 6% × 60 ÷ 365) + $12,000
To compute the March 15 date:
Jan
31 days
Note date (14)
Feb
28 days
Mar 15
15 days = 60 days on this date
2. Maturity date of the Feb 10 note receivable:
Feb
28 days
Note date
(10)
Subtotal 18 days in Feb.
Mar
31 days
Apr
30 days
May 11
11 days = 90 days on this date
May 11, 2017 will be the maturity date for the February 10 note receivable.

782
Solu ons To Problems
PROBLEM 7–8
1.
Note (a)
Note (b)
Note (c)
Note (d)
Total number of days in the month
when the note was signed
Jan 1
31 days
Jun
30 days
Less: Note date
(15)
(21)
Subtotal
16 days
9 days
Next month total days
Dec
31 days
Jul
31 days
Next month total days
Jan
31 days
Aug
5 days
Next month total days
Feb
28 days
Next month total days
Mar
31 days
Next month total days
Apr
30 days
Date in month to equal term in days
May
13 days
Total number of days of the note term
180 days
45 days
Total number of months
3 months
4 months
Maturity date
May 13, 2017
Apr 6, 2017
Aug 5, 2017
April 11, 2018
2. Note (a) accrued interest from Jan 1 to Dec 31, 2017:
$260,000
× 4% × 180 ÷ 365 = $5,129
Note (b) accrued interest from Jan 15 to Dec 31, 2017:
$180,000
× 5% × 3 ÷ 12 = $2,250
Note (c) accrued interest from Jun 21 to Dec 31, 2017:
$40,000
× 5.5% × 45 ÷ 365 = $271
Note (d) accrued interest from Dec 1 to Dec 31, 2017:
$60,000
× 6.5% × 1 ÷ 12 = $325
3. Note (a) cash payment amount collected at maturity:
$260,000
× 4% × 180 ÷ 365 = $5,129 + $260,000 = $265,129 principal and interest
Note (b) cash payment amount collected at maturity:
$180,000
× 5% × 3 ÷ 12 = $2,250 + 180,000 = $182,250 principal and interest
Note (c) cash payment amount collected at maturity:
$40,000
× 5.5% × 45 ÷ 365 = $271 + 40,000 = $40,271 principal and interest
Note (d) cash payment amount collected at maturity:
$60,000
× 6.5% × 4 ÷ 12 = $1,300 + 60,000 = $61,300 principal and interest
PROBLEM 7–9

Chapter 8 Solu ons
783
1. Net sales: $250,000
− 52,000 − 5,000 = 193,000
Average accounts receivable: ($53,000 + 22,000)
÷ 2 = $37,500
Accounts receivable turnover (193,000
÷ 37,500) = 5.15 mes per year
2. If the turnover ra o from the previous year was 5.25 mes per year, the company is not as
efficient at collec ng its accounts receivable in 2017 compared to the previous year.
Chapter 8 Solu ons
PROBLEM 8–1
Cost of Lots:
Cheque to Jones
$140,000
Bank loan assumed by Arrow
100,000
Razing of barns
6,000
Legal, accoun ng, and brokerage Fees
20,000
Clearing and levelling costs
10,000
Total outlays
$276,000
Less:
Contra items:
Proceeds from crops
$6,000
Proceeds from house
1,600
Proceeds from lumber
4,400
12,000
Net cost of 500 lots
$264,000
Net cost per lot ($264,000/500 lots)
$528
PROBLEM 8–2
1.
(a) Units of Produc on:
(
$30,000
−
8,000
)
80,000 units
× 15,000 units = $4,125
Note: The half-year rule does not apply to this method.
(b) Straight-line:
(
$30,000
−
8,000
)
6 years
× 50% = $1,833
(c) Double-declining balance: $30,000
× 33%* × 50% = $4,950
* 2/6 = 33% DDB rate
2. Carrying amounts at the end of 2017:
Carrying amount = Cost
− accumulated deprecia on

784
Solu ons To Problems
Units of produc on:
Cost
$30,000
Accumulated deprecia on
(4,125)
$25,075
Straight-line:
Cost
$30,000
Accumulated deprecia on
(1,833)
$28,167
Double declining balance:
Cost
$30,000
Accumulated deprecia on
(4,950)
$25,050
3. The double-decline balance method resulted in the highest deprecia on expense and lowest
net income for 2017.
4. Deprecia on for 2018:
(a) Units of Produc on:
(
$30,000
−
8,000
)
80,000 units
× 25,000 units = $6,875
(b) Straight-line:
(
$30,000
−
8,000
)
6 years
=
$3,667
(c) Double-declining balance: ($30,000
− $4,950) × 33% = $8,267
Double-declining balance method resulted in the highest deprecia on expense and lowest
net income for 2018.
PROBLEM 8–3
1. Deprecia on expense for each of 2019 through to 2022 inclusive:
Deprecia on/unit
=
Cost
− Residual
=
$95,000
− $5,000 = $10/unit
Expected Total Produc on
9,000 units
Actual Units
Deprecia on
Year
Produced
Expense
Calcula ons
2019
2,000
$20,000
2,000 units
× $10/unit = 20,000
2020
3,000
30,000
3,000 units
× $10/unit = 30,000
2021
2,800
28,000
2,800 units
× $10/unit = 28,000
2022
2,900
12,000
1,200 units
× $10/unit = 12,000*
$90,000
Total deprecia on
* Maximum allowable total deprecia on is Cost-Residual or $90,000. This is based on a
total of 9,000 units. Therefore, the maximum amount of deprecia on that can be recorded
in 2022 is $12,000 which is based on 1,200 units.
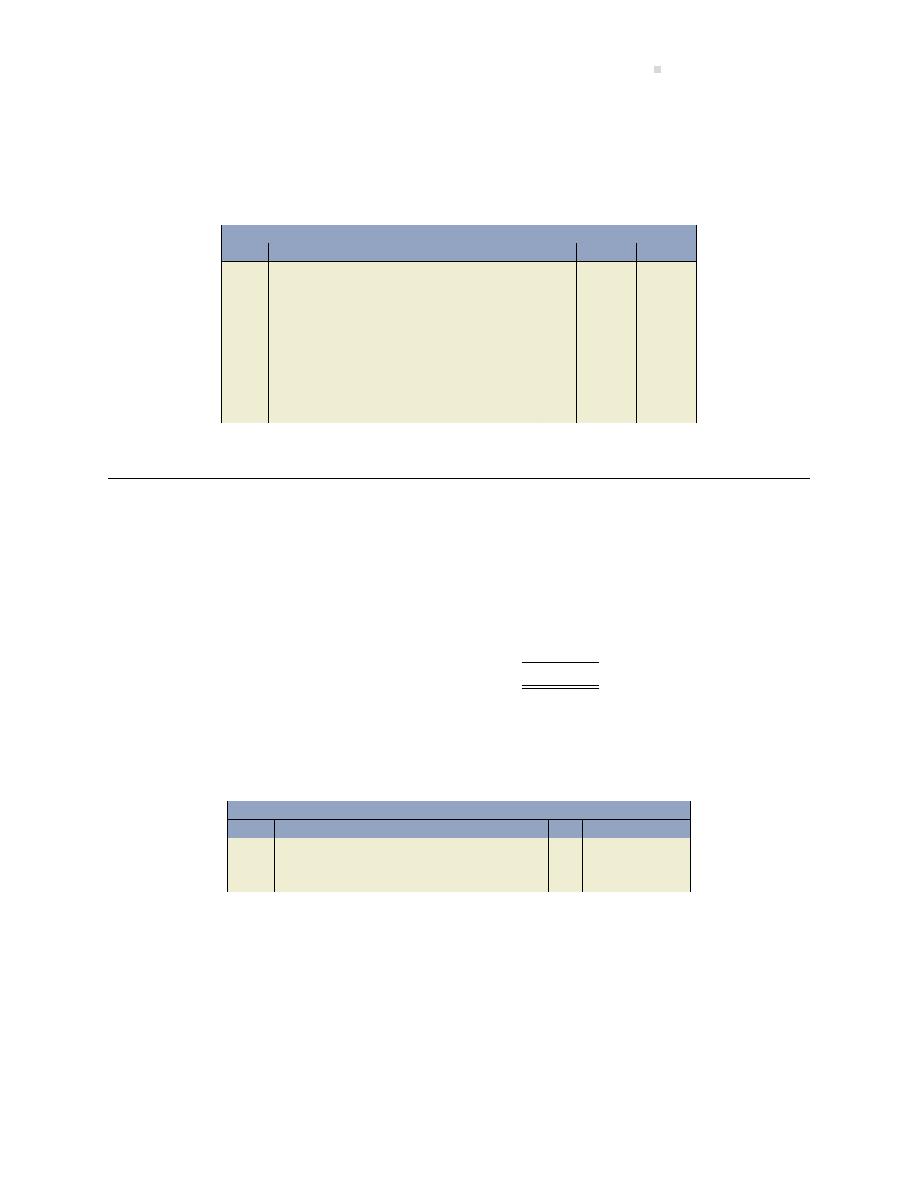
Chapter 8 Solu ons
785
2. Accumulated deprecia on at the end of 2022 is $90,000.
3. Carrying amount of the machine at the end of 2022 is $5,000 ($95,000
− 90,000).
4. Entry on January 15, 2023 to record the sale of the machinery for $12,000:
General Journal
Date
Account/Explana on
PR
Debit
Credit
Cash . . . . . . . . . . . . . . . . . . . . . . . . . . . . . . . . . .
12,000
Accumulated Deprecia on . . . . . . . . . . . . . .
90,000
Machinery . . . . . . . . . . . . . . . . . . . . . . . . .
95,000
Gain on Disposal . . . . . . . . . . . . . . . . . . . .
7,000
To record gain on disposal calculated as:
[$95,000 Cost of Machinery
− $90,000 Ac-
cumulated Deprecia on = $5,000 Carry-
ing Amount (or net book value)]
− $12,000
Proceeds of Disposal = $(7,000)
PROBLEM 8–4
1. Asset cost:
Purchase of machinery
$35,000
Transporta on charges
1,200
Installa on charge
5,700
31,900
Note: Minor repairs are expensed.
2. Straight-line deprecia on for each year for 4 years:
General Journal
Date
Account/Explana on
PR
Debit
Credit
Deprecia on Expense . . . . . . . . . . . . . . . . . .
5,975
Accumulated Deprecia on – Machine
5,975
(
$31,900
− 8,000) ÷ 4 years
Declining balance method:
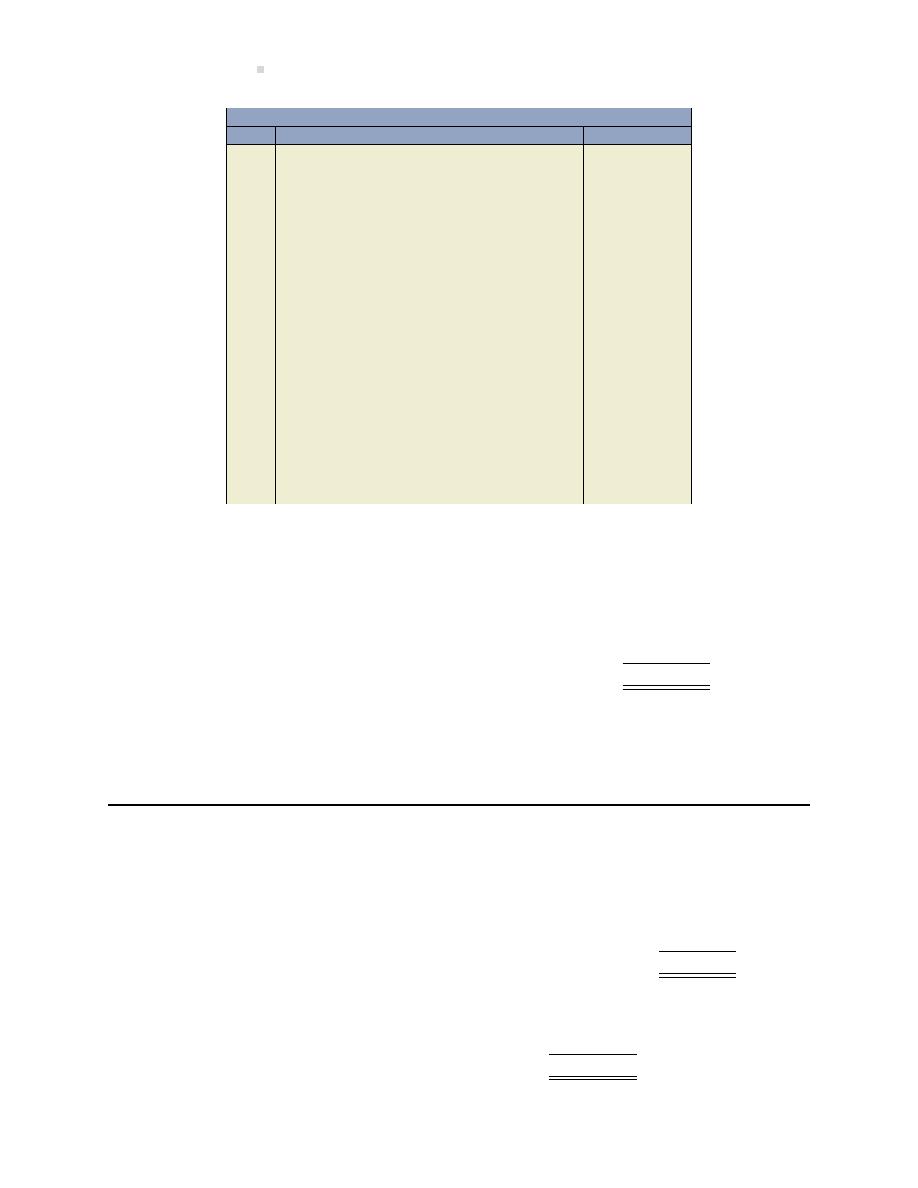
786
Solu ons To Problems
General Journal
Date
Account/Explana on
PR
Debit
Credit
2017
Deprecia on Expense . . . . . . . . . . . . . . . . . .
7,975
Accumulated Deprecia on . . . . . . . . . . .
7,975
2/4 = 25% rate , ($31,900
× 25%)
2018
Deprecia on Expense . . . . . . . . . . . . . . . . . .
5,981
Accumulated Deprecia on . . . . . . . . . . .
5,981
(
$31,900
− 7,975) × 25%
2019
Deprecia on Expense . . . . . . . . . . . . . . . . . .
4,486
Accumulated Deprecia on . . . . . . . . . . .
4,486
(
$31,900
− 7,975 − 5,981) × 25%
2020
Deprecia on Expense . . . . . . . . . . . . . . . . . .
3,365
Accumulated Deprecia on . . . . . . . . . . .
3,365
(
$31,900
− 7,975− 5,981− 4,486) × 25%
2021
Deprecia on Expense . . . . . . . . . . . . . . . . . .
2,093
Accumulated Deprecia on . . . . . . . . . . .
2,093
(
$31,900
− 7,975 − 5,981 − 4,486 −
3,365)
× 25% = $2,523
Note: Only $2,093 of deprecia on can be expensed to ensure that the carrying amount
remains equal to the residual value of $8,000.
3.
Asset cost, 2017
$ 31,900
Deprecia on expense for 3 years (2017, 2018, 2019)
(17,925)
Depreciable amount for remaining four years
$ 13,975
Revised deprecia on = (13,975
− 2,000) ÷ (5 − 3) = $5,988
Annual deprecia on for the remaining two years = $5,988 per year
PROBLEM 8–5
1.
2011 deprecia on ($115,000
− 17,250 ÷ 30 × 50%)
$
288
2012-2017 depreca on ($115,000
− 17,250) ÷ 30 × 6 years
19,550
Total deprecia on to Dec 31, 2017
$19,838
Cost
$115,000
Less: Accumulated deprecia on
(19,838)
Carrying amount (Dec 31, 2017)
$ 95,162
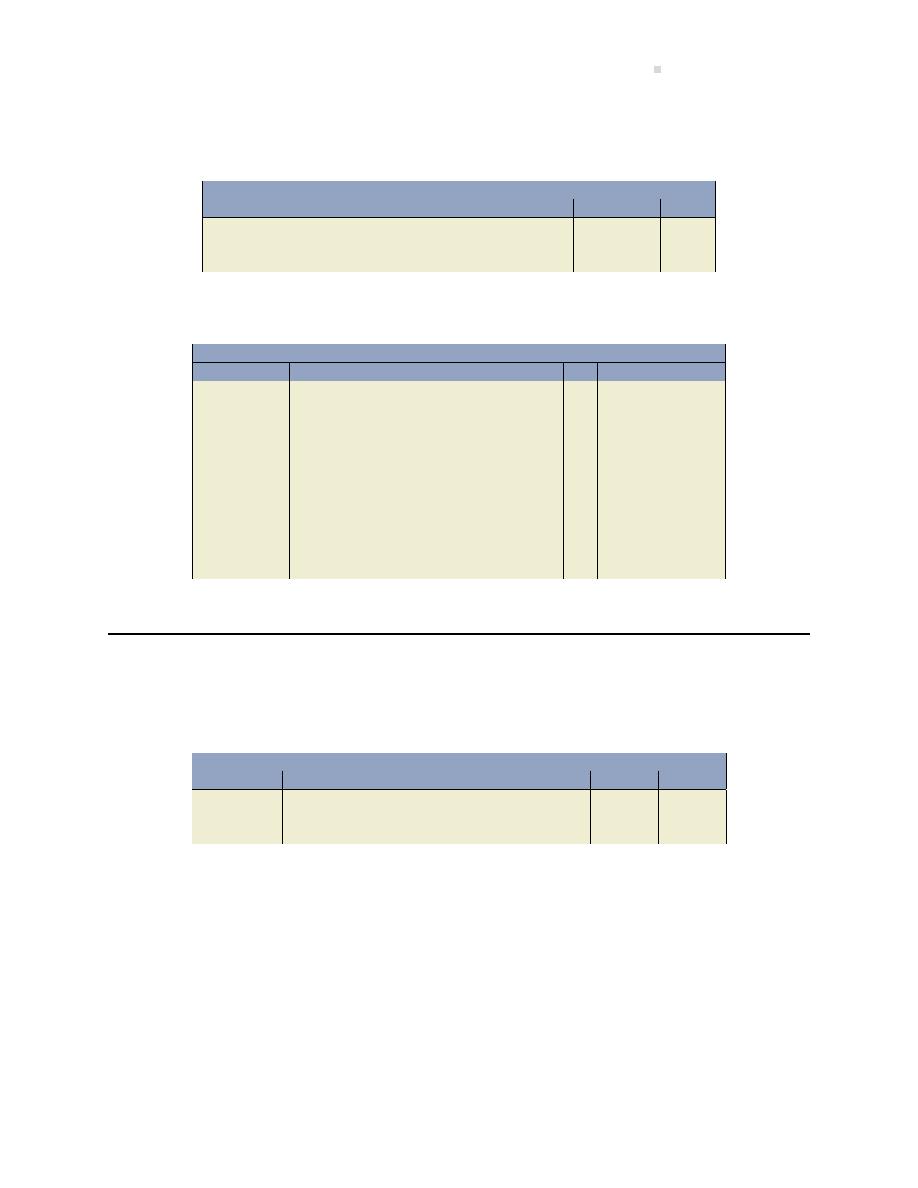
Chapter 8 Solu ons
787
2. Revised deprecia on for 2018: ($95,162
− 18,000) ÷ 15 years remaining = $5,144
Entry:
General Journal
Date
Account/Explana on
PR
Debit
Credit
Dec 31, 2018
Deprecia on Expense . . . . . . . . . . . . . . . . . .
5,144
Accumulated Deprecia on . . . . . . . . . . .
5,144
To record deprecia on for 2018.
3.
General Journal
Date
Account/Explana on
PR
Debit
Credit
July 31, 2019
Deprecia on Expense . . . . . . . . . . . . . . . . . .
2,572
Accumulated Deprecia on . . . . . . . . . . .
2,572
To record deprecia on to date of disposal:
($5,144
× 50%).
July 31, 2019
Cash . . . . . . . . . . . . . . . . . . . . . . . . . . . . . . . . . .
80,000
Accumulated Deprecia on – Machine
($19,838 + 5,144 + 2,572) . . . . . . . . . . . . . .
27,554
Loss on Disposal . . . . . . . . . . . . . . . . . . . . . . .
7,446
Machine . . . . . . . . . . . . . . . . . . . . . . . . . . .
115,000
To record sale of asset.
PROBLEM 8–6
1.
General Journal
Date
Account/Explana on
PR
Debit
Credit
Aug 1, 2018
Equipment . . . . . . . . . . . . . . . . . . . . . . . . . . . .
250,000
Cash . . . . . . . . . . . . . . . . . . . . . . . . . . . . . . .
250,000
To record the purchase of equipment.
2.
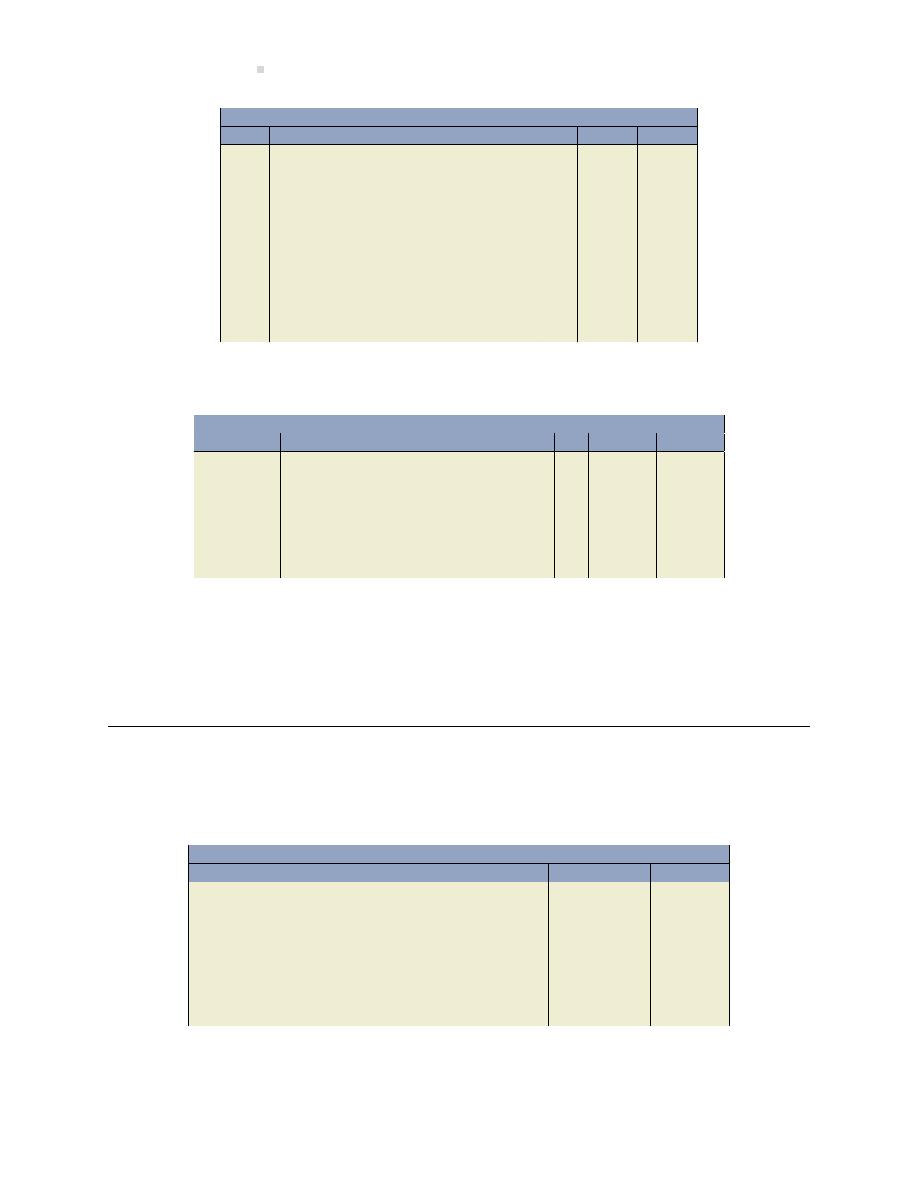
788
Solu ons To Problems
General Journal
Date
Account/Explana on
PR
Debit
Credit
2014
Deprecia on Expense . . . . . . . . . . . . . . . . . .
11,550
Accumulated Deprecia on . . . . . . . . . . .
11,550
(
$250,000
−40,000)÷200,000×11,000)
2015
Deprecia on Expense . . . . . . . . . . . . . . . . . .
26,250
Accumulated Deprecia on . . . . . . . . . . .
26,250
(
$250,000
−40,000)÷200,000×25,000)
2016
Deprecia on Expense . . . . . . . . . . . . . . . . . .
36,750
Accumulated Deprecia on . . . . . . . . . . .
36,750
(
$250,000
−40,000)÷200,000×35,000)
3.
General Journal
Date
Account/Explana on
PR
Debit
Credit
Jan 1, 2017
New asset* . . . . . . . . . . . . . . . . . . . . . . . . . . . .
170,000
Accum deprecia on – Old asset . . . . . . . . .
74,550
Loss on disposal . . . . . . . . . . . . . . . . . . . . . . .
35,450
Old asset . . . . . . . . . . . . . . . . . . . . . . . . . . .
250,000
Cash . . . . . . . . . . . . . . . . . . . . . . . . . . . . . . .
30,000
To record the trade-in of the old asset for
a new asset.
* Trade-in of asset:
Value of new asset = cash paid + fair value of asset traded (given up) = $30,000+$140,000 =
$170,000
PROBLEM 8–7
1.
General Journal
Date
Account/Explana on
PR
Debit
Credit
Jan 1, 2018
Land . . . . . . . . . . . . . . . . . . . . . . . . . . . . . . . . . .
150,000
Buildings . . . . . . . . . . . . . . . . . . . . . . . . . . . . . .
400,000
Patents . . . . . . . . . . . . . . . . . . . . . . . . . . . . . . .
200,000
Machinery . . . . . . . . . . . . . . . . . . . . . . . . . . . .
150,000
Goodwill . . . . . . . . . . . . . . . . . . . . . . . . . . . . . .
100,000
Cash . . . . . . . . . . . . . . . . . . . . . . . . . . . . . . .
1,000,000
To record purchase of Zak Company as-
sets.
2. For the impairment loss:
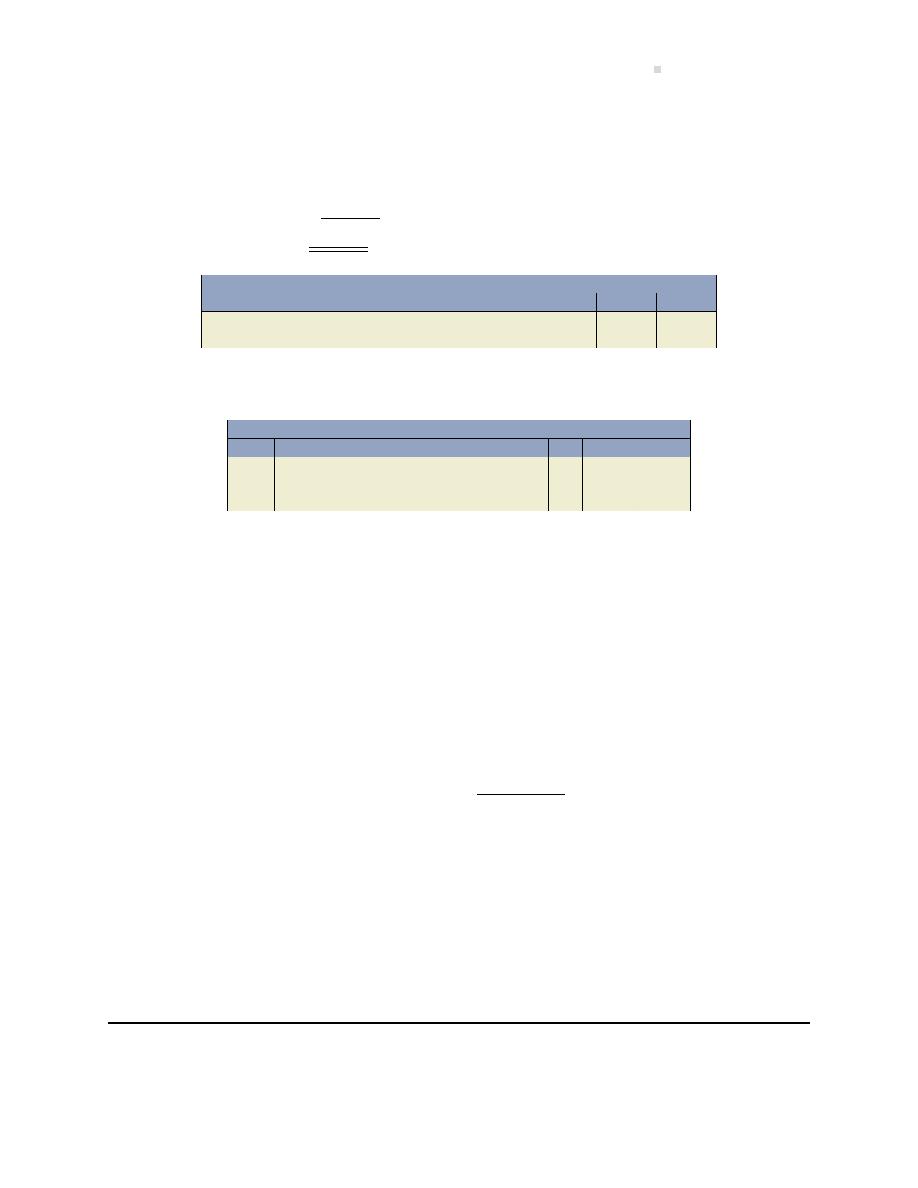
Chapter 8 Solu ons
789
Carrying amount January 1, 2020:
(
$200,000
− 0) ÷ 20 years = 10,000 per year ÷ 2 years = $20,000
$200,000
− 20,000 = $180,000
Recoverable amount is 165,000, therefore there is an impairment.
Impairment amount: $15,000
General Journal
Date
Account/Explana on
PR
Debit
Credit
Jan 1, 2020
Loss on impairment of patents . . . . . . . . . .
15,000
Patents . . . . . . . . . . . . . . . . . . . . . . . . . . . .
15,000
3. Amor za on:
General Journal
Date
Account/Explana on
PR
Debit
Credit
Amor za on expense . . . . . . . . . . . . . . . . . .
9,167
Accumulated amor za on, patents . . .
9,167
(($165,000*
− 0) ÷ (20 − 2)
* Note: When an impairment occurs, the new carrying amount will be the recoverable
amount.
4.
Teldor Ltd.
Balance Sheet
At December 31, 2020
Intangible assets:
Patents
$165,000
Accumulated amor za on
(29,167)
$135,833
Total intangible assets
235,833
Disclosure:
Patents were purchased on January 1, 2018 for $200,000. Their useful life is es mated to
be 20 years and amor zed on a straight-line basis. In 2020, patents were wri en down to
$165,000 based on their recoverable amount at that date.
Note: Goodwill is not reported as an intangible asset.
PROBLEM 8–8
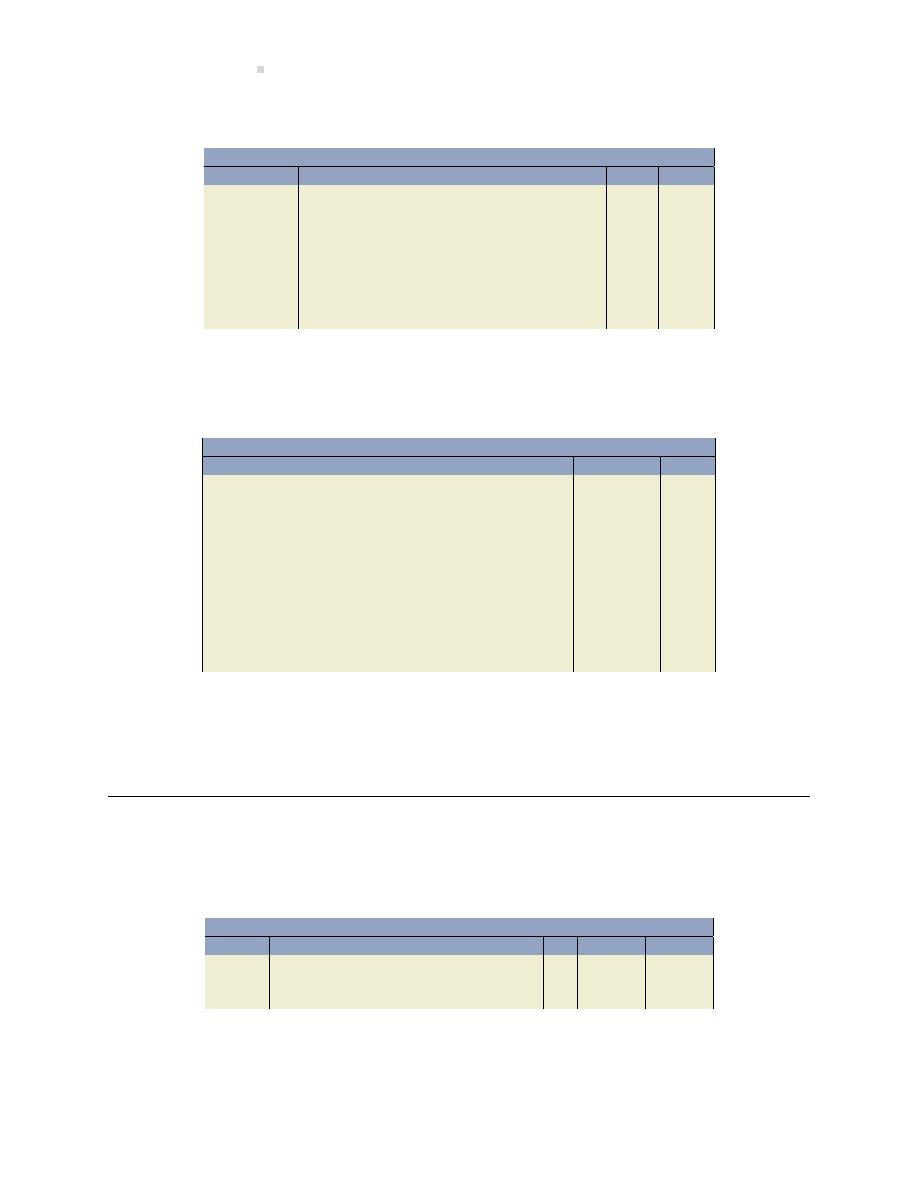
790
Solu ons To Problems
1.
General Journal
Date
Account/Explana on
PR
Debit
Credit
Jan 31, 2018
Computer . . . . . . . . . . . . . . . . . . . . . . . . . . . . .
3,000
Cash . . . . . . . . . . . . . . . . . . . . . . . . . . . . . . .
3,000
Mar 1, 2018
Computer . . . . . . . . . . . . . . . . . . . . . . . . . . . . .
1,000
Cash . . . . . . . . . . . . . . . . . . . . . . . . . . . . . . .
1,000
Apr 1, 2019
Computer . . . . . . . . . . . . . . . . . . . . . . . . . . . . .
2,000
Cash . . . . . . . . . . . . . . . . . . . . . . . . . . . . . . .
2,000
Alternate interpreta ons are acceptable, with adequate explana on.
2.
General Journal
Date
Account/Explana on
PR
Debit
Credit
Dec 31, 2018
Deprecia on Expense . . . . . . . . . . . . . . . . . .
667
Accumulated Deprecia on – Equip-
ment . . . . . . . . . . . . . . . . . . . . . . . . . . . . . . . . .
667
To record 2018 deprecia on: ($3,000 +
1,000)
× 1/3 years × 50%).
Dec 31, 2019
Deprecia on Expense . . . . . . . . . . . . . . . . . .
2,667
Accumulated Deprecia on – Equip-
ment . . . . . . . . . . . . . . . . . . . . . . . . . . . . . . . . .
2,667
To record 2019 deprecia on: ($3,000 +
1,000 + 2,000
− 667) × 50%)
Chapter 9 Solu ons
PROBLEM 9–1
1.
(a) Entry to record receipt of loan proceeds from the bank:
General Journal
Date
Account/Explana on
PR
Debit
Credit
Dec. 31
Cash . . . . . . . . . . . . . . . . . . . . . . . . . . . . . . . . . .
100,000
Loan Payable . . . . . . . . . . . . . . . . . . . . . . .
100,000
To record loan from First Na onal Bank.
(b) Entry to record purchase of the equipment:
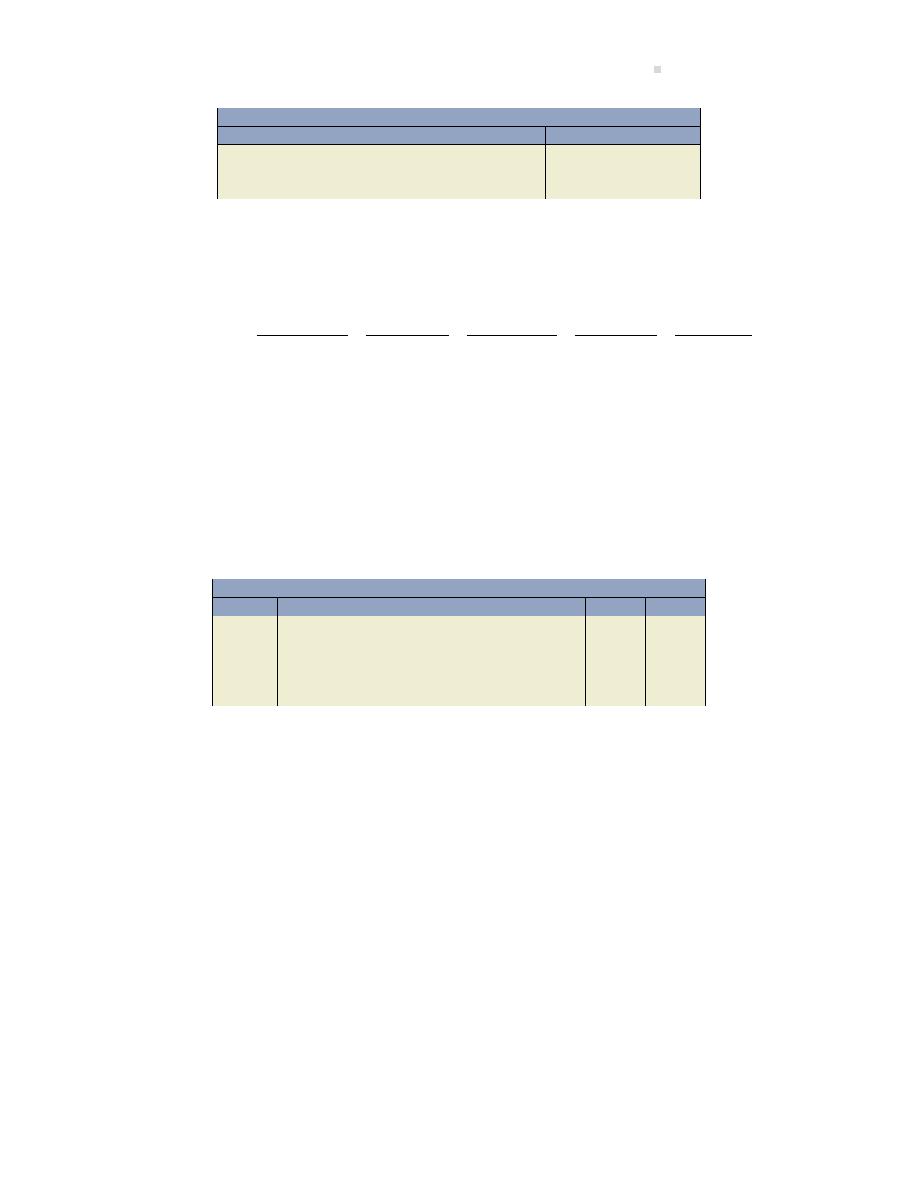
Chapter 9 Solu ons
791
General Journal
Date
Account/Explana on
PR
Debit
Credit
Jan. 2
Equipment . . . . . . . . . . . . . . . . . . . . . . . . . . . .
95,000
Cash . . . . . . . . . . . . . . . . . . . . . . . . . . . . . . .
95,000
To record purchase of equipment.
2. The loan repayment schedule is as follows:
Zinc Corp.
Loan Repayment Schedule
A
B
C
D
E
(D
− B)
(A
− C)
Year
Beginning
(A
× 8%)
Reduc on
Total
Ending
Ended
Loan
Interest
of Loan
Loan
Loan
Dec. 31
Balance
Expense
Payable
Payment
Balance
2016
$100,000
$8,000
$22,192
$30,192
$77,808
2017
77,808
6,225
23,967
30,192
53,841
2018
53,841
4,307
25,885
30,192
27,956
2019
27,956
2,236
27,956
30,192
-0-
3. Entry to record the last loan payment:
General Journal
Date
Account/Explana on
PR
Debit
Credit
Dec. 31
Interest Expense . . . . . . . . . . . . . . . . . . . . . . .
2,236
Loan Payable . . . . . . . . . . . . . . . . . . . . . . . . . .
27,956
Cash . . . . . . . . . . . . . . . . . . . . . . . . . . . . . . .
30,192
To record final loan payment to First Na-
onal Bank.
4. The par al balance sheet is as follows:
Zinc Corp.
Par al Balance Sheet
At December 31, 2017
Liabili es
Current
Current Por on of First Na onal Bank Loan
(Note X)
$25,885
Non-current
First Na onal Bank Loan (Note X)
27,956
Note X would disclose per nent informa on including details of the loan
repayment agreement (for example, interest rate, repayment terms, security)
if just the carry amount is shown on the balance sheet as above.
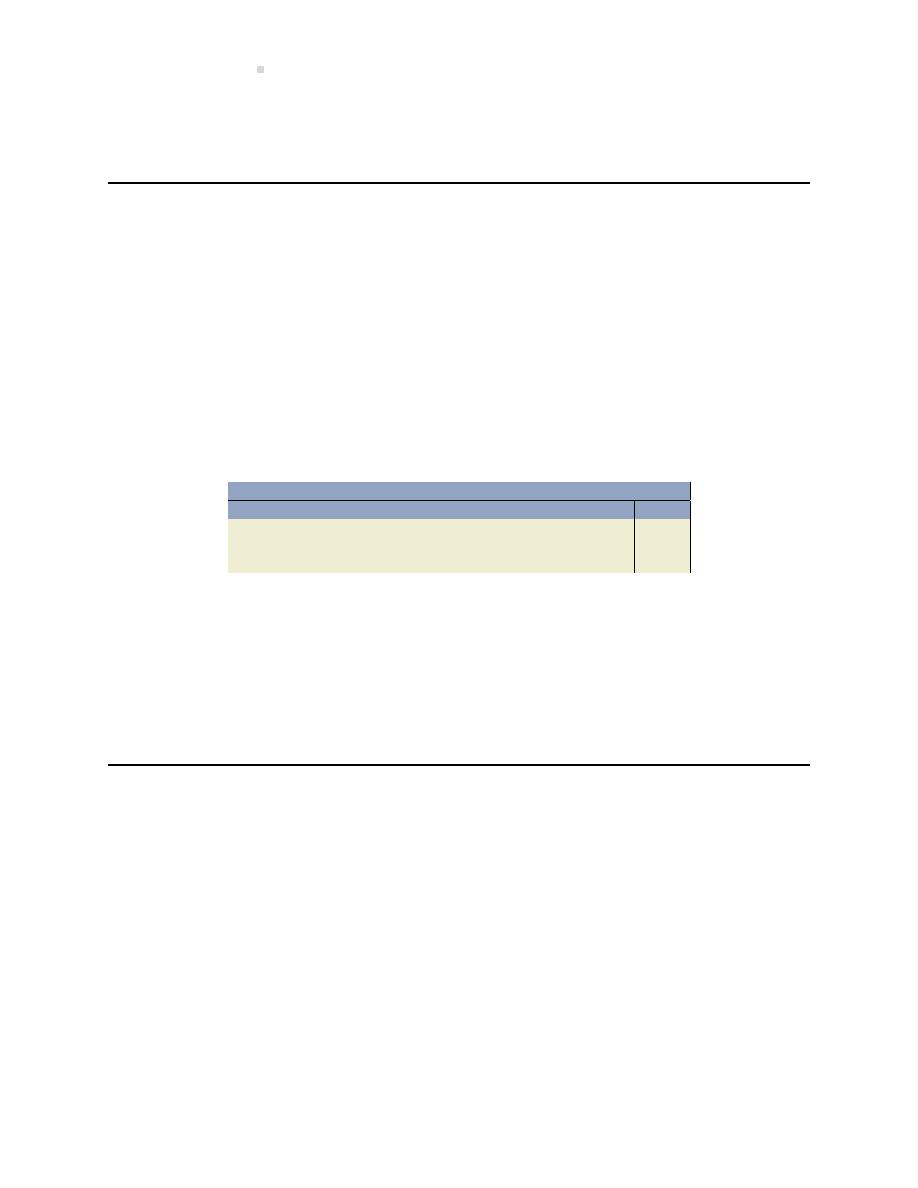
792
Solu ons To Problems
Chapter 10 Solu ons
PROBLEM 10–1
1. The equity sec on of the balance sheet a er the split is as follows:
Before split
A er split
Equity
Equity
Common Shares
Common Shares
Authorized – 5,000 Shares
Authorized – 5,000 Shares
Issued and Outstanding – 1,000 Shares $100,000
Issued and Outstanding – 5,000 Shares $100,000
2. Memorandum indica ng the new number of shares:
General Journal
Date
Account/Explana on
PR
Debit
Credit
Memorandum
The outstanding shares were increased
from 1,000 to 5,000 by a 5-for-1 share split.
3. It can be es mated that the market price per share would approximate $8 ($40/5). How-
ever, the share split should not have any effect on the overall value of the firm to investors.
Therefore, if five mes as many shares are now outstanding, each share should be worth
1/5 as much but each shareholder’s paid-in capital would be the same before and a er the
share split.
PROBLEM 10–2
1. General journal to record 2019 transac ons:
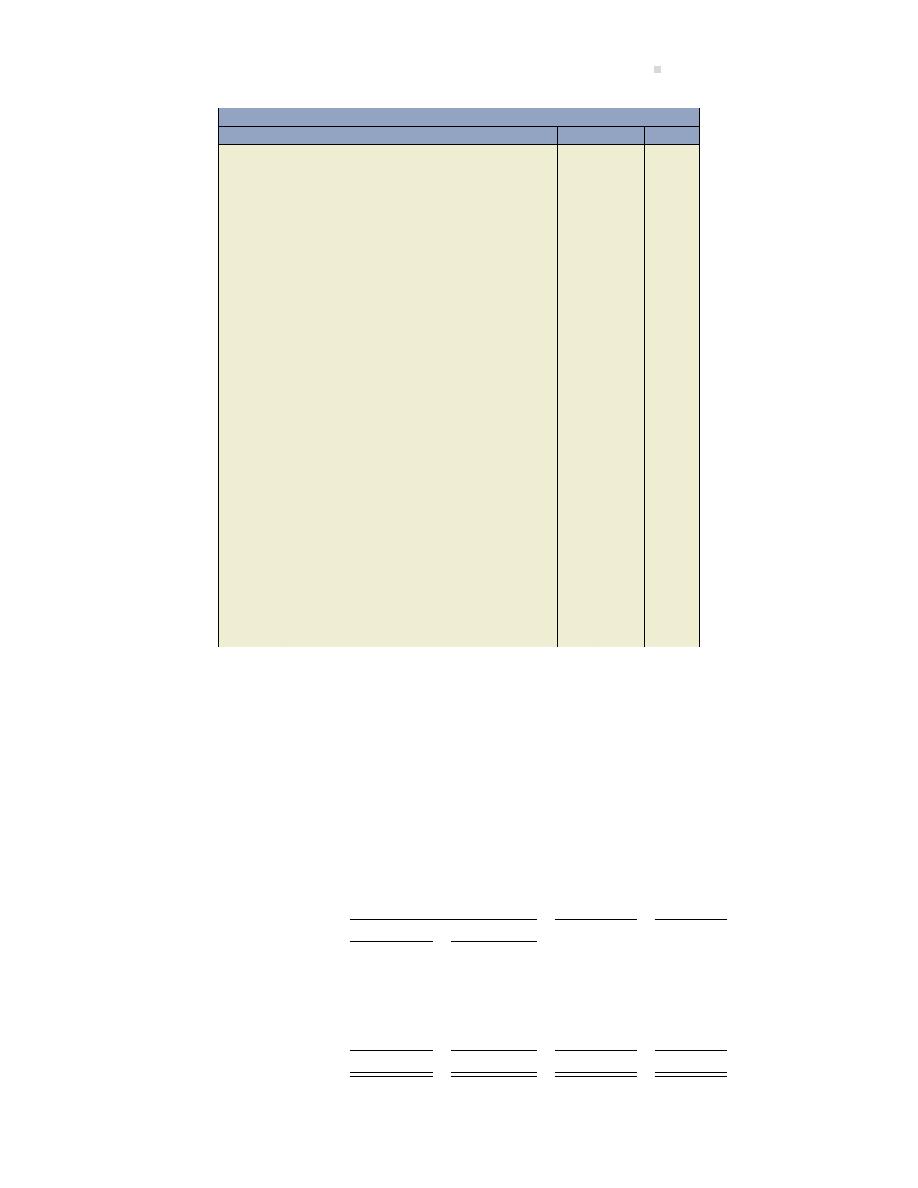
Chapter 10 Solu ons
793
General Journal
Date
Account/Explana on
PR
Debit
Credit
Feb. 15
Cash Dividends Declared* . . . . . . . . . . . . . .
112
Dividends Payable – Preferred Shares .
12
Dividends Payable – Common Shares .
100
Apr. 1
Dividends Payable – Preferred Shares . . . .
12
Dividends Payable – Common Shares . . . .
100
Cash . . . . . . . . . . . . . . . . . . . . . . . . . . . . . . .
112
May 1
Share Dividends Declared* . . . . . . . . . . . . . .
400
Share Dividends to be Distributed . . . .
400
(2,000 shares
× 10% = 200 shares × $2)
Jun. 15
Share Dividends to be Distributed . . . . . . .
400
Common Shares . . . . . . . . . . . . . . . . . . . .
400
Aug. 15
Cash Dividends Declared* . . . . . . . . . . . . . .
122
Dividends Payable – Preferred Shares .
12
Dividends Payable – Common Shares
(2,200 shares
× $0.05) . . . . . . . . . . . . . . . . .
110
Oct. 1
Dividends Payable – Preferred Shares . . . .
12
Dividends Payable – Common Shares . . . .
110
Cash . . . . . . . . . . . . . . . . . . . . . . . . . . . . . . .
122
Dec. 15
Share Dividends Declared* . . . . . . . . . . . . . .
660
Share Dividends to be Distributed . . . .
660
(2,200 shares
× 10% × $3 = $660)
27
Share Dividends to be Distributed . . . . . . .
660
Common Shares . . . . . . . . . . . . . . . . . . . .
660
31
Income Summary . . . . . . . . . . . . . . . . . . . . . .
1,400
Retained Earnings . . . . . . . . . . . . . . . . . . .
1,400
31
Retained Earnings**. . . . . . . . . . . . . . . . . . . .
1,294
Share Dividends Declared . . . . . . . . . . . .
1,060
Cash Dividends Declared . . . . . . . . . . . .
234
* Alterna vely, Retained Earnings could have been debited.
**If Retained Earnings was debited on the dividend declara on dates, then a closing entry
is not required.
2. The statement of changes is as follows:
TWR Contrac ng Inc.
Statement of Changes in Equity
For the Year Ended December 31, 2019
Retained
Total
Share Capital
Earnings
Equity
Common
Preferred
Opening Balance
$2,000
$400
$ 900
$ 3,300
Net Income
1,400
1,400
Dividends Declared
Cash
(234)
(234)
Common Shares
1,060
(1,060)
Ending Balance
$3,060
$400
$ 1,006
$ 4,466
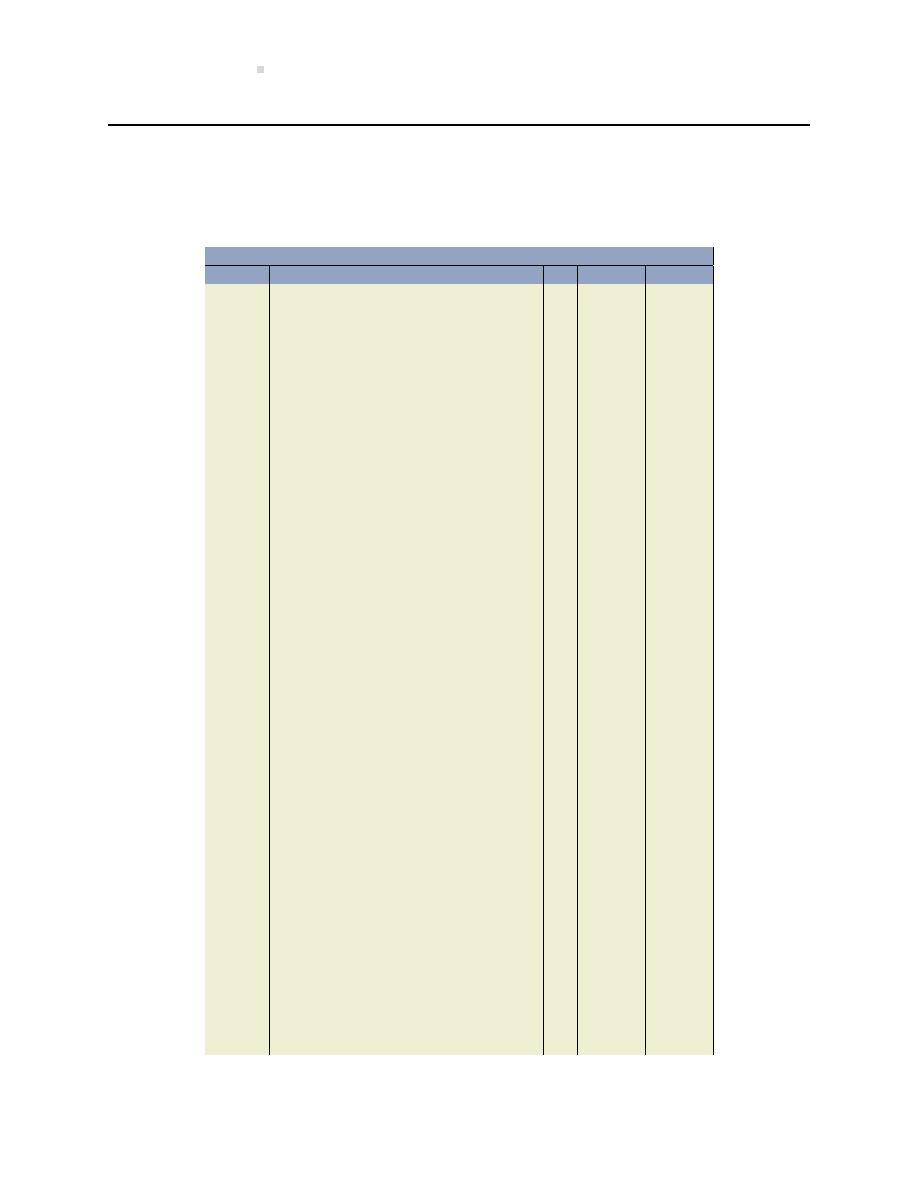
794
Solu ons To Problems
PROBLEM 10–3
1. General journal to record 2019 transac ons:
General Journal
Date
Account/Explana on
PR
Debit
Credit
Feb. 10
Cash Dividends Declared* . . . . . . . . . . . . . .
32,000
Dividends Payable – Preferred Shares .
30,000
Dividends Payable – Common Shares .
2,000
To record dividend declara on; $15,000
in arrears to Preferred + $15,000 to Pre-
ferred for 2019 leaves remainder of $2,000
for Common.
Mar. 1
Dividends Payable – Preferred Shares . . . .
30,000
Dividends Payable – Common Shares . . . .
2,000
Cash . . . . . . . . . . . . . . . . . . . . . . . . . . . . . . .
32,000
To record payment of dividends declared
February 10.
5
Cash . . . . . . . . . . . . . . . . . . . . . . . . . . . . . . . . . .
36,000
Preferred Shares . . . . . . . . . . . . . . . . . . . .
36,000
To record issuance of 2,000 preferred
shares at $18 each.
Memorandum Entry: Board of Directors
declared a 2:1 split on preferred and com-
mon shares:
Preferred Shares – (30,000 shares +
2,000 shares)
× 2 = 64,000
Common Shares – 70,000
× 2 =
140,000
Jun. 22
Cash . . . . . . . . . . . . . . . . . . . . . . . . . . . . . . . . . .
80,000
Common Shares . . . . . . . . . . . . . . . . . . . .
80,000
To record issuance of 20,000 common
shares at $4 each.
Nov. 10
Share Dividends Declared* . . . . . . . . . . . . . .
112,000
Share Dividends to be Distributed . . . .
112,000
To record share dividend;
[20%
×
(140,000 + 20,000)]
× $3.50.
Dec. 15
Share Dividends to be Distributed . . . . . . .
112,000
Common Shares . . . . . . . . . . . . . . . . . . . .
112,000
To record distribu on of common share
dividend.
31
Income Summary . . . . . . . . . . . . . . . . . . . . . .
290,000
Retained Earnings . . . . . . . . . . . . . . . . . . .
290,000
To close the credit balance in the Income
Summary account.
31
Retained Earnings**. . . . . . . . . . . . . . . . . . . .
144,000
Cash Dividends Declared . . . . . . . . . . . .
32,000
Share Dividends Declared . . . . . . . . . . . .
112,000
To close the dividend accounts.

Chapter 10 Solu ons
795
* Alterna vely, Retained Earnings could have been debited.
** If Retained Earnings was debited on the dividend declara on dates, then a closing entry
is not required.
2. The equity sec on of the balance sheet is as follows:
Wondra Inc.
Par al Balance Sheet
December 31, 2019
Contributed Capital
Preferred Shares; $0.50 cumula ve;
unlimited shares authorized; 64,000
shares issued and outstanding
$516,000
Common Shares; unlimited shares
authorized; 192,000 shares issued and
outstanding
752,000
Total contributed capital
$1,268,000
Retained Earnings
241,000
Total Equity
$1,509,000
Part 2 Calcula ons (using T-accounts to track changing account balances):
Preferred Shares
$480,000
(30,000 shares)
Dec. 31/18 balance
36,000
(2,000 shares)
Mar. 5/19
0
(32,000 shares)
Apr. 15/19
$516,000
(64,000 shares)
Dec. 31/19 balance
Common Shares
$560,000
(70,000 shares)
Dec. 31/18 balance
0
(70,000 shares)
Apr. 15/19
80,000
(20,000 shares)
Jun. 22/19
112,000
(32,000 shares)
Nov. 15/19
$752,000
(192,000 shares)
Dec. 31/19 balance
Retained Earnings
$95,000
Dec. 31/18 balance
Dec. 31/19
Cash Div.
32,000
Share Div.
112,000
290,000
Dec. 31/19
241,000
Dec. 31/19 balance
PROBLEM 10–4
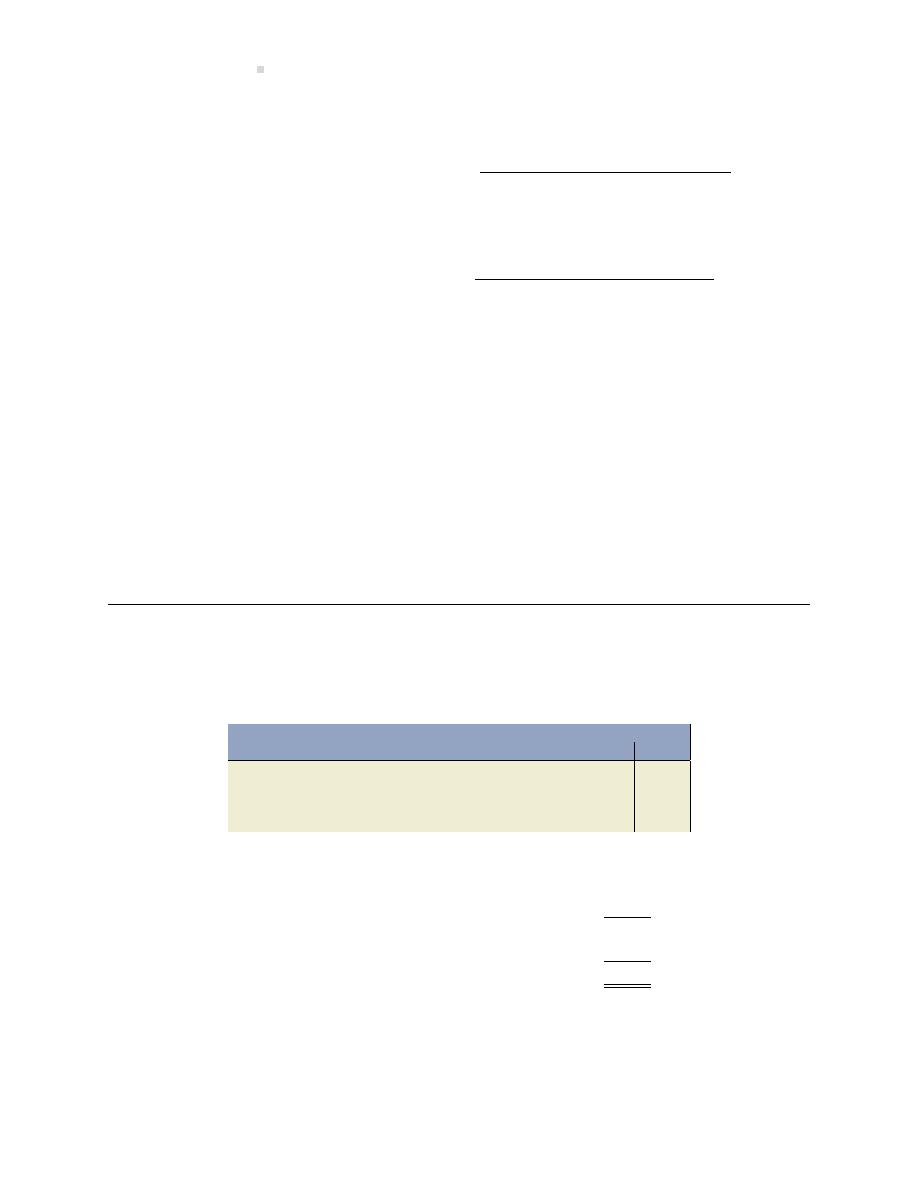
796
Solu ons To Problems
1. The paid-in capital per common share, and book value per common share are:
Paid-in capital per common share
=
Total Paid-in Capital
Number of shares outstanding
=
$3,070/300 = $10.23 (rounded)
Book value per common share =
Total equity
Number of shares outstanding
=
$3,570/300 = $11.90
2. There is li le rela onship between market price and the book value of a share. Book value
provides only a basis on which to compare two or more companies, or to compare a com-
pany’s market price per share. Market value is affected by investors’ percep ons of future
earnings expecta ons of the company. Also some assets recorded at historical cost, such
as land, may have appreciated in value. This apprecia on would be reflected in the market
value of the common shares, but not in the book value.
Chapter 11 Solu ons
PROBLEM 11–1
1. Entry to record the disposal:
General Journal
Date
Account/Explana on
PR
Debit
Credit
Accumulated Deprecia on . . . . . . . . . . . . . .
16
1
Cash . . . . . . . . . . . . . . . . . . . . . . . . . . . . . . . . . .
12
Equipment . . . . . . . . . . . . . . . . . . . . . . . . .
20
Gain on Sale of Equipment . . . . . . . . . . .
8
Cost (given)
20
1
Acc. Deprecia on (derived)
(16)
Book Value or Carrying Amount (given)
4
Cash Proceeds (given)
(12)
Gain on Sale (given)
8
Cash is increased by $12, the amount of the sale proceeds, but this does not represent
cash flow from an opera ng ac vity. The sale of property, plant and equipment assets is an
inves ng ac vity, and so will not be shown in the calcula on of cash flow from opera ng

Chapter 11 Solu ons
797
ac vi es. The $12 inflow of cash from the sale of the equipment will be shown as a cash
inflow in the Inves ng Ac vi es sec on of the SCF.
The $8 gain on sale is included in the calcula on of net income. Since it (a) does not repre-
sent actual cash inflow (the $12 is the actual cash inflow) and (b) is not an opera ng ac vity,
the gain is deducted from net income on the SCF to derive cash flow from opera ng ac vi-
es.
2. Cash flow from opera ng ac vi es calculated as follows:
Net Income
$33
Items Not Affec ng Cash Flow
Deprecia on Expense
10
Gain on Sale of Equipment
(8)
Cash Flow from Opera ng Ac vi es
$35
PROBLEM 11–2
1. Beginning retained earnings + net income
− dividends declared = Ending retained earnings;
156 + 50
− 0 = 206. No dividends were declared so the net change in retained earnings of
50 is en rely an opera ng ac vity – net income.
2. The cash flow from opera ng ac vi es is calcula ng as follows:
Balance
Change
Cash Effect
Ac vity
2019
2018
Dr. (Cr.)
Dr. (Cr.)
Dr.
Cr.
Inflow
Ou low
Cash
100
86
14
To be explained
C&CE
Accounts Receivable
60
40
20
20
Opera ng
Inventory
36
30
6
6
Opera ng
Prepaid Rent
10
-0-
10
10
Opera ng
Retained Earnings
(206)
(156)
50
50
Opera ng
-0-
-0-
50
50
50
36
$14 net cash inflow
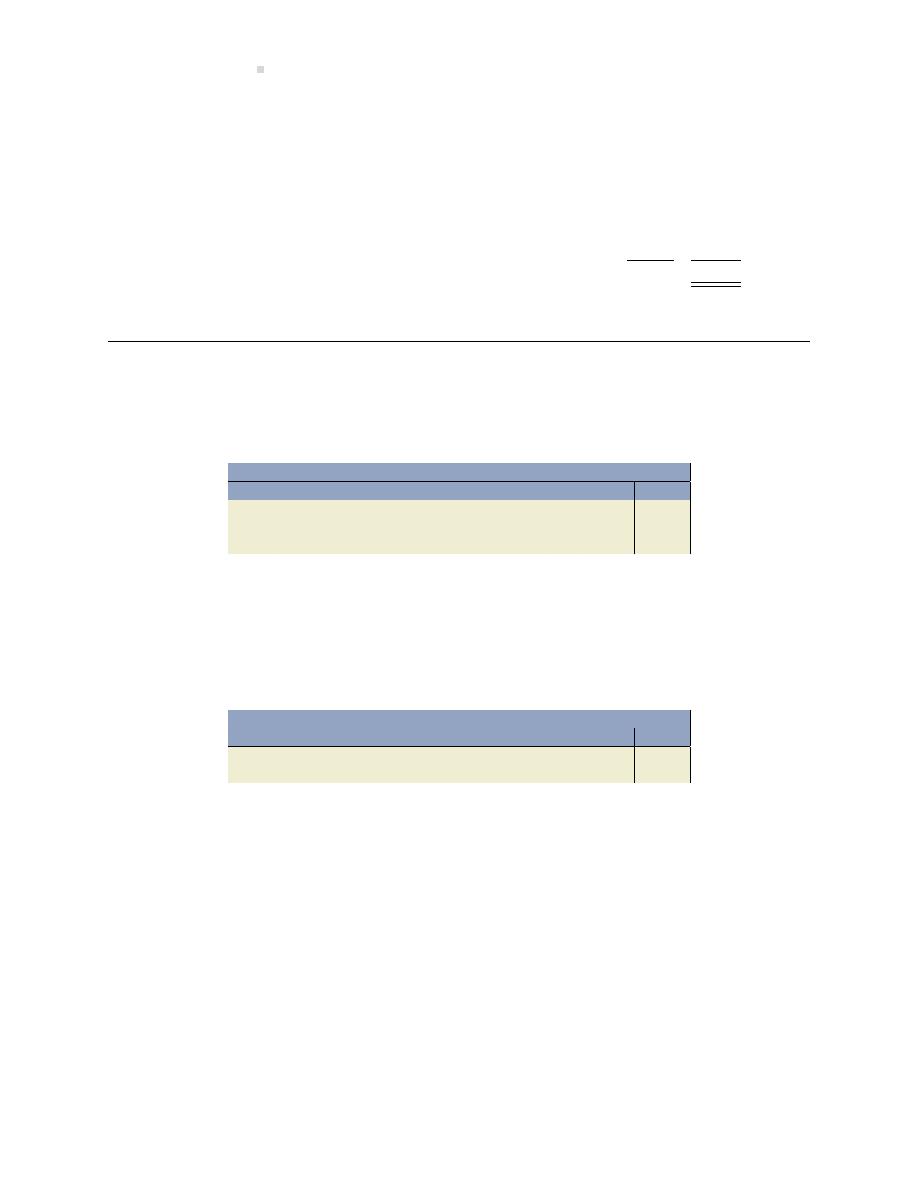
798
Solu ons To Problems
Cash flow from opera ng ac vi es would be calculated as:
Net Income
$ 50
Adjustments to reconcile net income to cash provided by
opera ng ac vi es:
Increase in Accounts Receivable
(20)
Increase in Inventory
(6)
Increase in Prepaid Rent
(10)
(36)
Cash Flow from opera ng ac vi es
$ 14
PROBLEM 11–3
1. Entry to record the deprecia on expense for the year:
General Journal
Date
Account/Explana on
PR
Debit
Credit
Deprecia on Expense . . . . . . . . . . . . . . . . . .
100
Accumulated Deprecia on – Machin-
ery . . . . . . . . . . . . . . . . . . . . . . . . . . . . . . . . . . .
100
There is no cash effect. However, the deprecia on expense should be added back to the
net loss figure when deriving cash flow from opera ng ac vi es because it is a non-cash
expense.
2. Entry to account for the change in the Machinery balance sheet account:
General Journal
Date
Account/Explana on
PR
Debit
Credit
Machinery . . . . . . . . . . . . . . . . . . . . . . . . . . . .
300
Cash . . . . . . . . . . . . . . . . . . . . . . . . . . . . . . .
300
Since (a) the Machinery account increased $300 (500
− 200) during the year, (b) no disposals
occurred, and (c) all purchases of machinery were paid in cash, $300 of cash must have been
spent on machinery purchases. This cash ou low is an inves ng ac vity.
3. Cash flow table:

Chapter 11 Solu ons
799
Balance
Change
Cash Effect
Ac vity
2019
2018
Dr. (Cr.)
Dr. (Cr.)
Dr.
Cr.
Inflow
Ou low
Cash
350
650
300
To be explained
C&CE
Machinery
500
200
300
300
Inves ng
Accumulated Deprecia on
(250)
(150)
100
100
Opera ng
Retained Earnings
(600)
(700)
100
100
Opera ng
-0-
-0-
400
400
100
400
$300 net cash ou low
Statement of Cash Flows
For the Year Ended December 31, 2019
Cash flows from opera ng ac vi es:
Net Loss
$(100)
Adjustments to reconcile net loss to cash
provided by opera ng ac vi es
Deprecia on Expense
100
Net cash flow from opera ng ac vi es
-0-
Cash flows from inves ng ac vi es:
Purchase of Machinery
(300)
Net decrease in cash
(300)
Cash at beginning of year
650
Cash at end of year
$350
PROBLEM 11–4
1. Cash flow table:
Balance
Change
Cash Effect
Ac vity
2019
2018
Dr. (Cr.)
Dr. (Cr.)
Dr.
Cr.
Inflow
Ou low
Cash
1,350
1,800
*450
To be explained
C&CE
Borrowings
(800)
(1,300)
500
500
Financing
Retained Earnings
(550)
(500)
50
90
Opera ng
40
Financing
-0-
-0-
500
500
90
540
*$450 net cash ou low

800
Solu ons To Problems
Cash flow from opera ng ac vi es equals net income of $90. All revenue was received in
cash and all expenses were paid in cash, and there were no changes to any other balance
sheet accounts that affect cash flow from opera ng ac vi es.
2. Dividends declared must have been $40, calculated as follows:
Opening Retained Earnings (given)
$500
Add: Net Income (given)
90
Less: Dividends Paid (derived)
(40)
Ending Retained Earnings (given)
$550
3. Cash Used by Financing Ac vi es:
Repayment of Borrowings
$(500)
Payment of Dividends
(40)
$(540)
PROBLEM 11–5
Calcula ons:
Change
Cash Effect
Ac vity
Dr.
Cr.
Inflow
Ou low
Cash
*1,175
To be explained
C&CE
Accum. Dep’n.
120(b)
120
Opera ng
Accounts Receivable
(d)40
40
Opera ng
Merchandise Inventory
50(e)
50
Opera ng
Accum. Amort – Patents
5(f)
5
Opera ng
Wages Payable
20(c)
20
Opera ng
Borrowings
(g)250
250
Financing
Common Shares
500(h)
500
Financing
Retained Earnings
800(a)
800
Opera ng
(i)30
30
Financing
1,495
1,495
1,495
320
*$1,175 net cash inflow

Chapter 11 Solu ons
801
Dunn Corpora on
Statement of Cash Flows
For the Year Ended December 31, 2019
Cash flows from opera ng ac vi es:
Net Income
$800
Adjustments to reconcile net income to cash provided
by opera ng ac vi es
Increase in accounts receivable
(40)
Decrease in merchandise inventory
50
Increase in wages payable
20
Deprecia on and Amor za on Expense ($120 + 5)
125
Net cash inflow from opera ng ac vi es
955
Cash flows from financing ac vi es:
Repayment of borrowings
$(250)
Common shares issued
500
Payment of dividends
(30)
Net cash inflow from financing ac vi es
220
Net increase in cash
1,175
Cash at beginning of year**
25
Cash at End of Year
$1,200
**If the company had $1,200 cash on hand at the end of the year and cash increased by $1,175
during the year, cash on hand at the beginning of the year must be $25.
PROBLEM 11–6
Calcula ons:
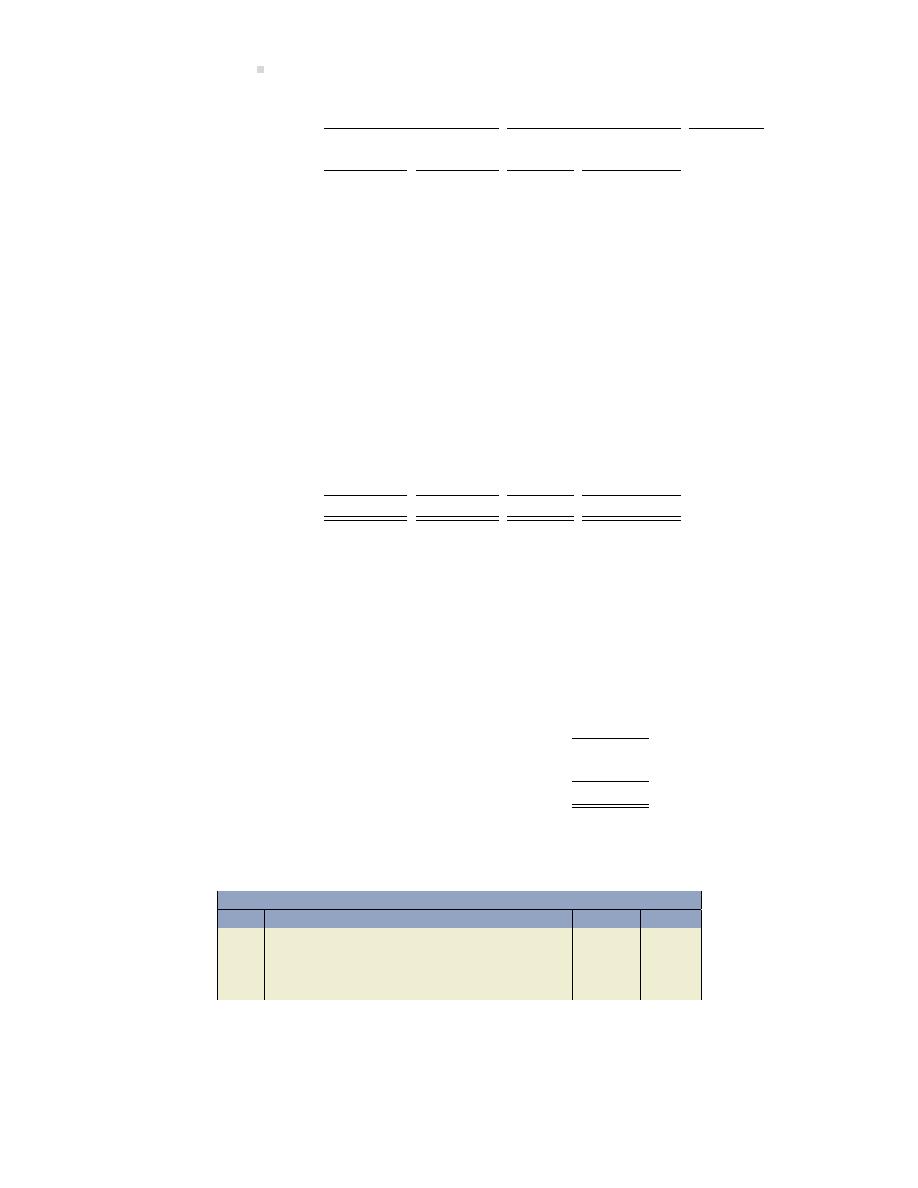
802
Solu ons To Problems
Change
Cash Effect
Ac vity
Dr.
Cr.
Inflow
Ou low
Cash
37,900
2
To be explained
C&CE
Accounts Receivable
(c) 900
900
Opera ng
Merchandise Inventory
(d) 1,200
1,200
Opera ng
Equipment
(h) 10,000
5
Inves ng
(j) 15,000
(i)6,000
3
Inves ng
(j)1,500
Opera ng
Accum. Dep’n. – Equip.
(j) 7,500
(a) 3,000
3,000
Opera ng
Accum. Amort – Patents
(e) 100
100
Opera ng
Accounts Payable
(k) 1,000
1,000
Opera ng
Wages Payable
(b) 500
500
Opera ng
Dividends Payable
(i) 5,000
4
Borrowings
(f) 5,000
5,000
Financing
Common Shares
(g) 12,500
12,500
Financing
(h) 10,000
5
Retained Earnings
20,000
1
20,000
Opera ng
(i) 5,000
4
67,300
67,300
44,800
6,900
$37,900
2
net cash inflow
1
Net income = $95,000
− 70,000 − 5,000 = $20,000
2
Given
3
Cost of machinery
$15,000
Accumulated deprecia on (1/2)
(7,500)
Carrying amount
7,500
Cash proceeds
(6,000)
Loss on disposal
$1,500
The journal entry to record the sale would be:
General Journal
Date
Account/Explana on
PR
Debit
Credit
Cash . . . . . . . . . . . . . . . . . . . . . . . . . . . . . . . . . .
6,000 (i)
Accumulated Dep’n. . . . . . . . . . . . . . . . . . . . .
7,500
Loss on Sale . . . . . . . . . . . . . . . . . . . . . . . . . . .
1,500(j)
Machinery . . . . . . . . . . . . . . . . . . . . . . . . .
15,000
Items (a) and (b) affect the SCF. The first (i) is a cash inflow from inves ng ac vi es. The second
(j) is added back to net income to arrive at cash flow from opera ng ac vi es.

Chapter 12 Solu ons
803
4
Dividends were declared but not paid therefore there is no impact on cash.
5
$10,000 of equipment was acquired by issuing common shares which is a non-cash transac on
reported in a note but not included on the statement of cash flows.
1. The statement of cash flows is as follows:
Wheaton Co. Ltd.
Statement of Cash Flows
For the Year Ended December 31, 2019
Cash flows from opera ng ac vi es:
Net income ($95,000
− 70,000 − 5,000)
$ 20,000
Adjustments to reconcile net income to cash provided by
opera ng ac vi es:
Deprecia on and amor za on ($3,000 + 100)
3,100
Loss on Disposal of Machinery
1,500
Increase in wages payable
500
Increase in accounts receivable
(900)
Decrease in merchandise inventory
1,200
Decrease in accounts payable
(1,000)
Net cash inflow from opera ng ac vi es
24,400
Cash flows from inves ng ac vi es:
Proceeds from sale of machinery
$ 6,000
Net cash inflow from inves ng ac vi es
6,000
Cash flows from financing ac vi es:
Repayment of borrowings
(5,000)
Common shares issued for cash
12,500
Net cash inflow from financing ac vi es
7,500
Net Increase in cash (given)
37,900
Cash at beginning of year (given)
1,000
Cash at end of year (derived)
$ 38,900
2. The statement of cash flows shows that the company has financed its ac vi es internally
from opera ons and by issuing common shares. The sale of machinery also generated cash.
It has repaid some borrowings and acquired some property, plant and equipment assets.
Wheaton Co. Ltd. has generated substan ally more cash than it has used in 2019.
Chapter 12 Solu ons
PROBLEM 12–1

804
Solu ons To Problems
Belafonte Corpora on
Balance Sheet
At April 30, 2011
Assets
Liabili es and Equity
Cash
$ 2,000
(c)
Accounts Payable
$ 8,000
(f)
Accounts Receivable
8,000
(a)
Bonds Payable
20,000 (b)
Merchandise Inventories
20,000 (b)
Common Shares
15,000
(g)
Total Current Assets
30,000
(d)
Retained Earnings
7,000
(i)
Property, plant and equipment
20,000
(b)
assets (net)
Total Liabili es and
Total Assets
$50,000
(e)
Equity
$50,000 (h)
Informa on:
(1) Current assets = 3.75
× Current liabili es (accounts payable)
(2) Sales for year = $73,000
(3) Merchandise inventories = $20,000 = Property, plant and equipment assets = bonds payable
(4) Accounts receivable collec on period = 40 days
Average accounts receivable
× 365 days
Net credit sales
(5) Bonds payable = 10
× cash
(6) Total current assets = 2
× common shares.
Calcula ons:
(a)
Average accounts receivable
× 365 days = 40 days
$73,000
Average accounts receivable = $8,000
(b) Merchandise inventory, property, plant and equipment assets (net), and bonds payable each
equal $20,000
(c) Cash = bonds payable/10 = $20,000/10 = $2,000
(d) Total current assets = $2,000 + 8,000 + 20,000 = $30,000
(e) Total assets = $20,000 + 30,000 = $50,000
(f) Accounts payable = Current assets/3.75 = $30,000/3.75 = $8,000

Chapter 12 Solu ons
805
(g) Common shares = Current assets/2 = $30,000/2 = $15,000
(h) Total liabili es and equity must equal total assets
(i) Retained earnings = Total liabili es and equity
− accounts payable − bonds payable − com-
mon shares = $50,000
− 8,000 − 20,000 − $15,000 = $7,000
PROBLEM 12–2
Hook Limited
Balance Sheet
At December 31, 2011
Assets
Current
Cash
$ 30,000
Accounts Receivable
150,000
(3)
Merchandise Inventories
90,000
(4)
Total Current Assets
270,000
(2)
Property, Plant, and Equipment
442,500 (10)
Less: Accumulated Deprecia on
100,000
342,500
(9)
Total Assets
$612,500
(8)
Liabili es
Current
Accounts Payable
$ 50,000
Accrued Liabili es
70,000
(1)
Total Current Liabili es
120,000
Non-current
8% Bonds Payable
125,000
(6)
245,000
Equity
Common Shares
80,000
(5)
Retained Earnings
287,500 (12)
367,500
Total Liabili es and Equity
$612,500
(11)
Calcula ons:
(1) Accrued liabili es = $120,000
− 50,000 = $70,000
(Total current liabili es
− accounts payable)
(2) Total current assets = $120,000 + 150,000 = $270,000
(Total current liabili es + working capital)

806
Solu ons To Problems
(3) Accounts receivable = ($120,000
× 1.5) − 30,000 = $150,000
[(Total current liabili es
× acid-test ra o) − cash]
(4) Inventories = $270,000
− 150,000 − 30,000 = $90,000
(Total current assets
− accounts receivable − cash)
(5) Net income = [$80,000
− (80,000/8)] − $30,000 = $40,000
[Income before interest and income taxes
− (income before interest and income taxes/ mes
interest earned)
− income taxes
Therefore, common shares = $40,000/5
× $10 = $80,000
(Net income/Earnings per share)
× issued value
(6) Bonds payable = $80,000/8 divided by 0.08% = $125,000
[Income before interest and income taxes/Times interest earned)/Interest rate]
(7) If the ra o of equity to total assets is 0.60 to 1, then the ra o of liabili es to total assets is 0.40
to 1.
(8) Total assets = ($120,000 + 125,000)/0.4 = $612,500
[(Total current liabili es + total non-current liabili es)/Total debt to total assets ra o]
(9) Net PPE = $612,500
− 270,000 = $342,500
(Total assets
− current assets)
(10) PPE = $342,500 + 100,000 = $442,500
(Net PPE + accumulated deprecia on)
(11) Total liabili es and equity = Total assets = $612,500.
(12) Retained earnings = $612,500
− 245,000 − 80,000 = $287,500
(Total liabili es and equity
− total liabili es − common shares)
Chapter 13 Solu ons
PROBLEM 13–1
1. Schedule to allocate the 2015 net income to partners:
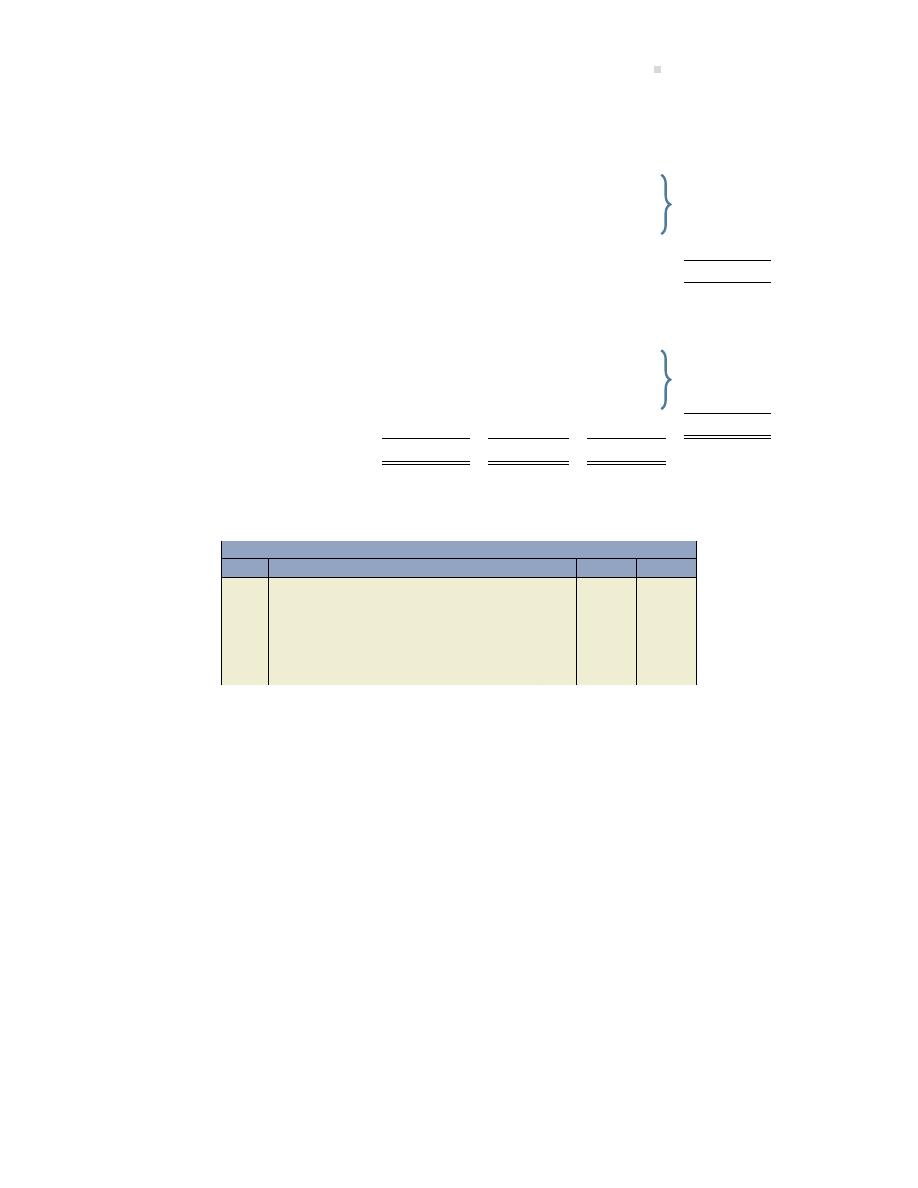
Chapter 13 Solu ons
807
Bog
Cog
Fog
Total
Profit to be allocated
$40,000
Interest alloca on:
Bog: $60,000
× 10%
$ 6,000
Cog: $100,000
× 10%
$ 10,000
(18,000)
Fog: $20,000
× 10%
$ 2,000
Balance
22,000
Salary alloca on:
24,000
30,000
48,000
(102,000)
Balance (deficit)
(80,000)
Balance allocated in profit and
loss sharing ra o:
Bog: ($80,000)
× 5/10
(40,000)
Cog: ($80,000)
× 3/10
(24,000)
80,000
Fog: ($80,000
× 2/10
(16,000)
Balance
$
-0-
Total allocated to partners
($10,000)
$16,000
$34,000
2. Entry to record the division of the 2015 net income:
General Journal
Date
Account/Explana on
PR
Debit
Credit
Income Summary . . . . . . . . . . . . . . . . . . . . . .
40,000
Bog, Capital . . . . . . . . . . . . . . . . . . . . . . . . . . .
10,000
Cog, Capital . . . . . . . . . . . . . . . . . . . . . . . .
16,000
Fog, Capital . . . . . . . . . . . . . . . . . . . . . . . .
34,000
To record net income alloca on to part-
ners.