/
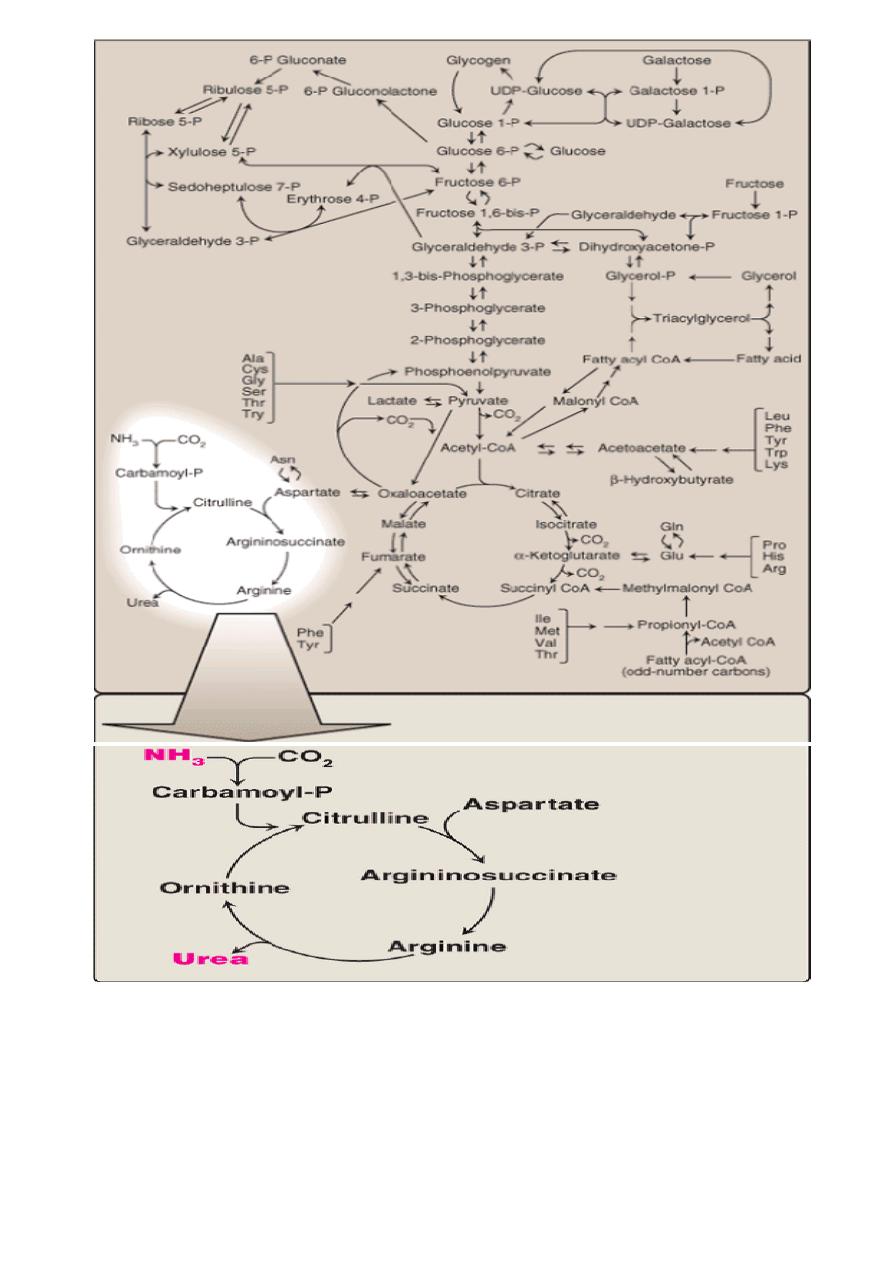
Figure 19.1 Urea cycle shown as part of the essential reactions of energy metabolism. (See Figure
8.2, p. 92, for a more detailed view of the metabolic pathway.)
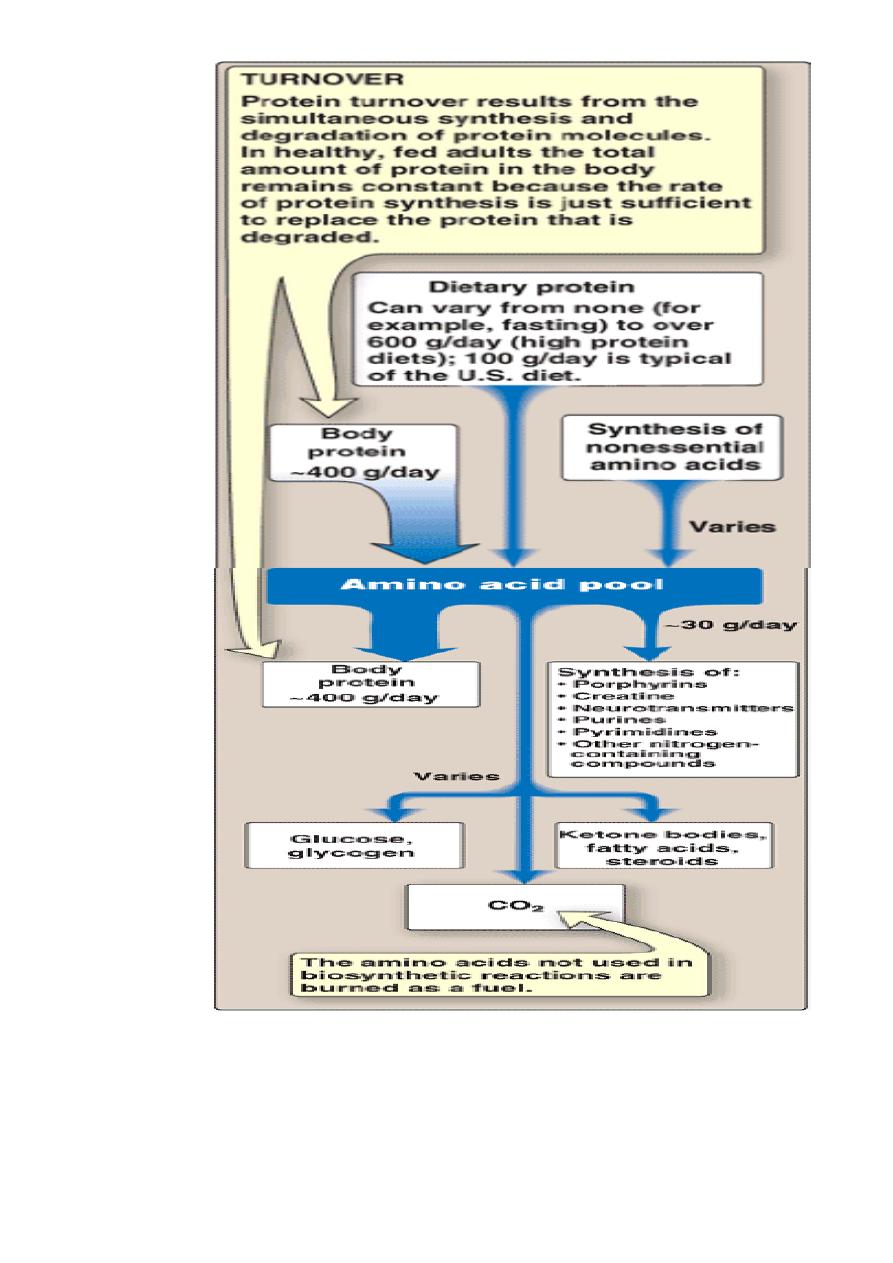
Figure 19.2 Sources and fates of amino acids.
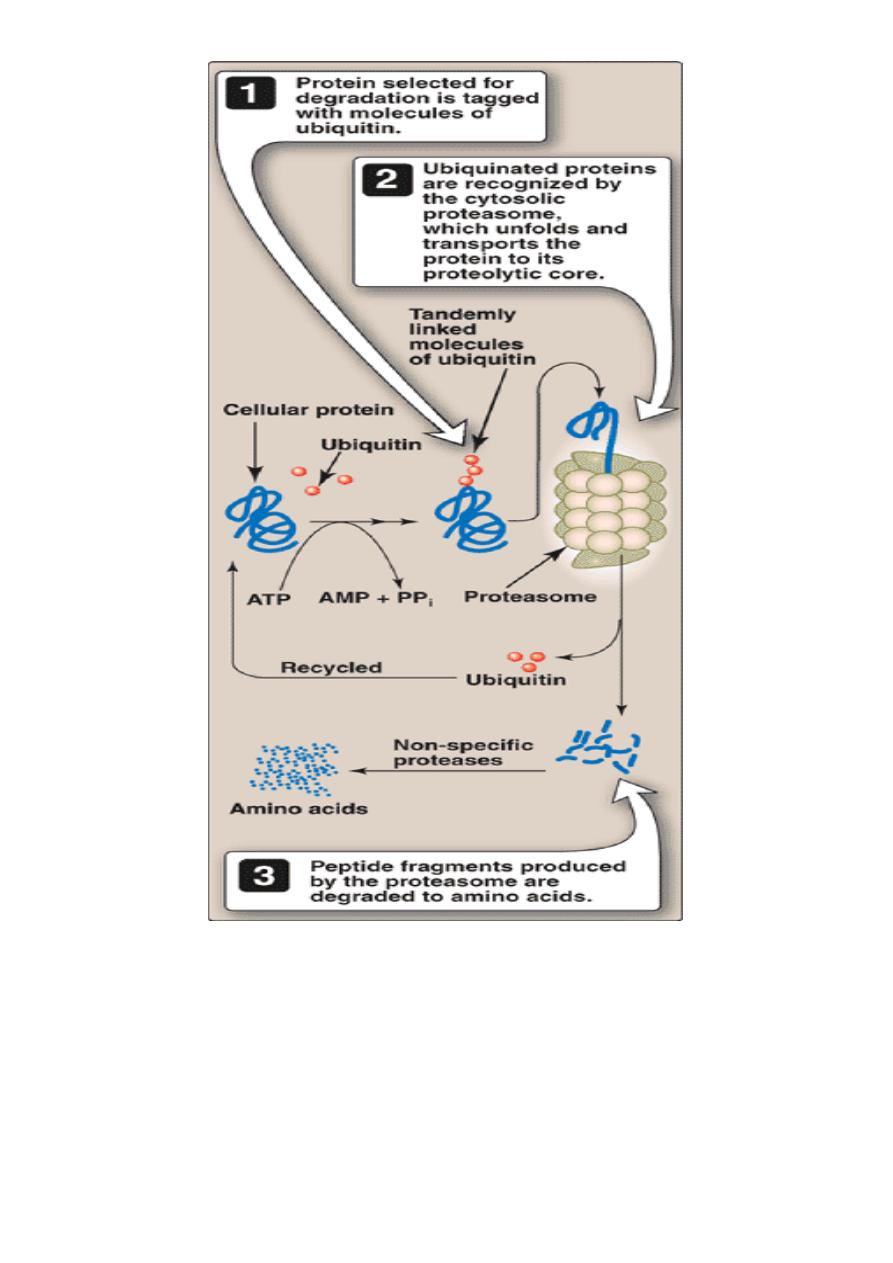
Figure 19.3 The ubiquitin-proteasome degradation pathway of proteins.
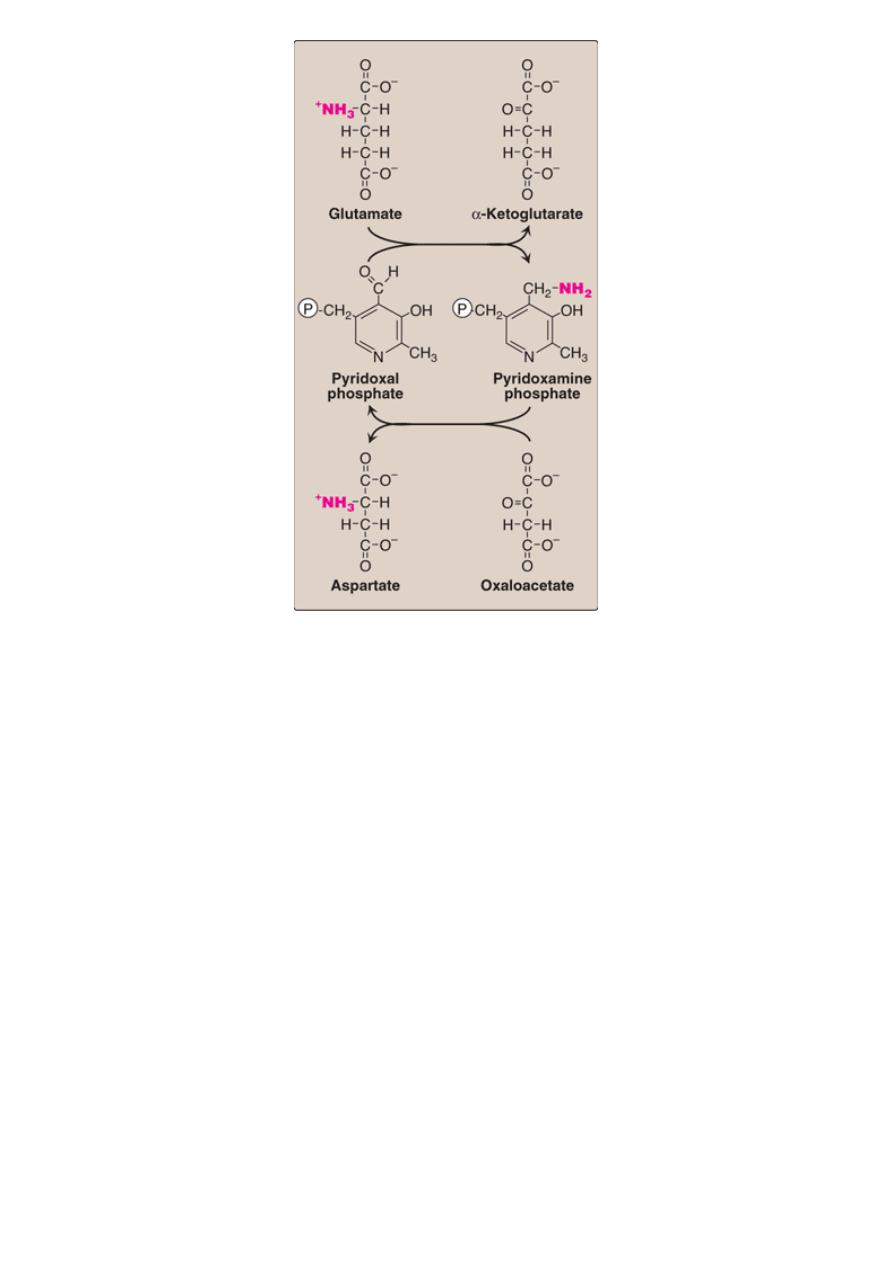
Figure 19.9 Cyclic interconversion of pyridoxal phosphate and pyridoxamine phosphate during the
aspartate aminotransferase reaction. [Note: P = phosphate group].
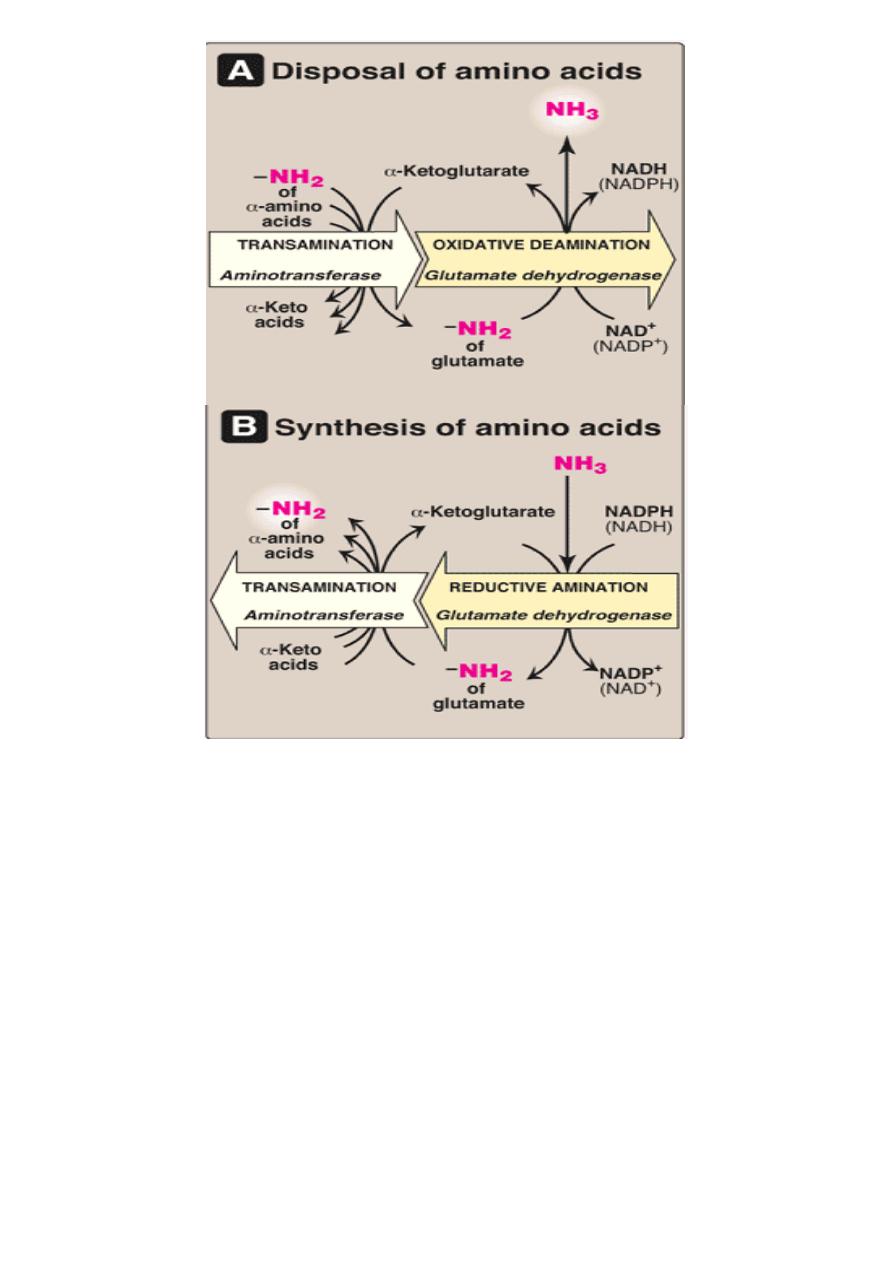
Figure 19.12 Combined actions of aminotransferase and glutamate dehydrogenase reactions.
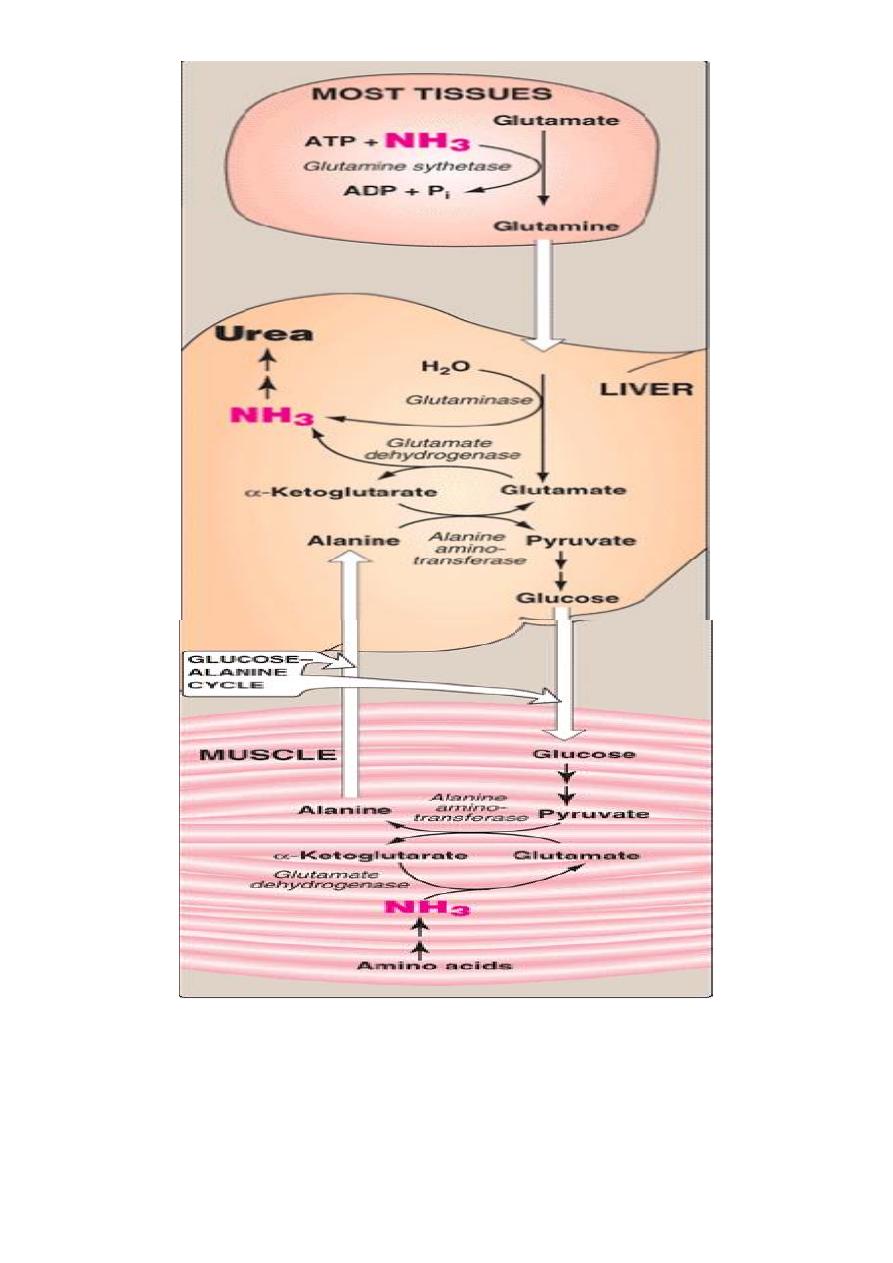
Figure 19.13 Transport of ammonia from perip
.heral tissues to the liver.
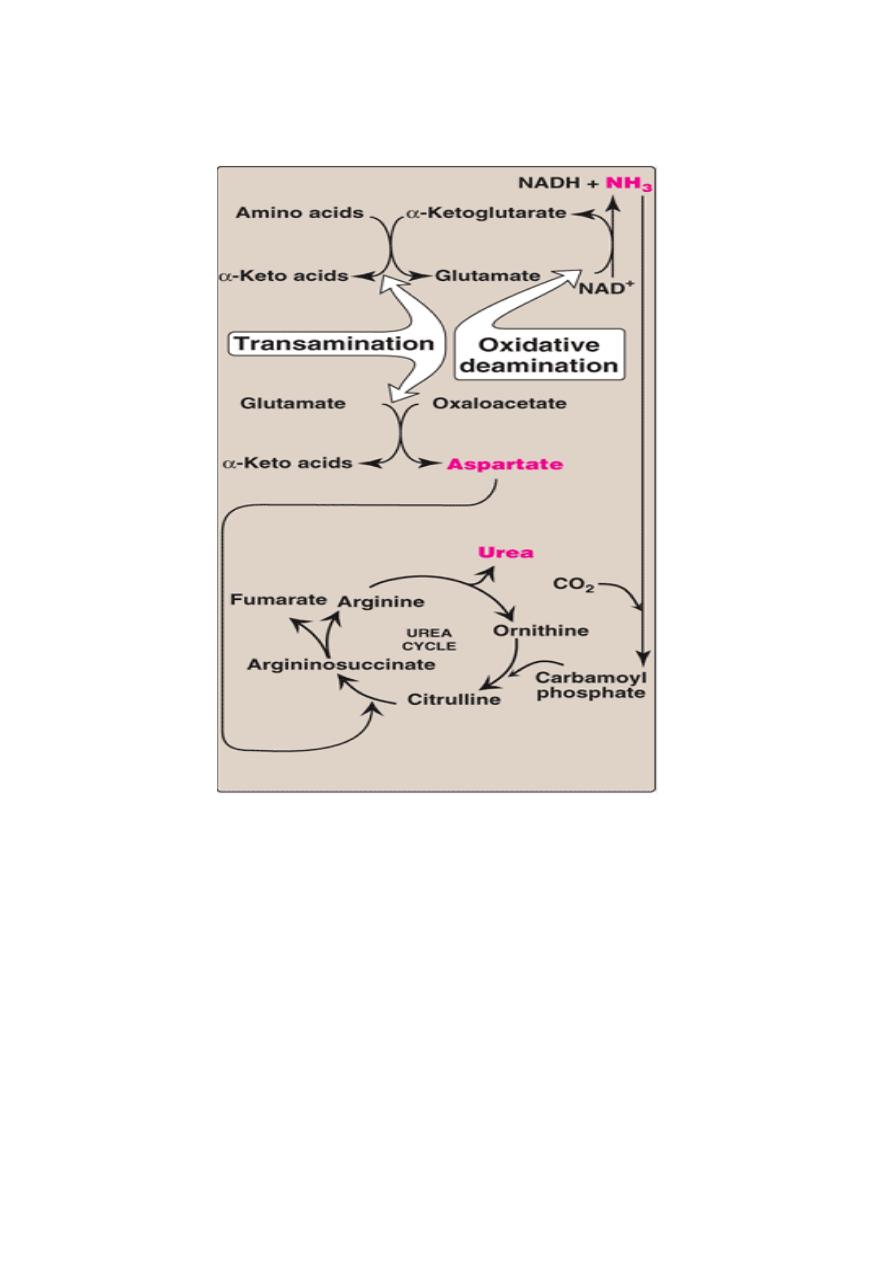
Figure 19.15 Flow of nitrogen from amino acids to urea. Amino groups for urea synthesis are
collected in the form of ammonia and aspartate.
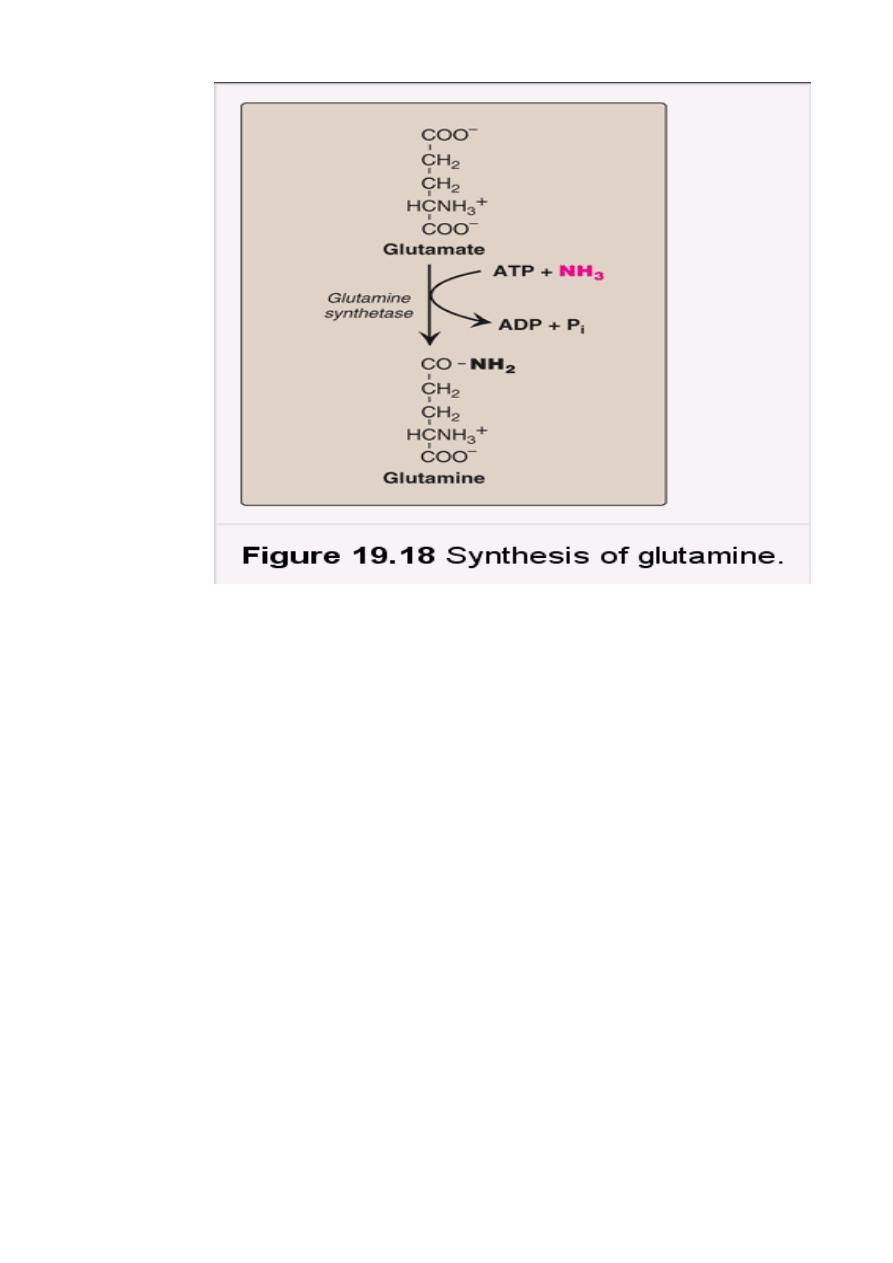
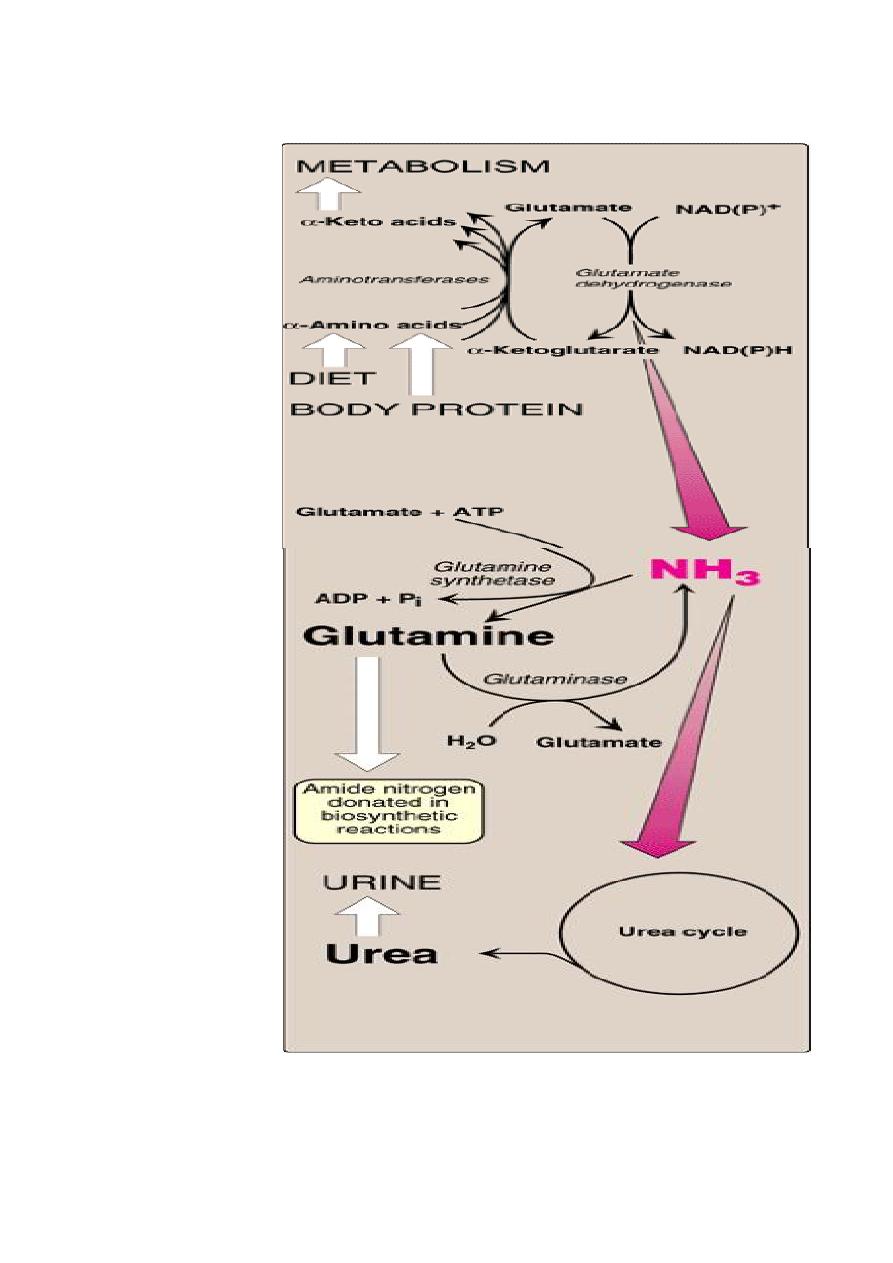
Figure 19.19 Metabolism of ammonia.
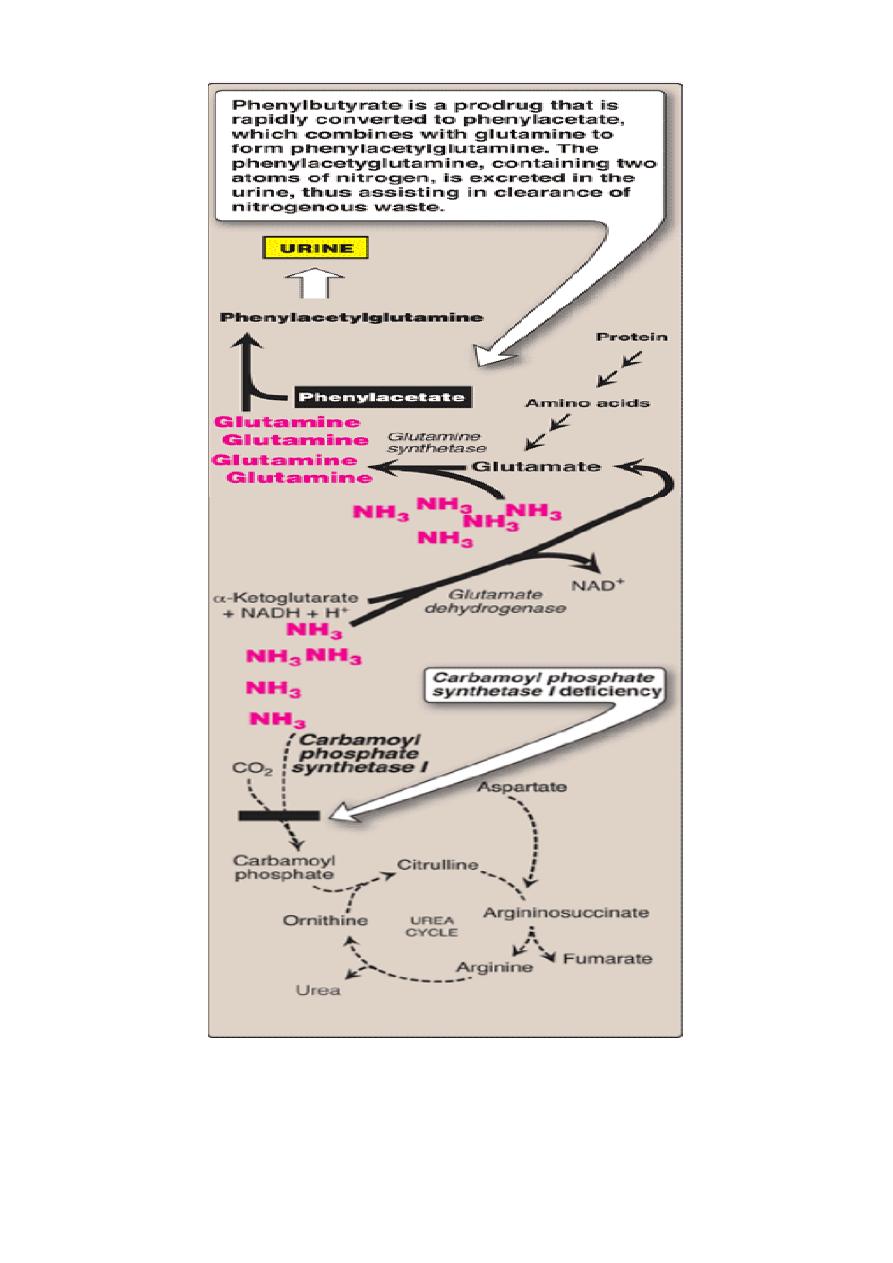
Figure 19.20 Metabolism of nitrogen in a patient with a deficiency in the urea cycle enzyme
carbamoyl phosphate synthetase I. Treatment with phenylbutyrate converts nitrogenous waste to a
form that can be excreted.

Figure 19.1 Urea cycle shown as part of the essential reactions of energy metabolism. (See Figure
8.2, p. 92, for a more detailed view of the metabolic pathway.)
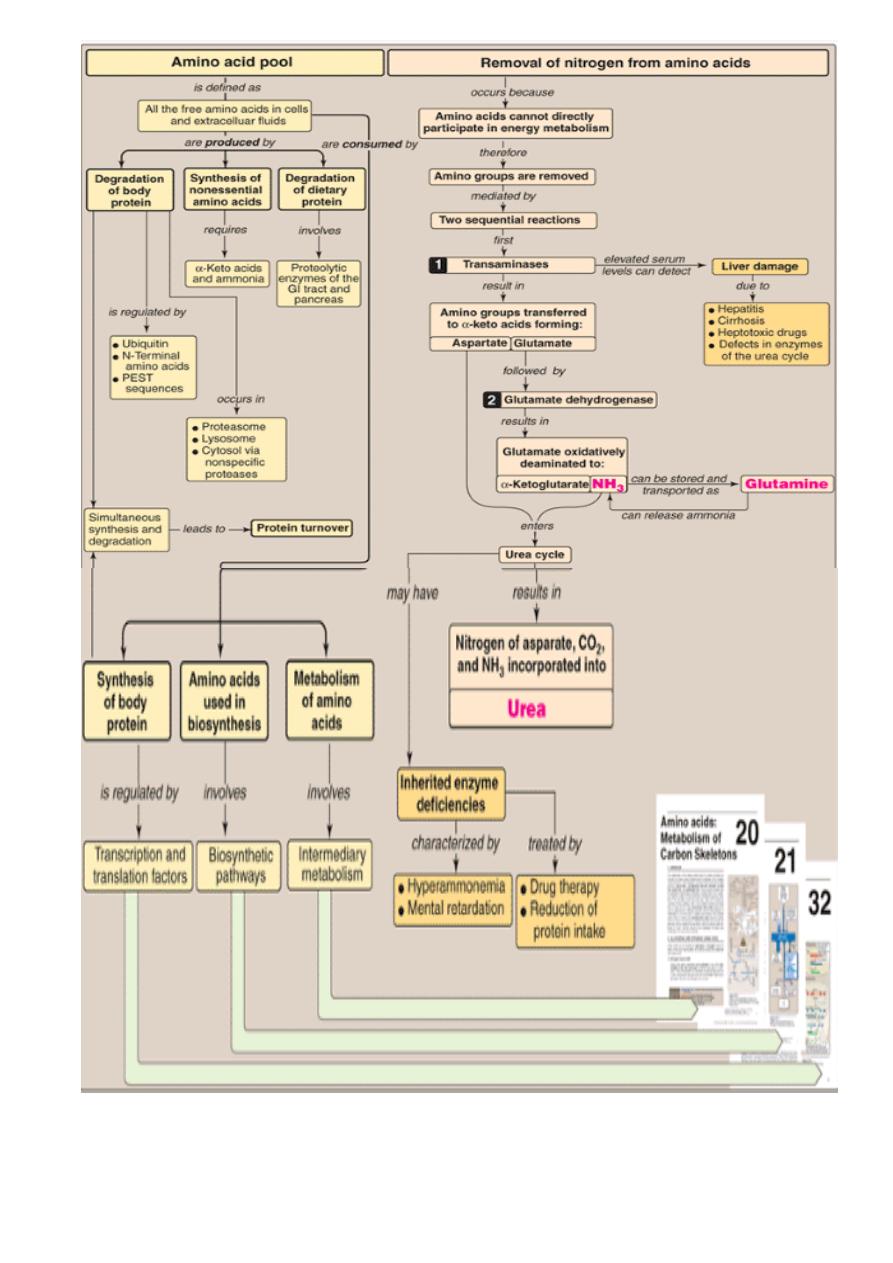
Figure 19.21 Key concept map for nitrogen metabolism.