Applications of probability distribution
Estimation of population parametersLearning objectives
At the end of the lecture the student should be able to:Understand the concept of a sampling distribution.
Understand the concept of Central Limit Theorem .
Understand the concept of a confidence interval.
Know how confidence intervals are constructed in general.
Know the margin of error in a confidence interval.
Find a confidence interval for a mean
Find a confidence interval for a proportionFind the value of z associated with various confidence levels and use it to construct any level of confidence interval for a population mean.
Know the behavior of confidence intervals when the confidence level ,the standard deviation or the sample size are changed.
3
Statistical Inference: A decision, estimation, prediction, or generalization about a population, based on a sample.
Descriptive Statistics: summary descriptions of a collection of data
A population: is a collection of all possible individuals, objects, or measurements of interest.
The numerical values of characteristics of populations are parameters.
Definitions
A sample :is a portion, or part, of the population of interest.
The numerical values of characteristics of samples are statistics.Definitions
sampleentire population
Estimation of Population parameters
In medical Statistics , we usually deal with samples drawn from populations.
What is the purpose of taking a sample ?
The answer, is:
To get accurate information about the population from which the sample is taken.
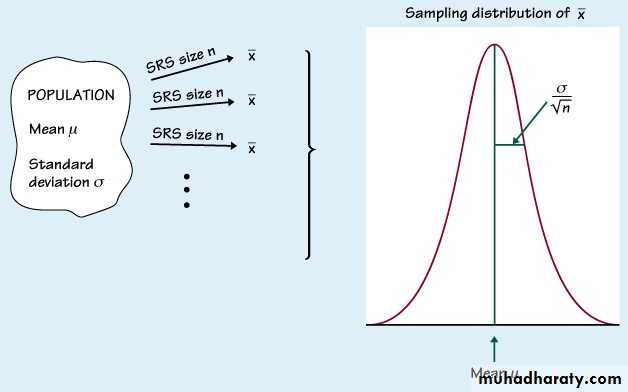
The Central Limit Theorem (CLT) says : If all possible random samples of size N were taken from a population that has a mean of m and a sd of s for a given variable, then the distribution of the means ( which is called the sampling distribution of the means ) has three properties:
It will be approximately normally distributed if:
The variable is normally distributed in the population OR
N is “fairly large” (N>30).
Sampling distribution of the means & the Central Limit Theorem
• The mean of the sampling distribution is equal to the mean of the variable in the population = μ
• The sd of the sampling distribution ( the standard error of the mean) , is equal to the sd of the variable in the population (s) divided by the square root of the sample size.
n
SE
s
=
IF s is UNKNOWN SE CAN BE ESTIMATED BY:
=
n
sd
SE
For normally distributed populations
When a variable in a population is normally distributed, the sampling distribution of for all possible samples of size n is also normally distributed.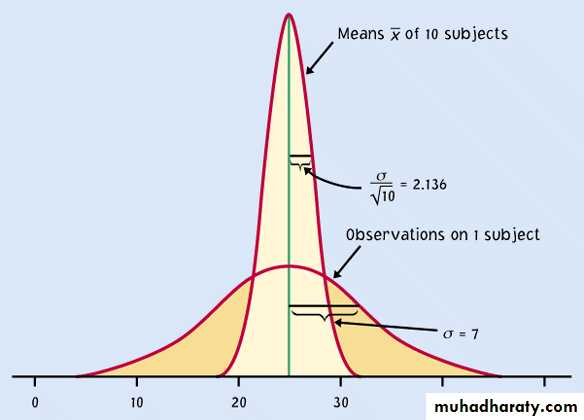
Population
Sampling distributionPopulation with strongly skewed distribution
Sampling distribution of for n = 2 observationsSampling distribution of for n = 10 observations
Sampling distribution of
for n = 25
observations
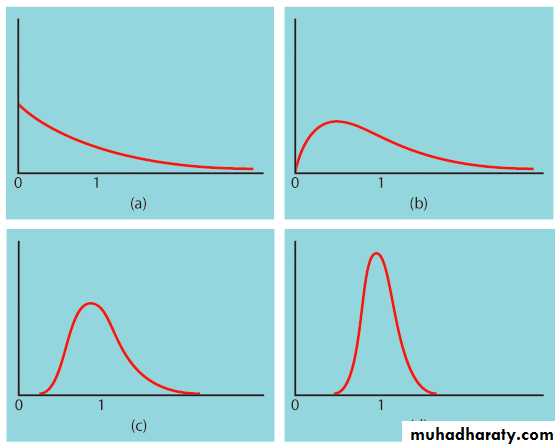
How large a sample size?
It depends on the population distribution. More observations are required if the population distribution is far from normal.
• A sample size of 40 will typically be good enough to overcome extreme skewness and outliers.
Sampling distribution of the means
The characteristics of the normal distribution could be applied to the distribution of the sample means:68% of the means of the samples drawn from a population fall within m ± 1 standard error of the mean
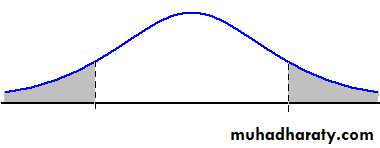
95% of the means of the samples drawn from a population fall within m ± 1.96 x standard error of the mean
99% of the means of the samples drawn from a population fall within m ± 2.58 x standard error of the mean
Alternatively,
The probability that contains population mean µ is 0.95The probability that contains population mean µ is 0.99
( SE)
1.96
X
±
(
)
SE
2.58
X
±
We can estimate the true mean of the population from sample data. The mean of the sample is the estimate of the population mean.
I. Estimation of population mean
Confidence Interval (CI)
A confidence interval is a range of values within which the population parameter is expected to occur.If we have a sample mean & we want to estimate the population mean. we need to construct confidence limits around the sample mean.
The Confidence Interval:
Confidence Limit
Z is the critical value in a normal probability distribution for computing the upper and lower estimates.95% confidence Interval
We are 95% confident that the true population value falls within this range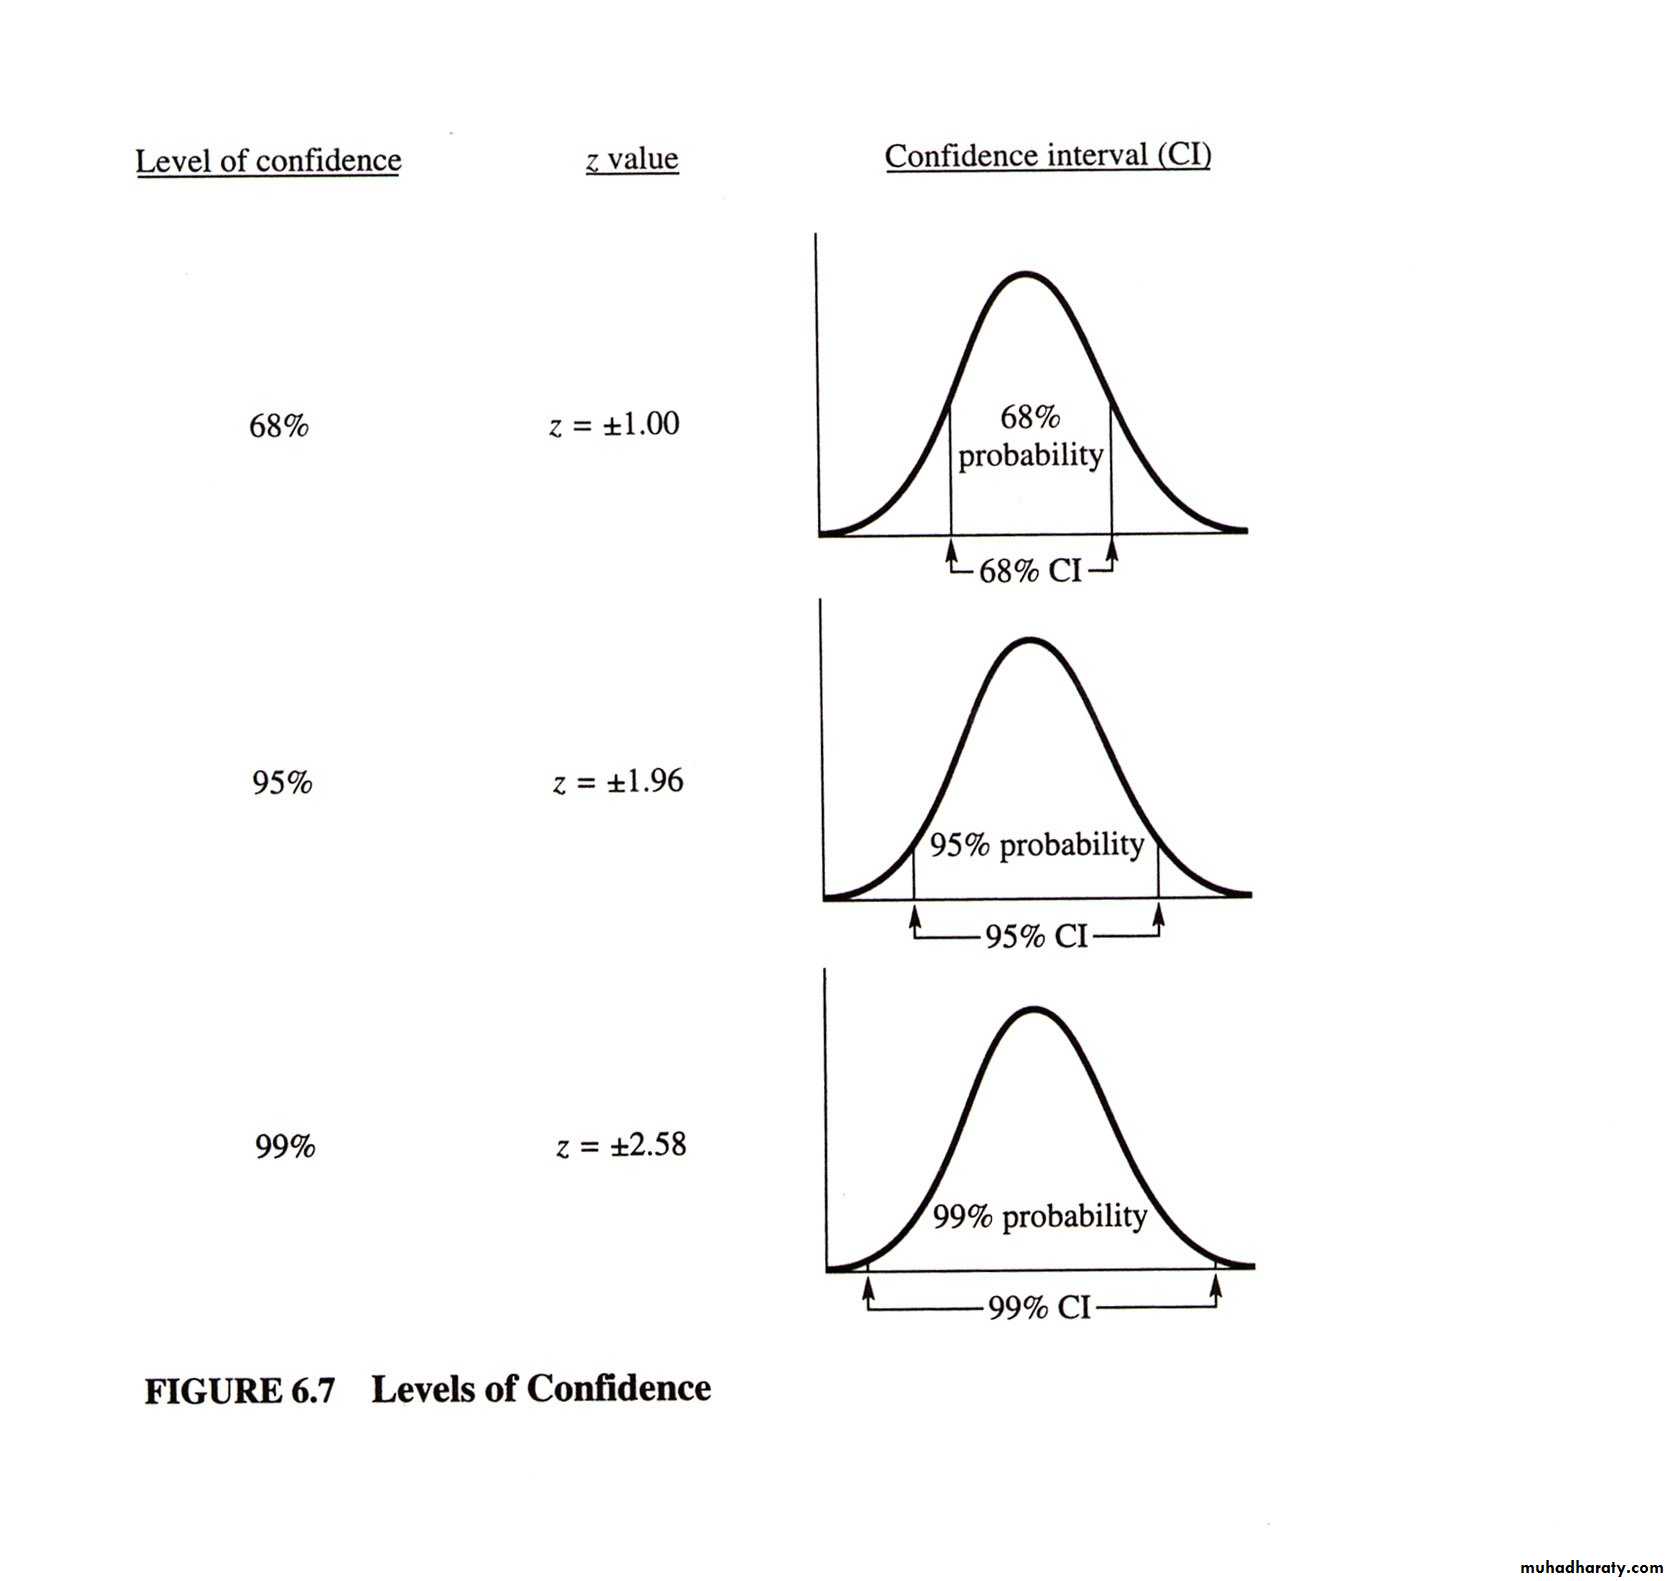
Other Levels of Confidence
0
0
Confidence interval for µ
AssumptionsPopulation standard deviation is known
Population is normally distributed
If population is not normal, use large sample ( >30)
Factors Affecting Interval Width
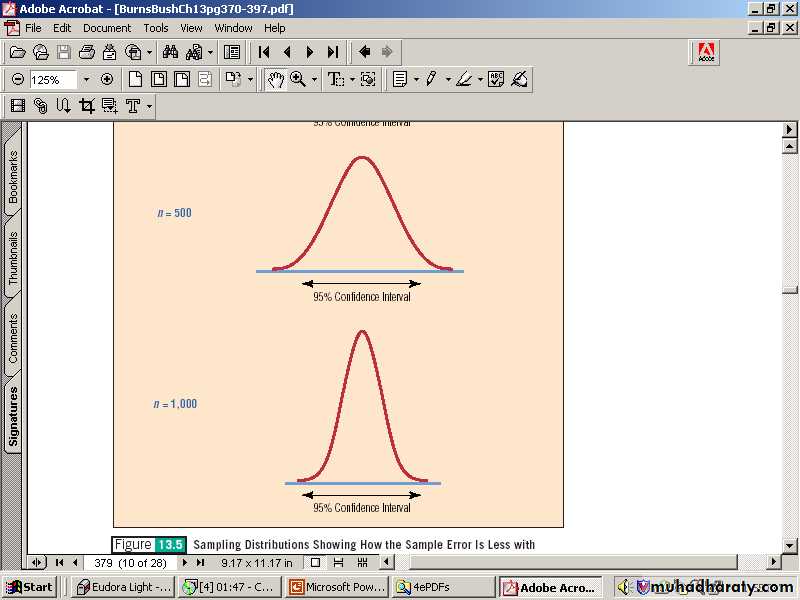
Factors that determine the width of a confidence interval are:1. Sample size, n.
2. Variability in the population, usually estimated by sd.
3. Desired level of confidence, usually 95% or 99%.
The sample size will affect the width of the confidence interval.
II. Estimation of population proportion(Confidence limits for proportions)
The concept of Confidence Interval can be extended to other parameters of interest like the proportion of a population having a particular attribute.
25
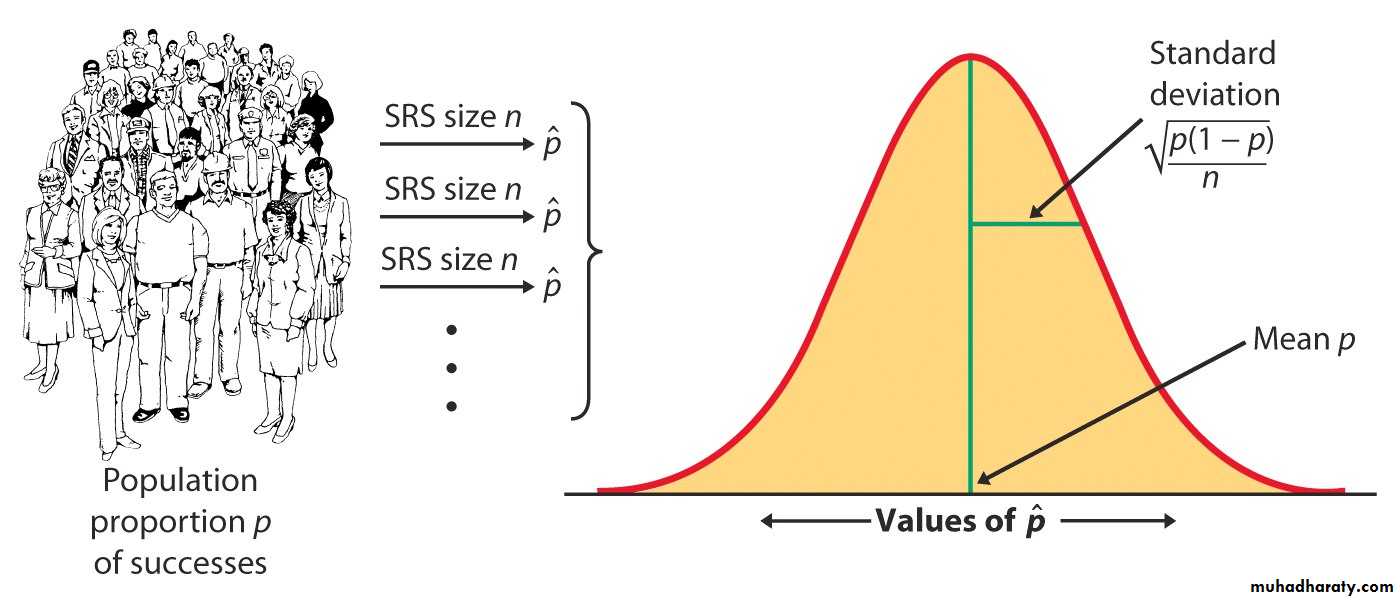
Sampling distribution of the sample proportion
The sampling distribution of is never exactly normal. But as the sample size increases, the sampling distribution of becomes approximately normal.The normal approximation is most accurate for any fixed n when p is close to 0.5, and least accurate when p is near 0 or near 1.
27
Using the Normal approximation to the binomial, we can make the following substitutions in the confidence interval :
μ becomes π
X becomes p
σ /n becomes √π(1-π)/ n ((standard deviation of π)
√π(1-π)/ n can be estimated by the sample values .
28
95% confidence Intervalfor proportion
p ± 1.96 √π(1− π)/n
29Example
A sample poll of 100 voters chosen at random from all voters in a given district indicated that 55% of them were in favour of a particular candidate. Finda) 95%, and
b) 99% confidence limits for the proportion of all voters in favour of the candidate.
30
Answers
a) 95% confidence interval for true proportion π is p ± 1.96 √p(1− p)/ni.e. 0.55 ± 1.96 √0.55 (0.45)/100 = (0.452-0.647)
b) Similarly 99% confidence interval is p ± 2.58 √p(1− p)/n =. (0.422,0.678)
31
THANK YOU