Electrocardiogram (ECG)
Mohammed Hashim AlmosawyThi-Qar Medical College
ECG:
Is a recording of electrical waves that produced by the electrical activity of the heart , it is one of the most valuable diagnostic tools in modern medicine .It is essential for diagnosis of cardiac problems if any changes in cardiac activity are developed
Basic components of the healthy heart beat
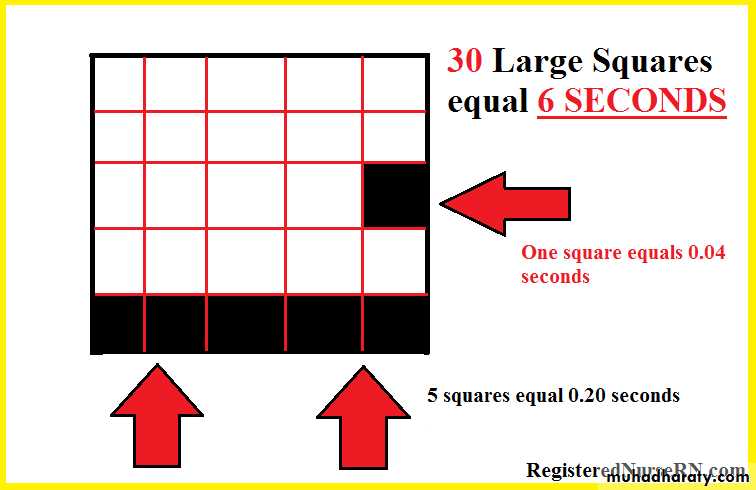
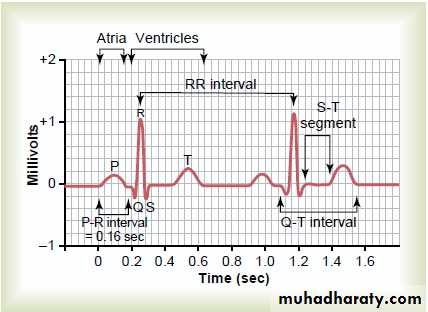
ECG paper
- One large box = 5 small boxes
- One small box = o.o4 sec
- One large box = 0.2 sec
* Each 5 large boxes = 1 second
Basic components of the healthy heart beat
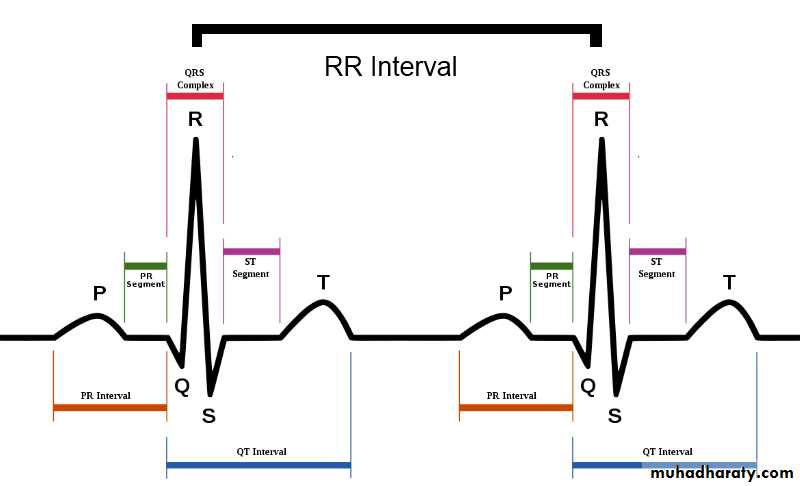
1- ECG wavesP : atrial depolarization (contraction)
QRS : ventricular depolarization (contraction)T : ventricular repolarization (relaxation)
U : purkinje fibers repolarization
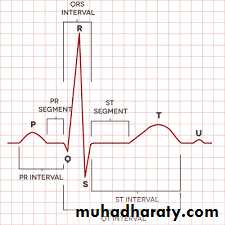
2- Segments
isoelectric lines because these is no electrical activity during this time* Two segments:
1- P-R segment : ( starts from the end
Of the P wave to the beginning of the Q wave )
2- S-T segment : ( starts from the end of
S wave to the beginning of T wave )
Normal duration of S-T segment = 0.08 – 0.12
= 2 – 3 small boxes
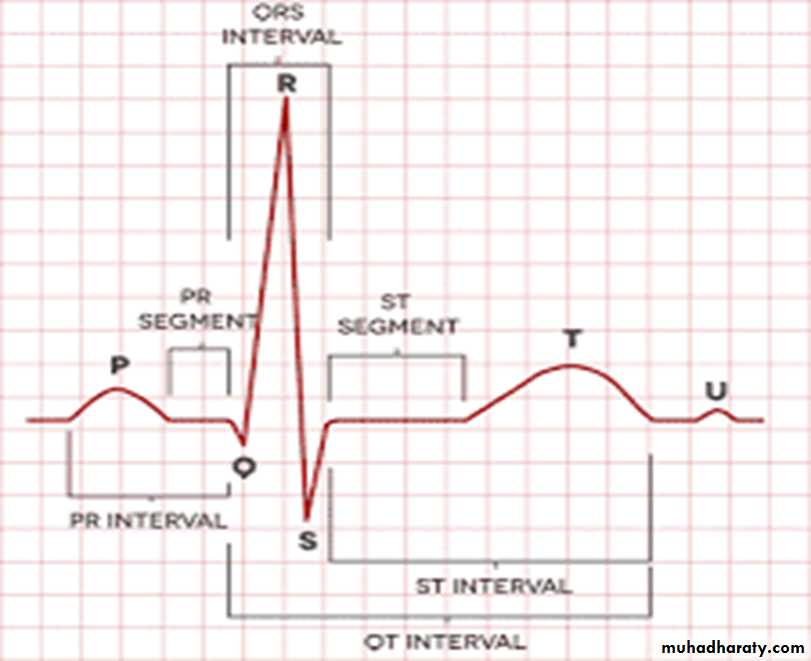
3- Intervals :
* 3 Intervals:1- P-R interval : ( from the beginning of P
wave to the beginning of Q wave )
Normally : 3-5 small boxes
2- Q-T interval : ( from the beginning
of Q wave to the end of T wave )Normally : 8 to 12 small boxes
3- R-R interval : ( from R wave to next
R wave )
How to read ecg to approach to the dx ?
The following are very important parts in ECG that help you to reach the diagnosis
1- Rate : normal HR is 60 – 100 beat /min
A – if the heart rhythm is regular so I calculate the large boxes between R wave and next R wave and dividing 300 on it .
Example: number of large boxes between adjacent R waves = 4 large boxes so
the heart rate =300/4 = 75 beat / min
B- if the rhythm irregular so I calculate the number of QRS complex in 30 large boxes then multiply by 10 .
Example: number of QRS complex in 30 large boxes = 8 QRS complexes so
the heart rate = 8 * 10 = 80 beat /min
Normal heart rate
Bradycardia :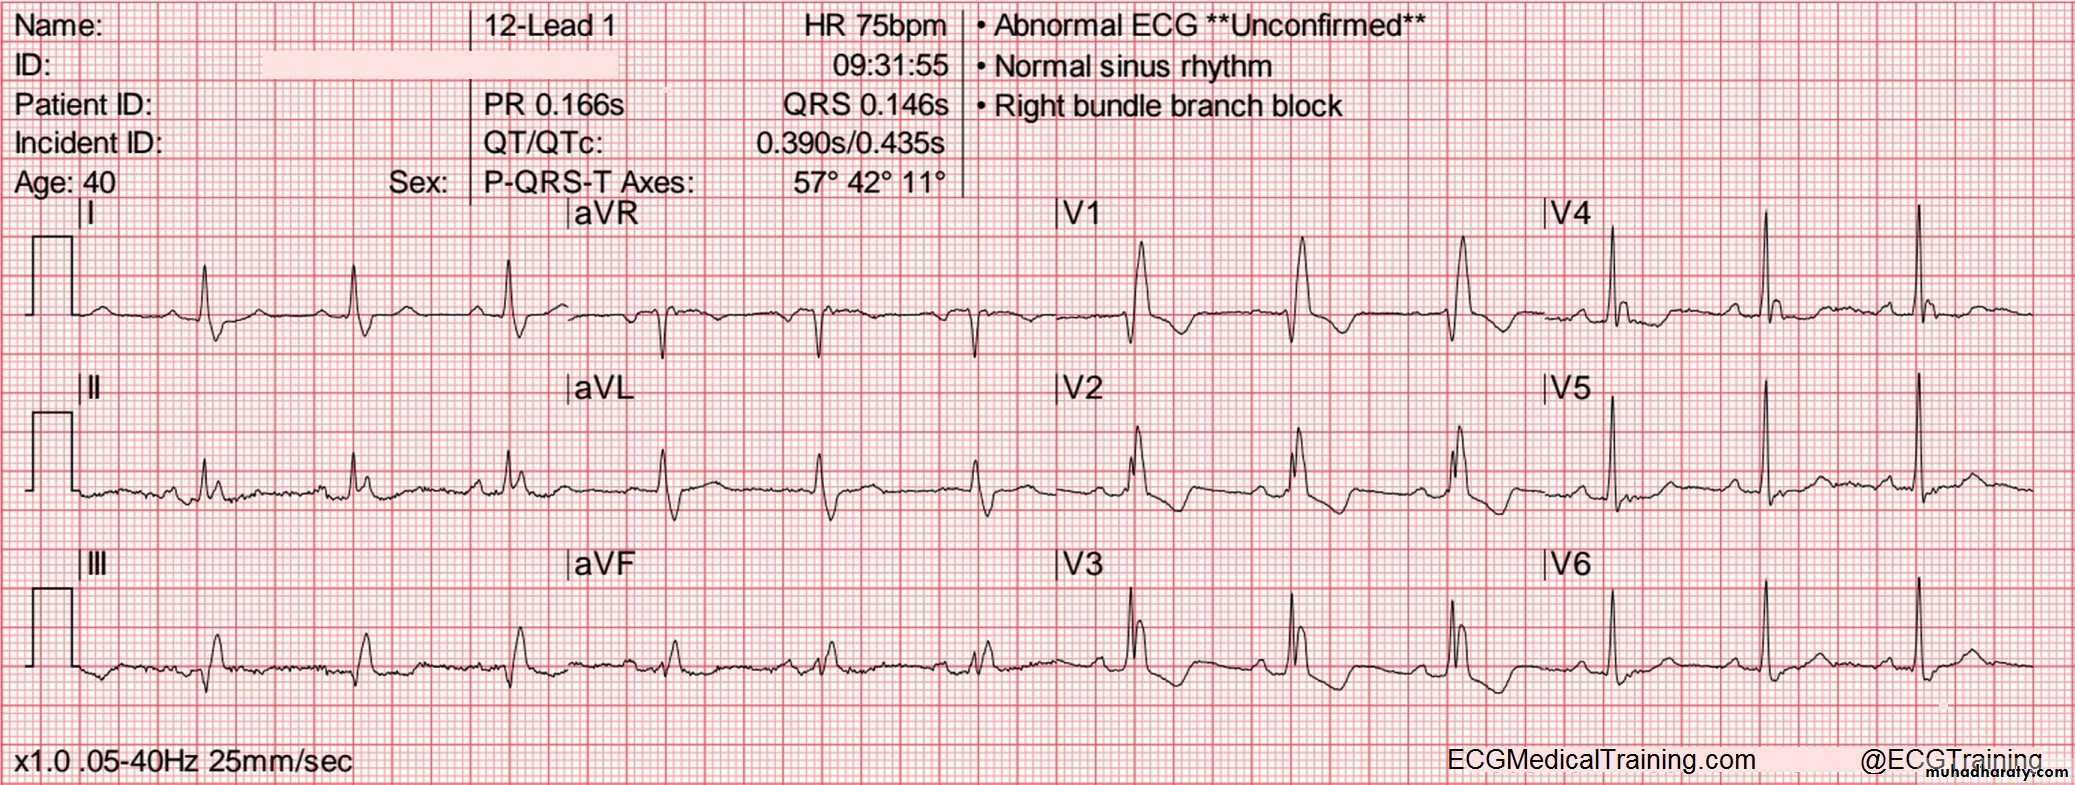
Regular rhythm tachycardia
2 – Rhythm :
regular or irregular and if the P wave present or not .If the P wave present so it is sinus rhythm , if not present it is not sinus rhythm
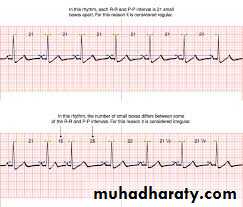
* To know the rhythm you carefully compare each R-R intervals, if all the R-R intervals
are equal so it is regular rhythm , if not equal so it is irregular rhythm .
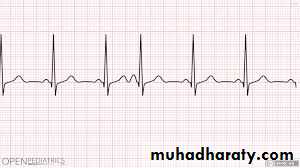
Example: regular sinus rhythm
Irregular sinus rhythm
(Narrow R-R interval) (wide R-R interval)If the P wave can not determined so it is not sinus
3- Morphology of P wave and QRS complex and their relationship
- normal shape of P wave or not ( normally the P wave identical in shape and up right )Normal shape of QRS complex , width ( normal or broad )
If the P wave followed by QRS or not
(This P wave not followed by QRS)
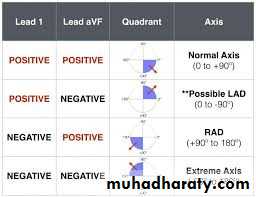
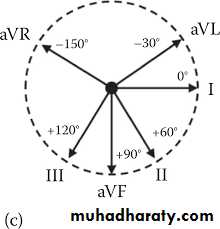
4- Axis
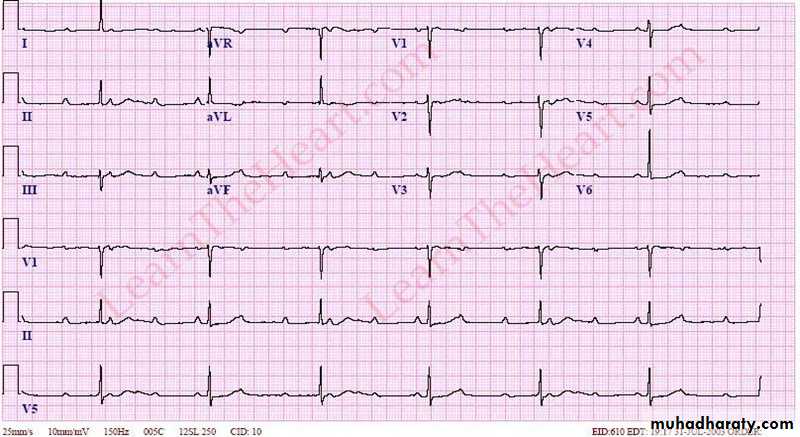
To know the axis is normal or not look to lead 1 and lead aVF1- Normal axis : positive QRS in lead 1 and aVF
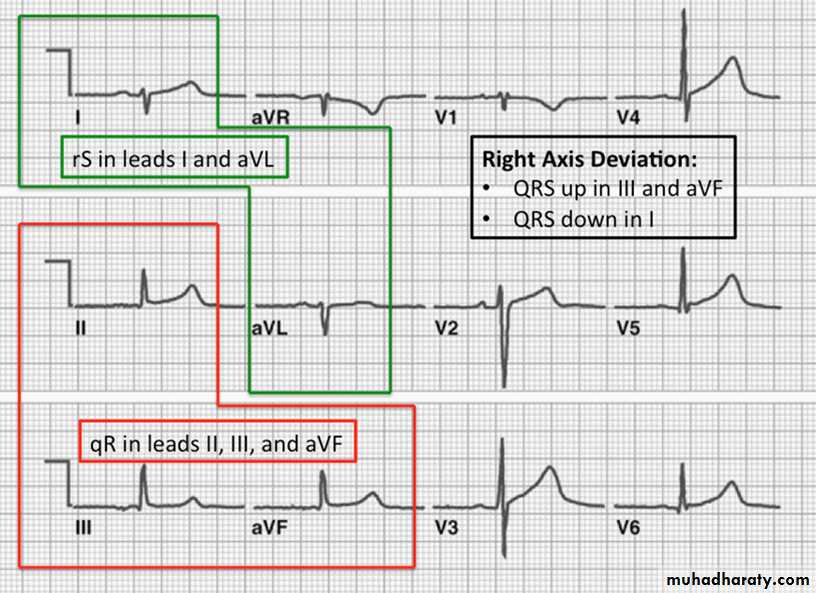
2- Right axis deviation : negative QRS in lead 1 and positive in lead aVF3- Left axis deviation : positive QRS in lead 1and negative in lead aVF
* Normal axis
* Right axis deviation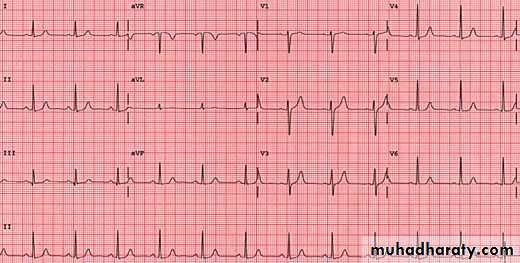
Left axis deviation
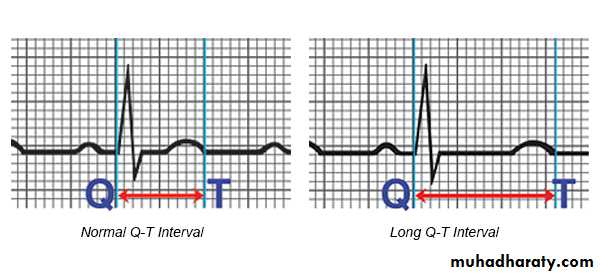
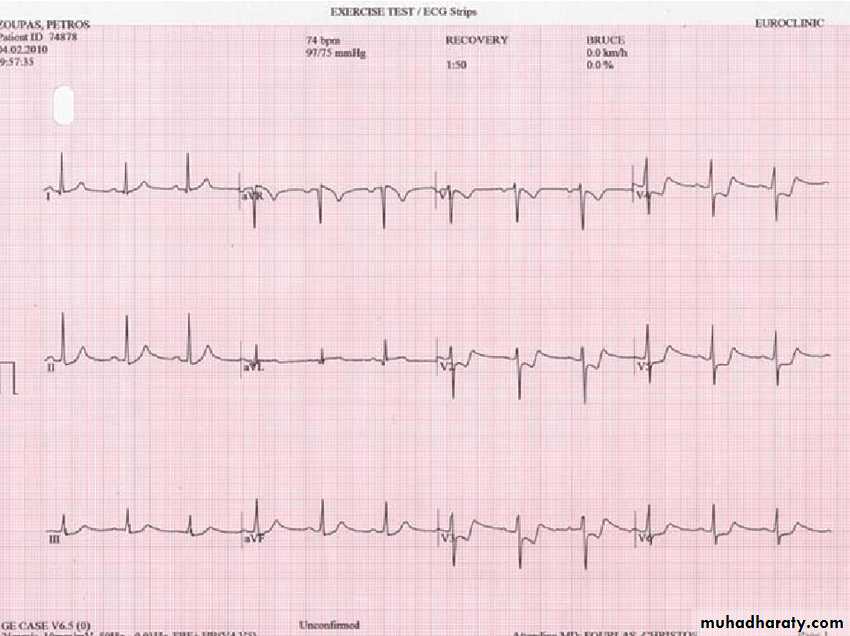
5- intervals
1- P-R interval ( normally 3-5 small boxes )2- Q-T interval ( normally 8 – 12 small boxes )
this ECG of WPWS
Short P-R interval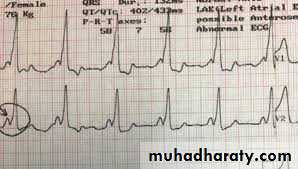
Long Q-T interval
6- Segments
1- P-R segmentP-R depression: this is a characteristic of pericarditis
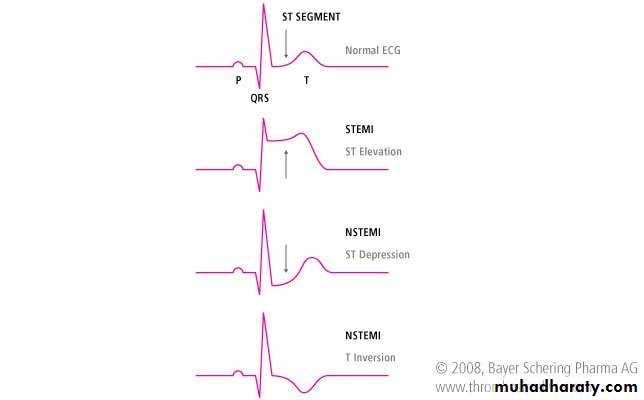
2- S-T segment :
A- S-T elevation : we consider the S-T elevated if ;-elevation more than one small box in all the leads
- elevation more than two small boxes in two contiguous leads
like ( V1 and V2 or V3 and V4)
S-T elevation in V2 and V3 ( anteroseptal M I )
B- S-T depression ; we consider the S-T depressed if ;
- depression more than 0.5 small box- the depression should be in at least two contiguous leads
7- T wave :
shape and amplitudeA- T wave inversions : can be caused by acute coronary ischemia( acute MI) , hypertrophic cardiomyopathy
B- Tall tented T wave : hyperkalaemia
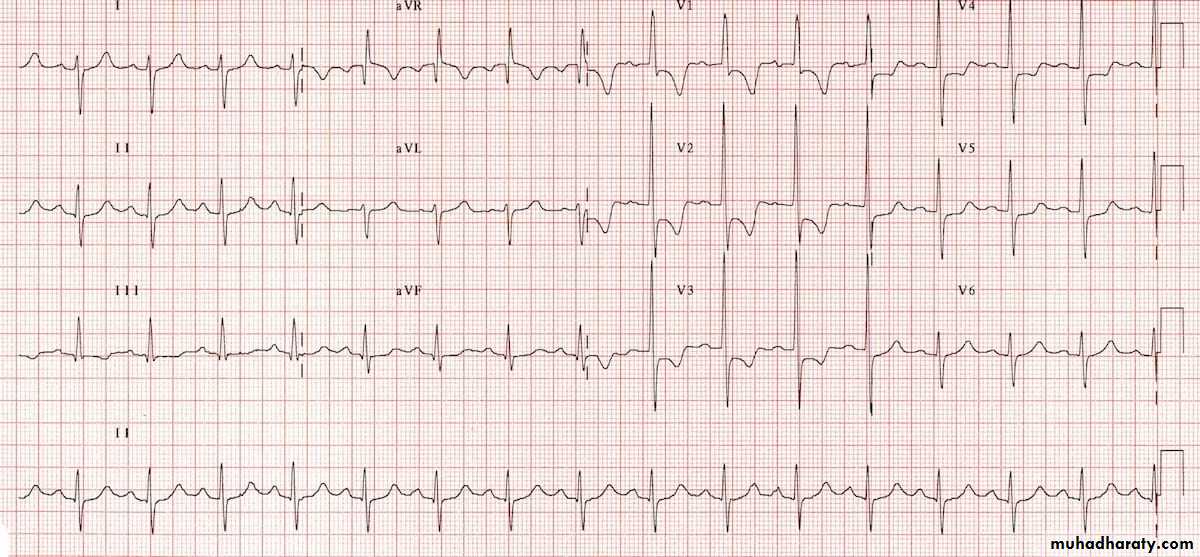
12 leads of ECG
1 – 3 limb leads :( I , II , III )
2- 3 augmented leads :
( a V R , a V L , a V F )
3 – 6 precordial leads :
( V1 , V2 ,V3 ,V4 ,V5 , V6 )
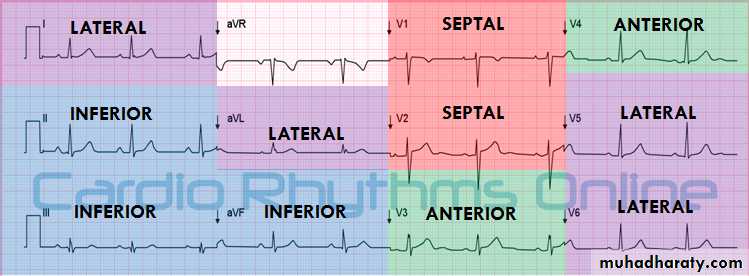
* Each lead represent a specific area in the heart
leads presentation on ECG
- Leads represent the lateral side of the heart : I , a V L , V5 ,V6- Leads represent the inferior side : II , III , a V F
- Leads represent the septum of the heart : V1 , V2
- Leads represent the anterior of the heart : V3 , V4
Cardiac Arrhythmias
* Remember that for interpretation of ECG we should know the following :1- rate
2- rhythm
3 -Morphology of P wave and QRS complex and their relationship
4- T wave
5- intervals
6- segments
7- axis
NOTE : BROAD QRS complex when the width of QRS more than 3 small boxes .
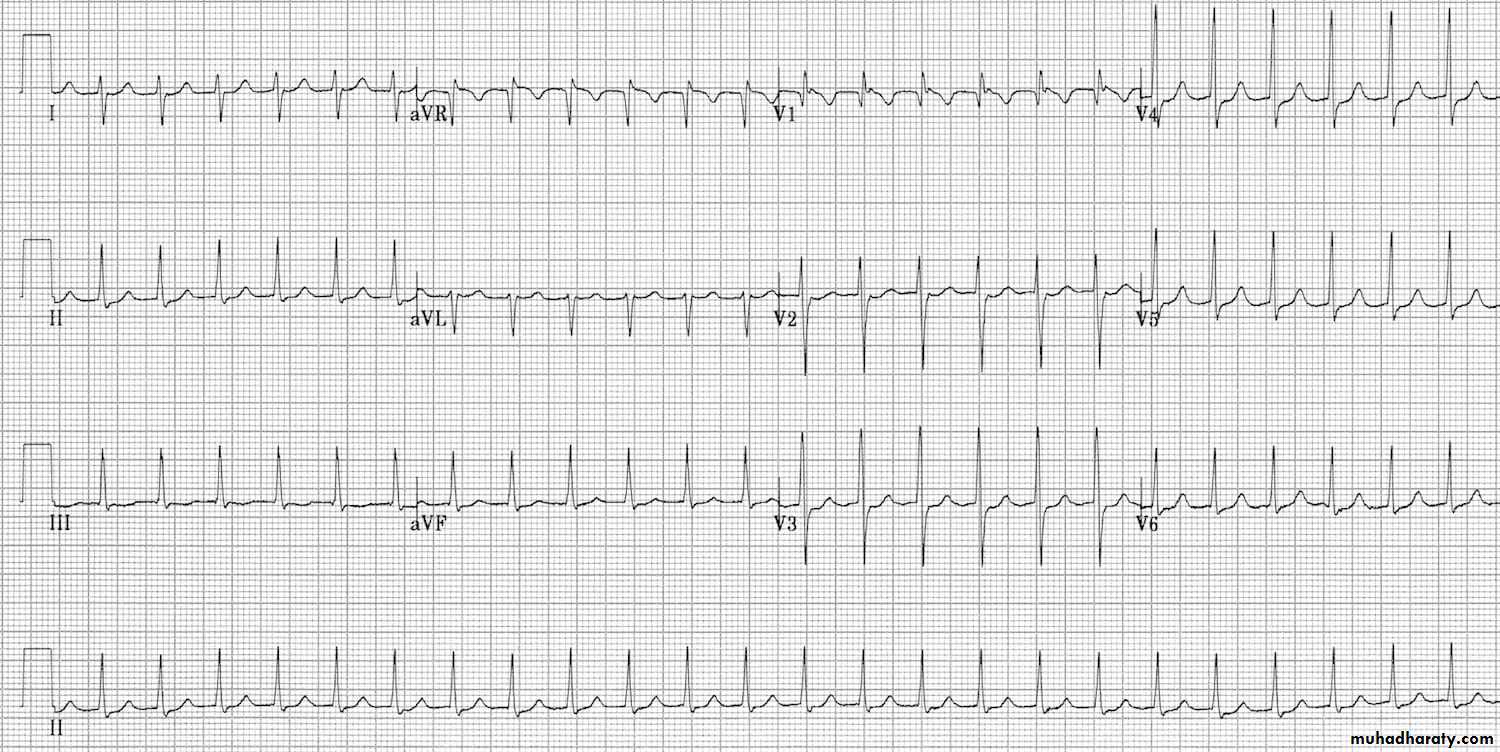
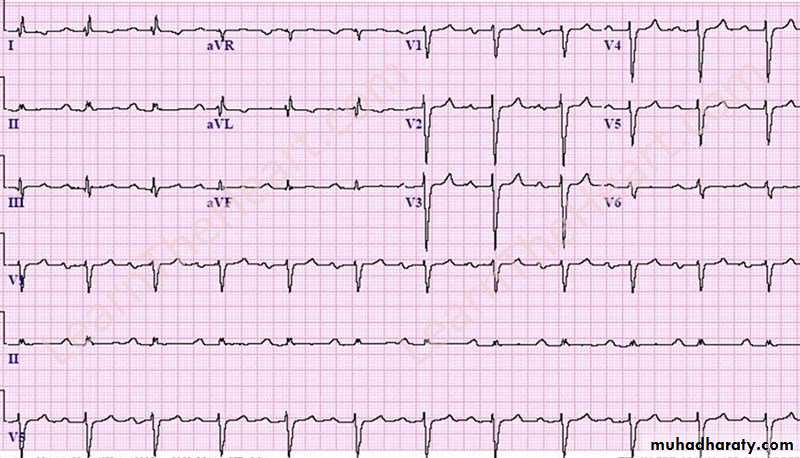
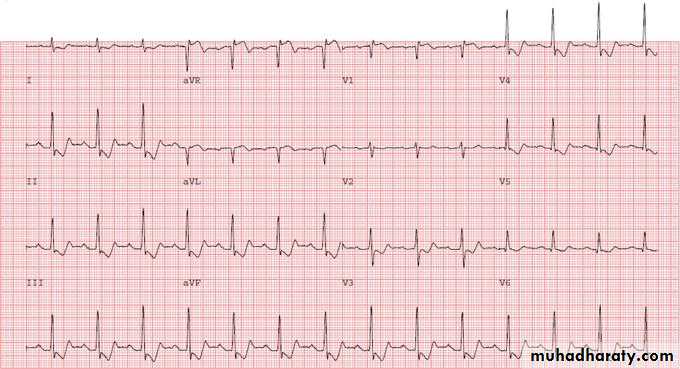
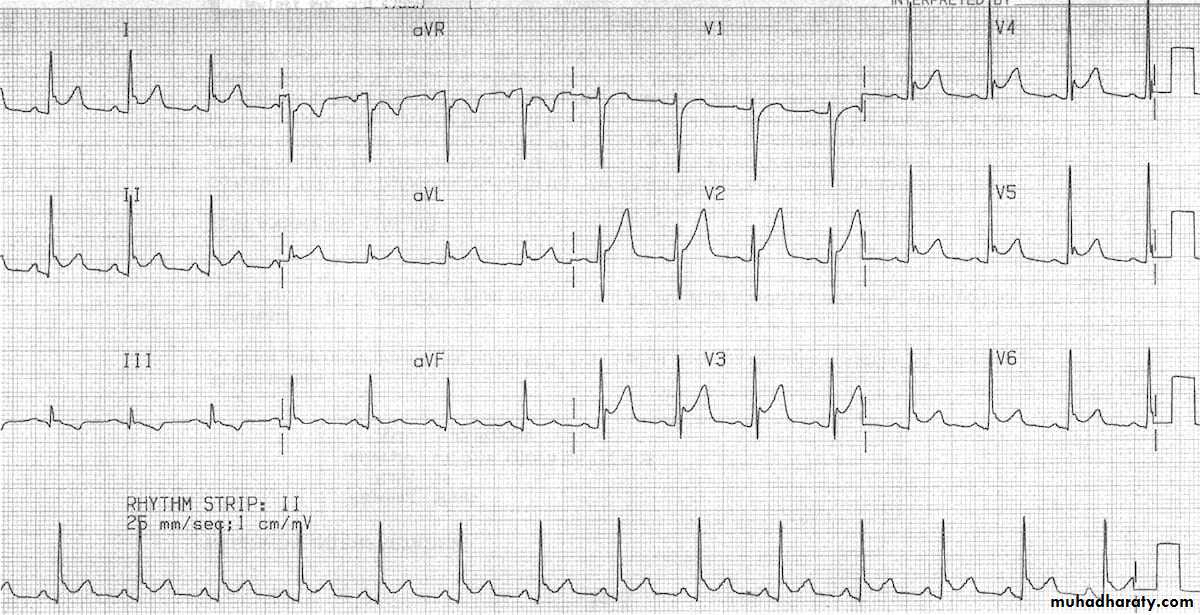
1- Sinus tachycardia :
- Sinus rhythm where the heart rate is faster than the normal range-ecg paper shows ( Narrow complex tachycardia , Regular rhythm , p wave normal , ….)
* Causes : ( anxiety , pain , fever , dehydration , hypovolemia , anaemia , infection , drugs such as dopamine ,…….)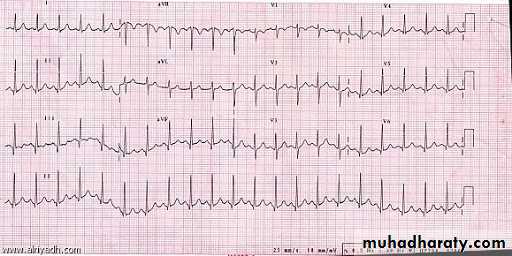
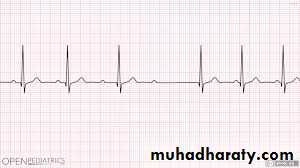
2- Sinus bradycardia
Is a sinus rhythm where the heart rate is slower than the normal range .- ECG paper shows ( narrow complex bradycardia , regular rhythm , P wave normal , …)
* Causes: ( hypothermia , hypoxia , hyperkalaemia , athletes , drugs such as digitalis and beta blocker , …..)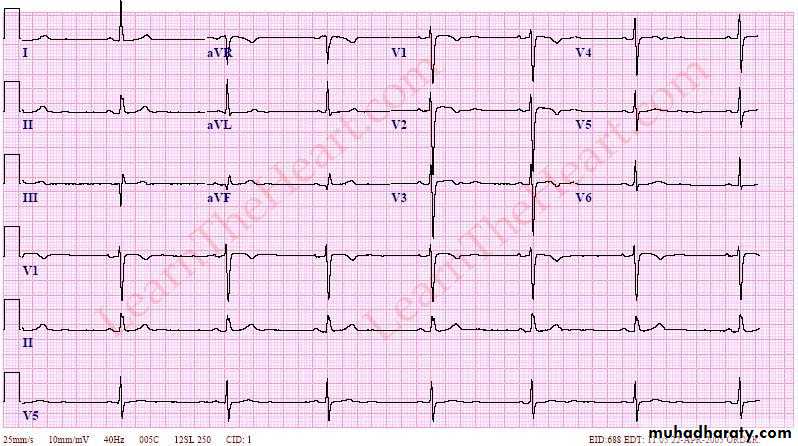
3- Premature atrial contraction ( atrial ectopic beat )
the electrical activity originate in the atrium other than the sinoatrial node , resulting in atrial arrhythmias that characterized by unusual P wave shape.
ECG finding :
- P wave come prematurelyBefore the next expected beat
- Unusual P wave shape
Normal QRS
Irregular rhythm
* Causes : ( electrolyte imbalance , cardiac stimulant such as tobacco , caffeine and alcohol , IHD , COPD )
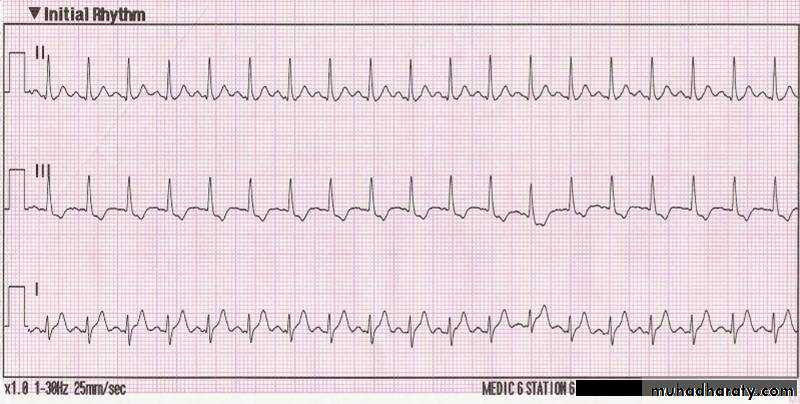
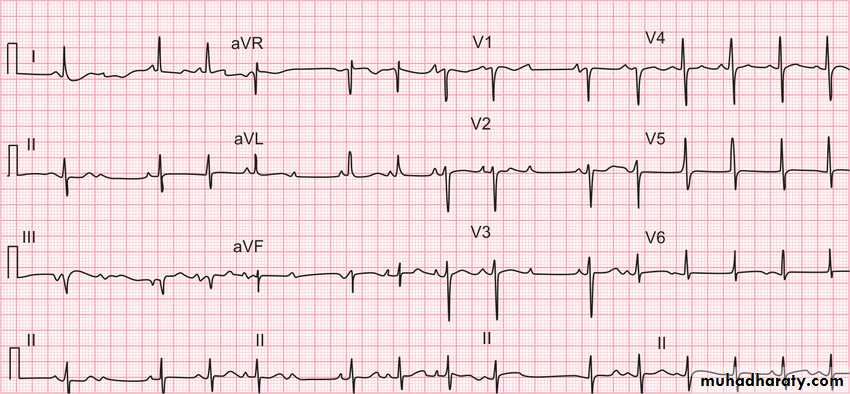
4 – Supraventricular Tachycardia
There is an extra pathway that the electrical impulse follows , which causes a fast heart rate .* causes : ( any cardiac surgery that could cause inflammation in the atria or ventricles , sinus arrhythmia , atrial flutter )
ECG findings :
Narrow complex tachycardia
regular rhythm
No P wave
Some S-T segment depression
Dx : Supra- ventricular tachycardia
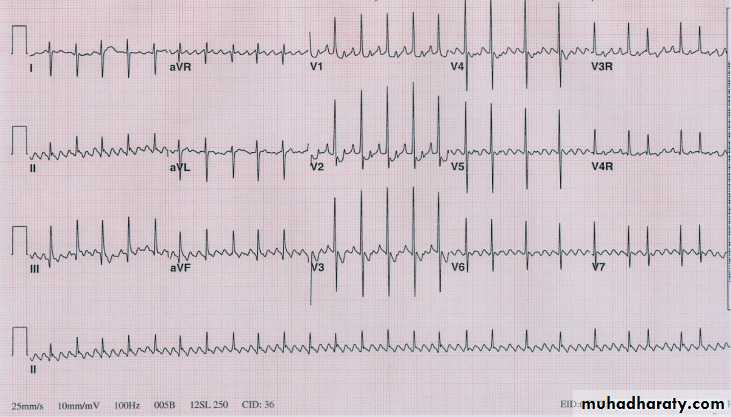
* Other Ecg example :
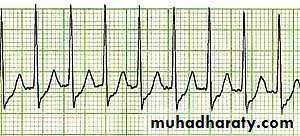
5 – atrial fibrillation ( AF )
Prevalence of AF increase with age : 5% of individuals above 70 years , 10 % of individuals above 80 years15-25 % of all ischemic strokes are associated with AF
* Causes of AF :
- valvular heart diseases
- ischemic heart disease
- thyrotoxicosis
- pulmonary disease
both A and B ECG paper are example on AF
A –
B -
both above ECG findings show :
1- narrow QRS complex ( normal width ) tachycardia2 – irregular - irregular rhythm
3- no P wave
Dx : Atrial fibrillation with rapid ventricular response ( tachycardia )
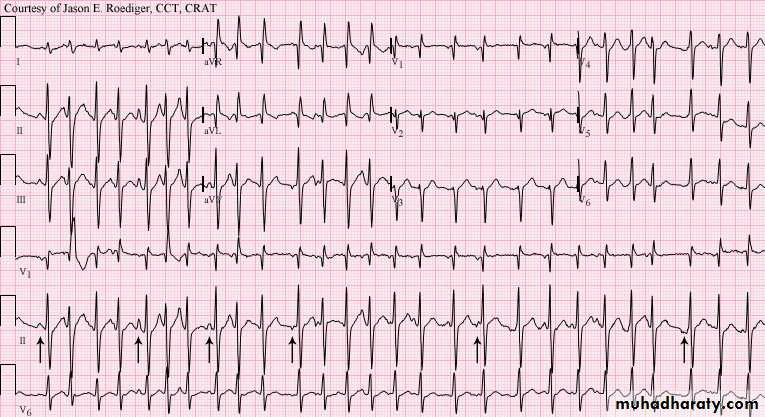
Note: not always the AF associated with rapid ventricular response but sometimes associated with normal ventricular response ( normal rate ) or with slow ventricular response ( bradycardia )6- atrial flutter
Less common than AFCharacterized by zigzagging baseline ( saw tooth waves ) best seen in in leads II , III , a V F
* CAUSES ;
- Associated with significant cardiac disease such as mitral valve disease
- complicate 5 % of acute M I
- Flutter usually arise in the Rh atrium and often associated with diseases of right side of the heart : e.g. chronic obstructive pulmonary disease ( COPD) , pulmonary embolism and chronic congestive heart failure
Finding :
Narrow QRS complex tachycardiaRegular rhythm
Flutter zigzagging waves ( saw tooth pattern )
DX: atrial flutter
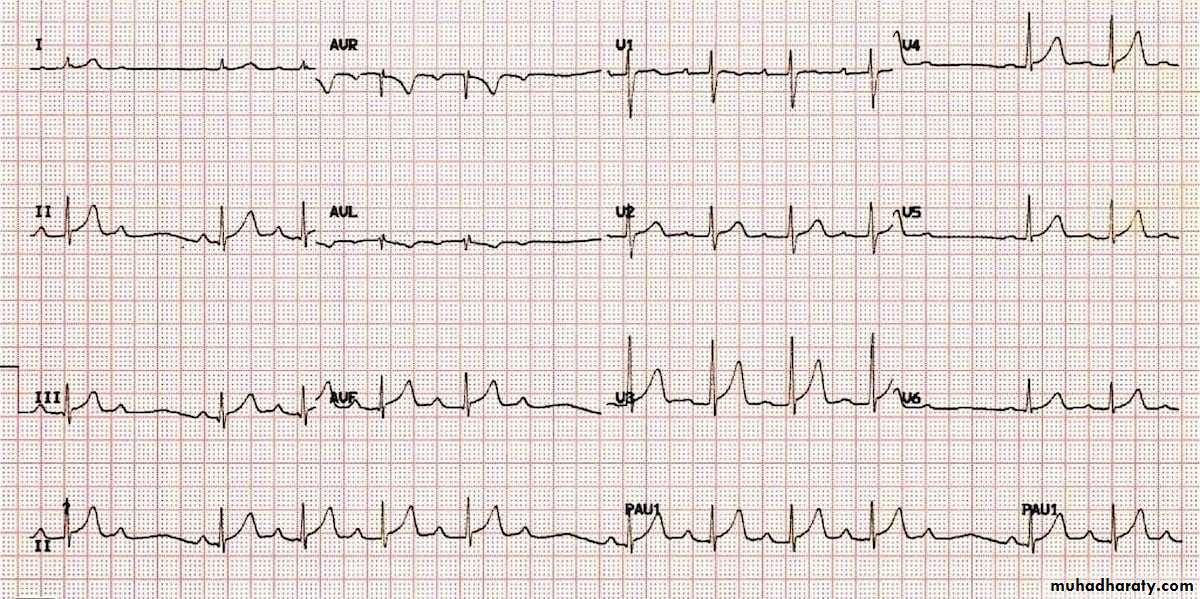
7- multi-focal atrial tachycardia
Causes: ( lung disorders , IHD , low blood pressure , hypomagnesaemia )* ECG
Findings:
1- narrow complex tachycardia2- irregularity
3- different morphologies of P wave at least 3 P waves morphologies in the
same lead ( important point)
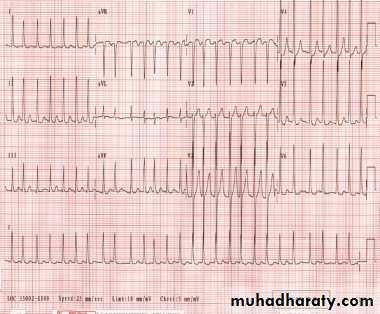
8- Ventricular Tachycardia
Two types :
1-sustained lasts for more than 30 seconds2-non-sustained lasts for less than 30 seconds .
VT is a serious cardiac arrhythmia , in some patients cardiac output will be lost .
Causes : ( IHD , MI , cardiomyopathy , electrolyte imbalance )
VT differ from supraventricular tachycardia arrhythmias ( SVT , A Flutter , A Fibrillation )
because the origin of beat from the ventricles so result in broad QRS complex
Look to this ECG
The above ECG show :
1- broad complex tachycardia2- regular
3- QRS complexes have the same morphology
Dx : VT
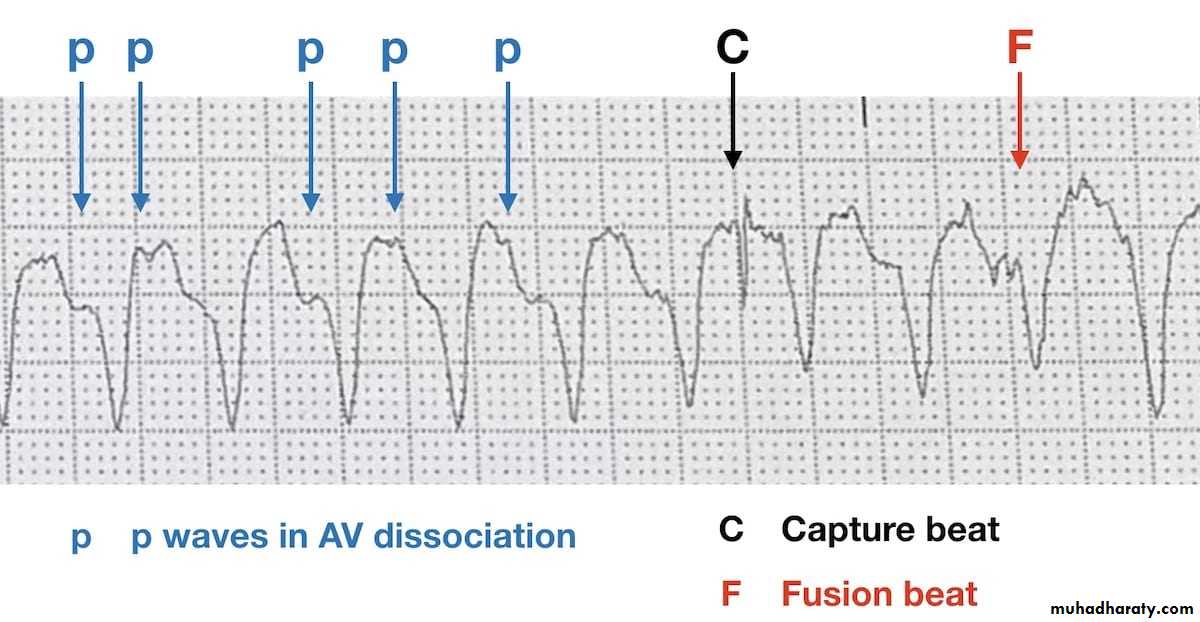
Note : other findings that can be seen in VT ecg are :
a- P wave may be present or not
b- fusion beats and capture beats
Read in details about capture
and fusion beats(mechanism) in anybook of ECG
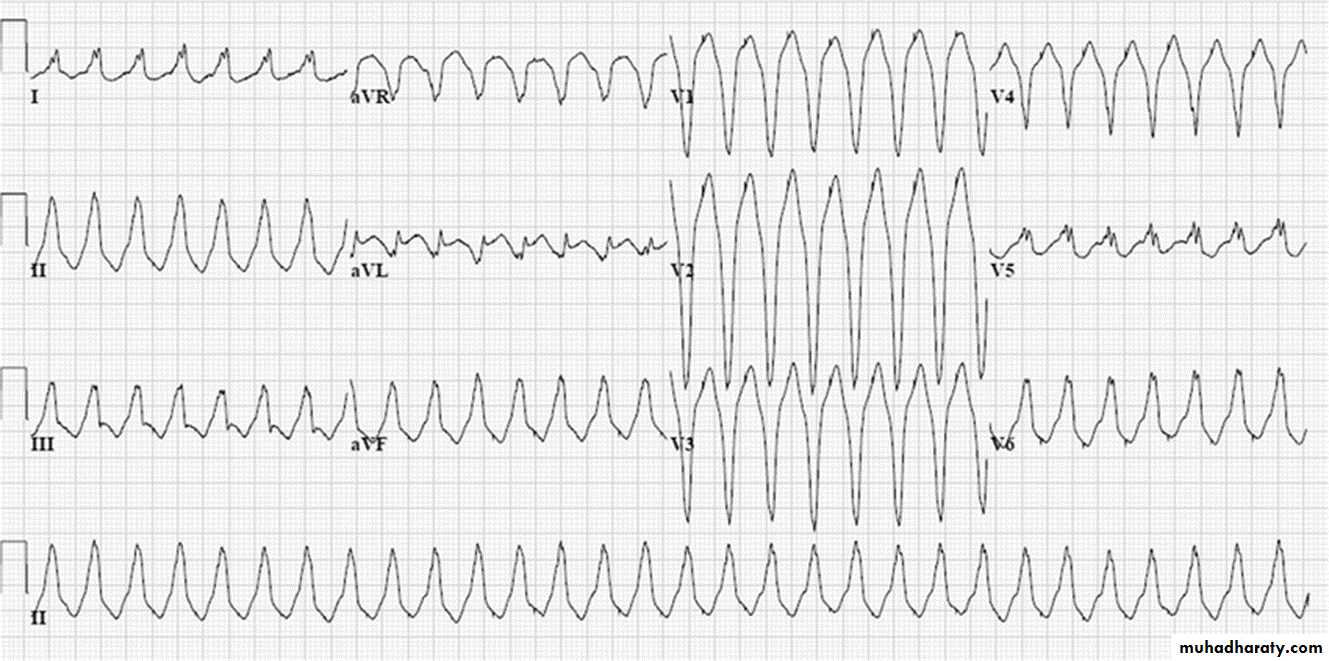
9- Torsade de pointes
Polymorphic ventricular tachycardia with irregularity .Causes: ( anti-arrhythmic drugs , electrolyte imbalance e.g. hypokalaemia and
hypomagnesaemia )
* spiky QRS complexes rotating irregularly
around the isoelectric line at rate about200 beat / min
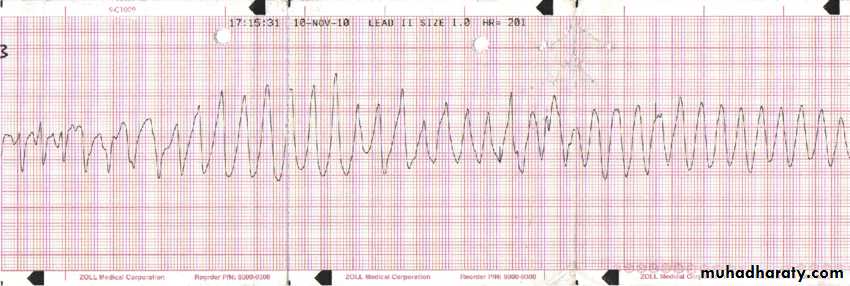
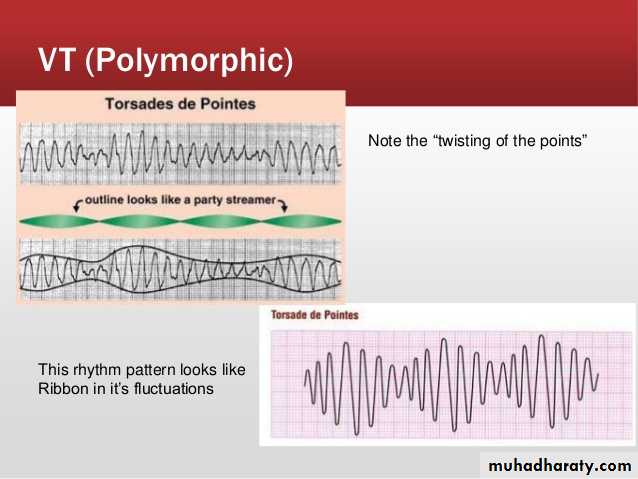
Ecg
*Findings:
1-broad complex tachycardia2- irregular rhythm
3-prolongation of Q-T interval
4 – twisting of points

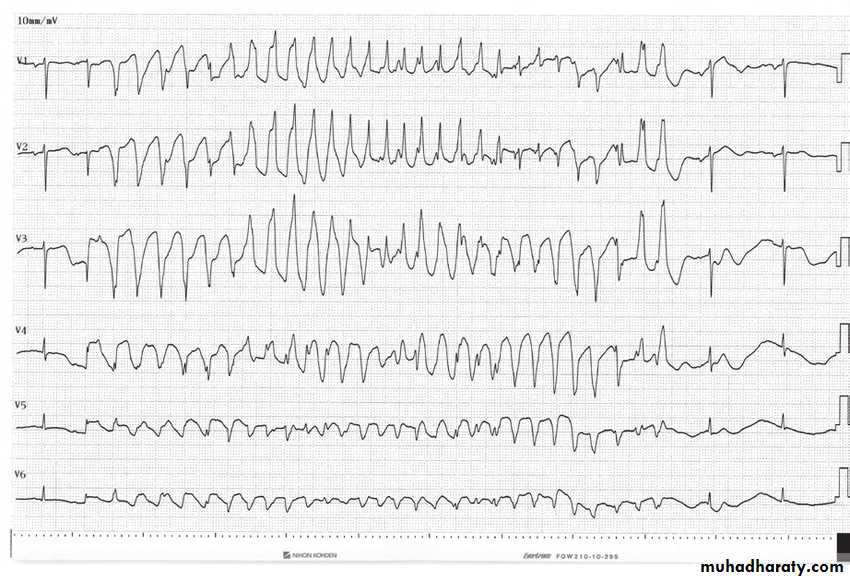
10- Ventricular fibrillation
very bizarre irregular ECG , random in both amplitude and frequencyCauses: ( IHD , Heart failure , electrolyte imbalance , cardiomyopathy )
-ECG :
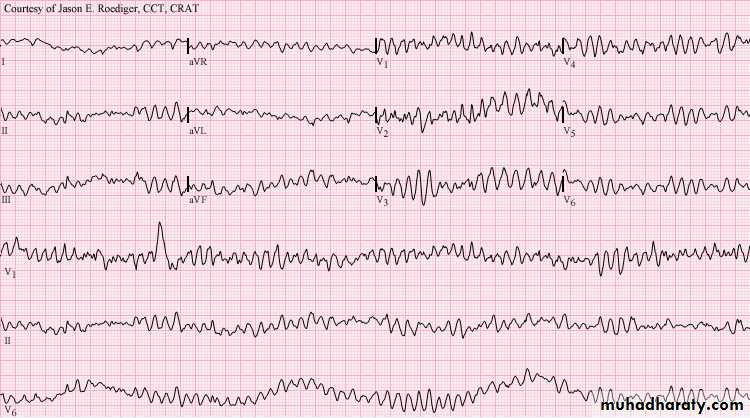
Finding :
1- bizarre shape2- broad complex tachycardia with different size
3- irregular with no identifiable P wave
Dx: Ventricular fibrillation
Av block1 – first degree AV block
there is a delay in the conduction of atrial impulses to the ventricles .It is usually benign
If associated with acute MI , close monitoring of the ECG is required because may progress tohigher degree of AV block
Causes : ( inferior MI , IHD , electrolyte imbalance , drugs such as beta- blocker)
ECG:
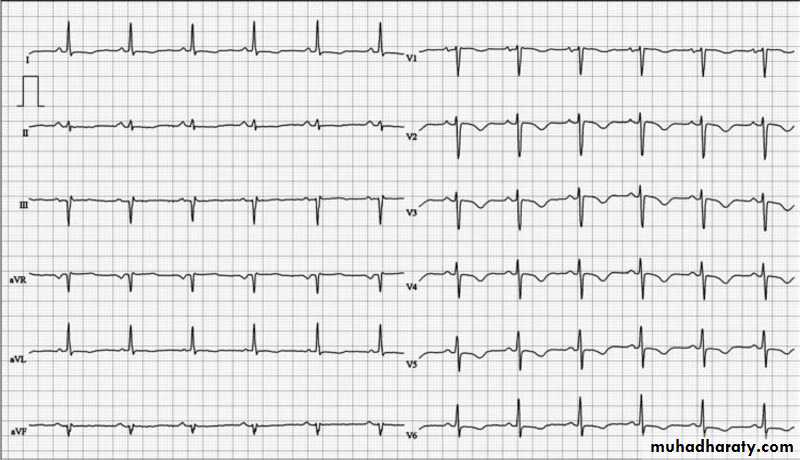
Findings:1- normal rate
2- sinus regular rhythm ( normal P wave , normal R-R interval)
3-prolongation of P-R interval more than 5 small boxes ( constant P-R prolongation)
Dx: first degree AV block
2- Second degree AV block ( mobitz I OR Wenckebach)
Causes : ( inferior MI , electrolyte imbalance , drugs such as beta blocker , digoxin , verapamil )* ECG
Findings:
1- normal rate2- irregular
3- progressive prolongation of P-R interval with dropped QRS ( dropped beat )
Dx : second degree AV block
Progressive
Prolongation of P-RDropped beat
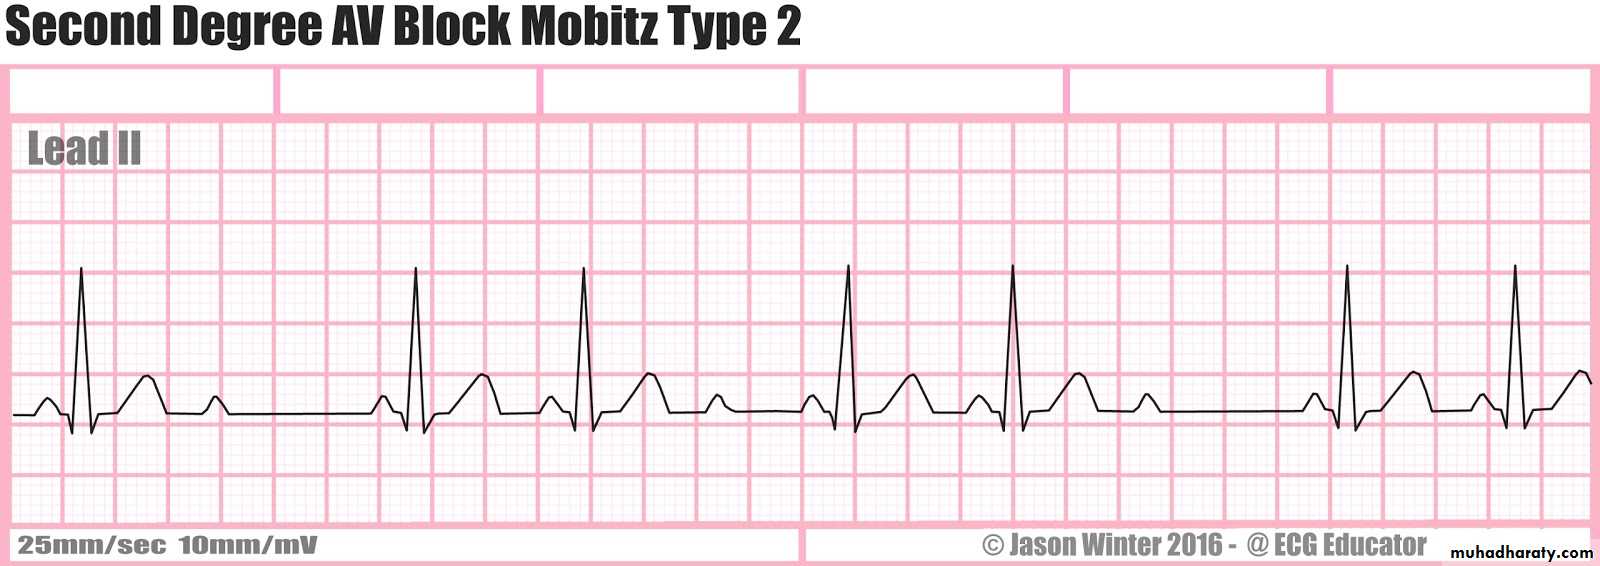
3- Second degree AV block ( Mobitz II )
- It is less common than second degree type I , it is more serious than type I , it can suddenly progress to third degree ( complete block ) .Causes: ( acute MI , drugs such as digoxin , beta blocker , verapamil )
ECG:
Findings:
1-normal rate2- irregular rhythm w
3- dropped QRS complexes
4- prolongation of P-R interval but constant
Note : the only difference between type I and type II prolonged P-R intervals in type I are progressive while in type II are constant .
Dx : second degree AV block type II
4- Third degree AV block ( complete )
Total failure of conduction between the atria and the ventricles .
Characterized by AV dissociation so the P wave totally not related to the QRS complexes
Causes : ( septal acute MI with extensive necrosis of the septum , fibrosis of bundle of his ,
endocarditis , drugs )
* ECG :
Findings :
1- bradycardia2- more P waves than QRS complexes
3- complete dissociation between P wave and QRS complex
Dx: third degree heart block ( complete )
5 – Right bundle branch block ( RBBB)Conduction down the right bundle branch is blocked
Causes : ( ischemic heart disease including right bundle branch , pulmonary embolism , cardiomyopathy , rheumatic heart disease )
* Diagnosis made by examining the chest leads V1 and V6 .
* ECG findings in RBBB :
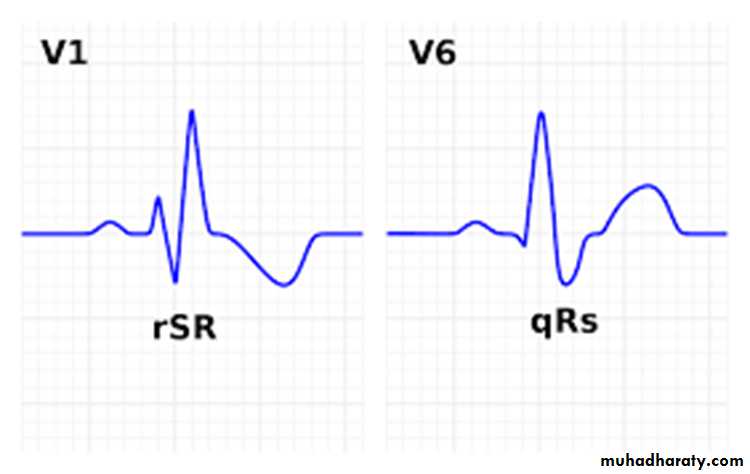
- normally in ECG after P wave there is negative ( Q wave – positive R wave – negative S wave ) , in RBBB in V1 after the P wave there is ( positive r wave – negative S wave – positive R wave )
So this give r S R pattern in V1 ( M- shape QRS complex in V1 )
Broad complex ( more than 3 small boxes )
In lateral leads ( I , a V L , V5 ,V6 ) there is ( negative Q , positive R wave , negative wide slurred S wave ) so this give shape of ( W shape in these leads )
M and W shapes in ECG
ECG:
Findings:1- r S R pattern in V1 , V2 , V3 with broad complex
2- wide , slurred S wave in leads V6, V5, I , a V L
Dx : right bundle branch block
6 – left bundle branch block
Conduction down the left bundle branch is blockCauses : ( ischemic heart disease including left bundle branch , cardiomyopathy , hypertensive disease )
Diagnosis made by examining the chest leads V1 and V6 .
ECG findings in LBBB:
-broad complex
r S pattern in V1 with dominant S wave pattern or Q S pattern give the W shape complex
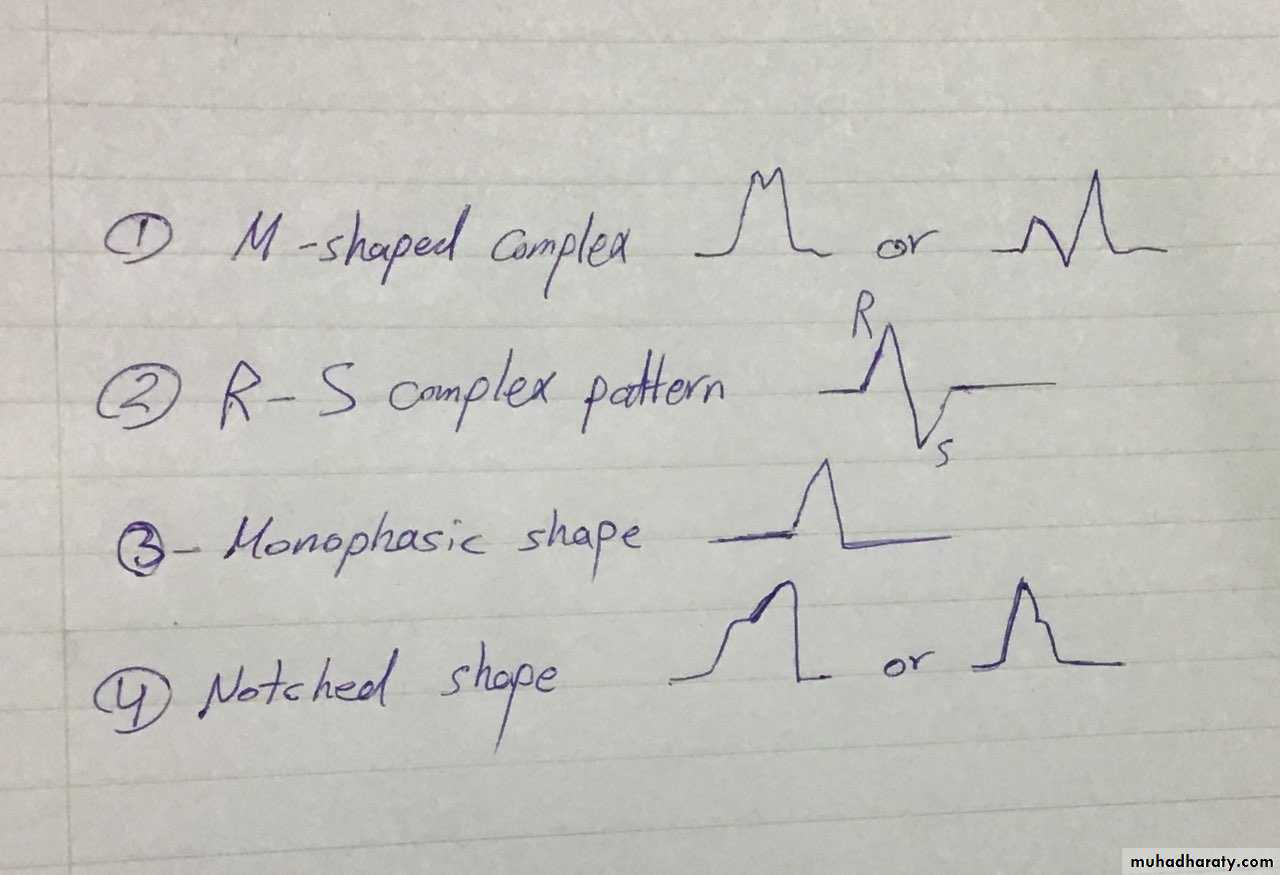
Complex in lateral leads ( I , a V L , V5 ,V6 ) gives either M shape ,R S pattern , monophasic shape , notched shape )
Complex patterns in lateral leads :
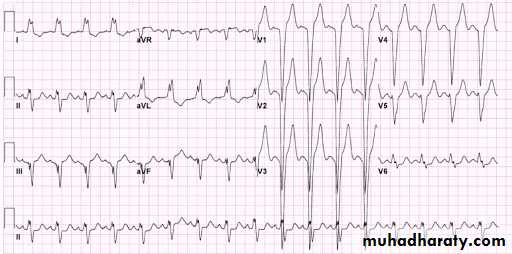
ECG:
Findings :1- broad complex
2- q S pattern in V1 ,V2 ,V3 with dominant S wave
3- M shaped pattern in ( I , a V L , V6)
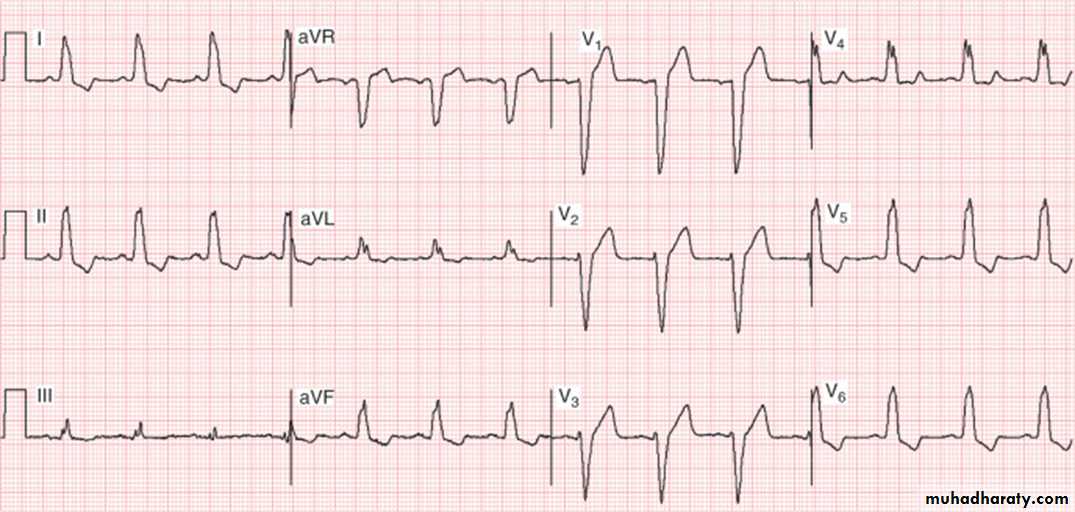
Other ECG :
Findings:1- broad complex
2- r S pattern in V1,V2,V3 with dominant S wave
3- notched complex in ( I , V5 , V6 ) , M shaped in a V L ,
Myocardial infraction
Remember the leads presentation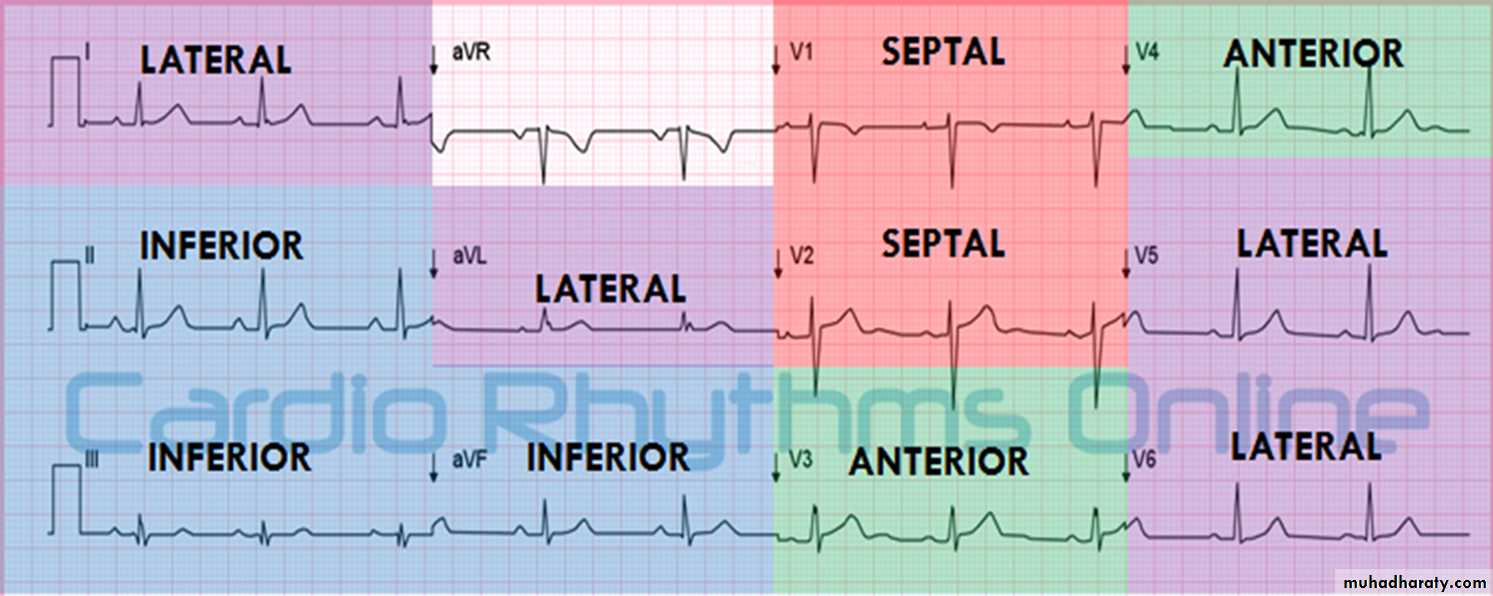
A ) S-T elevation MI
Elevation should be more than one small square in all the leads OR more than 2 small squares in two contiguous leads that represent the same area of the heart .Example ECG
Findings: 1- S-T elevation in V1,V2,V3 and V4
DX: anteroseptal myocardial infraction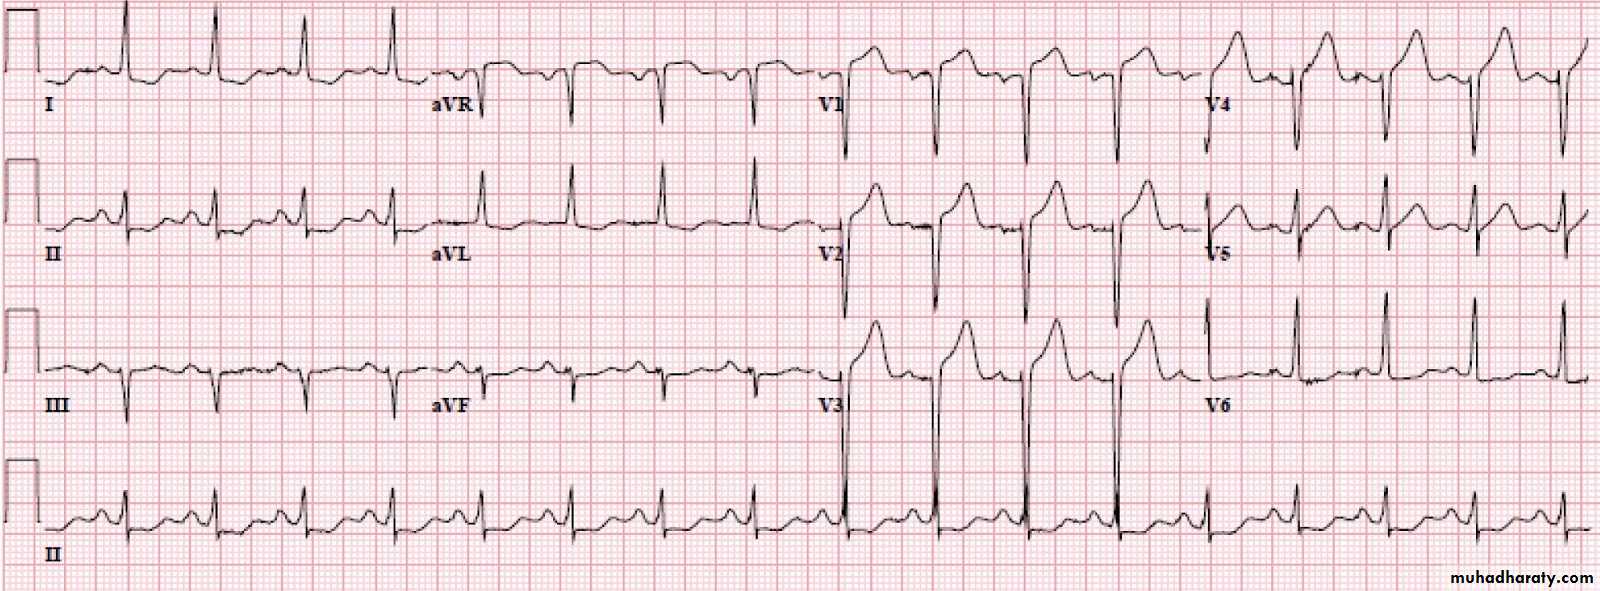
Other ECG:
Findings:1- S-T elevation in V2,V3,V4
2- other important and clear finding (homework )
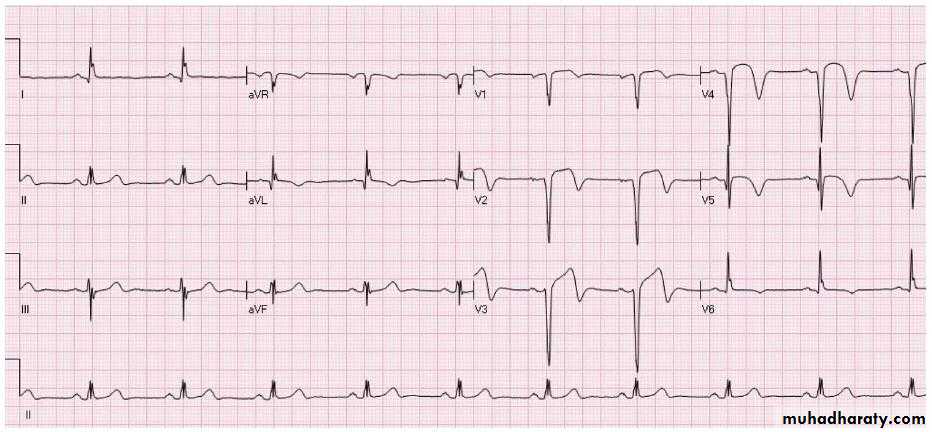
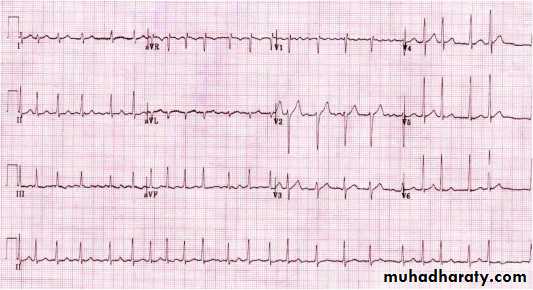
B) Non- S T elevation MI (either S-T depression MI or T wave inversion MI )
*S-T depression should be more than 0.5 small square and the depression should be in at least two contiguous leads .Example ECG:
Findings : ( S-T depression in V2,3,4,5,6 , I , II , a V L )
- Other important and clear findings .( homework )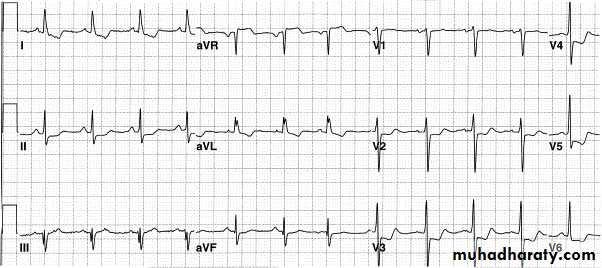
OTHER Example ECG for non STEMI
Findings:1- inferior leads S-T depression (II ,III , a V F )
2- S-T depression in leads ( V3,V4,V5)
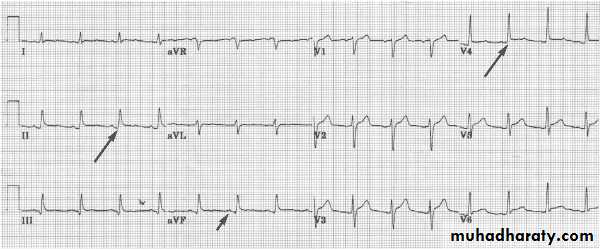
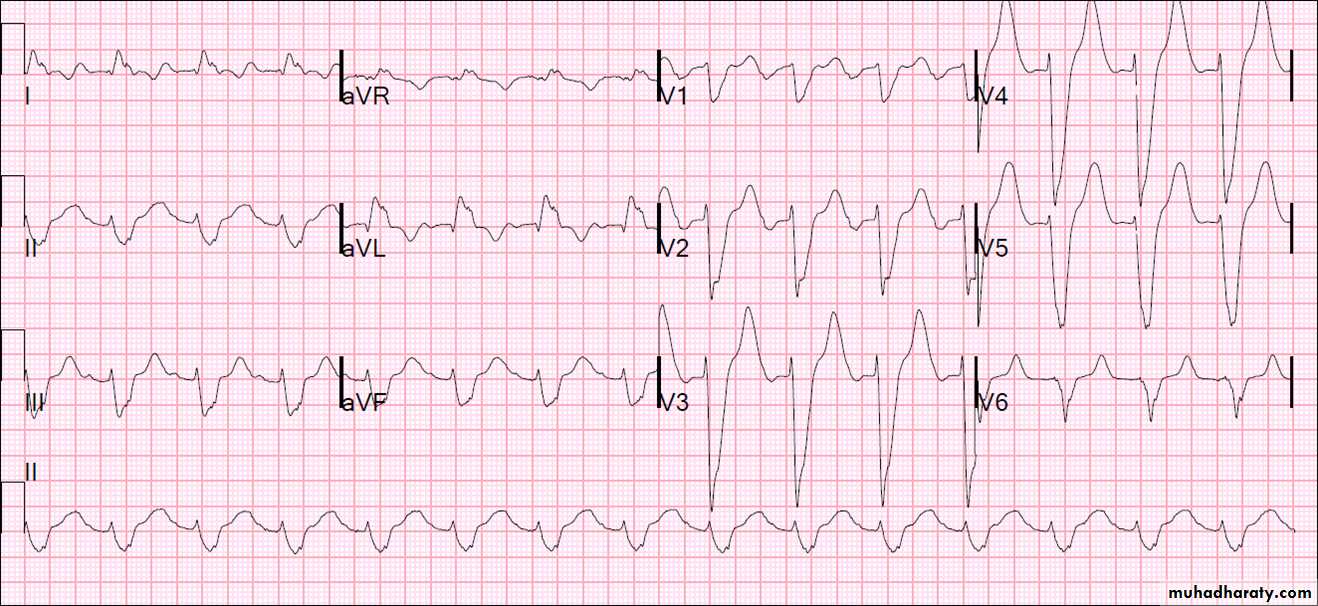
hyperkalemia
Ecg changes :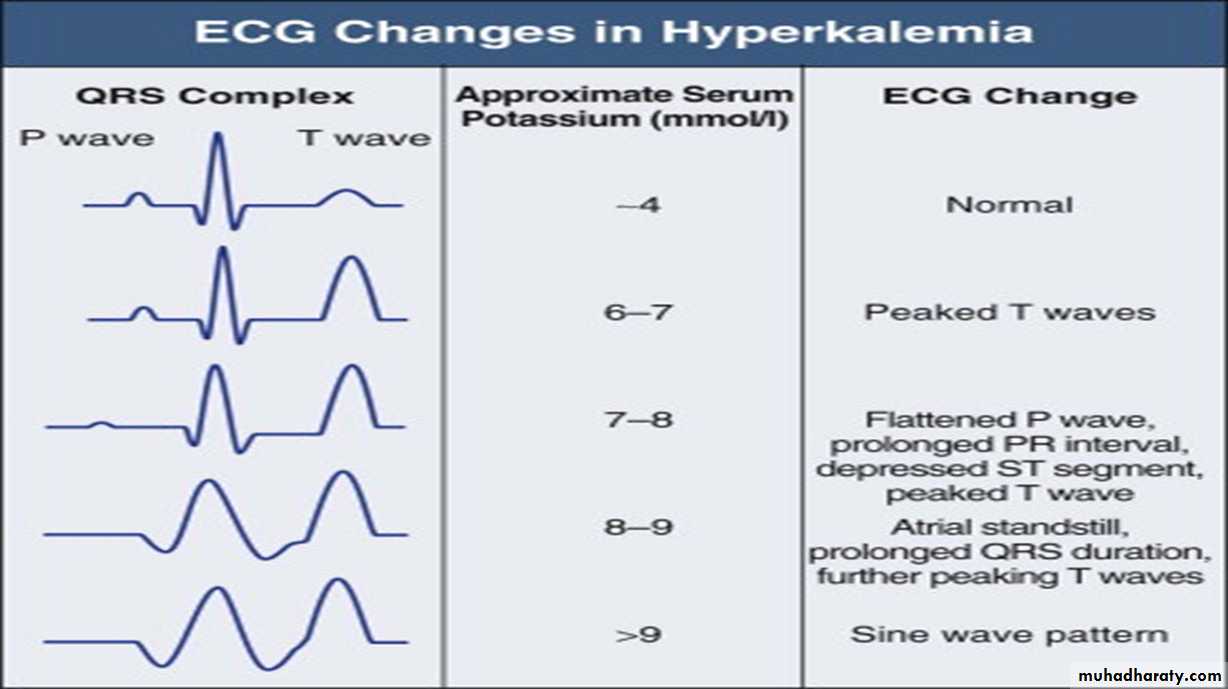
Example ECG :
Findings :1- peaked , tented T wave in V2, V3 ,V4, V5
2- Broad complex with changes of left bundle branch block
*( Management of hyperkalemia is very important )
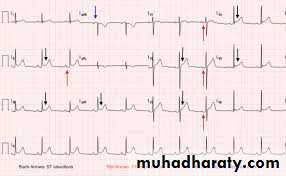
Pericarditis
ECG :Findings:
1- P-R segment depression in multiple leads ( specific ECG marker for pericarditis )2 – saddle shape S-T elevation also in multiple leads
Other ECG example :
Findings: 1- P-R segment depression2- saddle shape S-T elevation
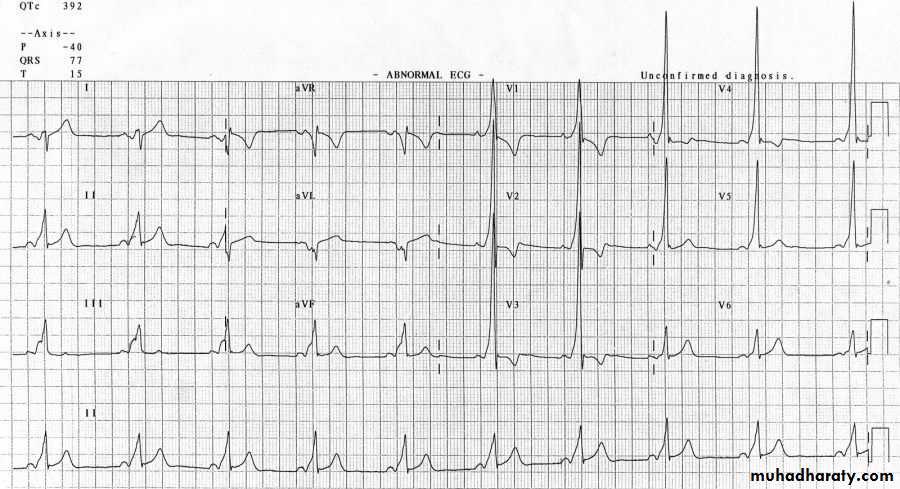
Wolf Parkinson white syndrome
WPWS is a condition where atrial impulses bypass the AV junction and activate the ventricular myocardium directly via an accessory pathway ( bundle of Kent ) .Thought to be hereditary
Its incidence is 0.1-0.3 % of population
1) WPWS type 1:
Left sided pathway resulting in predominant R waveECG example :
Findings in above ECG :
1- Sinus rhythm2- broad QRS complexes with slurred upstroke ( delta wave ) associated with
dominant R wave in V1
3- very short P-R interval ( important finding in WPWS )
3- right axis deviation
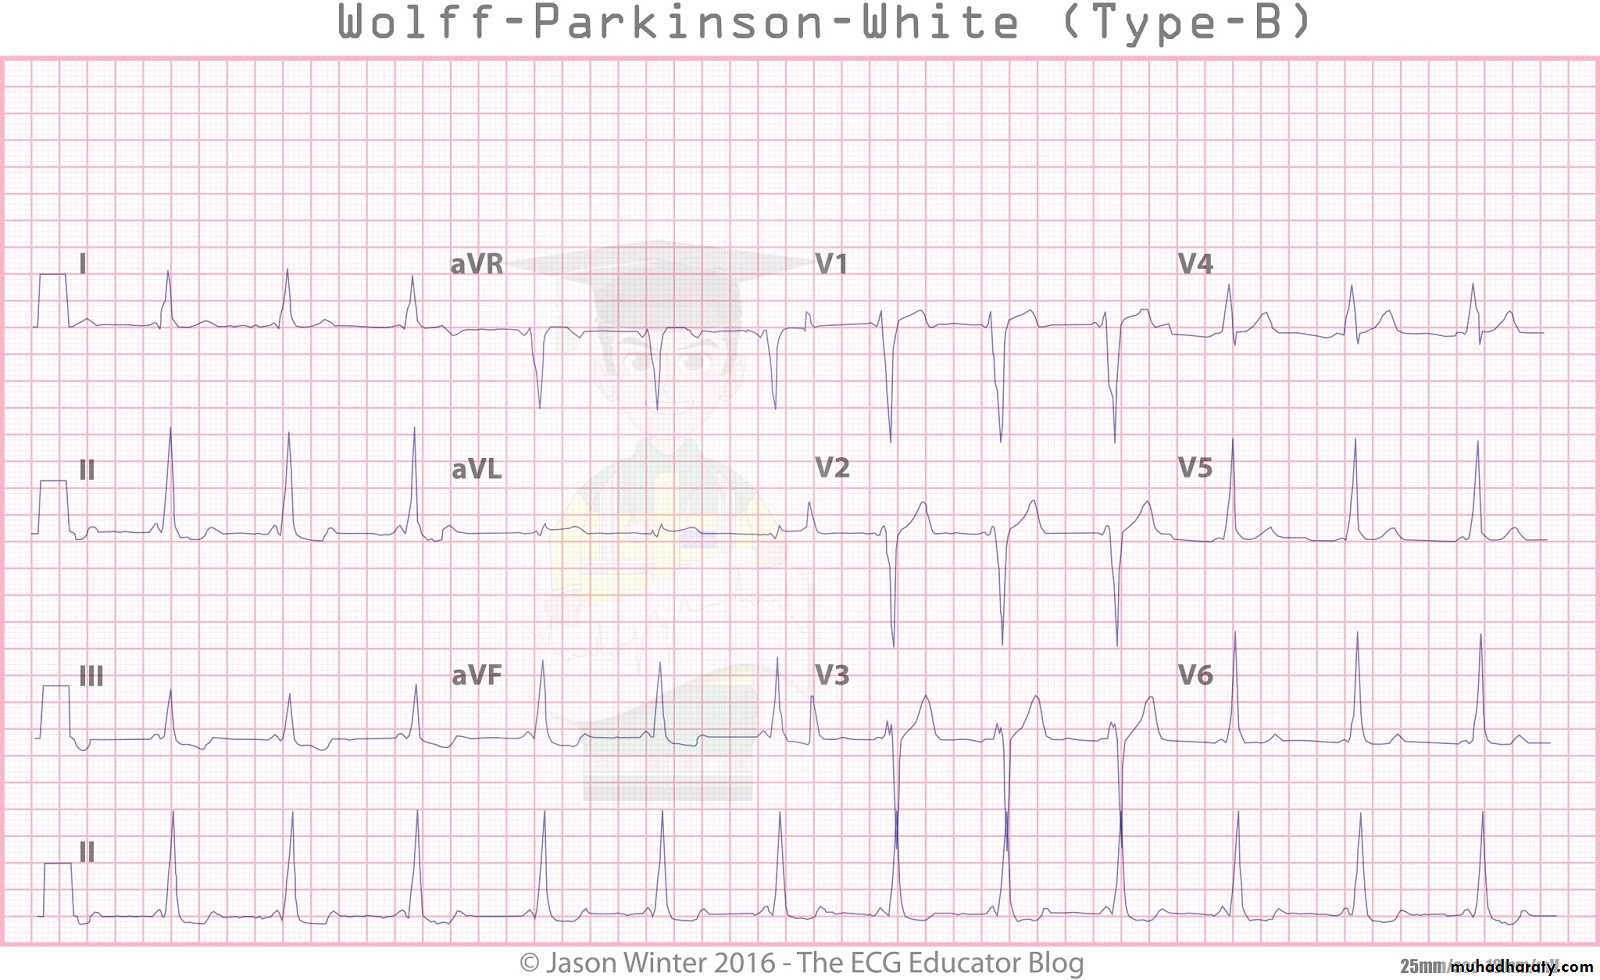
2) WPWS type B
RIGHT sided pathway resulting in predominant S or QS wave- The ECG findings the Same as in type A but instead of dominant R wave in type A there is dominant S wave or QS pattern in V1 .
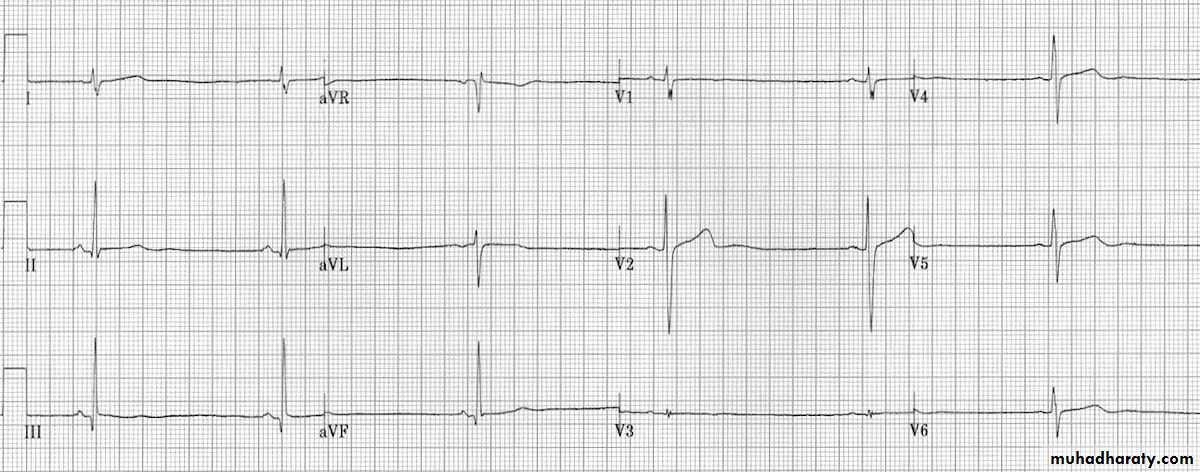
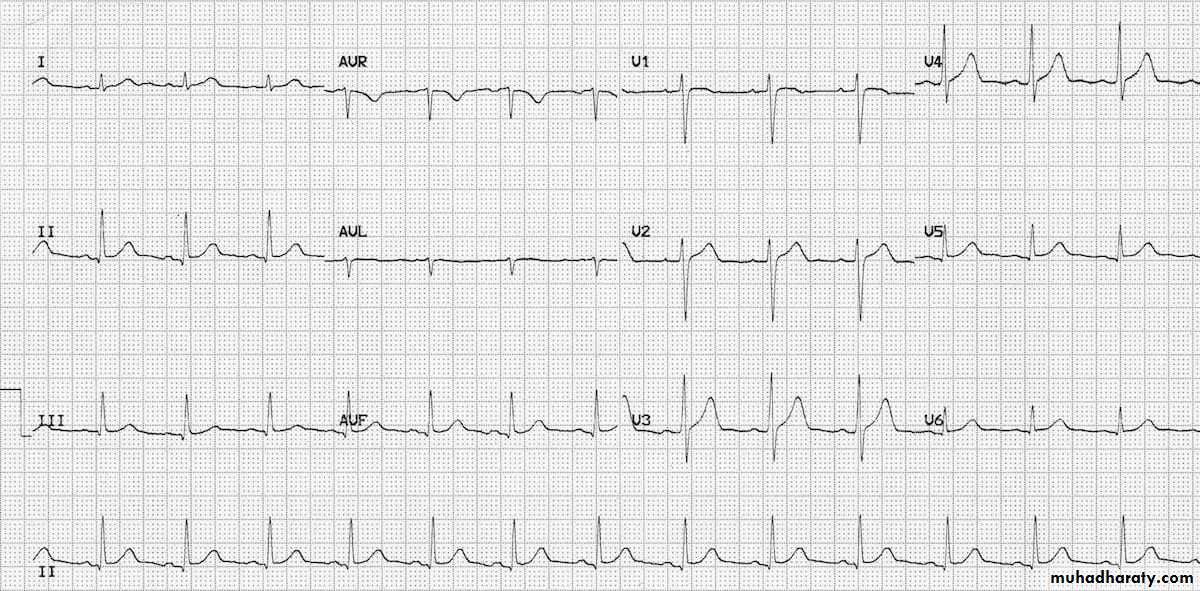
Ventricular hypertrophy
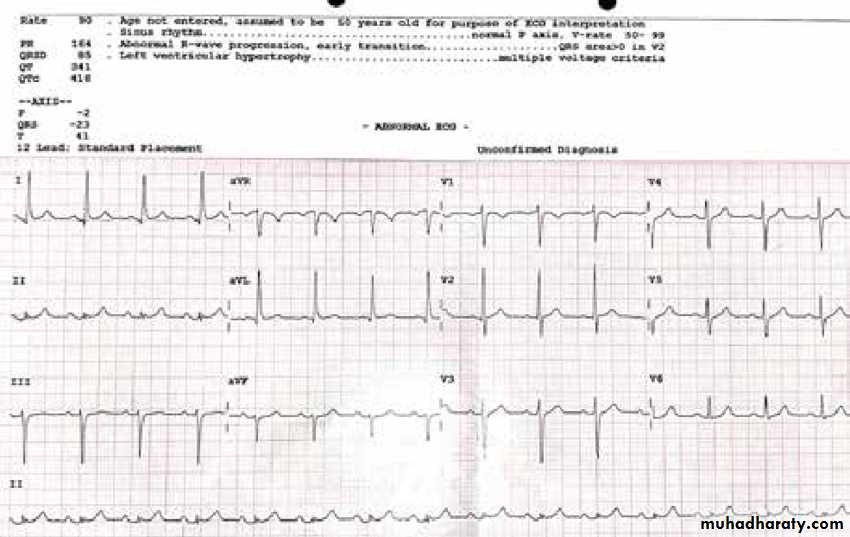
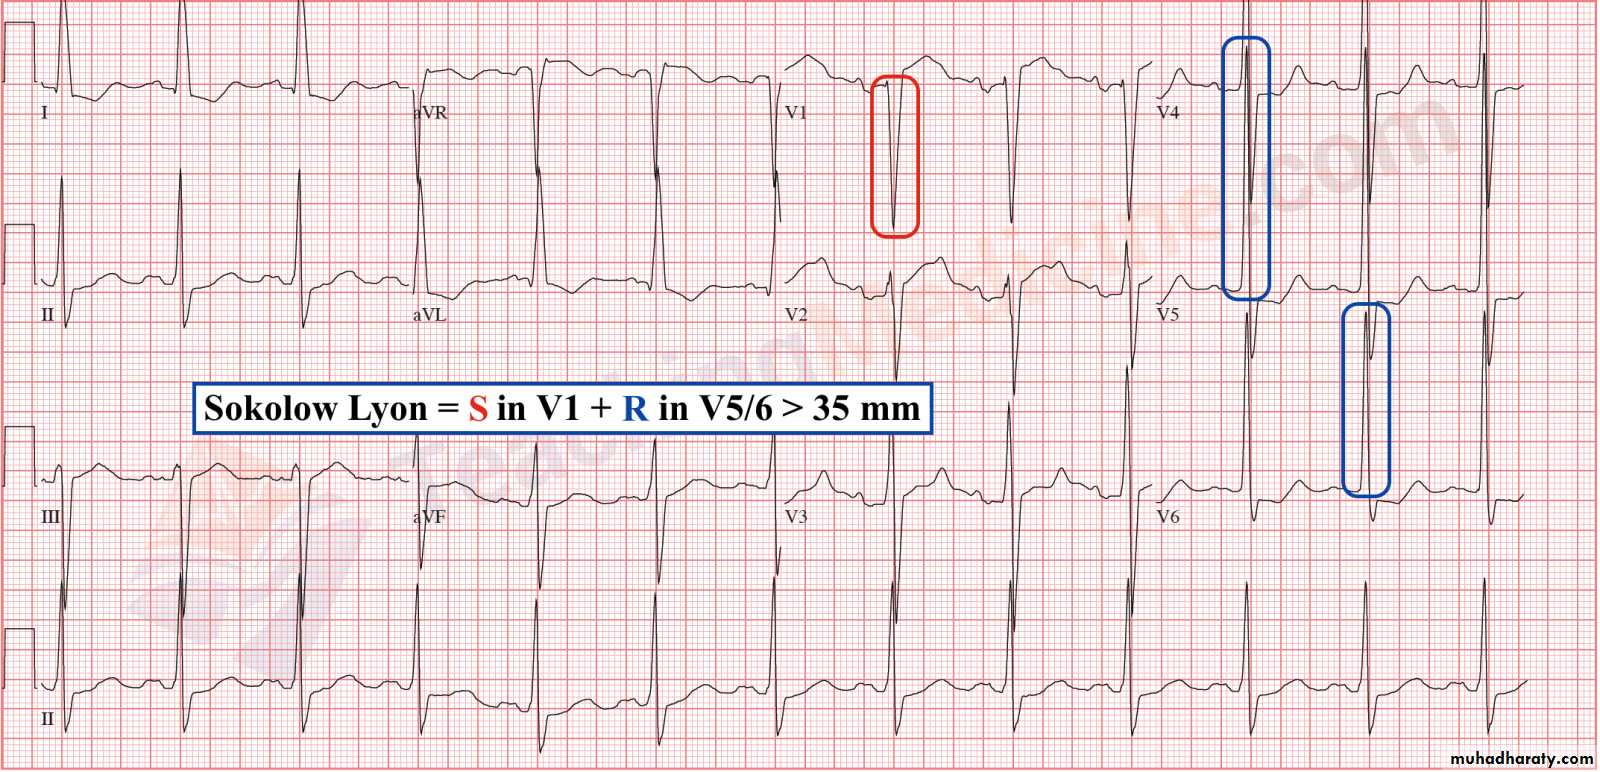
1– Left ventricular hypertrophy* Sokolov – Lyon criteria , voltage criteria
= most deepest S wave in V1 or V2 + tallest R wave height in V5 or V6 > 35 mm ( > 7 large boxes)
( more accurate criteria )
other criteria is ( a V L criteria )
R wave in a V L > 12 mm
Causes :( systemic
hypertension , aortic
regurgitation , other )
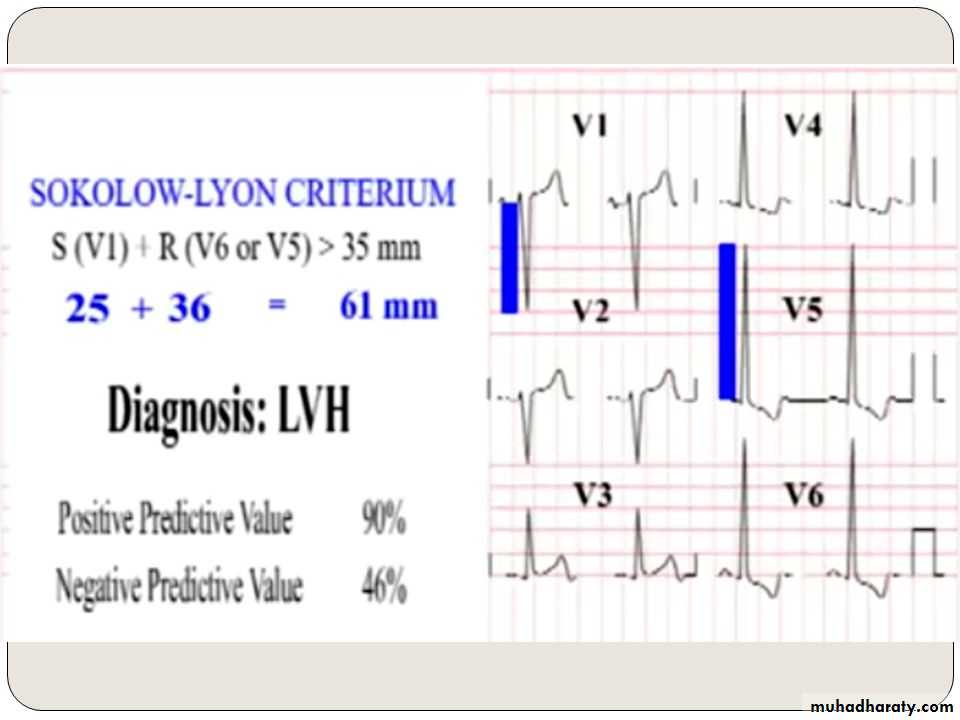
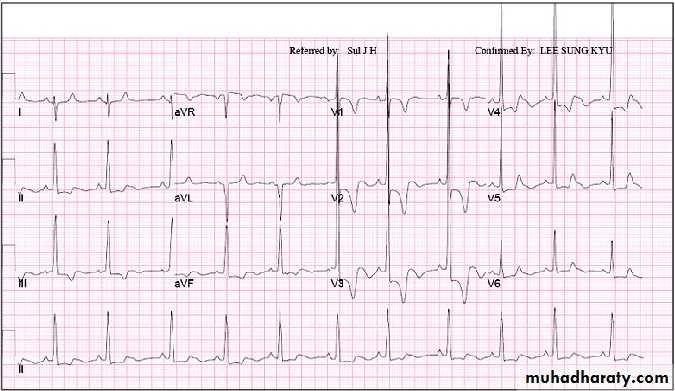
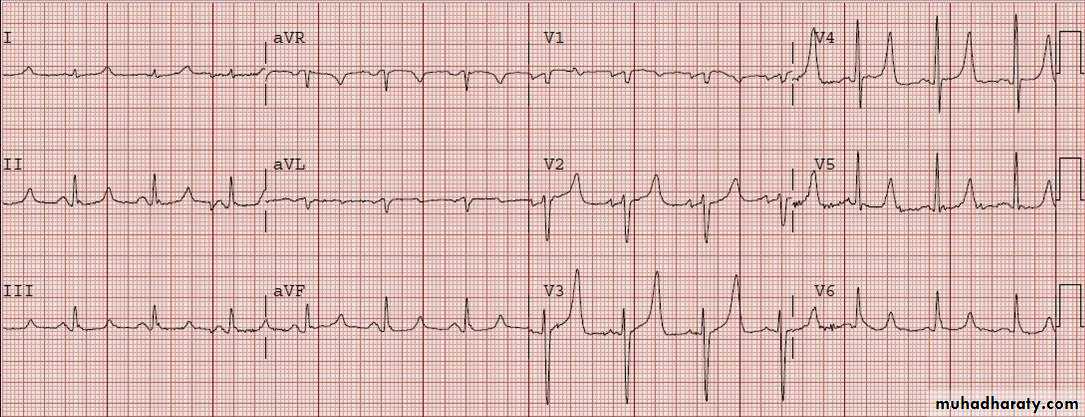
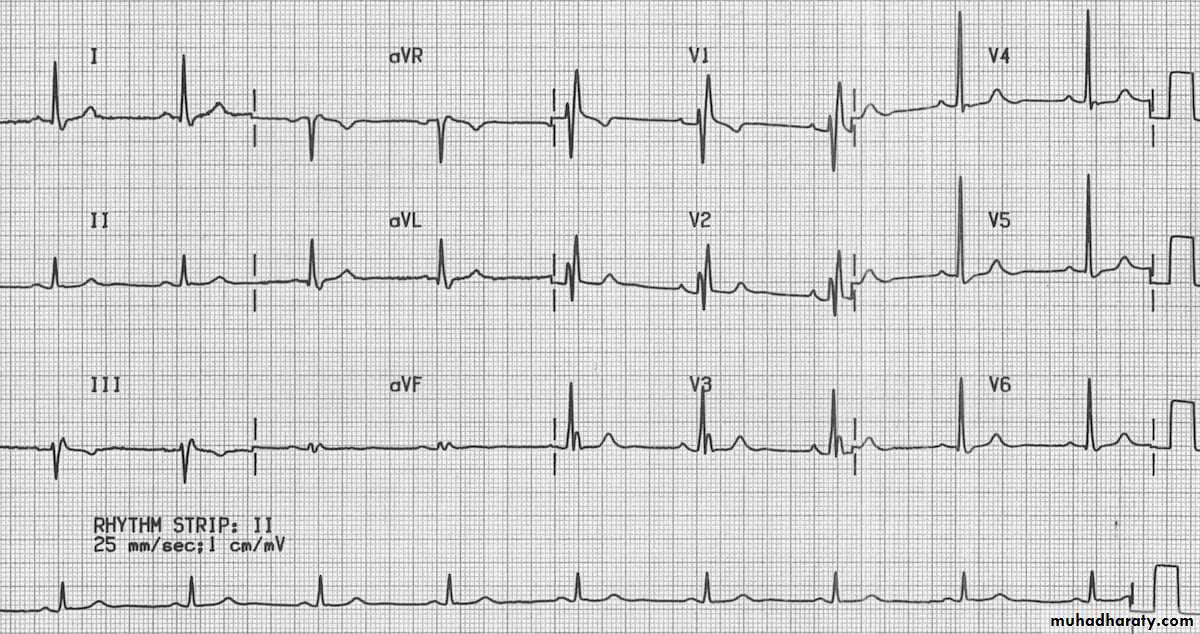
ECG of LVH
Look to the depth of S wave in V1 and tall of R wave in V6 so the sum of both > 35 mm Note : in LVH the R wave amplitude will progressively increase from V1 to V6 ( gradual increase ) while the S wave depth will progressively decrease .
2- Right ventricular hypertrophy
here the R wave amplitude progressively decrease in length from V1 to V6 while the S wavedepth will progressively increase from V1 to V6 ( diagnosed by The same criteria ) .