Correlation and RegressionRelationshipsbetween Variables
A researcher is usually interested in five things about relationships1- Are two or more variables related?
2- If so, what is the strength of the relationship?
3- What type of relationship exists (Is it positive or negative)?
4- Is it statistically significant ?
5- What kind of predictions can be made from the relationship?
Statistical Methods: I. Correlation:-
It is a statistical method used to measure the relationship between variablesIt provides a quantitative means of expressing a relationship between two or more variables.
For example Correlation might be used to express the relationship between…
* Age and height of children.
* Number of days students are absent and their level of achievement.
* Scores on two different student assessments, such as reading and math.
* Serum cholesterol & blood pressure
.
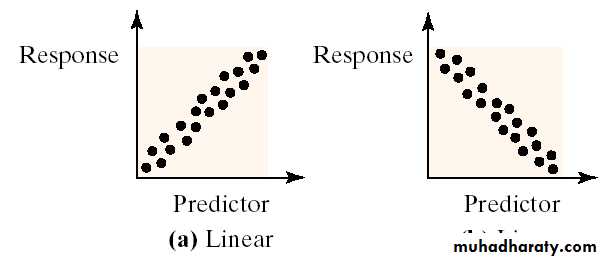
Types of relationships:
1- Direct (positive) Relationship:
- When values on two variables tend to go in the same direction, this is called a direct relationship.
Example: The correlation between children’s ages and heights is a direct relationship.
i.e. the older children tend to be taller than younger children.
2- Inverse (Negative) Relationship:
- When values on two variables tend to go in opposite directions, we call this an inverse relationship.
-Example: The correlation between students’ number of absences and level of achievement is an inverse relationship. i.e. the students who are absent more often tend to have lower achievement.
Definitions:
* Bivariate data: is data in which two variables are measured on an individual. (x, y)The response( dependent) variable is the variable whose value can be explained or determined based upon the value of the predictor( independent) variable
* Scatter plot (or scatter diagram):
is a graph in which the paired (x, y) sample data are plotted with a horizontal x-axis and a vertical y-axis. Each individual (x, y) pair is plotted as a single point.- A scatter diagram shows the relationship between two quantitative variables measured on the same individual.
- The predictor variable is plotted on the horizontal axis and the response variable is plotted on the vertical axis.
- Each individual in the data set is represented by a point in the scatter diagram.
- The points are not connected when drawing a scatter diagram.
- A scatter diagram is a visual way to describe the nature of the relationship between the independent and dependent variables.

Pearson - Correlation Coefficient:
•Pearson correlation coefficient (r) measures strength of the linear relationship between two quantitative variables.
• Assumptions:
• - Both variables are quantitative continuous variables.
• - The underlying distribution of both variables are normal.
Correlation Coefficient: Pearson Correlation Coefficient – r :
- it is a quantitative measure of the degree of association.- measures the strength and direction of a linear relationship between two variables.
- The symbol for the sample correlation coefficient is r.
- The symbol for the population correlation coefficient is (rho)
- The range of the correlation coefficient is from 1 to 1. That is, -1 < r < 1.
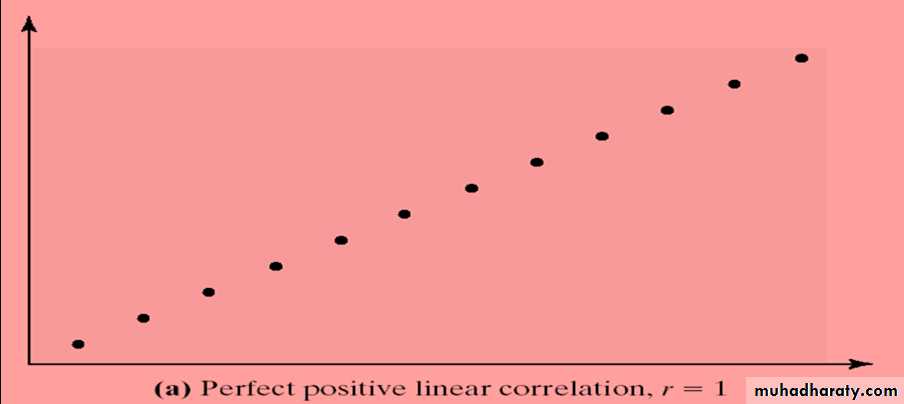
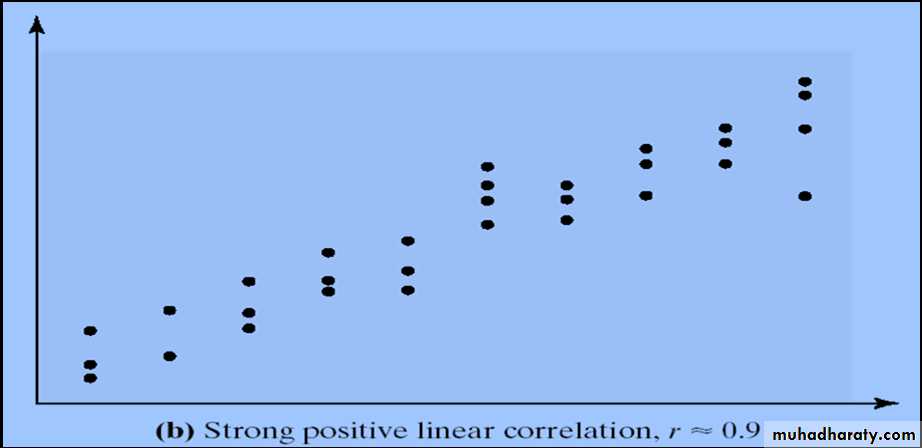
- If r = +1, there is a perfect positive linear relation between the two variables.
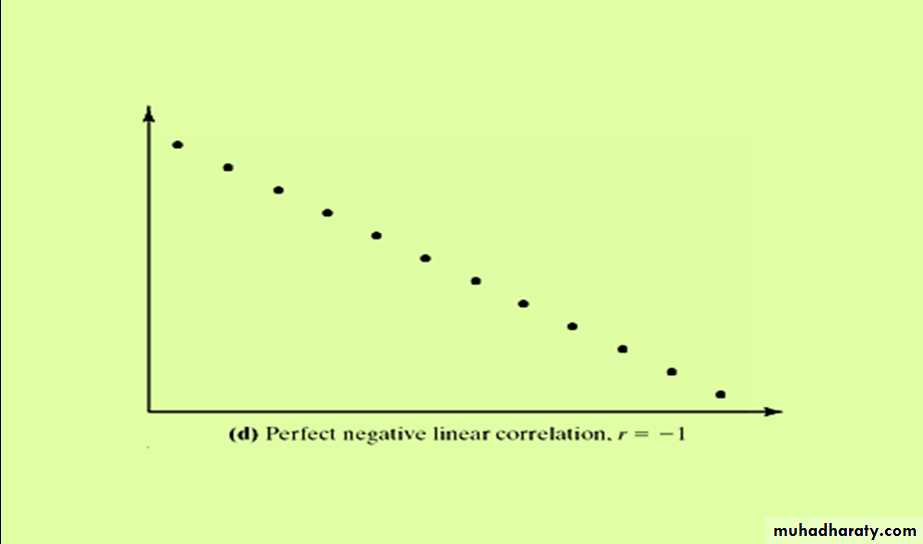
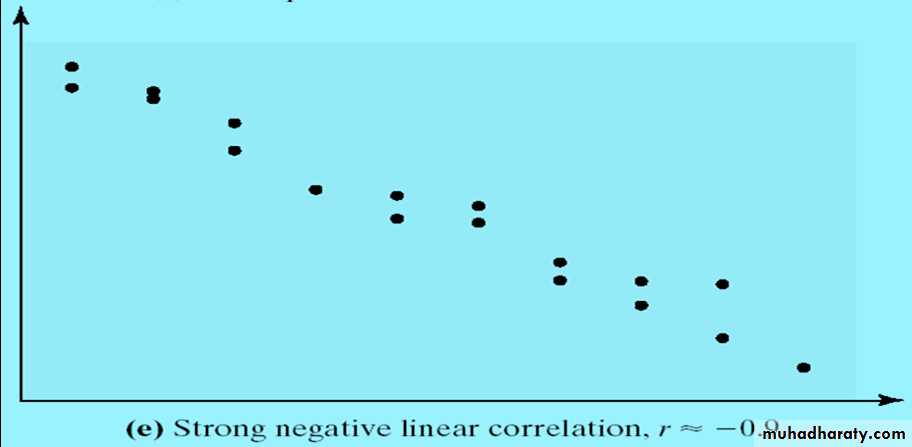
- If r = -1, there is a perfect negative linear relation between the two variables.
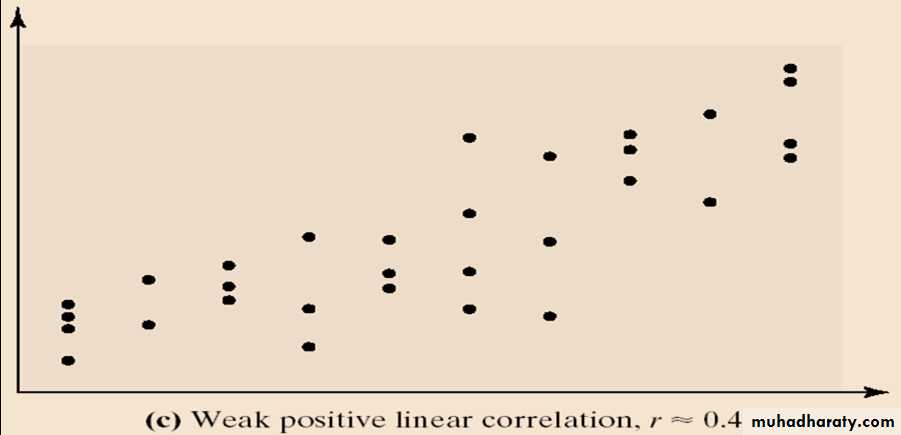
- The closer r is to +1, the stronger the evidence of positive association between the two variables.
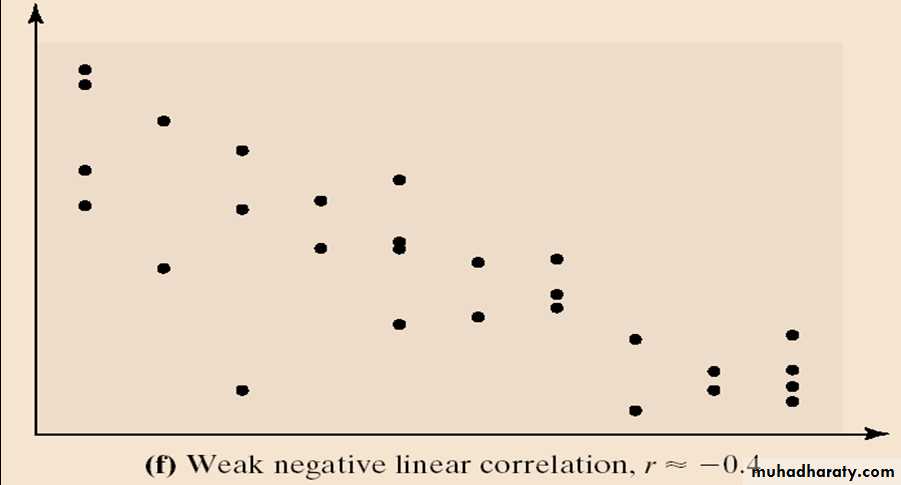
- The closer r is to -1, the stronger the evidence of negative association between the two variables.
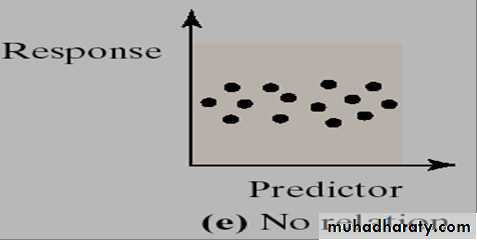
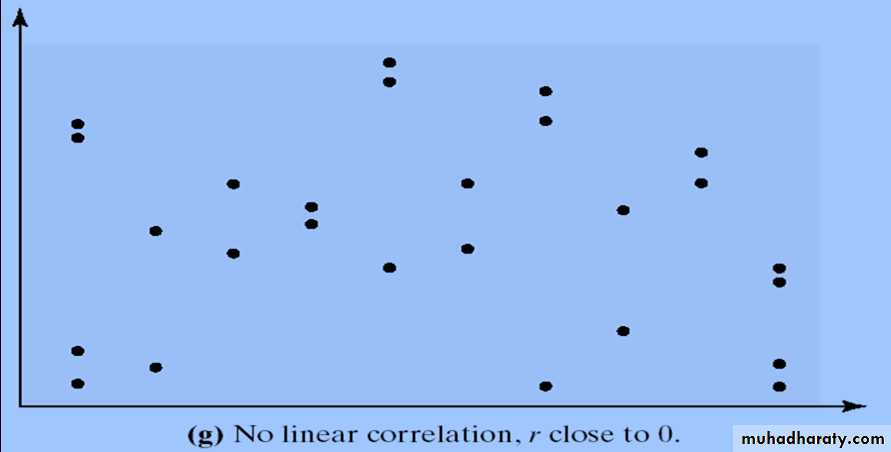
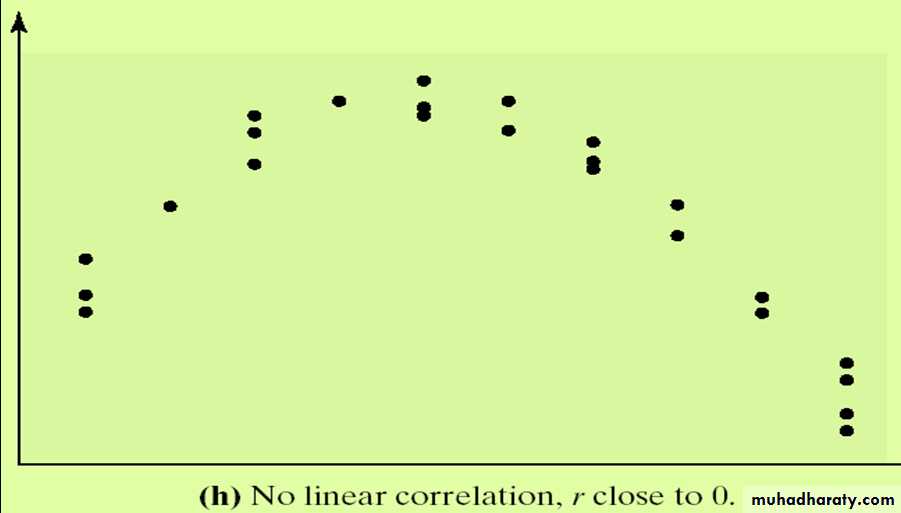
- If r is close to 0, there is evidence of no linear relation between the two variables. Because the linear correlation coefficient is a measure of strength of linear relation, r close to 0 does not imply no relation, just no linear relation.
- It is a unit less measure of association. So, the unit of measure for x and y plays no role in the interpretation of r
Correlation Coefficient:
When there is no linear relationship between the variables or only a weak relationship, the value of r will be close to 0.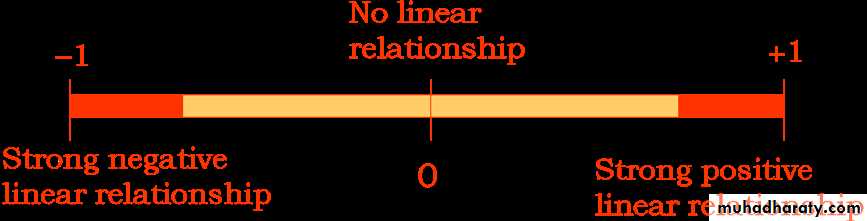

• Calculating correlation coefficient: Example:
Hypothesis Testing:- We wish to determine whether the linear correlation between two variables is significant.
- In hypothesis testing, one of the following is true:
H0: 0 This null hypothesis means that there is no correlation between x and y variables in the population.
H1: 0 This alternative hypothesis means that there is a significant correlation between the two variables in the population.
• 2
• Formula for the t test for the correlation coefficient:
• with degrees of freedom equal to n 2.
• Example:
• Test the significance of the correlation coefficient for the age and blood pressure
• data when r=0.897 & n=6. Use α = 0.05.
Step 1: State the Hypotheses.
H0: = 0 Ha: ≠ 0Step 2: Find the critical values. Since α = 0.05 and there are 6 - 2 degrees of freedom, the critical value for t = +2.776.
Step 3: Compute the test value. t = 4.059
Step 4: Make a decision. Reject the null hypothesis, since the test value falls in the critical region (4.059 > 2.776).
Step 5: Summarize the results. There is a significant relationship between the variables of age and blood pressure
Coefficient of Determination :
- The coefficient of determination is a measure of the variation of the dependent variable that is explained by the independent variable.The symbol for the coefficient of determination is r2.
The coefficient of non determination is a measure of the unexplained variation.
- The formula for the coefficient of non determination is: 1-r2- It is important to calculate r2 because the significance of a correlation coefficient is greatly dependent on sample size (n).
- When (n) is large, even very small values of r can be statistically significant.
• II. Regression Analysis:
• Knowing that two variables are correlated allows us to be able to predict
• the value of one variable based on knowing the value of the other variable.
• Regression analysis shows relationships between variables in the form of equations,
• which can predict the value of a dependent variable on the basis of values of independent variables.
II. Regression Analysis:
• Knowing that two variables are correlated allows us to be able to predict the
• value of one variable based on knowing the value of the other variable.
• Regression analysis shows relationships between variables in the form
• of equations, which can predict the value of a dependent variable on the basis
• of values of independent variables.
Regression Equation:
- where b is the slope of the line and a is the y' intercept.
• The regression equation expresses a relationship between
• x (called the independent variable), predictor variable
• or explanatory variable,
• and y (called the dependent variable or response variable).
• Regression Equation:
•