ThiQar college of MedicineFamily & Community medicine dept.
Nutrition Lecture 6/ onlineThird stage by: Dr. Muslim N. SaeedMay 6th ,2021Assessment of Nutritional status in children
Growth chartsMulticenter Growth Reference Study
In 2006 the World Health Organization released growth charts based on the Multicenter Growth Reference Study (MGRS).Six study sites representing 5 continents were included: USA, Brazil, Norway, Ghana, Oman, and India.
The data obtained are presented in 5 standard gender-specific charts:
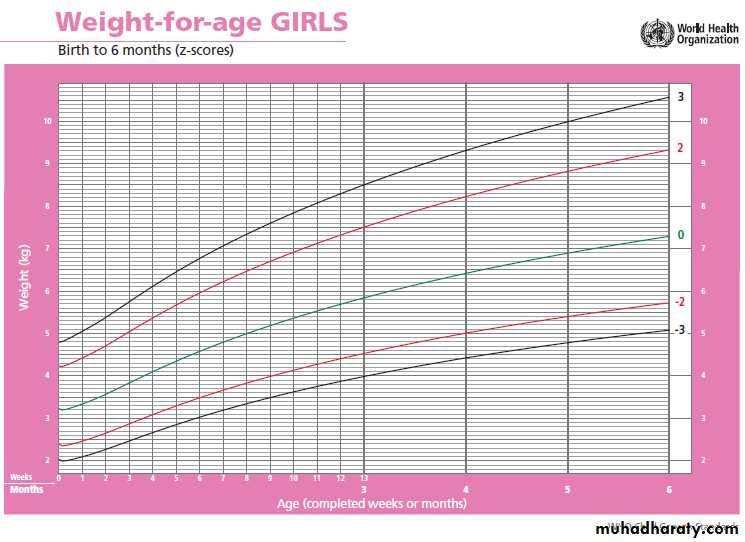
(1) weight for age;
(2) height (length and stature) for age;
(3) head circumference for age;
(4) weight for height (length and stature).
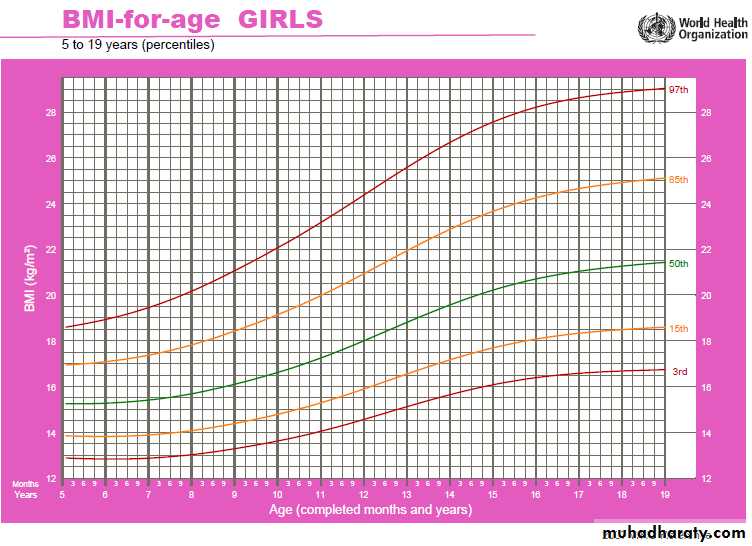
(5) BMI for age for children
Growth indicators are used to assess growth considering a child’s age and measurements together.
1. length/height-for-age.
2. weight-for-age
3. weight-for-length/height.
4. BMI (body mass index)-for-age
-The specific charts used will depend on the child’s age, which determines whether the child will stand for measurement of height or lie down for measurement of length.
-The measurements will be plotted on growth charts in the Boys Growth Record or the Girls Growth Record so that trends can be observed over time and any growth problems identified.
Growth monitoring is one of the basic activities of the under 5 clinics where the child is weighed periodically at (ideally):
• monthly intervals during the 1st year,
• every 2 months during the 2nd year and
• every 3 months thereafter up to the age of 5 to 6 years.
• There are no national policies for growth monitoring beyond the age of 6 years.
newborns and infants from birth - 1 month assessed weekly.
However, children who are severely underweight, or who have not gained weight for 2 months, or who are “at risk” of under nutrition, should be weighed frequently preferably every month.
All the points on the growth chart should be marked only as dots.
The height and weight should be recorded (and head circumference till 3 years) and plotted on the chart.At all subsequent visits join the dot up to the previous dot.
For children with particularly tall or short parents, there is a risk of over diagnosing growth disorders if parental height is not taken into account.
It is important to correct for various factors in plotting and interpreting growth charts.
For premature infants, over diagnosis of growth failure can be avoided by using growth charts developed specifically for this population.
A cruder method, subtracting the weeks of prematurity from the postnatal age when plotting growth parameters.
In order to plot points, one needs to understand certain terms related to graphs and the plotting convention:
X-axis – the horizontal reference line at the bottom of the graph. In the Growth Record graphs, some x-axes show age and some show length/height. Plot points on vertical lines corresponding to completed age (in weeks, months, or years and months), or to length or height rounded to the nearest whole centimetre.
Y-axis – the vertical reference line at the far left of the graph. In the Growth Record graphs, the y-axes show length/height, weight, or BMI. Plot points on or between horizontal lines corresponding to length/height, weight or BMI as precisely as possible.
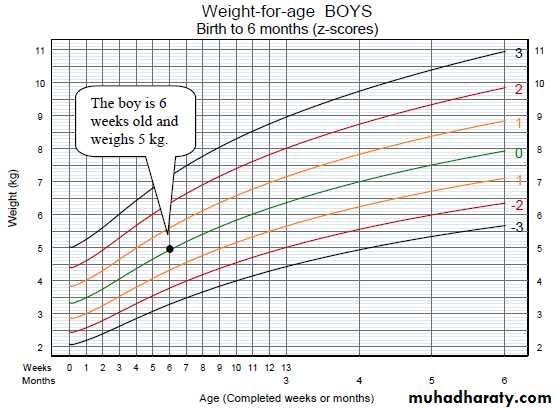
Plotted point – the point on a graph where a line extended from a measurement on the X-axis (age) intersects with a line extended from a measurement on the Y-axis (e.g. weight).
Example: On the graph below, age (in weeks or months) is on the X-axis; weight in kilograms is on the Y-axis. The horizontal lines represent 0.1 kg (100 g) increments. A point has been plotted for an infant boy who is 6 weeks old and weighs 5 kg.
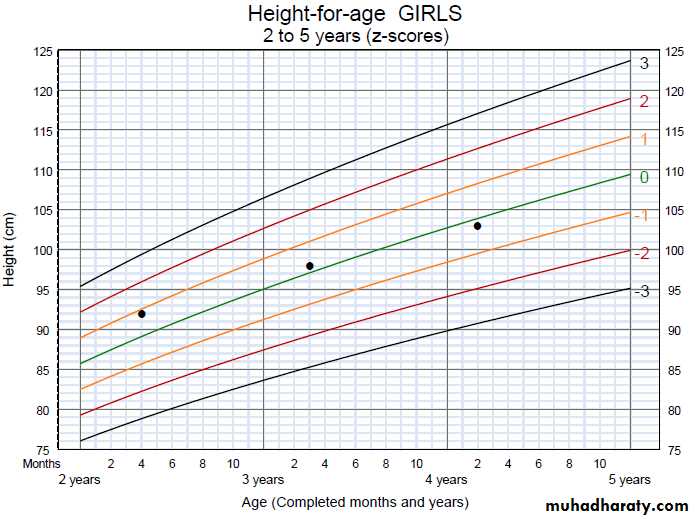
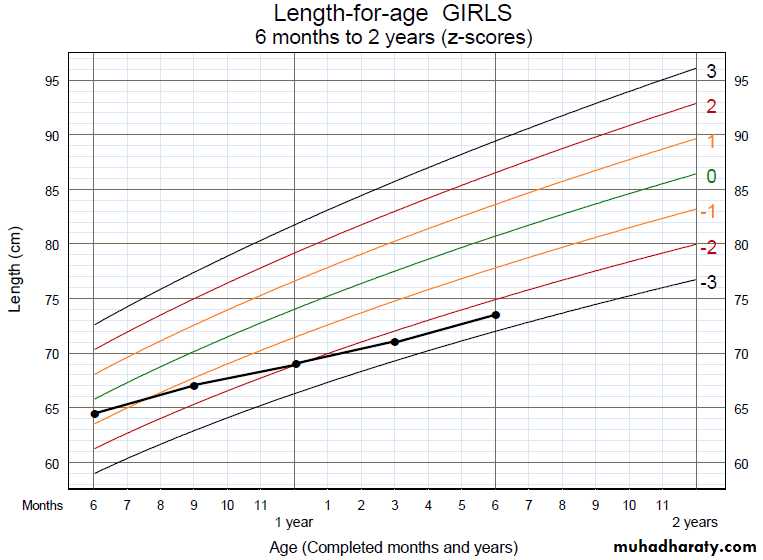
The following graph shows a girl’s height_for_age at three visits. The horizontal lines represent 1 cm increments. At the first visit, she was 2 years and 4 months of age and was 92 cm in height.
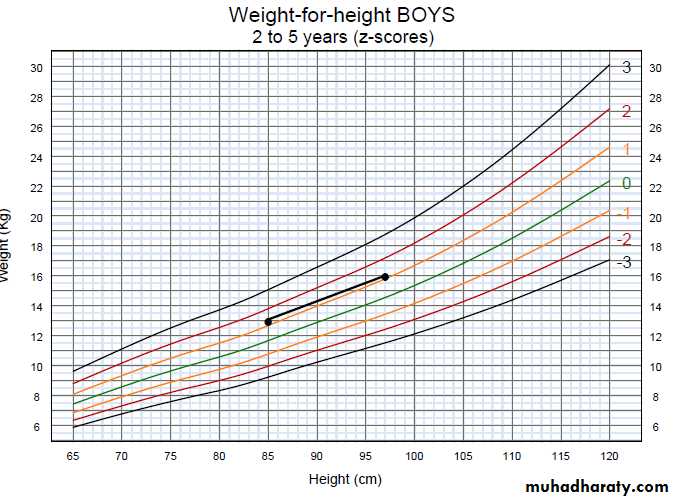
This chart shows a boy’s weight_for_height at two visits. The horizontal lines represent 0.5 kg (500 g) increments while the vertical lines represent 1 cm increments. At the first visit, he is 2 years and 2 months old. He is 85 cm in height and weighs 13 kg.
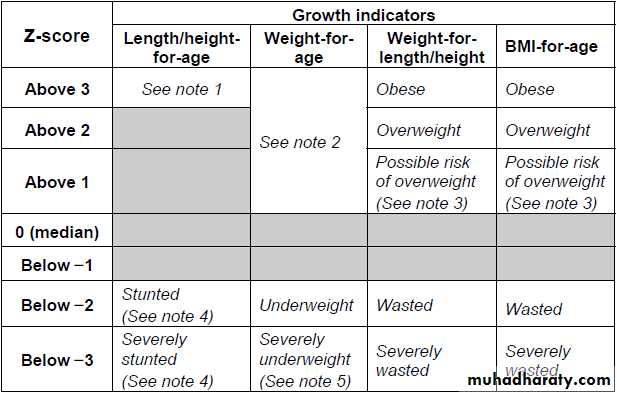
Growth ProblemsCompare the points plotted on the child’s growth charts with the z-score lines to determine whether they indicate a growth problem. Measurements in the shaded boxes are in the normal range.
Notes:
1. A child in this range is very tall. Tallness is
Rarely a problem, unless it is so excessive that
it may indicate an endocrine disorder such as
A growth-hormone-producing tumor.
Refer a child in this range for assessment if you
suspect an endocrine disorder (e.g. if
parents of normal height have a child who is
excessively tall for his or her age).
2. A child whose weight-for-age falls in this
range may have a growth problem, but this is
better assessed from weight-for-length/height
or BMI-for-age.
3. A plotted point above 1 shows possible risk.
A trend towards the 2 z-score line shows definite risk.
4. It is possible for a stunted or severely stunted child
to become overweight.
Consider all growth charts and observations
Consider all of a child’s growth charts together, particularly if only one of the charts shows a problem. For example, if a child is underweight according to the weight_for_age chart, you must also consider length_for_age and weight_for_length. Focus more on the weight_for_length/height and the length/height_for_age charts.*Length/height_for_age reflects attained growth in height. Stunting (length/height-for-age below -2) implies that for a long period the child received inadequate nutrients to support normal growth and/or that the child has suffered from repeated infections. A stunted child may have a normal weight-for-height, but have low weight-for-age due to shortness.
Weight-for-length/height is a reliable growth indicator even when age is not known.
Wasting (weight-for-length/height below -2) usually results from a recent severe event, such as reduced food intake and/or illness that caused severe weight loss.BMI-for-age classifies children in a similar manner to weight-for length/height. Both indicators also help to identify whether the child has excess weight relative to length/height.
Looking at the growth charts all together will help you to determine the nature of growth problems. It will also be important to consider trends observed over time.
Interpret trends on growth charts
To identify trends in a child’s growth, look at points for growth indicators plotted at a series of visits.Trends may indicate that a child is growing consistently and well, or they may show that a child has a growth problem, or that a child is “at risk” of a problem and should be reassessed soon. “Normally” growing children follow trends that are, in general, parallel to the median and z-score lines.
Most children will grow in a “track,” that is, on or between z-score lines and roughly parallel to the median; the track may be below or above the median.
When interpreting growth charts, be alert for the following situations, which may indicate a problem or suggest risk:
A child’s growth line crosses a z-score line.
There is a sharp incline or decline in the child’s growth line.
The child’s growth line remains flat (stagnant); i.e. there is no gain in weight or length/height. Whether or not the above situations actually represent a problem or risk depends on where the change in the growth trend began and where it is headed. For example, if a child has been ill and lost weight, a rapid gain (shown by a sharp incline on the graph) can be good and indicate “catch-up growth.” Similarly, for an overweight child a slightly declining or flat weight growth trend towards the median may indicate desirable “catch-down.” It is very important to consider the child’s whole situation when interpreting trends on growth charts.
A girl’s height-for-age dropped from above -1 to below-2 in a period of 9 months, crossing two z-score lines. Her growth in length seems to have slowed down at an age when rapid growth is expected. She is now stunted.
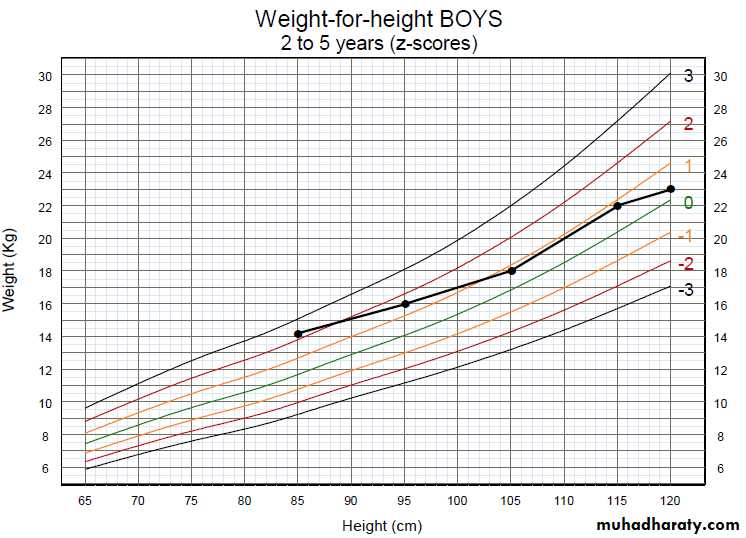
weight-for-height at five visits from age 2 to 5 years, the crossing ofz-score lines towards the median and slowing of weight gain represent a good trend.
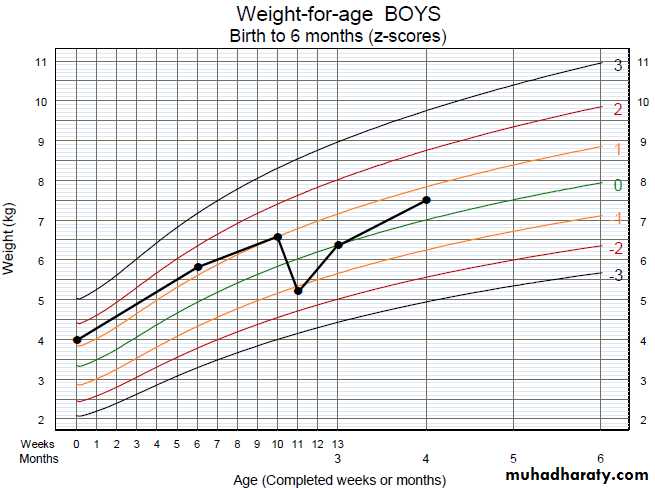
A boy’s weight-for-age chart shows a sharp decline from age 10 to 11 weeks, when he had diarrhoea and lost 1.3 kg. The chart shows a sharp incline after the episode of diarrhoea, during re-feeding, as he gained back most of the lost weight.
What is malnutrition?
Malnutrition is a group of conditions in children and adults generally related to poor quality or insufficient quantity of nutrient intake, absorption, or utilization.Types of malnutrition
There are two major types of malnutrition:
• Protein-energy malnutrition - resulting from deficiencies in any or all nutrients
• Micronutrient deficiency diseases - resulting from a deficiency of specific micronutrients
Underweight: weight for age < –2 standard deviations (SD) of the WHO Child Growth chart.
Stunting: height for age < –2 SD of the WHO Child Growth chart.
Wasting: weight for height < –2 SD of the WHO Child Growth chart.
Overweight: weight for height > +2 SD of the WHO Child Growth chart.
Underweight
Underweight is a form of malnutrition where the child doesn’t gain weight properly, it is usually due to inadequate intake of energy from macronutrients for long period.
Diagnosed as, if the child is 10 years old or younger.
Dx:
If child is ≤ 10 years
using weight for age indicator:
If Weight for age less than -2SD of WHO weight for age growth charts the child is underweight , if less than -3SD child is severely underweight.
Wasting
Wasting: is a form of acute malnutrition resulting in rapid and acute weight loss following infectious disease or trauma.Defined as weight for height < -2SD of WHO growth charts ,
Described only in children less than 5 years, where infectious diseases like acute respiratory illness or gastrointestinal illness are common and fatal.
Causes of underweight
• Inadequate intake is the most common cause, either due to poor appetite, picky eater or hectic schedule of child.• Prematurity : premature children are usually underweight because they have higher needs to catch to their peers
• Medications, such as those used in treatment of attention deficit hyperactivity disorder (ADHD), which can suppress appetite.
• Chronic diseases like heart diseases, kidney diseases , cancer etc…
• Food allergies, which can make getting enough calories a challenge and the more food allergies, the greater the challenge.
• Hormonal or digestive problems or other issues of inadequate nutrient absorption that can sometimes keep children from gaining weight as they grow.
• •Psychiatric problems: like depression, eating disorders especially in teenagers, family issues.
Work up of underweight case
1. Anthropometry:
Measure weight, height and intrpret according to age.
2. Biochemical :
CBC, ionized calcium, urine analysis, stool analysis, thyroid function, fasting and postprandial blood sugar.
3. Dietary assessment: 24 hours recall, FFQ (food frequency questionnaire)
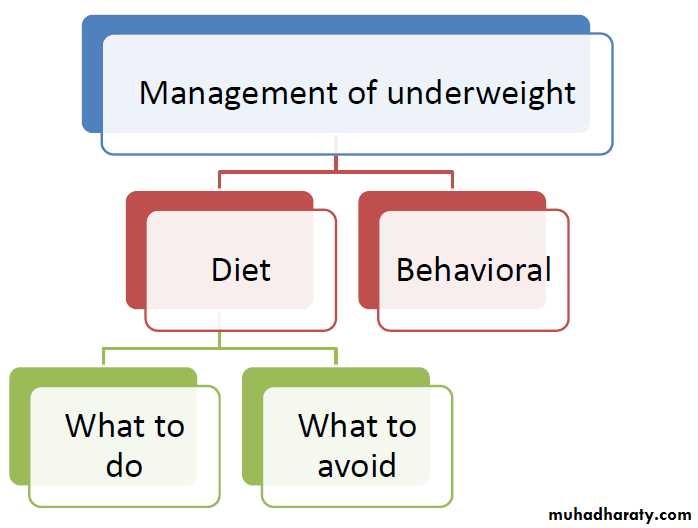
Behavioral modification
•Make feeding time pleasant and family time.•Avoid criticism and focus on positive attitude
•Food is not a reward nor a punishment.
•Don’t make feeding time stressful or a negative experience.
•Don’t insist on finishing the meal in aggressive way
Dietary management
Here are some mistakes that should be avoided
1.Too much snacking , fixed meals and snack time helps the child eat proper food.
2.Giving the child sweets/ juices , high sugar food will make the child lose appetite and miss meals.
3.Avoid unhealthy high fat food.
Diet plan
•Pick the calorie level suitable to the child’s age
•Know the number of servings , start planning.
Supplements
•Give iron or calcium only in case of deficiency.•Powders like Pediasure or Growth formula for kids may be needed.
•Add the powder to milk shake , ice cream , pudding or milk.
•Use the supplement twice daily in severe cases.
Iron deficiency anemia
Iron deficiency anemia is the most common type of anemia, characterized by low hemoglobin levels.Causes :
Inadequate intake of iron.
Increased needs due to growth spurts
Blood loss acute or chronic
Clinical picture: Pallor, Lack of energy, Lack of concentration, Shortness of breath
Consequences:
•Impaired growth
•Impaired cognition
How Is Iron-Deficiency Anemia Diagnosed?
-Complete blood count (CBC). Additional tests may be ordered to evaluate the levels of serum ferritin, iron, total iron-binding capacity, and/or transferrin.
-In an individual who is anemic from iron deficiency, there will be:
•Low hemoglobin (Hg) and hematocrit (Hct)
•Low mean cellular volume (MCV)
•Low ferritin
•Low serum iron (Fe)
•High transferrin or total iron-binding capacity (TIBC)
•Low iron saturation
How Is Iron Deficiency Treated?
•Even if the cause of the iron deficiency can be identified and treated, it is still usually necessary to take medicinal iron (more iron than a multivitamin can provide) until the deficiency is corrected and the body's iron stores are replenished.•Medicinal Iron
The amount of iron needed to treat patients with iron deficiency is higher than the amount found in most daily multivitamin supplements.
Dietary iron
-Iron in diet has animal source and plant source.-Animal sources: Red meat, organ meat (liver &spleen), Poultry & eggs, Fish and sea food.
-Plant sources: Beans and legumes, Molasses, Green leafy vegetables.
-Iron from animal sources have higher bioavailability than iron from plant sources.
Stunting
•Stunting is a form of Chronic Malnutrition , due to inadequate intake of energy , protein , micronutrients like calcium , zinc or iron.
•Stunting is a public health problem in the developing countries.
•Stunting is diagnosed when the child height is less than -2SD of the WHO growth charts.
Consequences of stunting
•Lack of physical power
•Poor school achievement
•Psychiatric problems
•Prone to obesity.
•If not treated grow in to short adult with less than optimum physical growth and activity, also poor school achievement affects his career life.
Diagnosis of stunting
•Anthropometry.•Biochemical tests: CBC, ionized calcium, thyroid function, stool, urine
•Clinical : A pediatrician is needed to exclude hormonal or genetic causes of stunting.
•Dietary assessment: 24 hours recall , FFQ
Treatment
•First if there is other causes rather than nutrition , treat the cause.
•Nutritional treatment:
•Supplementation is needed if the child has any deficiency.
•Balanced diet according to age is needed.
•Regular follow up.
End