By Dr. Muslim N . SaeedFamily & C. Medicine dept.
Medical Statistics \3rd stageL2-October 24th ,2021
Mathematical ((Numerical))representation of data
1- Measurements of location ((Measurement ofcentral tendency)).a) Arithmetic Mean (Average)
The most commonly used measure of central tendency.
This is the sum (Σ) of all observations divided by the
number of observation. We have:
Population Mean (μ) = Σx / N (N= No. of population)
Sample Mean (x) = Σx /n (n= No. of sample)
Advantages.
Uniqueness, only Arithmetic Mean for a giving set of data. Simplicity, easy to compute & understand.
Take in consideration all values, not ignore any one (takes into account the magnitude of each and every observation in the data).
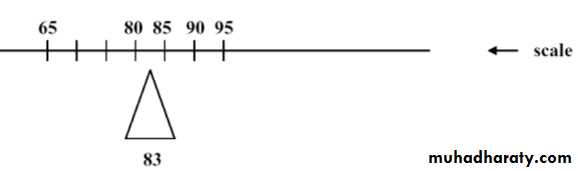
EX: Suppose data are: 90, 80, 95, 85, and 65 (n=5)
Sample mean x = 90 + 80 + 95 + 85 + 65 = 83
The mean can be thought of as a “balancing point”, “center of gravity”
Disadvantages.
Affected by the extreme values, which in some cases sodistorted that it become undesirable as a measure of
central tendency. As an EX. Of how the extreme values
may affect the mean: Suppose five physicians receive the
following charges, $95, $95, $85, and $280. The charge
for the five physicians is found to be $118, a value that is
not very representative to their charges.
The mean is the most commonly used measure of central
tendency. However, if the data has extreme values (veryhigh or very low values produce skewness in the data),
such values can pull the mean towards one side and make
it less useful. The median is less influenced by extreme
values and this makes it useful in certain epidemiological
studies where skewed distributions are studied.
Ex: Measurement results from the Forced Expiratory Volume (FEV) test in one second (in litres):
2.30, 2.15,3.50,3.60,3.50, 2.82, 4.05, 2.25,2.68, 3, 2.68, 2.85, 3.38,
The mean is calculated as:
∑ X\n = 2.93 liters .
b) Median (50th percentile, 5th deciles)
It is the value that divides the data into two equal parts(50% greater and 50% lesser than it)) giving that the
values are arranged in o ordered of magnitude.
If the number of values is odd, then the position of the
median = n+1/ 2.
If the number of values is even, then the median is taken
to be the mean of (n/2) and (n/2 +1) observations.
Advantages.
1) Uniqueness, only 1 median for a giving data.2) Simplicity, easy to calculate.
3) Not affected by the extreme values.
Disadvantages.
Didn't take in consideration all values, but only the median one.
EX: give the median of these values:
1st set of data: 5, 15, -7, 20, 25, 3, -1, 0 & -3.
2nd set of data: 7, 9, 16, -5, -9, 3, -4, & 6.
Solution: (1st set )ordered array: -7, -3, -1, 0, 3, 5, 15, 20, 25
2nd set of data : -9, -5, -4, 3, 6,7,9,16
Median position= (9+1)/2=5, i.e. the 5th reading,
median = 3 in 1st set
2nd set median order= (8/2) & (8/2) + 1 =4 & 5 so position 3 & 6, (3+6)/2= 4.5 in 2nd set.
The Median is a Better Description (than the Mean) of the
Majority When the distribution is skewed (not affected by
the extreme values).
Ex: Data are: 14, 89, 93, 95, 96
• Skewness is reflected in the outlying low value of 14• The sample mean is 77.4
• The median is 93
When do we use mean & median?
If there are extreme values in a set of data we use the median, so as not to be misled by extreme value when we use the mean.
c) Mode.
The value which occurs most frequently. Mode is notunique
If all values are different → No mode.
If one value which occur most frequently → Uni-modal.
If two values which occur most frequently → Bi-modal.
If 3 values which occur most frequently → Trimodal….
etc.
Advantages.
1) Simplicity, easy to calculate.2) Unlike mean & median, the mode can be used for qualitative data (e.g., modal diagnosis as HT, DM, IHD …..etc.).
Important to know:
If the data is homogenous, we use the mean, but if it is not, we use the median. For uni-modal frequency distribution (normal
distribution) which is symmetric: The mean = The median= The mode.
Knowing the values of the mean and median of a
distribution can provide some information on the
skewness of a distribution.
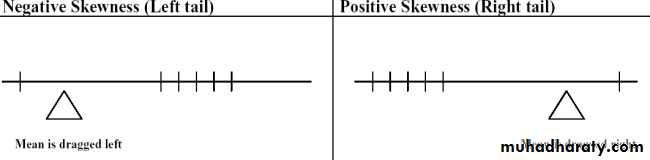
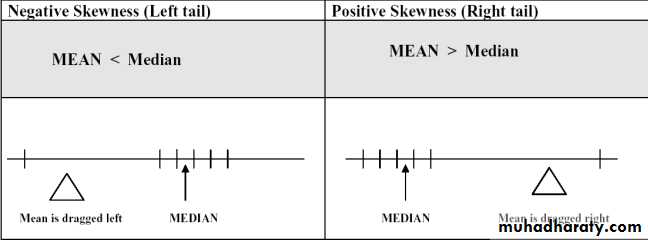
If the mean is greater than the median then: the
distribution is positively skewed; the long tail is on the high (usually right) side of the graph.
If the mean is equal to the median then: the distribution is symmetric.
If the mean is less than the median then: the distribution is negatively skewed; the long tail is on the low (usually left) side of the graph.
Measures of Central Tendency; The Weighted Mean:
The individual values in the set are weighted by their respective frequencies._ ∑ (n . X)
X w = -------------
N
20
Examples
Although the mean is often an excellent summary measure of a set of data, the data must be approximately normally distributed, because the mean is quite sensitive to extreme values that skew a distribution.Example
In an outbreak of hepatitis A, 6 persons became ill with clinical symptoms. The incubation periods for the affected persons (xi) were 29, 31, 24, 29,30, and 25 days.
_ ∑ X
X = --------- = 168/6 = 28 days
n
If the largest value of the six listed incubation periods were 131 instead of 31, the mean would change from 28.0 to ?
21
(24+25+29+29+30+25+131)/6 =44.7 days
Ex
Consider the data taken from a study that examines the response to ozone and sulfur dioxide among adolescents suffering from asthma. The following are the measurements of forced expiratory volume (liters) for 10 subjects:3.5, 2.6, 2.8, 4.0, 2.3, 2.7, 3.0, 4.0, 2.9, 3.0
Calculate the measures of central tendency.
22
Ex. 2
For the following haemoglobin values (gm/dl), find the mean, mode, and median.12, 14, 16, 15, 8, 10, 10, 13, 11, 14, 15, 10, 10, 17, 14
23
Ex. 3
A sample of 15 patients making visits to a health center traveled these distances in miles, calculate measures of central tendency:5, 9, 11, 3, 12, 13, 12, 6, 13, 7, 3, 15, 12, 15, 5
24
Ex. 4
Arterial blood gas analysis performed on a sample of 15 physically active adult males yielded the following resting PaO2 values:75, 80, 80, 74, 84, 78, 89, 72, 83, 76, 75, 87, 78, 79, 88
Calculate the measures of central tendency.
25
Group Exercise
• Mean age
• (months)
• No. of
• children
• Village
• 58
• 44
• 1
• 45
• 78
• 2
• 62
• 48
• 3
• 60
• 45
• 4
• 59
• 47
• 5
26
The mean age in months of preschool children in five villages are presented down; calculate the weighted mean of preschool children in these villages.