

1
Medicine
Fourth stage Lec-2
Dr.Jasim 27/10/2015
ECG Rhythm Interpretation
How to Analyze a Rhythm :
2
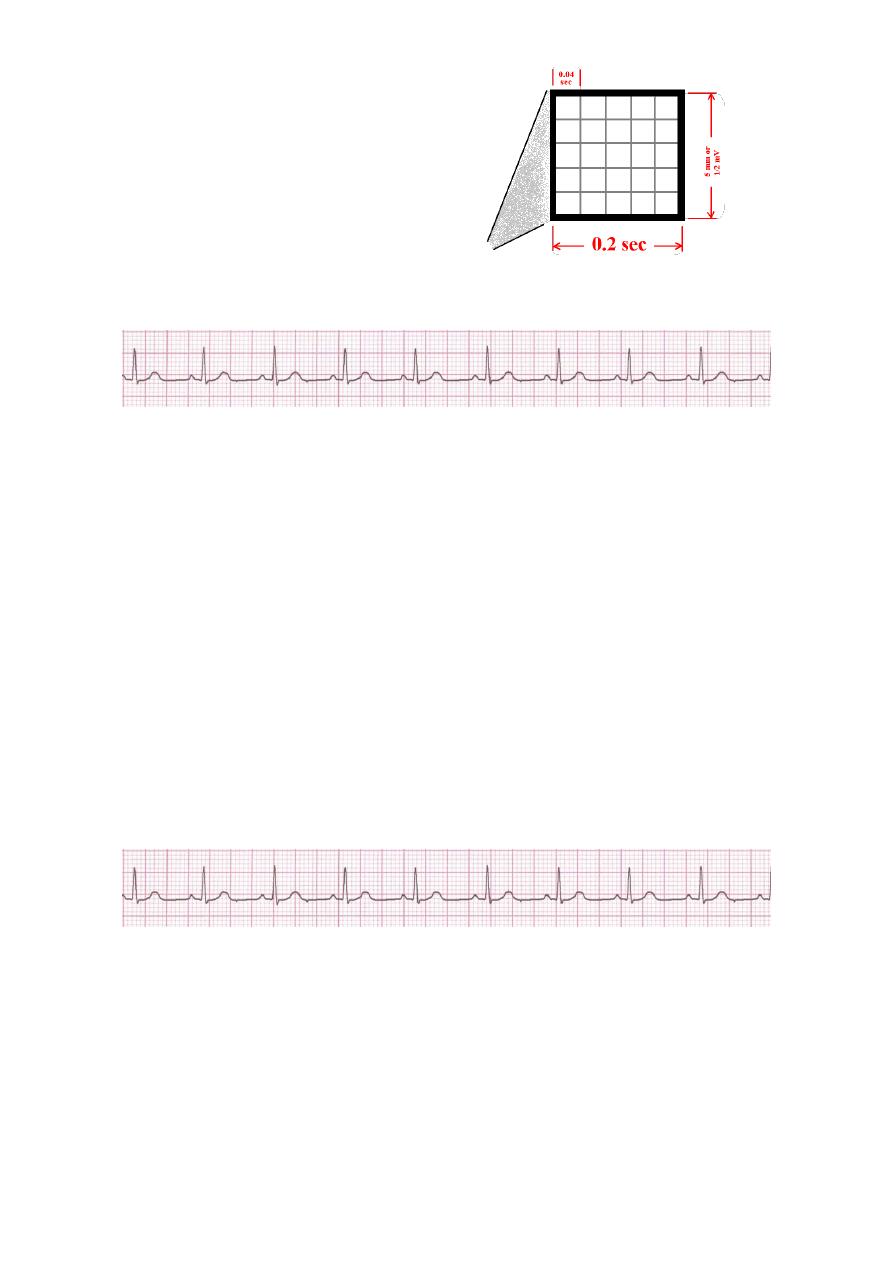
The ECG Paper :
• Horizontally
– One small box - 0.04 s
– One large box - 0.20 s
• Vertically
– One large box - 0.5 mV
Rhythm Analysis :
• Step 1: Calculate rate.
• Step 2: Determine regularity.
• Step 3: Assess the P waves.
• Step 4: Determine PR interval.
• Step 5: Determine QRS duration
• Step 6: ST -T
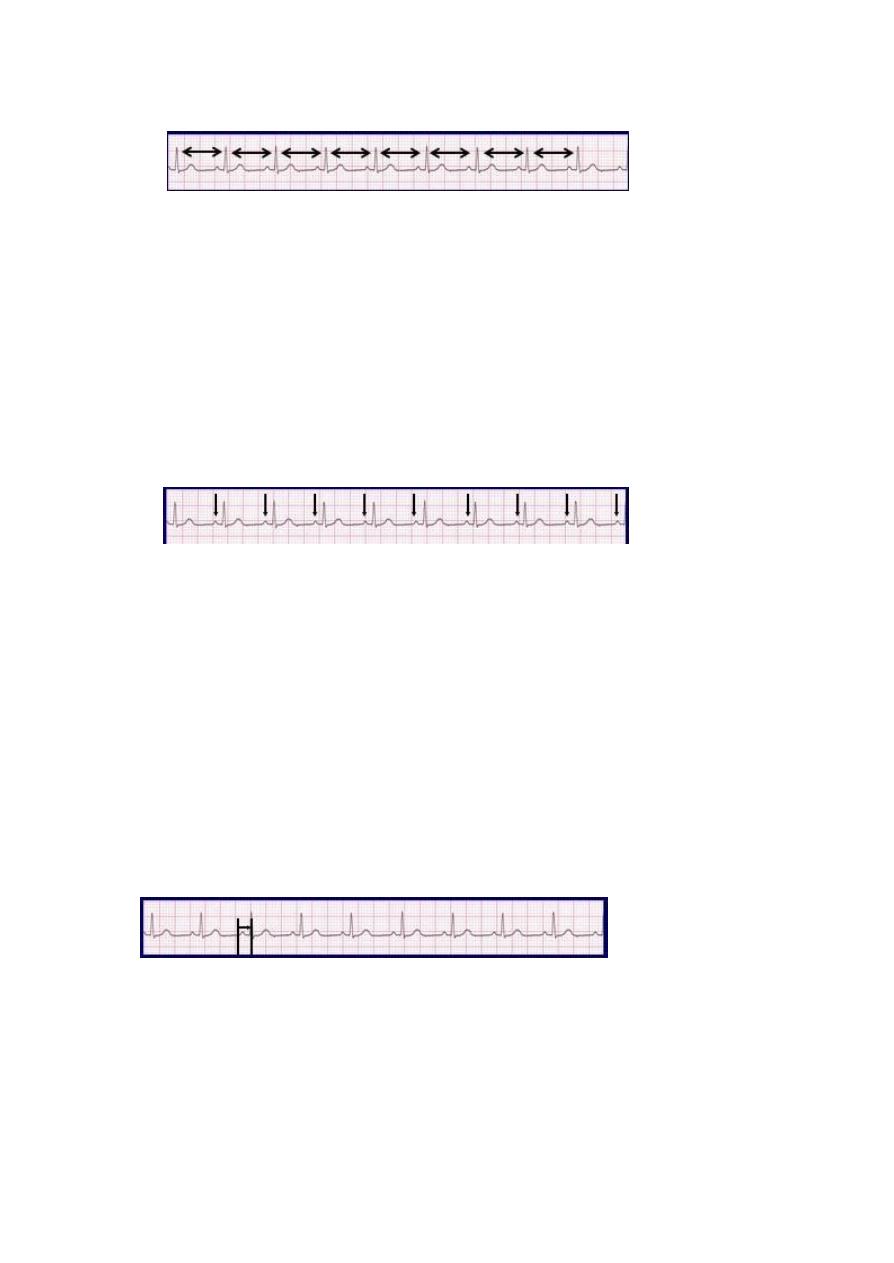
Step 1: Calculate Rate
300/No of large square between 2 R waves= 90 bpm
3
.
Step 2: Determine regularity
• Look at the R-R distances (using a caliper or markings on a pen or paper).
• Regular (are they equidistant apart)? Occasionally irregular? Regularly irregular?
Irregularly irregular?
• Interpretation? Regular
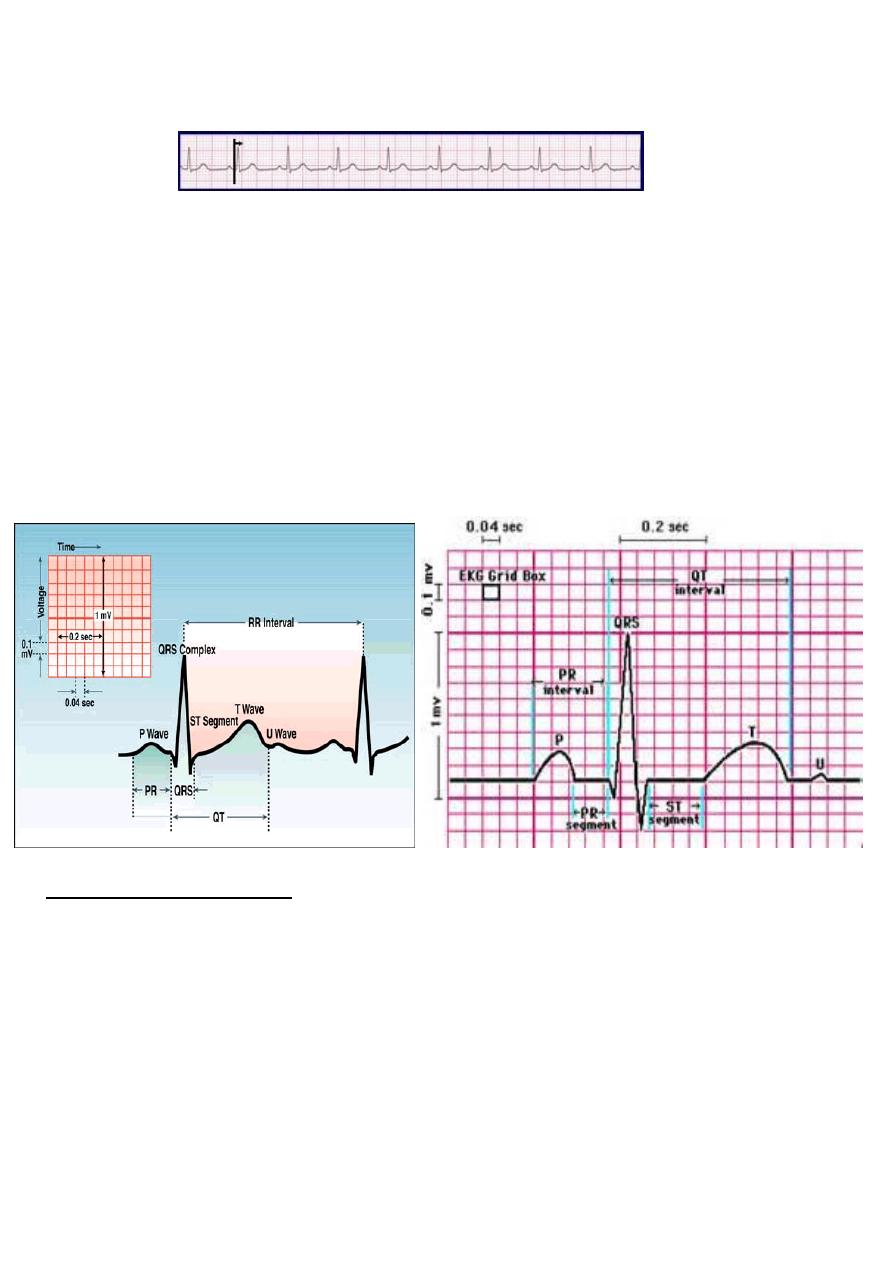
Step 3: Assess the P waves
• Are there P waves?
• Do the P waves all look alike?
• Do the P waves occur at a regular rate?
• Is there one P wave before each QRS?
• Interpretation? Normal P waves with 1 P wave for every QRS
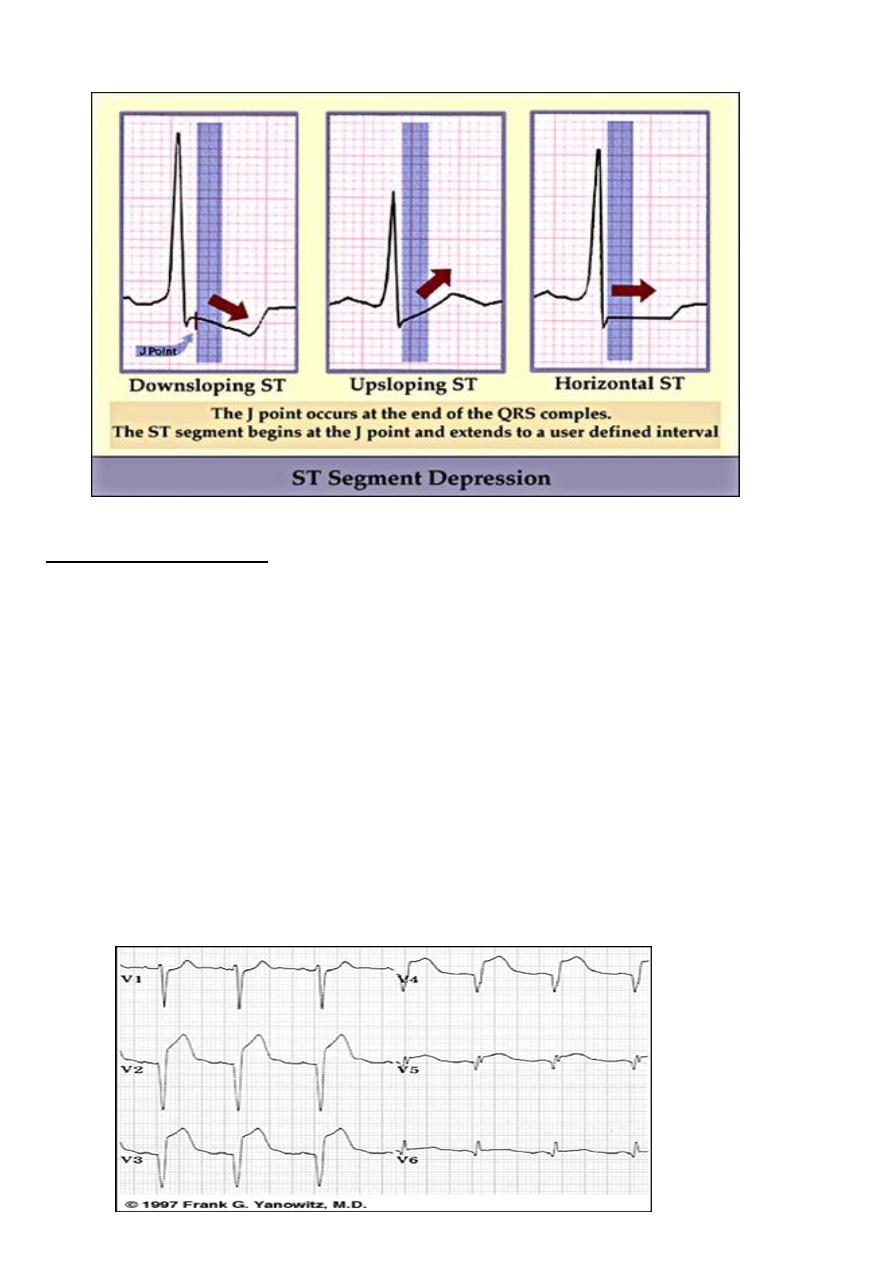
Step 4: Determine PR interval
• Normal: 0.12 - 0.20 seconds
(3 - 5 boxes)
• Interpretation? 0.12 seconds
4
.
Step 5: QRS duration
• Normal: 0.04 - 0.12 seconds.
(1 - 3 boxes)
• Interpretation? 0.08 seconds
Step 6: ST –T
ST Start from S wave till the beginning of T wave
Causes of S-T depression
IHD
Subendocardial ischemia
Non q wave MI
Reciprocal changes in acute MI
NON-ISCHEMIC CAUSES
VH, BBB, digoxine,
hypokalemia, MVP, CNS diseases
5
.
Causes of ST elevation
ST Elevation convex upward
Acute MI
Prinzmetal angina
Ventricular Aneurysm
Normal variant
ST Elevation concave upward
Pericarditis
OTHER CAUSES (LBBB,hyperkalemia)

6
.
Abnormalities of T wave
T INVERSION
MI
Ischemia
Pericarditis
Myocarditis
CNS dis
VH (strain pat.)
Digoxine
MVP
PEAKED T WAVE
Anxiety
Hyperkalemia
Rhythm Summary
• Rate 90-95 bpm
• Regularity regular
• P waves normal
• PR interval 0.12 s
• QRS duration 0.08 s
• ST -T isoelectric
Interpretation ? Normal Sinus Rhythm
Reading 12-Lead ECGs
The best way to read 12-lead ECGs is to develop a step-by-step approach (just as we did for
analyzing a rhythm strip). In these modules we present a 6-step approach:
1. Calculate RATE
2. Determine RHYTHM
3. Calculate INTERVALS
4. Determine QRS AXIS
5. Assess for HYPERTROPHY
6. Look for evidence of INFARCTION

7
.
QRS AXIS :
The QRS represents the net overall direction of the heart’s electrical activity .
abnormalities of the can hint at :
• ventricular enlargement
• Conduction blocks ( ie. Hemiblocks )
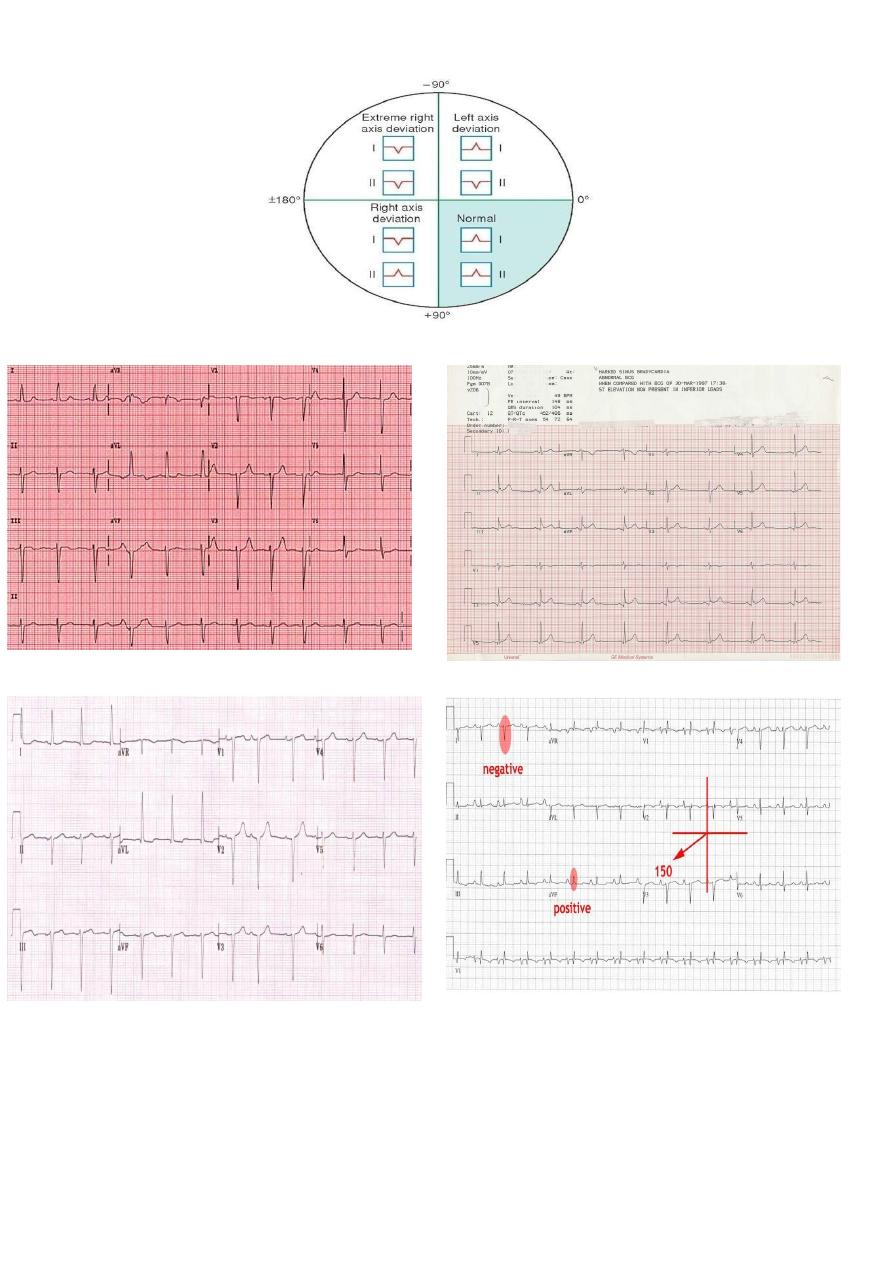
The quadrant approach
1-examin the QRS complex in lead 1 and aVF to determine if they are predominatly positive
or predominantly negative .
the combination should place the axis into of the 4 quadrants below :
5
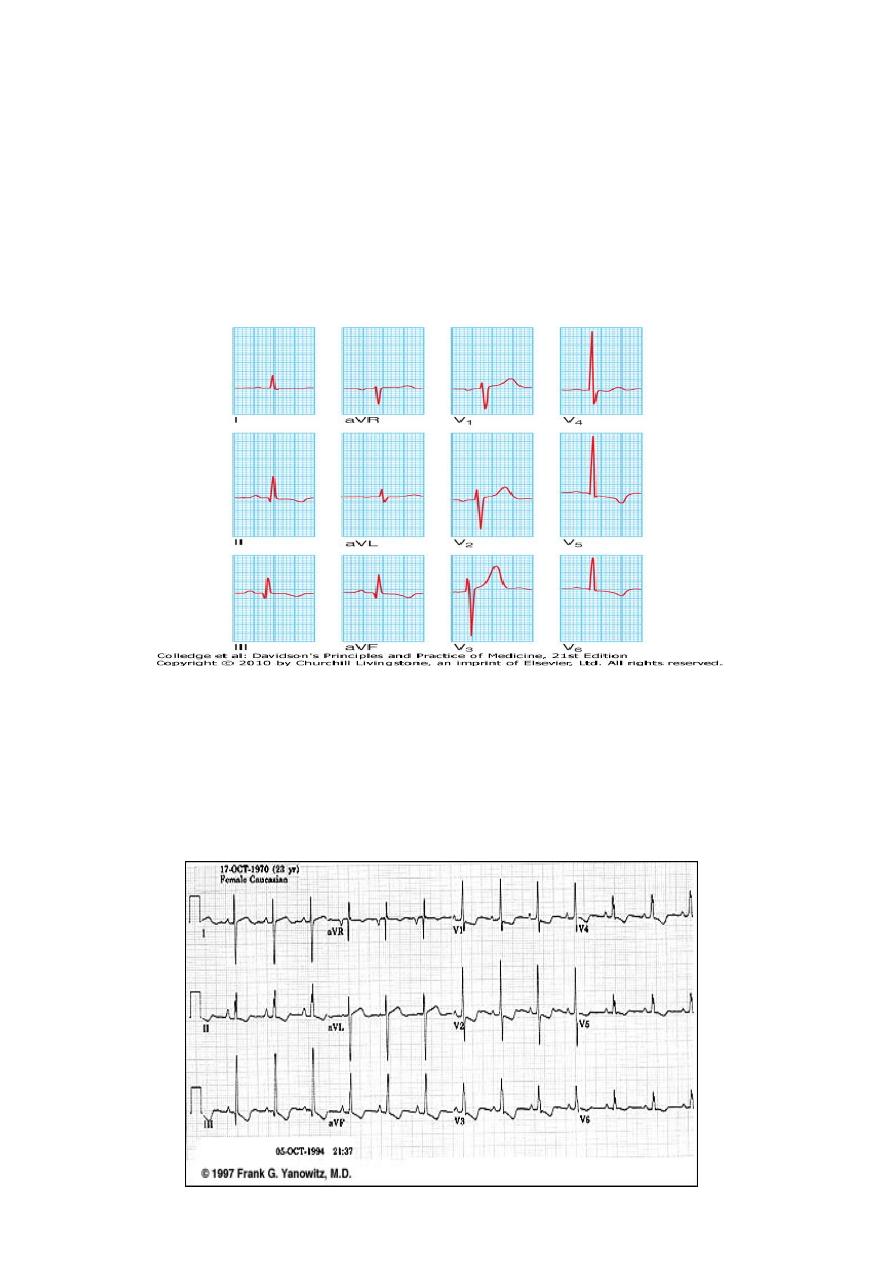
HYPERTROPHY
• LVH Sv1+Rv6>35 mm
• RVH Rv1/Sv1 >1
LVH
RVH