بسم الله الرحمن الرحيم
(وما أوتيتم من العلم إلاّ قليلاً) صدق الله العظيم 85 الإسراء
Al-Iraqia university Prof. Dr. Samia –Alshahwani
College of medicine Y1 L3 - 12- 2015
Human Biology
Ch 1 Exploring life & science
(Science and scientific study)
1.3 Science as a process
Objectives:
By the end, the student should be able to:
1. Describe the scientific method process.
2. Distinguish between a control group & experimental group.
3. Recognize the importance scientific information reporting.
Science:
Is the objective, logical & repeatable attempts to understand the principles & forces operating in the universe.Sciences are a way of knowing about the natural world.
Scientists aim to be objective, rather than subjective, objective observations are supported by factual information, whereas subjective observations involve personal judgment. e.g. Fat content of a food, would be an objective observation of a nutritional study, but reporting good or bad taste is a subjective observation. It is difficult to make objective observations & conclusions because we are often influenced by our prejudices; conclusions can change because of new findings made with advances in techniques or equipment.
Importance of Scientific Theories in Biology
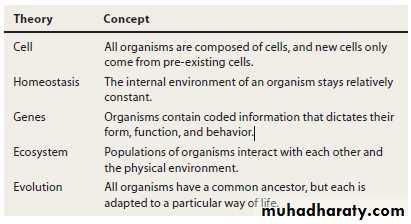
The goal of science is to understand the natural world in terms of scientific theories. Scientific theories are concepts that tell about the order and the patterns within the natural world. Some of the basic biology theories: Cell, homeostasis, Genes, ecosystem &evolution, their concepts are mentioned below:
Basic biolo
Scientific method Steps (Fig. 1.8)Scientific method: Process by which information is acquired.
1-Observations: Defining the problem you wish to explain,
Study previous data in previous researches
2-Hypothesis: falsifiable explanations for the observation
3-Experimentation: Controlled attempts to test hypotheses
4-Conclusion: The hypothesis supported or not, either modified or rejected, repeat the steps above.
5-Scientific theory: Concept based on a wide range of observations and experiments.
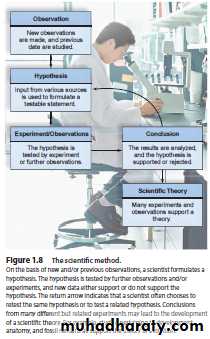
Fig. 1.8 The scientific method.
On the basis of new &/or previous observations, a scientist formulates a hypothesis. The hypothesis is tested by further observations &/or experiments, & new data either support or do not support the hypothesis. The return arrow indicates that a scientist often chooses to retest the same hypothesis or to test a related hypothesis. Conclusions from many different but related experiments may lead to the development of a scientific theory, e.g., studies pertaining to development, anatomy, & fossil remains all support the theory of evolution.Data should be interpreted honestly& results that do not fit one's preconceived biases should not be discarded or ignored in favor of data that fits one's prejudices.
A biologist who puts his own well-being first (money, popularity, position, etc.), runs the risk of faulty.
How to do a controlled study
A large number of subjects are divided randomly to groups.
The test group is exposed to an experimental variable.
A control group is given a placebo.
All groups are treated the same.
The results & written & data are presented then the study is published in a scientific journal.
Publication of Scientific Studies
Scientific studies published in scientific journal must be credible, accurate, unbiased, & well executed others may read about an experiment in a scientific journal, repeat it in a different location, and get similar results. Each article must have an informative topic, abstract, introduction including study aims, materials and methods, results, discussion, conclusion, recommendations, references & acknowledgments.Scientific Journals Versus other Sources of Information
Primary sources of information are the best if second hand sources are used carefully evaluate the source, the internet is not regulated , although URLs that end in edu, gov, and org most likely provide reliable scientific information.1.4 Scientific Study
When evaluating scientific information, it is important to consider the type of data given to support it. Anecdotal data, which consist of testimonials by individuals rather than results from a controlled study, are not considered reliable data e.g. claims from people that a particular diet helped them lose weight.Testimonial data are suspect because the effect of whatever is under discussion may not have been studied with a large number of subjects or a control group. When two events occur at the same time, one factor may not be the cause of the other. This problem happened when data largely depended on finding Helicobacter pylori at site of ulcer in its cause study. More data were needed before the scientific community concludes that Helicobacter pylori were the cause of ulcer. Similarly, that human papillomavirus (HPV) infection usually precedes cervical cancer could be viewed only as limited evidence that HPV causes cervical cancer. In this instance, HPV has turned out to be a cause of cervical cancer, but not all correlations turn out to be causations. e.g. Scientific studies do not support the well- entrenched belief that exposure to cold temperatures results in colds. Instead, we now know that viruses cause colds.
What to Look For:
To examine a scientific paper read, abstract, methods, results, conclusion & recommendations. The conclusion is authors’ data interpretation.Data presentation
Graphs
Data depicted in the form of bar graph fig. 1.10 or line graph fig. 1.11:
A graph shows the relationship between two quantities, such as the taking of an antibiotic and the disappearance of an ulcer. As in Figure 1.10, the experimental, variable (study groups) is plotted on the x-axis (horizontal), and the result (effectiveness) is plotted along the y-axis(vertical). Graphs are useful tools to summarize data in a clear and simplified manner. For example, Figure 1.10d immediately shows that antibiotic B produced the best results.
The title and labels can assist you in reading a graph; therefore,
When looking at a graph, first check the two axes to determine
What the graph pertains to, e.g. Fig. 1.11, we can see that the investigators were studying tree trunk diameters at four sites. By looking at this graph, we know that trees with the greatest diameter are found at site 2, and we can also see to what degree the tree trunk diameters differed.
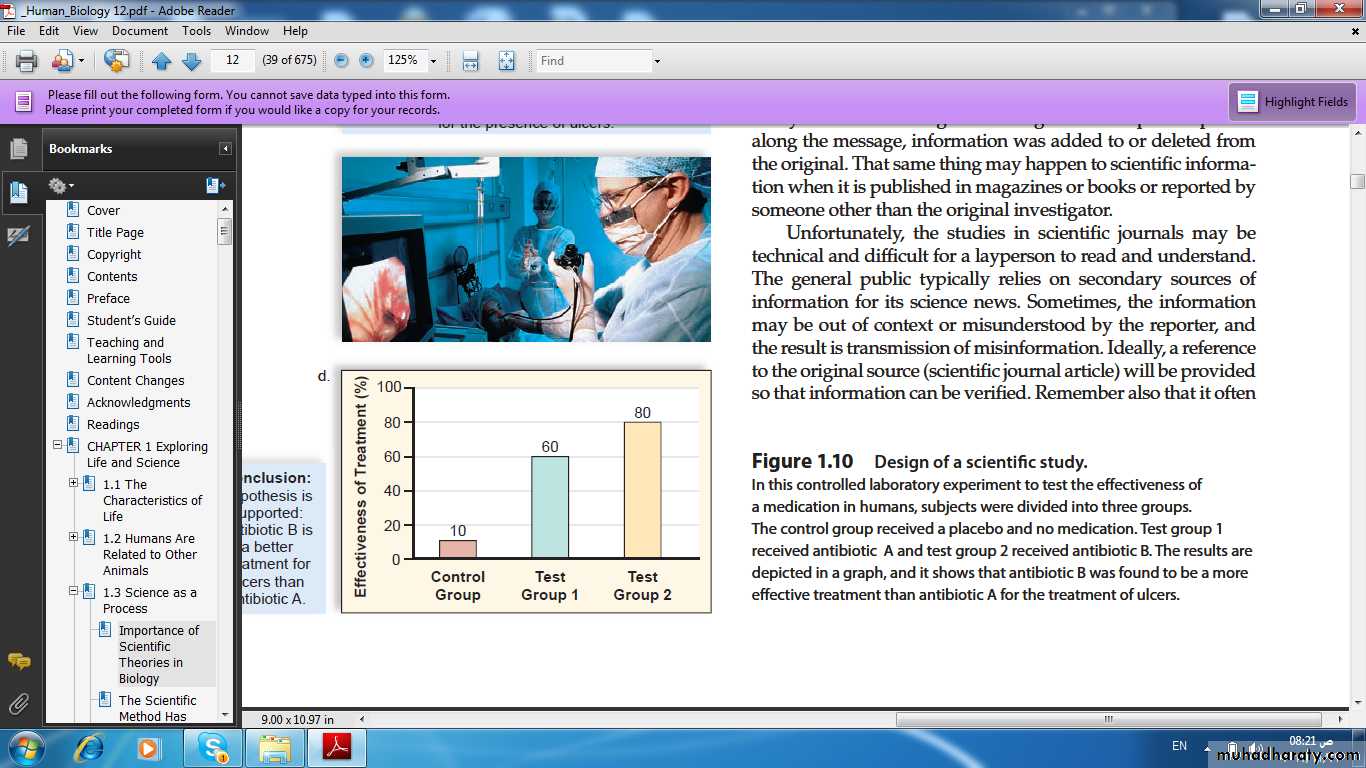
Fig. 1. 10 Design of a scientific study.
In this controlled laboratory experiment to test the effectiveness of a medication in humans, subjects were divided into three groups.The control group received a placebo and no medication. Test group 1 received antibiotic A and test group 2 received antibiotic B. The results are depicted in a graph, and it shows that antibiotic B was found to be a more effective treatment than antibiotic A for the treatment of ulcers.
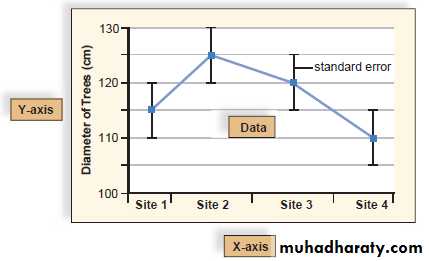
Fig. 1.11 The presentation of scientific data.
Line graph shows that the diameter of tree trunks varied at four different places. The bars above each data point represent the variation, or standard error.Statistical Data
Statistics help to evaluate the experimental data; standard error tells how uncertain a particular value is. In Fig. 1.11, the standard error is represented by the bars above and below each data point. This provides a visual indication of the statistical analysis of the data.
Statistical Significance
When you conduct an experiment, there is a possibility that the results are due to chance or due to some factor other than the experimental variable. Investigators take into account several factors when they calculate the probability value (p) that their results were due to chance alone. If the probability value is low, the results are described as statistically significant. A probability value of less than 5% (usually written as p < 0.05) is acceptable, but, even so, the lower the p value, the less likely that results is due to chance. Therefore, the lower the p value, the greater the confidence in the results. Depending on the type of study, most researchers like to have a p value of <0.05, but p values of <0.001 are common in many studies.1.5 Science and Social Responsibility
Scientific information is based on observation & experimentation, Modern technology has risks, all need to be able to make decisions regarding how and when technology should be used.Science is the driving force behind technology.
Technology is the scientific knowledge application
Science &Technology
Benefits Versus Risks
Investigations into cell structure and genes led to current time biotechnology revolution, gene manipulation is known, if you have diabetes & using insulin, it is produced by genetically modified (GM) bacteria. Despite its benefits, there are risks associated with biotechnology. Ecologists are concerned that GM crops could endanger the biosphere, e.g. farmers are planting GM cotton that produces an insect-killing toxin, and toxins may also kill the natural predators that feed on insect pests. It may not be wise to kill off friendly predatory insects.
People are now eating GM foods and foods that have been manufactured by using GM products. Some people are concerned about the possible effects of GM foods on health. In medicine, gene technology raises even more difficult ethical issues. These include whether humans should be cloned or whether gene therapy should be used to modify people inheritance, even before they are born. A current debate centers on the use of stem cells to cure human illnesses, such as spinal cord injuries or Alzheimer disease. You may not appreciate this debate until you know that early human embryos are composed only of cells called embryonic stem cells. Embryonic stem cells are genetically capable of becoming any type of tissue needed to cure a human illness. Should human embryos be dismantled & used for this purpose? It means they will never have the opportunity to become human beings.
Everyone Is Responsible:
Science, technology, & society have interacted throughout history, & scientific investigation & technology have always been affected by human values. Studying science, such as human biology, give the background needed to full participation in ethical debates. All needs to be involved in making value judgments about proper use of technology. Biodiversity, is threatened, it must be preserved. Scientists can inform & educate, but they need not bear the burden of making these decisions alone because science does not make value judgments.*This is the job of all of us.
Thanks Samia 2015