• PRESENTATION OF DATA
• Mathematical Presentation• Measures of Central Location
• Learning Objectives
• Given a set of data,• Identify the mode
• Determine the median
• Calculate the mean
• Choose which measure of central location is most appropriate for the data
• Types of Measures
• Central Location / Position / Tendency –• a single value that represents (is a good summary of) an entire distribution of data
• Spread / Dispersion / Variability –
• how much the distribution is spread or dispersed from that from its central location• Measures of Central Tendency
• Parameter:
• Descriptive measurement
• computed from data of population
• Statistic:
• descriptive measurement
• computed from data of a sample
• Measure of Central Location
• Definition: a single value that represents (is a good summary of) an entire distribution of data• Also known as:
• “Measure of central tendency” “Measure of central position”• Common measures Arithmetic mean Median
• Mode• MEAN
• Arithmetic mean:• The sum of all
• value of a set of observation divided by the number of these observations
• MEAN
• Characteristics of the Mean:
• A single value
• Simple, easy to compute
• and to
• understand
• It take in consideration all values in the set ( did not exclude any single value)
• Greatly affected by extreme value(s)
• MEAN
• Calculated by this equation:∑ x
• Mean of population
• μ =----------
• N
Obs
Age
1
27
2
27
3
28
4
28
5
28
6
29
7
29
8
29
9
29
10
30
11
30
12
30
13
30
14
30
15
31
16
31
17
32
18
34
19
36
20
37
• N = 20
• xi = 605
• 30.25
• 20
• 605
•
•
• Arithmetic Mean
• 6
• 5• 4
• 3
• 2
• 1
• 0
• 0
• 5
• 10
• 15
• 30
• 35
• 40
• 45
• 50
• 20 25
• Nights of stay
• Mean = 12.0
• Mean = 15.3
• Mean Uses All Data, So Sensitive to Outliers• 0
• 1• 2
• 3
• 4
• 5
• 6
• 0 10 20
• 30 40 50 60 70 80
• 90 100 110120 130140 150
• Nights of stay
• Numbe
• Centered distribution Approximately symmetrical Few extreme values (outliers)
• OK!• When to use the arithmetic mean?
• MEAN
• Weighted mean: the individual• values in the set are weighted by their respective frequencies.
• Median
• Definition: Median is the middle value; also, the value that splits the distribution into two equal parts• 50% of observations are below the median
• 50% of observations are above the median
• Method for identification Arrange observations in order Find middle position as (n + 1) / 2
• 1. Identify the value at the middle
• MEDIAN
• After creating ordered array (arranging data in an ascending or descending order), the median will be the middle value that divides the set of observations into two equal halves.• MEDIAN
• Characterized by:• A single value
• Simple, easy to compute , and easy to understand
• Did not take in consideration all observations
• Not affected by extreme values
• MEDIAN
• Steps in computing the median:
• Create ordered array
• Find position of the median which depends on the number of observation in the set:
• If it is odd no.:
• position of median= (n+1)/2, the median value is then specified
• MEDIAN
• If it is odd no.:• position of median= (n+1)/2, the median value is then specified
• MEDIAN
• If it is even no.• we will have 2 positions of the median:
• n/2 & n/2+1, the median will be the mean of the two middle values
• Median Observation
• Median:• Odd Number of Values
• N = 19
• =
• =
• =
N+1
• 2
• 19+1
2
• 20
2
• 10
• =
• Median age = 30 years
Obs
Age
1
• 27
2
• 27
3
• 28
4
• 28
5
• 28
6
• 29
7
• 29
8
• 29
9
• 29
10
• 30
11
• 30
12
• 30
13
• 30
14
• 30
15
• 31
16
• 31
17
• 32
18
• 34
19
• 36
• N = 20
Obs
Age
1
27
2
27
3
28
4
28
5
28
6
29
7
29
8
29
9
29
10
30
11
30
12
30
13
30
14
30
15
31
16
31
17
32
18
34
19
36
20
37
• Median Observation
• N+1
• =
• 2
20+1
• =
• 221
• =
• 210.5
• =
• Median age = Average value between 10th and 11th observation
• Median:
• Even Number of Values
30+30
2
• 30 years
• =
• Find Median of Length of Stay Data; Is Median Sensitive to Outliers?
• 0, 2, 3, 4, 5,
• 9, 9, 10, 10, 10,
• 12, 13, 14, 16, 18,
• 0, 2, 3, 4, 5,
• 9, 9, 10, 10, 10,• 12, 13, 14, 16, 18,
5, 6, 7, 8, 9,
10, 10, 11, 12, 12,
18, 19, 22, 27, 49
5, 6, 7, 8, 9,
10, 10, 11, 12, 12,• 18, 19, 22, 27, 149
• Median at 50%
• = 10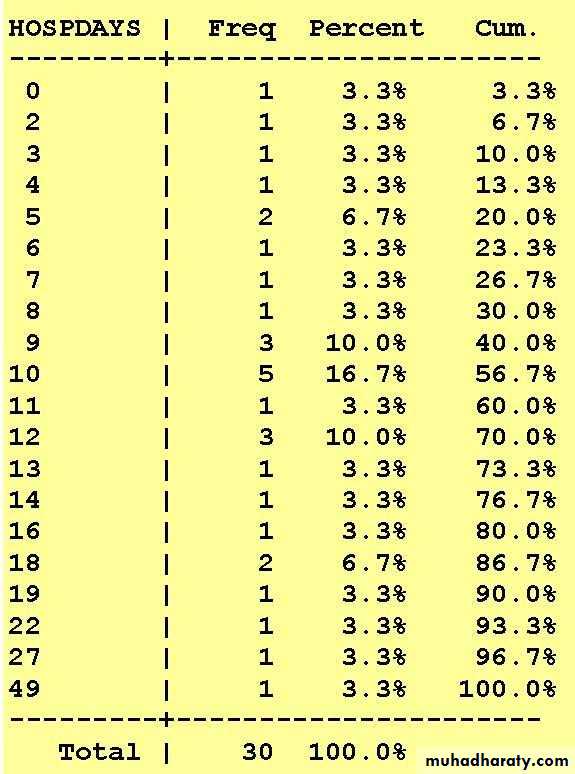
• MODE
• The most frequently occurring value in a series of observations.• Data distribution with one mode is called
• unimodal; two modes is called bimodal;
• two is called multimodal
• Sometimes the data is
• more than distribution. nonmodal
• Method for identification
• Arrange data into frequency distribution or histogram, showing the values of the variable and the frequency with which each value occurs
• Identify the value that occurs most often
• is the value
• that
• occurs
• Definition: Mode most frequently
• Mode
• MODE
• To determine the mode in a set of large number of observations, it may be mandatory to create a table showing the frequency distribution of observations values. The most frequent value will be the mode.Age
Frequency
27
2
28
3
29
4
30
5
31
2
32
1
33
0
34
1
35
0
36
1
37
1
Total
20
• Mode
• Ob s
• Age1
• 27
2
• 27
3
• 28
4
• 28
5
• 28
6
• 29
7
• 29
8
• 29
9
• 29
10
• 30
11
• 30
12
• 30
13
• 30
14
• 30
15
• 31
16
• 31
17
• 32
18
• 34
19
• 36
20
• 37
• Mode
Obs
Age
1
27
2
27
3
28
4
28
5
28
6
29
7
29
8
29
9
29
10
30
11
30
12
30
13
30
14
30
15
31
16
31
17
32
18
34
19
36
20
37
• 7
• 6
• 5
• 4
• 3
• 2
• 1
• 2
• 27 8 29 30 31 32
• 33 34 35 36 37
• The most frequent value of the variable
• Mode = 30• Age (years)
• Frequency
• Mode
• Finding Mode from Length of Stay Data
• 0, 2, 3, 4, 5, 5, 6, 7, 8, 9,• 9, 9, 10, 10, 10, 10, 10, 11, 12, 12,
12, 13, 14, 16, 18, 18, 19, 22, 27, 49
• Mode = 10
• Finding Mode from Histogram
• 6• 5
• 4
• 3
• 2
• 1
• 0
• 0
• 5
• 10
• 15
• 35
• 40
• 45
• 50
20 25 30
• Nights of stay
• Number
• Mode – Sensitive to Outliers?
• 6
• 5• 4
• 3• 2
• 1• 0
• 0 10 20• 30 40 50
• 60 70 80 90 100110120 130140150
• Nights of stay
• Number o
• Population
18
16
14
12
10
• 8
• 6
• 4
• 2
• 0
• Bimodal Distribution
• Unimodal Distribution
20
18
16
14
12
10
• 8
• 6
• 4
• 2
• 0
• Population
• Mode – Properties / Uses
• Easiest measure to understand, explain, identify
• Always equals an original value
• Insensitive to extreme values (outliers)
• •
• but poor statistical
• Good descriptive measure, properties
• May be more than one mode
• May be no mode
• Does not use all the data
• Exercise
• A sample• of 15
• patients
• making to a health
• traveled
• distances in
• visits center these miles,
• calculate
• measures of central tendency.
• Pat. no
• Distance
• (mile)(X)
• Pat. no
• Distance
• (mile)(X)
• 1
5
9
13
• 2
9
10
7
• 3
11
11
3
• 4
3
12
15
• 5
12
13
12
• 6
13
14
15
• 7
12
15
5
8
6
T
141
• ANSWER
∑ x
• • Mean= ------ = 141/15= 1.4 mile
n
• ANSWER
• Median:• Arrange data in order: 3,3,5,5,6,7,9,11,12,12,12,13,13,15,15
• Find the site of the median
• Since (n=15) is odd number, then the site of the median will be
• = n+1/2=8
• So the median is the 8th value in the ordered array =11 mile
• ANSWER
• Mode:• Create a table of frequency distribution of observations in the set:
• So the mode will be 12 mile since this value had the highest frequency
xf
3
2
5
2
6
1
7
1
9
1
11
1
12
3
13
2
15
2
Total
15
• EXERCISE:
• The mean age in months of preschool children in five villages are presented down; calculate the weighted mean of preschool children in these villages
• EXERCISE:
village• No. of children
• Mean age (months)
1
44
58
2
78
45
3
48
62
4
45
60
5
47
59
• ANSWER
• Step 1: multiply the mean age for each village by the corresponding number of children in each village and add up the totals:
• (44 X58)+ (78 X 45) + (48 X 62) + (45 X
• 60) + (47 X 59)
• =14511 months
• ANSWER
• Step• 2: divide the total cumulative age by the
• total number of children in the five villages
• 14511 14511
• • =--------------------------=------------- 44+78+48+45+47 262• =55.38 months
• Measures of Central Location – Summary• Measure of Central Location – single measure that represents an entire distribution
• Mode – most common value
• Median – central value
• Arithmetic mean – average value
• Mean uses all data, so sensitive to outliers
• Mean has best statistical properties
• Mean preferred for normally distributed data
• Median preferred for skewed data