Presentation of Data
Mathematical Presentation of DataMeasures of Dispersion
2
Quintiles, Centiles & Quartiles
A quintile is a value below which a certain proportion of observations occurred in the ordered set of data values.
A centiles are values, in a series of observations, arranged in ascending order of magnitude, which divide the distribution into 100 equal parts (10th Percentile, 3rd, 97th, and the 50th (median) percentile).
3
Quintiles, Centiles & Quartiles
Quartiles are the observations in an array that divide the distribution into four equal parts.
lower Quartile: the value below which 25% of observations lie in an ordered array
2nd quartile = Median = 50th percentile
Upper Quartile = 75th percentile
Interquartile Range: is the middle 50% of all observations
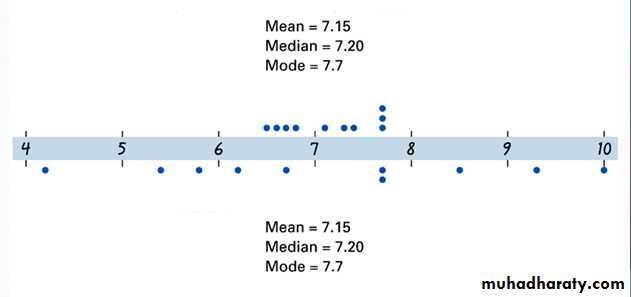
Distance travelled in miles
Villages
7.7
7.7
7.7
7.4
7.3
7.1
6.8
6.7
6.6
6.5
Village (1)
10
9.3
8.5
7.7
7.7
6.7
6.2
5.8
5.4
4.2
• Village (2)
Distance travelled in Miles
• Village (2)
• Village (1)
Measures of Central Tendency
7.15
7.15
Mean
7.2
7.2
Median
7.7
7.7
Mode
Dot plots of Distance Travelled
Even though the measures of center tendency are all the same, it is obvious from the dot plots of each group of data that there are some differences in the ‘spread’ (or variation) of the data
Village (1)
Village (2)Consider these means for weekly candy bar consumption
Mean = {7, 8, 6, 7, 7, 6, 8, 7}
= (7+8+6+7+7+6+8+7)/8= 7
Mean = {12, 2, 0, 14, 10, 9, 5, 4}
= (12+2+0+14+10+9+5+4)/8
= 7
Measures of Dispersion
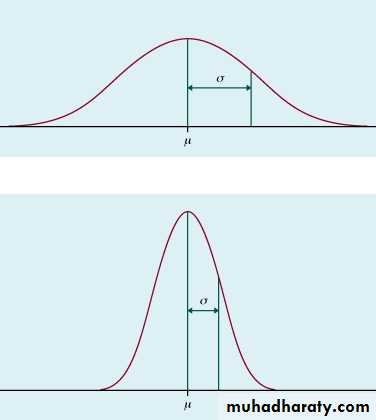
As well as measures of central tendency we need measures of how variable the data are.Dispersion is a key concept in statistical thinking.
The basic question being asked is how much do the scores deviate around the Mean?
Measures of Dispersion; These are
The range
The Variance
Standard Deviation
Standard Error
Coefficient of Variation
Measures of Dispersion; The Range
The range is an important measurement
However, they do not give much indication of the spread of observations about the mean
• Simple to calculate• Easy to understand
• It neglect all values in the center and depend on the extreme value, extreme value are dependent on sample size
• It is not based on all observations
• It is not amenable for further mathematic treatment
• should be used in conjunction with other measures of variability
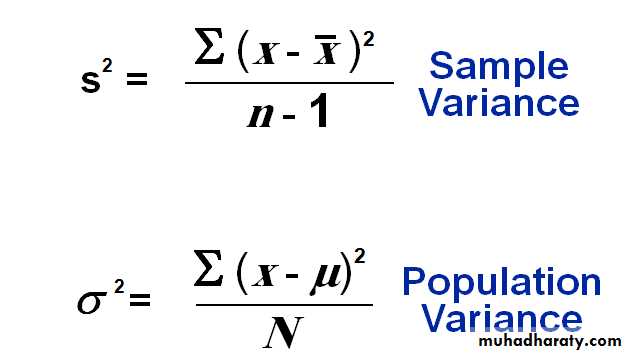
Variance:
• The mean sum of squares of the deviation from the mean.• e.g. if the data is: 1,2,3,4,5.
• The mean for these data=3
• the difference of each value in the set from the mean:
• 1-3= -2
• 2-3= -1
• 3-3= 0
• 4-3= 1
• 5-3= 2
• The summation of the differences =zero
• Summation of square of the differences is not zero
The Variance
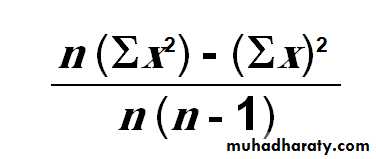
Another formula for the variance
Variance can never be a negative valueAll observations are considered
The problem with the variance is the squared unitThe standard deviation is the square root of the variance
The standard deviation measured the variability between observations in the sample or the population from the mean of that sample or that population.The unit is not squared
SD is the most widely used measure of dispersion
Standard Error of the mean(SE)
• It measures the variability or dispersion of the sample mean from population mean• It is used to estimate the population mean, and to estimate differences between populations means
• SE=SD/√ n
Coefficient of variation (CV):
• It expresses the SD as a percentage of the mean• CV= (S /mean) x 100 (mean of the sample)
• It has no unit
• It is used to compare dispersion in two sets of data especially when the units are different
• It measures relative rather than absolute variation
• It takes in consideration all values in the set
Group Work
A sample of 15 patients making visits to a health center traveled these distances in miles, calculate measures of Dispersion.• Distance
• (mile)(X)
• Pat. no
• Distance
• (mile)(X)
• Pat. no
• 13
• 9
• 5
• 1
• 7
• 10
• 9
• 2
• 3
• 11
• 11
• 3
• 15
• 12
• 3
• 4
• 12
• 13
• 12
• 5
• 15
• 14
• 13
• 6
• 5
• 15
• 12
• 7
• 141
• T
• 6
• 8
• Group 1 Exercise (1)
Group 1 Exercise (2)
Calculate the measures of dispersion for 16 fasting blood glucose levels (mmol/l) In a series of 15 patients which were recorded as follows:
5·8, 4·3, 25·9, 5·2, 6·1, 3·9, 4·4, 5·6, 5·3, 4·5, 4·6, 3·8, 5·1, 5·4, 4·6
Group 1 Exercise (3)
Calculate the measures of dispersion in a series of 20 patients from a renal unit, whom hemoglobin levels (mg/dl) were recorded as follows:8·4, 11·9, 6·3, 8·2, 9·5, 9·0, 7·6, 9·0, 10·1, 9·8, 8·9, 10·4, 7·6, 8·8, 11·5, 10·6, 8·2, 8·7, 9·0, 8·8
Group 1 Exercise (4)
A sample of 11 patients admitted to a psychiatric ward experienced the following lengths of stay, calculate measures of dispersion.• length
• No.• Length
• No.
• 28
• 7
• 29
• 1
• 14
• 8
• 14
• 2
• 18
• 9
• 11
• 3
• 22
• 10
• 24
• 4
• 14
• 11
• 14
• 5
• total
• 14
• 6


