
A BEGINNER’S
GUIDE TO
BLOOD CELLS

2
nd
Edition
Barbara J. Bain
MB BS FRACP FRCPath
Reader in Diagnostic Haematology,
Department of Haematology
St Mary’s Hospital Campus, Imperial College,
St Mary’s Hospital,
London
A Beginner’s
Guide to
Blood Cells

© 1996, 2004 by Blackwell Publishing Ltd
Blackwell Publishing, Inc., 350 Main Street, Malden, Massachusetts 02148-5020, USA
Blackwell Publishing Ltd, 9600 Garsington Road, Oxford OX4 2DQ, UK
Blackwell Publishing Asia Pty Ltd, 550 Swanston Street, Carlton, Victoria 3053,
Australia
The right of the Author to be identified as the Author of this Work has been asserted
in accordance with the Copyright, Designs and Patents Act 1988.
All rights reserved. No part of this publication may be reproduced, stored in a
retrieval system, or transmitted, in any form or by any means, electronic,
mechanical, photocopying, recording or otherwise, except as permitted by the UK
Copyright, Designs and Patents Act 1988, without the prior permission of the
publisher.
First published 1996
Second edition 2004
Library of Congress Cataloging-in-Publication Data
Bain, Barbara J.
A beginner’s guide to blood cells / Barbara J. Bain. – 2nd ed.
p.
; cm.
Includes index.
ISBN 1-4051-2175-0
1. Hematology–Handbooks, manuals, etc. 2. Blood cell–Handbooks, manuals, etc.
[DNLM: 1. Blood Cells–physiology–Handbooks. 2. Blood Cells Count–methods–
Handbooks. 3. Blood Cells–pathology–Handbooks. WH 39 B 162b 2004] I. Title.
RB45.B268 2004
616.1
¢5–dc22
2004001756
ISBN 1-4051-2175-0
A catalogue record for this title is available from the British Library
Set in 9.5 on 13 pt Trump by SNP Best-set Typesetter Ltd., Hong Kong
Printed and bound in India by Replica Press Pvt. Ltd.
For further information on Blackwell Publishing, visit our website:
http:/www.blackwellpublishing.com
The publisher’s policy is to use permanent paper from mills that operate a sustaina-
ble forestry policy, and which has been manufactured from pulp processed using acid-
free and elementary chlorine-free practices. Furthermore, the publisher ensures that
the text paper and cover board used have met acceptable environmental accreditation
standards.

Contents
Preface, vii
Abbreviations, ix
1 The Blood Film and Count, 1
2 Assessing Red Cells, 29
3 Assessing White Cells and Platelets, 45
4 Haematological Findings in Health and Disease, 56
5 Self-assessment, 98
Index, 117
v

Preface
A Beginner’s Guide to Blood Cells
is an introduction to normal
and abnormal blood cells and blood counts for trainees, whether
they be trainee laboratory scientists, medical students, trainee
haematologists or trainee physicians. It may be seen as comple-
mentary to Blood Cells: a Practical Guide (3
rd
Edn., Blackwell
Science, Oxford, 2003), from which the illustrations are drawn.
Unlike Blood Cells, A Beginner’s Guide does not seek to be
comprehensive. It introduces the important basic concepts, sets
haematological findings in a clinical context and, in the final
chapter, lets the reader test his or her own knowledge.
All photographs are of blood films stained by May–Grünwald–
Giemsa (MGG) stain and all have been taken at the same magni-
fication so that they can be readily compared with each other.
Barbara J. Bain
2004
vii

ix
Abbreviations
dl
Decilitre
DNA
Deoxyribonucleic acid
FBC
Full blood count
fl
Femtolitre
G6PD
Glucose-6-phosphate dehydrogenase
Hb
Haemoglobin concentration
Hct
Haematocrit
HDW
Haemoglobin distribution width
MCH
Mean cell haemoglobin
MCHC
Mean cell haemoglobin concentration
MCV
Mean cell volume
MGG
May–Grünwald–Giemsa
HPLC
High performance liquid chromatography
NRBC
Nucleated red blood cell
PCV
Packed cell volume
pg
Picogram
RBC
Red blood cell count
RDW
Red cell distribution width
RNA
Ribonucleic acid
WBC
White blood cell count

1
CHAPTER 1
The Blood Film
and Count
Blood
Blood is a life-sustaining fluid which circulates through the heart
and blood vessels. It carries oxygen and nutrients to the tissues
and waste products to the lungs, liver and kidneys, where they
can be removed from the body. Usually when blood is removed
from the body it forms a solid blood clot. However, if clotting is
prevented by mixing with an anticoagulant, the blood separates,
under the influence of gravity, into three layers (Fig. 1.1). The
bottom layer is deep red in colour and is composed of red cells.
The top layer is clear and pale yellow. It is called plasma and is
composed of various salts and proteins dissolved in water. In
between is a narrow layer called the buffy coat because of its buff
or yellowish white colour. The buffy coat is composed mainly of
cells of a variety of types, collectively known as white cells. In
addition there are small cellular fragments, called platelets,
which have a role in blood clotting.
The blood film
Although we can judge the proportions of red cells and white
cells in a tube of sedimented blood, we get far more information
if the blood is carefully mixed and a thin layer is spread on a glass
slide to form a blood film. The blood cells are then preserved by
exposure to the alcohol methanol, a process known as fixation.
The fixed film of blood is stained with a mixture of several dyes
so that the individual cells can be recognized when they are
examined with a microscope. After staining, the colour of red
A Beginner’s Guide to Blood Cells, 2nd Edition
Barbara J. Bain
Copyright © 1996, 2004 by Blackwell Publishing Ltd
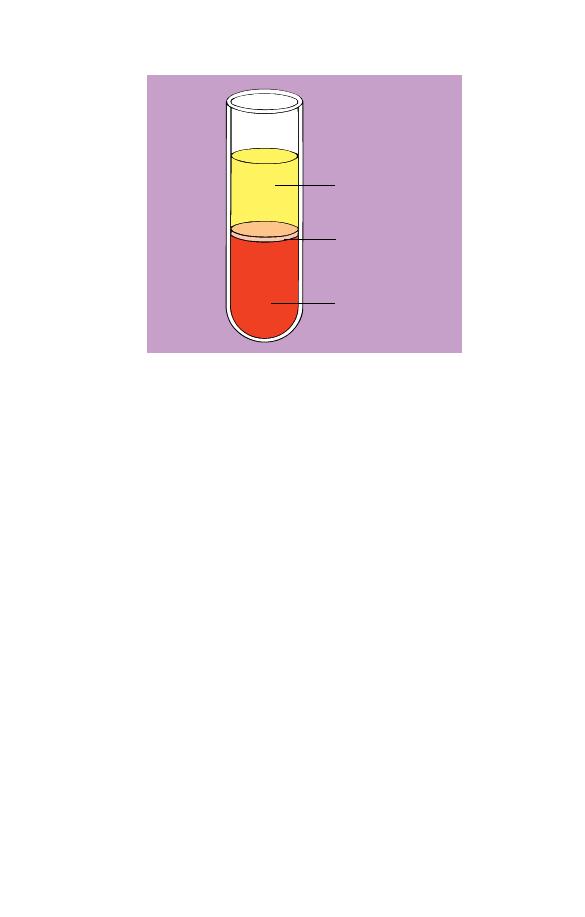
Plasma
Buffy coat
Red cells
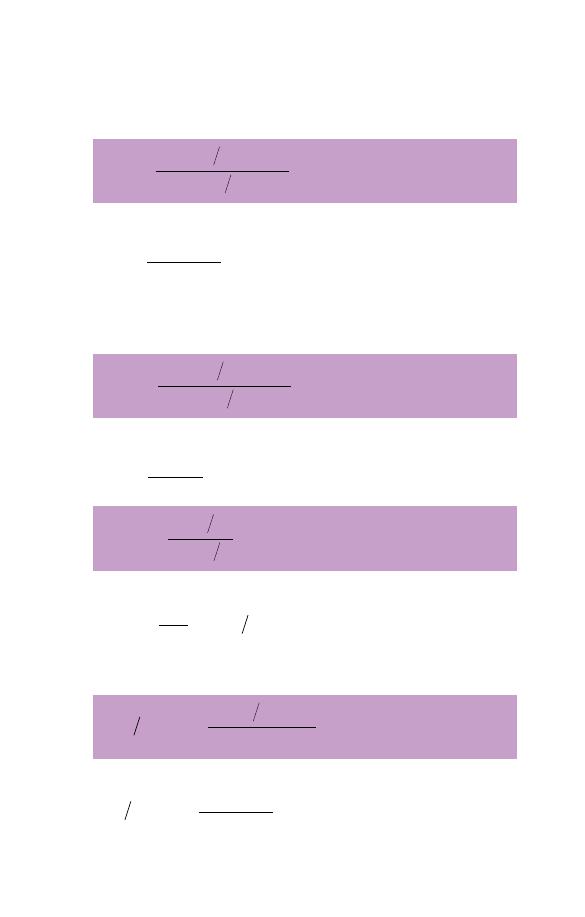
Fig. 1.1 Diagram of a tube of anticoagulated blood which has been allowed
to sediment, showing the separation of blood into red cells, a buffy coat
(white cells and platelets) and plasma.
cells is enhanced and the white cells and platelets, which would
otherwise be transparent and colourless, have acquired a variety
of colours which allow their detailed structure to be recognized.
One of the commonest mixtures of dyes used to stain blood cells
is the May–Grünwald–Giemsa (MGG) stain, named after its in-
ventors. All the photographs in this book are of MGG-stained
blood films.
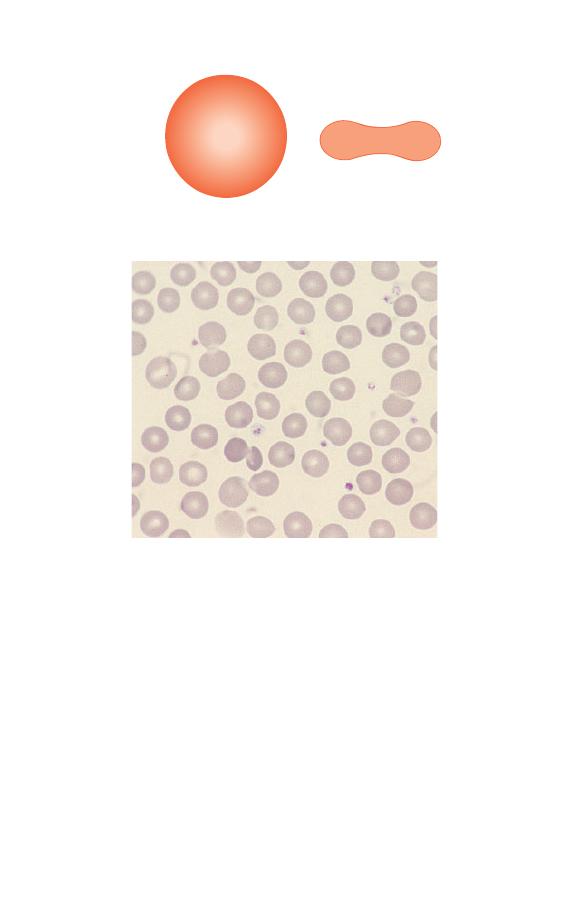
Red cells
The most numerous cells in a blood film are the red cells, also
known as erythrocytes. Normal red cells are disc-shaped but are
thinner in the centre (Fig. 1.2). As a consequence, on a stained
blood film, they have a circular outline and a paler central area
(Fig. 1.3). Red cells owe their pinkish-brown colour to the pres-
ence of a complex protein, haemoglobin, which is their major
constituent. Enhancement of their colour in a stained film is
because haemoglobin takes up eosin, one of the dyes of the MGG
stain. In the body it is haemoglobin of the red cells which, in the
2
Chapter 1
lungs, combines with oxygen from inspired air and transports it
to tissues where it is needed for the metabolic processes supply-
ing the energy needs of the body. Mature red cells in humans
(although not in some other species) differ from most body cells
in that they do not have a nucleus. Red cells are produced in the
bone marrow and usually lose their nuclei when they are re-
leased into the blood stream.
Fig. 1.2 A diagram of a red cell viewed from above and in cross-section.
Fig. 1.3 Normal red cells (erythrocytes) showing little variation in size and
shape, an approximately round outline and a small area of central pallor in
some of the cells. The small lilac-staining structures between the red cells
are platelets.
The Blood Film and Count
3
White cells
In healthy people there are at least five types of white cell
or leucocyte in the circulating blood. Unlike red cells, white
cells have retained their nuclei. The cell is therefore made
up of a nucleus and cytoplasm. The cytoplasm is the site of
protein synthesis and other cellular functions. The nucleus is
composed of chromatin, which is mainly deoxyribonucleic
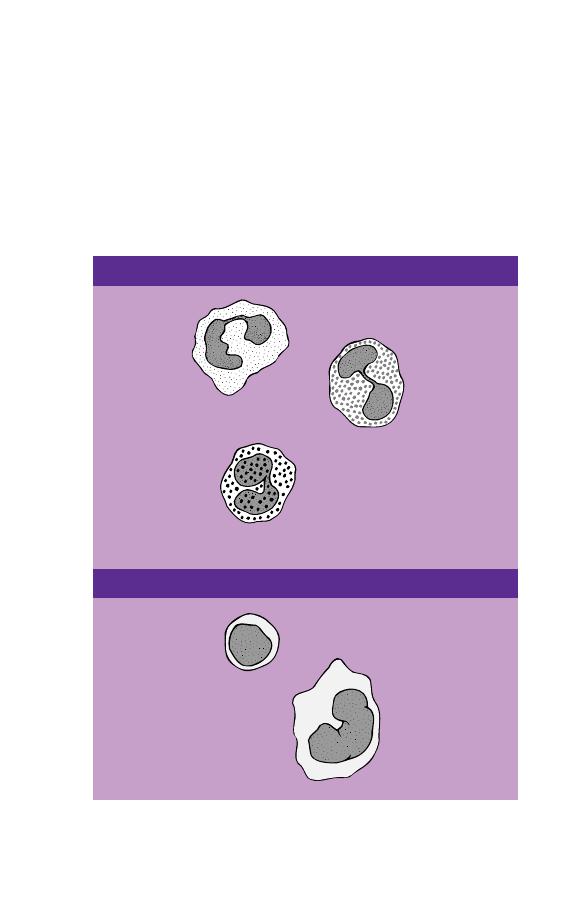
Fig. 1.4 A diagram showing how white cells are classified.
Neutrophil
Eosinophil
Basophil
Lymphocyte
Monocyte
MONONUCLEAR CELLS
GRANULOCYTES OR POLYMORPHONUCLEAR LEUCOCYTES
4
Chapter 1
acid (DNA), carrying genetic messages. Genetic messages are
transmitted from the nucleus to the cytoplasm by ribonucleic
acid (RNA).
White cells are divided into granulocytes (also known as poly-
morphonuclear leucocytes) and mononuclear cells. There are
three types of granulocyte and two types of mononuclear cell
(Fig. 1.4). The names are not very logical but they have been in
use for a long time and are generally accepted. Granulocytes are
so named because their cytoplasm contains prominent granules.
However, monocytes also have granules and so do some lympho-
cytes. The term polymorphonuclear leucocyte refers to the very
variable nuclear shape which is typical of granulocytes. The term
mononuclear cell means that the cell has only a single nucleus.
However, this is true of granulocytes, as well as of the cells
conventionally referred to as mononuclear. The functions of the
various leucocytes are summarized in Table 1.1.
Neutrophils
Neutrophils (Fig. 1.5) have a nucleus which stains purple and is
divided into two to five segments or lobes. The lobes are sep-
arated by a thin strand or filament of nuclear material. The
nuclear chromatin is heterogeneous with some clumping. The
cytoplasm of neutrophils is very pale blue and is packed
with fine lilac-staining granules. The granules are referred to as
Fig. 1.5 A normal neutrophil with a bilobed nucleus and cytoplasm
containing delicate lilac-staining granules. The other nucleated cell is a
small lymphocyte.
The Blood Film and Count
5

Table 1.1 The functions of leucocytes.
Cell
Major function
Neutrophil
Is attracted to sites of infection by a process known as
chemotaxis; ingests micro-organisms (a process known
as phagocytosis) and destroys them
Eosinophil
The same functions as the neutrophil; in addition, helps
control parasitic infections; has a role in allergic
responses
Basophil
Has a role in immediate hypersensitivity reactions,
allergic and inflammatory responses and in the control
of parasitic infections
Lymphocyte
Mediates
B lymphocyte matures into a plasma cell,
immune
which secretes antibodies (humoral
responses
immunity)
T lymphocyte attacks cells bearing foreign
antigens and antibody-coated cells; can help
or suppress B cells (part of cell-mediated
immunity)
Natural killer lymphocyte (NK cell) attacks
foreign cells and tumour cells (part of cell-
mediated immunity)
Monocyte
Phagocytoses and kills micro-organisms including
mycobacteria and fungi, phagocytoses cells or
organisms that have bound immunoglobulin or
complement and phagocytoses dead and damaged cells;
presents antigen to cells of the immune system;
migrates to tissues where it differentiates, to become a
long-lived phagocytic and antigen-presenting cell
known as a macrophage
neutrophilic because they owe their colour to uptake of both
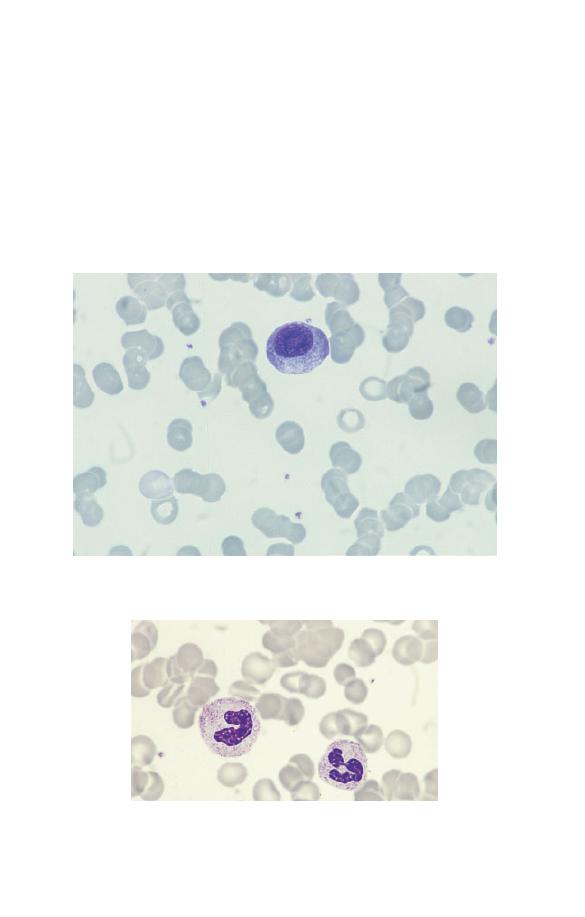
the acidic and the basic components of the stain. In females a
proportion of the neutrophils have a very small lobe, known as a
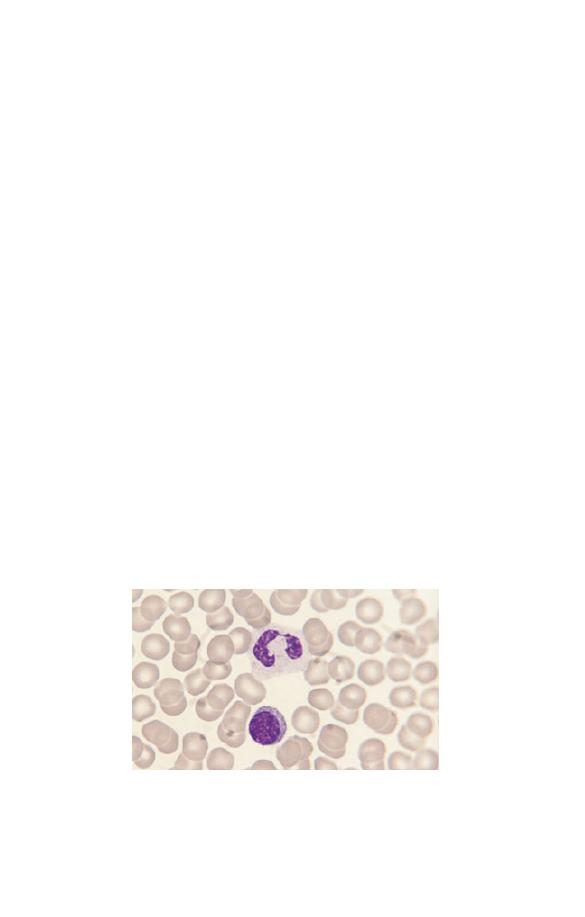
‘drumstick’, protruding from the nucleus (Fig. 1.6). It represents
the inactive X-chromosome of the cell.
Neutrophils are produced in the bone marrow. They spend
6–10 hours in the blood stream before moving from capillaries
into tissues. The major function of neutrophils is as tissue
phagocytes. They move preferentially to sites of infection or
inflammation where they ingest, kill and break down bacteria.
The process of moving to sites of infection or inflammation
6
Chapter 1
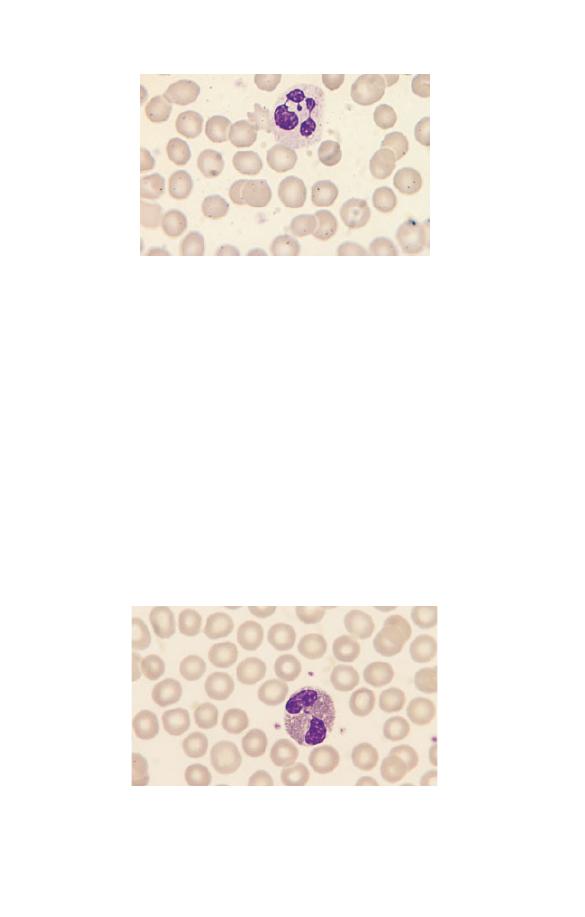
Fig. 1.6 A normal neutrophil from a female showing a nucleus with four
lobes and a ‘drumstick’.
is known as chemotaxis and occurs in response to activated
complement components and chemical signals released by a
variety of cells. The process of ingesting bacteria is known as
phagocytosis.
Eosinophils
Eosinophils (Fig. 1.7) have a nucleus that is usually bilobed
and pale blue cytoplasm, which is packed with large refractile,
orange–red granules. The granules are referred to as eosinophilic
because they take up the acidic dye eosin. Eosinophils are pro-
duced in the bone marrow and circulate in the blood stream for
Fig. 1.7 A normal bilobed eosinophil. The granules are reddish-orange and
pack the cytoplasm.
The Blood Film and Count
7
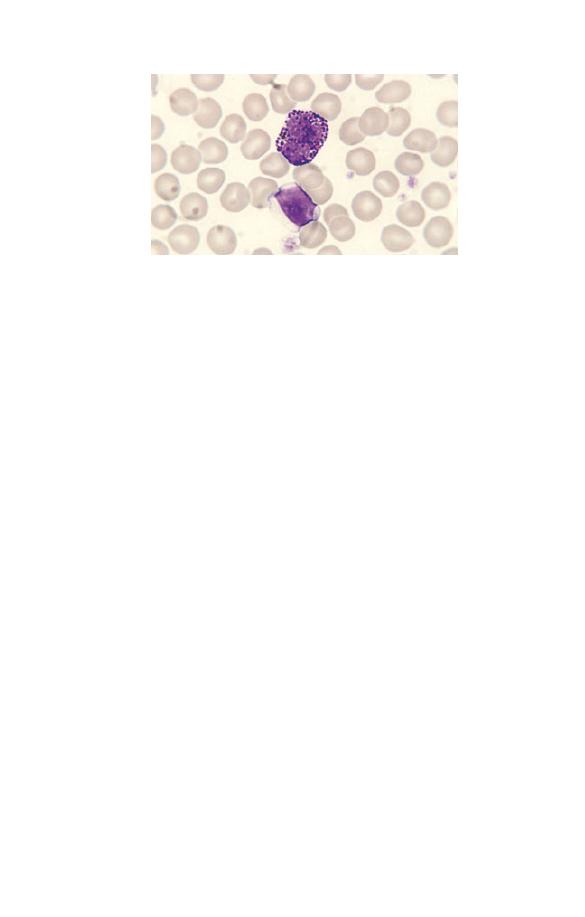
Fig. 1.8 A normal basophil. The nucleus has three lobes. The cytoplasm is
packed with large purple granules. (The lower cell is a lymphocyte.)
about 6 hours before migrating to tissues. They respond to
chemotactic stimuli, are phagocytic and can kill ingested organ-
isms. They are important in the body’s defences against tissue
parasites, being able to discharge their granule contents
extracellularly, seriously damaging large parasites. Eosinophils
are also involved in allergic reactions.
Basophils
Basophils (Fig. 1.8) have a lobulated nucleus, which is often
obscured by the large purple-staining granules which pack the
very pale blue cytoplasm. The granules are referred to as
basophilic because they take up basic components of the stain
(such as methylene blue). In fact they stain metachromatically
with basic stains, i.e. the granules react with a blue dye to
produce a purple colour. Basophils are produced in the bone
marrow and circulate in the blood in small numbers before
migrating to tissue. They have a role in allergic and inflamma-
tory responses.
Lymphocytes
Lymphocytes are the second most numerous circulating white
cell after neutrophils. They are smaller than granulocytes with
a round or somewhat irregular outline and pale blue, clear
8
Chapter 1
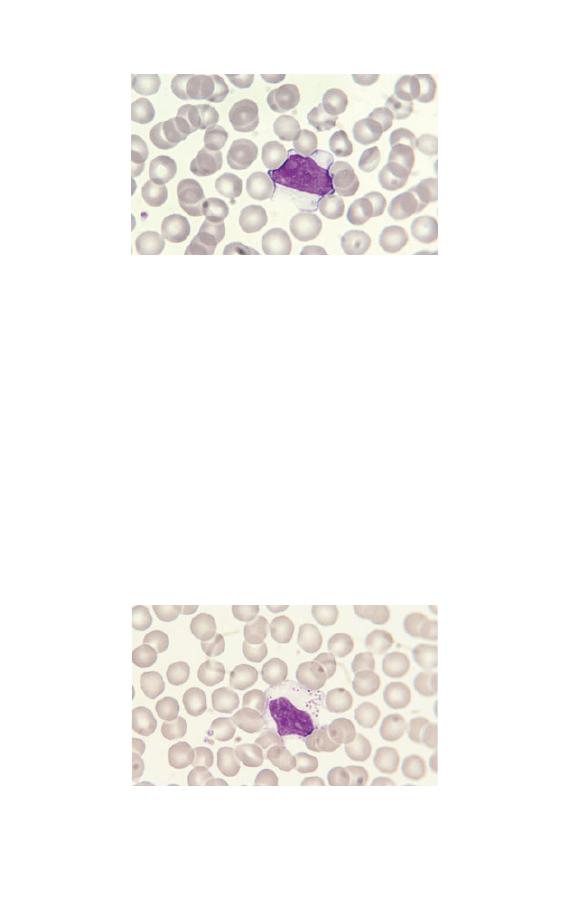
Fig. 1.9 A large lymphocyte with a less densely staining nucleus than
occurs in a small lymphocyte and more plentiful pale blue cytoplasm.
A nucleolus is apparent, top left in the nucleus.
Fig. 1.10 A large granular lymphocyte showing a moderate number of
prominent azurophilic granules in clear cytoplasm.
cytoplasm. Some lymphocytes have a variable number of az-
urophilic (pinkish-purple) granules. Lymphocytes are divided
into three morphological categories, depending on their size, the
amount of cytoplasm and the presence or absence of cytoplasmic
granules. These categories are small lymphocyte (Fig. 1.5),
large lymphocyte (Fig. 1.9) and large granular lymphocyte
(Fig. 1.10). Small lymphocytes are most numerous. The nuclear
chromatin of lymphocytes may be dense and homogeneous
(particularly in small lymphocytes) or more lightly staining and
somewhat heterogeneous (particularly in large lymphocytes).
The Blood Film and Count
9

Occasional normal lymphocytes show a discrete but ill-defined
paler structure within the nucleus, which is the nucleolus.
Lymphocytes are produced from lymphoid stem cells in the
bone marrow and probably the thymus. Their function is in
tissues such as lymph nodes, spleen, tonsils and the lymphoid
tissue associated with mucous membranes. They circulate in the
blood stream, enter lymphoid tissues and emerge again from
lymphoid tissues into lymphatic channels, where they form one
constituent of a clear fluid known as lymph. Lymphatics drain
into the thoracic duct and ultimately into the blood stream.
This process of continuing movement between tissues and the
blood stream is known as lymphocyte recirculation. Lympho-
cytes function in the body’s immune responses. They are divided
into three functional types: B cells, T cells and natural killer
(NK) cells. B cells differentiate in tissues into plasma cells,
which secrete antibodies, thereby providing humoral immunity.
T cells function in cell-mediated immunity as do NK cells. T
cells also modulate B cell function. The functional categories of
lymphocyte show little correlation with morphological cate-
gories except that large granular lymphocytes are either T cells
or NK cells. However, other T cells cannot be distinguished
morphologically from B cells. The functional categories of
lymphocytes are of far more importance than the morphological
categories.
Monocytes
Monocytes (Fig. 1.11) are the largest normal blood cells. They
have lobulated nuclei and voluminous cytoplasm which is grey-
ish-blue, is sometimes opaque and may be vacuolated or contain
fine azurophilic granules.
Monocytes have an intravascular life span of several days.
They function mainly in tissues where they differentiate into
long-lived macrophages (sometimes called histiocytes). Mono-
cytes and macrophages respond to chemotactic stimuli and are
phagocytic. They are part of the body’s defences against bacterial
and fungal infections and also ingest and break down dead
and dying body cells. They present antigen to lymphocytes.
10
Chapter 1

Fig. 1.11 A monocyte, showing a lobulated nucleus and voluminous,
opaque cytoplasm containing very fine azurophilic granules. Several
platelets are also visible. (Monocytes should not be confused with large
granular lymphocytes. Lymphocytes have clear, pale blue cytoplasm and
discrete, sometimes prominent granules whereas monocytes usually have
more opaque, grey–blue cytoplasm with very fine granules.)
They secrete chemical messengers, known as cytokines, which
influence the behaviour of other body cells, including blood
cells and their precursors. Monocytes differentiate not only into
macrophages but also into various specialized cells, specific to
different organs, such as the Kupffer cells of the liver and the
microglial cells of the brain.
Platelets
Platelets are produced within the vascular channels (sinusoids)
of the bone marrow by the fragmentation of the protruding cyto-
plasm of large bone marrow cells known as megakaryocytes.
They are thus not, strictly speaking, cells but rather are frag-
ments of the cytoplasm of cells.
Platelets are considerably smaller than red cells and white
cells (Fig. 1.11). They are pale blue with fine azurophilic granules
which tend to be clustered in the centre of the platelet. When
blood films are made, as is generally the case, from anticoagu-
lated blood, the platelets are usually discrete and separate from
each other, but in some circumstances they form clumps or
aggregates.
The Blood Film and Count
11

Haemopoietic cells
Peripheral blood cells are produced in the bone marrow. Their
precursors are referred to as haemopoietic cells (Fig. 1.12). The
only significant function of haemopoietic cells is the production
of mature end cells. Recognizable haemopoietic precursors are
present in the circulating blood of healthy subjects but, except in
the neonatal period and during pregnancy, they are quite uncom-
mon and are not often noted in a blood film. They are much
commoner in patients with leukaemia or other haematological
disorders and in patients with severe infection or other serious
systemic diseases.
Myeloblasts
Myeloblasts (Fig. 1.13) are very rare in the blood of healthy
subjects. They are larger than lymphocytes but often smaller
than monocytes. They have a high nucleocytoplasmic ratio and
scanty to moderate amounts of cytoplasm, which varies from
weakly to moderately basophilic. (Basophilic in this context in-
dicates a blue colour consequent on the uptake of basic dyes.)
The nucleus is approximately round, nuclear chromatin is dif-
fuse and nucleoli may be apparent. In patients with leukaemia
and related disorders, the cytoplasm may contain small numbers
of azurophilic granules or other inclusions or vacuoles (see page
91). Myeloblasts are precursors of neutrophils, eosinophils and
basophils.
Promyelocytes
Promyelocytes (Fig. 1.14) are rare in the blood of healthy people.
They are larger than myeloblasts with more plentiful cytoplasm
and consequently a lower nucleocytoplasmic ratio. The cyto-
plasm is more basophilic than that of a myeloblast and contains
azurophilic (pinkish-purple) primary granules. Sometimes there
is a more lightly staining zone in the cytoplasm adjacent to
the nucleus, which represents the Golgi apparatus, where
granules are produced. The nucleus is round or oval, is usually
eccentric, shows some chromatin condensation and has a
12
Chapter 1
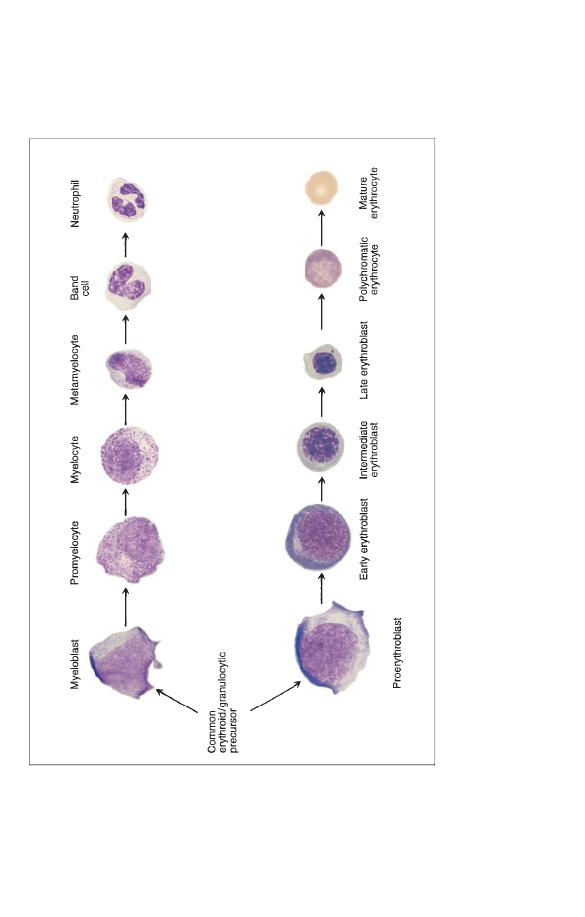
Fig. 1.12
A diagram showing the relationship of haemopoietic precursors to each other and to the end cells into which they
differentiate. Proliferation of cells occurs simultaneously with maturation or differentiation so that one myeloblast is likely
to give
rise to 16 mature granulocytes and one proerythroblast to 16 red cells. Myeloblasts, promyelocytes and myelocytes are all cells
capable of cell division or mitosis. Metamyelocytes and all later cells are non-dividing cells. All red cell precursors with th
e
exception of late erythroblasts are dividing cells. Myeloblasts differentiate not only into neutrophils, as shown in the diagra
m, but
also into eosinophils and basophils.
The Blood Film and Count
13
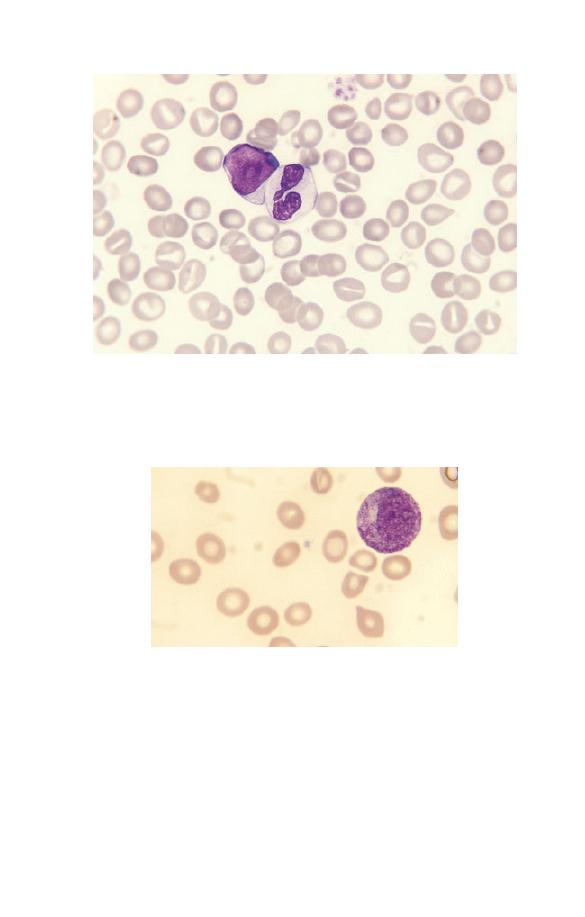
Fig. 1.13 A blood film of a patient showing a myeloblast and a neutrophil.
The myeloblast has a high nucleocytoplasmic ratio, a diffuse chromatin
pattern and a single nucleolus. The neutrophil is hypogranular.
Fig. 1.14 A promyelocyte showing a lower nucleocytoplasmic ratio than
that of a myeloblast, an eccentric nucleus, azurophilic granules and a
Golgi zone to the left of the nucleus.
visible nucleolus. Because they have no specific (lineage-
associated) granules, promyelocytes, which are precursors of
neutrophils, eosinophils or basophils, cannot generally be distin-
guished from each other.
14
Chapter 1

Fig. 1.15 A neutrophil myelocyte showing a smaller cell than a
promyelocyte with some condensation of nuclear chromatin and no visible
nucleolus. On microscopic examination it is apparent that such cells have
primary and secondary granules with different staining characteristics.
Myelocytes
Myelocytes (Fig. 1.15) are uncommon in the blood of healthy
subjects except in the neonatal period and during pregnancy.
They are smaller than promyelocytes. They have not only azuro-
philic or primary granules but also secondary granules character-
istic of specific lineages, i.e. neutrophilic, eosinophilic or
basophilic granules. The myelocyte nucleus is round or oval and
shows chromatin condensation; no nucleolus is apparent.
Metamyelocytes
Small numbers of neutrophil metamyelocytes (Fig. 1.16) are
present in the blood of healthy subjects. Basophil and eosinophil
metamyelocytes are not seen in the blood of healthy subjects.
Metamyelocytes have similar characteristics to myelocytes but
differ in that the nucleus is indented, U-shaped or C-shaped and
the primary granules are usually no longer apparent.
Band cells
Neutrophil band forms (Fig. 1.17) are present as a minor popula-
tion in the blood of healthy people. They are intermediate
in characteristics between metamyelocytes and mature
The Blood Film and Count
15
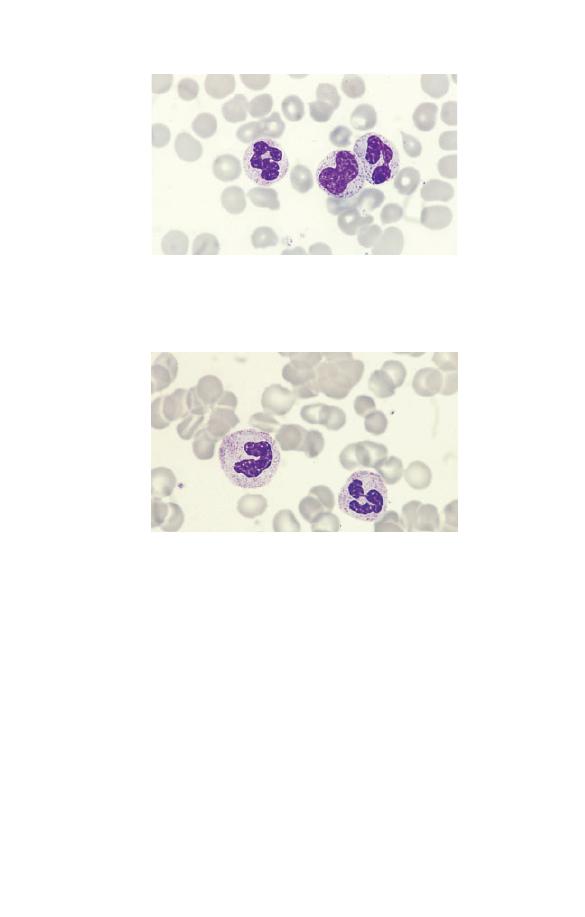
Fig. 1.16 A neutrophil metamyelocyte between two segmented
neutrophils. The nucleus is indented.
Fig. 1.17 A neutrophil band form (left) compared with a segmented
neutrophil (right).
neutrophils. The nucleus has an irregular shape with some paral-
lel edges so that it resembles a band or ribbon. It differs from a
mature or segmented neutrophil in that the nucleus is not
divided into distinct lobes or segments. Eosinophil and basophil
band forms are quite uncommon.
Nucleated red blood cells
Nucleated red blood cells (NRBC) or erythroblasts (Fig. 1.18) are
present in very small numbers in healthy people, except during
the neonatal period. Those which are most likely to be released
16
Chapter 1
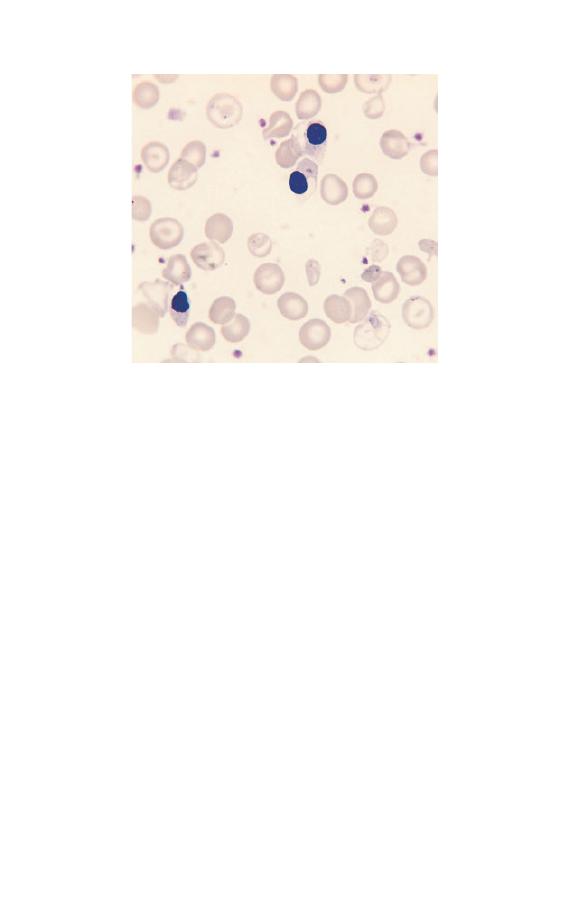
Fig. 1.18 Three nucleated red blood cells (NRBC) showing a small densely
staining nucleus and cytoplasm which is pink because of the presence of
haemoglobin.
into the blood stream are late erythroblasts. They can be readily
recognized because the cytoplasm is at least partly haemoglobin-
ized giving them a pinkish or lilac tinge. NRBC have a superficial
resemblance to lymphocytes but can be distinguished from them
not only by the colour of the cytoplasm but also by the lower
nucleocytoplasmic ratio and the denser, more homogeneously
staining nucleus.
The blood count
Haematology laboratories not only examine blood films. They
also perform various measurements relating to the haemoglobin
content of the blood, the characteristics of red cells and the
number of red cells, white cells and platelets. These measure-
ments are collectively referred to as a blood count or full blood
count (FBC). During illness, abnormalities can develop in any of
the cells in the blood. The purpose of performing a blood count
and examining a blood film is to detect quantitative and qualita-
The Blood Film and Count
17

tive abnormalities in blood cells. Their detection often helps in
diagnosis and in the treatment of the patient.
Haemoglobin concentration
If red cells are lysed, the haemoglobin is released from the red
cells and forms a solution in the plasma. The haemoglobin con-
centration (Hb) can be measured biochemically by light absorp-
tion at a specified wave length after a chemical reaction which
converts haemoglobin to cyanmethaemoglobin or to lauryl sul-
phate haemoglobin. Hb is measured in either grams per decilitre
(g/dl) or grams per litre (g/l). A fall in the Hb is referred to as
anaemia.
Haematocrit or packed cell volume
An alternative way of detecting anaemia is to centrifuge a tube
containing an aliquot of blood and measure the proportion of the
column of blood which is occupied by the red cells. Nowadays an
equivalent measurement is made by various automated instru-
ments using a quite different principle to get the same infor-
mation. This test is called a packed cell volume (PCV) or a
haematocrit (Hct). Some haematologists use these two terms
interchangeably while others used PCV to refer to a measure-
ment made after centrifugation and Hct for an estimate made by
an automated instrument. This measurement is expressed as a
decimal percentage, i.e. as litres/litre (e.g. 0.45).
Cell counts
Traditionally blood cells were counted by diluting a small quan-
tity of blood in a diluent which could also stain the cells or, if
white cells or platelets were to be counted, could lyse the more
numerous red cells. The diluted blood was placed in a counting
chamber of known volume and the number of cells present was
counted microscopically. Such a method of counting blood cells
is very labour-intensive and not suited to the large number of
blood counts needed in modern medical practice. Nowadays
blood cells are counted by large automated instruments.
18
Chapter 1

A stream of cells in a diluent passes through a sensing zone.
They are sensed either because they pass through an electric field
or because they pass through a beam of light. Each cell passing
through the sensing zone generates an electrical impulse, which
can then be counted. Red cells are both relatively large and
relatively numerous and so can be readily counted. White cells
can be counted by lysing the more numerous red cells or by
altering the red cells in some way so that they are ‘invisible’ to
the instrument. Platelets are distinguished from other cells by
their smaller size. Cell counts are expressed as the number of
cells in a litre of blood. The red blood cell count (RBC) is ex-
pressed as a number
¥ 10
12
per litre (e.g. 5
¥ 10
12
/l). The white
blood cell count (WBC) and platelet count are expressed as a
number
¥ 10
9
per litre (e.g. 7.5
¥ 10
9
/l and 140
¥ 10
9
/l). A white
cell count of 7.5
¥ 10
9
/l means that there are 7 500 000 000 cells in
a litre of blood.
Red cell indices
Red cells can vary in their size and in the amount of haemoglo-
bin contained in an individual cell. Abnormalities in both these
cell characteristics are common in certain inherited abnormal-
ities and when people are sick. Diagnostically useful information
can be obtained by measuring them. Traditionally the size of red
cells was estimated by dividing the PCV by the number of cells
in the blood to give a mean cell volume (MCV). The haemoglobin
content of individual cells was estimated by dividing the Hb by
the RBC to give a mean cell haemoglobin (MCH). The Hb of
individual cells was estimated by dividing the Hb by the PCV
to give a mean cell haemoglobin concentration (MCHC).
Nowadays, not only is the PCV estimated electronically but the
size of a red cell can be calculated from the height of the elec-
trical impulse which is generated when the cell passes through
a light beam or through an electrical field. As the automated
instruments also measure the total Hb of the blood, it is a simple
matter for the red cell indices to be produced automatically
as part of the blood count. Instruments can be designed to
measure the MCV and calculate the PCV/Hct from the
MCV and the RBC or, alternatively, to measure the PCV/Hct
The Blood Film and Count
19
and calculate the MCV from the PCV/Hct and the RBC. The
formulae which relate the various red cell indices to each other
are as follows:
MCV
PCV l l
1000
RBC cells l
12
=
-
( )
¥
(
)
¥ 10
(1)
e.g. if the PCV is 0.33 and the RBC 4.1
¥ 10
12
/l, then
MCV
0.33 1000
4.1
80.5fl femtolitres
=
¥
=
(
)
(In understanding this formula and the following ones, it
should be noted that if the RBC is 4.1
¥ 10
12
/l then 4.1 is the
RBC/l
¥ 10
-12
.)
MCH
Hb g dl
10
RBC cells l
10
12
=
( )
(
)
¥
¥
-
(2)
e.g. if the Hb is 12.3 g/dl and the RBC is 4.1
¥ 10
12
/l then
MCH
12.3 10
4.1
30 pg picograms
=
¥
=
(
)
MCHC
Hb g dl
PCV l l
=
( )
( )
(3)
e.g. if the Hb is 12.3 g/dl and the PCV/Hct is 0.33 then
MCHC
12.3
37.3g dl
=
=
0 33
.
If an instrument measures the RBC rather than the PCV/Hct,
then the formula is
RBC l 10
PCV l l
1000
MCV fl
12
¥
=
( )
¥
( )
-
(4)
e.g. using the same figures as above
RBC l 10
0.33 1000
80.5
4.1
12
¥
=
¥
=
-
20
Chapter 1

Normal ranges
In order to interpret blood counts it is necessary to know what is
normal. This is usually done by reference to either a normal
range or a reference range. A reference range is more strictly
defined than a normal range but both represent the range of test
results which would be expected in healthy people of the same
age and sex (and, if relevant, of the same ethnic origin) as the
person being investigated. Conventionally, both types of range
are expressed as the central 95% of test results that would be
expected in healthy people. The reason for excluding the top
2.5% and the bottom 2.5% is that there is usually an overlap
between test results of healthy people and of those who are sick.
A 95% range has been chosen to avoid either classifying too
many healthy subjects as abnormal or missing relevant abnor-
malities in patients who are sick. It is clear that for any one test
5% of healthy subjects will have results falling outside the ‘nor-
mal’ range. Conversely, a patient who is sick may have a test
result which is abnormal for him or her but which is still within
the normal range. For example, a man may have a large gastroin-
testinal haemorrhage, causing his Hb to fall from its normal level
of around 16 g/dl to 14 g/dl. The latter
⫺14g/dl⫺is within the
range expected for a healthy adult man but for this particular
patient it is abnormal. This is because the range of test results
expected in a group of healthy people is much wider than the
range expected if the same test is repeated day after day in the
same person. Usually we have no way of knowing what is ‘nor-
mal’ for a particular individual and so we have to resort to
comparing his or her test results with a normal range.
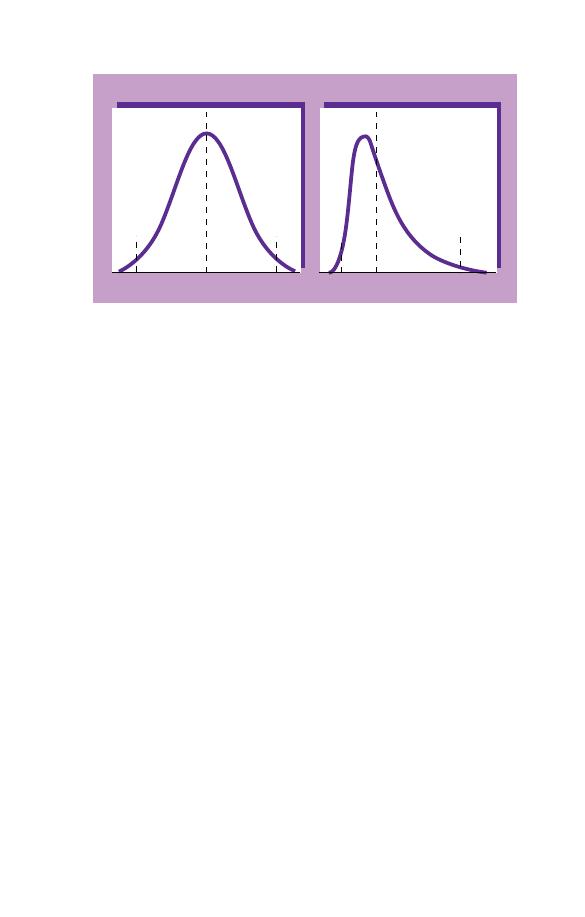
The statistical distribution of test results differs for different
tests. Many tests, e.g. the Hb, show a normal or Gaussian distri-
bution. This means that if the distribution of the test results is
plotted on graph paper a bell-shaped curve is obtained (Fig.
1.19a). If this is so, the 95% range can be calculated by estimat-
ing the mean
± 2 standard deviations. Other test results, e.g. the
WBC (Fig. 1.19b), have a skewed distribution which only be-
comes bell-shaped if the test results are plotted on logarithmic
graph paper. Test results with this type of distribution require
special statistical treatment to derive the normal range.
The Blood Film and Count
21
(a)
(b)
13.3
15.0
16.7
3.5
6.2
10.8
WBC (cells x 10
9
/l)
Hb (g/dl)
Distribution of Hb in
adult Caucasian males
Distribution of WBC in
adult Caucasian females
Fig. 1.19 Smoothed histograms showing (a) the normal distribution of Hb
and (b) the log normal distribution of the white cell count.
Some normal ranges applicable to healthy people are shown in
Tables 1.2–1.4. However, it should be noted that the test results
for some haematological variables, e.g. the MCV, vary according
to the method of measurement and it is desirable for laboratories
to derive their own normal ranges for their own automated
instruments by obtaining blood samples from a large number of
healthy people. In the case of children, it is always difficult to
obtain blood samples from large numbers of healthy individuals
of various ages. As a consequence, published normal ranges for
children are not as reliable as those for adults.
How to examine a blood film
Blood films should be examined in a systematic way. First the
film should be examined without using the microscope, to make
sure it is well spread (not too thick, too long or too short) and
that its staining characteristics are normal. A film that is a
deeper blue than other films stained in the same batch is usually
indicative of an increase in the concentration of plasma proteins.
This can be diagnostically important since it is often caused by
multiple myeloma (a plasma cell malignancy) (see page 87) or by
chronic inflammatory disease.
22
Chapter 1

Table 1.2 Normal ranges for healthy Caucasian adults.
Males
Females
WBC
¥ 10
-9
/l
3.7–9.5
3.9–11.1
RBC
¥ 10
-12
/l
4.32–5.66
3.88–4.99
Hb (g/dl)
13.3–16.7
11.8–14.8
PCV (Hct) (l/l)
0.39–0.5
0.36–0.44
MCV (fl)
82–98
MCH (pg)
27.3–32.6
MCHC (g/dl)
31.6–34.9
RDW
9.5–15.5*
11.6–13.9†
HDW
1.82–2.64†
Neutrophils
¥ 10
-9
/l
1.7–6.1
1.7–7.5
Lymphocytes
¥ 10
-9
/l
1.0–3.2
Monocytes
¥ 10
-9
/l
0.2–0.6
Eosinophils
¥ 10
-9
/l
0.03–0.06
Basophils
¥ 10
-9
/l
0.02–0.29
Large unstained cells
(LUC)
¥ 10
-9
/l
0.09–0.29
Platelets
¥ 10
-9
/l
.
143–332
,
169–358
RDW, red cell distribution width; HDW, haemoglobin distribution width.
The differential white cell counts and the platelet counts are for
Technicon H.1 series automated instruments. The ranges are wider for
manual differential counts, particularly for monocytes, eosinophils and
basophils. Platelet counts are very dependent on the method used for
counting and should be assessed only in relation to a normal range derived
for the instrument or method in use.
* Coulter S Plus IV.
† Technicon H.1 series.
Next the film is examined microscopically at low power (e.g.
with a
¥25 objective) so that a large part of the film can be
scanned rapidly to detect any abnormal cells present in small
numbers. Finally the film is examined at a higher power (e.g.
with a
¥40 or ¥50 objective) so that the detailed structure of cells
can be assessed. The great majority of films can be evaluated
perfectly adequately without using high power (i.e. a
¥100 oil
immersion objective). High power can be reserved for making a
detailed assessment of films that show significant abnormalities
requiring further assessment. In examining a film be sure to look
The Blood Film and Count
23

Table 1.3 Normal ranges for Afro-Caribbean and Africans for those
haematological variables where the ranges differ from those of Caucasians.
Males
Females
West Indians
WBC
¥ 10
-9
/l
2.8–9.5
3.3–9.8
Neutrophils
¥ 10
-9
/l
1.0–5.8
1.4–6.5
Platelets
¥ 10
-9
/l
122–313
149–374
Africans
WBC
¥ 10
-9
/l
2.8–7.2
3.2–7.8
Neutrophils
¥ 10
-9
/l
0.9–4.2
1.3–4.2
Platelets
¥ 10
-9
/l
115–290
125–342
It should be noted that the lower RBC, Hb, PCV and MCV observed in
Afro-Caribbean and Africans are likely to be consequent on a high
prevalence of thalassaemia trait and haemoglobinopathies rather than on
other ethnic differences. It is therefore appropriate to use Caucasian
reference ranges for red cell variables for Afro-Caribbean and Africans.
Table 1.4 Approximate 95% ranges for red cell variables and for
automated* total and differential white cell counts for Caucasian infants
and children.
Age (years)
RBC (
¥¥¥¥¥
10
-----
12
/l)
Hb (g/dl)
MCV (fl)
Birth
3.5–6.7
,5
14–24
100–135
1
4.1–5.3
,5
11–14
71–84
2–5
4.2–5.0
,5
11–14
73–86
6–9
4.3–5.1
,5
11–14
75–88
9–12
4.3–5.1
11.5–15.5
76–91
Neutrophil Lymphocyte Monocyte Eosinophil
Age (years) WBC
count
count
count
count
Birth
,5
5–23
1.7–19
,5
1–11
0.1–3.5
0.05–2
1
5.6–17.5 1.5–7
2.5–9
0.15–1.3
0.06–0.6
2–5
,5
5–13
1.5–8.5
1.5–5.5†
0.15–1.3
0.08–1.2
6–9
,5
4–10
1.5–6
1.5–4
0.15–1.3
0.08–1
9–12
,5
4–10
1.5–6
1.5–4
0.15–1.3
0.04–0.8
* Ranges will be wider for manual differential counts than for automated
counts.
† The lymphocyte count is up to 8
¥ 10
9
/l in 2-year-olds, up to 5.5
¥ 10
9
/l
in 3- and 4-year-olds and up to 4.5
¥ 10
9
/l in 5-year-olds.
24
Chapter 1

specifically at red cells, white cells and platelets so that no
abnormality is inadvertently overlooked. Be sure to look at the
edges and tail of the film where abnormal cells may be found.
Finally, decide if a differential count is needed. Nowadays this
will often have been performed by an automated instrument but
you may need to verify its accuracy and in leukaemia you may
need to carry out a manual differential count, i.e. one performed
with the aid of a microscope.
Learning to look at blood films
When learning to recognize cells for the first time it is useful
to compare cells seen down the microscope with photographs.
Examining films on a double-headed microscope with an ex-
perienced laboratory worker is also very valuable. To learn to
recognize high and low WBC and platelet counts, start by com-
paring the film appearance with the count on an automated
instrument. After you have had some experience try to estimate
what the count will be before you look at the test results. Later
you will need to be able to do this fairly accurately so that you
can recognize erroneous instrument counts. Similarly, start by
looking at films with high and low MCVs and compare the size
of the red cells with neutrophils and lymphocytes until you can
recognize large and small red cells. When you have had some
experience try to estimate the approximate MCV before you look
at the test results. Eventually you will be able to judge the MCV,
at least to within 5–10 fl.
Recognizing problems with the blood sample
Before carrying out a detailed assessment of a blood film it is
important to detect any abnormal characteristics of the speci-
men which might interfere with your assessment of the film or
with the accuracy of the automated count. The most common
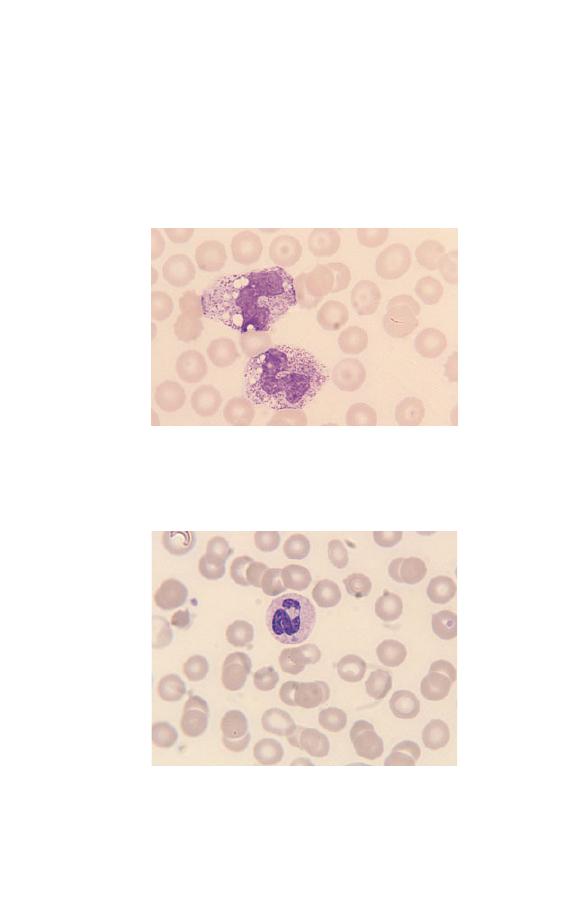
problem is storage artefact (Fig. 1.20). This occurs when blood
has been at room temperature for a day or more before reaching
the laboratory. The red cells turn into echinocytes, i.e. their
shape alters so that the surface is covered with numerous short,
regular projections. This process is also known as crenation.
The Blood Film and Count
25
Some of the white cells develop fuzzy outlines or disintegrate
entirely when the blood film is spread. The nuclei of neutrophils
become dense, homogeneous and round and may break up into
two or more round masses. It is important not to confuse these
degenerating neutrophils with NRBC. They have a lower nucleo-
cytoplasmic ratio and the cytoplasm is pink and slightly granular
rather than reddish-brown. It is impossible to give any reliable
opinion of films showing storage artefact. If the blood count is
normal they can usually be ignored but if there is any reason to
suspect a haematological abnormality a fresh blood sample must
be obtained.
A common cause of inaccurate blood counts is partial clotting
of the specimen or aggregation of the platelets. Platelets may
aggregate because they have been activated (i.e. the process of
blood clotting has started) or because there is an antibody present
in the plasma which leads to platelet aggregation in blood that
is anticoagulated with ethylenediaminetetra-acetic acid (EDTA).
Aggregated platelets form masses between the red cells, that may
Fig. 1.20 Storage artefact. The red cells are crenated, a lymphocyte (right)
has a fuzzy outline and one of the two neutrophils (left) has a nucleus
which has become round, dense and homogeneous. (Compare the
degenerating neutrophil with the nucleated red cells shown in Fig. 1.18.)
26
Chapter 1
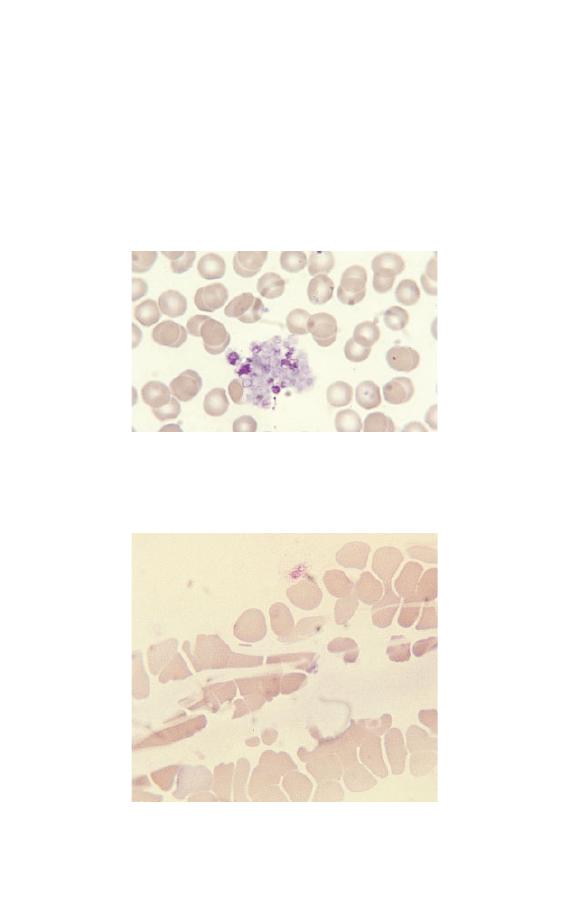
Fig. 1.22 Fibrin strands passing between and over red cells.
contain intact platelets (Fig. 1.21) or may be composed of totally
degranulated platelets, which stain pale blue. Less often, partial-
ly clotted samples contain fibrin strands, which are seen as pale
blue or almost non-staining linear structures running between
and deforming red cells (Fig. 1.22). Another in vitro artefact, less
common than platelet aggregation but which can also lead to
falsely low platelet counts, is platelet satellitism (Fig. 1.23).
Fig. 1.21 A platelet aggregate containing a mixture of intact and
degranulated platelets.
The Blood Film and Count
27

Fig. 1.23 Platelet satellitism.
Less common artefacts which should be recognized are those
due to accidental freezing or overheating of the blood specimen
before it reaches the laboratory and the presence of lipid (fat)
in the plasma. All these abnormalities cause anomalous blood
counts.
Interpreting blood films
When assessing blood films, always note the age, sex and ethnic
origin of the patient and keep in mind what would be normal for
that individual. Also consider the clinical details so that you can
look carefully for any specific abnormalities which might be
relevant, keeping in mind that the clinical details may provide
you with an obvious explanation for an abnormality you have
noted. For example, if the clinical details were ‘alcohol excess’
you would not be surprised to find that the patient had macro-
cytosis and you would go on to see if there were stomatocytes or
any of the other abnormalities which could be caused by alcohol.
Your report of these abnormalities would give the clinician very
specific information which would help to confirm his/her clini-
cal suspicion.
28
Chapter 1

29
CHAPTER 2
Assessing
Red Cells
Red cells should be assessed as to their:
• number
• size
• shape
• degree of haemoglobinization
• distribution in the blood film.
Their appearance should be described using a standard
terminology.
Assessing red cell number and distribution
(anaemia, polycythaemia, rouleaux formation,
red cell agglutination)
The thickness of a film of blood spread on a glass slide is deter-
mined by how thick the blood is, i.e. by its viscosity. This in turn
is determined by the Hb. In a normal blood film it is possible to
find a part of the film which is ideal for microscopic examination
where the red cells are touching but not overlapping. If the Hb is
abnormally high (a condition referred to as polycythaemia) the
blood has a high viscosity and the film of blood on the glass slide
is thick. The red cells therefore appear packed together through-
out the whole length of the film. The term ‘packed film’ is often
used. Conversely, when a patient is anaemic the viscosity of the
blood is low, the blood film is very thin and there are large spaces
between the red cells. The effect of Hb on the blood film can be
seen by comparing Figs 2.1, 2.2 and 2.3.
Usually red cells are distributed fairly regularly on the slide.
Two abnormalities of distribution may occur. When there is an
A Beginner’s Guide to Blood Cells, 2nd Edition
Barbara J. Bain
Copyright © 1996, 2004 by Blackwell Publishing Ltd
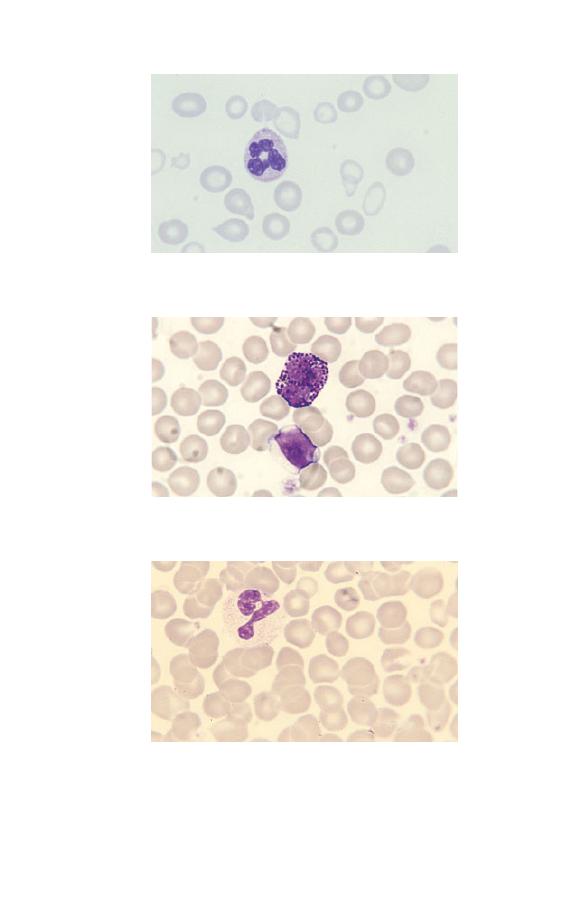
Fig. 2.2 Normal distribution of red cells in a healthy subject with normal Hb.
Fig. 2.3 Polycythaemia.
Fig. 2.1 Anaemia (caused by iron deficiency).
30
Chapter 2
increase in high-molecular-weight plasma proteins there is an
effect on the electrical charge on the surface of the red cells and
the cells sediment rapidly and form into stacks, like a pile of
coins. These stacks are referred to as rouleaux (Fig. 2.4) and the
film is said to show increased rouleaux formation. The other
abnormality of cell distribution is red cell agglutination. This is
caused by an antibody against a red cell antigen. The antibody-
coated red cells become sticky and form into irregularly shaped
Fig. 2.5 Red cell agglutinates.
Fig. 2.4 Rouleaux.
Assessing Red Cells
31
clumps or agglutinates (Fig. 2.5). Agglutinates can be distin-
guished from rouleaux because the clumps are an irregular jum-
ble rather than an orderly stack. Red cell agglutinates are most
often caused by an antibody which is active below normal body
temperature, referred to as a cold antibody or cold agglutinin.
Agglutinates will be less numerous if another film is made after
the blood has been warmed. The presence of cold agglutinins can
lead to anomalous blood count results.
Assessing red cell size (microcytosis,
macrocytosis, anisocytosis)
Red cells are smaller than normal lymphocytes and significantly
smaller than granulocytes. If cells are smaller than normal they
are described as microcytic and if larger than normal as macro-
cytic. They are referred to as microcytes or macrocytes respec-
tively. Red cells of normal size are said to be normocytic. If red
cells show greater variation in size than normal the blood film is
said to show anisocytosis (Fig. 2.6). Anisocytosis can be graded as
+, ++ or +++ (mild, moderate or severe). The different sizes of red
cells can be appreciated by comparing Figs 2.7, 2.8 and 2.9.
Assessing red cell shape (poikilocytosis)
If red cells show more than the normal degree of variation in
red cell shape there is said to be poikilocytosis (Fig. 2.10).
Fig. 2.6 Severe anisocytosis; the MCV was 133 fl but the macrocytosis is
not uniform.
32
Chapter 2
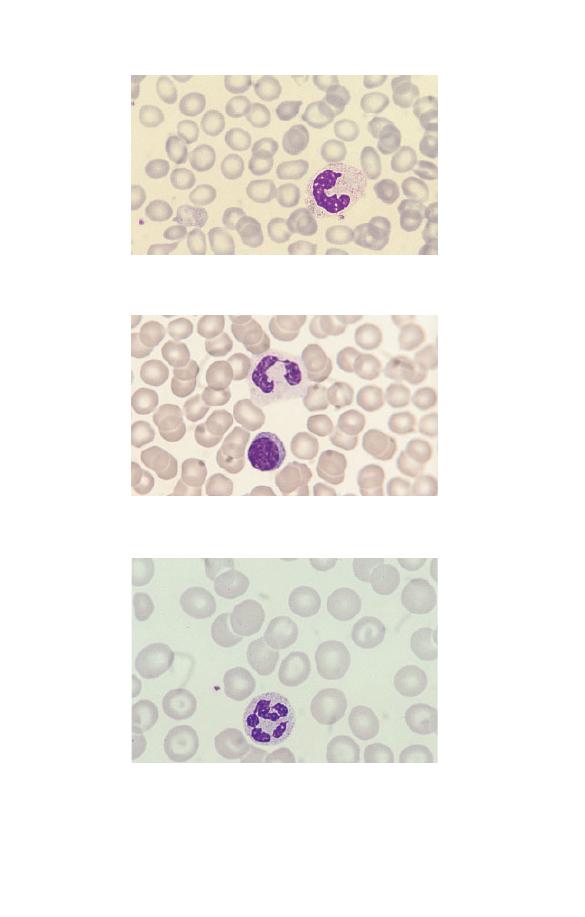
Fig. 2.7 Microcytic red cells (MCV 62 fl).
Fig. 2.8 Normocytic red cells.
Fig. 2.9 Macrocytic red cells (MCV 105 fl).
Assessing Red Cells
33
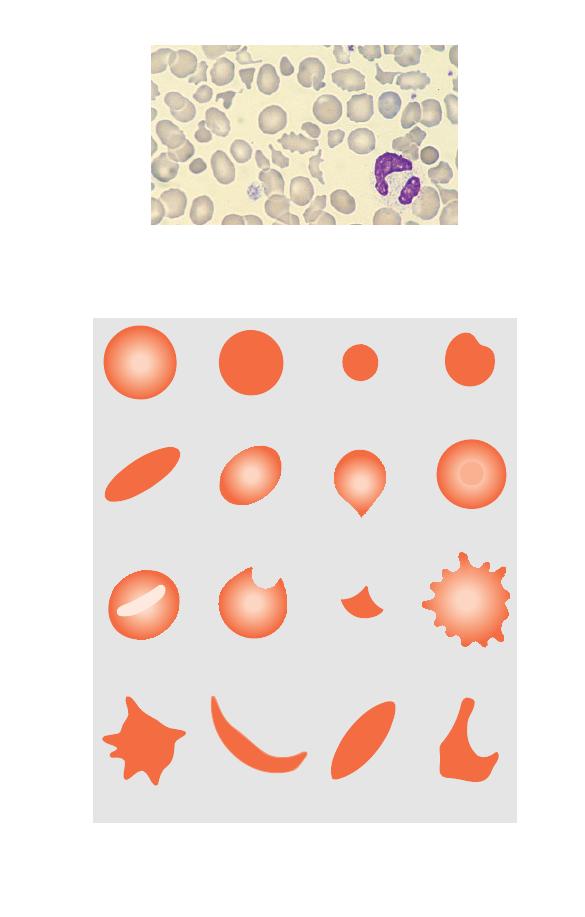
Fig. 2.10 Severe poikilocytosis; cells vary considerably in shape but no
single shape dominates. (This was a case of transient severe poikilocytosis
in the neonatal period in a baby with hereditary elliptocytosis.)
Fig. 2.11 Diagrammatic representation of different types of poikilocyte.
Normal cell
Spherocyte
Micro-spherocyte
Irregularly
contracted cell
Target cell
Dacrocyte (tear-drop
poikilocyte)
Ovalocyte
Elliptocyte
Stomatocyte
Keratocyte
Schistocyte
(fragment)
Echinocyte
(crenated cell)
Acanthocyte
S-C poikilocyte
Boat-shaped
cell
Sickle cell

Individual cells of abnormal shape are referred to as poikilocytes.
Poikilocytosis can be graded in a similar manner to anisocytosis.
Individual cells of a particular shape have names which identify
them, as defined in Table 2.1 and illustrated in Fig. 2.11 and Figs
2.12–2.22.
Table 2.1 Definitions of cells by shape.
Spherocyte
Cell which is approximately spherical in shape so
that it has lost its central pallor; the cell outline is
regular
Microspherocyte
Spherocyte of reduced size and therefore diameter
Irregularly
Cell of reduced size and diameter with a lack of
contracted cell
central pallor but with an irregular outline
Elliptocyte
Cell with an elliptical outline
Ovalocyte
Cell with an oval outline
Dacrocyte
Cell shaped like a tear-drop
(tear-drop
poikilocyte)
Target cell
Cell with a more strongly staining area in the centre
of the area of central pallor
Stomatocyte
Cell with a central slit or stoma
Keratocyte
Cell with two or four curved horn-shaped
projections
Schistocyte
Fragment of a cell, usually angular; a
(red cell
microspherocyte is a particular type of
fragment)
schistocyte
Echinocyte
Cell with its surface covered with 20–30 small,
(crenated cell)
regular, blunt projections
Acanthocyte
Cell with its surface covered with two to twenty
projections of irregular shape and irregularly
distributed
Sickle cell
Cell with a sickle or crescent shape, caused by the
presence of a high concentration of an abnormal
haemoglobin known as haemoglobin S
Boat-shaped
Cell similar in shape to an elliptocyte but with
cell
both ends pointed, usually indicative of the
presence of haemoglobin S
SC poikilocyte
Bizarre poikilocyte formed when cells contain both
haemoglobin S and haemoglobin C, having some
curved edges and some square or rectangular
protrusions
Assessing Red Cells
35
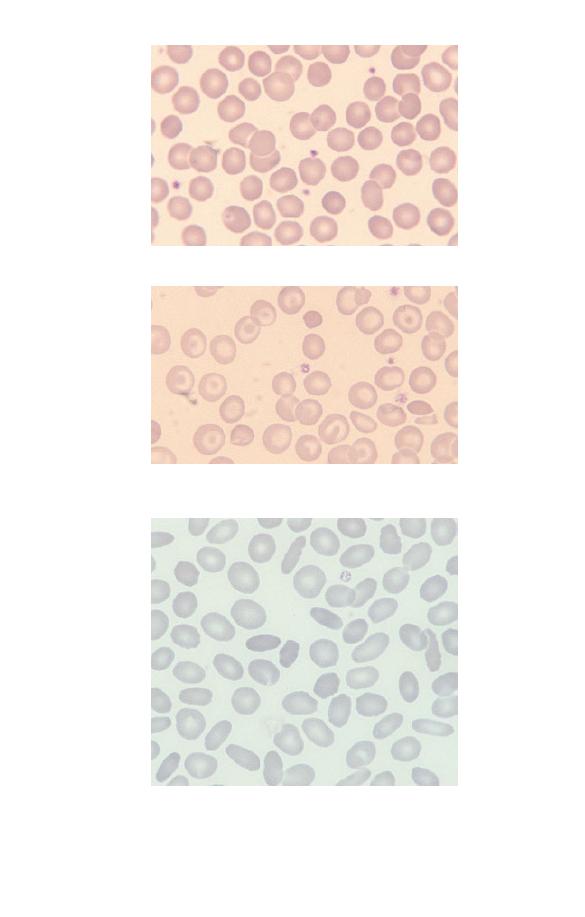
Fig. 2.12 Moderate numbers of spherocytes (in hereditary spherocytosis).
Fig. 2.14 Numerous elliptocytes and ovalocytes (in hereditary
elliptocytosis).
Fig. 2.13 Several irregularly contracted cells (in haemoglobin C disease).
The majority of the other cells are target cells.
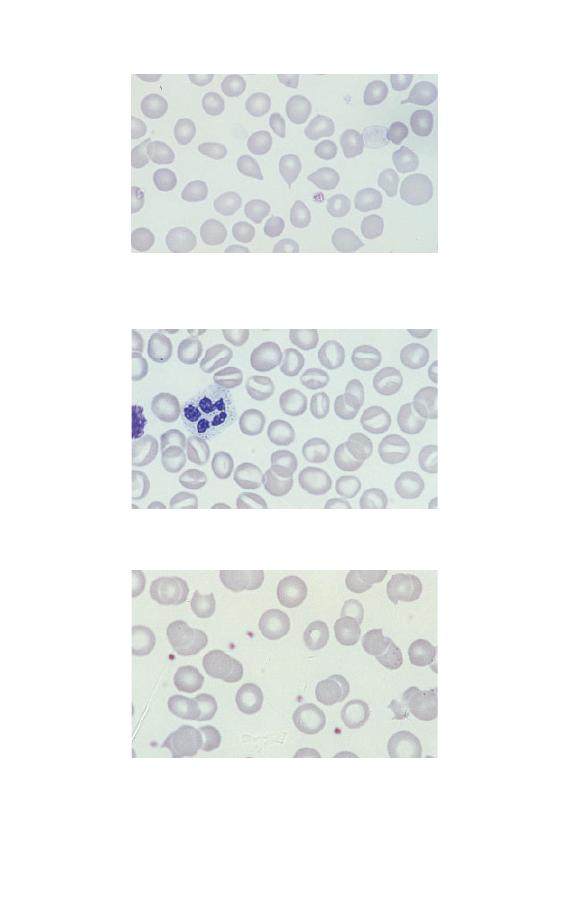
Fig. 2.15 Several dacrocytes (tear-drop poikilocytes) (in idiopathic
myelofibrosis).
Fig. 2.16 Numerous stomatocytes (in hereditary stomatocytosis).
Fig. 2.17 Several keratocytes (in microangiopathic haemolytic anaemia);
keratocytes are sometimes called ‘bite cells’ because they look as if a bite
has been taken from them.
Assessing Red Cells
37
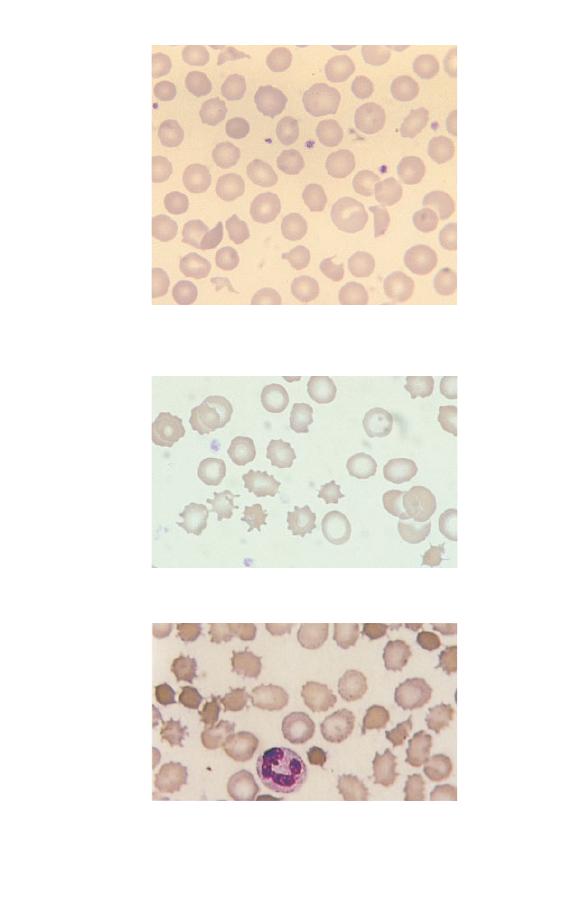
Fig. 2.20 Acanthocytes (in abetalipoproteinaemia).
Fig. 2.18 Several schistocytes (red cell fragments) including a
microspherocyte (in haemolytic uraemic syndrome).
Fig. 2.19 Echinocytes (crenated cells) (in chronic renal failure).
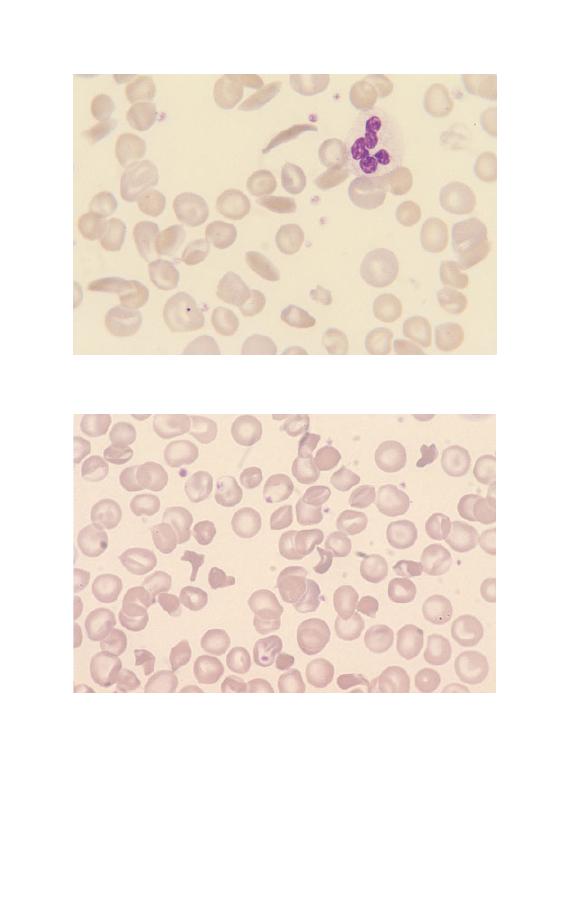
Fig. 2.22 SC poikilocytes (in sickle cell/haemoglobin C disease).
Assessing red cell colour (hypochromia,
hyperchromia, anisochromasia, polychromasia)
Normal red cells are reddish-brown with approximately the cen-
tral third to quarter of the cell being paler. They are described as
Fig. 2.21 One sickle cell and several boat-shaped cells (in sickle cell
anaemia).
Assessing Red Cells
39
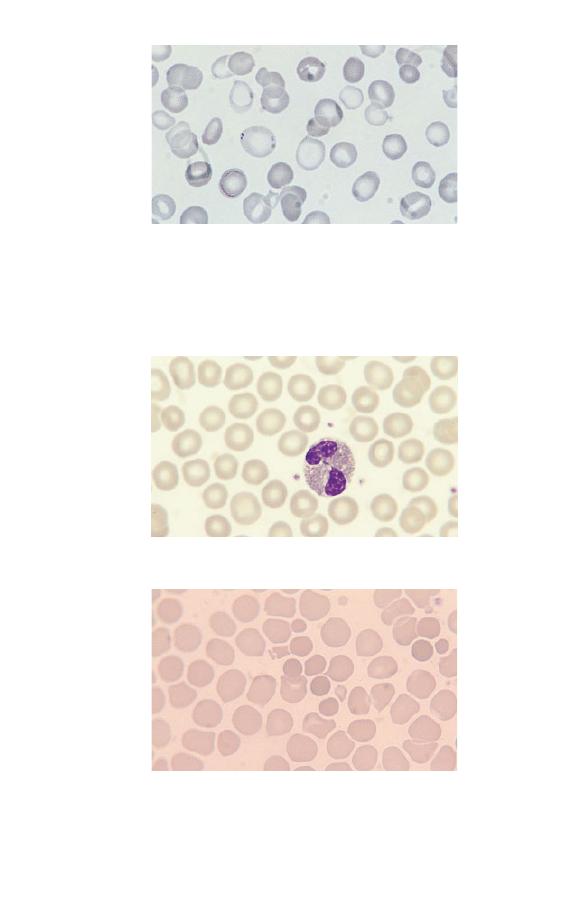
Fig. 2.25 Hyperchromic cells (which in this case are microspherocytes in a
severely burned patient; spherocytes and irregularly contracted cells are
also hyperchromic).
Fig. 2.24 Normochromic cells (in a healthy subject).
Fig. 2.23 A population of severely hypochromic cells with only a thin
rim of haemoglobinized cytoplasm (in refractory anaemia with ring
sideroblasts); there are other cells which stain normally and the film is
therefore described as dimorphic. In addition one cell just left of centre has
small basophilic inclusions, known as Pappenheimer bodies, towards the
periphery of the cell.

Fig. 2.26 A polychromatic macrocyte.
normochromic. Cells which have an area of central pallor more
than a third of the diameter of the cell are said to be hypochromic
and the film is said to show hypochromia. Cells which lack
central pallor are said to be hyperchromic. Hypochromic, normo-
chromic and hyperchromic cells are compared in Figs 2.23–2.25.
These staining characteristics are determined by the concentra-
tion of haemoglobin in the cell and by the shape of the cell. Cells
which show a greater than normal variation in the degree of
haemoglobinization are said to show anisochromasia (see Fig.
2.1). Red cells which have a blue or lilac tinge are said to show
polychromasia (‘many colours’). Polychromatic cells (Fig. 2.26)
are young cells, newly released from the bone marrow. They
have not yet been remodelled to the disc shape of a mature
erythrocyte and therefore lack central pallor. They are also gen-
erally larger than more mature cells and in this case may be
described as polychromatic macrocytes. Young red cells can also
be detected with a special stain of live (unfixed) cells called a
supravital stain. Young cells detected in this way are called
reticulocytes because the supravital staining causes a network or
‘reticulum’ to be deposited. Another word usually used to de-
scribe staining characteristics of red cells is dimorphic. The word
means that there are two types of cell but it is most often applied
to a mixture of hypochromic and normochromic cells (see Fig.
2.23). The two populations of cells usually differ in size as
well as in staining characteristics. A dimorphic film differs from
Assessing Red Cells
41

Fig. 2.27 Numerous cells showing basophilic stippling (in lead poisoning).
Punctate basophilia is an alternative term used to describe this
abnormality.
one showing anisochromasia in that there are two distinct
populations of cells rather than a gradation of staining character-
istics.
Detecting red cell inclusions (Pappenheimer bodies,
basophilic stippling, Howell–Jolly bodies)
Red cells may contain inclusions. Pappenheimer bodies are
small, basophilic inclusions, occurring in small numbers to-
wards the periphery of the cell (see Fig. 2.23). They contain iron
and when this is confirmed by an iron stain they are referred to
as siderotic granules. Basophilic stippling refers to the presence
of small basophilic inclusions distributed throughout the red cell
(Fig. 2.27). They do not contain iron but represent abnormally
staining ribosomes. Howell–Jolly bodies (Fig. 2.28) are larger,
round, densely staining inclusions, usually towards one edge of
the cell. They represent a nuclear fragment that was not extrud-
ed when the red cell left the bone marrow. Usually any Howell–
Jolly bodies left in red cells as they leave the bone marrow are
removed by the spleen. They are therefore most often seen in
people who have had their spleens removed.
Malaria parasites are intracellular and are detected as inclu-
sions within red cells. Their detection is very important in diag-
42
Chapter 2
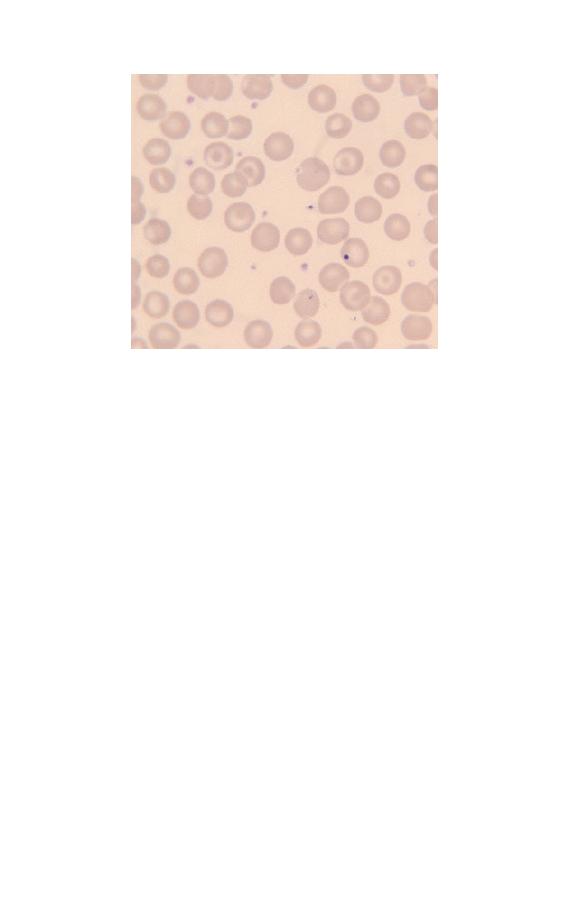
Fig. 2.28 A cell containing a Howell–Jolly body in a patient who has had a
splenectomy. There are also several target cells.
nosis and as yet there is no reliable substitute for the blood film
in their detection.
The full blood count in red cell assessment
The blood count is very important in detecting or confirming the
presence of anaemia, polycythaemia, microcytosis and macro-
cytosis. Some instruments also detect hypochromia and hyper-
chromia by changes in the MCHC. Most instruments can detect
the presence of two cell populations which would produce a
dimorphic blood film. Many instruments also produce a meas-
urement called the red cell distribution width (RDW), which
quantitates anisocytosis. Some also produce a measurement
called the haemoglobin distribution width (HDW), which is in-
dicative of the degree of anisochromasia.
The adequate assessment of an abnormal blood count often
requires the examination of a blood film since there are many
abnormalities detectable on blood films which are not detected
by automated counters, e.g. the presence of poikilocytes, red cell
Assessing Red Cells
43

inclusions or increased rouleaux formation. The presence of red
cell agglutinates can sometimes be suspected because of very
abnormal and improbable FBC results but a blood film is needed
for confirmation.
44
Chapter 2

45
CHAPTER 3
Assessing White
Cells and
Platelets
White cells and platelets may be increased or decreased in
number. They may also show morphological abnormalities,
either inherited or acquired. Assessing whether the numbers of
individual types of white cell are increased or decreased requires
a differential count. However, the differential count is of little
importance in itself and should only be used to calculate the
absolute numbers of each cell type. The absolute counts are
then compared with those expected in healthy people of the
same age, sex and ethnic group. The terms used in describing
numerical abnormalities in white cells and platelets are defined
in Table 3.1.
Table 3.1 Terminology used for abnormalities of white cell and platelet
numbers.
Leucocytosis
Increased white cell count
Neutrophilia (or neutrophil leucocytosis)
Increased neutrophil count
Lymphocytosis
Increased lymphocyte count
Monocytosis
Increased monocyte count
Eosinophilia
Increased eosinophil count
Basophilia
Increased basophil count
Thrombocytosis
Increased platelet count
Leucopenia
Decreased white cell count
Neutropenia
Decreased neutrophil count
Lymphopenia (or lymphocytopenia)
Decreased lymphocyte count
Monocytopenia
Decreased monocyte count
Eosinopenia
Decreased eosinophil count
Basopenia
Decreased basophil count
Thrombocytopenia
Decreased platelet count
A Beginner’s Guide to Blood Cells, 2nd Edition
Barbara J. Bain
Copyright © 1996, 2004 by Blackwell Publishing Ltd

Assessing white cell and platelet numbers
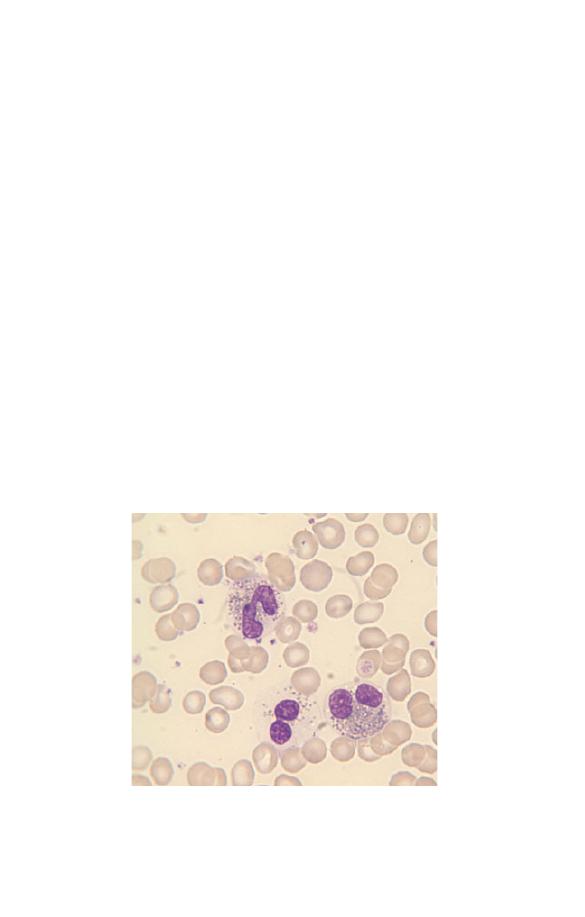
White blood cell counts can be assessed by examining a blood
film, preferably by low power, but an instrumental WBC is
much more precise. Figure 3.1 illustrates leucocytosis. In com-
parison, if the WBC were normal, no more than one or two
cells would be expected in a microscopic field of this size and if
there were leucopenia many such fields would contain no white
cells.
Platelet numbers can also be assessed on a film, by relating
their number to the number of red cells present. An instrument
platelet count is generally much more precise than an estimate
from a film but is prone to errors because of poor specimen
collection techniques or characteristics of the sample. If a plate-
let count is unexpectedly low it is important to check that this
is not because the specimen is partially clotted. Some automated
instruments have a mechanism for checking for clots but other-
wise this has to be done manually by the laboratory worker. It is
important that all low platelet counts are confirmed on a blood
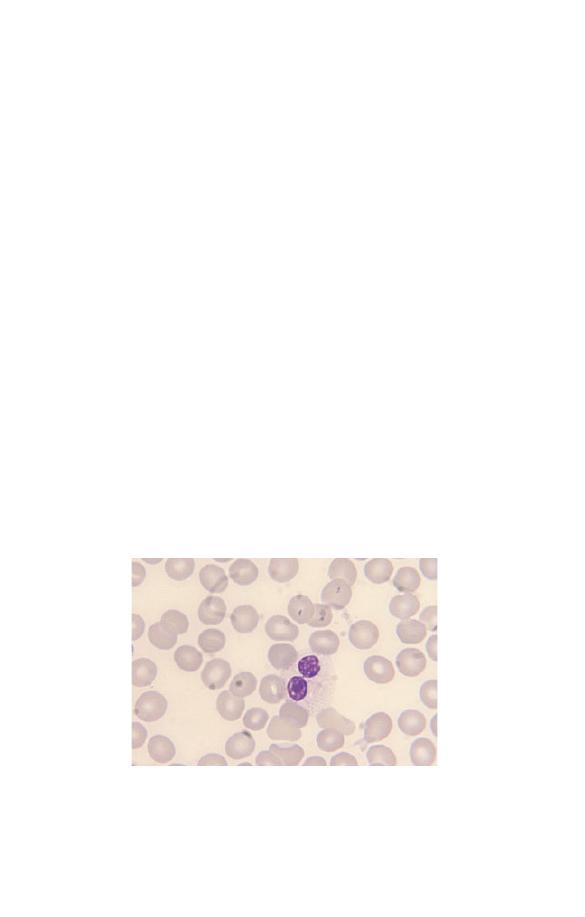
film. Figures 3.1, 3.2 and 3.3 contrast normal, high and low
platelet counts. It is also important to examine a blood film in all
cases with apparent thrombocytopenia to exclude platelet aggre-
gation or satellitism (see Figs 1.21 & 1.23) as a cause of a falsely
low count.
Assessing neutrophil morphology
Neutrophils may show increased (Fig. 3.4) or decreased (see Fig.
1.13) granulation. Increased granulation is usually a reaction to
infection or inflammation and is therefore referred to as toxic
granulation. However, it does also occur as a normal phenom-
enon, during pregnancy. Cytoplasmic inclusions may be present
as an inherited or acquired abnormality. The commonest such
abnormality is a small, pale, blue–grey inclusion which occurs
both during pregnancy and in infection and inflammation and is
known as a Döhle body (Fig. 3.5). Another common cytoplasmic
abnormality, which is strongly suggestive of infection, is cyto-
plasmic vacuolation (Fig. 3.4).
46
Chapter 3
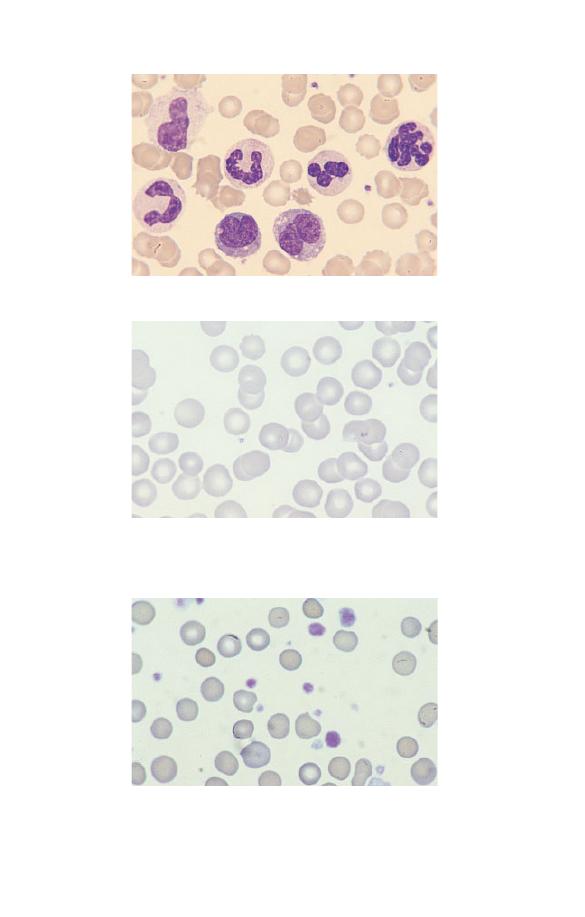
Fig. 3.1 Leucocytosis.
Fig. 3.3 Thrombocytosis (in chronic granulocytic leukaemia). The platelets
also show increased variation in size and some are agranular.
Fig. 3.2 Thrombocytopenia (in Wiskott–Aldrich syndrome). There are only
two platelets in the film. The platelets are also abnormally small,
although their staining characteristics are normal.
Assessing White Cells and Platelets
47
Neutrophils may have congenital or acquired abnormalities of
nuclear lobulation. An increase in band forms and less lobulated
neutrophils in relation to more mature, well-lobulated neu-
trophils is known as a left shift (Fig. 3.4). This term is also used
when neutrophil precursors are present in the blood. Neutrophils
Fig. 3.4 Toxic granulation, vacuolation and left shift (the two white cells
are band forms).
Fig. 3.5 A neutrophil containing a Döhle body, a small blue–grey
cytoplasmic inclusion which can be seen just below the nucleus.
48
Chapter 3
may also be hypolobulated, but with very round lobes and with
some nuclei being shaped like a pair of spectacles or a peanut.
This occurs as a congenital abnormality known as the Pelger–
Huët anomaly (Fig. 3.6). There will be some neutrophils with
completely round nuclei. This congenital anomaly is of no clin-
ical significance but it is important not to confuse it with left
shift. A similar abnormality can develop as an acquired condi-
tion known as the pseudo- or acquired Pelger–Huët anomaly.
The acquired Pelger–Huët anomaly is clinically very significant
because it is a feature of a neoplastic condition, called a myelo-
dysplastic syndrome, which may lead on to acute leukaemia.
The nuclei have similar abnormal shapes in the congenital
and acquired Pelger–Huët anomalies but in the latter there are
often associated abnormalities (e.g. neutropenia or hypogranular
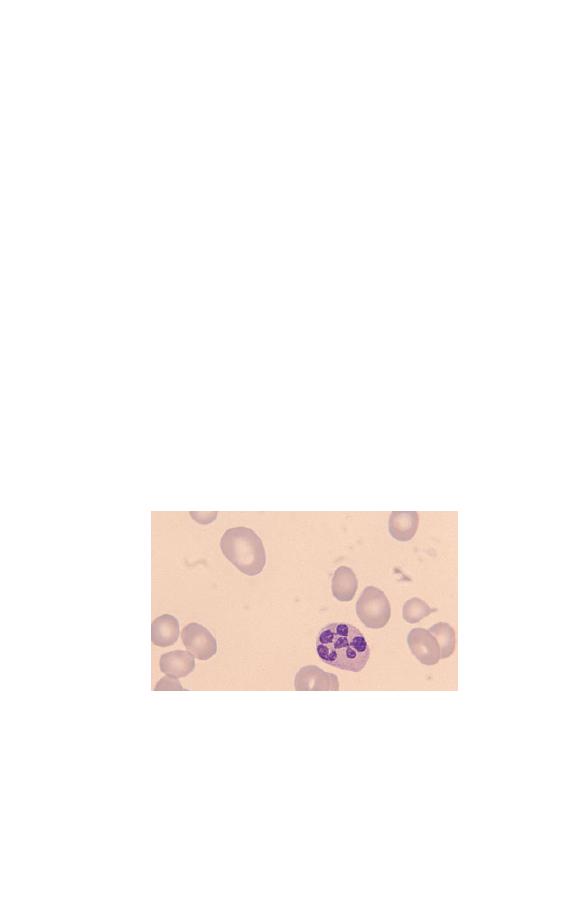
neutrophils). Neutrophils may also show increased lobulation
(Fig. 3.7). This is known as right shift. Neutrophils with six or
more lobes are said to be hypersegmented. Neutrophil hyperseg-
mentation is an important clue to the presence of deficiency
of vitamin B
12
or folic acid. Macropolycytes (Fig. 3.8) should
not be confused with hypersegmented neutrophils: they are
twice the size of normal neutrophils and the nucleus is twice as
big. This is because one cell division has been missed during
neutrophil production. Macropolycytes are likely to have 92
Fig. 3.6 A neutrophil with two very round lobes in a patient with the
congenital Pelger–Huët anomaly.
Assessing White Cells and Platelets
49
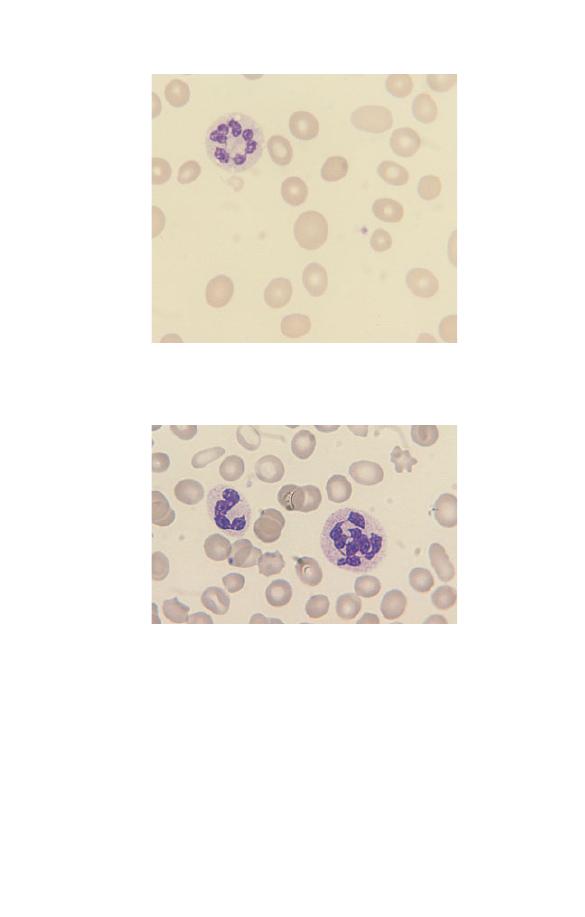
Fig. 3.8 A macropolycyte compared with a normal neutrophil. The
macropolycyte is twice as large as the normal neutrophil and has a
nucleus with seven or eight lobes which is also twice as large as a normal
neutrophil nucleus.
rather than 46 chromosomes, i.e. they are likely to be tetraploid
rather than diploid. Although their nuclei may have six or more
lobes, macropolycytes do not have the same significance
as hypersegmented neutrophils and should be distinguished from
them.
Fig. 3.7 A hypersegmented neutrophil in a patient with megaloblastic
anaemia. The neutrophil nucleus has seven lobes.
50
Chapter 3

Granulocyte precursors and nucleated red cells may be present
simultaneously in the peripheral blood. This can occur as a
normal phenomenon in pregnancy but otherwise it is mainly
seen in severely ill patients, who are usually anaemic. The anae-
mia is referred to as a leucoerythroblastic anaemia. Leucoeryth-
roblastic anaemia is indicative of either a bone marrow disease
(e.g. idiopathic myelofibrosis), bone marrow infiltration (e.g. by
carcinoma cells) or a severe systemic illness (e.g. severe infection
or haemorrhagic shock).
Assessing lymphocyte morphology
Congenital abnormalities of lymphocytes are rare. Most abnor-
malities of lymphocyte morphology are caused by viral infec-
tions. Less often, increased numbers of lymphocytes showing a
variable degree of morphological abnormality are indicative of a
neoplastic process, either a lymphoid leukaemia or a lymphoma
(see Chapter 4). The most striking reactive changes in lympho-
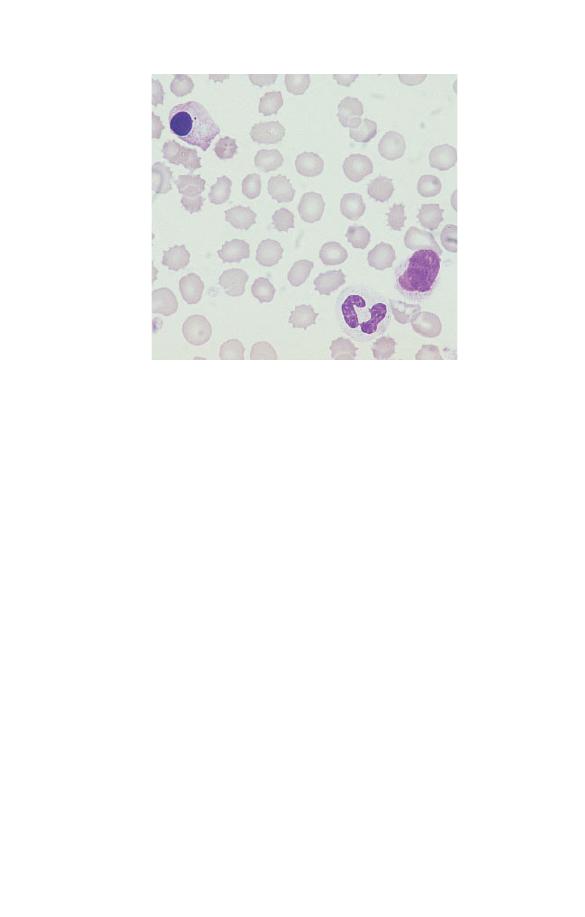
cyte morphology are seen in infectious mononucleosis, an illness
caused by an acute infection by the Epstein–Barr (EB) virus.
There is lymphocytosis and lymphocytes are morphologically
very abnormal (Fig. 3.9). Some are very large, some have primi-
tive nuclei with a diffuse chromatin pattern and nucleoli, some
nuclei are lobulated, some cells have voluminous basophilic
cytoplasm. The cells are pleomorphic, i.e. they vary greatly in
size and shape. The lymphocytes are so abnormal that initially
their true nature was not known and they were referred to as
atypical mononuclear cells. Now they are more often referred to
as atypical lymphocytes. Large numbers of atypical lym-
phocytes, similar to those seen in infectious mononucleosis, can
also occur in infection by cytomegalovirus, hepatitis A virus and
adenovirus and during the parasitic infection, toxoplasmosis.
Smaller numbers of atypical lymphocytes are seen in many other
viral, bacterial, rickettsial and protozoan infections.
Other reactive changes, in addition to those typical of
infectious mononucleosis, occur in lymphocytes both during
infection and during exposure to other antigenic stimuli. B
lymphocytes may differentiate into plasma cells (Fig. 3.10) with
an increased amount of basophilic cytoplasm, a pale-staining
Assessing White Cells and Platelets
51
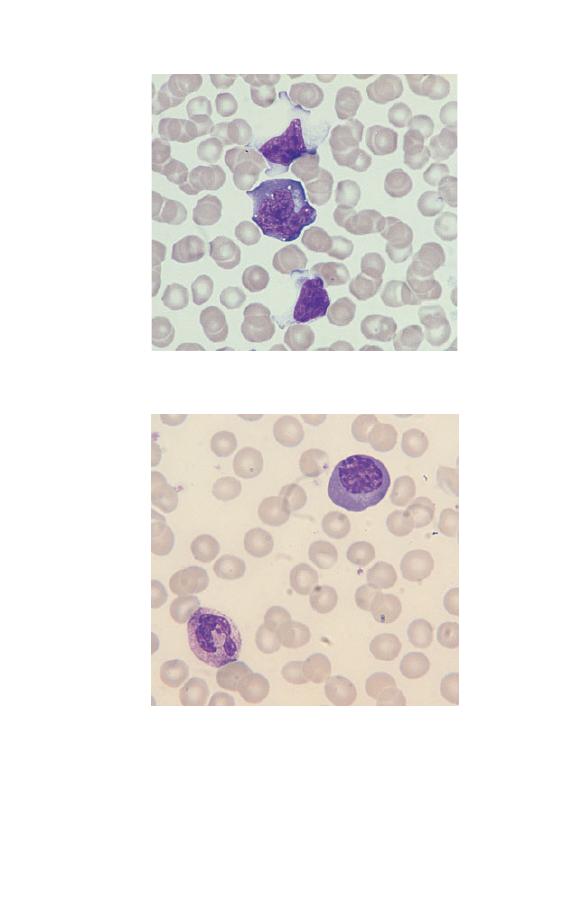
Fig. 3.10 A plasma cell (occurring as a reactive change in a patient with
infection). The chromatin is clumped and a Golgi zone is apparent below
the nucleus.
Fig. 3.9 Atypical lymphocytes (in infectious mononucleosis).
52
Chapter 3
area near the nucleus (the Golgi zone) and an eccentric nucleus
with clumped chromatin. There may also be plasmacytoid lym-
phocytes with characteristics intermediate between those of
lymphocytes and plasma cells. An increase of large granular
lymphocytes can also occur as a reactive change, e.g. during
chronic viral infection. These cells may be indistinguishable
from normal large granular lymphocytes but sometimes they
show features of activation such as a larger size and more volu-
minous basophilic cytoplasm.
Characteristic morphological changes occur in lymphocytes in
different types of leukaemia and lymphoma (see Chapter 4).
Assessing morphology of monocytes,
eosinophils and basophils
Numerical changes in monocytes, eosinophils and basophils are
often useful in diagnosis but this is less often the case with
morphological changes.
Monocytes can show increased size and cytoplasmic vacuola-
tion during infection. Immature monocytes with increased gran-
Fig. 3.11 Eosinophil leucocytosis with one of the three eosinophils being
markedly hypogranular.
Assessing White Cells and Platelets
53

ulation and cytoplasmic basophilia can occur both in infections
and in leukaemia and related conditions.
Eosinophils can show a variety of morphological abnormalities
(Fig. 3.11) including hyper- and hypolobulation, reduced granula-
tion and cytoplasmic vacuolation. However, these changes occur
in reactive eosinophilia (e.g. in parasitic infection) and also in
eosinophilic leukaemia so they are not useful in differential
diagnosis.
Basophils sometimes show reduced granulation but since this
can occur as a laboratory artefact as well as during allergic reac-
tions and in leukaemia and related disorders, its detection is not
very helpful in diagnosis.
Assessing platelet morphology
Platelets may be smaller than normal (Fig. 3.2) or, more often,
larger than normal (Fig. 3.3). Very large platelets are sometimes
referred to as giant platelets. An increased variability in platelet
size is referred to as platelet anisocytosis (Fig. 3.3). Platelet size
is of diagnostic significance, particularly if considered in relation
to the platelet count. Small or normal-size platelets in associa-
tion with thrombocytopenia suggest that the cause is a failure of
bone marrow production, whereas thrombocytopenia with large
platelets is more likely to be caused by peripheral destruction or
consumption of platelets with the bone marrow responding by
increasing platelet production. Platelet size is also useful in
assessing the likely cause of thrombocytosis. In reactive throm-
bocytosis (e.g. caused by severe infection or inflammation) the
platelets are usually of normal size, whereas when thrombocyto-
sis is a feature of a myeloproliferative disorder (chronic granulo-
cytic leukaemia, essential thrombocythaemia or polycythaemia
rubra vera) platelet size is generally increased and some giant
platelets are present.
Platelets may show defective or absent granulation. Often this
is an artefactual change, because the blood specimen has partly
clotted or because platelets have aggregated and have discharged
some or all of their granules (see Fig. 1.21). If an artefact is
excluded then the detection of defectively granulated platelets is
54
Chapter 3

of diagnostic significance. It occurs as a rare congenital anomaly
(the grey platelet syndrome), but usually it is consequent on a
bone marrow disease such as one of the myeloproliferative or
myelodysplastic disorders.
Assessing White Cells and Platelets
55

56
CHAPTER 4
Haematological
Findings in
Health and
Disease
The blood film and count in healthy individuals
The microscopic features of normal blood cells and the normal
range for the blood count have been discussed in Chapter 1. In
assessing what is ‘normal’ it is necessary to consider the gender,
age and ethnic origin of the person being investigated.
Gender
Adult men have a higher normal range for RBC, Hb and PCV/Hct
than adult women but women tend to have a somewhat higher
WBC and platelet count (see Table 1.2).
Neonates, infants, and children
The blood counts of healthy neonates, infants and children differ
greatly from those of healthy adults (see Table 1.3). Neonates
have a higher Hb, MCV, WBC, neutrophil count and lymphocyte
count than adults. Children in general have a higher lymphocyte
count than adults. They tend to have a slightly lower Hb and
MCV.
Pregnancy
Physiological variation in the blood count occurs during preg-
nancy. The Hb falls, the MCV rises slightly and the WBC and
neutrophil count rise. Immature cells (myelocytes and occasion-
A Beginner’s Guide to Blood Cells, 2nd Edition
Barbara J. Bain
Copyright © 1996, 2004 by Blackwell Publishing Ltd

al promyelocytes) appear in the blood and there may be ‘toxic’
granulation and Döhle bodies.
Ethnic variation
The blood counts of healthy Africans and Afro-Caribbeans (see
Table 1.3) often show a lower white cell and neutrophil count
than is usual in Caucasians (see Table 1.2). There is also a
tendency to a lower platelet count, particularly in Africans.
Abnormalities of red cells
Polycythaemia
Polycythaemia is an increase in the Hb. It is usually accompa-
nied by an increase in the RBC and PCV/Hct. It can be caused by
a true increase in the total volume of red cells in the circulation
(true polycythaemia) or by a decrease in the total plasma volume
(apparent or relative or pseudo-polycythaemia). It is not possible
to distinguish true from apparent polycythaemia by a blood film
or count. True polycythaemia is caused by overproduction of red
cells. Normally red cell production is driven by erythropoietin
production in response to a diminished oxygen supply to the
kidney. Overproduction of red cells may be an erythropoietin-
mediated physiological response to hypoxia or it may be caused
by inappropriate secretion of erythropoietin or by mechanisms
independent of erythropoietin. Some of the important causes of
polycythaemia, classified according to mechanism, are shown in
Table 4.1.
Polycythaemia vera
Polycythaemia vera, also referred to as polycythaemia rubra vera
or primary proliferative polycythaemia, is a myeloproliferative
disorder characterized by overproduction of red cells. In many
patients there is also overproduction of white cells and platelets.
Clinical features are facial plethora and sometimes a moderate
degree of splenomegaly. The disease may be complicated by
arterial thrombosis and peripheral ischaemia.
Haematological Findings
57

Table 4.1 Some important causes of polycythaemia, classified according to
mechanism.
Relative polycythaemia
Acute loss of water from the body
or plasma from the blood stream,
e.g. dehydration, shock or burns
Chronic reduction of plasma
volume, sometimes due to
cigarette smoking, sometimes
idiopathic, diuretic use
True polycythaemia,
Living at a high altitude, hypoxic
erythropoietin-mediated,
lung disease, cyanotic heart
resulting from hypoxia
disease, hypoventilation (e.g. due
to extreme obesity)
True polycythaemia,
High-affinity haemoglobin or
erythropoietin-mediated,
abnormal haemoglobin without
resulting from tissue hypoxia
oxygen-carrying capacity, e.g.
increased carboxyhaemoglobin
in heavy smokers or
methaemoglobinaemia
(congenital or acquired)
True polycythaemia,
Renal artery stenosis
erythropoietin-mediated, due to
inadequate blood supply to the
kidney
True polycythaemia due to
Renal disease: renal cysts, renal
inappropriate erythropoietin
tumours
secretion
Other inappropriate erythropoietin
production: hepatic tumours,
cerebellar haemangioblastoma,
uterine fibroids
True polycythaemia, independent
Polycythaemia vera
of erythropoietin, due to
intrinsic bone marrow disease
The blood film is ‘packed’. The number of neutrophils, ba-
sophils, and platelets may be increased and some giant platelets
may be present. Increased numbers of basophils are particularly
important in diagnosis since they are not increased in any of the
other causes of true or apparent polycythaemia.
Further steps
: Confirm the high Hb on a repeat blood sample.
Check history and physical findings. Is the patient hypoxic or a
heavy smoker? Check the blood film for neutrophilia, basophilia
and giant platelets. If the cause is not obvious, measure red cell
58
Chapter 4

mass and plasma volume to check if this is a true or a relative
polycythaemia. If it is a true polycythaemia and the patient is
not hypoxic, do an ultrasound examination of the abdomen to
assess the kidneys and spleen, measure serum erythropoietin
concentration and do a trephine biopsy of the bone marrow.
Anaemia and other disorders of red cell production
Anaemia is a reduction of the Hb, usually accompanied by a
reduction in the RBC and PCV/Hct. A reduction of the RBC, Hb
and PCV/Hct can also be factitious, when a blood specimen has
been taken from a vein above an intravenous infusion or when
there has been poor mixing of the specimen in the laboratory.
Laboratory workers must be alert to the possibility of such mis-
leading results. Table 4.2 summarizes the causes of anaemia,
according to mechanism. Anaemia can also be classified accord-
ing to cell size, as microcytic, normocytic or macrocytic. This is
useful as it directs investigation to a more limited range of
Table 4.2 Some important causes of anaemia, classified according to
mechanism.
Blood loss
Reduced red cell life span (haemolytic anaemia)
Consequent on an intrinsic abnormality of red cells, either inherited
(e.g. hereditary spherocytosis or haemoglobin C disease) or acquired
(e.g. paroxysmal nocturnal haemoglobinuria)
Consequent on extrinsic (vascular or plasma) factors (e.g. haemolytic
uraemic syndrome, autoimmune haemolytic anaemia)
Inadequate production of red cells
Deficiency or iron, vitamin B
12
or folic acid
Aplastic or hypoplastic anaemias, either inherited or acquired (e.g.
Fanconi’s anaemia or drug-induced aplastic anaemia)
Ineffective production of red cells (e.g. myelodysplastic syndromes)
Bone marrow infiltration by malignant cells
Bone marrow fibrosis
Low-affinity haemoglobin
*
Abnormal distribution of red cells within the vasculature
Hypersplenism
*A rare mechanism of anaemia except that this is one of the causes of the
low Hb in sickle cell anaemia.
Haematological Findings
59

possibilities (Table 4.3). Anaemia can also be classified according
to the appearance of the red cells, e.g. as a spherocytic anaemia or
as a microangiopathic haemolytic anaemia. The more important
causes of anaemia will be discussed, together with other disor-
ders of red cell production, in the following pages.
Megaloblastic anaemia
Megaloblastic anaemia usually results from a deficiency of either
vitamin B
12
or folic acid. It can occur at any age but is common-
est in the elderly. Clinical features are those of anaemia (e.g.
pallor, fatigue, breathlessness) and in addition there may be mild
jaundice, inflammation of the tongue (glossitis) and, in the case
of vitamin B
12
deficiency, neurological complications.
Table 4.3 Some causes of anaemia with microcytic, normocytic or
macrocytic red cells.
Causes of microcytic anaemia
Iron deficiency anaemia
Anaemia of chronic disease
Thalassaemia (but thalassaemia trait more often causes microcytosis
without anaemia)
Congenital sideroblastic anaemia
Causes of normocytic anaemia
Early iron deficiency anaemia
Early anaemia of chronic disease
Recent blood loss
Combined deficiency of iron and either folic acid or vitamin B
12
Renal failure
Haemolytic anaemia (but may also be macrocytic)
Causes of macrocytic anaemia
Vitamin B
12
deficiency
Folic acid deficiency
Administration of certain drugs (e.g. hydroxyurea, azathioprine,
zidovudine)
Liver disease
Alcohol excess
Hypothyroidism
Haemolytic anaemia
Myelodysplastic syndromes
60
Chapter 4

The diagnosis can only be made with certainty from a bone
marrow examination, which shows asynchrony between nuclear
and cytoplasmic maturation, nuclear maturation being retarded.
However, the blood film and count are often so typical that there
is little doubt as to the diagnosis and, if further investigations
can be done rapidly and provide a definitive diagnosis, bone
marrow examination is not necessary.
The blood film (see Fig. 3.7) shows anaemia, macrocytosis,
anisocytosis and poikilocytosis. Macrocytes include both round
and oval macrocytes (whereas round macrocytes alone are charac-
teristic of macrocytosis for other reasons, e.g. liver disease or
ethanol excess). Anisocytosis and poikilocytosis become marked
as the anaemia becomes more severe. Poikilocytes include oval
cells, teardrop poikilocytes and red cell fragments. When anaemia
is severe, there may be some circulating NRBC, which show the
nucleocytoplasmic asynchrony of megaloblastic erythropoiesis
(Fig. 4.1). Neutrophils are hypersegmented; there is an increase in
the mean lobe count, the proportion of five-lobed neutrophils is
increased and some neutrophils with six, seven or more lobes may
be present. There may also be a few macropolycytes.
The FBC shows a fall in the Hb and PCV/Hct and a parallel
increase in the MCV and MCH. Mean cell haemoglobin concen-
tration is normal. There is a marked fall in the RBC. The RDW
is increased. When anaemia is very severe the rise in the MCV is
not as marked as might be expected. This is because of the
Fig. 4.1 Megaloblastic anaemia showing macrocytosis and a circulating
megaloblast.
Haematological Findings
61

concomitant marked anisocytosis and poikilocytosis with many
red cell fragments and small poikilocytes. With severe anaemia
the RDW is very abnormal and the HDW is also increased. In
severe cases the WBC and platelet count are reduced.
Further steps
: Check clinical history and physical findings. Is
the diet deficient in vitamin B
12
(vegan or very restricted vegetar-
ian diet) or folic acid (lack of liver and fresh fruit and vegetables)?
Has the patient had a total gastrectomy? Do the history or the
physical findings suggest alcohol excess, liver disease or malab-
sorption? Is the patient taking a drug known to cause macrocyto-
sis? Are there neurological features suggestive of vitamin B
12
deficiency (peripheral neuropathy, optic neuropathy, subacute
combined degeneration of the spinal cord, dementia)?
Assay serum vitamin B
12
and red cell folate and do liver and
thyroid function tests. Consider whether a bone marrow aspirate
is needed. If vitamin B
12
concentration is reduced, test for anti-
bodies to gastric parietal cells and intrinsic factor and consider a
Schilling test. If coeliac disease is suspected, test for antibodies
to endomysium and gliadin.
If haemolytic anaemia is possible, examine blood film for
polychromasia and specific features of various haemolytic anae-
mias, do reticulocyte count and measure serum bilirubin and
lactate dehydrogenase.
Iron deficiency anaemia
Iron deficiency anaemia occurs when the body’s stores of iron are
insufficient to maintain erythropoiesis. It occurs at any age but is
commonest in infancy, in menstruating girls and women and
during pregnancy. Clinical features are those of anaemia. Severe
cases may also have cracking at the corners of the mouth (angu-
lar cheilosis), atrophic glossitis and flat or spoon-shaped nails
(koilonychia).
The anaemia that develops is initially normocytic and normo-
chromic and subsequently hypochromic and microcytic (Fig.
4.2). There is mild to moderate anisocytosis and poikilocytosis.
Poikilocytes often include elliptocytes. The long, thin ellipto-
cytes of iron deficiency are sometimes referred to as pencil cells.
62
Chapter 4
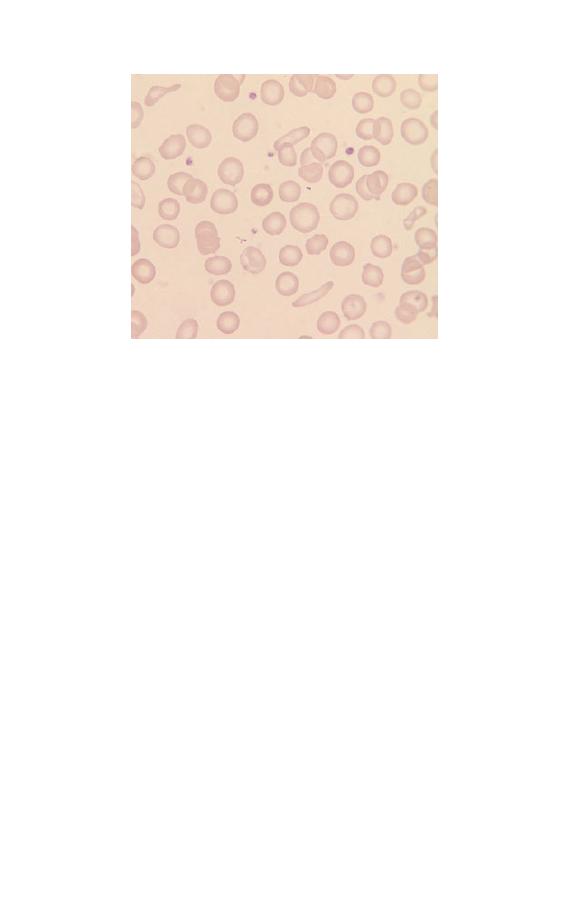
Fig. 4.2 Iron deficiency anaemia showing anisocytosis, anisochromasia and
the presence of poikilocytes including elliptocytes (pencil cells).
Target cells are uncommon and anisochromasia is characteristic,
two features that can be useful in making the distinction from
thalassaemia trait. The platelet count is sometimes increased.
The FBC initially shows a fall in the Hb and a rise in the RDW.
Subsequently there is a fall in the MCV and the MCH and, when
it is measured by a sensitive technique, a fall in the MCHC.
Further steps
: Check history and physical findings. Is the diet
adequate (vegetarian diets are often deficient in iron)? Is the
patient a rapidly growing child or adolescent or a woman who
has had repeated pregnancies? Is there a history of blood loss, e.g.
heavy menses (menorrhagia), vomiting blood (haematemesis),
passing black stools (melaena—indicative of upper gastrointesti-
nal blood loss)? Does the patient take aspirin or other drugs that
cause gastric ulceration or have a history of indigestion or diffi-
culty swallowing? Is there any bowel dysfunction suggestive of
malabsorption or a bowel lesion that could cause occult haemor-
rhage? Consider testing for coeliac disease (antiendomysial and
antigliadin antibodies).
Measure serum ferritin (low level confirms iron deficiency) or
both
serum iron and iron-binding capacity or transferrin concen-
Haematological Findings
63

tration (a low serum iron does not confirm iron deficiency
unless it is accompanied by a raised iron-binding capacity/
transferrin).
Remember, it is not sufficient to merely confirm a diagnosis of
iron deficiency. You must also find the reason.
Anaemia of chronic disease
The anaemia of chronic disease (Fig. 4.3) can result from chronic
infection, from chronic inflammatory diseases such as rheuma-
toid arthritis, or from malignant disease. Clinical features are
those of anaemia and of the primary disease. The mechanism of
anaemia is reduced delivery of iron from the reticuloendothelial
system to the developing erythroblast together with a blunted
erythropoietin response to anaemia and a minor degree of short-
ening of red cell survival. The anaemia is initially normocytic
and normochromic, but, when the condition is chronic and se-
vere, hypochromia and microcytosis may be marked. Poikilocy-
tosis is not marked. Because of an increased concentration of
plasma proteins, rouleaux formation is usually more marked
than in iron deficiency anaemia of equivalent severity and the
erythrocyte sedimentation rate (ESR) shows a more marked in-
crease. Other signs of an inflammatory response such as in-
creased background staining, neutrophilia and thrombocytosis
occur if the underlying disease is severe.
Fig. 4.3 Anaemia of chronic disease showing microcytosis, hypochromia
and anisochromasia.
64
Chapter 4

It may be impossible to distinguish between iron deficiency
anaemia and the anaemia of chronic disease on the basis of the
blood count and film, and assessment of iron stores is then
needed.
Further steps
: Check the history and physical findings. Is there
evidence of infection, an inflammatory condition or a malignant
disease? Are there laboratory markers of inflammation such as
neutrophilia, an increased ESR, increased C-reactive protein, in-
creased serum globulins. Measure ferritin (normal or high) or
both
serum iron and iron-binding capacity or transferrin (all
low). If it is not clear whether the patient has iron deficiency or
the anaemia of chronic disease or a combination of the two,
consider a bone marrow aspirate to assess iron stores.
Beta thalassaemia trait
Beta thalassaemia trait is the abnormality resulting from reduced
or absent function of one of the two beta globin genes. The
individual is heterozygous for a beta thalassaemia gene,
b
0
or
b
+
thalassaemia. The condition occurs in many ethnic groups in-
cluding populations from around the Mediterranean and from
the Indian sub-continent and South-East Asia, Africans, Afro-
Caribbean and Arabs. This is usually an asymptomatic condi-
tion, but, since the offspring of two carriers of beta thalassaemia
trait may suffer from thalassaemia major, its detection is impor-
tant. The diagnosis is most readily suspected from the FBC. The
Hb is usually normal or only slightly reduced although it may be
lower during pregnancy or intercurrent infection. The MCV and
MCH are reduced and the RBC is elevated. The MCHC may be
slightly reduced when it is measured by a sensitive instrument.
The high RBC is useful in making a distinction from iron defi-
ciency since a high RBC is quite uncommon in iron deficiency.
The RDW is more often normal in thalassaemia trait than in iron
deficiency.
The blood film may show only microcytosis and in such cases
the diagnosis may not be suspected from the blood film. In other
cases (Fig. 4.4) there is also hypochromia and the presence of
poikilocytes including target cells. Some patients have promi-
Haematological Findings
65

nent basophilic stippling and some have small numbers of irreg-
ularly contracted cells. These two features are not expected in
iron deficiency and their presence is therefore useful in the
differential diagnosis of microcytosis.
However, since blood film abnormalities may be subtle, diag-
nosis is dependent on the blood count and on carrying out a
specific test (measurement of haemoglobin A
2
concentration)
whenever a low MCV and MCH suggest the possibility of this
diagnosis.
Further steps
: Check the ethnic origin of the patient. Measure
the haemoglobin A
2
percentage. A high level generally confirms
beta thalassaemia trait. Don’t forget that genetic counselling
may be needed. If the red cell indices are typical of thalassaemia
trait but the haemoglobin A
2
is normal, consider the possibility
of alpha thalassaemia trait (see below). Less often, such indices
are the result of polycythaemia that has been treated by repeated
venesection and has caused iron deficiency—check the clinical
history.
Alpha thalassaemia trait
Alpha thalassaemia trait is the abnormality resulting from ab-
sence or reduced function of either one or two of the four alpha
globin genes. It is an asymptomatic condition. It is commonest
Fig. 4.4 Beta thalassaemia trait showing microcytosis, hypochromia and
poikilocytosis. The poikilocytes include target cells and several irregularly
contracted cells.
66
Chapter 4

among Africans and Afro-Caribbeans and in Chinese and South-
East Asian populations. Not all cases show an abnormality of the
blood film or count. Patients who lack only one of the four alpha
globin genes may have mild microcytosis or may be haematolog-
ically normal. Patients who lack two alpha globin genes usually
have an abnormality very similar to that of beta thalassaemia
trait, although basophilic stippling and target cells are less
common.
Further steps
: Usually the diagnosis of alpha thalassaemia trait
does not matter. However, in certain ethnic groups (Chinese,
South-East Asian, Greek, Cypriot, Turkish) there may be a chro-
mosome with no alpha genes. This is called
a
0
thalassaemia and
if it is present in both parents it can cause a severe anaemia,
incompatible with life, in a fetus. So check the ethnic origin and
arrange DNA analysis if the individual could have alpha thalas-
saemia trait and if this would be clinically relevant. If the MCH
is 26 fl or higher,
a
0
thalassaemia is very unlikely. Confirmation
of the diagnosis of
a
+
thalassaemia, the milder condition in
which only one of the two alpha genes on a chromosome is
missing, is not generally necessary.
Haemoglobin H disease
Haemoglobin H disease is an inherited condition characterized
by a moderately severe anaemia attributable in part to reduced
synthesis of haemoglobin and in part to haemolysis. It is caused
by deletion of three of the four alpha globin genes (or by muta-
tions of alpha globin genes leading to a similar reduction of alpha
globin synthesis). The reduced alpha globin production leads to a
thalassaemic disorder and to the production of an abnormal
haemoglobin, haemoglobin H, which has four beta globin chains
and no alpha chains. Haemoglobin H is present as a minor com-
ponent, the majority of haemoglobin being haemoglobin A. Hae-
moglobin H disease occurs in South-East Asia and around the
Mediterranean. Clinical features are anaemia and splenomegaly.
The blood film (Fig. 4.5) shows hypochromia and marked mi-
crocytosis and anisocytosis. Poikilocytosis is very striking with
poikilocytes including red cell fragments, teardrop poikilocytes
Haematological Findings
67
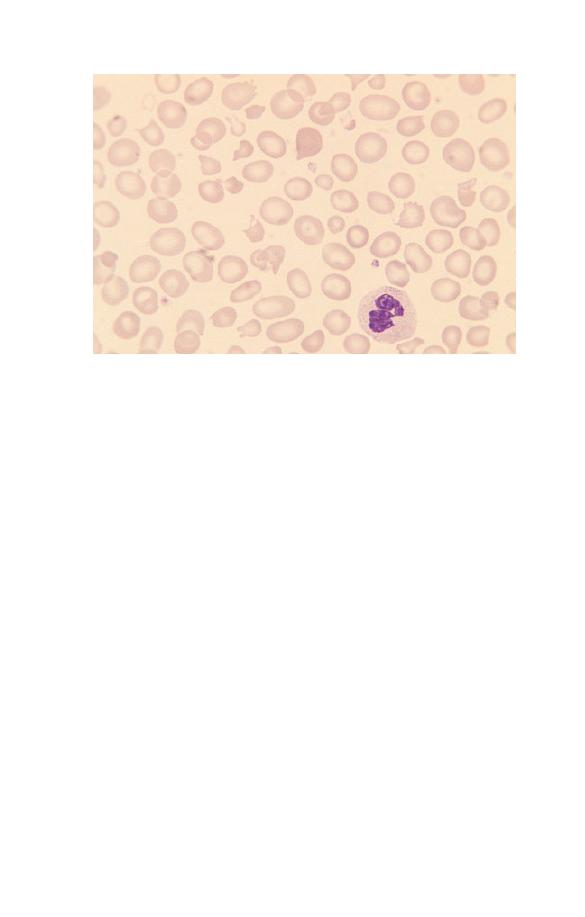
and target cells. There is polychromasia, correlating with an
increased reticulocyte count.
The Hb is moderately reduced (usually 6–10 g/dl). There is
marked reduction of the MCV and MCH, reduction of the
MCHC and an increased RDW and HDW.
Further steps
: Look for haemoglobin H inclusions by a specific
stain and look for haemoglobin H by haemoglobin electrophore-
sis or high performance liquid chromatography (HPLC). Check
for a raised reticulocyte count. Check the parents—at least one
of them should have only two alpha genes and thus should have
obvious alpha thalassaemia trait with an MCH less than 26 fl.
Hyposplenism
Reduced or absent splenic function is referred to as hyposplen-
ism. It can result from congenital absence or surgical removal of
the spleen or from loss of splenic function, e.g. because of splenic
atrophy or infarction. The blood film (see Fig. 2.28) shows target
cells, Howell–Jolly bodies, acanthocytes, occasional spherocytes,
Fig. 4.5 Haemoglobin H disease showing moderate hypochromia and
marked microcytosis, anisocytosis and poikilocytosis.
68
Chapter 4

occasional Pappenheimer bodies and some giant platelets. The
blood count may show increased neutrophils, lymphocytes or
platelets.
A degree of hyposplenism is normal in the neonatal period,
particularly in premature neonates. Otherwise hyposplenism is
abnormal and its detection is important. Patients may be una-
ware that a splenectomy has been carried out in the past, and
they and their physicians may therefore be unaware of the con-
sequent risk of overwhelming infection and the need for prophy-
lactic penicillin and certain vaccinations. Hyposplenism can also
provide a diagnostic clue to conditions such as coeliac disease
that can be associated with splenic atrophy.
When splenectomy is carried out in a patient with a haemato-
logical abnormality, post-splenectomy features are often modi-
fied or aggravated by the effects of the underlying disease. It is
also important to note the features of hyposplenism, when
present, since this might explain a haematological abnormality
such as thrombocytosis or lymphocytosis and avoid unnecessary
further investigations.
Further steps
: Check the history. Is the patient known to have
had a splenectomy or is there a history of a disease associated
with splenic atrophy (coeliac disease or dermatitis herpetiformis)
or replacement of functioning splenic tissue (amyloidosis)? Con-
sider a CT scan or other imaging technique to confirm unexpect-
ed hyposplenism, as this is an important diagnosis.
Hereditary spherocytosis
The term hereditary spherocytosis covers a heterogeneous group
of inherited red cell membrane disorders characterized by a
membrane spectrin deficiency, spherocytic red cells and either
haemolytic anaemia or compensated haemolysis. Inheritance is
most often autosomal dominant. Cases occur among many eth-
nic groups. Clinical features can include anaemia, jaundice and
the complications of gallstones.
The blood film shows that some, but not usually all, of the red
cells lack central pallor (see Fig. 2.12). In patients with anaemia
there may be polychromasia. The Hb may be normal or reduced.
Haematological Findings
69

MCHC is increased when it is measured by a sensitive method.
After splenectomy, spheroacanthocytes, i.e. spherical cells with
irregular spicules, may be very prominent (Fig. 4.6).
Further steps
: Check the family history and, if necessary, the
blood counts and films of both parents. An osmotic fragility
test confirms the present of spherocytes but is not necessary if it
is obvious that there are spherocytes. An autoimmune haemolyt-
ic anaemia is an important differential diagnosis, so check the
direct antiglobulin test (Coombs’ test). If the patient is in hospi-
tal, check that there has not been a recent blood transfusion
since a delayed haemolytic transfusion reaction can also cause
spherocytosis. In the neonatal period, consider haemolytic
disease of the newborn, particularly that due to ABO
incompatibility.
Hereditary elliptocytosis
The term hereditary elliptocytosis covers a heterogeneous group
of inherited red cell membrane abnormalities characterized by
elliptical red cells (see Fig. 2.14). Inheritance is usually autosom-
al dominant. Cases occur in many ethnic groups. Most cases are
not anaemic and many do not have significant haemolysis.
The blood film shows elliptocytes and some ovalocytes. Poly-
chromasia is usually absent. Cases with haemolytic anaemia
Fig. 4.6 Spherocytes, spheroacanthocytes and red cells containing
Pappenheimer bodies following splenectomy for hereditary spherocytosis.
70
Chapter 4

have polychromasia and, in addition to elliptocytes and ovalo-
cytes, often have other poikilocytes including some red cell
fragments. In the great majority of cases the FBC is normal.
Anaemic cases show a reduced Hb and increased RDW.
Further steps
: The diagnosis of hereditary elliptocytosis can
usually be made from the blood film. As haemolysis is unusual,
further diagnostic tests are not usually necessary.
Glucose-6-phosphate dehydrogenase deficiency
Glucose-6-phosphate dehydrogenase (G6PD) is a red cell enzyme
necessary to protect haemoglobin and other red cell proteins
from endogenous or exogenous oxidant stress. Deficiency of
G6PD leaves the individual susceptible to haemolysis during
infection (endogenous oxidants generated by neutrophils) or on
exposure to certain drugs, naphthalene in mothballs or fava
beans (exogenous oxidants). Inheritance is sex-linked recessive.
Cases occur in many ethnic groups but particularly in Africans,
Afro-Caribbean, Afro-Americans, and in populations from the
Middle East and around the Mediterranean. Most patients with a
deficiency are haematologically normal between attacks of acute
haemolysis.
During a haemolytic crisis the blood film (Fig. 4.7) shows
irregularly contracted cells, keratocytes (‘bite cells’) and red cells
with the haemoglobin retracted into half of the red cell mem-
brane (hemighosts). The irregularly contracted cells often have
protrusions that indicate the presence of Heinz bodies attached
to the red cell membrane. Heinz bodies are red cell inclusions
composed of denatured haemoglobin. They can be identified by a
specific supravital stain. Heinz bodies and severely damaged red
cells are removed by the spleen so that after a few days there are
fewer irregularly contracted cells but polychromasia, indicative
of a reticulocyte response, is then apparent.
Further steps
: A test for Heinz bodies is not always necessary
as it is often obvious from the very typical blood film that the
patient has haemolysis induced by an oxidant. An assay for
G6PD should be done. However, if the patient is already recover-
Haematological Findings
71
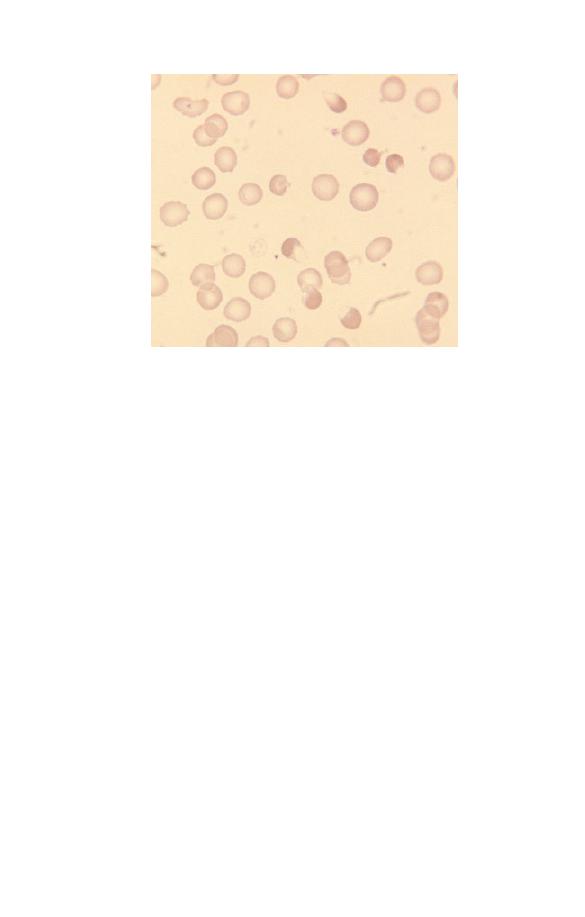
ing from the haemolysis and has a high reticulocyte count the
result may be normal. This is particularly likely to occur with
the type of G6PD deficiency that is found in those of African
ethnic origin; they generally have normal levels of G6PD in
reticulocytes although older cells are deficient; an episode of
acute haemolysis can thus paradoxically lead to a rise in the
G6PD concentration. Therefore, if the history and blood film
suggest the possibility of G6PD deficiency but the assay is nor-
mal, repeat the test when the patient has recovered from the
episode of haemolysis and the reticulocyte count has gone back
to normal.
Autoimmune haemolytic anaemia
Autoimmune haemolytic anaemia is anaemia caused by autoan-
tibodies, active at body temperature, directed at red antigens
(warm autoantibodies). The condition is uncommon and can
occur at any age.
The blood film (Fig. 4.8) shows spherocytosis and polychro-
matic macrocytes. The blood film in autoimmune haemolytic
Fig. 4.7 Blood film during an acute haemolytic episode in glucose-6-
phosphate dehydrogenase (G6PD) deficiency showing anaemia, irregularly
contracted cells (some with protrusions) and a hemighost.
72
Chapter 4
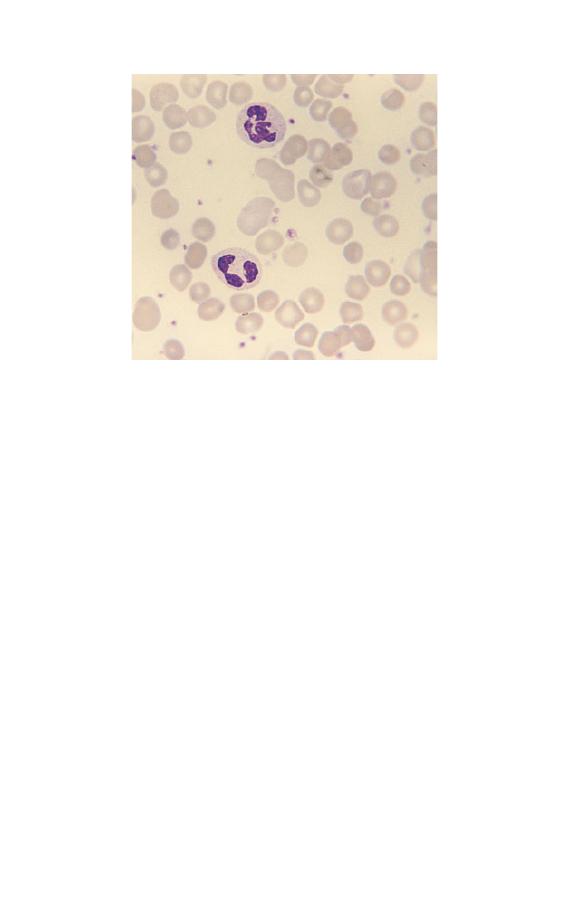
anaemia cannot be reliably distinguished from that of hereditary
spherocytosis, although anaemia and spherocytosis are often
more severe than is usual in hereditary spherocytosis. Occasion-
ally there are small red cell agglutinates or red cells that have
been ingested by monocytes. The blood count shows the same
abnormalities as are present in hereditary spherocytosis.
Further steps
: Check the direct antiglobulin test (Coombs’
test) to see if there is immunoglobulin or complement on the
surface of the red cells. Test for antinuclear activity and for the
presence of antibodies to double-stranded DNA, as an autoim-
mune haemolytic anaemia is often a feature of systemic lupus
erythematosus.
Beta thalassaemia major
Beta thalassaemia major is a severe, transfusion-dependent anae-
mia resulting from homozygosity or compound heterozygosity
for beta thalassaemia (
b
0
b
0
or
b
0
b
+
or
b
+
b
+
). It occurs in all the
ethnic groups with a significant incidence of beta thalassaemia
Fig. 4.8 Autoimmune haemolytic anaemia showing anaemia,
spherocytosis and several polychromatic macrocytes.
Haematological Findings
73

trait. Clinical features are those of severe anaemia and, in addi-
tion, hepatomegaly, splenomegaly and overexpansion of mar-
row-containing bones.
The blood film shows striking anisocytosis, poikilocytosis,
hypochromia and microcytosis. Poikilocytes include target cells.
Red cells often contain Pappenheimer bodies and show ba-
sophilic stippling. In patients who have also been splenect-
omized, Pappenheimer bodies are very numerous and
Howell–Jolly bodies are present. Sometimes there are precipi-
tates with the same staining characteristics as haemoglobin;
these are alpha chain precipitates, formed because of the lack of
the beta globin chains that would normally combine with the
alpha chains. NRBC are common. They show defective haemo-
globinization and dysplastic features such as nuclear lobulation
and fragmentation. There is marked reduction of the RBC, Hb,
PCV/Hct, MCV and MCH. The MCHC is also reduced and the
RDW is increased.
In patients who are being transfused (Fig. 4.9) there will be a
mixture of normal transfused cells and the patient’s cells show-
ing the above abnormalities.
Further steps
: In the absence of transfusion, beta thalassaemia
major is incompatible with life so the diagnosis is usually made
in infancy. The affected infants are found to become anaemic
from around 6 months of life, as synthesis of fetal haemoglobin
stops and synthesis of adequate amounts of haemoglobin A does
not occur. The infant requires haemoglobin electrophoresis or
high performance liquid chromatography (HPLC). This will
show either no haemoglobin A or only small amounts with the
only haemoglobin present in significant amounts being haemo-
globin F. Both parents should be tested for beta thalassaemia trait
and genetic counselling should be given. Beyond the neonatal
period, the differential diagnosis is with beta thalassaemia inter-
media. This is a genetically heterogeneous group of disorders
that are more severe than beta thalassaemia trait but are compat-
ible with life, even if not transfused.
74
Chapter 4

Fig. 4.9 Dimorphic blood film in a patient with thalassaemia major who
was being transfused. The transfused red cells appear normal whereas the
patient’s red cells show hypochromia, anisocytosis, poikilocytosis and
Pappenheimer bodies. One hypochromic cell (bottom right) contains an
alpha chain precipitate. There are three NRBC, which show cytoplasmic
defects consequent on the failure of haemoglobin synthesis.
Sickle cell anaemia
Sickle cell anaemia results from homozygosity for an abnormal
beta globin gene, the
b
S
gene. As there is no normal beta gene
there is no synthesis of normal beta globin and consequently no
haemoglobin A can be produced. The haemoglobin is almost all
haemoglobin S with a small amount of haemoglobin A
2
and a
variable, sometimes increased, amount of haemoglobin F. Sickle
cell anaemia is commonest in those of African ancestry but
occurs also in other ethnic groups including Indians, Arabs and
Greeks. The most prominent clinical feature is recurrent painful
crises caused by tissue infarction.
The blood film in sickle cell anaemia (see Fig. 2.21) shows
anaemia, sickle cells, boat-shaped cells and target cells. Once
infancy is past, the changes of hyposplenism are also present, as a
result of splenic infarction. Most striking is the presence of
Howell–Jolly bodies but there are also some Pappenheimer
Haematological Findings
75

bodies. NRBC are usually present and the WBC, neutrophil count,
lymphocyte count and platelet count are often elevated. Polychro-
masia is usually present. The lack of polychromasia in sickle cell
anaemia is a significant finding since it may indicate that red cell
production has ceased and severe anaemia is developing, usually
as a consequence of intercurrent parvovirus B19 infection.
The blood count usually shows an Hb of 7–9 g/dl. Some pa-
tients have a reduced MCV and MCH. The RDW is increased.
Further steps
: Do haemoglobin electrophoresis or HPLC anal-
ysis to demonstrate the absence of haemoglobin A and the pres-
ence of mainly haemoglobin S with some haemoglobin A
2
and F.
Check parents and confirm that both carry haemoglobin S. If the
MCV and MCH are normal or near normal the diagnosis of sickle
cell anaemia is confirmed but if the patient has microcytic red
cells the diagnosis could also be compound heterozygosity for
haemoglobin S and beta
0
thalassaemia. Family studies may per-
mit the distinction but if this is not possible DNA analysis can
be carried out. In an emergency, the diagnosis of sickle cell
anaemia can be made fairly reliably by consideration of the Hb,
red cell indices, blood film and sickle solubility test.
Sickle cell trait
Sickle cell trait is an asymptomatic condition consequent on
heterozygosity for the
b
S
gene. Haemoglobin S and haemoglobin
A are present in similar amounts although there is somewhat
more haemoglobin A than haemoglobin S. The blood film may
either be normal or show microcytosis or target cells. The FBC
may be normal or show microcytosis. Since both the blood film
and the blood count may be normal it is clear that the diagnosis
of sickle cell trait cannot be based on either but requires specific
tests for its detection.
Further steps
: Haemoglobin electrophoresis or HPLC is re-
quired. The nature of a variant haemoglobin with characteristics
suggestive of haemoglobin S on one of these tests must be con-
firmed by a sickle solubility test or by use of two independent
methods, e.g. both haemoglobin electrophoresis and HPLC.
76
Chapter 4

Sickle cell trait (haemoglobin S less than 50%) has to be distin-
guished from sickle cell/beta
+
thalassaemia compound heterozy-
gosity (haemoglobin S greater than 50%).
In an emergency, sickle cell trait can be provisionally diag-
nosed from the Hb, red cell indices, blood film and sickle solubil-
ity test. Sickle cell/haemoglobin C compound heterozygosity
can also have a normal Hb and red cell indices but the blood film
is much more abnormal than that of sickle cell trait (see below).
Sickle cell/haemoglobin C disease
Patients who are compound heterozygotes for haemoglobin S
and haemoglobin C have these two haemoglobins in approxi-
mately equal amounts. Since they have no normal beta genes
they cannot produce haemoglobin A. Sickle cell/haemoglobin C
disease occurs in those with West African ancestry (since haemo-
globin C originated in West Africa). Symptoms can be similar to
those of sickle cell anaemia but are usually milder.
The blood film shows target cells, irregularly contracted cells
and boat-shaped cells but classic sickle cells are much less fre-
quent than in sickle cell anaemia. Many patients have a variable
number of typical poikilocytes containing both haemoglobin S
and haemoglobin C (SC poikilocytes) (see Fig. 2.22). There
may be NRBC, polychromasia and features of hyposplenism but
these are all less prominent than in sickle cell anaemia. Rare red
cells may be found containing haemoglobin C crystals, recog-
nized by their parallel edges. The FBC may show a normal Hb
or a mild anaemia, the Hb being generally higher than 8 g/dl.
Some patients have a reduced MCV and some have an elevated
MCHC.
Further steps
: Haemoglobin electrophoresis or HPLC, supple-
mented by a sickle solubility test, is required. Two independent
tests are required to confirm the diagnosis.
Haemoglobin C disease
Haemoglobin C disease is consequent on homozygosity for an
abnormal beta gene,
b
C
. There is no haemoglobin A. This condi-
Haematological Findings
77

tion occurs in people of West African ancestry. There is a chronic
haemolytic anaemia, which may be asymptomatic or lead to
gallstones.
The blood film (see Fig. 2.13) usually shows a mixture of target
cells and irregularly contracted cells. Rare cells may contain
haemoglobin C crystals. The FBC usually shows a mild to mod-
erate anaemia. The MCV and MCH are often reduced and the
MCHC is often increased.
Further steps
: Haemoglobin electrophoresis or HPLC is re-
quired. Two independent tests are required to confirm the diag-
nosis. If there is microcytosis, an alternative diagnosis of
haemoglobin C/beta
0
thalassaemia must be considered.
Abnormalities of white cells
Neutrophil leucocytosis (neutrophilia)
An increased neutrophil count is usually caused by increased
bone marrow output. However, it can also be caused both by
mobilization of the marginated granulocyte pool (neutrophils
which have been adherent to the endothelium), e.g. following
vigorous exercise or an epileptic fit, and by decreasing egress of
neutrophils to the tissues, e.g. after administration of high doses
of corticosteroids. Some important causes of neutrophil leucocy-
tosis are shown in Table 4.4.
Bacterial infection
Most patients with bacterial infection have a neutrophil leucocy-
tosis. The blood film may also show a left shift, toxic granula-
tion, Döhle bodies and vacuolation (Fig. 4.10). There may be
small numbers of atypical lymphocytes (e.g. plasmacytoid lym-
phocytes). There is lymphopenia and eosinopenia. If the bacterial
infection becomes more chronic there may also be monocytosis,
anaemia and increased rouleaux formation.
It is important not to misinterpret the physiological changes of
pregnancy and the post-partum period as being due to infection.
It should also be noted that all the changes characteristic of
78
Chapter 4
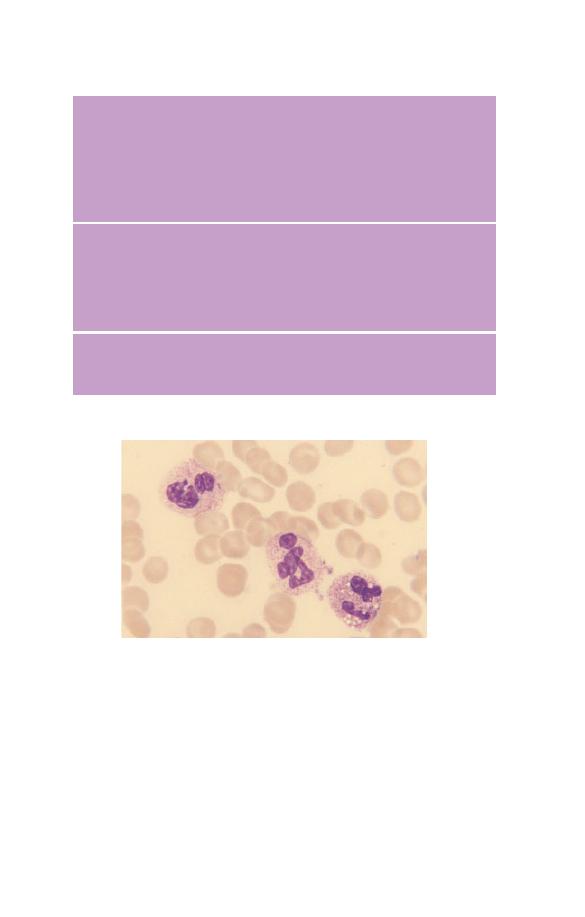
infection can be caused by the administration of granulocyte and
granulocyte–macrophage colony-stimulating factors.
Further steps
: Consider the clinical setting to exclude causes
of neutrophilia other than bacterial infection. Look for other
blood film features typical of bacterial infection.
Table 4.4 Some important causes of neutrophil leucocytosis.
Physiological and pharmacological
Neonatal period, pregnancy and the post-partum period
Mobilization of marginated granulocyte pool – exercise, epinephrine
(adrenaline) injection, epileptic convulsions
Administration of cytokines, e.g. granulocyte or granulocyte–
macrophage colony-stimulating factors (G-CSF or GM-CSF)
Administration of high-dose corticosteroids or lithium
Reactive
Infection (particular bacterial infection)
Tissue infarction (e.g. myocardial infarction)
Other tissue damage (e.g. trauma, surgery, burns)
Acute inflammation
Acute haemorrhage or hypoxia
Neoplastic
Leukaemia (particularly chronic myeloid leukaemia)
Myeloproliferative disorders
Fig. 4.10 Blood film in acute infection showing neutrophil leucocytosis,
toxic granulation and vacuolation.
Haematological Findings
79
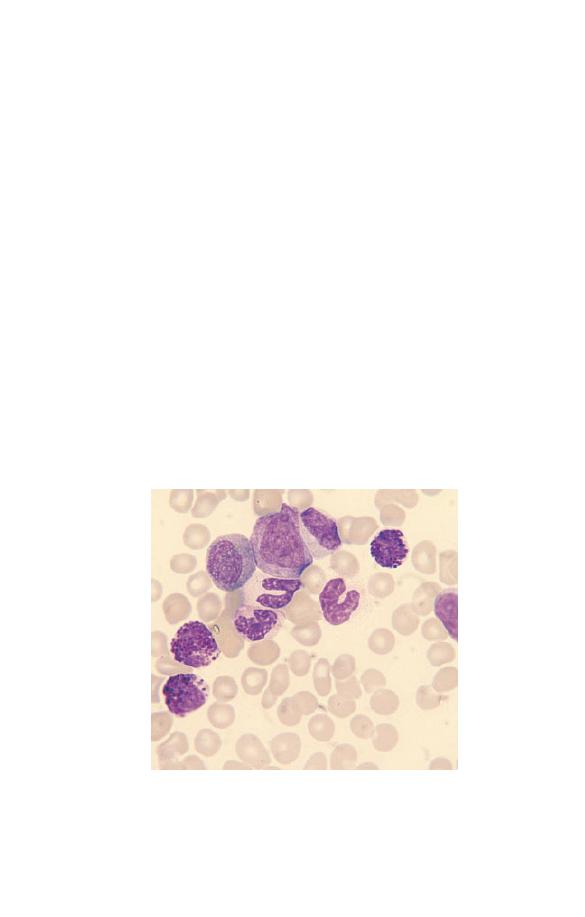
Fig. 4.11 Chronic myeloid (chronic granulocytic) leukaemia showing three
basophils, an eosinophil myelocyte and mature and immature cells of
neutrophil lineage.
Chronic myeloid leukaemia
Chronic myeloid leukaemia (also called chronic granulocytic
leukaemia because the main cells produced are granulocytes) is a
distinctive neoplastic condition, which, in the great majority of
cases, is associated with a specific acquired cytogenetic abnor-
mality in all myeloid cells. This is a translocation between
chromosomes 9 and 22, known as t(9;22), leading to the forma-
tion of an abbreviated chromosome 22 known as the Philadel-
phia (Ph) chromosome.
Chronic myeloid leukaemia occurs at any age, mainly from
late adolescence to old age. The disease is rare in children but
occasional cases do occur. Clinically there is marked splenome-
galy and a lesser degree of hepatomegaly.
The blood film is very characteristic (Fig. 4.11) and a correct
diagnosis can usually be made from the blood count and film
alone. There is a marked leucocytosis with the most frequent
cells being myelocytes and mature neutrophils. There is a less
marked increase in metamyelocytes, promyelocytes and blast
cells. Basophils are increased in number in virtually all cases and
eosinophils in about 80% of cases. Monocytes are increased,
80
Chapter 4

but not in proportion to cells of the granulocyte lineages. There
is usually a mild to moderate normocytic, normochromic
anaemia. The platelet count is most often normal or increased
but is occasionally reduced. The white cells do not usually show
any dysplastic features, nor are there any reactive or ‘toxic’
features such as toxic granulation, Döhle bodies or neutrophil
vacuolation.
Further steps
: A very accurate diagnosis is required because
there is now very specific treatment for this type of leukaemia.
All patients in whom the diagnosis is suspected require cytoge-
netic analysis of bone marrow cells to detect the t(9;22) translo-
cation. If it is not detected but the suspicion of the diagnosis
is strong, molecular genetic analysis is also needed to see if the
fusion gene that usually results from a t(9;22) transloca-
tion (BCR–ABL fusion) is present despite the absence of the
translocation.
Chronic myeloid leukaemia is not usually confused with reac-
tive neutrophilia, e.g. as a response to infection, because an
increase in the eosinophil and basophil counts does not generally
occur in infection, the number of granulocyte precursors in the
blood is generally less and reactive changes such as toxic granu-
lation, are often present.
Lymphocytosis and morphologically abnormal
lymphoid cells
Lymphocytosis can be caused by increased mobilization of lym-
phocytes from tissues into the blood stream or by increased
production of lymphocytes, either in response to an antigenic
stimulus or as a neoplastic condition. Transient lymphocytosis,
due to redistribution of lymphocytes, occurs as an acute response
to severe physical stress. When there is lymphocytosis as a re-
sponse to an infection there are often also morphological changes
in lymphocytes; these are most striking in infectious mononucl-
eosis, in which atypical lymphocytes (see Fig. 3.9) are numerous.
More subtle reactive changes in lymphocytes are common in
other infections, particular infections in children or viral infec-
tions at any age. Lymphoid cells are also morphologically abnor-
Haematological Findings
81

mal in lymphoid neoplasms. Some of the important causes of
lymphocytosis are shown in Table 4.5.
Further steps
: Assess the clinical history and physical findings.
Has there been sudden severe physical stress? Are there signs or
symptoms of infection, such as fever or sore throat? Is there
enlargement of lymph nodes, liver or spleen, suggestive of a
lymphoproliferative disorder? The blood count needs to be re-
peated to exclude transient lymphocytosis. Persistent lymphocy-
tosis is usually an indication for immunophenotyping the cells
to facilitate diagnosis of a lymphoproliferative disorder.
Chronic lymphocytic leukaemia
Chronic lymphocytic leukaemia is a disease of the middle-aged
and elderly. In the early stages of the disease there may be no
abnormal physical findings. Later there is lymphadenopathy,
hepatomegaly and splenomegaly.
The blood film in chronic lymphocytic leukaemia (Fig. 4.12) is
characterized by an increase of small, mature lymphocytes
(which are of B lineage). In the early stages the lymphocyte count
is only moderately elevated but later the count may be very high.
Table 4.5 Some important causes of lymphocytosis.
Physiological and caused by kinetic alterations
Exercise
Epinephrine (adrenaline) administration
As an early acute reaction to physical stress (e.g. following trauma,
sickle cell crisis, myocardial infarction, cardiac arrest)
Reactive
Infections [particularly viral and rickettsial infections,
whooping-cough (pertussis), bacterial infections in infants and
young children]
Neoplastic
Chronic lymphocytic leukaemia
Other lymphoid leukaemias
Lymphomas in leukaemic phases
82
Chapter 4
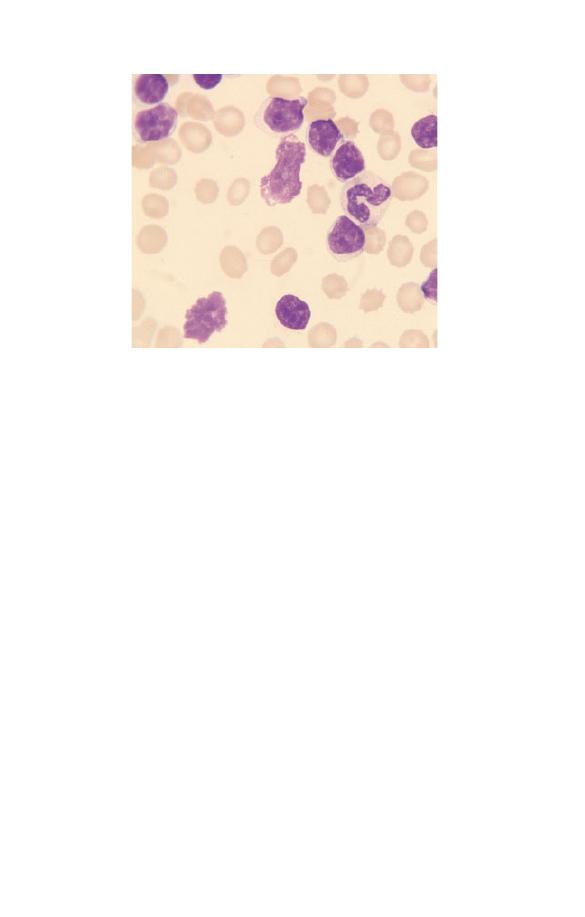
The cells are more uniform in appearance than normal small
lymphocytes. Both the cell and the nucleus have a smooth regu-
lar outline. The nucleocytoplasmic ratio is high. The nuclear
chromatin is usually moderately condensed and nucleoli are not
usually apparent. Often nuclear chromatin is coarsely clumped,
giving a mosaic or paving-stone pattern. The cytoplasm is agran-
ular but occasionally contains crystals or globular inclusions.
Smear cells, formed when the cell is disrupted during the spread-
ing of the film, are characteristic but not pathognomonic. In
some patients there is anaemia or thrombocytopenia. Anaemia
can be caused by complicating autoimmune haemolytic anaemia
and in these cases spherocytes are apparent.
Further steps
: If the lymphocytosis is persistent, immunophe-
notyping is usually indicated to confirm the diagnosis, even if
the patient does not have lymphadenopathy or hepatosplenome-
galy. However, elderly patients with early disease need to be
reassured as disease progression is often slow and they may not
need treatment for many years, if at all. Nevertheless, confirm-
ing the diagnosis means that the patient’s general practitioner is
Fig. 4.12 Chronic lymphocytic leukaemia, showing lymphocytosis with an
increase of mature small lymphocytes. There are two smear cells.
Haematological Findings
83
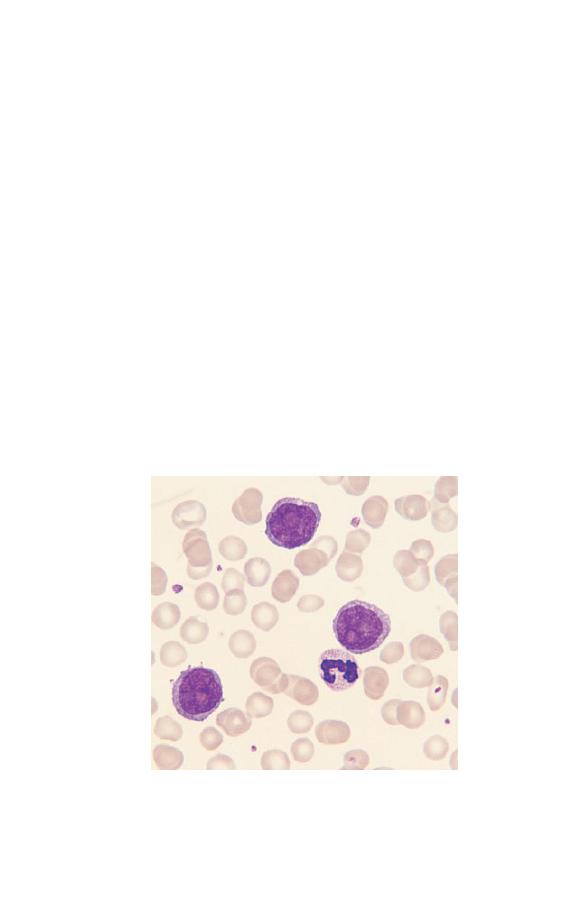
alert to the possibility of common complications, such as herpes
zoster, that may need treatment. A bone marrow aspirate and
trephine biopsy does not yield much information in the early
stages of the disease, but these investigations are indicated if
there is a possibility that the patient will soon need treatment. If
there are spherocytes, a direct antiglobulin test is indicated to
confirm the presence of complicating autoimmune haemolytic
anaemia.
Prolymphocytic leukaemia
Prolymphocytic leukaemia is a disease of the middle-aged and
elderly. Clinically there is marked splenomegaly and minor lym-
phadenopathy.
The WBC is usually markedly elevated and there is an increase
of lymphoid cells, which are morphologically very abnormal
(Fig. 4.13). They are larger than normal lymphocytes with a large
and prominent nucleolus. The chromatin shows irregular
condensation.
Fig. 4.13 Prolymphocytic leukaemia (B-lineage) showing three
prolymphocytes. These cells are larger than the cells of chronic
lymphocytic leukaemia and have large, prominent nucleoli.
84
Chapter 4

Further steps
: Immunophenotyping is indicated to confirm
that there is a clonal B-cell population.
Follicular lymphoma
Lymphomas are lymphoid neoplasms that predominantly affect
lymph nodes and other lymphoid tissues. However, lymphomas
may infiltrate the bone marrow and there may be an overspill of
lymphoma cells into the blood. Follicular lymphoma is a disease
of adult life. It is characterized clinically by lymphadenopathy,
splenomegaly or both, and pathologically by a nodular or follicu-
lar growth pattern of neoplastic cells in lymph nodes. A signifi-
cant minority of patients have circulating lymphoma cells.
Follicular lymphoma cells are usually smaller than the cells of
chronic lymphocytic leukaemia and more pleomorphic. They
have very scanty cytoplasm. The nucleus shows a more even
chromatin distribution. Some cells have distinctive notches or
deep clefts (Fig. 4.14). Patients may have only small numbers of
circulating lymphoma cells or the abnormal cells may be suffi-
ciently numerous to cause a lymphocytosis. In those cases
with lymphocytosis it is important to note the distinctive
cellular features to avoid confusion with chronic lymphocytic
leukaemia.
Further steps
: Immunophenotyping is indicated to confirm
that there is a clonal B-cell population. Lymph node biopsy may
Fig. 4.14 Cleft lymphocyte in follicular lymphoma.
Haematological Findings
85

be needed to confirm the diagnosis. However, specific cytogenet-
ic and molecular genetic abnormalities are found in follicular
lymphoma and these analyses, together with immunophenotyp-
ing, can confirm the diagnosis and obviate the need for a general
anaesthetic for a lymph node biopsy.
Hairy cell leukaemia
Hairy cell leukaemia is a B-lineage lymphoid neoplasm with
distinctive neoplastic cells. It is a disease of adult life character-
ized clinically by splenomegaly without lymphadenopathy.
Hairy cells (Fig. 4.15) are larger than normal lymphocytes. The
nucleus is often round but is sometimes lobulated or shaped like
a peanut shell or a dumbbell. There is moderately plentiful,
weakly basophilic cytoplasm with irregular ‘hairy’ margins.
Hairy cells are usually present only in small numbers so a careful
search may be necessary to find and identify them. Pancytopenia
is usual with neutropenia being common and monocytopenia
being particularly severe.
Further steps
: Immunophenotyping is indicated to confirm
that there is a clonal B-cell population with a distinctive immu-
nophenotype. Cytochemistry, to demonstrate tartrate-resistant
acid phosphatase activity, can also confirm the diagnosis when
considered in conjunction with the cytological features. A tre-
phine biopsy is also diagnostically useful, showing characteristi-
cally widely spaced cells.
Fig. 4.15 Two hairy cells in hairy cell leukaemia.
86
Chapter 4

Multiple myeloma
Multiple myeloma is a plasma cell neoplasm in which the malig-
nant cells usually secrete an abnormal immunoglobulin known
as a paraprotein. The main site of disease is the bone marrow and
bones. Multiple myeloma is predominantly a disease of the mid-
dle-aged and elderly. Common clinical features are anaemia,
bone pain, pathological fractures, hypercalcaemia and renal
failure.
In the majority of patients the blood film shows increased
rouleaux formation and increased background staining between
the cells. Both are caused by the increased concentration of
immunoglobulin in the blood. There is a normocytic, normo-
chromic anaemia. Occasionally there are circulating myeloma
cells (see Fig. 2.4), which resemble normal plasma cells to
a greater or lesser extent, i.e. they may have plentiful basophilic
cytoplasm, an eccentric nucleus and a paler-staining zone in
the cytoplasm adjacent to the nucleus representing the Golgi
zone.
Detecting the features of multiple myeloma in patients with a
normocytic normochromic anaemia can be very important in
patient management, as this is often the first clue to the nature
of the patient’s illness.
Further steps
: The suspicion of multiple myeloma requires: a
bone marrow aspirate and trephine biopsy, investigations for a
serum paraprotein and for urinary monoclonal immunoglobulin
light chains (Bence–Jones protein), measurement of the concen-
tration of normal serum immunoglobulin and radiographs of
relevant bones, including the skull (a ‘skeletal survey’). Occa-
sionally magnetic resonance imaging (MRI), to image the bone
marrow, may be necessary.
The acute leukaemias and related conditions
The acute leukaemias are characterized by proliferation of im-
mature cells, either lymphoid or myeloid, with a failure of differ-
entiation to mature end cells. Because the immature cells are
proliferating in the bone marrow they replace normal haemopoi-
Haematological Findings
87
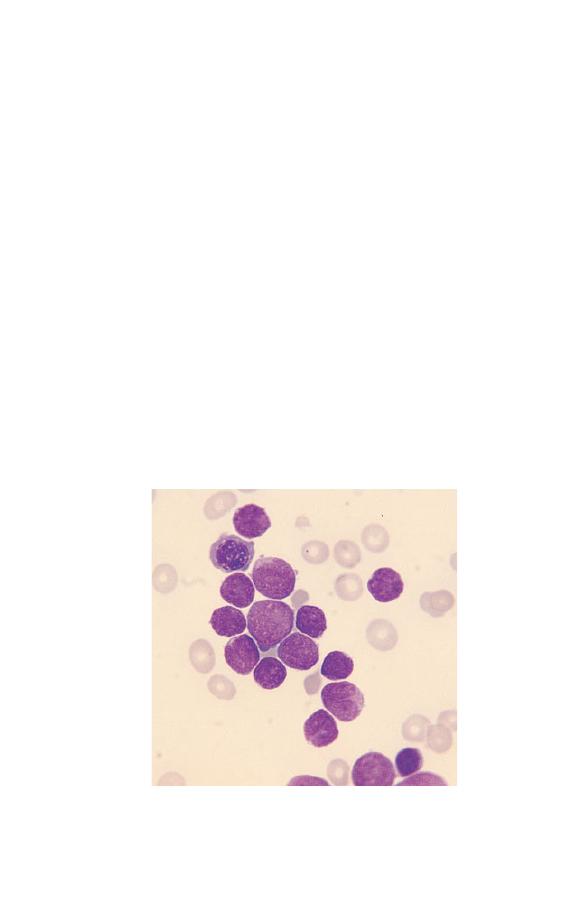
Fig. 4.16 Acute lymphoblastic leukaemia of L1 subtype. There is one
NRBC; all the other cells are lymphoblasts.
etic cells and cause anaemia and various cytopenias. Prolifera-
tion of leukaemic cells in other organs causes some degree of
hepatomegaly and splenomegaly and, particularly in the case of
acute lymphoblastic leukaemia, lymphadenopathy.
Acute lymphoblastic leukaemia
Acute lymphoblastic leukaemia is predominantly a disease of
children. It is caused by proliferation, in the bone marrow and
lymphoid tissues, of lymphoblasts of either B or T lineage. Over-
spill into the blood occurs in the majority of cases. Patients are
often anaemic or thrombocytopenic. Acute lymphoblastic leu-
kaemia has been divided into three morphological subtypes L1,
L2 and L3 by an international cooperative group, the French–
American–British (FAB) group. Most childhood cases have L1
morphology (Fig. 4.16). The blasts are fairly uniform in appear-
ance but vary in size from that of a normal lymphocyte to about
twice this size. They have a high nucleocytoplasmic ratio, a de-
licate diffuse chromatin pattern and sometimes small nucleoli.
88
Chapter 4
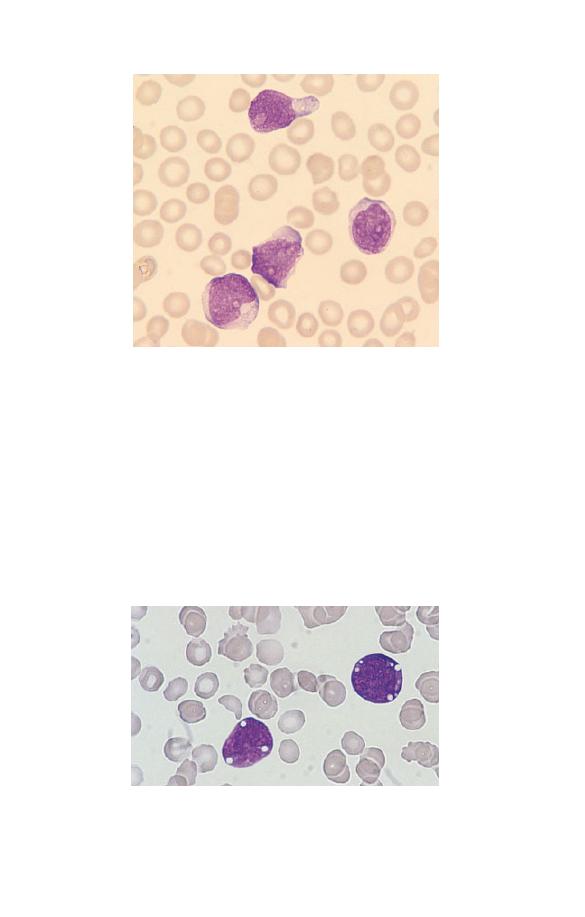
Fig. 4.17 Acute lymphoblastic leukaemia of L2 subtype.
Fig. 4.18 Acute lymphoblastic leukaemia of L3 subtype (can also be
regarded as the leukaemic equivalent of Burkitt’s lymphoma).
The smaller blasts can show some chromatin condensation.
Some childhood cases and a larger proportion of adult cases have
L2 morphology (Fig. 4.17). The blasts are larger than those of L1,
have more plentiful cytoplasm and are more pleomorphic. Both
cells and nuclei may be irregular in shape and nucleoli are some-
times prominent. A small minority of cases have L3 morphology
(Fig. 4.18). Cells are fairly regular in shape. They have moderate-
ly to strongly basophilic cytoplasm and prominent cytoplasmic
Haematological Findings
89

vacuolation in at least a proportion of cells. Whether blast cells
have L1 or L2 features is of little clinical significance. L1 acute
lymphoblastic leukaemia can usually be readily diagnosed from
the cytological features alone, whereas L2 acute lymphoblastic
leukaemia is more likely to be confused with acute myeloid
leukaemia and special tests to make the distinction are impor-
tant. Otherwise, this categorization can be ignored. The L3
subtype, however, has a very specific clinical significance. Cyto-
logical features are the same as in the leukaemic phase of
Burkitt’s lymphoma. L3 morphology correlates with a mature B
cell immunophenotype and requires specific management. In
fact, the most recent classification of acute leukaemia, that pro-
posed by the World Health Organization expert group, classifies
this condition as a leukaemic phase of non-Hodgkin’s lymphoma
rather than as acute leukaemia. This is appropriate since, al-
though the disease is clinically very aggressive, the immunophe-
notype is that of a mature B cell rather than that of a B-cell
precursor.
Further steps
: When facilities are available, immunophenotyp-
ing is always indicated in suspected acute lymphoblastic leukae-
mia. This is for two reasons; (i) to distinguish the blast cells of T-
or B-lineage acute lymphoblastic leukaemia from the blast cells
of some acute myeloid leukaemias with very primitive myelob-
lasts; and (ii) to distinguish non-Hodgkin’s lymphoma (mature B
or T cells) from acute lymphoblastic leukaemia/lymphoblastic
lymphoma (B- or T-cell precursors).
These are very important distinctions to make since the treat-
ment is very different. In addition, if facilities are available,
cytogenetic and molecular analysis are indicated in all cases of
acute lymphoblastic leukaemia. This is because all cases are not
the same. There are many sub-types that require individual man-
agement. Cytochemistry is irrelevant in acute lymphoblastic
leukaemia unless immunophenotyping is unavailable.
Acute myeloid leukaemia
Acute myeloid leukaemia occurs at all ages from the neonatal
period to old age. However, the incidence increases steadily
90
Chapter 4

Table 4.6 Simplified FAB classification of acute myeloid leukaemia.
M0
Acute myeloblastic leukaemia with minimal evidence of myeloid
differentiation
M1
Acute myeloid leukaemia with little maturation beyond the
myeloblast stage
M2
Acute myeloid leukaemia with maturation
M3
Acute hypergranular promyelocytic leukaemia (M3) and its
microgranular or hypogranular variant (M3 variant)
M4
Acute myelomonocytic leukaemia
M5
Acute monoblastic (M5a) and monocytic (M5b) leukaemia
M6
Acute erythroleukaemia
M7
Acute megakaryoblastic leukaemia
through adult life and old age. Acute myeloid leukaemia has
been divided by the FAB group into eight morphological sub-
types, which are summarized, in a simplified form, in Table 4.6.
Diagnosis and classification of acute myeloid leukaemia require
examination of a bone marrow aspirate but, since blast cells are
usually present in the blood, a provisional diagnosis can often be
made from examination of the blood film. It is necessary to
recognize myeloblasts, monoblasts and normal and abnormal
promyelocytes in order to recognize and classify acute myeloid
leukaemia. In M0 and M1 acute myeloid leukaemia the predom-
inant cell is a myeloblast. It is a large cell with a high nucleocy-
toplasmic ratio. One or more nucleoli may be detected in the
nucleus. In M1 acute myeloid leukaemia the cytoplasm may
contain scanty granules or Auer rods (Fig. 4.19). In M2 acute
myeloid leukaemia promyelocytes are also present (Fig. 4.20).
They have more numerous granules than myeloblasts and may
have an eccentric nucleus and a Golgi zone. In M4 acute myeloid
leukaemia both myeloblasts and monoblasts are present (Fig.
4.21). Monoblasts are larger than myeloblasts with voluminous
cytoplasm. Cytoplasmic basophilia varies from weak to moder-
ately strong. The cytoplasm is sometimes vacuolated. The
monoblast may be a round cell with a round nucleus or irregular
in shape with a lobulated nucleus. There is often a large nucleo-
lus. In M5 acute myeloid leukaemia the dominant cell may be a
monoblast (M5a) or there may also be promonocytes and mature
monocytes (M5b). Promonocytes are larger than monocytes and
Haematological Findings
91
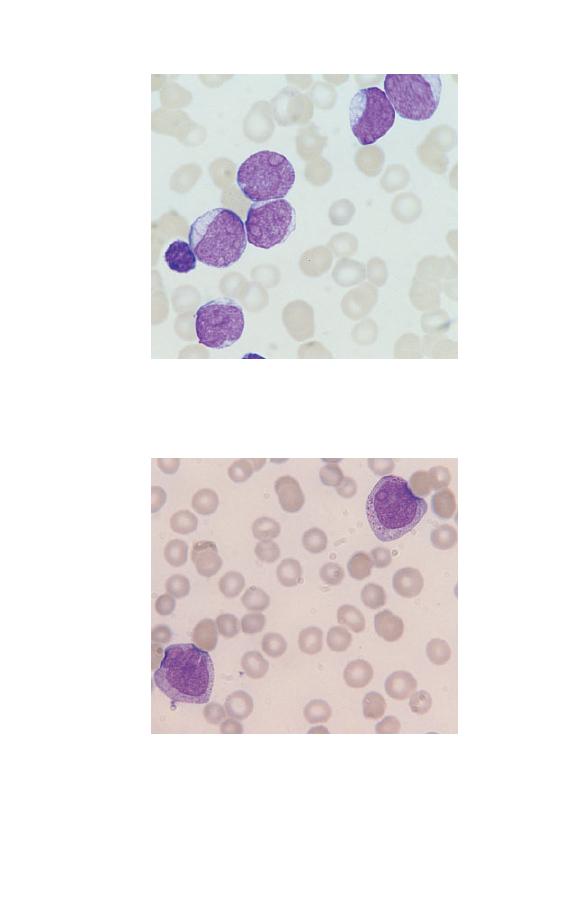
Fig. 4.19 Acute myeloid leukaemia of M1 subtype showing six
myeloblasts and a lymphocyte. The blast cell adjacent to the lymphocyte
contains an Auer rod.
Fig. 4.20 Acute myeloid leukaemia of M2 subtype showing two
promyelocytes.
92
Chapter 4
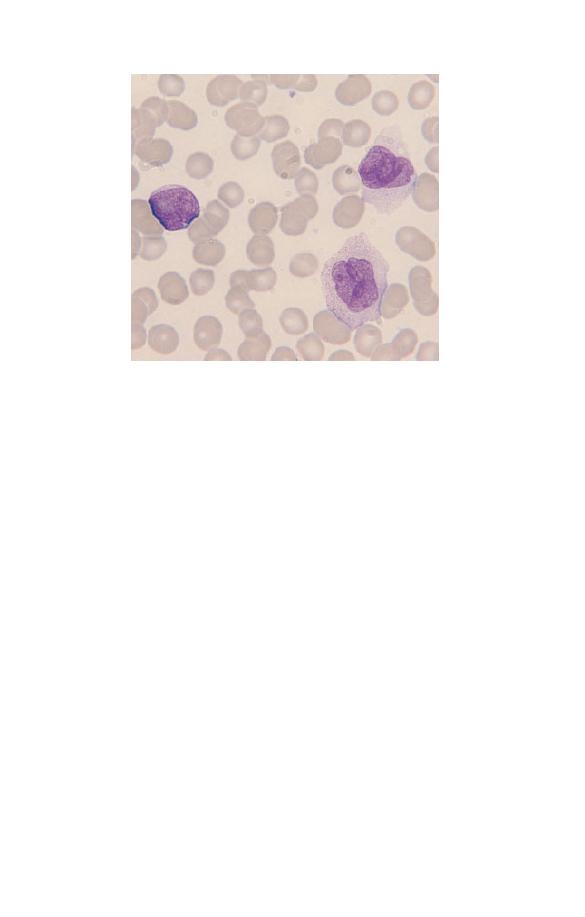
Fig. 4.21 Acute myeloid leukaemia of M4 subtype showing a myeloblast
(left) and two monoblasts (right).
have more basophilic and heavily granulated cytoplasm. M3
acute myeloid leukaemia (Fig. 4.22) is cytologically very distinc-
tive. The promyelocyte cytoplasm is packed with large, brightly
staining azurophilic granules. There may be giant granules or
bundles of Auer rods. M3 variant acute myeloid leukaemia is
more difficult to diagnose on cytological features, particularly
from the peripheral blood film. By light microscopy most of the
promyelocytes have no apparent granules but a minority have
fine dust-like granules, a pink blush to the cytoplasm or bundles
of Auer rods. Many of the promyelocytes have a distinctive
bilobed nucleus (Fig. 4.23).
Most cases of acute myeloid leukaemia have a normocytic,
normochromic anaemia and thrombocytopenia. A small minor-
ity of cases have an increased platelet count. Neutropenia is also
characteristic but some cases of M2 acute myeloid leukaemia
have neutrophilia. A very small minority of cases have eosi-
nophilia or basophilia. M0 and M7 acute myeloid leukaemia
cannot be distinguished from acute lymphoblastic leukaemia by
microscopy alone. Diagnosis of M6 acute myeloid leukaemia
always requires bone marrow examination.
Haematological Findings
93
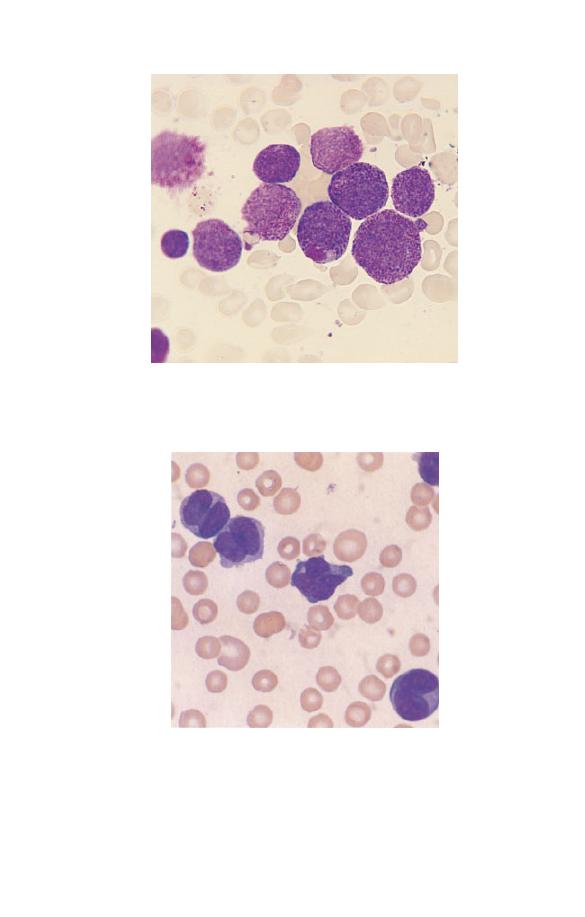
Fig. 4.22 Acute myeloid leukaemia of M3 subtype showing hypergranular
promyelocytes, one of which contains a giant granule.
Fig. 4.23 Acute myeloid leukaemia of M3 variant subtype showing the
characteristic bilobed hypogranular promyelocytes.
94
Chapter 4

Further steps:
If acute myeloid leukaemia is suspected, cyto-
chemistry is needed to confirm the myeloid nature of the abnor-
mal cells (if this is not already obvious). A bone marrow aspirate
and cytogenetic analysis are also needed, since the cytogenetic
sub-type is increasingly used in planning optimal treatment for
each individual patient. Immunophenotyping is sometimes
needed, to confirm a diagnosis of acute myeloid rather than acute
lymphoblastic leukaemia. This is necessarily so in the FAB cat-
egory of M0 acute myeloid leukaemia, in which the blast cells
are very primitive and do not express myeloperoxidase, non-
specific esterase or other myeloid enzymes. They do, however,
express antigens that are characteristic of myeloid cells. Immu-
nophenotyping may also be necessary in cases of acute myeloid
leukaemia in which the leukaemic blast cells are megakaryo-
blasts (M7 acute myeloid leukaemia).
If M3 or M3 variant acute myeloid leukaemia is suspected, it
is vital to confirm the diagnosis rapidly. This is because this
condition is often complicated by disseminated intravascular
coagulation and there is a need for urgent correction of the
coagulation abnormality and specific anti-leukaemic treatment.
An accurate as well as a speedy diagnosis of this subtype of acute
leukaemia is particularly important since the specific treatment
indicated differs from that in other types of acute myeloid leu-
kaemia.
The myelodysplastic syndromes
The myelodysplastic syndromes are related to acute myeloid
leukaemia. Both are neoplasms of myeloid cells with continued
proliferation of myeloid precursors but defective production of
mature end cells. In the myelodysplastic syndromes the dissoci-
ation between proliferation and maturation is not as severe as in
acute myeloid leukaemia so that some end cells are produced.
However, haemopoiesis is ineffective, leading to the paradox of
frequent pancytopenia (anaemia, leucopenia and thrombocytope-
nia) despite a cellular bone marrow. Blast cells may be increased
and acute myeloid leukaemia may supervene in patients with
one of the myelodysplastic syndromes. This group of closely
related conditions occurs mainly in the elderly.
Haematological Findings
95

The blood film shows various cytopenias, most often anaemia,
neutropenia and thrombocytopenia. Blood cells are often mor-
phologically abnormal. Red cells may be macrocytic or, in those
with defective incorporation of iron into haemoglobin, there
may be a minor population of hypochromic microcytes and Pap-
penheimer bodies (see Fig. 2.23). Neutrophils may be hypogran-
ular (see Fig. 1.13) or show the acquired Pelger–Huët anomaly.
Platelets may show abnormal variation in size or be hypogranu-
lar or agranular. Blasts may be present and occasionally they
contain Auer rods. Monocytes may be increased. The neutrophil
count may be increased but neutropenia is much more common.
The platelet count is increased in a minority of patients but is
more often decreased.
Further steps
: Bone marrow aspiration is required, to assess the
number of blast cells and exclude a diagnosis of acute myeloid
leukaemia. This should be supplemented by cytogenetic analy-
sis, which sometimes confirms an otherwise uncertain diagnosis
and in other instances gives information of prognostic impor-
tance. Cytochemical stains are indicated on the bone marrow
aspirate, to detect any ring sideroblasts (Perls’ stain) or Auer rods
(Sudan Black B or myeloperoxidase stain) that might be present.
Since non-neoplastic conditions can also cause dysplastic chang-
es in haemopoietic cells, it is sometimes necessary to exclude
other conditions before making a presumptive diagnosis of mye-
lodysplastic syndrome. Such conditions include alcohol and drug
toxicity, vitamin B
12
or folic acid deficiency, heavy metal expo-
sure and human immunodeficiency virus (HIV) infection.
Idiopathic myelofibrosis
Idiopathic myelofibrosis is a myeloproliferative disorder with
onset usually in middle or old age.The fibrosis that affects the
bone marrow is a reactive change that results from the prolifer-
ation of a clone of neoplastic haemopoietic cells. It is therefore
no longer ‘idiopathic’ but the name remains convenient, to dis-
tinguish this condition from secondary myelofibrosis. The blood
film is important in suggesting the diagnosis. There is a normo-
cytic, normochromic anaemia with marked anisocytosis and
96
Chapter 4

poikilocytosis. Teardrop poikilocytes are present. The blood film
is leucoerythroblastic, i.e. NRBC and granulocyte precursors are
present. In the early stages of the disease there may be neu-
trophilia or thrombocytosis but usually there is pancytopenia.
Platelets may show increased variation in size and granularity
with some poorly granulated platelets and some giant forms.
Occasionally circulating megakaryocytes or megakaryocyte bare
nuclei are present.
Further steps
: The blood film in idiopathic myelofibrosis can-
not be distinguished from that in myelofibrosis secondary to
other myeloproliferative disorders (e.g. polycythaemia vera or
essential thrombocythaemia). Knowledge of the previous history
is essential to make the distinction. The differential diagnosis
also includes secondary myelofibrosis due to bone marrow infil-
tration in metastatic carcinoma. Assessment of clinical features
is very important in making this distinction since splenomegaly
is almost invariable in idiopathic myelofibrosis but is rare in
metastatic carcinoma. A leucoerythroblastic blood film can also
result from shock or acute hypoxia or reflect recovery from bone
marrow suppression or recovery from haematinic deficiency (de-
ficiency of iron, vitamin B
12
or folic acid).
Haematological Findings
97

98
CHAPTER 5
Self-assessment
This self-assessment chapter contains questions of varying levels
of difficulty. Most can be answered fully using the information
in this book. However, the clinical questions, which are designed
mainly for candidates preparing for higher examinations (e.g. of
the Royal College of Pathologists and the Royal College of Phy-
sicians in the UK), are more difficult and most require extra
knowledge. Nevertheless, since answers to the questions are
given and discussed, all readers should benefit from thinking
about all the questions.
Exercise 1
(for all readers)
Go through the book, covering the legends and identifying the
features in the illustrations. Uncover the legends and check if
you are right.
Exercise 2
(for medical students, trainee laboratory
scientists and trainee haematologists)
Using blood films and a microscope identify the major morpho-
logical features discussed in this book and check your identifica-
tion of cell types or morphological abnormalities with an
experienced laboratory worker.
Exercise 3
(for trainee laboratory scientists and
trainee haematologists)
Select some patient blood films, examine the blood films
A Beginner’s Guide to Blood Cells, 2nd Edition
Barbara J. Bain
Copyright © 1996, 2004 by Blackwell Publishing Ltd

microscopically, assess the blood counts and decide what you
would write on a report form to be sent back to clinical staff.
Compare what you have written with the reports written
by senior laboratory staff and discuss any discrepancy with
them.
Exercise 4 – multiple choice questions
(for all readers)
Answer the following true or false questions and then compare
your answers with those on pages 102–104. (It is suggested that
you photostat the relevant pages rather than writing in the book.
Fill in the circle for each true answer.) The number of correct
answers may be zero to five.
Q1 Microcytosis is characteristic of:
1 Beta thalassaemia trait . . . . . . . . . . . . . . . . . . . . . . . . . . . . . . . .
è
2 Iron deficiency anaemia . . . . . . . . . . . . . . . . . . . . . . . . . . . . . . .
è
3 Depletion of body iron stores without anaemia . . . . . . . . . . .
è
4 Hereditary elliptocytosis . . . . . . . . . . . . . . . . . . . . . . . . . . . . . . .
è
5 Megaloblastic anaemia . . . . . . . . . . . . . . . . . . . . . . . . . . . . . . . .
è
Q2 A 23-year-old Cypriot woman has a blood count for
premarital counselling. The results are as follows: RBC
5.5
¥ 10
12
/l, Hb 13.0 g/dl, PCV 0.38, MCV 70 fl, MCH 23.6 pg,
MCHC 34.2 g/dl, RDW 14. Which of the following possibilities
is most likely:
1 The patient is haematologically normal . . . . . . . . . . . . . . . . .
è
2 Body iron stores are depleted . . . . . . . . . . . . . . . . . . . . . . . . . . .
è
3 She has beta thalassaemia trait . . . . . . . . . . . . . . . . . . . . . . . . .
è
4 She has congenital sideroblastic anaemia . . . . . . . . . . . . . . . .
è
5 She has sickle cell trait . . . . . . . . . . . . . . . . . . . . . . . . . . . . . . . .
è
Q3 Macrocytosis may be a feature of:
1 Chronic haemolytic anaemia . . . . . . . . . . . . . . . . . . . . . . . . . . .
è
2 Excess alcohol intake . . . . . . . . . . . . . . . . . . . . . . . . . . . . . . . . .
è
3 Hyperthyroidism . . . . . . . . . . . . . . . . . . . . . . . . . . . . . . . . . . . . .
è
Self-assessment
99

4 Myelodysplastic syndromes . . . . . . . . . . . . . . . . . . . . . . . . . . . .
è
5 Sickle cell trait . . . . . . . . . . . . . . . . . . . . . . . . . . . . . . . . . . . . . . .
è
Q4 Neutrophil leucocytosis is likely to occur in:
1 Myocardial infarction . . . . . . . . . . . . . . . . . . . . . . . . . . . . . . . . .
è
2 Whooping-cough (pertussis) . . . . . . . . . . . . . . . . . . . . . . . . . . . .
è
3 Sickle cell crisis . . . . . . . . . . . . . . . . . . . . . . . . . . . . . . . . . . . . . .
è
4 Hypersplenism . . . . . . . . . . . . . . . . . . . . . . . . . . . . . . . . . . . . . . .
è
5 Chronic granulocytic leukaemia . . . . . . . . . . . . . . . . . . . . . . . .
è
Q5 The following are likely 1 day after major surgery:
1 Neutrophil leucocytosis . . . . . . . . . . . . . . . . . . . . . . . . . . . . . . .
è
2 Left shift . . . . . . . . . . . . . . . . . . . . . . . . . . . . . . . . . . . . . . . . . . . .
è
3 Lymphocytopenia . . . . . . . . . . . . . . . . . . . . . . . . . . . . . . . . . . . . .
è
4 Eosinopenia . . . . . . . . . . . . . . . . . . . . . . . . . . . . . . . . . . . . . . . . . .
è
5 Toxic granulation . . . . . . . . . . . . . . . . . . . . . . . . . . . . . . . . . . . . .
è
Q6 The following may be a feature of sickle cell trait:
1 Target cells . . . . . . . . . . . . . . . . . . . . . . . . . . . . . . . . . . . . . . . . . .
è
2 Sickle cells . . . . . . . . . . . . . . . . . . . . . . . . . . . . . . . . . . . . . . . . . .
è
3 Neutrophil leucocytosis . . . . . . . . . . . . . . . . . . . . . . . . . . . . . . .
è
4 Macrocytosis . . . . . . . . . . . . . . . . . . . . . . . . . . . . . . . . . . . . . . . . .
è
5 Polychromasia . . . . . . . . . . . . . . . . . . . . . . . . . . . . . . . . . . . . . . .
è
Q7 Indicate whether the following statements about Döhle
bodies are true or false:
1 They are a reliable indication of infection . . . . . . . . . . . . . . .
è
2 They are composed of denatured haemoglobin . . . . . . . . . . .
è
3 They are composed of DNA . . . . . . . . . . . . . . . . . . . . . . . . . . .
è
4 They may occur in healthy pregnant women . . . . . . . . . . . .
è
5 They are likely to be associated with left shift and toxic
granulation . . . . . . . . . . . . . . . . . . . . . . . . . . . . . . . . . . . . . . . . . .
è
100
Chapter 5

Q8 The following groups are likely to have higher neutrophil
counts than healthy adult Caucasian males:
1 Healthy Afro-Caribbean males . . . . . . . . . . . . . . . . . . . . . . . . .
è
2 Pregnant women . . . . . . . . . . . . . . . . . . . . . . . . . . . . . . . . . . . . .
è
3 Neonates . . . . . . . . . . . . . . . . . . . . . . . . . . . . . . . . . . . . . . . . . . . .
è
4 Patients who have just suffered an epileptic convulsion . . .
è
5 Patients being administered high doses of corticosteroids . .
è
Q9 The following can occur as a result of splenectomy:
1 Neutropenia . . . . . . . . . . . . . . . . . . . . . . . . . . . . . . . . . . . . . . . . .
è
2 Thrombocytopenia . . . . . . . . . . . . . . . . . . . . . . . . . . . . . . . . . . . .
è
3 Howell–Jolly bodies . . . . . . . . . . . . . . . . . . . . . . . . . . . . . . . . . . .
è
4 Target cells . . . . . . . . . . . . . . . . . . . . . . . . . . . . . . . . . . . . . . . . . .
è
5 Acanthocytes . . . . . . . . . . . . . . . . . . . . . . . . . . . . . . . . . . . . . . . .
è
Q10 The following are usually associated with spherocytes in
the blood film:
1 Severe iron deficiency anaemia . . . . . . . . . . . . . . . . . . . . . . . . .
è
2 Combined deficiency of vitamin B
12
and folic acid . . . . . . . .
è
3 Severe burns . . . . . . . . . . . . . . . . . . . . . . . . . . . . . . . . . . . . . . . . .
è
4 Autoimmune haemolytic anaemia . . . . . . . . . . . . . . . . . . . . . .
è
5 Polycythaemia rubra vera . . . . . . . . . . . . . . . . . . . . . . . . . . . . . .
è
Q11 The following may have target cells as a blood film
feature:
1 Obstructive jaundice . . . . . . . . . . . . . . . . . . . . . . . . . . . . . . . . . .
è
2 Sickle cell trait . . . . . . . . . . . . . . . . . . . . . . . . . . . . . . . . . . . . . . .
è
3 Sickle cell disease . . . . . . . . . . . . . . . . . . . . . . . . . . . . . . . . . . . .
è
4 Splenic atrophy . . . . . . . . . . . . . . . . . . . . . . . . . . . . . . . . . . . . . . .
è
5 Haemoglobin C disease . . . . . . . . . . . . . . . . . . . . . . . . . . . . . . . .
è
Q12 The following may cause polycythaemia:
1 Living below sea level . . . . . . . . . . . . . . . . . . . . . . . . . . . . . . . . .
è
2 Low-oxygen-affinity haemoglobin . . . . . . . . . . . . . . . . . . . . . . .
è
Self-assessment
101

3 Polycystic kidneys . . . . . . . . . . . . . . . . . . . . . . . . . . . . . . . . . . . .
è
4 Sleep apnoea . . . . . . . . . . . . . . . . . . . . . . . . . . . . . . . . . . . . . . . . .
è
5 Morbid obesity . . . . . . . . . . . . . . . . . . . . . . . . . . . . . . . . . . . . . . .
è
Answers to multiple choice questions
Q1 TTFFF
Discussion
: Beta thalassaemia trait and iron deficiency anaemia
are both characterized by microcytosis. Depletion of iron stores
without anaemia does not cause microcytosis. In hereditary
elliptocytosis the red cell indices are normal. Megaloblastic
anaemia is characterized by macrocytosis, not microcytosis.
Q2 FFTFF
Discussion
: The patient is not haematologically normal, as can
be seen by comparing her red cell indices with the normal range
for healthy adult women. Depletion of body iron stores does not
cause microcytosis in advance of anaemia. Congenital sidero-
blastic anaemia is very unlikely since the patient is not anaemic
and this rare condition occurs mainly in men. Sickle cell trait
would be possible but it is unlikely in a Cypriot woman and the
MCV is often normal. The red cell indices are typical of beta
thalassaemia trait, which is common in Cyprus.
Q3 TTFTF
Discussion
: Macrocytosis is characteristic of chronic haemolytic
anaemia and alcohol excess. It is often present in the myelodys-
plastic syndromes. Macrocytosis is a feature of hypothyroidism,
not hyperthyroidism. Sickle cell trait may be associated with
microcytosis but macrocytosis is not a feature.
Q4 TFTFT
Discussion
: Neutrophil leucocytosis is likely in myocardial in-
farction and sickle cell crisis, as a response to tissue infarction. It
is unlikely in whooping-cough, in which the usual haematolo-
102
Chapter 5

gical abnormality is lymphocytosis. Hypersplenism is character-
ized by neutropenia rather than neutrophilia. Neutrophilia is
invariable in chronic granulocytic leukaemia.
Q5 TTTTT
Discussion
: All these abnormalities are part of the usual re-
sponse to major surgery.
Q6 TFFFF
Discussion
: The blood film in sickle cell trait is often normal.
The only abnormalities which are at all likely are target cells and
microcytosis. Sickle cells are not seen.
Q7 FFFTT
Discussion
: Döhle bodies are cytoplasmic inclusions in neu-
trophils composed of ribosomes. They are not denatured haemo-
globin (Heinz bodies) or DNA (Howell–Jolly bodies). They occur
in infection, in inflammation, following cytokine administration
and in pregnancy and so are not a reliable indication of infection.
They are often associated with other reactive changes in neu-
trophils such as left shift and toxic granulation.
Q8 FTTTT
Discussion
: Healthy Afro-Caribbean tend to have lower neu-
trophil counts than Caucasians, rather than higher. Pregnant
women and neonates have a higher normal range than adult
males. Epileptic convulsions mobilize the marginated granulo-
cyte pool and thus raise the neutrophil count. Corticosteroids
alter granulocyte kinetics and raise the neutrophil count.
Q9 FFTTT
Discussion
: Splenectomy is likely to be associated with in-
creased neutrophil and platelet counts rather than reduced
counts. The other abnormalities are expected in hyposplenism.
Self-assessment
103

Q10 FFTTF
Discussion
: Severe thermal burns cause direct damage to the
red cell membrane and lead to spherocyte formation. Warm red
cell autoantibodies attach to the red cell membrane, leading to
removal of part of the membrane in the spleen and consequent
spherocyte formation. The other conditions listed do not cause
spherocytosis.
Q11 TTTTT
Discussion
: Target cells are sometimes present in sickle cell trait
and are usually present in all the other conditions listed.
Q12 FFTTT
Discussion
: Living at a high altitude and a high-affinity haemo-
globin would be likely to cause polycythaemia. Renal cysts and
tumour can lead to increased erythropoietin secretion and poly-
cythaemia. Sleep apnoea and morbid obesity can both cause
hypoxia and thus stimulate erythropoietin secretion and cause
polycythaemia.
Exercise 5 – clinical cases
(for all readers)
Q1 A 28-year-old Caucasian man presented with weight loss,
sweating, fatigue and abdominal discomfort. He was found to
be pale and his spleen was enlarged 15 cm below the left costal
margin. WBC was 100
¥¥¥¥¥ 10
9
/l, Hb 10.0 g/dl and platelet count
600
¥¥¥¥¥ 10
9
/l. His blood film is illustrated in Fig. 5.1.
1 List the abnormalities shown.
2 What is the most likely diagnosis?
3 What is the single test most likely to be useful in diagnosis?
4 What other tests could be useful in diagnosis?
104
Chapter 5
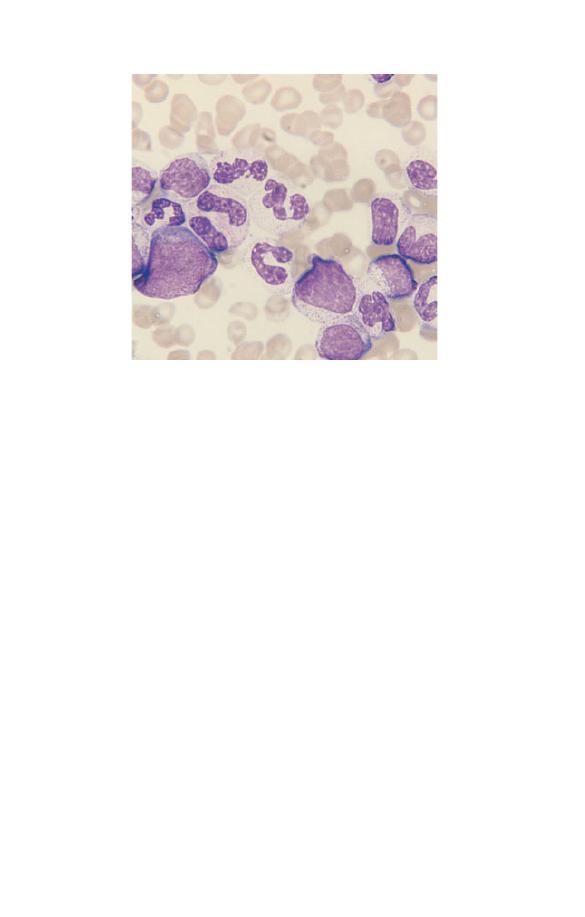
Q2 A 23-year-old woman had suffered for many years from
recurrent pains in her limbs and abdomen. Her mother was
Italian and was known to suffer from beta thalassaemia trait.
Her father was Afro-Caribbean. Her Hb was 10 g/dl and MCV
70 fl. Her blood film is illustrated in Fig. 5.2.
1 List all the abnormalities shown.
2 What is the most likely diagnosis?
3 What tests would be most useful in diagnosis and what would
you expect to find?
4 What abnormality if any would you expect to find in the
patient’s father?
Q3 A 40-year-old northern European Caucasian woman with
dermatitis herpetiformis was being treated by her
dermatologist with dapsone. She was noted to be pale and a
blood count was therefore performed. This showed an Hb of
9.5 g/dl and an MCV of 110 fl. Her blood film is illustrated in
Fig. 5.3.
1 List all the abnormalities present.
2 What is the most likely diagnosis?
Fig. 5.1 Peripheral blood film (Exercise 5, Q1).
Self-assessment
105
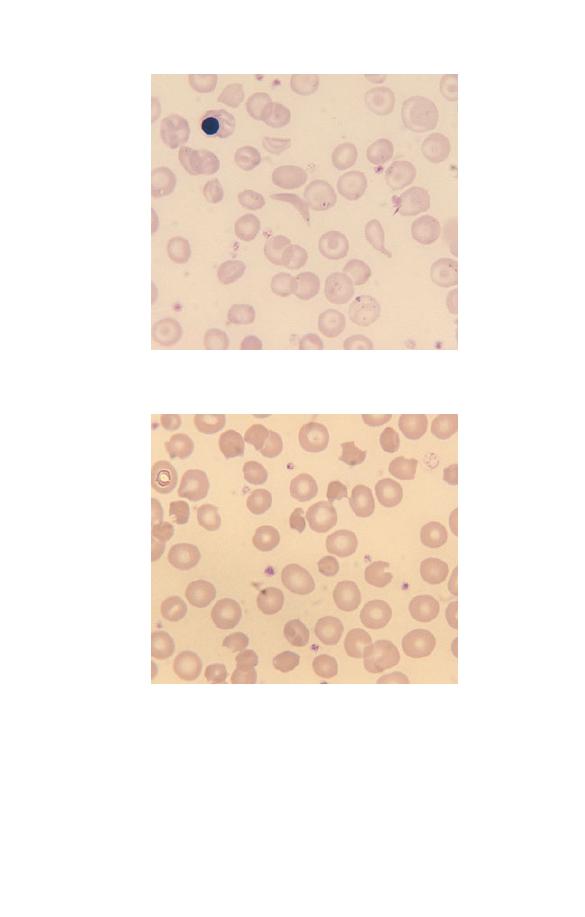
Fig. 5.3 Peripheral blood film (Exercise 5, Q3).
3 List the three tests which would be most useful in confirming
the diagnosis, assessing the severity of the conditions and
managing the patient.
Fig. 5.2 Peripheral blood film (Exercise 5, Q2).
106
Chapter 5

Q4 An 18-year-old Caucasian university student presented to
his general practitioner with fever, marked cervical
lymphadenopathy and malaise. He was found to have large
inflamed tonsils and slight jaundice. His WBC was 15
¥¥¥¥¥ 10
9
/l
and his platelet count 60
¥¥¥¥¥ 10
9
/l. His blood film showed
numerous atypical lymphocytes.
1 What is the most likely diagnosis?
2 What is the cause of this condition?
3 What test is usually done to confirm the diagnosis?
Q5 A 60-year-old Afro-Caribbean woman was referred to
medical outpatients because of lethargy, fatigue and chronic
backache. The only abnormality found on physical
examination was pallor. Results of her FBC were: WBC 5.0
¥¥¥¥¥
10
9
/l, Hb 9.5 g/dl, MCV 95 fl, platelet count 120
¥¥¥¥¥ 10
9
/l.
Biochemical screening showed: total protein 84 g/l (normal
range 60–80 g/l), albumin 33 g/l (normal range 35–51 g/l), serum
calcium 2.6 mmol/l (normal range 2.15–2.55 mmol/l),
creatinine 140
mmmmmmol/l (normal range 60–125mmmmmmol/l). Her blood
film is illustrated in Fig. 2.4 (see page 31).
1 What abnormalities are shown in the blood film?
2 What is the most likely diagnosis?
3 List the two tests most likely to confirm the diagnosis.
4 List the three abnormalities most likely to have contributed to
the elevated serum creatinine.
Q6 A 5-year-old Caucasian boy presented with a history of a
diarrhoeal illness followed by vomiting and mild jaundice. He
was found to be anaemic and to have a greatly elevated serum
creatinine. His blood film is illustrated in Fig. 5.4.
1 What abnormalities are shown in the blood film?
2 What is the general name for this type of anaemia?
3 What is the most likely diagnosis?
Self-assessment
107
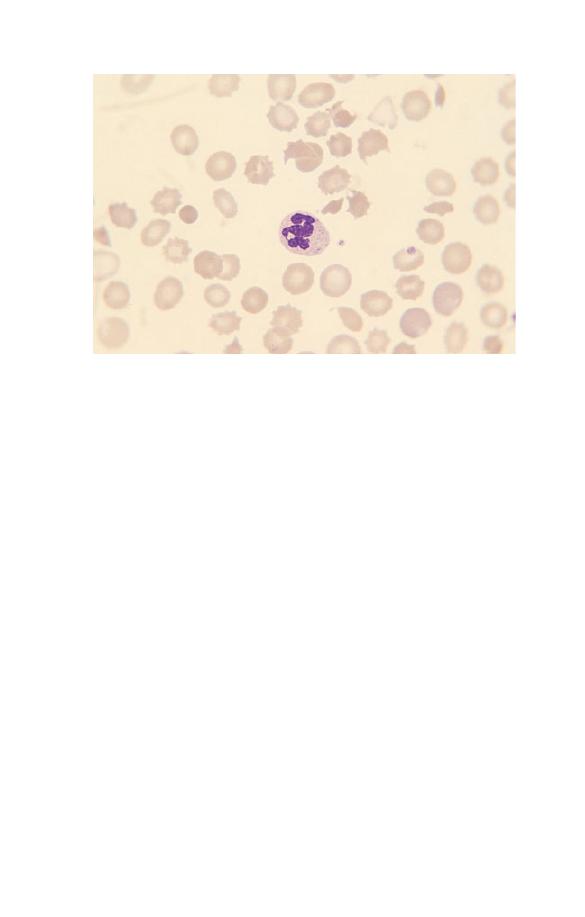
Q7 A 70-year-old Caucasian man presented to his general
practitioner with a history of gradual onset of tiredness and
bruising. His FBC was: WBC 4
¥¥¥¥¥ 10
9
/l, neutrophil count 0.8
¥¥¥¥¥
10
9
/l, Hb 8.5 g/dl and platelet count 50
¥¥¥¥¥ 10
9
/l. His blood film
is illustrated in Fig. 1.13 (see page 14).
1 List all the abnormalities shown in the blood film.
2 What is the most likely diagnosis?
3 What test is essential for confirmation of the diagnosis?
4 What supplementary test would give useful information?
Q8 A 30-year-old Caucasian woman presented to a casualty
department with recent onset of nose bleeding. She was found
to have multiple bruises and a blood count and coagulation
screen were therefore performed. Results of the FBC were:
WBC 8
¥¥¥¥¥ 10
9
/l, Hb 10.5 g/dl, platelet count 50
¥¥¥¥¥ 10
9
/l. The
prothrombin time, activated thromboplastic time and
thrombin time were prolonged, fibrinogen concentration was
1 g/l (normal range 1.5–4 g/l) and D-dimer was increased. The
blood film showed a number of abnormal white cells, one of
which is illustrated in Fig. 5.5.
Fig. 5.4 Peripheral blood film (Exercise 5, Q6).
108
Chapter 5
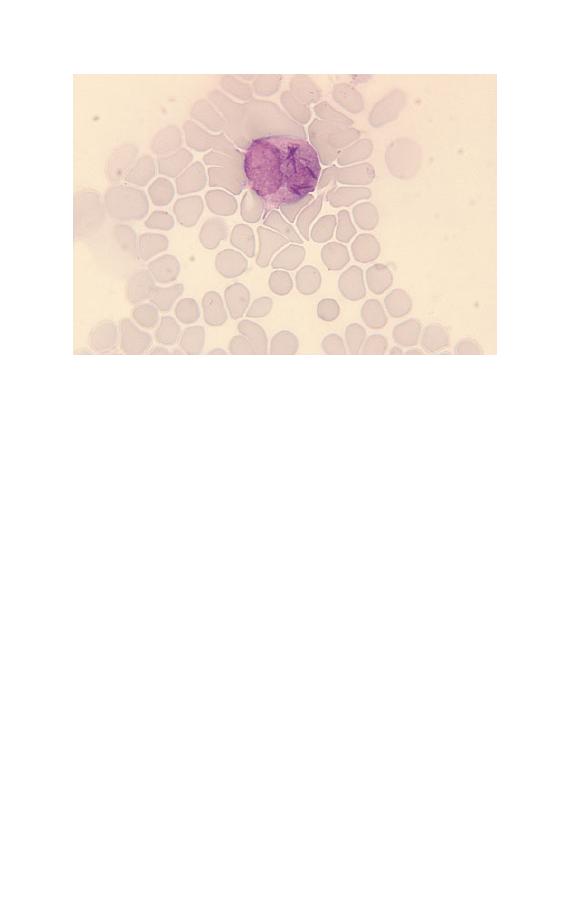
1 What is the abnormal cell?
2 What is the cause of the abnormal coagulation results?
3 What is the most likely diagnosis?
4 What test or tests would you perform to confirm the
diagnosis?
Q9 A 60-year-old Englishman presents to his general
practitioner with a history of weight loss, dyspnoea on
exertion and ankle swelling. He has a good diet. He is found
to have an Hb of 8 g/dl, an MCV of 70 fl and an RBC of
3.71
¥¥¥¥¥ 10
12
/l.
1 Calculate his PCV, MCH and MCHC.
2 What is the most likely diagnosis?
3 What tests would you do to confirm the diagnosis?
4 What underlying disease would you suspect?
Fig. 5.5 Peripheral blood film (Exercise 5, Q8).
Self-assessment
109

Answers to clinical cases
Q1
1 Leucocytosis with a mixture of mature granulocytes and
granulocyte precursors. Few platelets are apparent but the
platelet count is high so check more fields.
2 Chronic granulocytic leukaemia (chronic myeloid leukaemia).
3 Cytogenetic analysis for detection of the Philadelphia chromo-
some [resulting from the translocation t(9;22)(q34;q11) ].
4 Neutrophil alkaline phosphatase, serum B
12
concentration.
Discussion
: The clinical history and the height of the WBC
indicate that this is some type of leukaemia rather than a reac-
tive condition. Since there are many granulocytes and granulo-
cytic precursors present, this is clearly a myeloid leukaemia,
not a lymphoid leukaemia. The large number of mature
cells indicate a chronic rather than acute leukaemia. The
most likely diagnosis is chronic granulocytic leukaemia
(sometimes called chronic myeloid leukaemia). There are no
dysplastic features or monocytosis to suggest that this is
atypical chronic myeloid leukaemia or chronic myelomonocytic
leukaemia.
Cytogenetic analysis to detect the Philadelphia chromosome,
resulting from a translocation between chromosomes 9 and 22,
would confirm the diagnosis. This test is usually carried out on
a bone marrow aspirate. Neutrophil alkaline phosphatase is low
in 95% of cases of chronic granulocytic leukaemia and serum B
12
concentration is elevated but neither of these tests is important
if cytogenetic analysis is available.
Q2
1 Anaemia, microcytosis, an NRBC, a sickle cell, a tear-drop
poikilocyte, target cells and Pappenheimer bodies.
2 Compound heterozygosity for beta thalassaemia and sickle
cell haemoglobin.
3 Haemoglobin electrophoresis and a solubility test for sickle
cell haemoglobin. The likely result is that the majority of
110
Chapter 5

haemoglobin will be haemoglobin S with some haemoglobin
A
2
and possibly some haemoglobin A or haemoglobin F.
4 Sickle cell trait.
Discussion
: Since a sickle cell is present it is clear that the
patient has some form of sickle cell disease. Since her mother
had beta thalassaemia trait it is not possible for the patient to
have sickle cell anaemia (homozygosity for haemoglobin S). The
likely diagnosis is compound heterozygosity for beta thalassae-
mia trait (inherited from her mother) and sickle cell haemoglob-
in (inherited from her father). The low MCV and the
Pappenheimer bodies (the latter consequent on iron overload and
hyposplenism) are consistent with this diagnosis. The father
must have sickle cell trait (or some other abnormality with at
least one
b
S
gene e.g. sickle cell/haemoglobin C disease). In this
particular patient, haemoglobin electrophoresis showed only
haemoglobin S as her mother had
b
0
thalassaemia trait. If her
mother had had
b
+
thalassaemia trait then some haemoglobin A
would have been present but, in contrast to the findings in sickle
cell trait, the percentage of haemoglobin A would have been
lower than the percentage of haemoglobin S.
If you gave sickle cell trait as an answer this is wrong. Sickle
cell trait does not cause sickle cells in the blood film.
Q3
1 Macrocytosis, irregularly contracted cells and keratocytes.
2 Oxidant-induced haemolytic anaemia caused by dapsone.
3 Heinz body preparation, reticulocyte count and glucose-6-
phosphate dehydrogenase (G6PD) assay or red cell folate assay.
Discussion
: The blood film changes are typical of oxidant-in-
duced haemolytic anaemia. The keratocytes are caused by the
removal of Heinz bodies by the spleen. Dapsone is a known
oxidant which commonly causes haemolysis. The macrocytosis
is consistent with the reticulocytosis expected in this patient.
Her gender and her northern European origin make underlying
G6PD deficiency unlikely. The most useful tests would be a
Heinz body preparation and a reticulocyte count. The other tests
suggested are less likely to be useful since G6PD deficiency is
Self-assessment
111

unlikely. If the test is done it is important to relate the result to
the reticulocyte count since reticulocytes have a higher concen-
tration of the enzyme than mature erythrocytes. Patients with
chronic haemolytic anaemia have an increased need for folic
acid and deficiency is therefore possible. However, it is more
likely that the macrocytosis is caused by increased numbers of
reticulocytes.
Q4
1 Infectious mononucleosis.
2 Primary infection by the Epstein–Barr virus (EBV).
3 A serological test for the heterophile antibody, i.e. a modified
Paul–Bunnell test or infectious mononucleosis screening test.
Discussion
: This is a typical case of infectious mononucleosis
(‘glandular fever’). Thrombocytopenia caused by peripheral de-
struction of platelets is a known complication. Infectious mono-
nucleosis is characterized by the development of a heterophile
antibody which agglutinates sheep red cells. The antibody can be
identified by a Paul–Bunnell test but this is a labour-intensive
test and therefore not usually performed. A rapid screening test
which is a modification of the Paul–Bunnell tests (an infectious
mononucleosis screening test) is preferred. If the test is negative
it should be repeated in 7–10 days. Fig. 3.9 (page 52) shows a
typical blood film in this condition.
Q5
1 The blood film shows rouleaux formation and a plasma cell.
There is also increased background staining and two red cells
appear hypochromic.
2 The most likely diagnosis is multiple myeloma.
3 The two tests most likely to confirm the diagnosis are bone
marrow aspiration and serum protein electrophoresis.
4 Renal function may be impaired because of hypercalcaemia,
hyperuricaemia and deposition of Bence-Jones protein in the
renal tubules.
112
Chapter 5

Discussion
: This is a typical case of multiple myeloma. Note
that ‘myeloma’ is not a totally correct answer since solitary
myelomas also occur and it is clear that this patient has a dis-
seminated disease.
The two tests suggested are those most likely to confirm the
diagnosis. Any paraprotein detected should be quantified. Other
tests which may be useful include a radiological survey of the
skeleton, examination of the urine for Bence-Jones protein and
estimation of the concentration of normal serum immunoglobu-
lins. The erythrocyte sedimentation rate (ESR) is very likely to
be elevated in view of the marked rouleaux formation. However,
this observation would contribute no diagnostically useful infor-
mation in this patient and it would be less useful in following
the response to treatment than repeated measurements of the
concentration of the paraprotein. Note that in this patient the
ethnic origin is irrelevant; however, it is always worth noting
the ethnic origin because it may suggest a particular diagnosis.
Q6
1 The blood film shows numerous echinocytes (red cell cren-
ation), several fragments and a microspherocyte. Only two
platelets are apparent so it is possible that the patient has
thrombocytopenia. It is evident that the patient is anaemic
and there are some macrocytes.
2 This is a microangiopathic haemolytic anaemia.
3 The most likely diagnosis is haemolytic uraemic syndrome
following infection by a verocytotoxin-producing Escherichia
coli
.
Discussion
: Thrombotic thrombocytopenic purpura would also
be considered in the differential diagnosis of a microangiopathic
haemolytic anaemia with a suspicion of thrombocytopenia.
However, the history is typical for haemolytic uraemic syn-
drome and does not mention features suggestive of thrombotic
thrombocytopenic purpura such as bruising, purpura or petech-
iae, fever or neurological abnormalities. The macrocytes are
likely to indicate an increased reticulocyte count as a response to
the anaemia.
Self-assessment
113

Q7
1 The blood film shows a myeloblast, a hypogranular neut-
rophil, stomatocytes and tear-drop poikilocytes. The platelet
count appears to be reduced but there is a small platelet aggre-
gate at the top of the illustration, so it would be necessary
to examine more microscopic fields to confirm the
thrombocytopenia.
2 The most likely diagnosis is one of the myelodysplastic
syndromes.
3 A bone marrow aspirate is essential for diagnosis.
4 Cytogenetic analysis carried out on the bone marrow aspirate
would give information of relevance to prognosis.
Discussion
: A bone marrow aspiration is essential for diagnosis.
A diagnosis of myelodysplastic syndrome is favoured by the
history, which is suggestive of an illness of gradual onset, and, in
addition, although there are blast cells in the blood they appear
to be infrequent since the total WBC is not elevated. However,
without a bone marrow aspirate it is not possible to exclude a
diagnosis of acute myeloid leukaemia with associated myelodys-
plastic features. Cytogenetic analysis gives prognostic informa-
tion since certain abnormalities (e.g. complex rearrangements
and abnormalities of chromosome 7) are associated with a worse
prognosis; and if there were any doubt about the prognosis,
detection of a clonal cytogenic abnormality could confirm it.
Q8
1 An abnormal promyelocyte containing multiple Auer rods.
2 The tests are indicative of disseminated intravascular coagula-
tion since fibrinogen is reduced and D-dimer (a fibrin degrada-
tion product) is increased.
3 Acute hypergranular promyelocytic leukaemia.
4 Bone marrow aspiration and cytogenetic analysis to detect the
characteristic translocation, t(15;17)(q22;q21).
Discussion
: The combination of disseminated intravascular co-
agulation and an abnormal promyelocyte with multiple Auer
rods suggests a diagnosis of acute myeloid leukaemia of the
114
Chapter 5

hypergranular promyelocytic type (M3 acute myeloid leukae-
mia). It is not uncommon for this type of leukaemia to present
with a marked reduction of the platelet count but without severe
anaemia or leucocytosis. Disseminated intravascular coagula-
tion is characteristic of this subtype of acute myeloid leukae-
mia. Detection of the t(15;17) translocation confirms the
diagnosis. If it is not detected, molecular analysis for detection of
the PML-RARA fusion gene is indicated. Because of the frequen-
cy of disseminated intravascular coagulation, it is important to
be alert to the possibility of this diagnosis and to confirm it as a
matter of urgency so that specific treatment can be started.
Q9
1 The PCV is 0.26, the MCH 21.5 pg and the MCHC 31.0 g/dl. If
you cannot remember the relevant formulae, they can be
found on page 20.
2 Iron deficiency.
3 The diagnosis could be confirmed either by demonstrating a
low serum ferritin concentration or by demonstrating both a
reduced serum iron concentration and either an elevated total
iron binding capacity or an elevated transferrin concentration.
4 Occult gastrointestinal haemorrhage, e.g. due to carcinoma of
the colon or diverticular disease.
Discussion
: The indices are typical of iron deficiency and the
history, although non-specific, is consistent with this. In a mid-
dle-aged Englishman whose diet is normal this is most probably
due to occult gastrointestinal haemorrhage, either from the large
bowel or from the stomach. Biochemical tests on the blood
are likely to confirm the diagnosis of iron deficiency and it is
unlikely that a bone marrow aspiration would be needed for
confirmation in this patient. It is very important to identify
the underlying cause, since iron deficiency anaemia can be the
presenting feature of an otherwise occult gastrointestinal
malignancy.
Self-assessment
115

autoimmune haemolytic
anaemia 72–3, 73
azurophilic granules 9
B
B cells 10
bacterial infection 78–9, 79
band cells 13, 15–16, 16, 48
basopenia 45
basophils 4, 6, 8
morphology 53–4, 53
normal range 23
basophilia 45
basophilic stippling 42
beta thalassaemia major 73–4,
75
beta thalassaemia trait 65–6, 66,
102, 105
bite cells see keratocytes
blood 1, 2
blood clotting 26–7
blood count 17–28
cell counts 18–19
ethnic variation 23, 24, 57
gender effects 56
haematocrit (packed cell volume)
18
haemoglobin concentration
18
neonates, infants and children
56
normal ranges 21–2, 23, 24
in pregnancy 56–7
red cell indices 19–20
A
abetalipoproteinaemia 38
acanthocytes 34, 35, 38
acute lymphoblastic leukaemia
88–90, 88, 89
acute myeloid leukaemia 90–5, 91,
92
, 93, 94
Africans, normal ranges 24
Afro-Caribbeans, normal ranges 24
alpha thalassaemia trait 66–7
anaemia 30, 59–60, 59, 60
autoimmune haemolytic 72–3,
73
of chronic disease 64
haemolytic 111
iron deficiency 62–4, 63, 102
leucoerythroblastic 51
macrocytic 60
megaloblastic 60–2, 61
microcytic 60
normocytic 60
sickle cell 39, 75–6
anisochromasia 41
anaemia of chronic disease 64
iron deficiency anaemia 63
anisocytosis 32
beta thalassaemia major 74,
75
haemoglobin H disease 68
iron deficiency anaemia 63
megaloblastic anaemia 61
atypical lymphocytes 51, 52
atypical mononuclear cells 51
Auer rods 91, 92, 93, 114
Index
117
A Beginner’s Guide to Blood Cells, 2nd Edition
Barbara J. Bain
Copyright © 1996, 2004 by Blackwell Publishing Ltd

blood film 1–2
examination of 22–5
interpretation of 28
learning to look at 25
blood samples, problems with 25–
8, 26, 27, 28
boat-shaped cells 34, 35, 39
buffy coat 1
C
cell counts 18–19
children
blood count 56
normal ranges 24
chromatin 4–5, 52
chronic lymphocytic leukaemia
82–4, 83
chronic granulocytic leukaemia
80—1,80
chronic myeloid leukaemia 80–1,
80
Coombs’ test 70, 73
crenated cells see echinocytes
cyanmethaemoglobin 18
cytokines 11
D
dacrocytes 34, 35, 37
dimorphic cells 41
Döhle bodies 48, 79, 103
drumsticks 6, 7
E
echinocytes 25, 34, 35, 38, 113
elliptocytes 34, 35, 36
elliptocytosis
hereditary 34, 36, 70–1
iron deficiency anaemia 63
eosinopenia 45
eosinophils 4, 6, 7–8, 7
morphology 53–4, 53
normal range 23
infants and children 24
eosinophil leucocytosis see also
eosinophilia 45, 53
Epstein-Barr virus 51
erythrocyte sedimentation rate 64
erythrocytes see red cells
erythropoietin 57
ethnicity
and alpha thalassaemia trait 67
and blood count 23, 24, 57
ethylenediaminetetra-acetic acid 26
F
ferritin 63
fibrin strands 27
follicular lymphoma 85–6, 85
full blood count see blood count
G
glossitis 60
glucose-6-phosphate dehydrogenase
deficiency 71–2, 72
Golgi apparatus 12, 52
Golgi zone 12, 52
granulocytes 4, 5
grey platelet syndrome 55
H
haematocrit 18, 20
haemoglobin 2
mean cell 19, 20
mean cell concentration 19, 20
normal range, infants and
children 24
haemoglobin C disease 36, 39,
77–8
haemoglobin concentration 18
haemoglobin distribution width 43
normal range 23
haemoglobin H disease 67–8, 68
haemolytic anaemia 111
haemolytic uraemic syndrome 38
haemopoietic cells 12–17
see also individual cell types
hairy cell leukaemia 86
Heinz bodies 71
hemighosts 71, 72
hereditary elliptocytosis 34, 36,
70–1
hereditary spherocytosis 69–70,
70
Howell-Jolly bodies 42, 43, 103
beta thalassaemia major 74, 75
hyperchromia 40, 41
118
Index

hypochromia 40, 41
anaemia of chronic disease 64
beta thalassaemia major 74, 75
haemoglobin H disease 68
hyposplenism 68–9
I
idiopathic myelofibrosis 37, 96–7
infants
blood count 56
normal ranges 24
infectious mononucleosis 52, 112
iron deficiency anaemia 62–4, 63,
102
irregularly contracted cells 34, 35
K
keratocytes 34, 35, 37, 71
Kupffer cells 11
L
large unstained cells, normal
range 23
lauryl sulphate haemoglobin 18
lead poisoning 42
left shift 48, 79
leucocytes see white cells
leucocytosis 45, 46, 110
eosinophil 53
leucoerythroblastic anaemia 51
leucopenia 45
leukaemia 110
acute 87–96
acute lymphoblastic 88–90, 88,
89
acute myeloid 90–5, 91, 92, 93,
94
chronic lymphocytic 82–4, 83
chronic myeloid 80–1, 80
hairy cell 86
myelodysplastic syndromes
95–6
prolymphocytic 84–5, 84
lymphocytes 4, 6, 8–10, 9
atypical 51, 52
morphology 51–3, 52
normal range 23
infants and children 24
lymphocytopenia see lymphopenia
lymphocytosis 45, 81–7
causes of 82
chronic lymphocytic leukaemia
82–4, 83
follicular lymphoma 85–6, 85
hairy cell leukaemia 86
multiple myeloma 87
prolymphocytic leukaemia 84–5,
84
lymphopenia 45
M
macrocytes 32, 33
macrocytic anaemia 60
macrocytosis 28, 99–100, 102
autoimmune haemolytic
anaemia 73
megaloblastic anaemia 61
macrophages 10
macropolycytes 49, 50
malaria 42–3
May-Grünwald-Giemsa stain 2
mean cell haemoglobin 19, 20, 115
normal range 23
mean cell haemoglobin
concentration 19, 20, 115
normal range 23
mean cell volume 19, 20
normal range 23
infants and children 24
megakaryocytes 11
megaloblastic anaemia 50, 60–2,
61
metamyelocytes 13, 15, 16
microcytic anaemia 60
microcytosis 32, 33, 99, 102
anaemia of chronic disease 64
beta thalassaemia major 74
haemoglobin H disease 68
microspherocytes 34, 35, 38, 113
monocytes 4, 6, 10–11, 11
morphology 53–4, 53
normal range 23
infants and children 24
monocytopenia 45
monocytosis 45
mononuclear cells 4, 5
Index
119

multiple myeloma 87
myeloblasts 12, 13, 14
myelocytes 13, 15
myelodysplastic syndromes 49,
95–6, 114
N
natural killer cells 10
neonates, blood count 56
neutropenia 45
neutrophils 4, 5–7, 5, 6, 7, 13, 14
hypersegmentation 49
morphology 46–51, 48, 49, 50
normal range 23
Africans 24
infants and children 24
Afro-Caribbeans 24
neutrophil count 101, 103
neutrophil leucocytosis see
neutrophilia
neutrophilia 45, 78–81, 100, 102–3
bacterial infection 78–9, 79
chronic myeloid leukaemia 80–1,
80
normal ranges
Africans 24
blood count 21–2
Caucasians 23
infants and children 24
Afro-Caribbeans 24
normochromia 40, 41
normocytes 32, 33
normocytic anaemia 60
nucleated red blood cells 16–17, 17
O
ovalocytes 34, 35, 36
P
packed cell volume 18, 20, 115
normal range 23
Pappenheimer bodies 40, 42
beta thalassaemia major 74, 75
hereditary spherocytosis 70
Paul-Bunnell test 112
Pelger-Hüet anomaly 49
Perls’ stain 96
phagocytosis 7
Philadelphia chromosome 80
plasma 1
plasma cells 52
platelets 1, 11
aggregates 27
morphology 54–5
normal range 23
Africans 24
infants and children 24
Afro-Caribbeans 24
satellitism 28
poikilocytosis 32, 33–9
beta thalassaemia major 74, 75
beta thalassaemia trait 66
haemoglobin H disease 68
iron deficiency anaemia 63
megaloblastic anaemia 61
polychromasia 41
polychromatic cells 41
polycythaemia 30, 57, 58, 104
polycythaemia vera 57–9
polymorphonuclear leucocytes see
granulocytes
pregnancy, blood count in 56–7
proerythroblasts 13
prolymphocytic leukaemia 84–5,
84
promyelocytes 12, 13, 14, 15, 92,
94
punctate basophilia 42
R
red cells 1, 2–3, 3
formation 13
normal distribution 30
nucleated 16–17, 17
red cell abnormalities 57–78
alpha thalassaemia trait 66–7
anaemia 59–60, 59, 60
anaemia of chronic disease 64–5,
64
autoimmune haemolytic
anaemia 72–3, 73
beta thalassaemia major 73–4, 75
beta thalassaemia trait 65–6, 66
glucose-6-phosphate
dehydrogenase deficiency
71–2, 72
120
Index

haemoglobin C disease 77–8
haemoglobin H disease 67–8, 68
hereditary elliptocytosis 70–1
hereditary spherocytosis 69–70,
70
hyposplenism 68–9
iron deficiency anaemia 62–4, 63
megaloblastic anaemia 60–2, 61
polycythaemia 57, 58
polycythaemia vera 57–9, 58
sickle cell anaemia 75–6
sickle cell trait 76–7
sickle cell/haemoglobin C
disease 77
red cell agglutination 31–2, 31
red cell colour 39–42, 40, 41, 42
red cell count 19, 29–32, 30, 31
normal range 23
infants and children 24
red cell distribution width 43
normal range 23
red cell inclusions 42–3, 43
red cell indices 19–20
red cell shape see poikilocytosis
red cell size 19, 20, 32, 32, 33
reticulocytes 41
right shift 49, 50
ring sideroblasts 40
rouleaux 31, 112
S
satellitism 28
SC poikilocytes 34, 35, 39
schistocytes 34, 35, 38
self-assessment 98–115
sickle cell anaemia 39, 75–6
sickle cell disease 111
sickle cell trait 76–7, 100, 103
sickle cell/haemoglobin C disease
77
sickle cells 34, 35, 39
spheroacanthocytes 70
spherocytes 101
spherocytosis 34, 35, 36, 104
autoimmune haemolytic
anaemia 73
hereditary 69–70, 70
splenectomy 69, 101, 103
stomatocytes 34, 35, 37
storage artefacts 26
T
T cells 10
target cells 34, 35, 36, 43, 104
tear-drop poikilocytes see
dacrocytes
thrombocytopenia 45, 47, 54
thrombocytosis 45, 47
toxic granulation 46, 47, 48, 79
V
vacuolation 79
W
white cells 1, 4–11, 4
see also individual white cell
types
white cell abnormalities 78–97
acute leukaemias 87–96, 88, 89,
90, 91, 92, 93
idiopathic myelofibrosis 96–7
lymphocytosis 81–7, 82, 83, 84,
85
, 86
neutrophil leucocytosis 78–81,
79
, 80
white cell count 45, 46, 47
normal range 23
Africans 24
infants and children 24
Afro-Caribbeans 24
Wiskott-Aldrich syndrome
47
Index
121