
Dr. Ahmed S. Al-Naaimi
4
th
grade medical students
-1-
Q1)
The table below contains data from Georgia Natality Vital
Statistics report, 2000. Compute the age specific fertility rate,
general fertility rate, and total fertility rate.
Age group (years)
Number of women in population
Number of live births to women
of specified age group
(10-14)
296,114
396
(15-19)
286,463
17,915
(20-24)
285,733
36,512
(25-29)
316,000
35,206
(30-34)
326,709
27,168
(35-39)
350,943
12,685
(40-54)
887,104
2,404
Total
2,749,066
132,286
Solution
A
B
C
G
H
Age group
(years)
Number of
women in
population
Number of live
births to
women of
specified age
group
Age specific
birth rate
(/1000
women)
Age interval
width
Total fertility
rate
(10-14)
296,114
396
1.3
5
6.5
(15-19)
286,463
17,915
62.5
5
312.5
(20-24)
285,733
36,512
127.8
5
639
(25-29)
316,000
35,206
111.4
5
557
(30-34)
326,709
27,168
83.2
5
416
(35-39)
350,943
12,685
36.1
5
180.5
(40-54)
887,104
2,404
2.7
15
40.5
Total
2,749,066
132,286
2,152.0
For each age group:
Age specific birth rate = (B / A) x 1,000
Components of total fertility rate = C x G
Overall rates
General fertility rate = (total observed live births / total number of women ) x
1,000 = 48.1 per 1000 women
Total fertility rate = sum of its components
Total fertility rate = 2,152 per 1000 women

Dr. Ahmed S. Al-Naaimi
4
th
grade medical students
-2-
Q2)
The following 2000 data were reported for the Clayton County
(Georgia) Health District. Compute the crude death rate, race
specific death rates for white and black, infant mortality rate,
neonatal mortality rate, fetal death rate, cause of death ratio for
malignant neoplasms and major cardiovascular diseases.
Total
White
Black
Total population
236,517
89,741
121,927
Total live births
4,350
1,629
2,494
Fetal deaths
41
8
32
Deaths
All ages
1,366
898
446
Under 1 year
41
13
28
Under 28 days
24
6
18
Cause of death
Malignant neoplasm
303
212
85
Major cardiovascular disease
471
329
136
Solution
crude death rate=(1,366 / 23,6517) x 1000=5.8/1000
White race specific death rates=(898 / 89,741) x 1000=10.0/1000
Black race specific death rates=(446 / 121,927) x 1000=3.7/1000
infant mortality rate=(41 / 4,350) x 1000=9.4/1000
neonatal mortality rate=(24 / 4,350) x 1000=5.5/1000
fetal death rate=(41 / (4,350+41)) x 1000=9.3/1000
cause of death ratio for malignant neoplasms=(303 / 1,366) x 100=22.2%
cause of death ratio for major cardiovascular diseases=(471 / 1,366) x 100=34.5%

Dr. Ahmed S. Al-Naaimi
4
th
grade medical students
-3-
Q3)
For a certain population at a specific year, which is higher
crude birth rate or general fertility rate? Explain why?
The formula used for calculating each rate is as follows
Crude birth rate = Number of live births (during a year) x k
Average (mid year) population
General fertility rate = Number of live births (during a year) x k
Total number of women of child bearing age
One can notice that the numerator is the same for both rates, while the
denominator for crude birth rate is higher in magnitude than that of the general
fertility rate, since the total number of women is a part of that of the average mid-
year population. The resulting proportion would be therefore smaller for birth
rate compared to general fertility rate.

Dr. Ahmed S. Al-Naaimi
4
th
grade medical students
-4-
Q4)
The table below contains the birth vital statistics for USA for
the years 1949 and 1960
USA rates / 100,000 live births
1960
1949
<28 days of age
1,872.6
2,144.3
28 days to 11 months
731.4
989.0
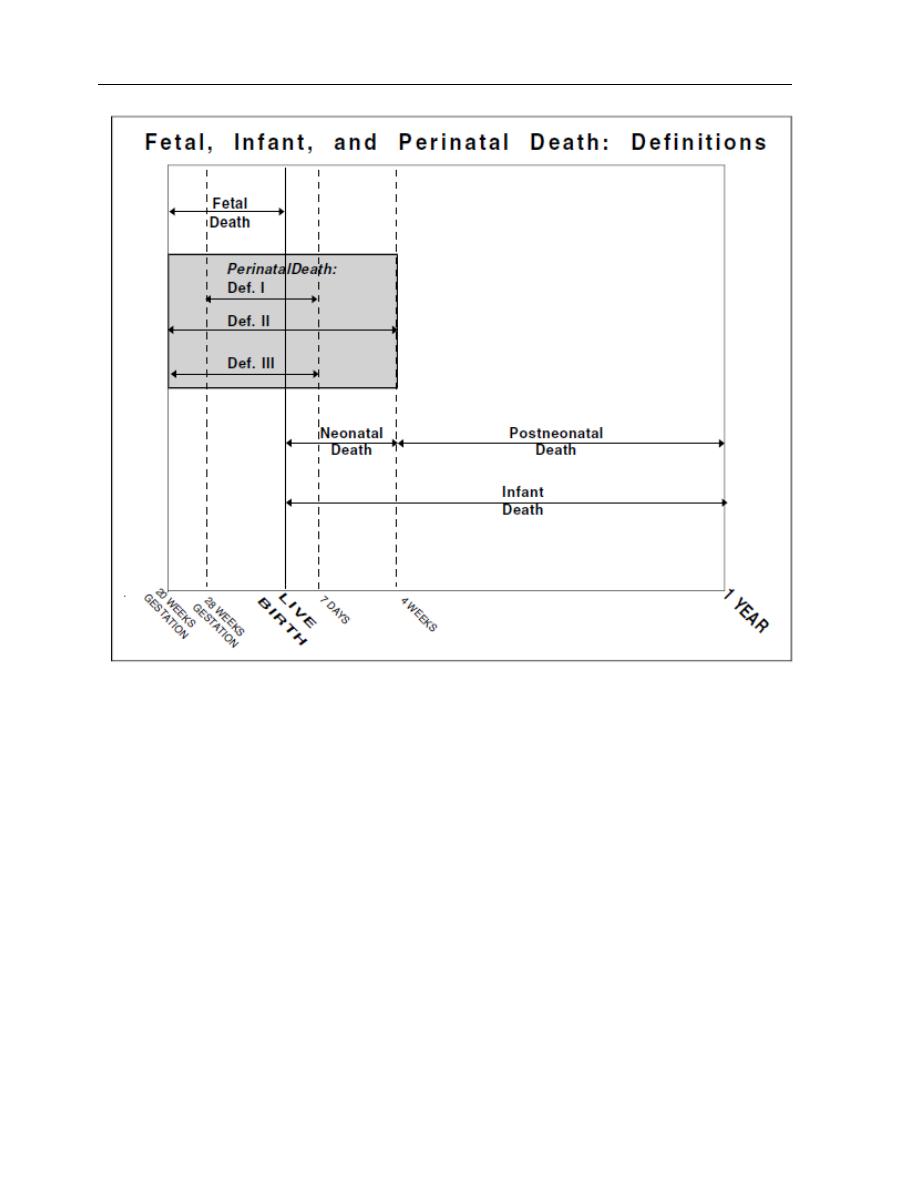
A) What is your interpretation of time trend changes in neonatal mortality rate?
B) Calculate the infant mortality rate at both points of time?
Neonates are those <28 days of age. The rates observed for USA shows a
noticeable decline in death rates during the 11 years follow up interval from 1949
to 1960.
Infant mortality rate is the death rate among <1 year of age children. Since this
rate shares the same denominator for both neonatal mortality rate (<28 days) and
children aged 28 days to 11 months mortality rate, it equals the sum of the two
rates.
Infant mortality rate (<1 year of age) for the year 1960 =2,604.0 infants deaths /
100,000 live births
Infant mortality rate (<1 year of age) for the year 1949 =3,133.3 infants deaths /
100,000 live births
Dr. Ahmed S. Al-Naaimi
4
th
grade medical students
-5-
Dr. Ahmed S. Al-Naaimi
4
th
grade medical students
-6-
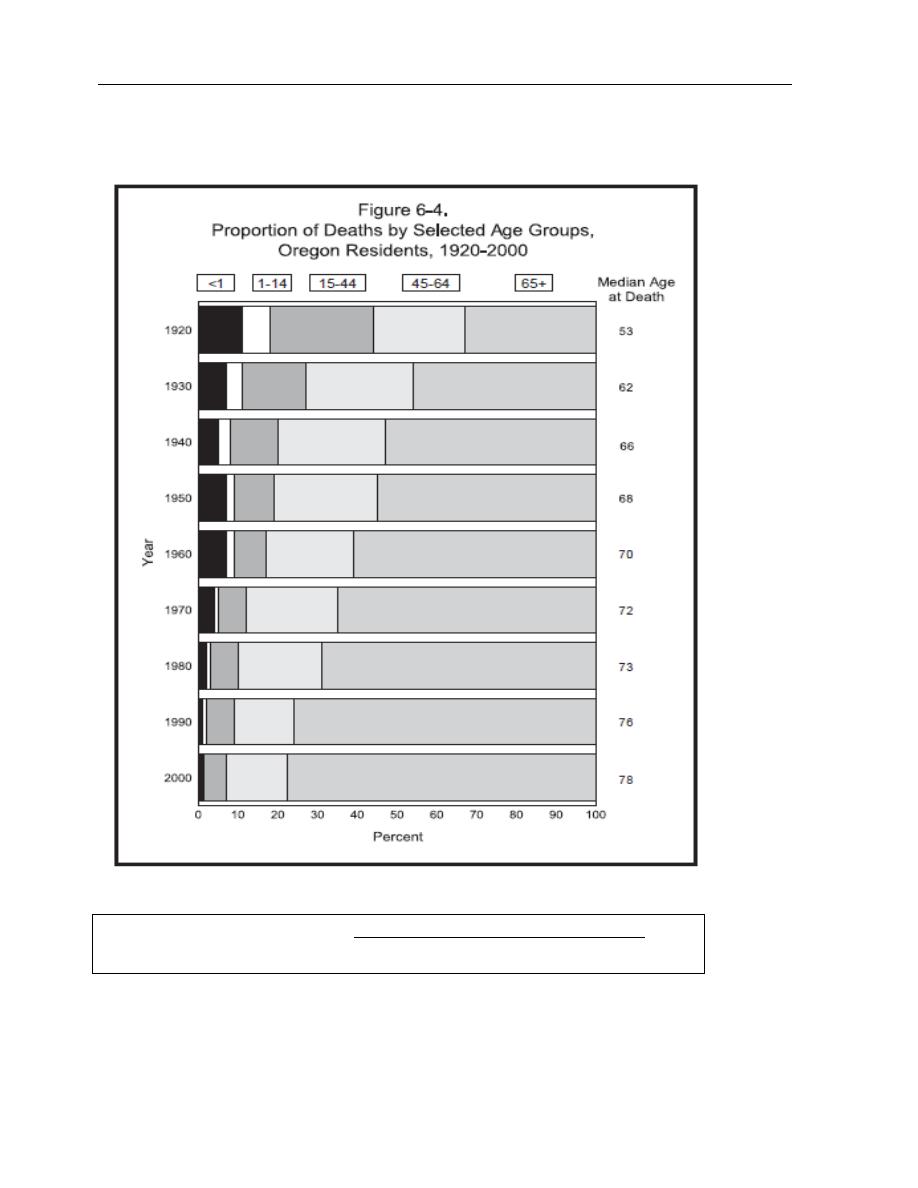
Q5)
What do you call the mortality measure showed in the figure
below? What is your interpretation of the time trend changes?
Proportional mortality ratio = Number of deaths in an age group x k
for an age group
Total number of deaths
It is evident from the figure above that as we move from the oldest time
station (year 1920) to the most recent one (year 2000) the contribution of younger
age groups (with special emphasis on infants) to total deaths declines and is
substituted by the oldest age group (65+ years). This pattern indicates a major
improvement in health status with time.