1
Q1) Two surveys were done of the same community 12 months apart. Of 5,000
people surveyed the first time, 25 had antibodies to histoplasmosis. Twelve
months later, 35 had antibodies, including the original 25.
What is the prevalence rate of histoplasmosis at the first and second survey?
What is the one year incidence rate?
Q1) Answer
1. Prevalence at the second survey:
x = antibody positive at second survey = 35
y = population = 5,000
(x/y) x 10ⁿ = 35/5,000 x 1,000 = 7 per 1,000
2. Incidence during the 12-month period:
x = number of new positives during the 12-month period = 35 – 25 = 10
y = population at risk = 5,000 – 25 (already infected) = 4,975
(x/y) x 10ⁿ = 10/4,975 x 1,000 = 2 per 1,000
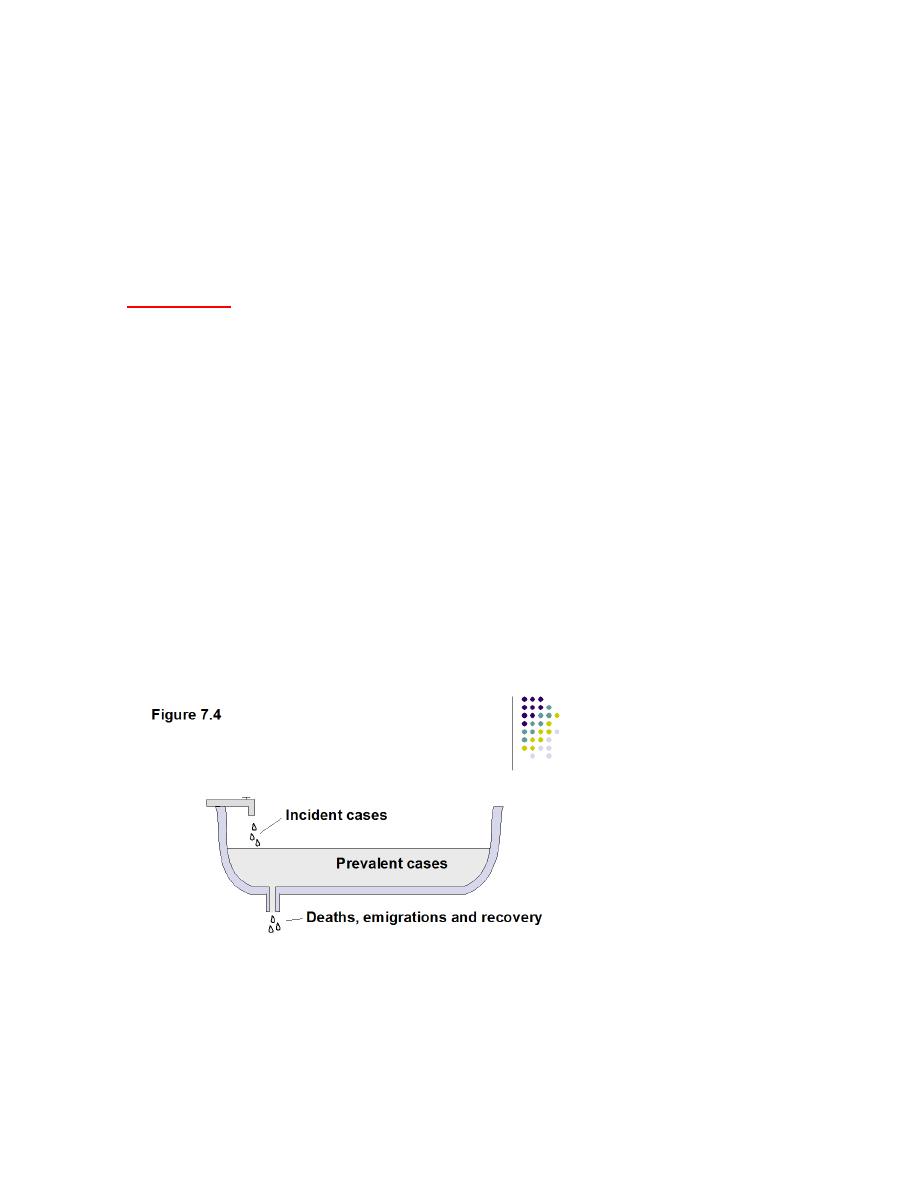
Prevalence is based on both incidence (risk) and duration of disease. High
prevalence of a disease within a population may reflect high risk, or it may reflect
prolonged survival without cure. Conversely, low prevalence may indicate low
incidence, a rapidly fatal process, or rapid recovery.

2
Q2) Use the following numbers to calculate the annual incidence rate and 1991
prevalence of AIDS per 100,000 population in Hispanics in Houston, Texas.
For ease of calculation, assume that cases alive at the beginning of 1991 live for
the entire year.
Total estimated Hispanic population in 1991 = 452,780
Total cases of AIDS in Hispanics reported from 1981- 1990 = 850
Total new cases of AIDS reported in Hispanics in 1991 = 95
Total deaths from AIDS in Hispanics from 1981 (first year reporting began) to
1990 = 595
What is the 1991 prevalence and incidence rate?
Q2) Answer:
991 prevalence= (850 - 595 + 95)/452,780 X 100,000 = 77.3/100,000
1991 incidence rate = 95/452,780 X 100,000 = 21/100,000
NOTE: When the population is large relative to the number of events in the
numerator, it is customary not to subtract deaths from the denominator.

3
Q3) Estimated* population values and the number of new TB cases reported to the
CDC appear in Table below. Use this data to calculate the TB (incidence rates)
case rates for years 2000 to 2007.
Table 2. New reported TB Cases: 2000-2007 in USA
Year
New Cases
US Population
Estimates
Case rate per
100,000
(incidence rate)
2000
16309
281,189,655
5.8
2001
15946
284,750,000
2002
15056
289,538,462
2003
14837
290,921,569
2004
14501
295,938,776
2005
14065
293,020,833
2006
13754
299,000,000
2007
13299
302,250,000
* Estimated population values for this exercise were generated used the rates and
cases that appear in the 2007 Surveillance Report (reference 2).
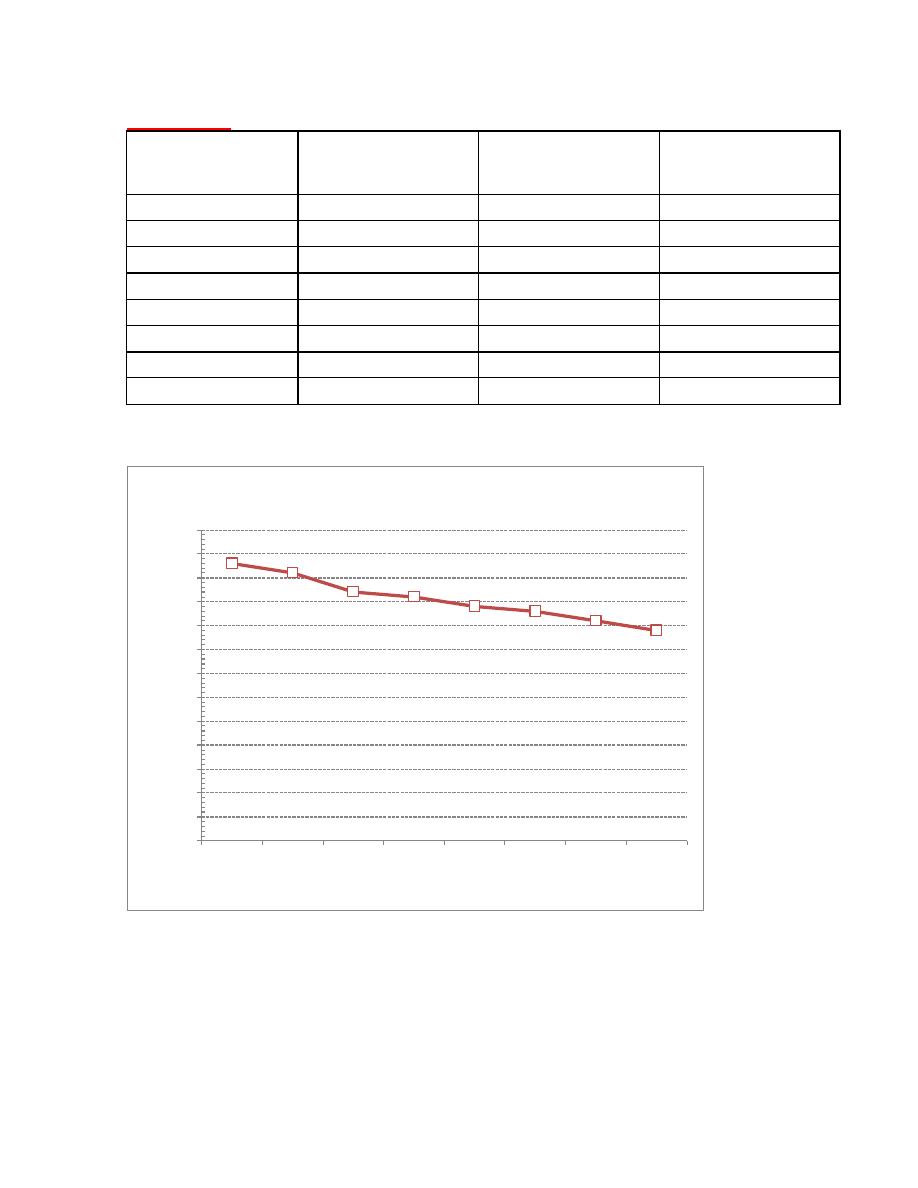
B. Describe the trend in TB incidence rates over time.
4
Q3) Answer
Year
New Cases
US Population
Estimates
Case rate per
100,000 (incidence
rate)
2000
16309
281,189,655
5.8
2001
15946
284,750,000
5.6
2002
15056
289,538,462
5.2
2003
14837
290,921,569
5.1
2004
14501
295,938,776
4.9
2005
14065
293,020,833
4.8
2006
13754
299,000,000
4.6
2007
13299
302,250,000
4.4
0
0.5
1
1.5
2
2.5
3
3.5
4
4.5
5
5.5
6
6.5
2000
2001
2002
2003
2004
2005
2006
2007
In
ci
d
e
n
ce
ra
te
o
f
TB
(/
100
,000
)
Year of reporting
Case rate per 100,000 (incidence rate)

5
Q4) For each of the following scenarios, determine whether it is more closely
related to incidence or to prevalence.
1. Number of campers who developed gastroenteritis within a few days after eating
potato salad at the dining hall?
2. Number of persons who reported having diabetes as part of the National Health
Interview Survey?
3. Occurrence of acute myocardial infarction (heart attack) among participants
during the first 10 years of follow-up of the Framingham Study?
4. Number of persons who died and whose deaths were attributed to Hurricane
Floyd in North Carolina in 1999?
5. Number of children who have immunity to measles, either because they had the
disease or because they received the vaccine?
Answer Q4)
1. Incidence – Here we are interested in the number of new cases after eating the
potato salad.
2. Prevalence – Here we are interested in the number of existing cases.
3. Incidence – Here we are interested in the number of new cases that occur during
the follow-up.
4. Incidence – Here we are interested in the number of new deaths attributed to the
hurricane.
5. Prevalence – Here we are interested in the existing number of children who have
immunity to measles.

6
Q5) Suppose a surveillance system was able to accurately and completely capture
all new occurrences of disease in a community. Suppose also that a survey was
conducted on July 1
st
that asked every member of that community whether they
currently had that disease. For each of the following conditions, determine
whether incidence (per 1,000 persons per year) or prevalence (per 1,000 persons
on July 1) is likely to be higher.
6. Rabies (occurs rarely and has a short duration, e.g., death within one week)?
7. Multiple sclerosis (rare occurrence, long duration [many years])?
8. Influenza (common but winter-seasonal occurrence, short duration)?
9. Poison ivy dermatitis (common spring/summer/fall occurrence, 2-week
duration)?
10. High blood pressure (not uncommon occurrence, lifelong duration)?
Answer Q5)
6. Incidence – Since rabies has a short duration, we would expect the prevalence on
a particular day to be low relative to the incidence.
7. Prevalence – The incidence of multiple sclerosis would be low, but since it has a
long duration, we would expect the prevalence to be higher.
8. Incidence – The incidence of influenza would be high, but since it is of short
duration the prevalence would be low.
9. Incidence – Since the duration of poison ivy is relatively short the prevalence
would be low, and since it is a common occurrence, the incidence would be
high.
10. Prevalence – Since high blood pressure is common and of long duration, both
incidence and prevalence are high, but the prevalence would be higher.
7
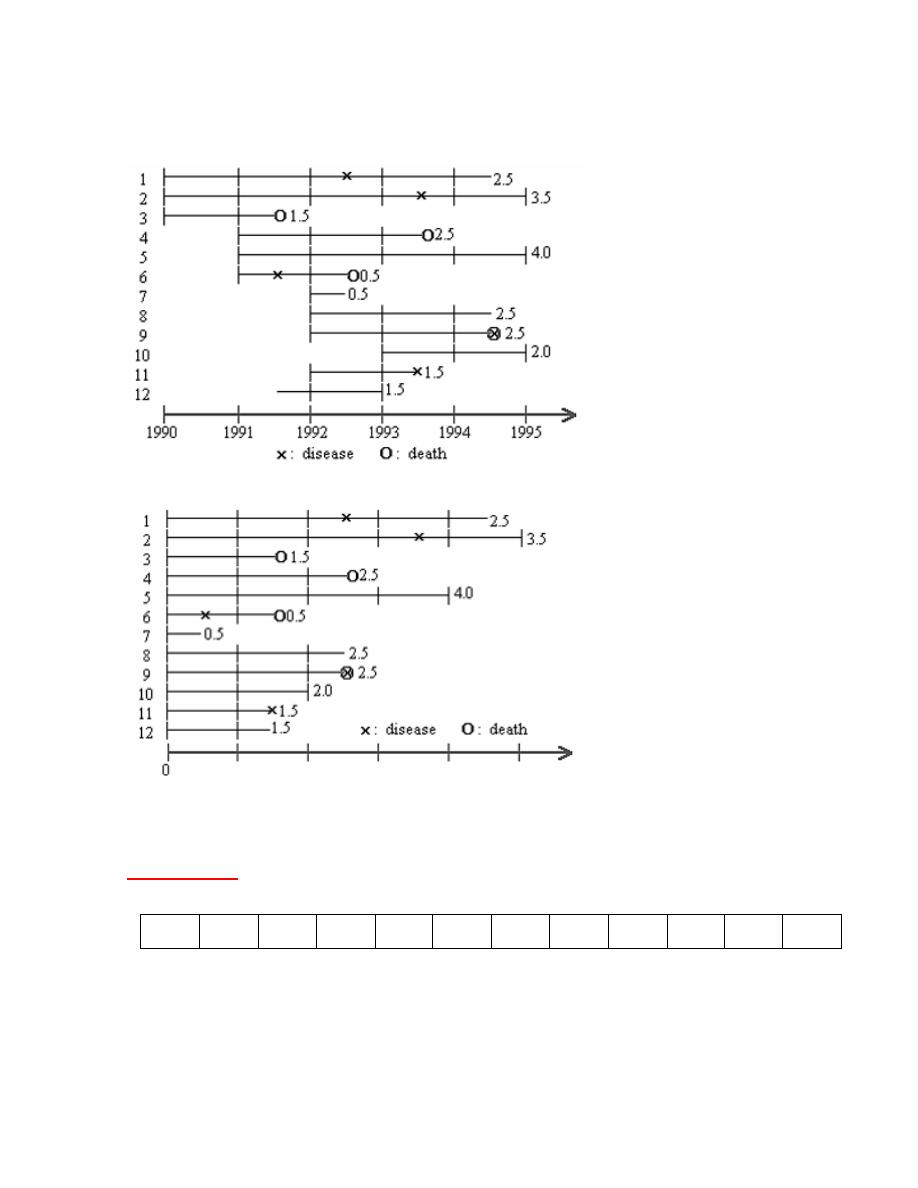
Q6) The figure below shows the results of follow up of 12 persons over a
maximum period of 5 years, waiting for the development of disease (X).
What is the incidence density of the disease (X) in the example above
Q6) Answer:
Person-year of observation
2.5
3.5
1.5
2.5
4
0.5
0.5
2.5
2.5
2
1.5
1.5
Total = 25 Person-year of observations
Count of subjects who developed the disease = 5
Incidence density = 5/25=0.20 x 100 (constant) = 20/100 person years