Lect.6
Electrical axis and cardiac vector
Objectives:
1. State the relationship between the direction of cardiac vector with
the direction (-ve, +ve) and amplitude of an ECG waves.
2. Draw diagram indicting the axes of limb leads.
Cardiac vector:
The cardiac vector is the net result of the directions of the spread of
depolarization waves from the SA node through the atria, AV node,
interventricular septum, ventricles, and to the apex of the heart, the last
part of the heart to be depolarized is the base of the heart.
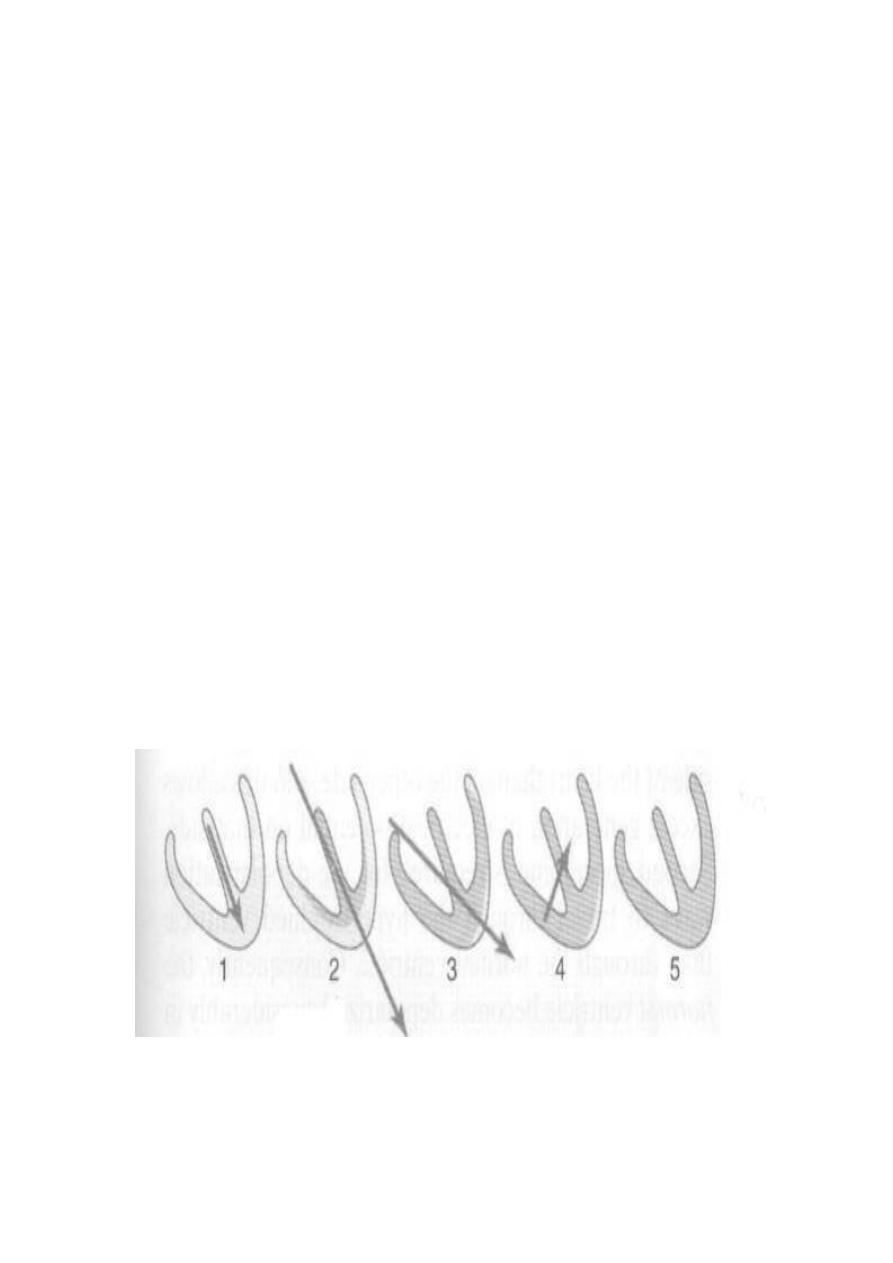
Vector that occurs during depolarization of the ventricles
When the cardiac impulse enters the ventricles through the AV bundle,
the first part of the ventricles to become depolarized is the left
endocardial surface of the septum, then this depolarization spreads
rapidly to involve both endocardial surfaces of the septum, the
endocardial surface of the two ventricles and finally it spreads through
the ventricular muscle to the outside of the heart and thereafter, the heart
vector points toward the base of the left ventricle.
Figure: Vectors that occur during depolarization of the
ventricles.
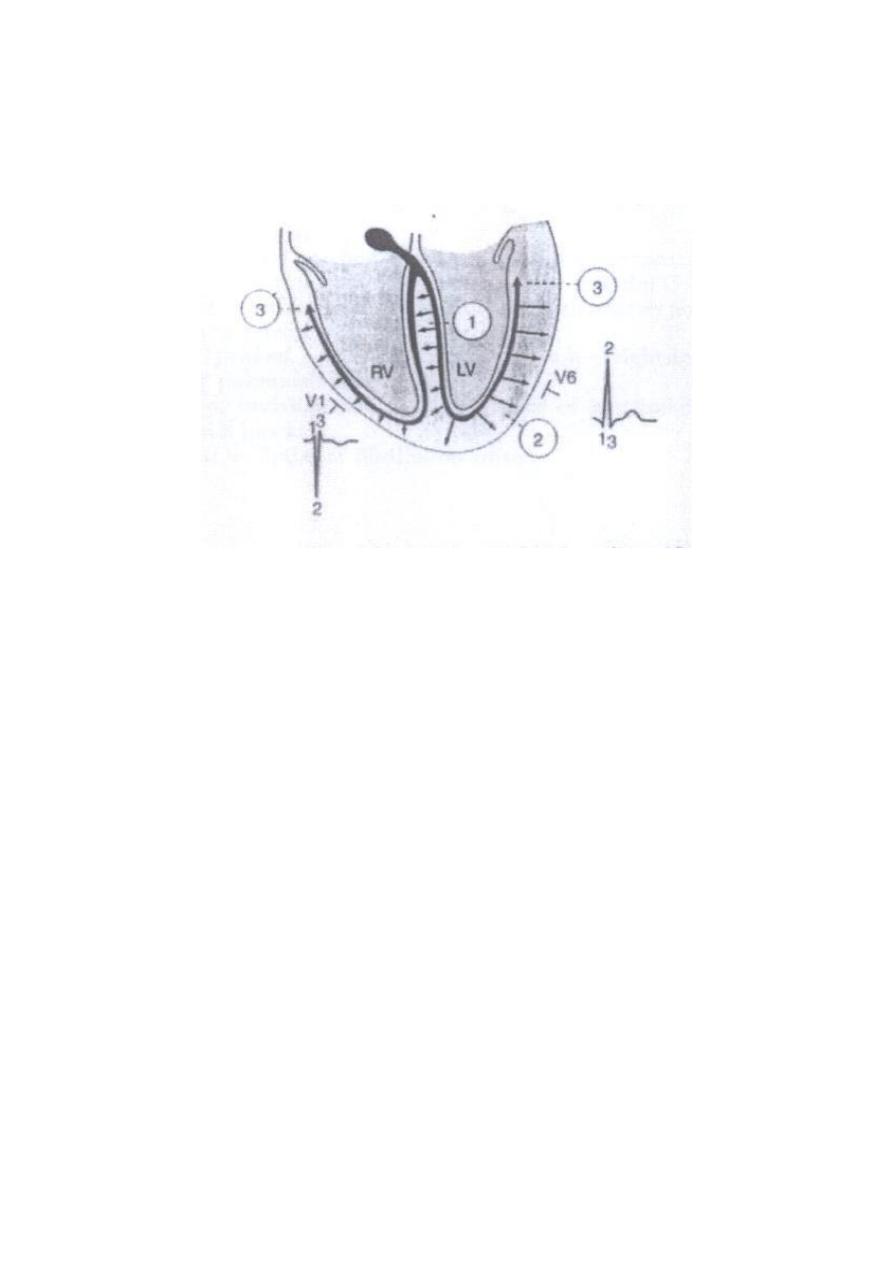
Figure: Gensis of the QRS complex. The first phase, directed from left to
right across the septum, produce Q wave in V6 and an R wave in V1. The
second phase, due to depolarization of the left ventricle from
endocardium to epicardium, results in a tall R wave in V6 and a deep S
wave in V1. Phase 3, depolarization of the basal parts of ventricles
producing a terminal S wave in V6 and a terminal R wave in V1.
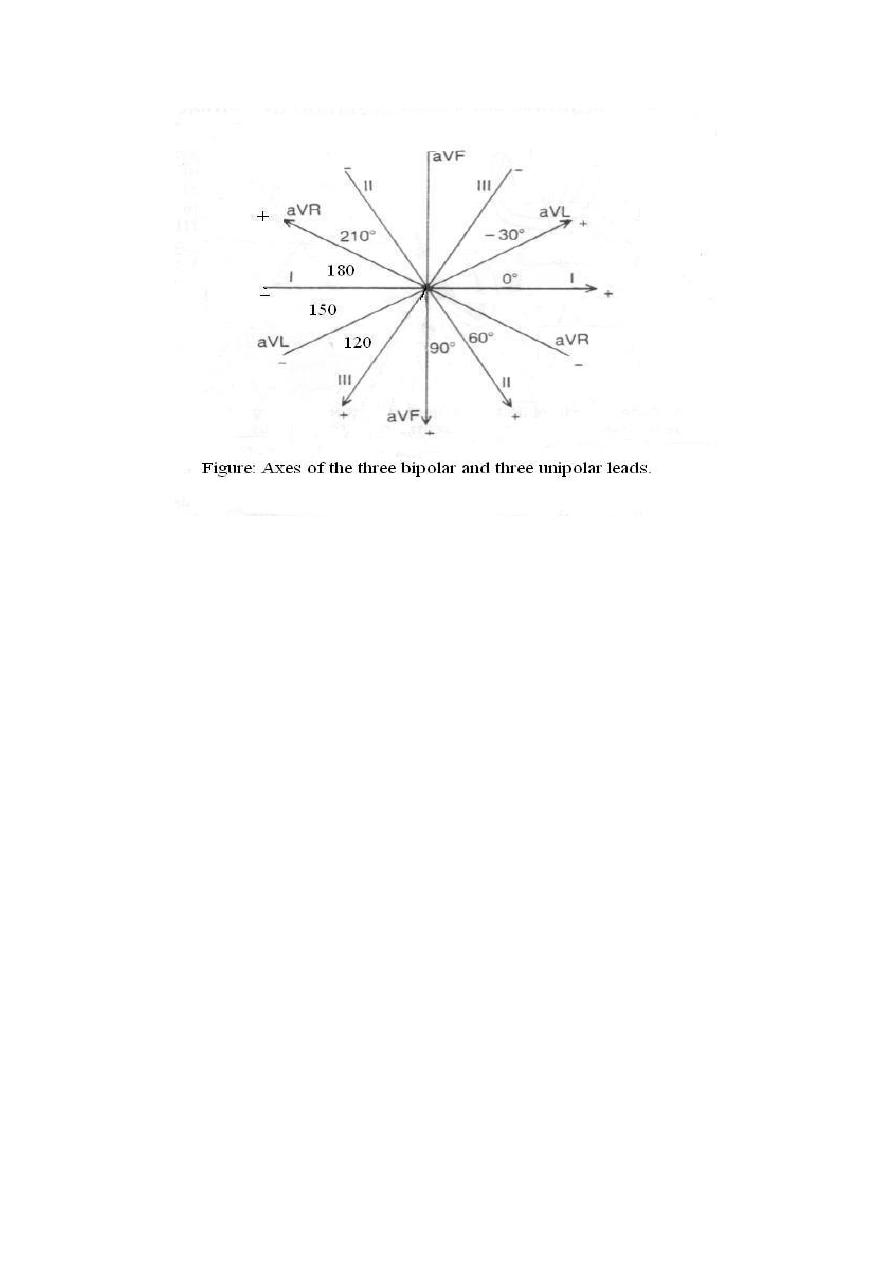
Electrical axis of the ventricular QRS:
In relation to the bipolar limb leads (I, II, III), the cardiac vector or axis
can be calculated. The relationship among the six limbs leads, i.e., the
axis of each standard bipolar and unipolar limb leads can be presented in
the following diagram:
The mean electrical axis of the ventricular QRS
The average direction of the depolarization waves in all ventricular
muscle fibres is called the mean electric axis of the ventricles or mean
ORS axis or vector.
Depolarization in cardiac muscle fibres can be represented by an arrow
pointing to the + ve direction. This arrow is called a vector.
In normal heart, the direction of the cardiac vectors of the ventricles is
normally toward the apex of the heart. In other words, the direction of the
electrical potential is from the base of the ventricles toward the apex..
The mean ORS axis has a magnitude & direction, and is related to the
anatomical axis of the heart. The normal electric axis is directed
downwards and to the left between - 30 and +110 (average + 60).
Clinically, the electrical axis of the heart is determined from the standard
bipolar limb leads; lead I and lead III as follows:
First, record the maximum potential (that of QRS wave; R wave)
and polarity (+ve or –ve), to determine the maximum potential, you
might need to subtract the area of the negative wave from the area
of the positive wave. This means that the net QRS deflection in
each lead is calculated by subtracting the amplitude of the largest -
ve wave in the QRS from that of the R wave.
Second, a distance equal to the net deflection in each lead is drawn
as
an
arrow on the corresponding axis of the bipolar limb lead (clock),
starting from its zero potential point and pointing to the resulting
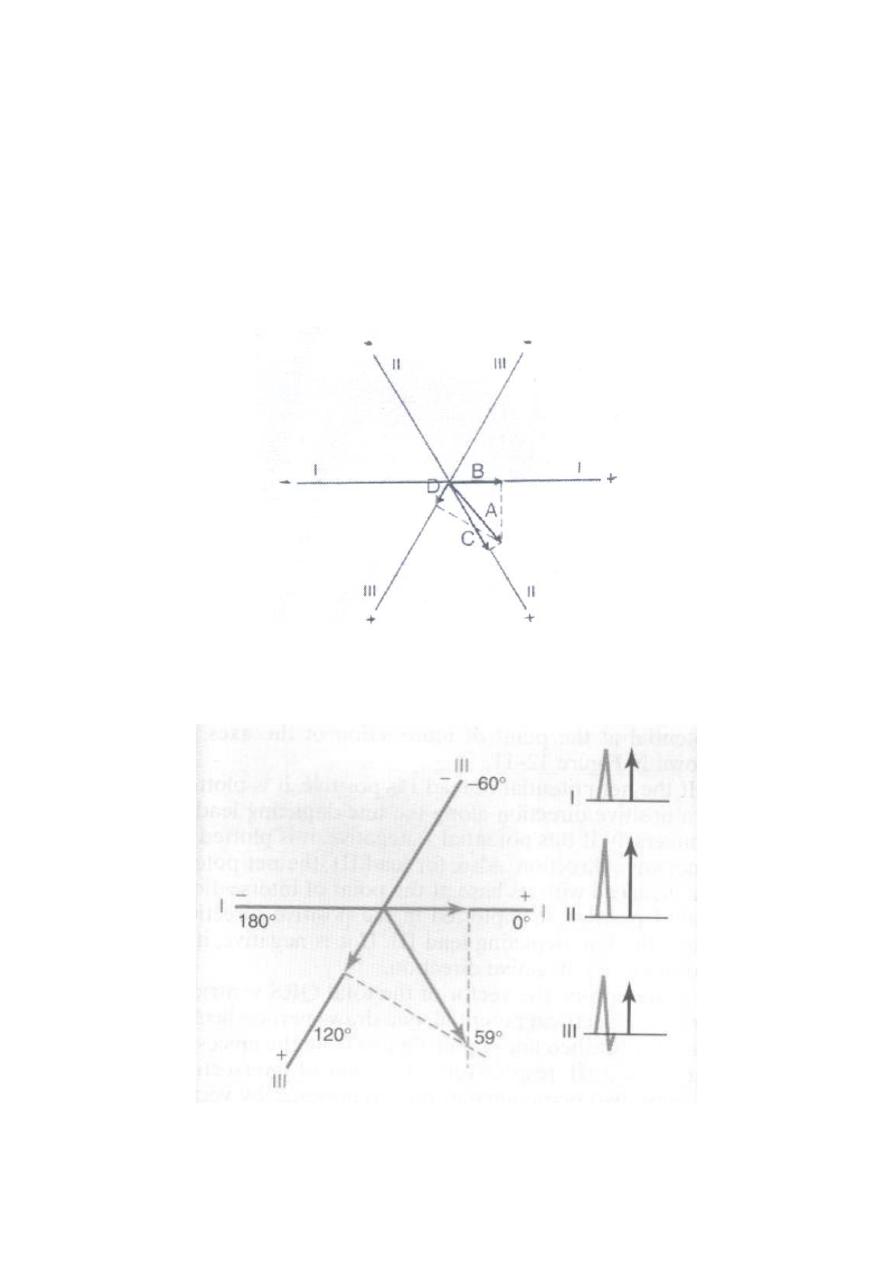
polarities (+ve or -ve).
Third, draws perpendicular lines form both ends of the arrows; th
apices of the two net potentials of lead I and III, the point of
intersection of these two lines represents the mean electrical axis or
the mean QRS vector of the ventricles.
In a normal heart, the average direction of the vector of the heart during
spread of the depolarization waves through the ventricles; the mean QRS
vector, is about +59 degrees, as shown in the following figures:
Figure: Determination of projected vectors in leads I, II, and III where
vector A represent the instantaneous potential in the ventricles.
Figure: The mean electrical axis of the heart (59 degree) plotted
From lead I and lead III.
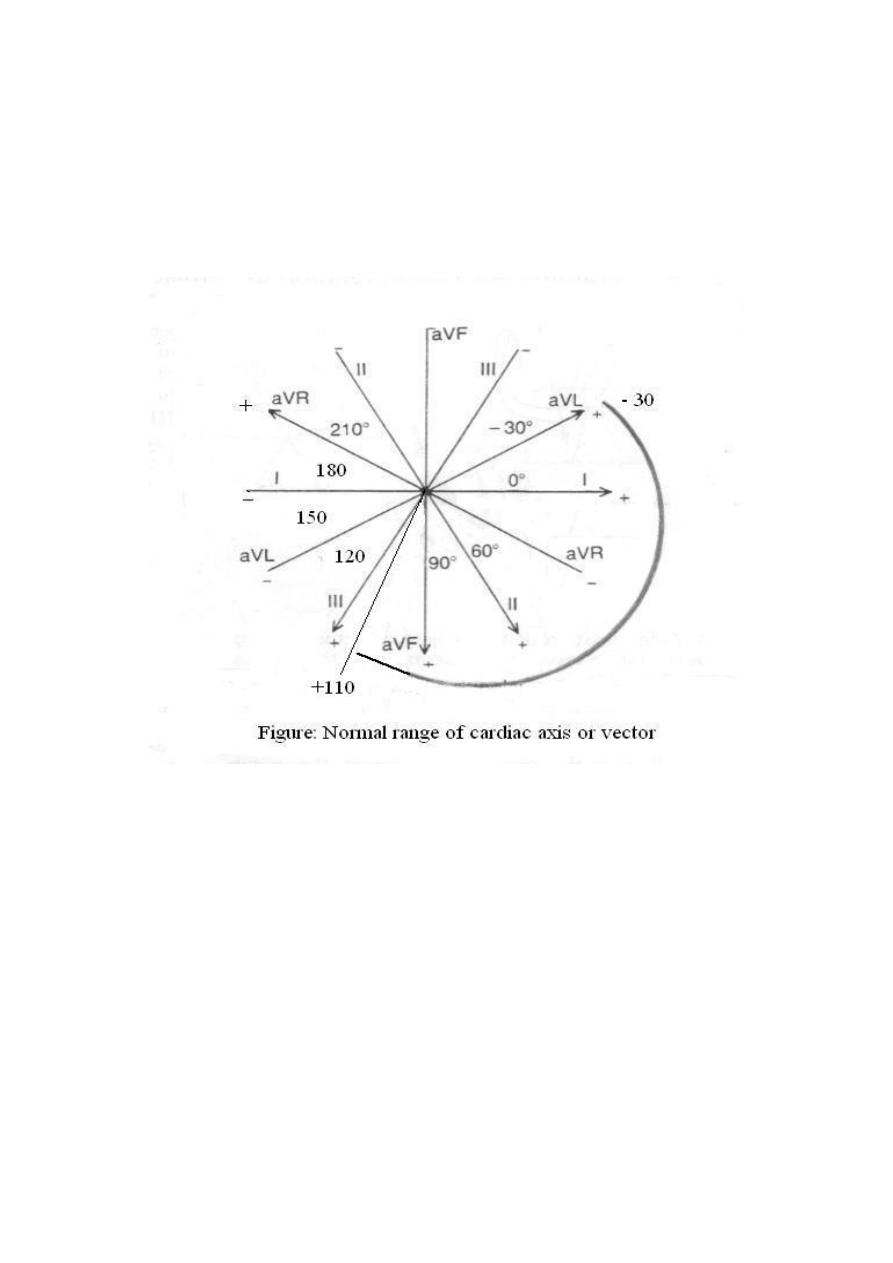
The cardiac vector affects the configuration of the ECG waves in the
various leads. The normal direction of the mean QRS vector is
downwards and to the left and is generally between –30 and +110
degrees.
Axis deviation:
Axis deviation occurs if the electric axis of the heart is beyond the normal
range and it may be to the right or to the left. QRS axis further right that
of +110 constitutes Right axis deviation (RAD), QRS axis left that of –
30 constitutes Left axis deviation (LAD).
Right axis deviation
This normally occurs in vertical hearts (e.g. in tall slender subjects), but
pathologically, it is common in right ventricular hypertrophy and right
bundle branch block. In this case, the projection of the mean QRS axis is
toward the -ve pole in lead I and toward the +ve pole in lead III, so in
ECG, there are deep -ve waves (S waves) in lead I and high +ve waves (R
waves) in lead III, as shown in the following figure.
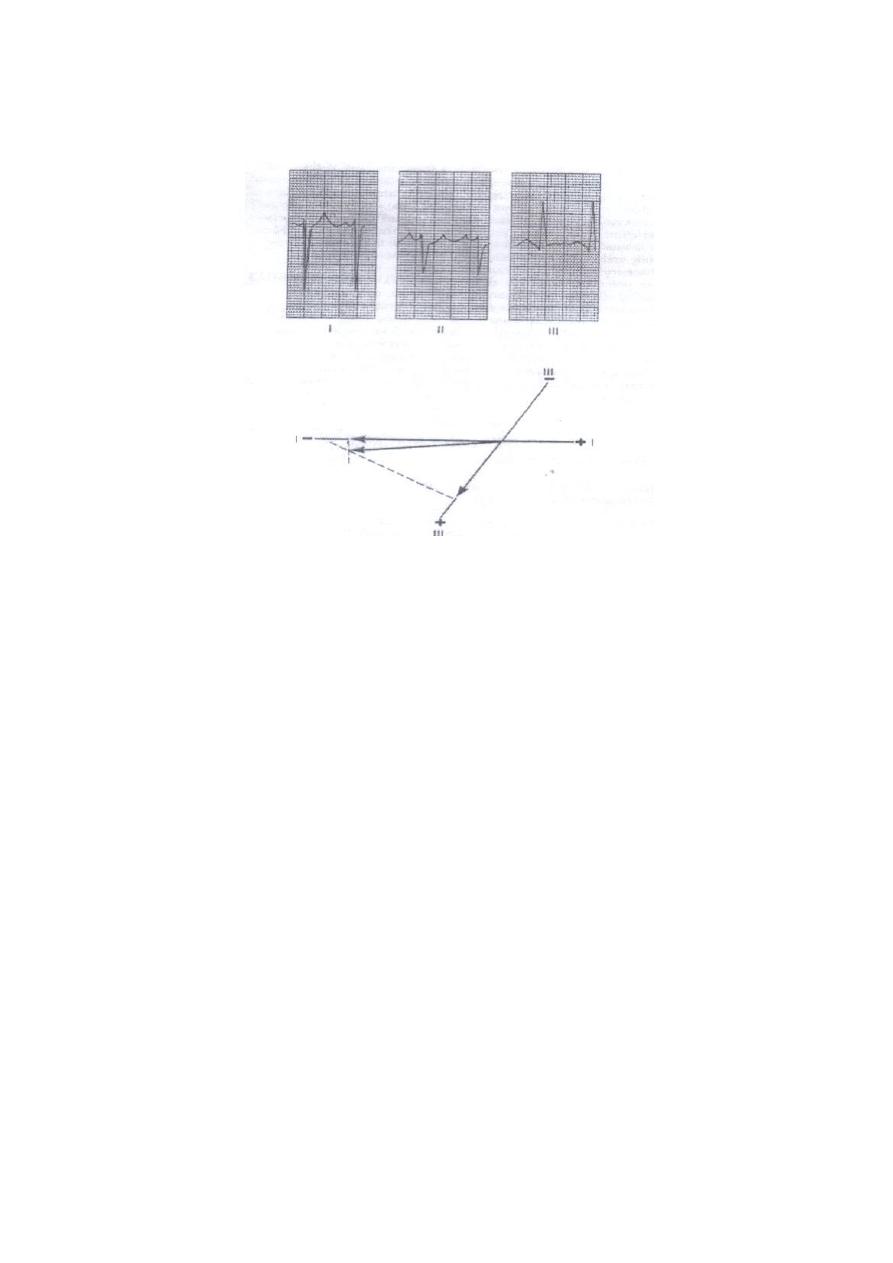
Figure: Right axis deviation and a slightly prolonged QRS complex.
Left axis deviation
This normally occurs in horizontal hearts (e.g. in short obese subjects and
pregnant women) but pathologically, it is common in left ventricular
hypertrophy and left bundle branch block. In this case, the projection of
the mean QRS axis is toward the +ve pole in lead I and toward the -ve
pole in lead III, so in ECG there are high +ve waves (R waves) in lead I
and deep -ve waves (S waves) in lead III.
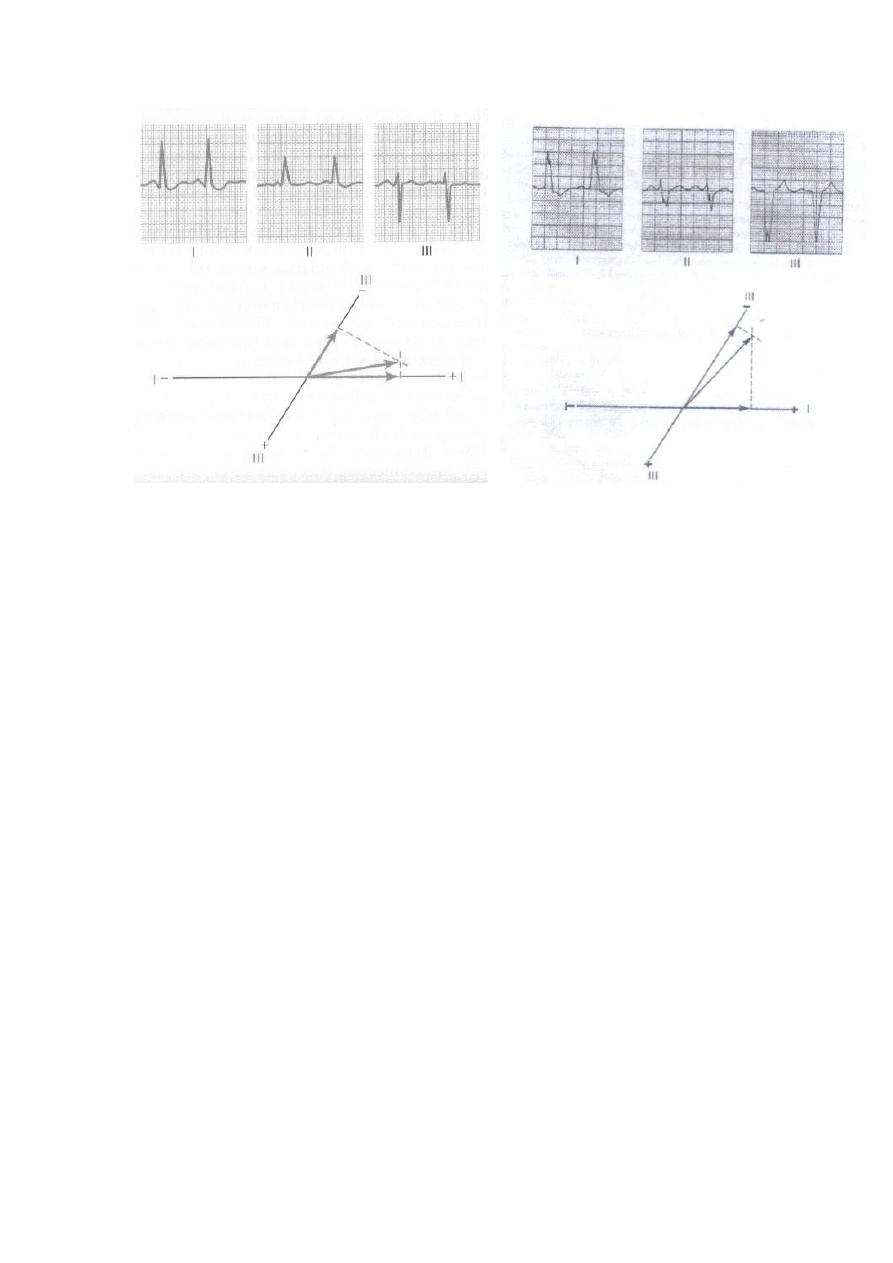
Figure: Example of left axis deviation. Figure: left axis deviation
caused by left bundle
branch block. Note also
the greatly prolonged QRS
complex.