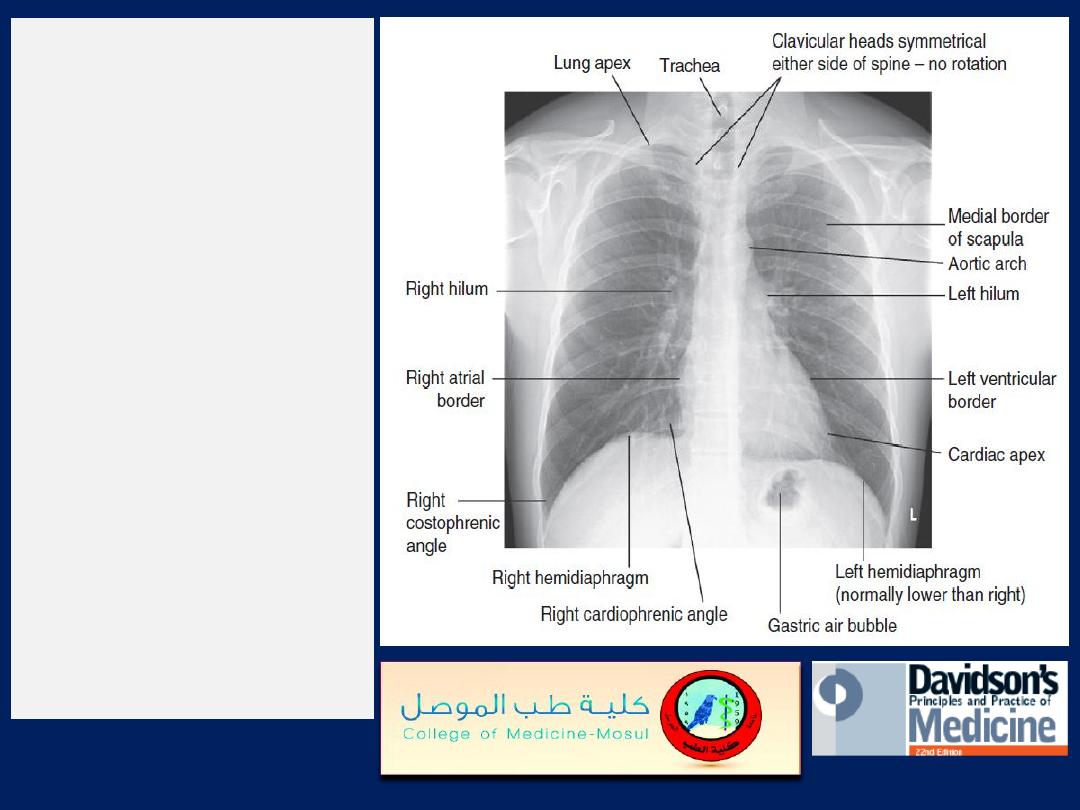
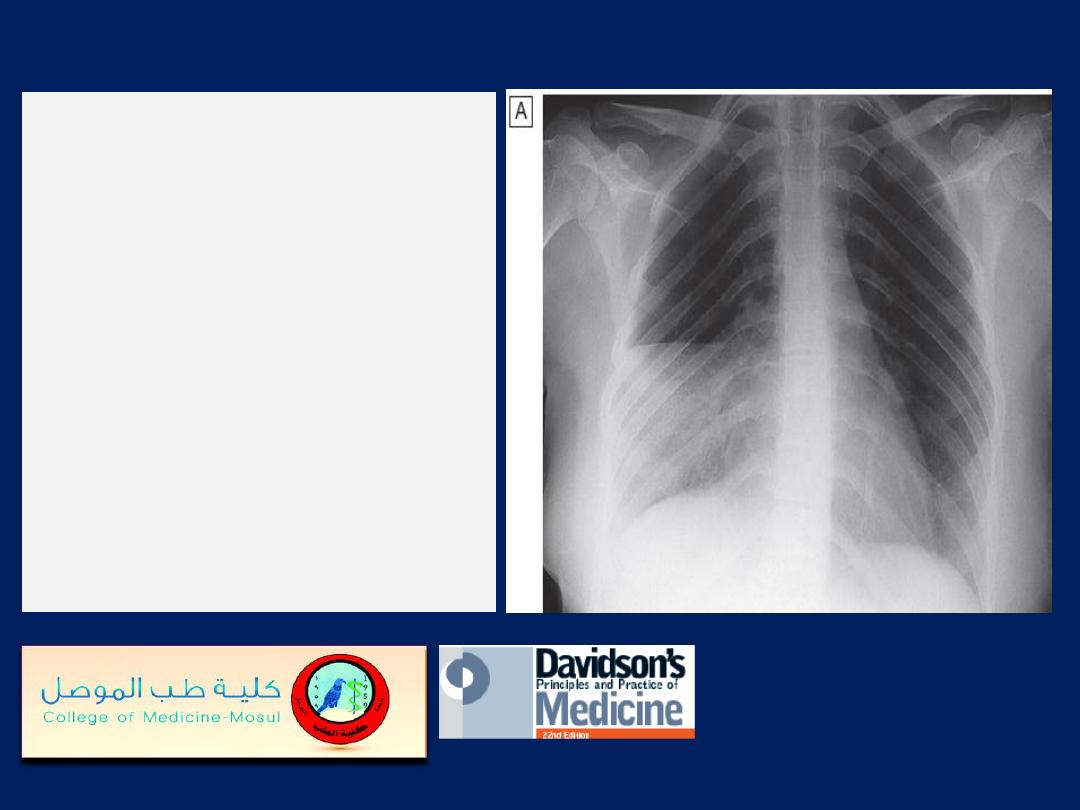
The normal chest X-ray.
The lung markings consist of
branching and tapering
lines radiating out from the
hila. Where airways and
vessels turn towards the film,
they can appear as open or
filled circles (see upper pole
of right hilum). The scapulae
may overlie the lung fields;
trace the edge of bony
structures to avoid
mistaking them for pleural
or pulmonary shadows. To
check for hyperinflation,
count the ribs; if more than
10 are visible posteriorly
above the diaphragm, the
lungs are hyperinflated.
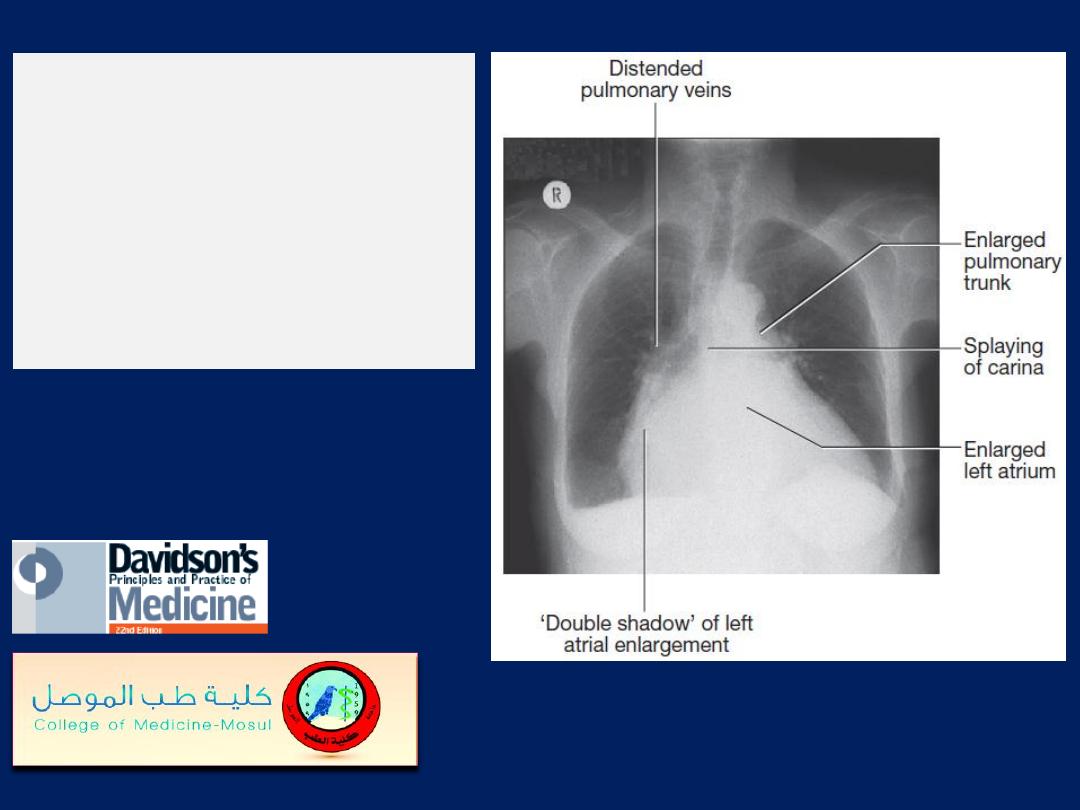
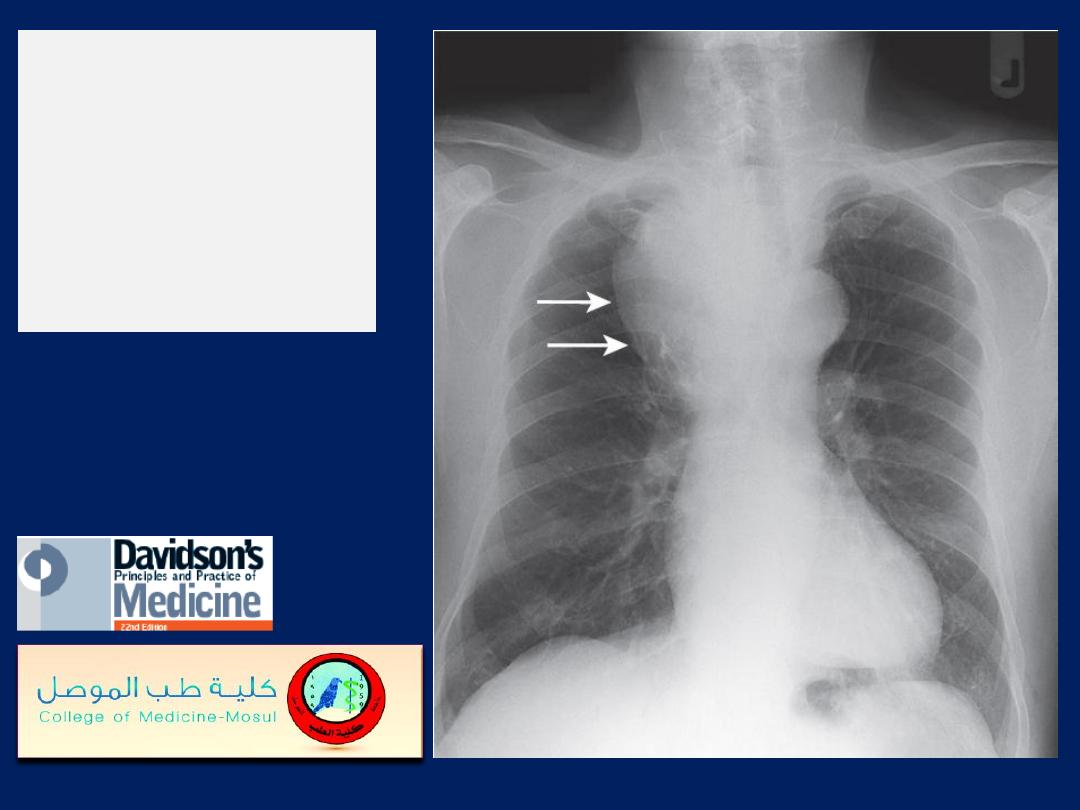
Chest X-ray of a patient
with mitral
stenosis and
regurgitation indicating
enlargement of the LA
and prominence of the
pulmonary artery trunk.
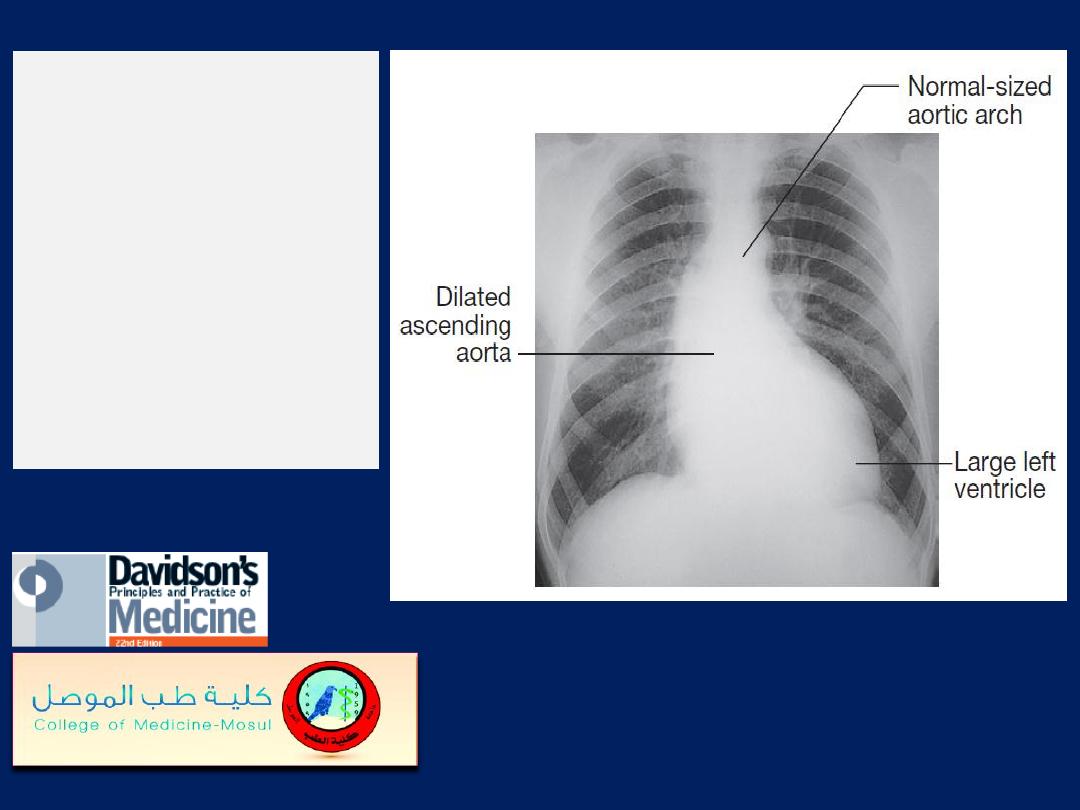
Chest X-ray
of a
patient with
aortic
regurgitation,
left
ventricular
enlargement and
dilatation of the
ascending aorta.
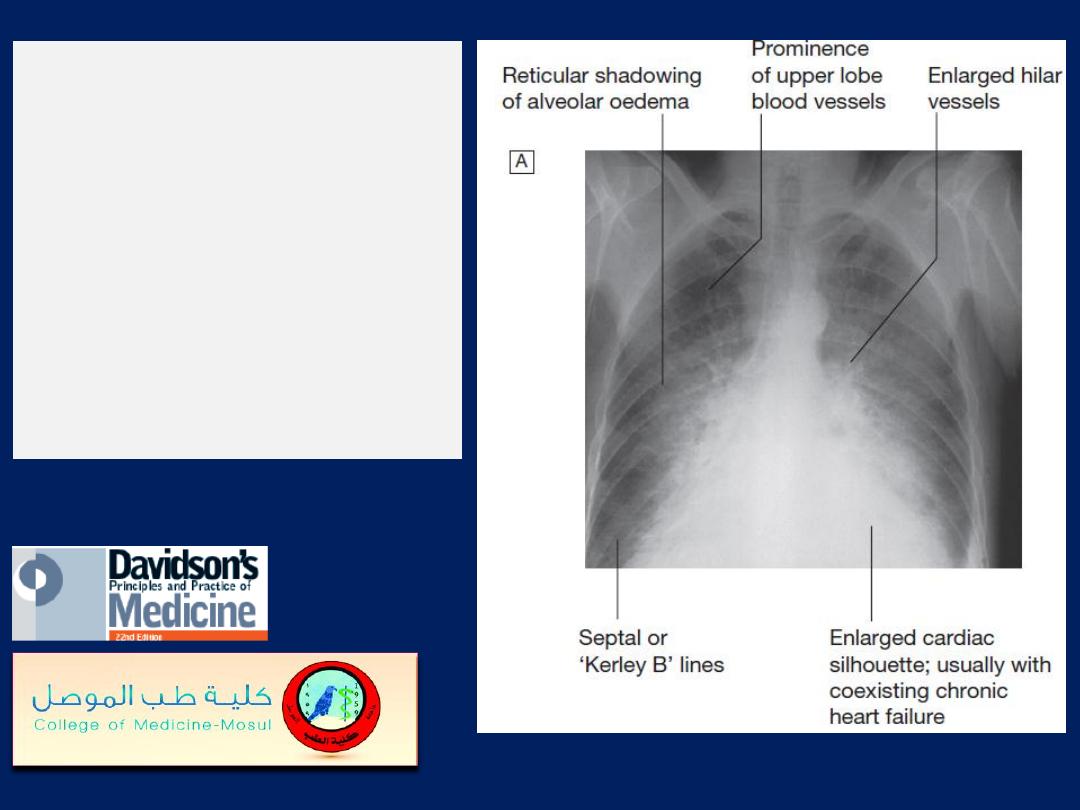
Radiological features of
heart failure.
A
Chest X-ray of
a patient with pulmonary
oedema.
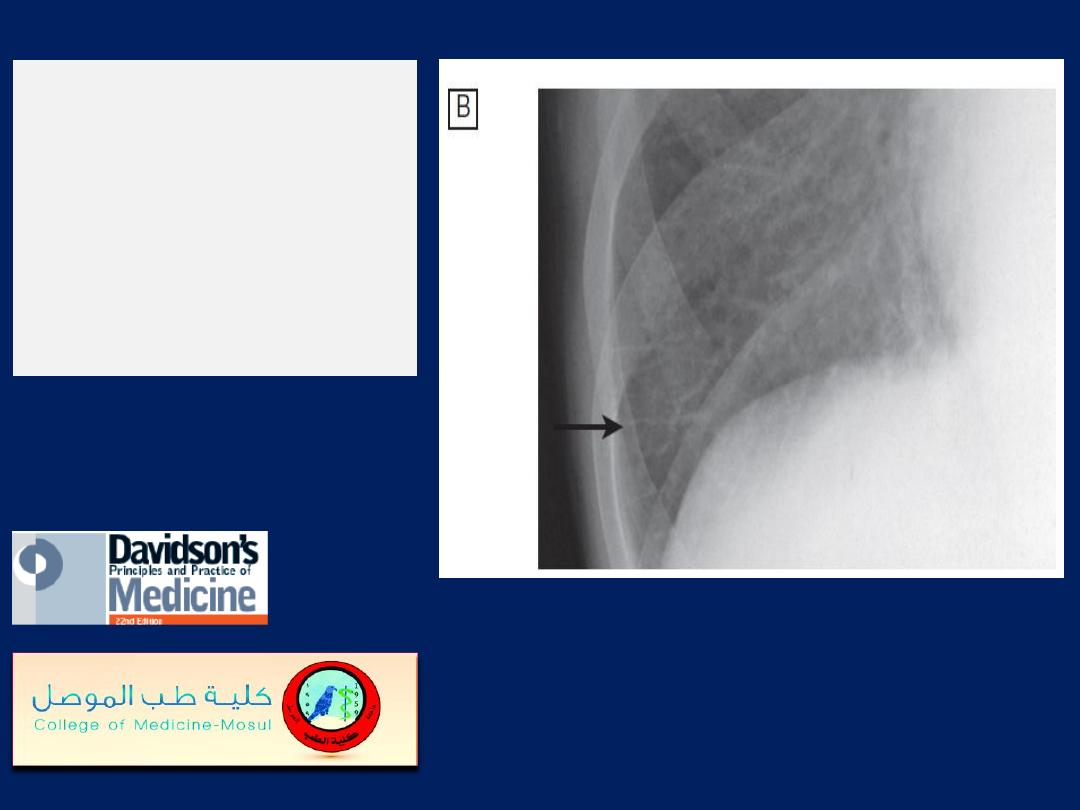
B
Enlargement of lung
base showing septal or
‘Kerley B’ lines (arrow).
Radiological features
of heart failure.
B
Enlargement of lung
base showing
septal or
‘Kerley B
’
lines (arrow).
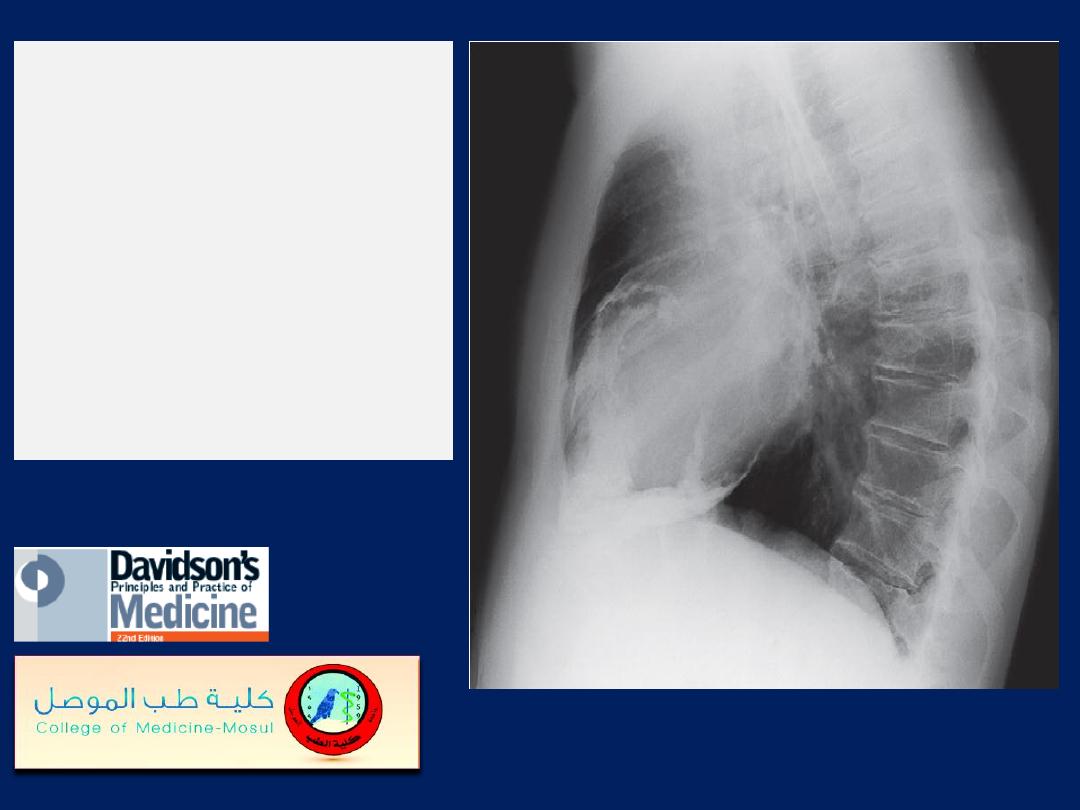
Lateral chest X-ray
from a patient with
severe heart failure
due
to chronic constrictive
pericarditis.
There is heavy
calcification of the
pericardium
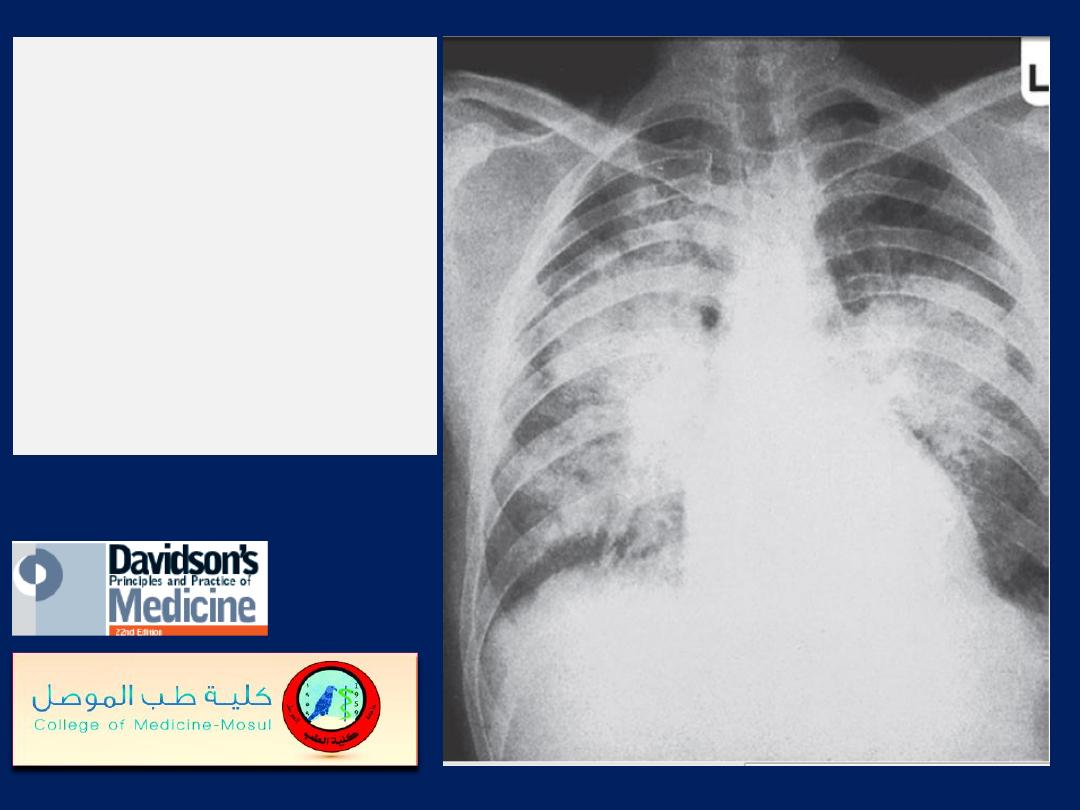
Pulmonary oedema
in
acute kidney injury. The
appearances are
indistinguishable from
left ventricular failure
but the heart size is
usually normal.
Blood
pressure is often high.
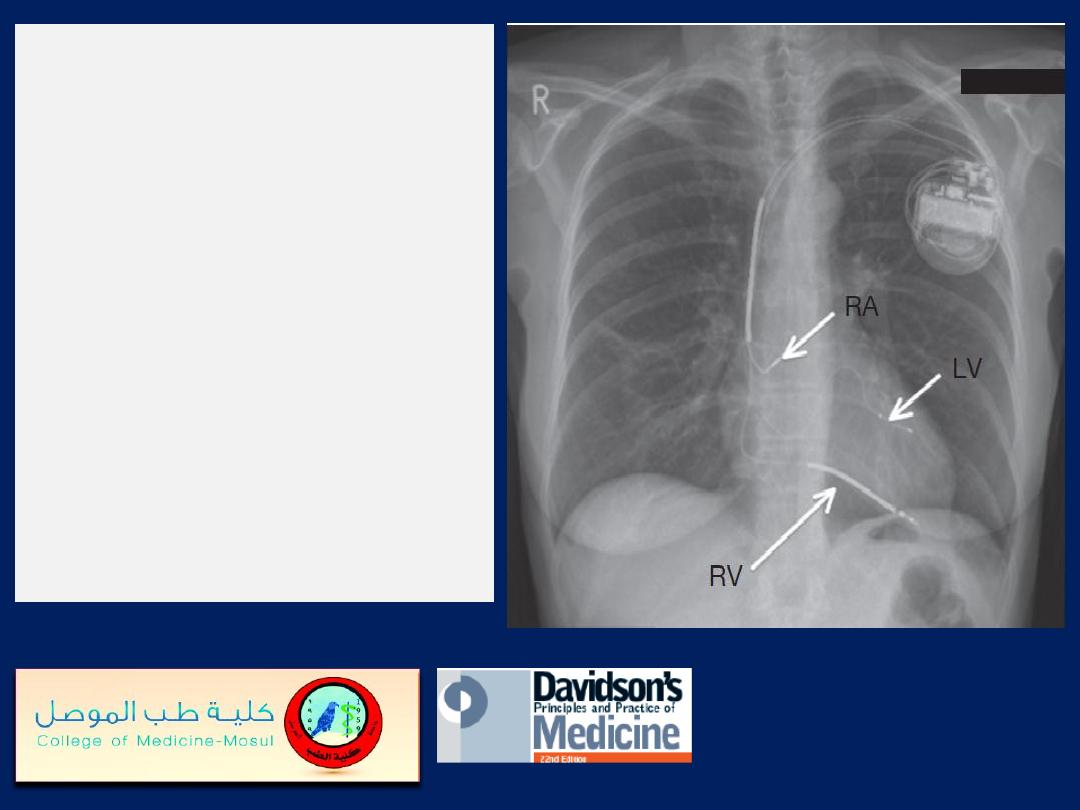
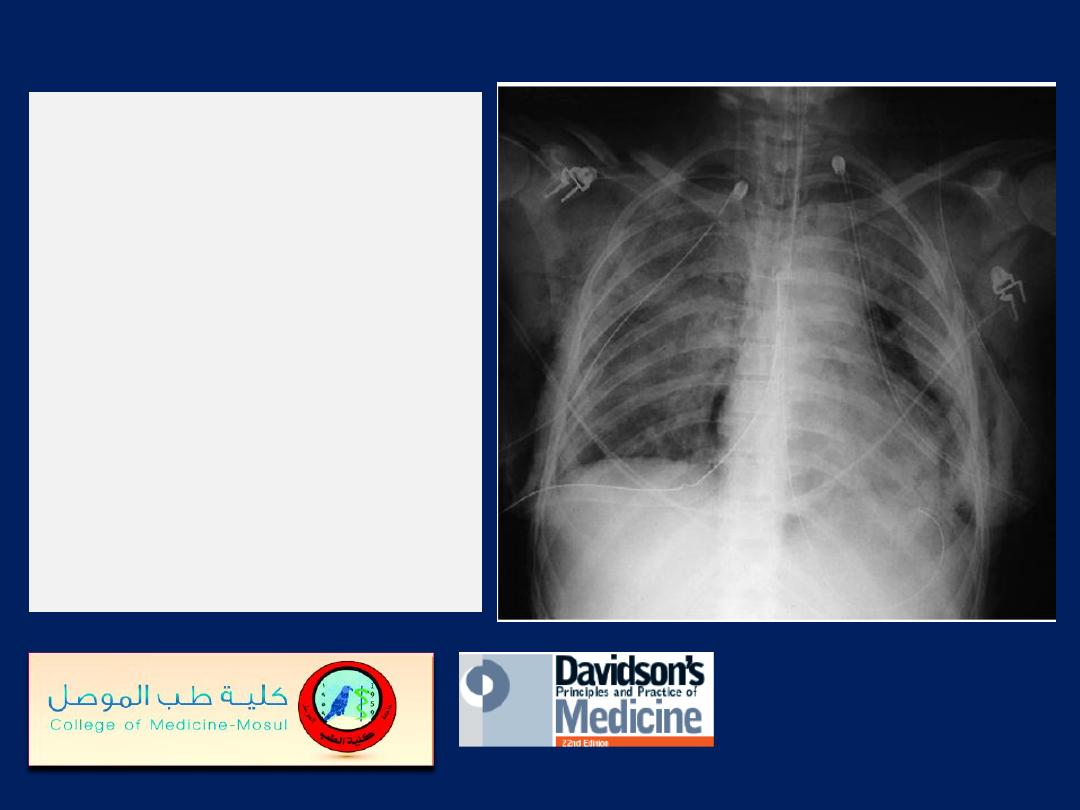
Chest X-ray of a biventricular
pacemaker and defibrillator
(cardiac resynchronisation
therapy). The right ventricular
lead (RV) is in position in the
ventricular apex and is used for
both pacing and defibrillation.
The left ventricular lead (LV) is
placed via the coronary sinus,
and the right atrial lead (RA) is
placed in the right atrial
appendage; both are used for
pacing only.
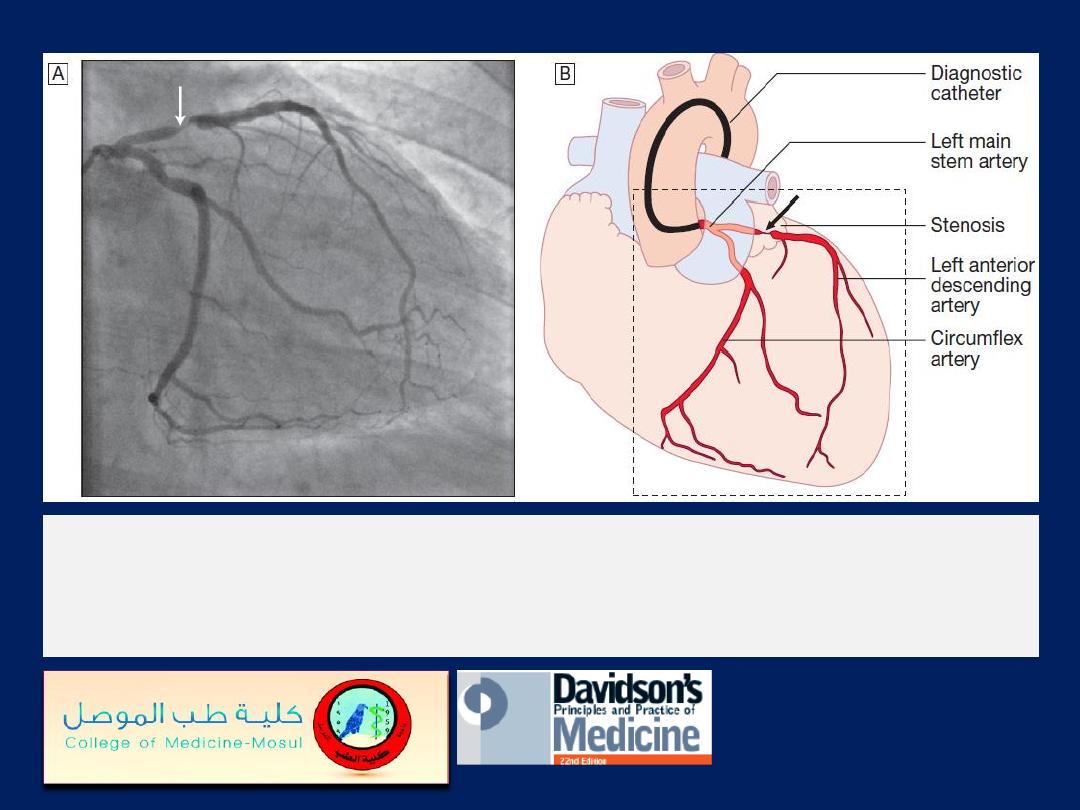
The left anterior descending and circumflex coronary arteries with a
stenosis in the left anterior descending vessel.
A
Coronary artery
angiogram.
B
Schematic of the vessels and branches
Chest X-ray
in acute
respiratory distress
syndrome (ARDS). Note
bilateral lung infiltrates,
pneumomediastinum,
pneumothoraces with
bilateral chest drains,
surgical emphysema, and
fractures of the ribs, right
clavicle and left scapula.
Near-drowning.
Chest X-
ray of a 39-year-old
farmer, 2 weeks after
immersion in a polluted
freshwater ditch for 5
minutes before rescue.
Airspace consolidation and
cavities in the left lower
lobe reflect
secondary
staphylococcal pneumonia
and abscess formation.
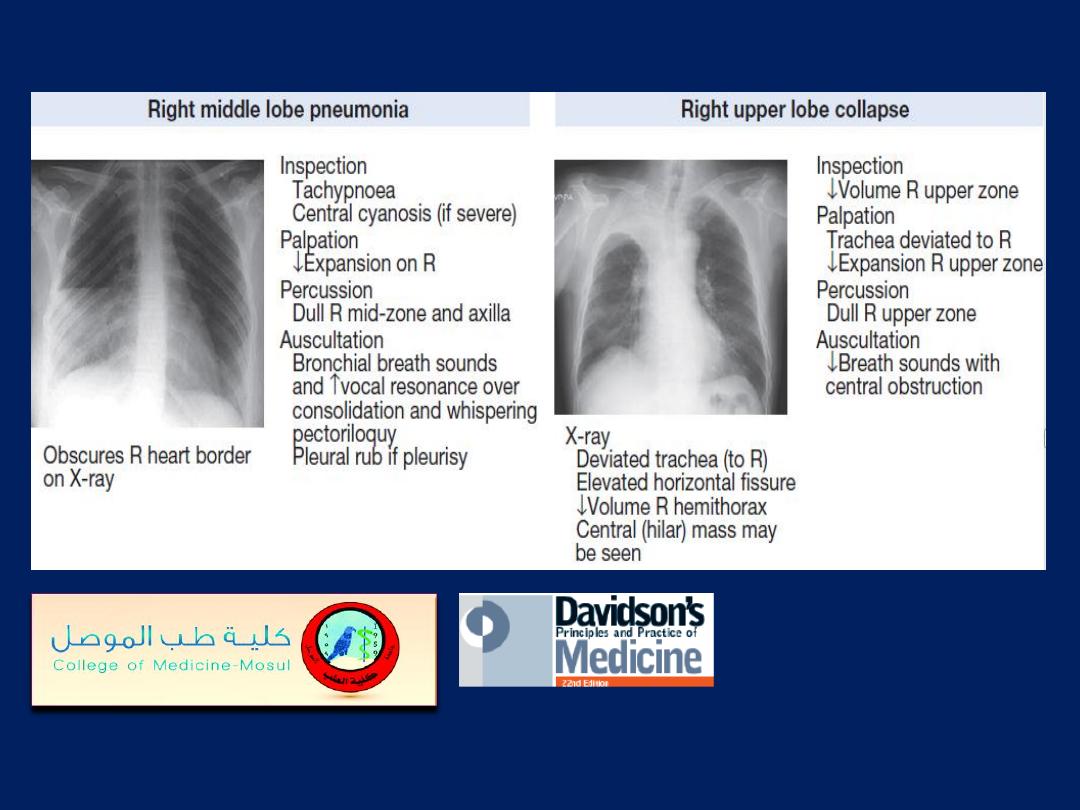
Pneumonia of the right
middle lobe.
A
PA view: consolidation
in the right middle lobe
with characteristic
opacification beneath the
horizontal fissure and loss
of normal contrast
between the right heart
border and lung.
Pneumonia of the
right middle lobe.
B
Lateral view:
consolidation
confined to the
anteriorly situated
middle lobe.
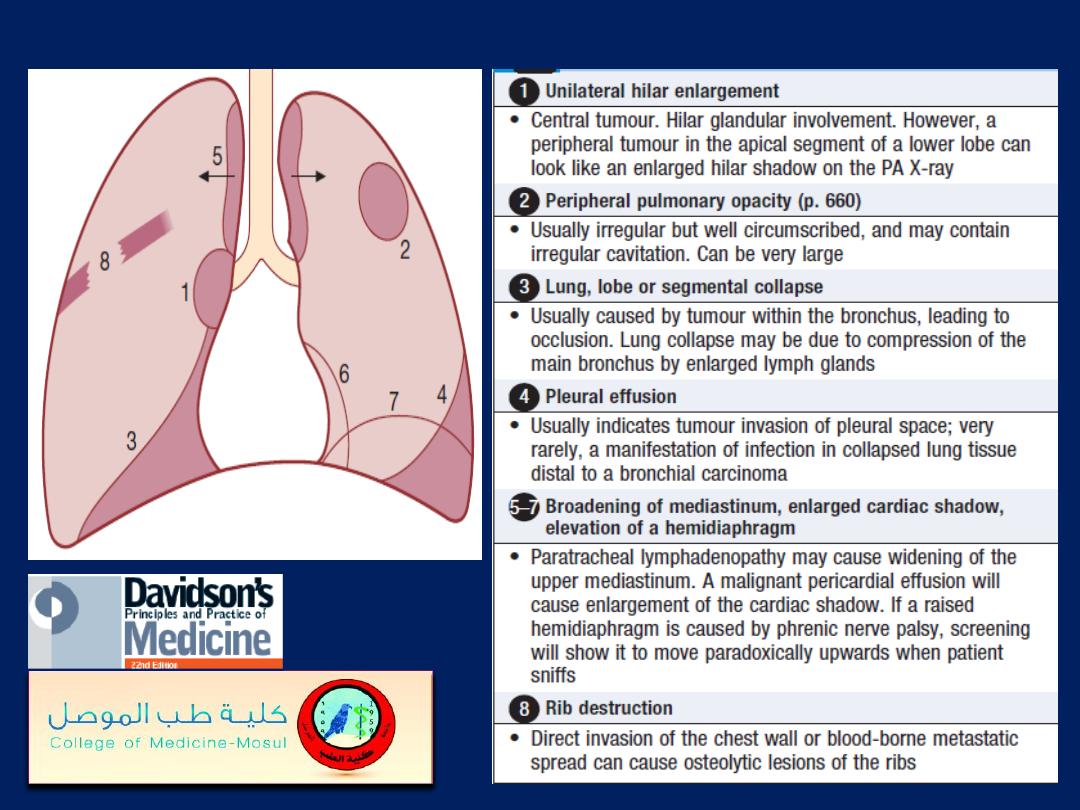
Common radiological presentations of bronchial carcinoma
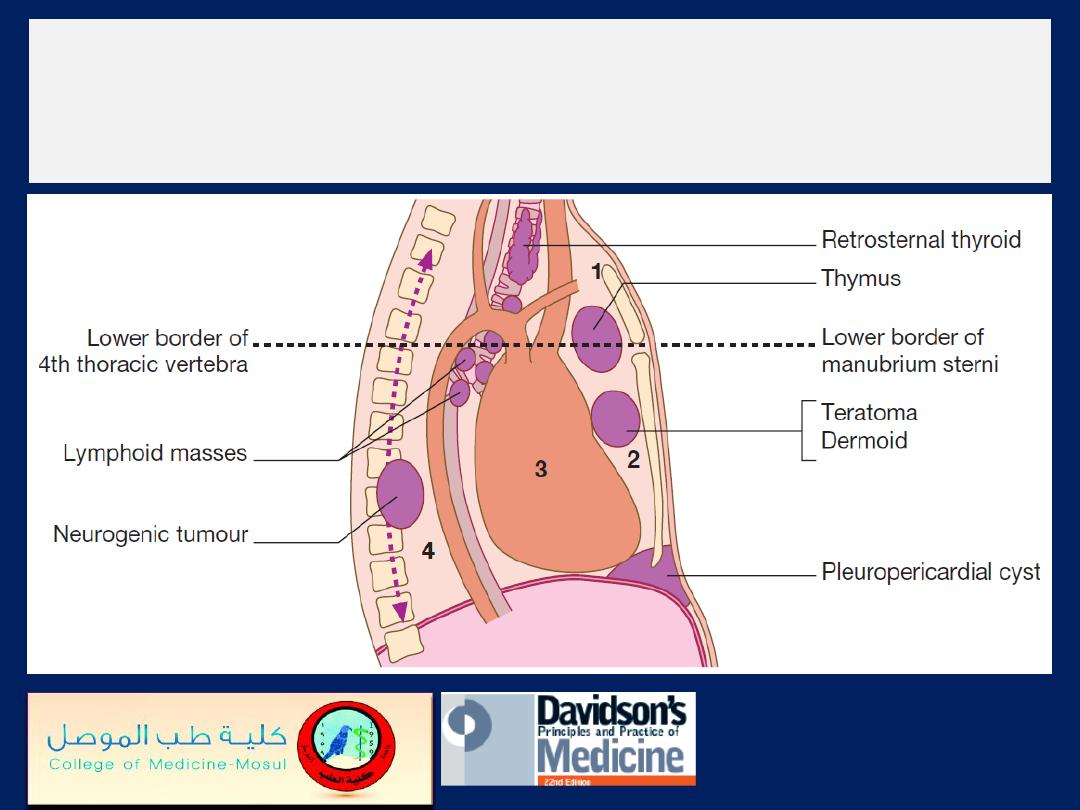
The divisions of the mediastinum.
(1)
Superior
mediastinum.
(2)
Anterior mediastinum.
(3)
Middle
mediastinum.
(4)
Posterior mediastinum.
Intrathoracic
goitre
(arrows)
extending from
right upper
mediastinum.
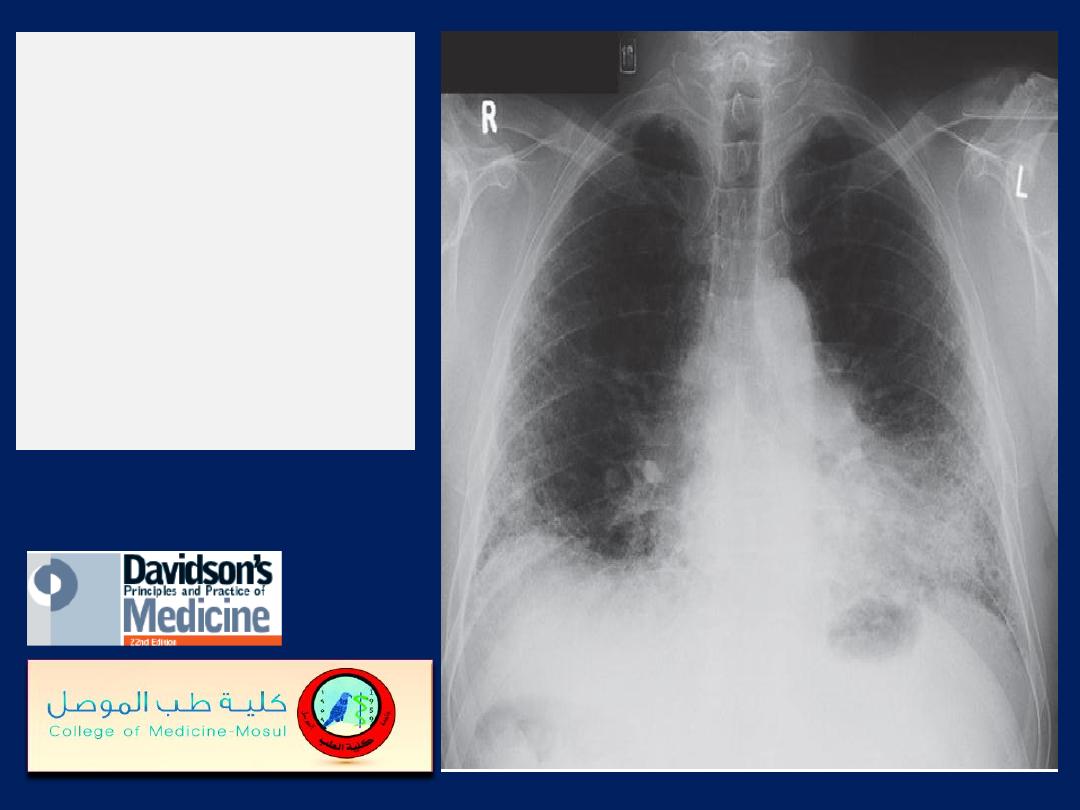
Idiopathic pulmonary
fibrosis.
Chest X-ray
showing bilateral,
predominantly lower-
zone and peripheral
coarse reticulonodular
shadowing and
small lungs.
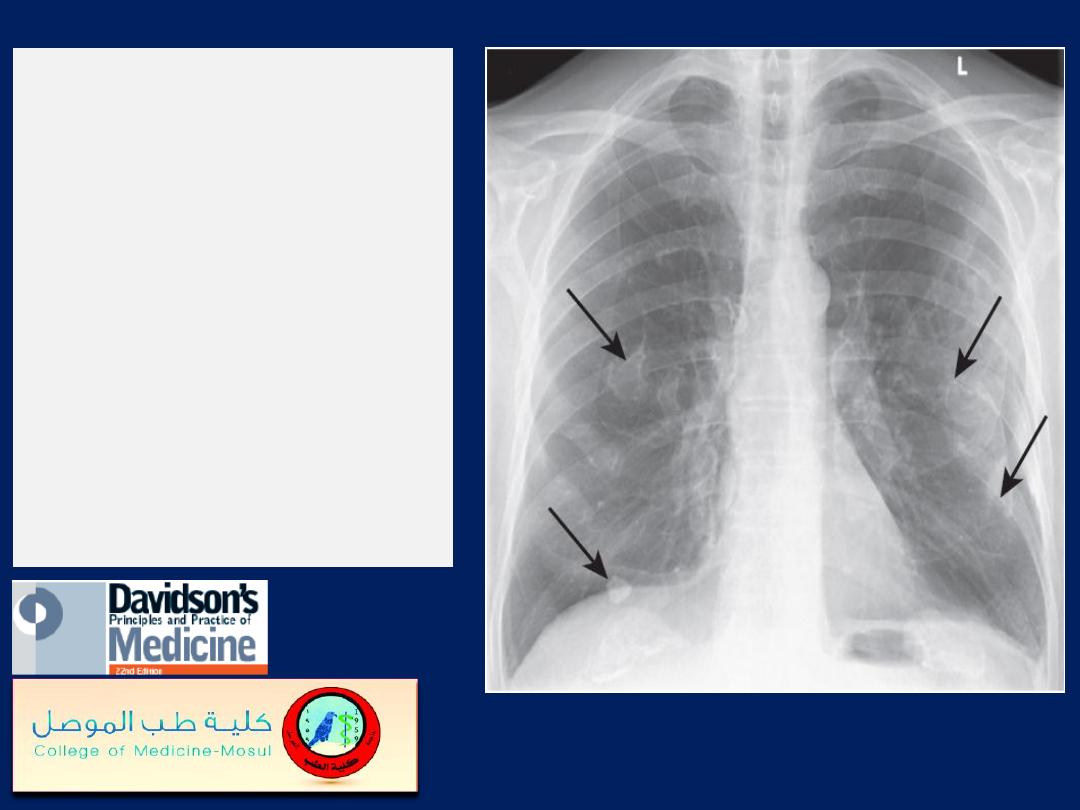
Asbestos-related
benign pleural plaques.
Chest X-ray showing
extensive calcified
pleural plaques (‘candle
wax’ appearance
– arrows), particularly
marked on the
diaphragm and lateral
pleural surfaces.
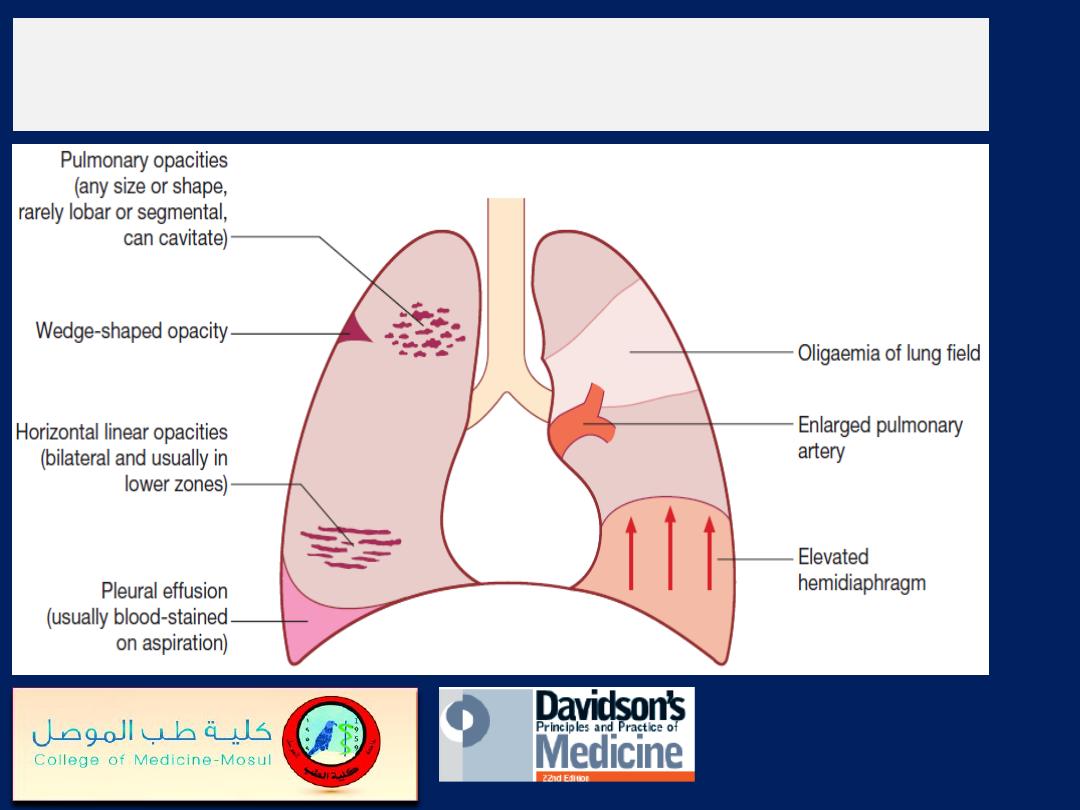
Features of pulmonary thromboembolism/infarction
on chest X-ray.
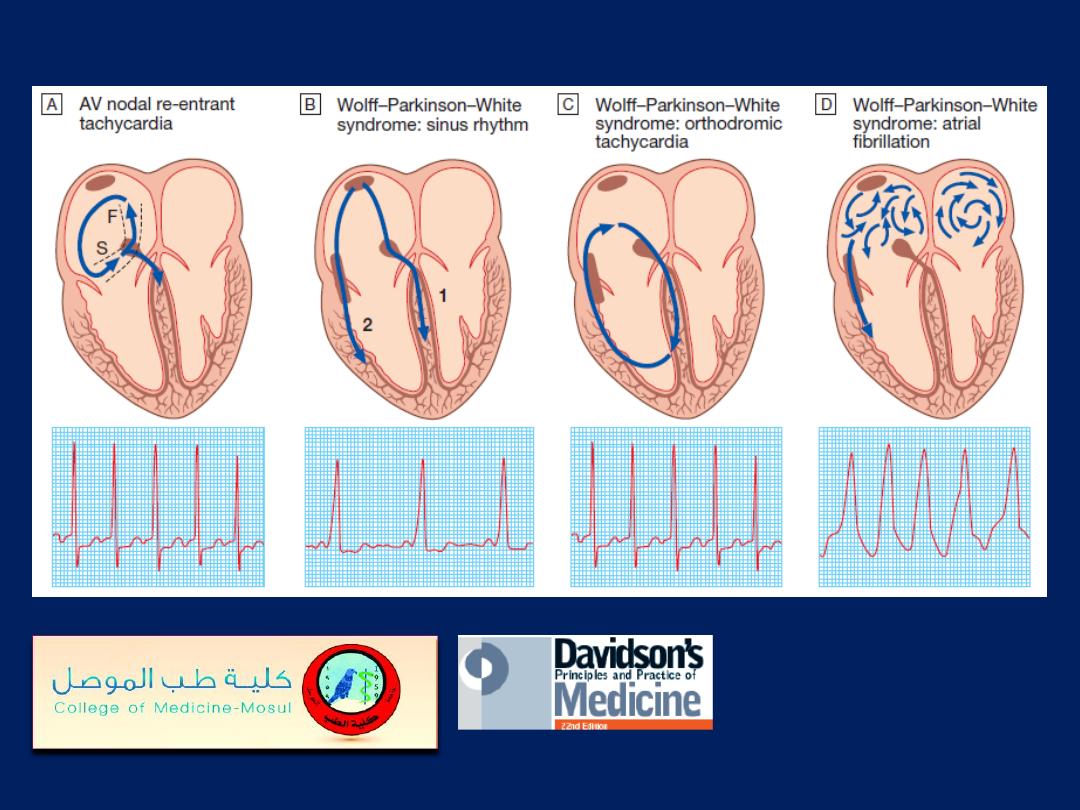

A The mechanism of AVNRT occurs via two right atrial AV nodal input pathways: the slow (S)
and fast (F) pathways. Antegrade conduction occurs via the slow pathway; the wavefront enters
the AV node and passes into the ventricles, at the same time re-entering the atria via the fast
pathway. In WPW syndrome, there is a strip of accessory conducting tissue that allows electricity
to bypass the AV node and spread from the atria to the ventricles rapidly and without delay.
When the ventricles are depolarised through the AV node, the ECG is normal, but when the
ventricles are depolarized through the accessory conducting tissue, the ECG shows a very short
PR interval and a broad QRS complex.
B In sinus rhythm, the ventricles are depolarised through (1) the AV node and (2) the accessory
pathway, producing an ECG with a short PR interval and broadened QRS
complexes; the characteristic slurring of the upstroke of the QRS complex is known as a delta
wave. The degree of pre-excitation (the proportion of activation passing down the accessory
pathway) and ECG appearances may vary a lot, and at times the ECG can look normal.
C Orthodromic tachycardia. This is the most common form of tachycardia in WPW. The re-
entry circuit passes antegradely through the AV node and retrogradely through the accessory
pathway. The ventricles are therefore depolarised in the normal way, producing a narrow-
complex tachycardia that is indistinguishable from other forms of SVT.
D Atrial fibrillation. the ventricles are largely depolarised through the accessory pathway,
producing an irregular broad-complex tachycardia
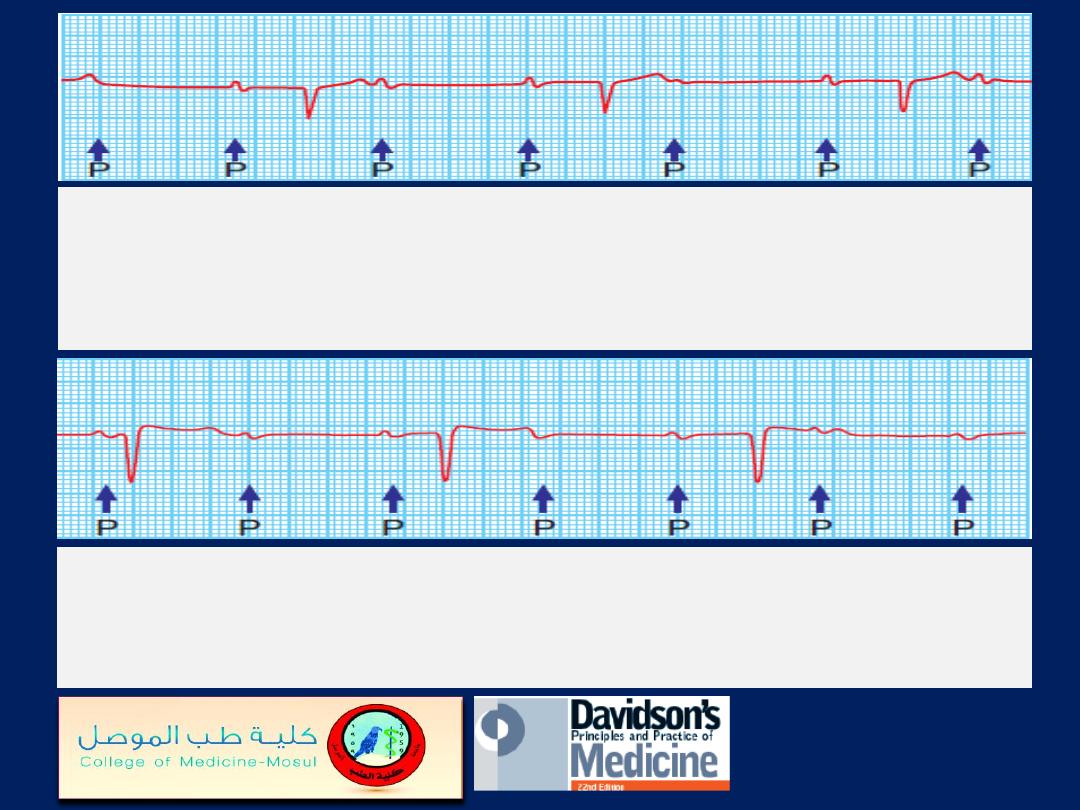
First-degree AV block. The PR interval is
prolonged and measures 0.26 s.
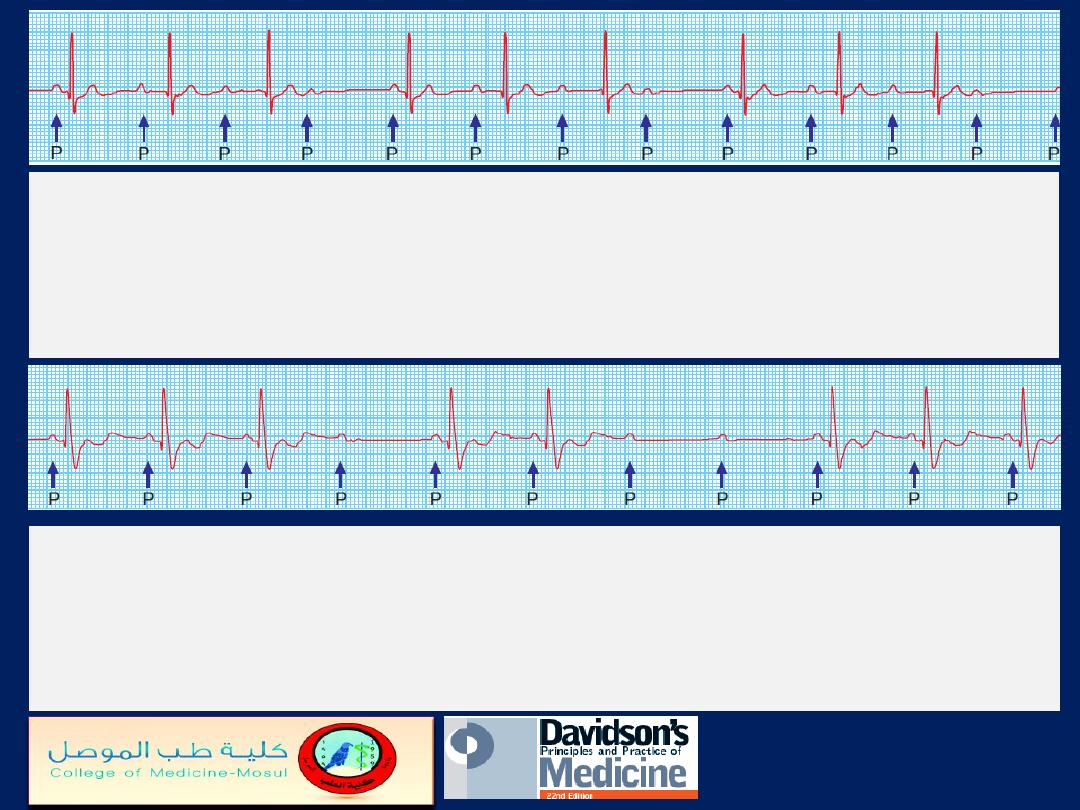
Second-degree AV block
(Mobitz type I – Wenckebach’s
phenomenon). The PR interval progressively increases until a P wave
is not conducted. The cycle repeats itself. In this example, conduction is
at a ratio of 4 : 3, leading to groupings of three V complexes.
Second-degree AV block
(Mobitz type II). The PR interval of
conducted beats is normal but some P waves are not conducted.
The constant PR interval distinguishes this from Wenckebach’s
phenomenon.
Second-degree AV block with fixed
2 : 1 block.
Alternate P waves are not conducted. This may be due
to Mobitz type I or II block.
Complete (third-degree) AV block.
There is complete
dissociation of atrial and ventricular complexes. The atrial rate is
80/min and the ventricular rate is 38/min.
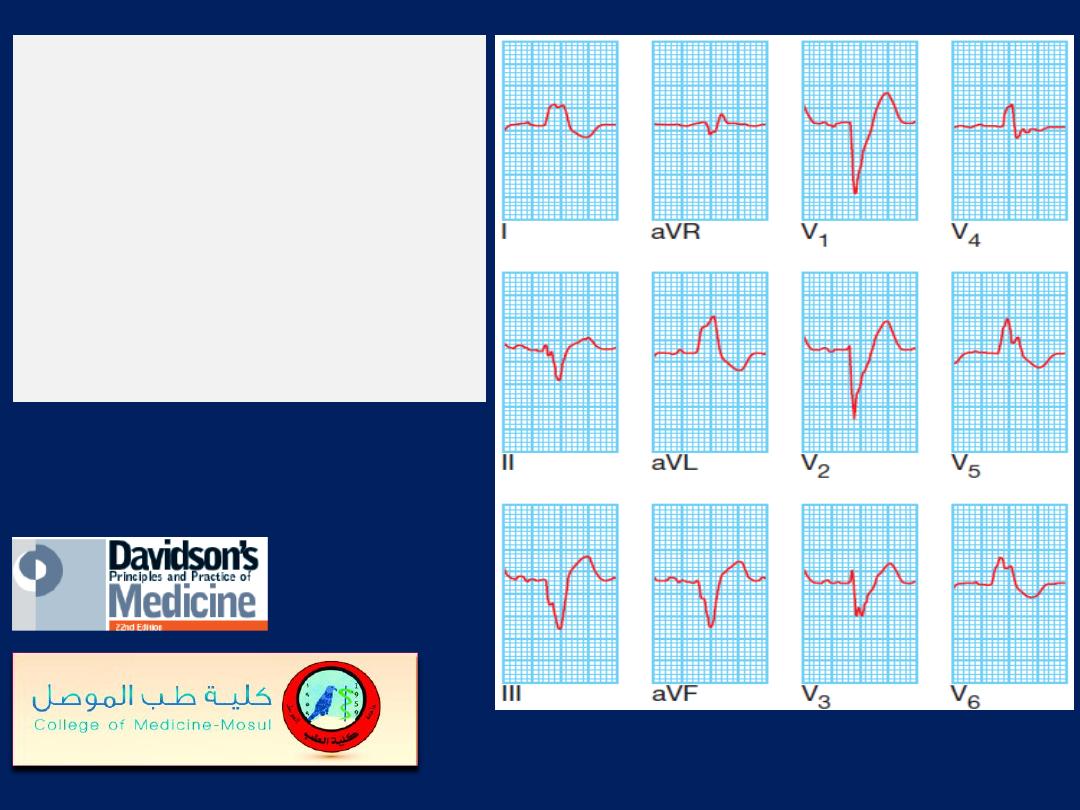
Left bundle branch block.
Note the wide QRS
complexes with loss of
the Q wave or septal
vector in lead I and ‘M’-
shaped QRS
complexes in V5 and V6.
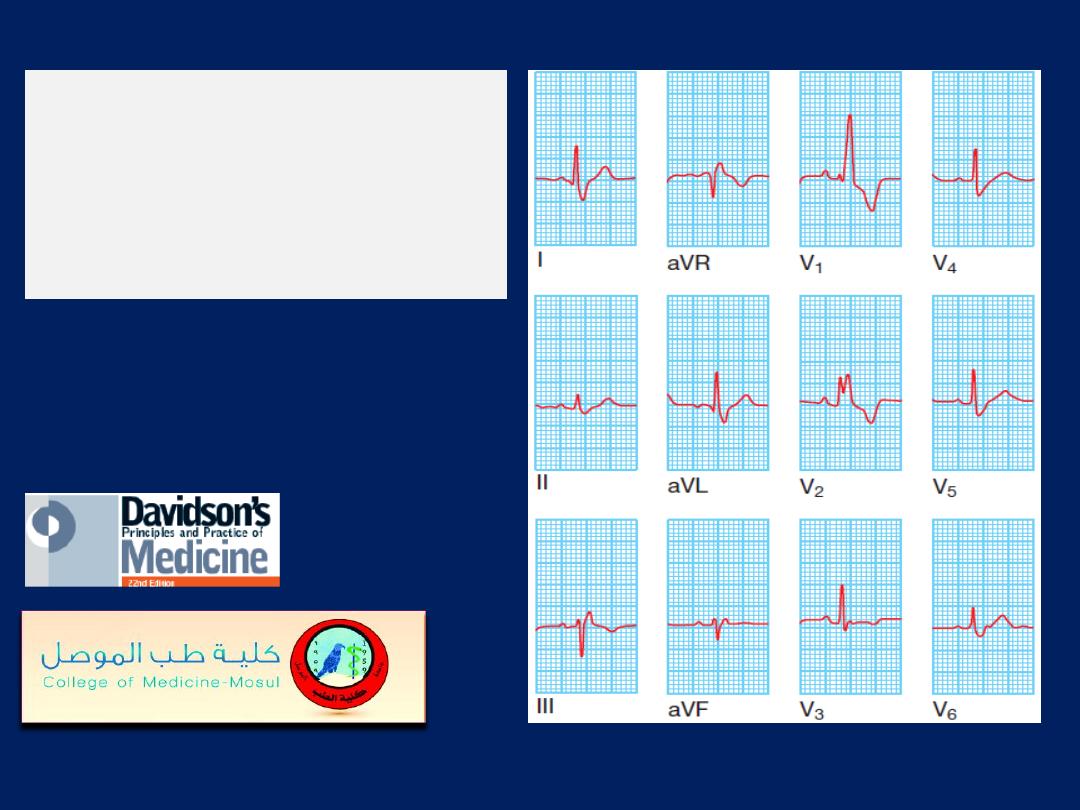
Right bundle branch block.
Note the wide QRS complexes
with ‘M’-shaped configuration
in leads V, and V2 and a wide
S wave in lead I.
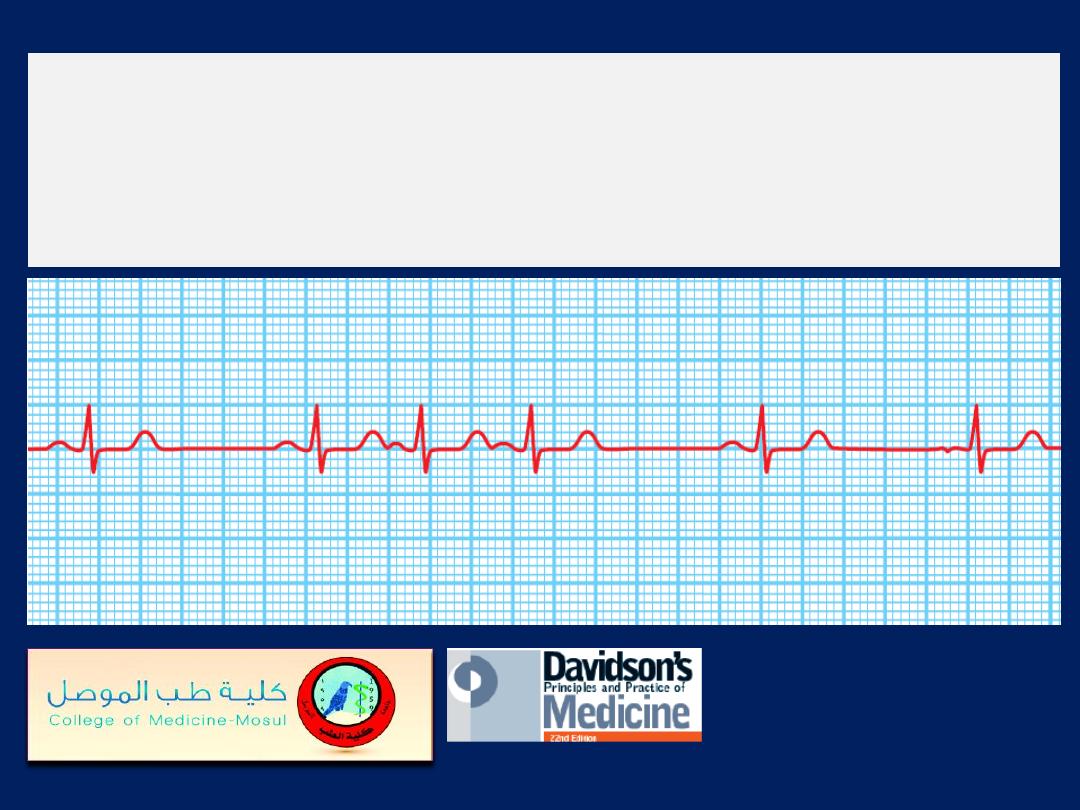
Atrial ectopic beats.
The first, second and fifth complexes
are normal sinus beats. The third, fourth and sixth complexes
are atrial ectopic beats with identical QRS complexes and
abnormal
(sometimes barely visible)
P waves.
Supraventricular tachycardia.
The rate is
180/min and the QRS complexes are normal.
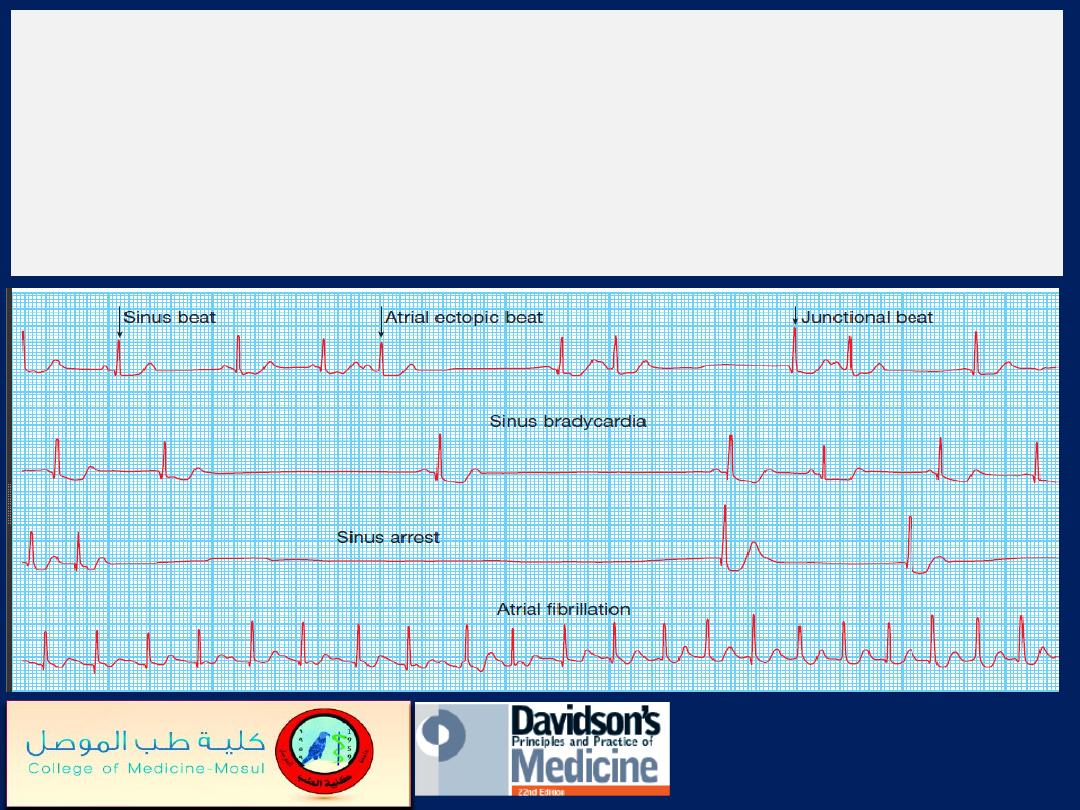
Sinoatrial disease (sick sinus syndrome).
A continuous
rhythm strip from a 24-hour ECG tape recording illustrating
periods of sinus rhythm, atrial ectopics, junctional beats,
sinus bradycardia, sinus arrest and paroxysmal atrial
fibrillation.
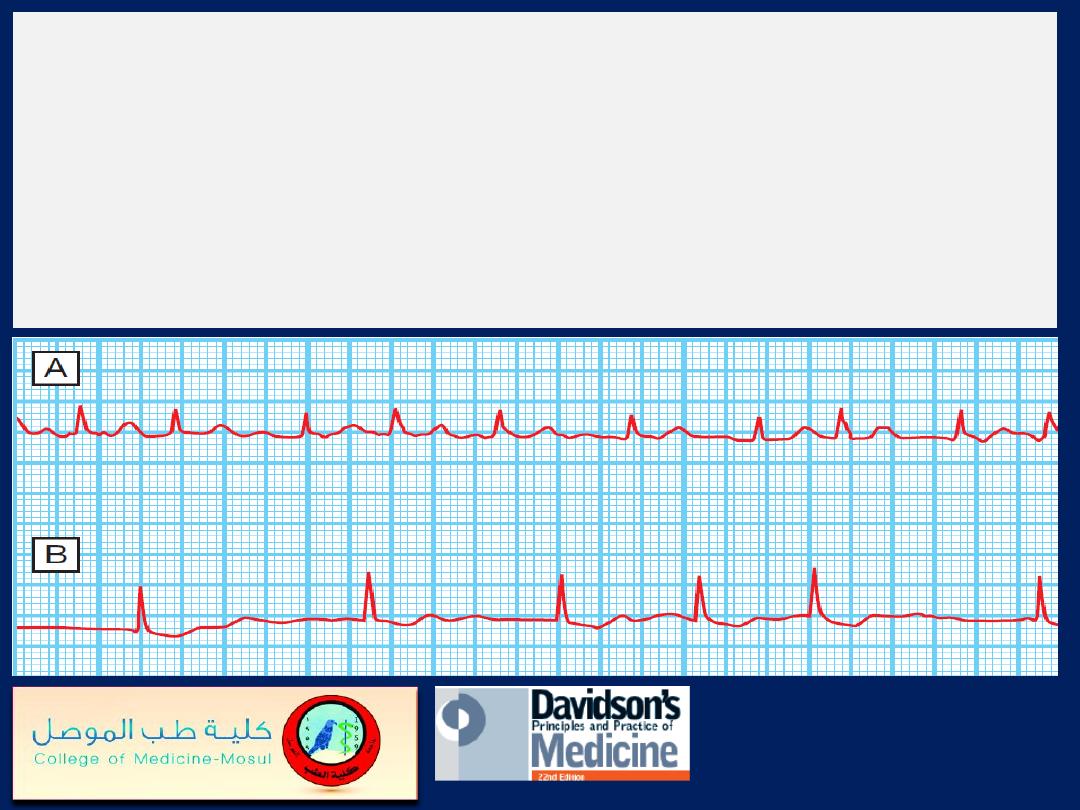
Two examples of atrial fibrillation.
The QRS complexes
are irregular and there are no P waves.
A
There is usually a fast ventricular rate, e.g. between 120
and 160/min, at the onset of atrial fibrillation.
B
chronic fibrillation, the V- rate may be much slower, due
to the effects of medication and AV nodal fatigue.
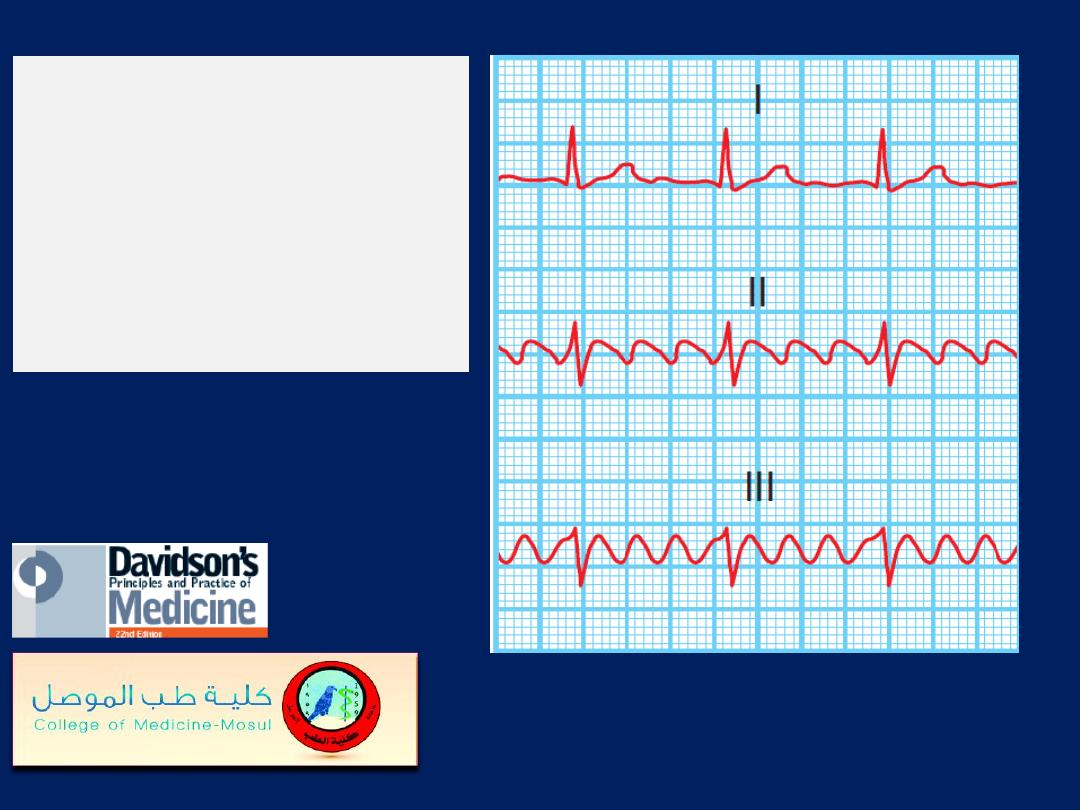
Atrial flutter
Simultaneous recording
showing atrial flutter
with 3 : 1 AV block;
flutter waves are only
visible in leads II and III.
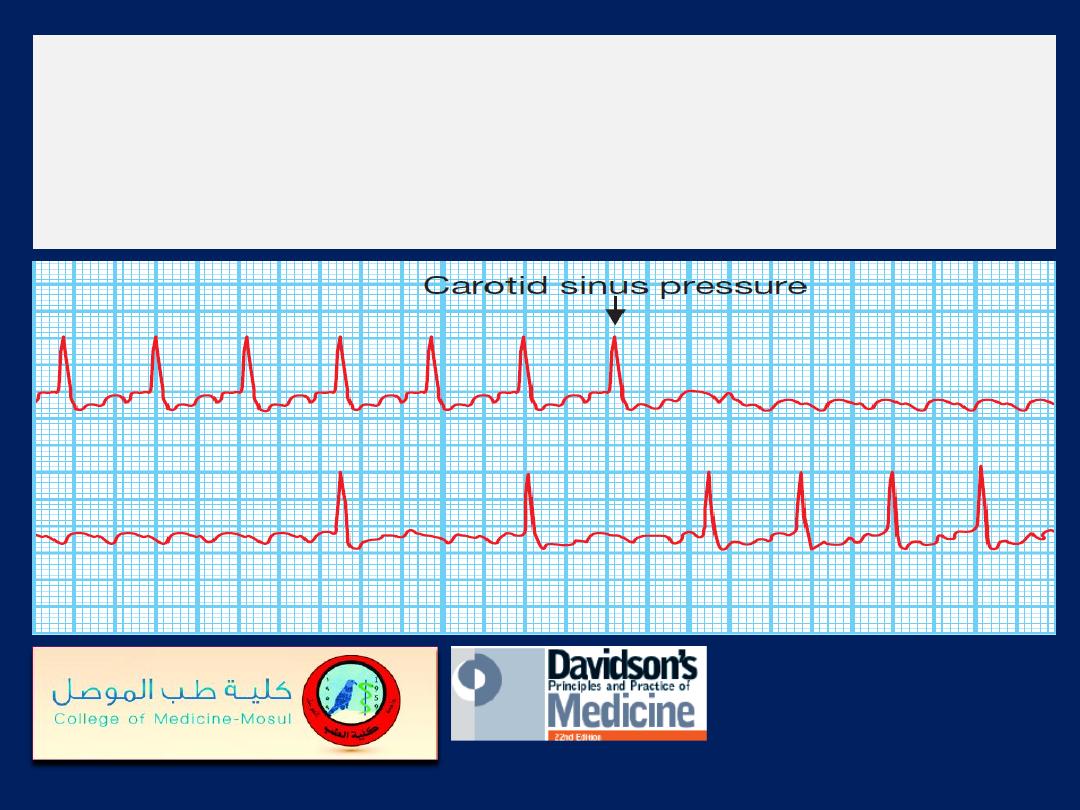
Carotid sinus pressure
in atrial flutter: continuous
trace. The diagnosis of atrial flutter with 2 : 1 block was
established when carotid sinus pressure produced
temporary AV block, revealing the flutter waves.
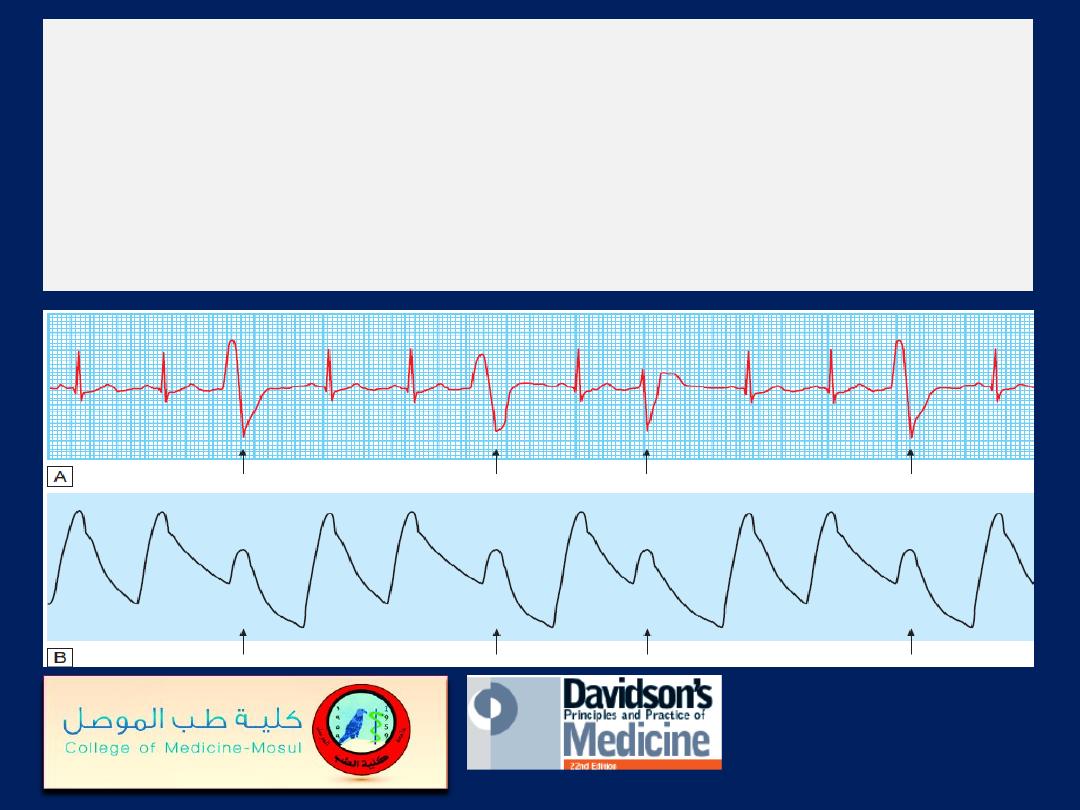
Ventricular ectopic beats.
A There are broad, bizarre QRS complexes (arrows) with no
preceding P wave in between normal sinus beats.
Their configuration varies, so these are multifocal ectopics.
B A simultaneous arterial pressure trace, the ectopic beats result in
a weaker pulse (arrows), may be perceived as a ‘dropped beat’.
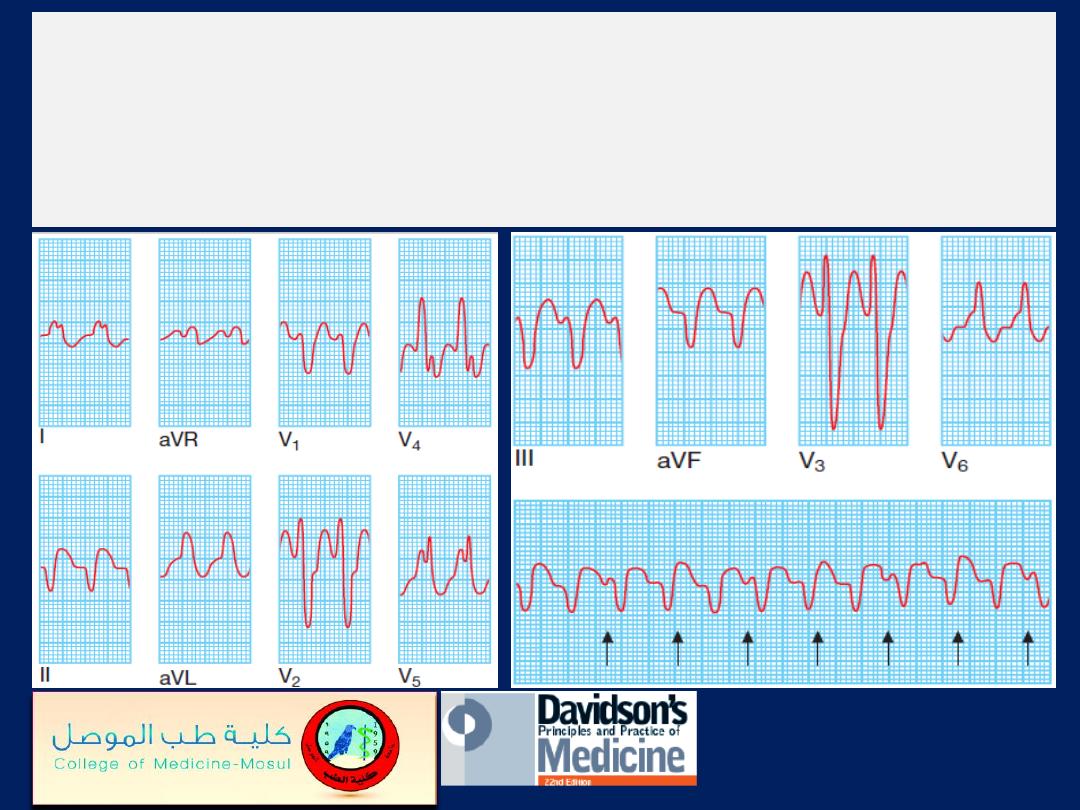
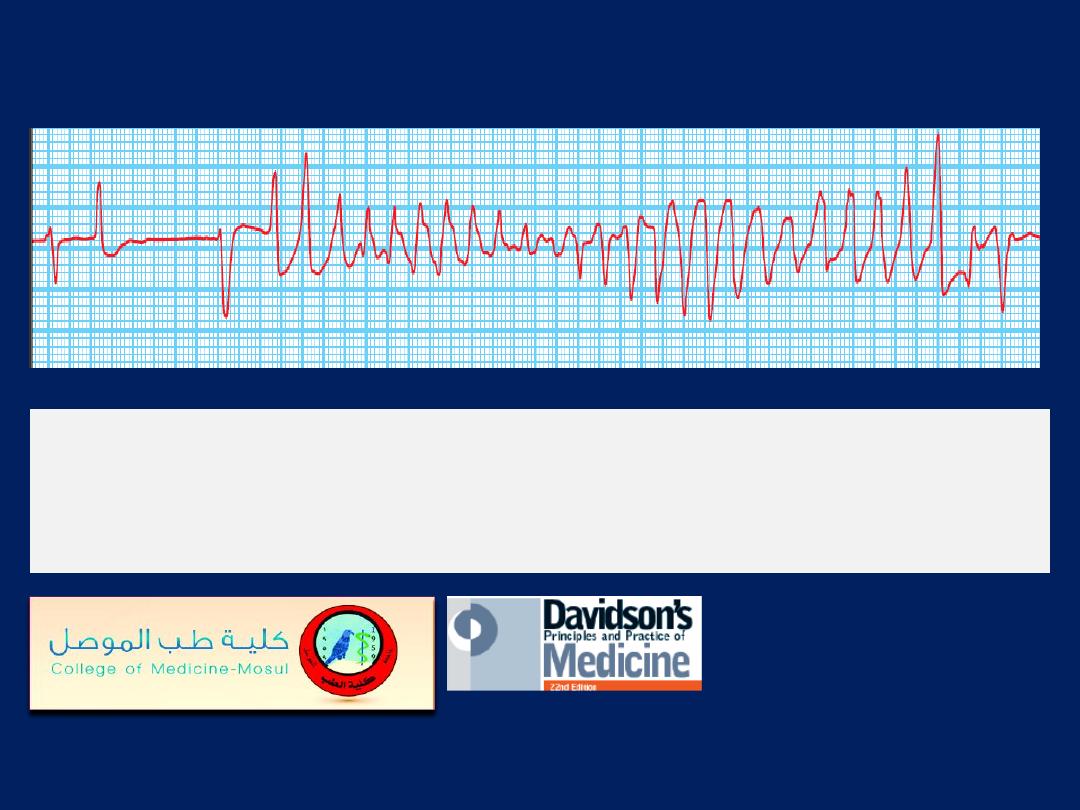
Ventricular tachycardia:
fusion beat (arrow). In VT , there
is independent atrial and ventricular activity. Occasionally,
a P wave is conducted to the ventricles through the AV
node, producing a normal sinus beat in the middle of the
tachycardia (a capture beat); more commonly, however, the
conducted impulse fuses with an impulse from the
tachycardia (a fusion beat). This can only occur when
there is
AV dissociation
and is therefore diagnostic of VT
Ventricular tachycardia:
12–lead ECG. There are typically
very broad QRS complexes and marked left axis deviation.
There is also AV dissociation; some P waves are visible
and others are buried in the QRS complexes (arrows).
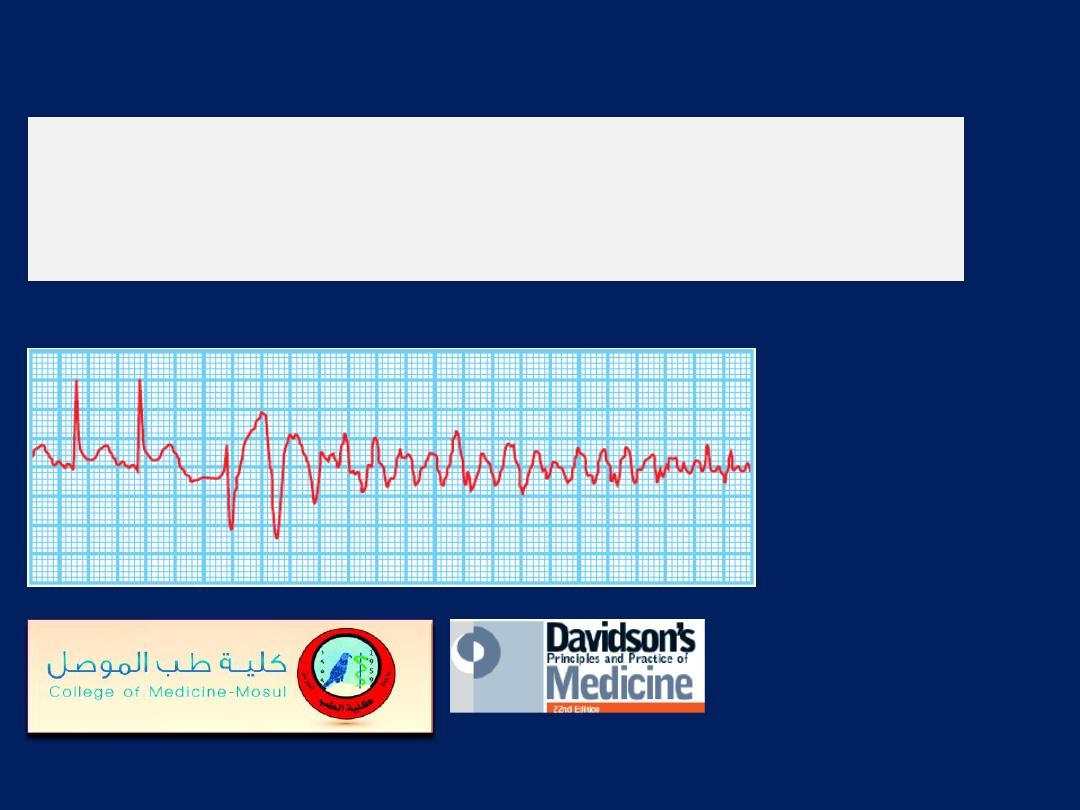
Torsades de pointes.
A bradycardia with a long QT
interval is followed by polymorphic ventricular tachycardia
that is triggered by an R on T ectopic.
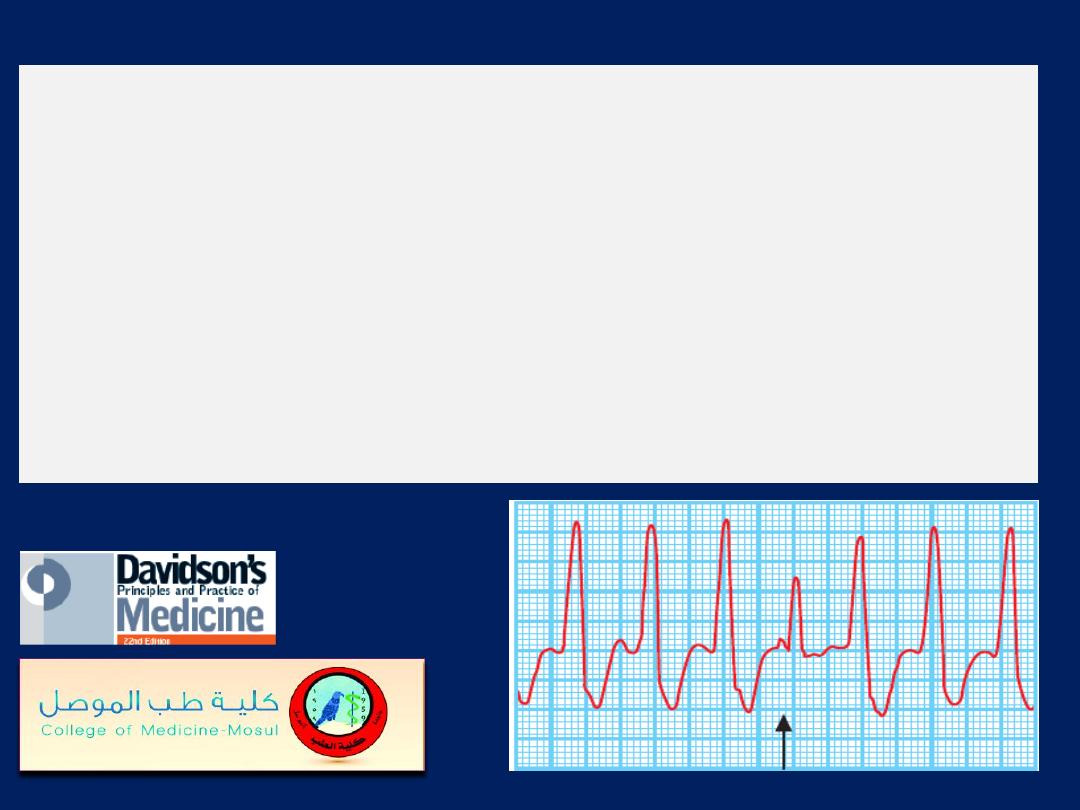
Ventricular fibrillation.
A bizarre chaotic rhythm, initiated in this case by two
ventricular ectopic beats in rapid succession.
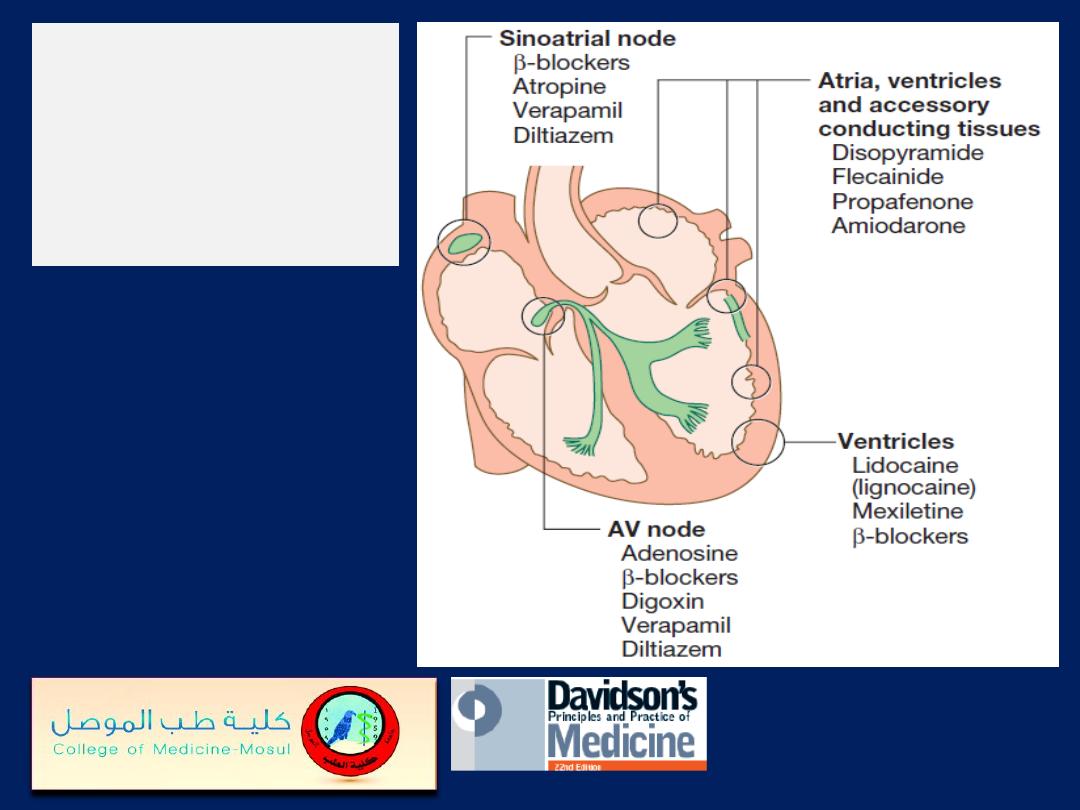
Classification of
anti-arrhythmic
drugs by site of
action.
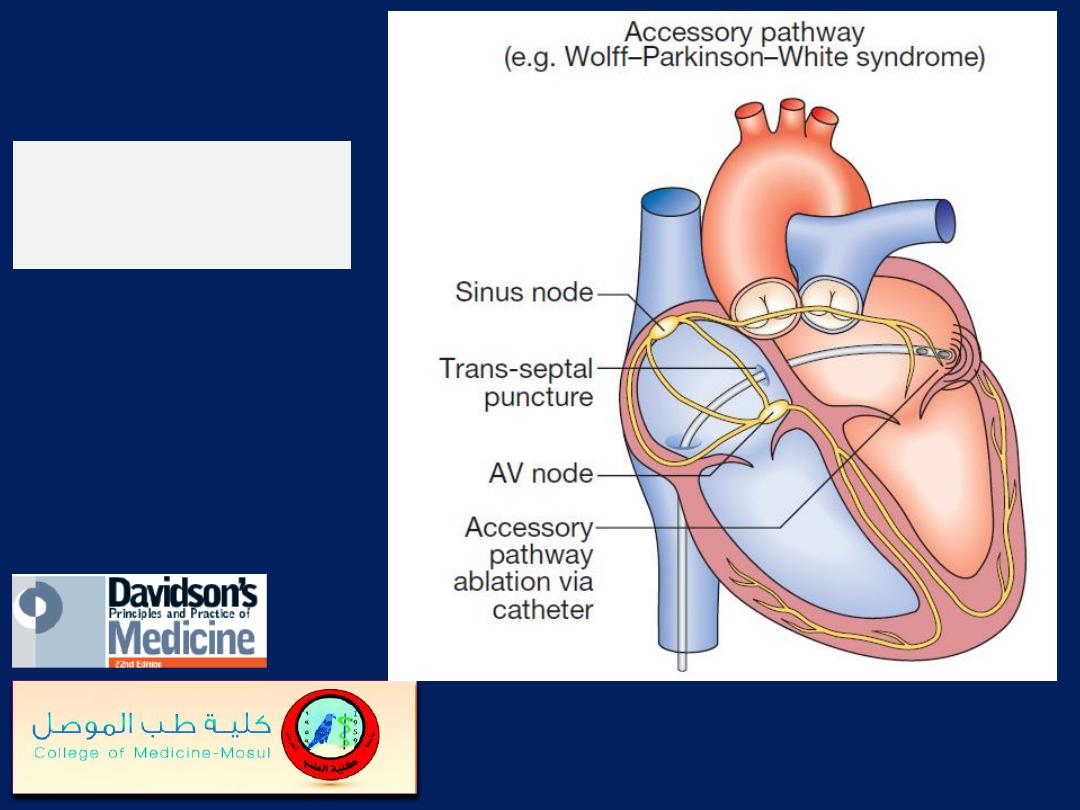
Radiofrequency
ablation
Dual-chamber pacing.
The first three beats show atrial and
ventricular pacing with narrow pacing spikes in front of each
P wave and QRS complex.
The last beats show spontaneous P waves with a different
morphology and no pacing spike; the pacemaker senses or
tracks these P waves and maintains AV synchrony by pacing
the ventricle after an appropriate interval.
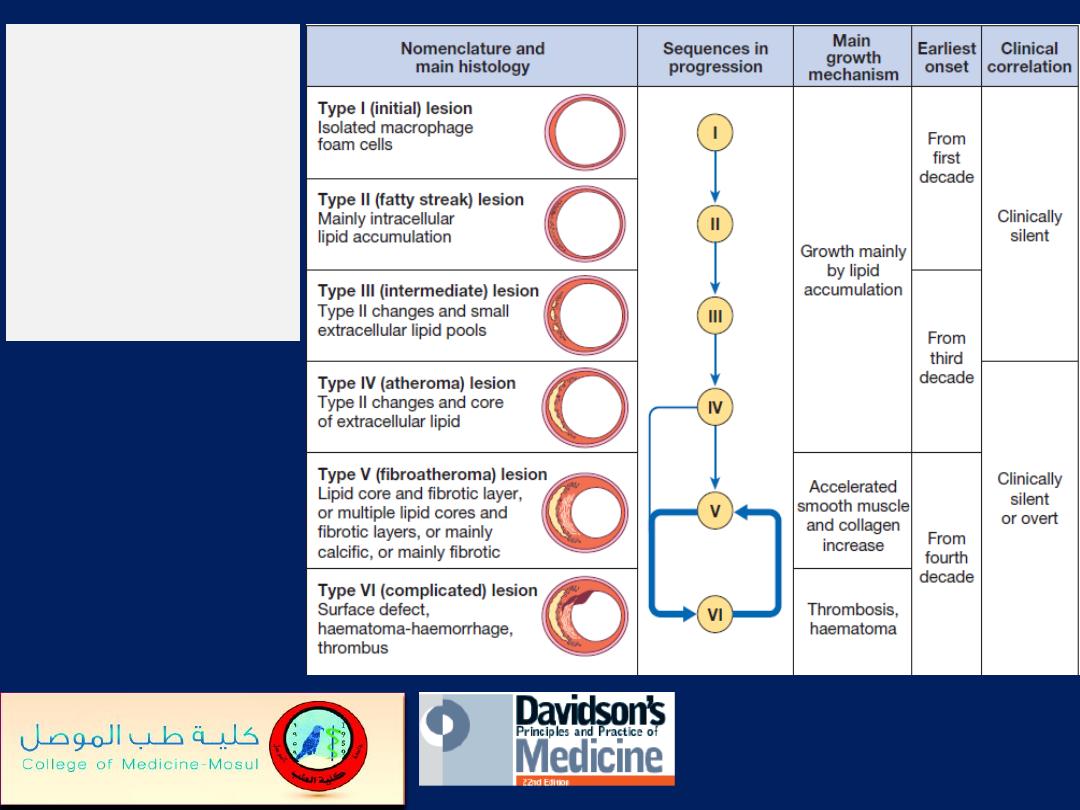
The six stages
of
atherosclerosis.
American Heart
Association
classification.
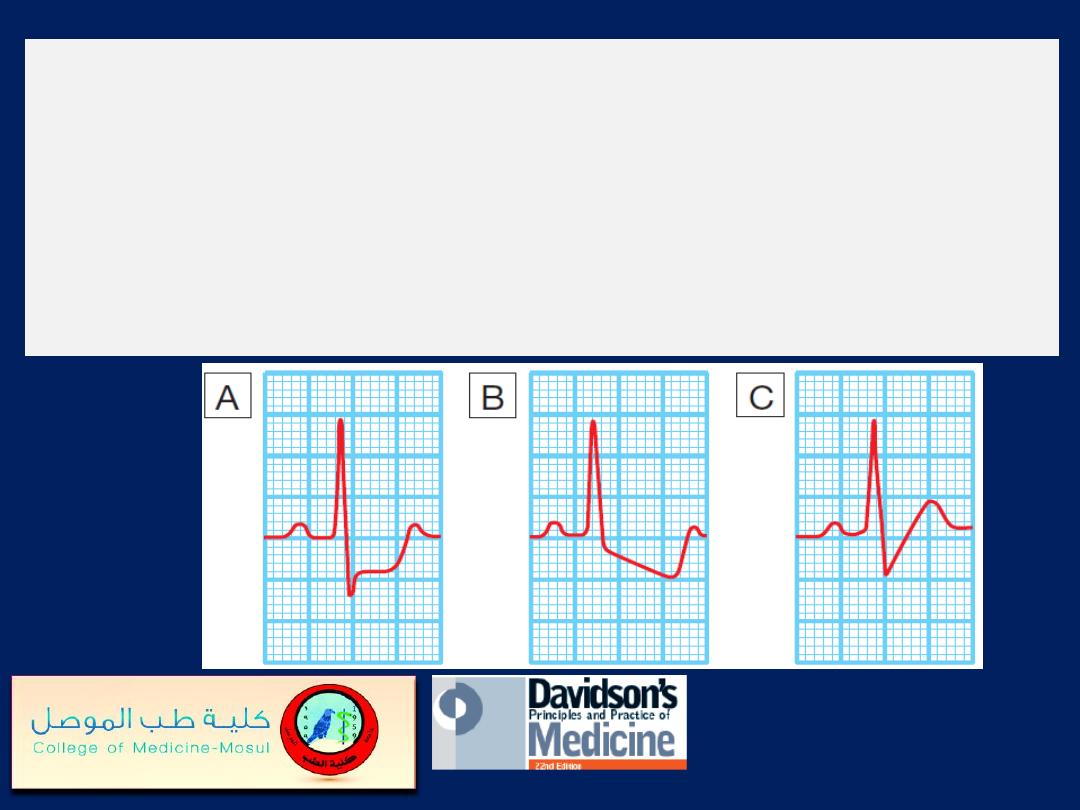
Forms of exercise-induced ST depression.
A
Planar ST depression is usually indicative of myocardial
ischaemia.
B
Downsloping depression also usually indicates
myocardial ischaemia.
C
Up-sloping depression may be a normal finding.
A positive exercise test
(chest
leads only). The resting
12-lead ECG shows some minor
T-wave changes in the
inferolateral leads but is
otherwise normal.
After 3 minutes’ exercise on a
treadmill, there is marked
planar ST depression in leads
V4 and V5 (right offset).
Subsequent coronary
angiography revealed critical
three-vessel CAD .
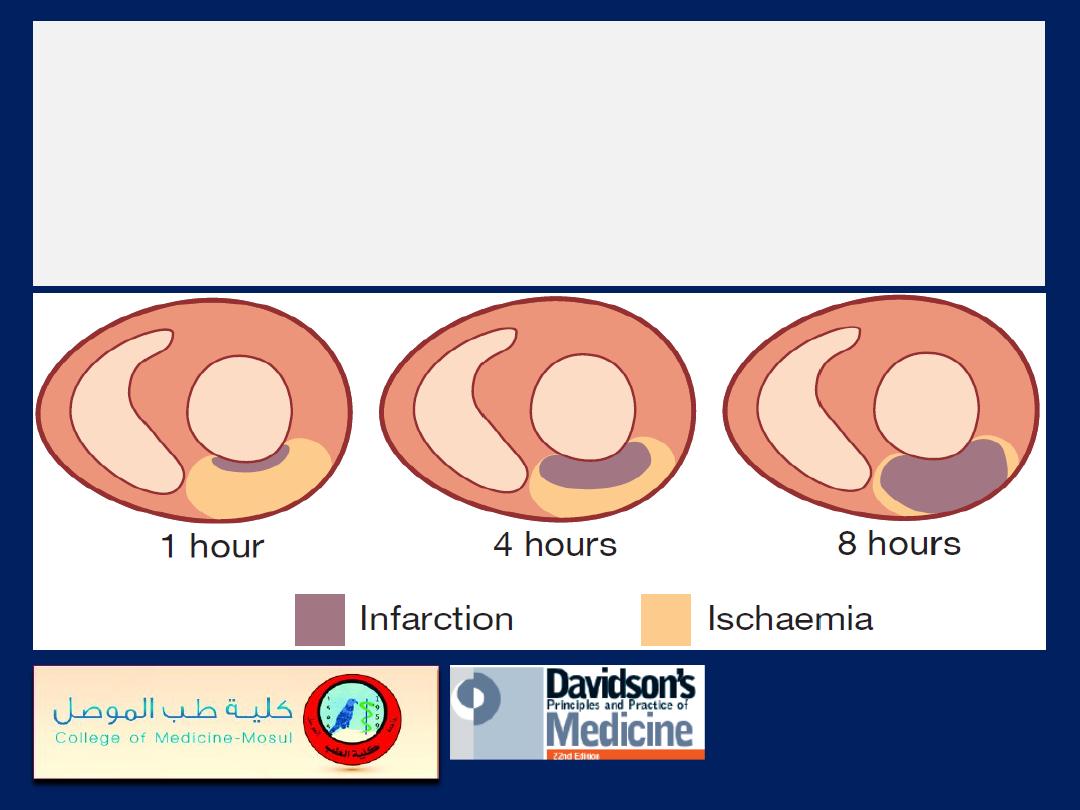
The time course of MI.
The relative proportion of
ischaemic, infarcting and infarcted tissue slowly changes
over a period of 12 hours. In the early stages of MI, a
significant proportion of the myocardium in jeopardy is
potentially salvageable.
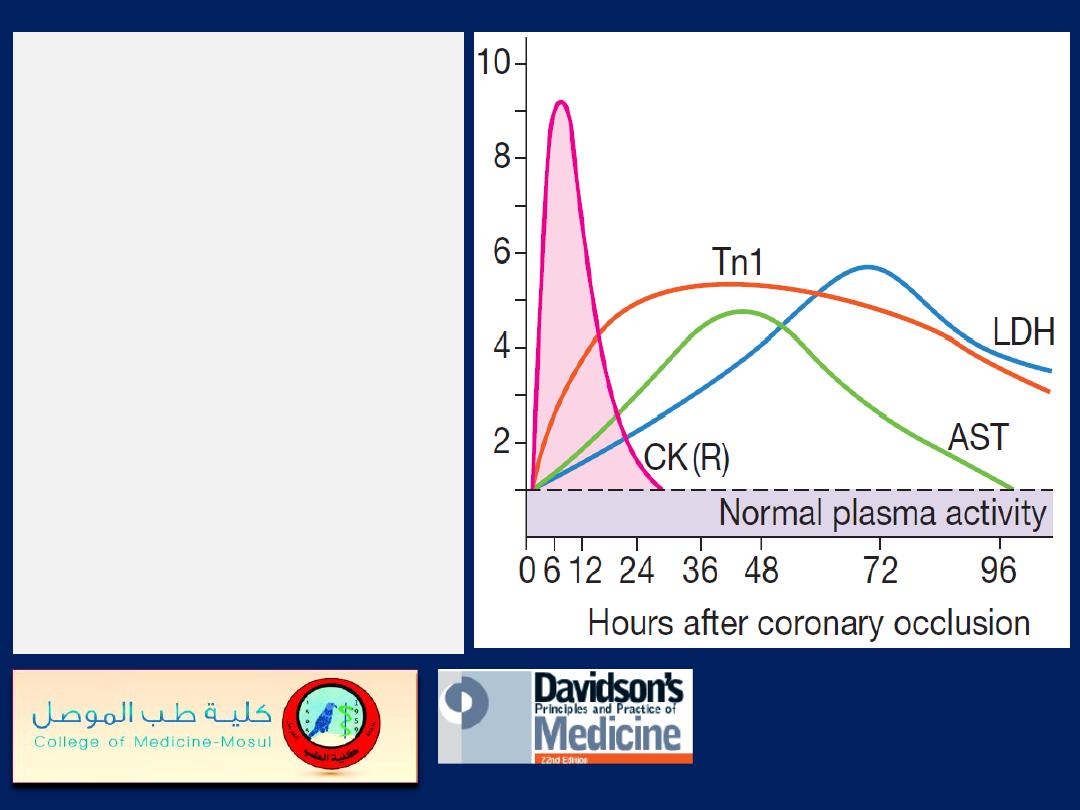
Changes in plasma cardiac
biomarker
concentrations
after MI. Creatine kinase (CK)
and troponin I (Tn I) are the
first to rise, followed by
aspartate aminotransferase
(AST) and then lactate
hydroxybutyrate)
dehydrogenase (LDH). In
patients treated with
reperfusion therapy, a rapid
rise in plasma creatine kinase
(curve CK (R)) occurs, due
to a washout effect.
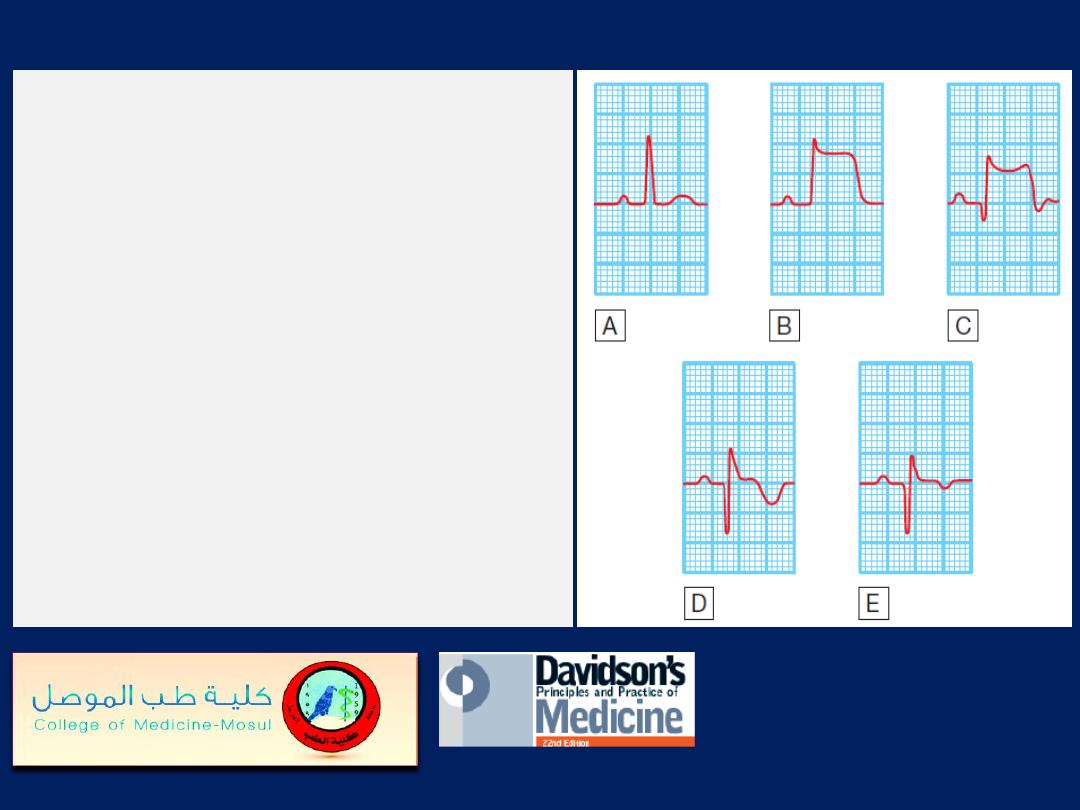
The serial evolution of ECG changes in
transmural MI.
A
Normal ECG complex.
B
Acute ST elevation (‘the current of injury’).
C
Progressive loss of the R wave, developing
Q wave, resolution of the ST elevation and
terminal T-wave inversion.
D
Deep Q wave and T-wave inversion.
E
Old or established infarct pattern; the Q
wave tends to persist but the T-wave changes
become less marked. The rate of evolution is
very variable but, in general, stage B
appears within minutes, stage C within
hours, stage D within days and stage E
after several weeks or months.
Recent anterior non-ST
elevation (
subendocardial)
MI. This ECG demonstrates deep
symmetrical T-wave inversion,
together with a reduction in the
height of the R wave in leads
V1, V2, V3 and V4.
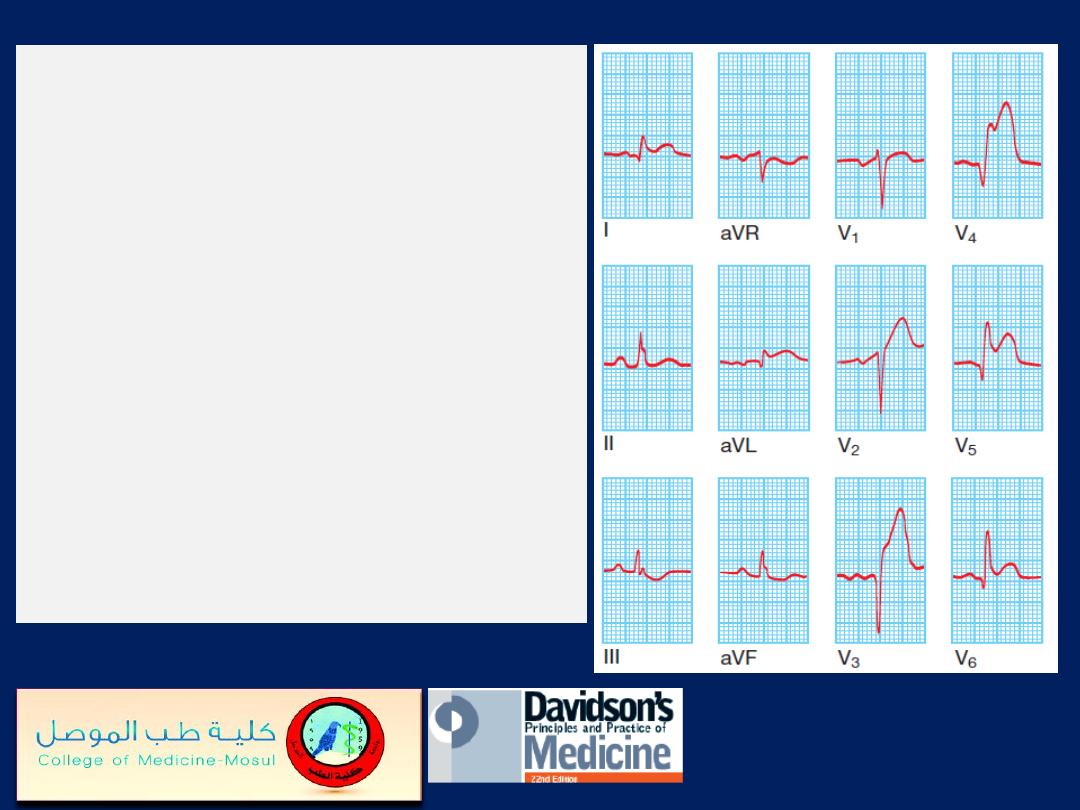
Acute transmural anterior MI.
This
ECG was recorded from a patient
who had developed severe chest pain
6 hours earlier. There is ST elevation
in leads I, aVL, V2, V3, V4, V5 and
V6, and there are Q waves in leads
V3, V4 and V5. Anterior infarcts with
prominent changes in leads V2, V3
and V4 are sometimes called
‘anteroseptal’ infarcts, as opposed to
anterolateral’ infarcts, in which the
ECG changes are predominantly
found in V4, V5 and V6.
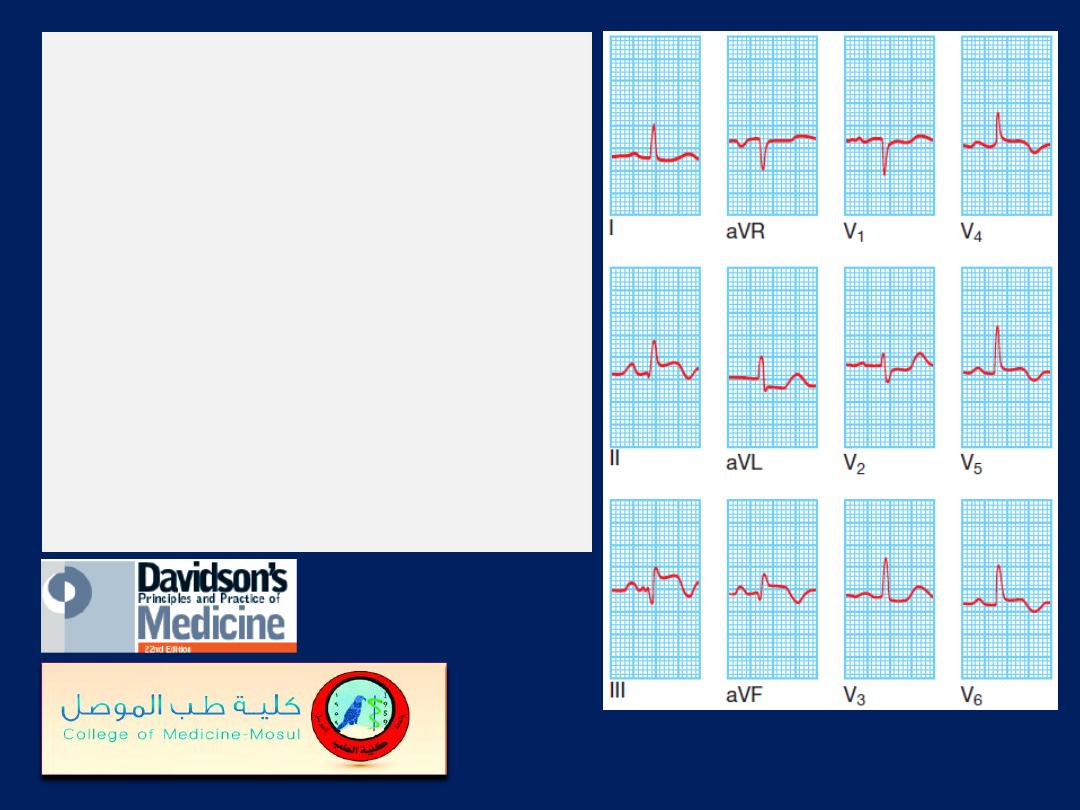
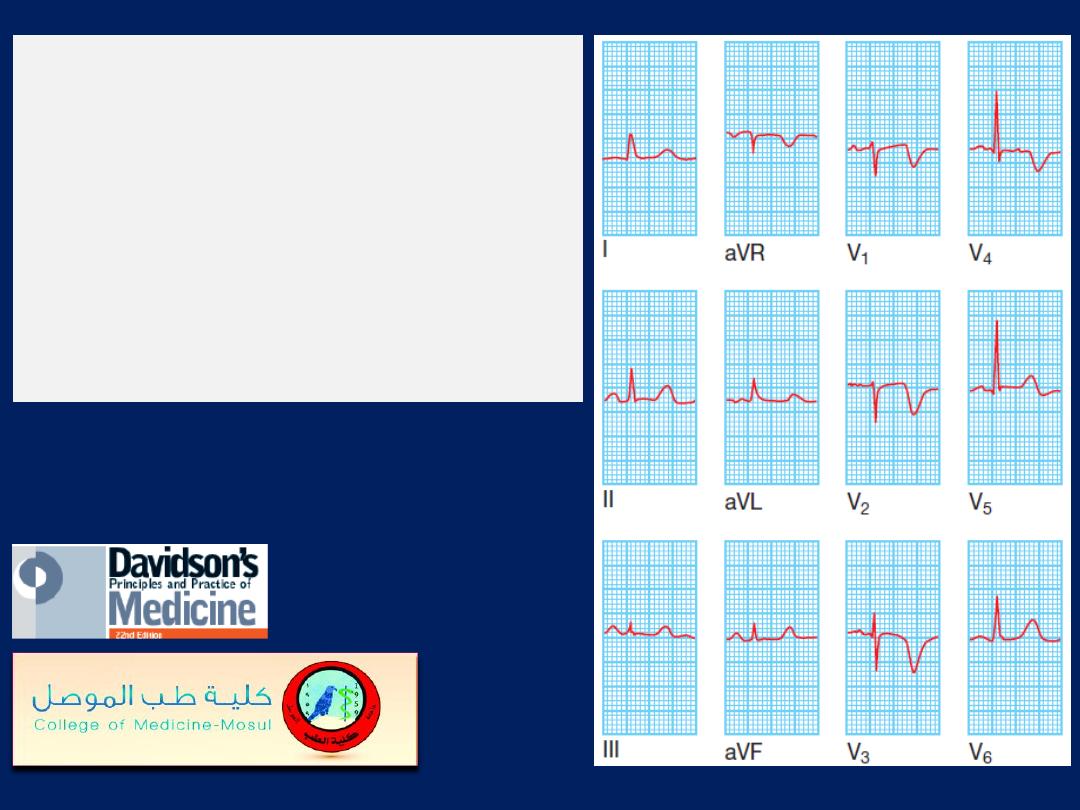
Acute transmural inferolateral
MI.
This ECG was
recorded from a patient who
had developed severe chest
pain 4 hours earlier. There is ST
elevation in the inferior leads II,
III and aVF and the lateral
leads V4, V5 and V6. There is
also ‘reciprocal’ ST depression
in leads aVL and V2.
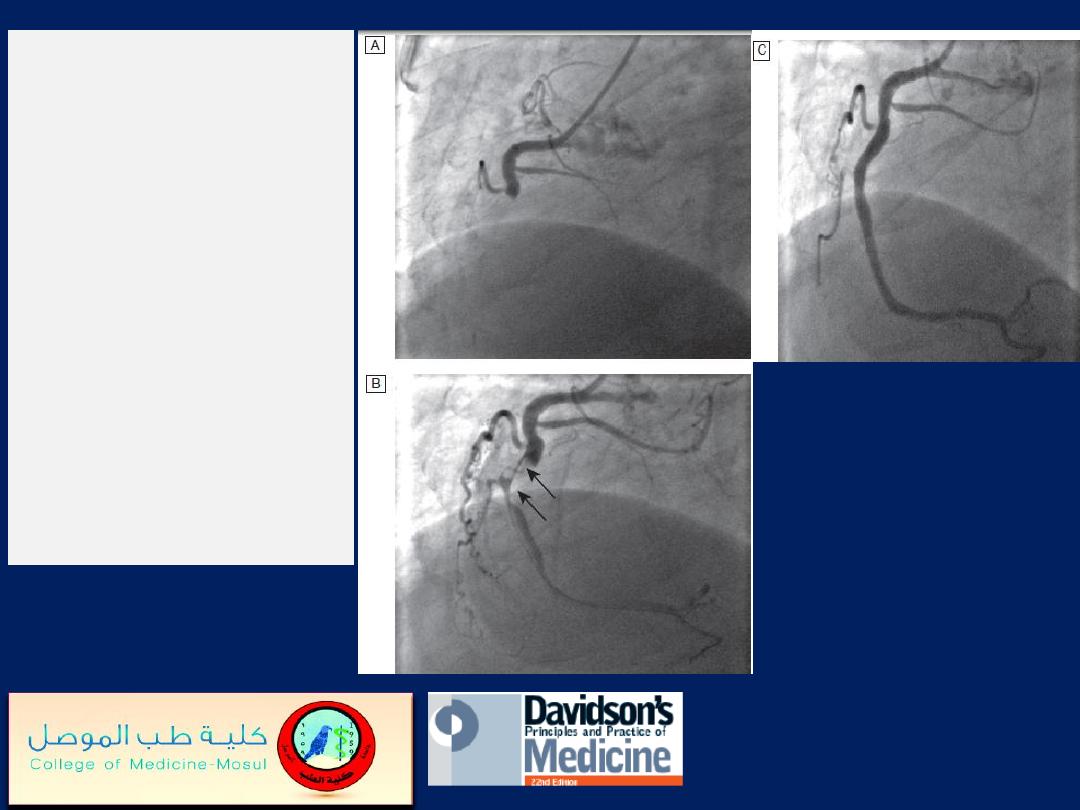
Primary PCI.
A
Acute right
coronary artery
occlusion.
B
Initial angioplasty
demonstrates a large
thrombus filling defect
(arrows).
C
Complete
restoration of normal
flow following
intracoronary stenting.
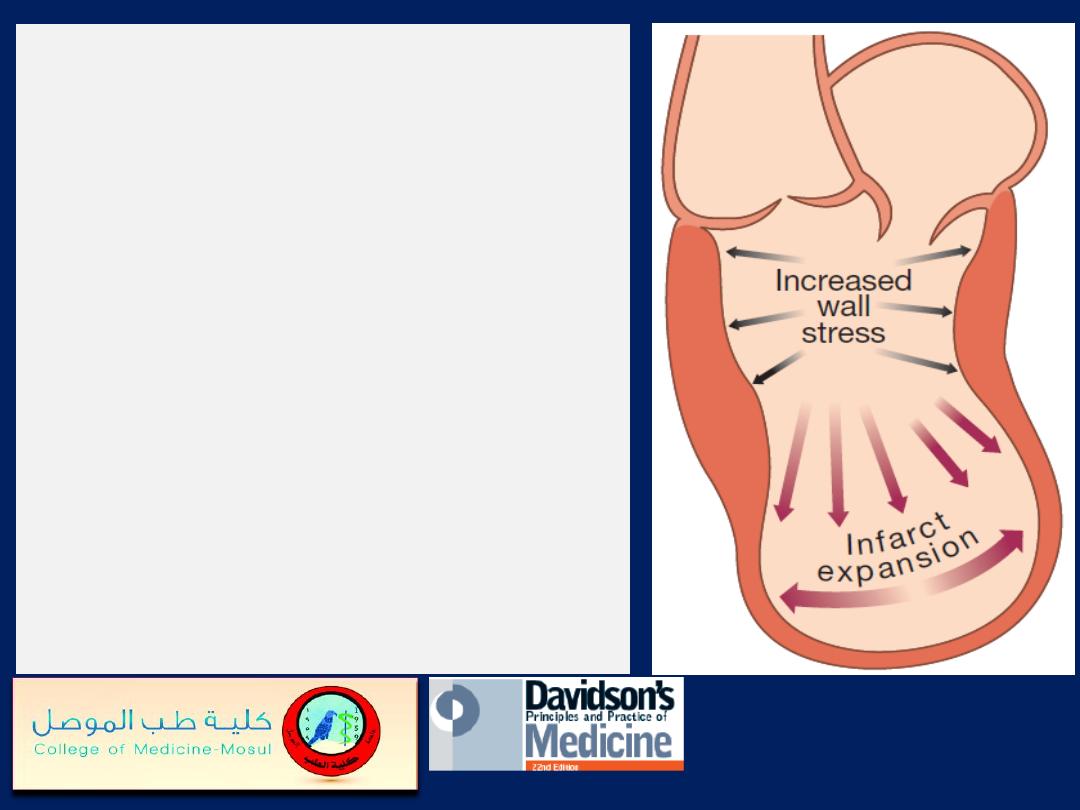
Infarct expansion and
ventricular remodelling.
Full-thickness Ml causes
thinning and stretching of the
infarcted segment (infarct
expansion), which leads to
increased wall stress with
progressive dilatation and
hypertrophy of the remaining
ventricle (ventricular
remodelling).
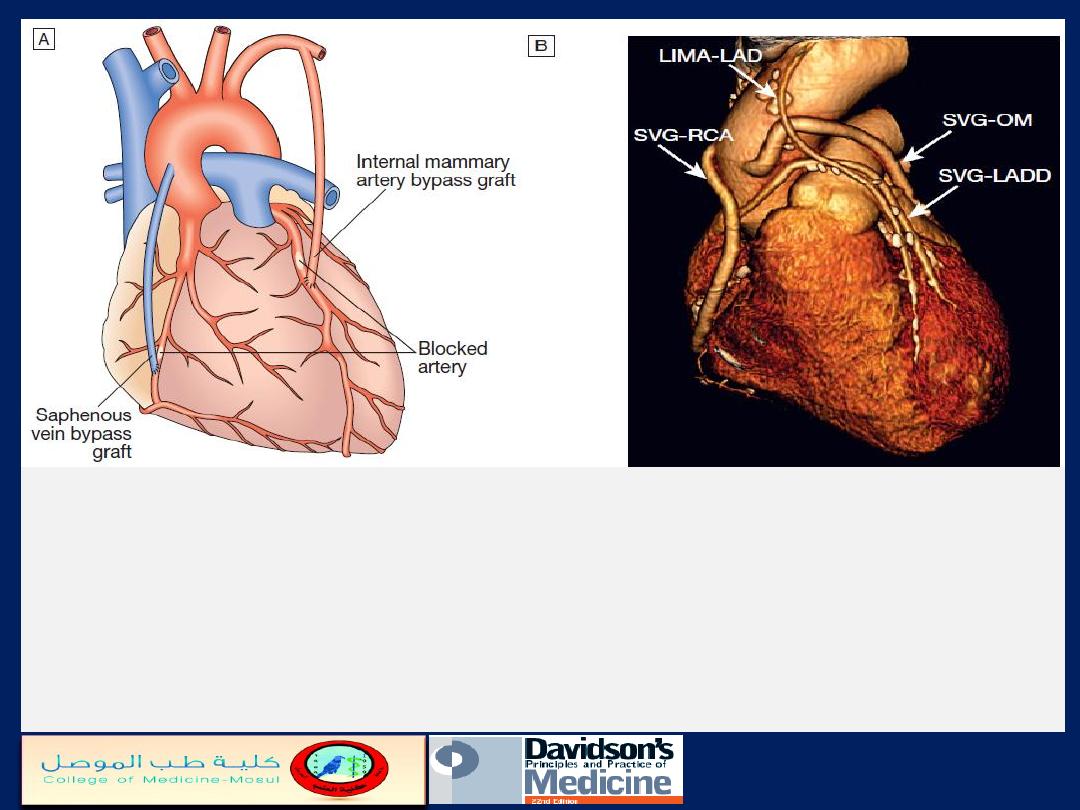
Coronary artery bypass graft surgery.
A
Narrowed or stenosed arteries are bypassed using saphenous vein grafts
connected to the aorta: or by utilising the internal mammary artery.
B
Three dimensional reconstruction of multidetector CT of the heart. The image shows
the patent saphenous vein grafts (SVG) to the right coronary artery (RCA), obtuse
marginal branch (OM) and diagonal branch (LADD), and left internal mammary
artery graft (LIMA) to the left anterior descending (LAD) coronary artery.
ECG in pericarditis.
Widespread ST elevation
(leads I, II, aVL and V1–V6) is
shown. The upward concave
shape of the ST segments (see
leads II and V6) and the
unusual distribution of
changes (involving anterior
and inferior leads) help to
distinguish pericarditis from
acute MI.
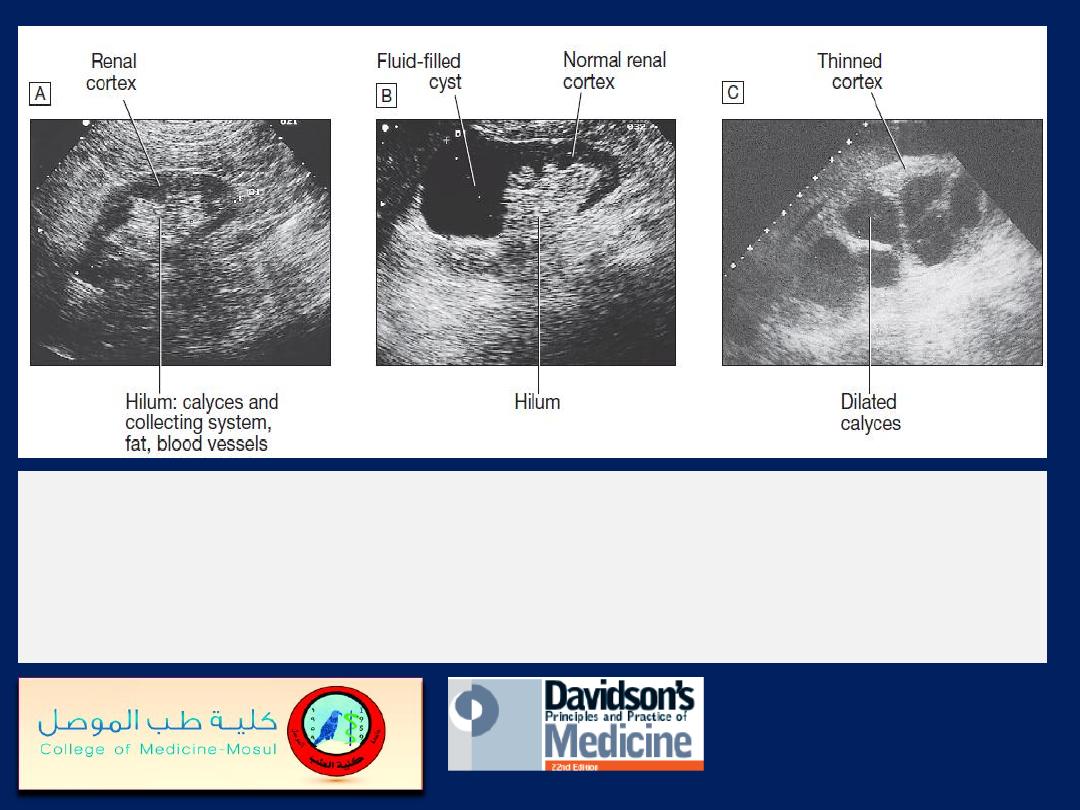
Renal ultrasound.
A
Normal kidney. The normal cortex is less echo-dense (blacker)
than the adjacent liver.
B
A simple cyst occupies the upper pole of an otherwise
normal kidney.
C
The renal pelvis and calyces are dilated by a chronic obstruction to
urinary outflow. The thinness and increased density of the remaining renal cortex
indicate chronic changes.
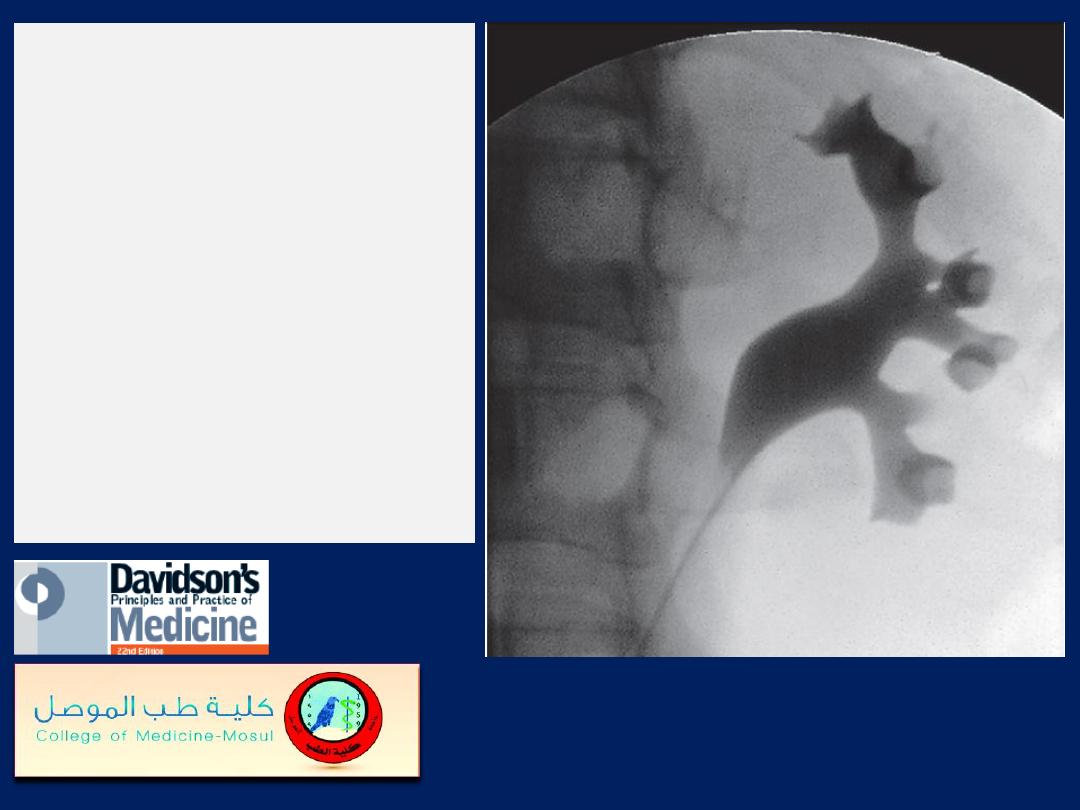
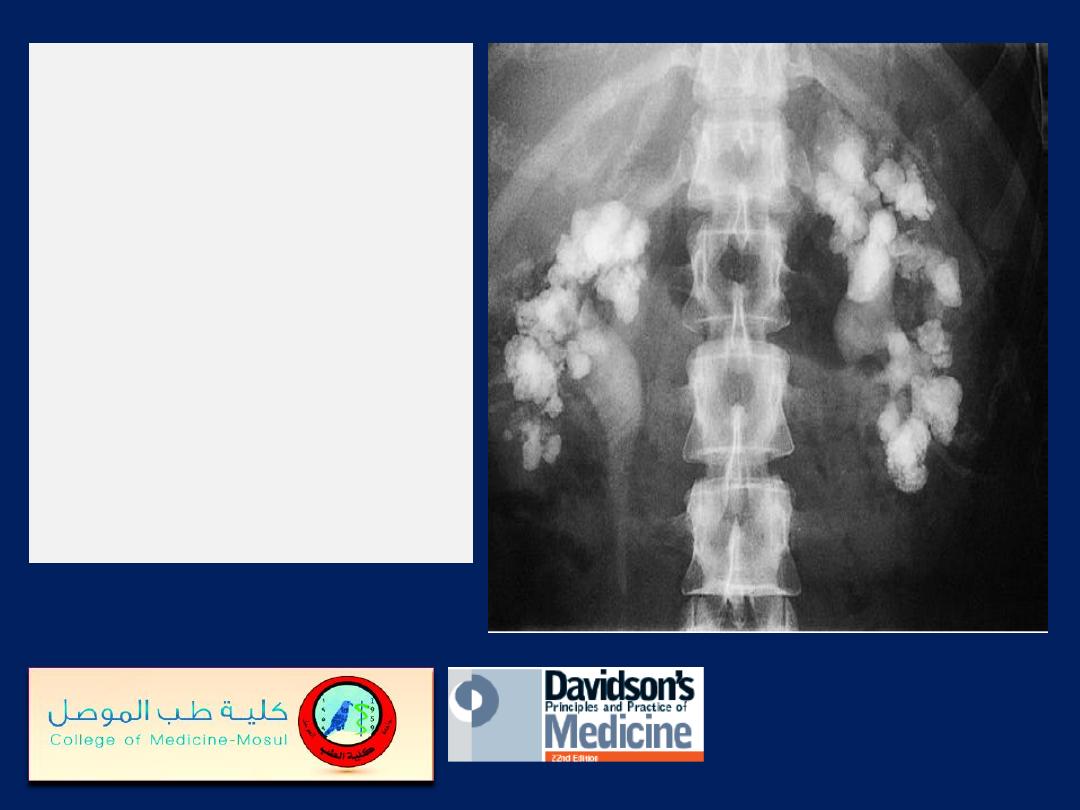
Retrograde pyelography.
The best views of the
normal collecting system
are shown by
pyelography. A catheter
has been passed
into the left renal pelvis
at cystoscopy. The
anemone-like calyces are
sharp-edged and normal.
Intravenous urography
(IVU).
A
Normal nephrogram phase at 1
minute.
B
Normal collecting system at 5 minutes.
C
Bilateral reflux
nephropathy (and chronic pyelonephritis), showing clubbing of the
calyces that is particularly marked in the upper right pole.
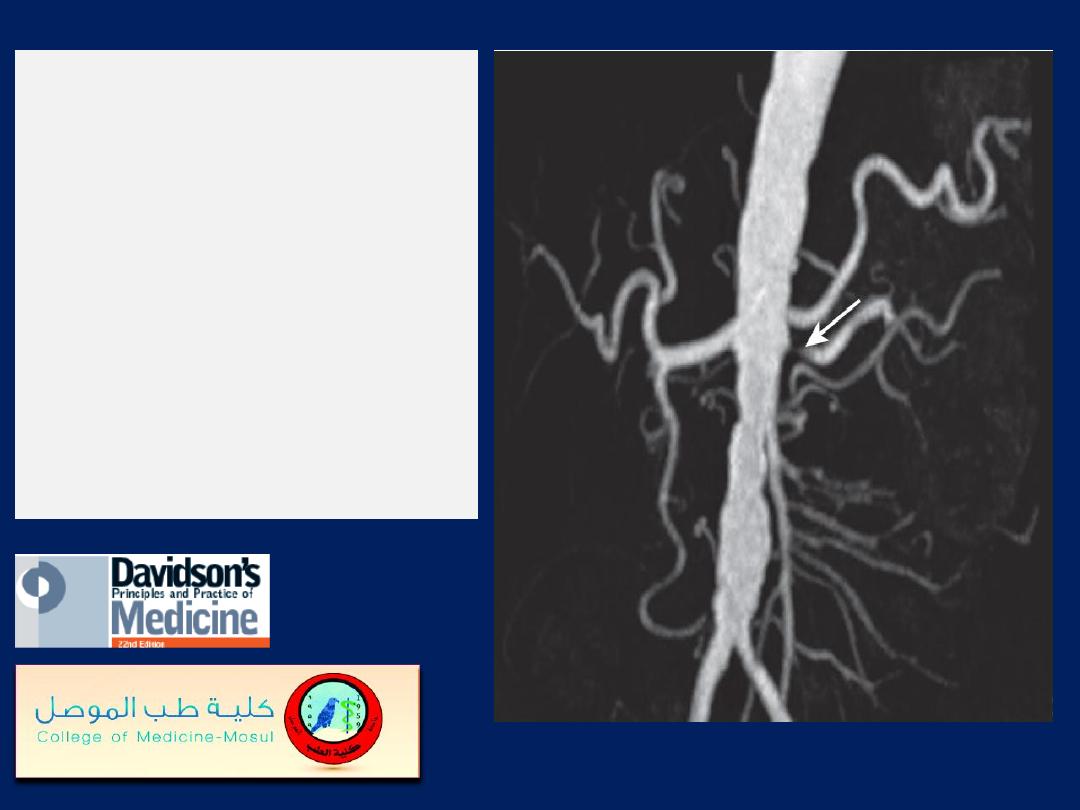
Renal artery stenosis.
A magnetic resonance
angiogram following
injection of contrast. The
abdominal aorta is
severely irregular
and atheromatous. The
left renal artery is
stenosed (arrow).
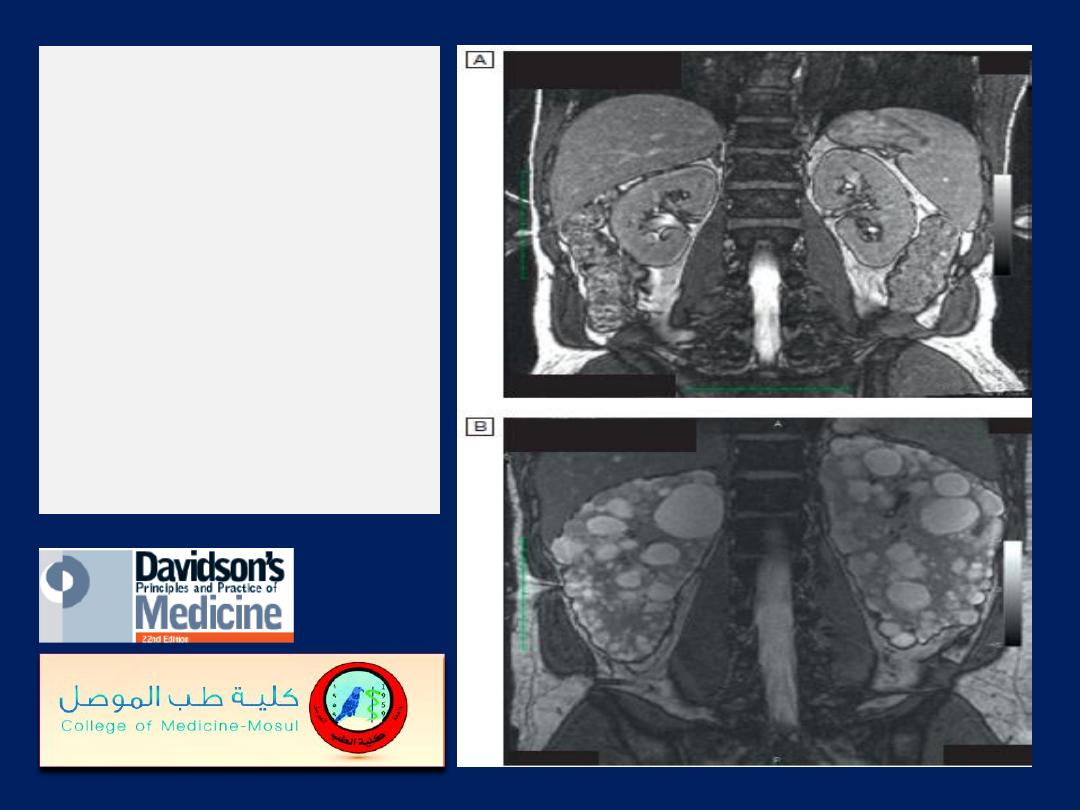
MRI images of the
kidneys.
A
Normal kidneys.
B
Polycystic kidneys;
although the kidney
enlargement is
extreme, this patient
had only slightly
reduced GFR.
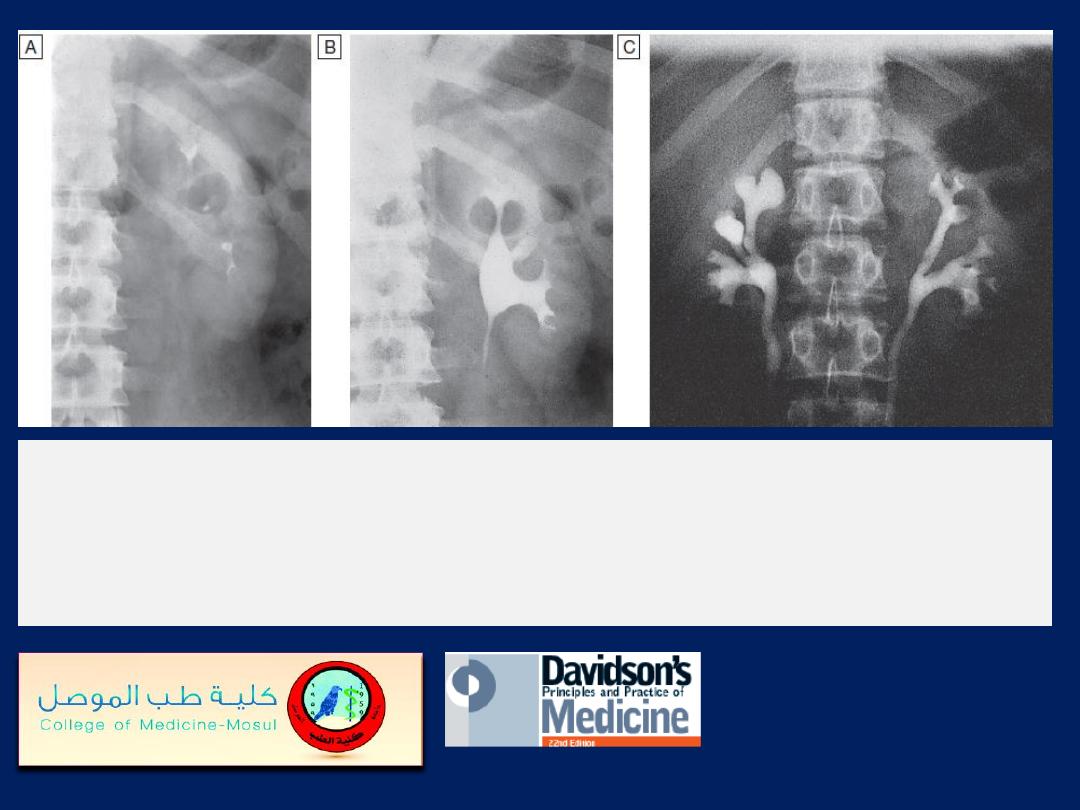
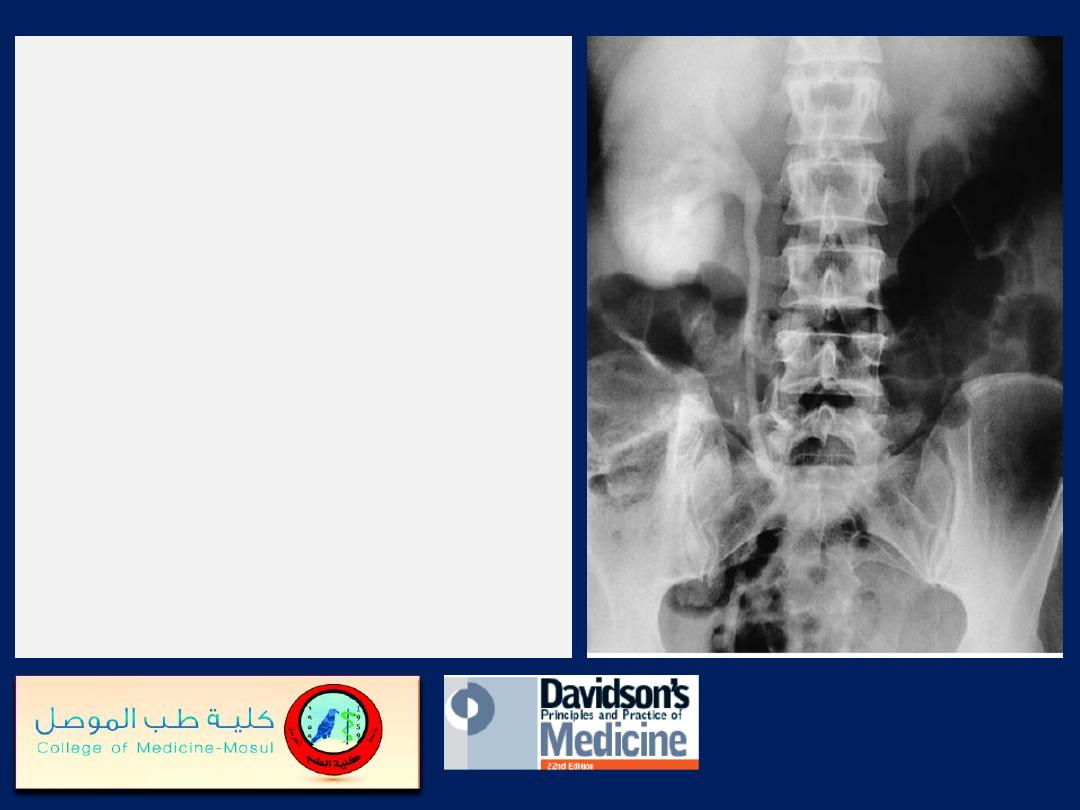
Radio-opaque bilateral
staghorn calculi v
isible
during intravenous
urography. The
intravenous pyelogram
demonstrates that,
while some dye is being
excreted by the right
kidney, there is little
function on the left.
Unilateral ureteric obstruction.
IV urogram of a patient with a
stone (not visible) at the lower
end of the right ureter.
This film, taken 2 hours post-
contrast injection, demonstrates
persistence of contrast medium
in the right kidney,
pelvicalyceal system and ureter,
whereas only a small amount
remains visible in the normal
left pelvicalyceal system.
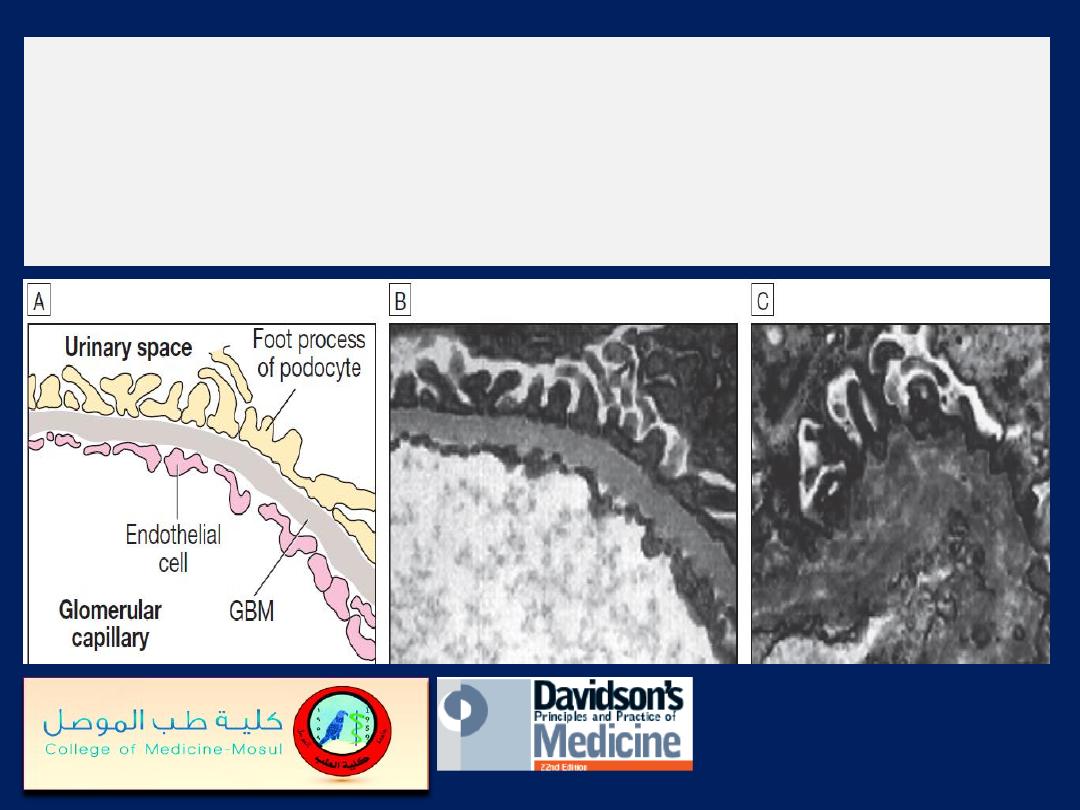
Alport’s syndrome.
A
Diagrammatic structure of the normal GBM.
B
The normal
GBM (electron micrograph) contains mostly the tissue-specific (α3, α4 and α5) chains
of type IV collagen.
C
In Alport’s syndrome, this network is disrupted and replaced
by α1 and α2 chains.
Although the GBM appears structurally normal in early life, in time thinning
appears, progressing to thickening, splitting and degeneration.
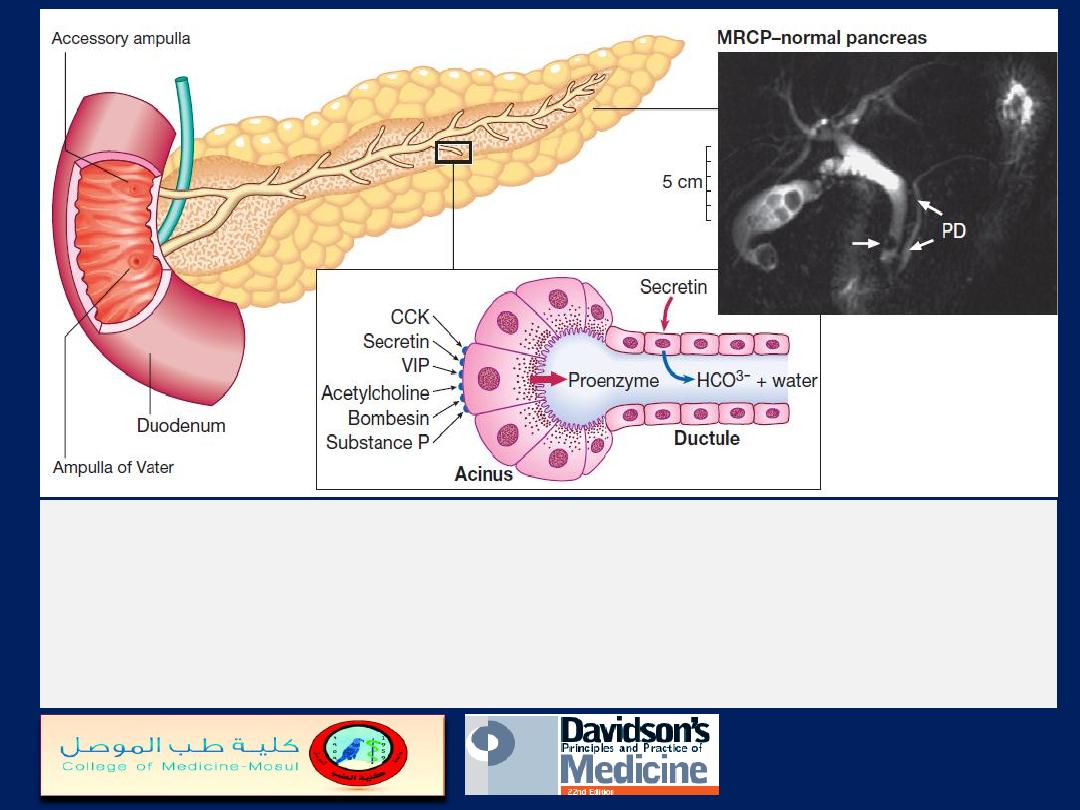
Pancreatic structure and function.
Ductular cells secrete alkaline fluid in response to
secretin. Acinar cells secrete digestive enzymes from zymogen granules in response to a
range of secretagogues. The photograph shows a normal pancreatic duct (PD) and side
branches, as defined at magnetic resonance cholangiopancreatography (MRCP). Note the
incidental calculi in the gallbladder and common bile duct (arrow). (CCK = cholecystokinin;
VIP = vasoactive intestinal polypeptide
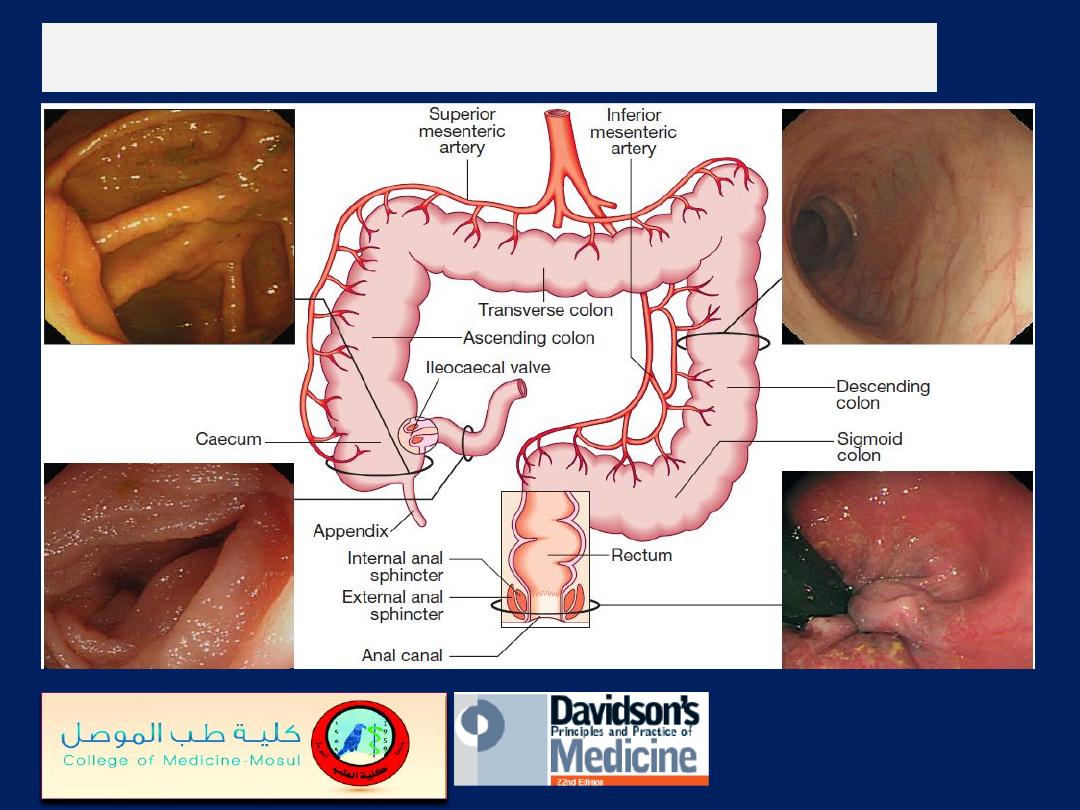
The normal colon, rectum and anal canal
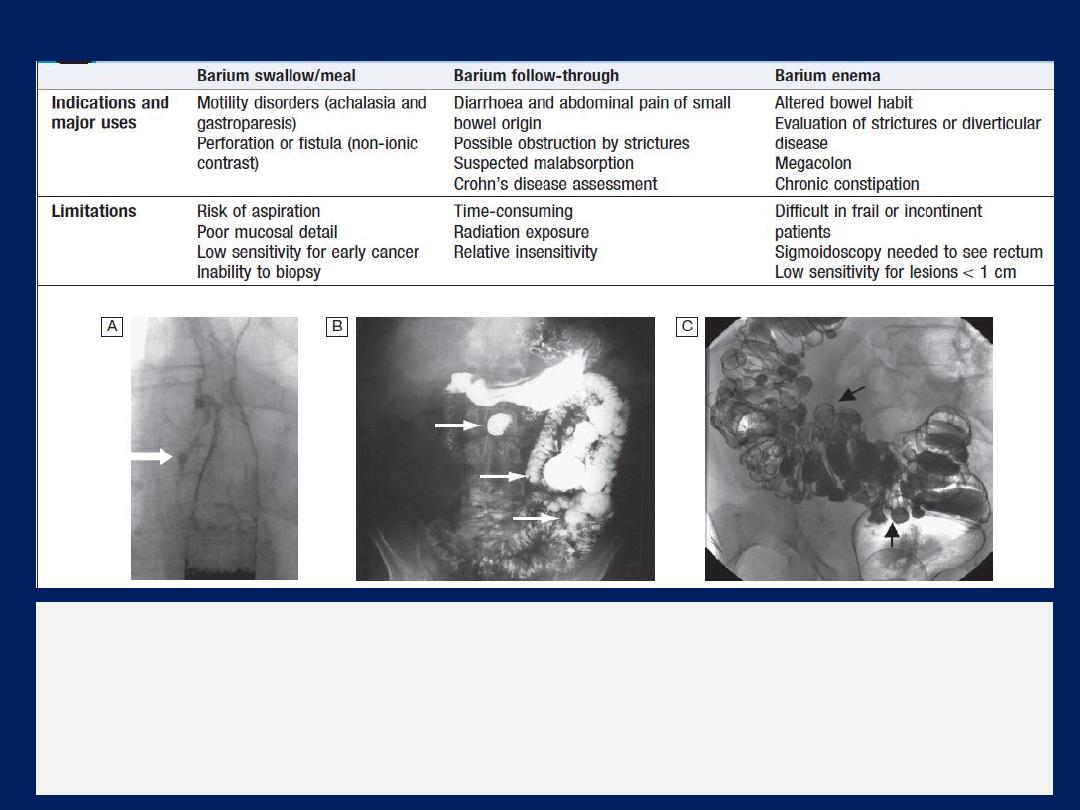
Contrast radiology in the investigation of gastrointestinal disease
Examples of contrast radiology
. A Non-ionic contrast swallow shows leakage of
contrast (arrow) into the mediastinum following stricture dilatation. B Barium follow-
through. There are multiple diverticula (arrows) in this patient with jejunal
diverticulosis. C Barium enema showing severe diverticular disease. There is
tortuosity and narrowing of the sigmoid colon with multiple diverticula (arrows).
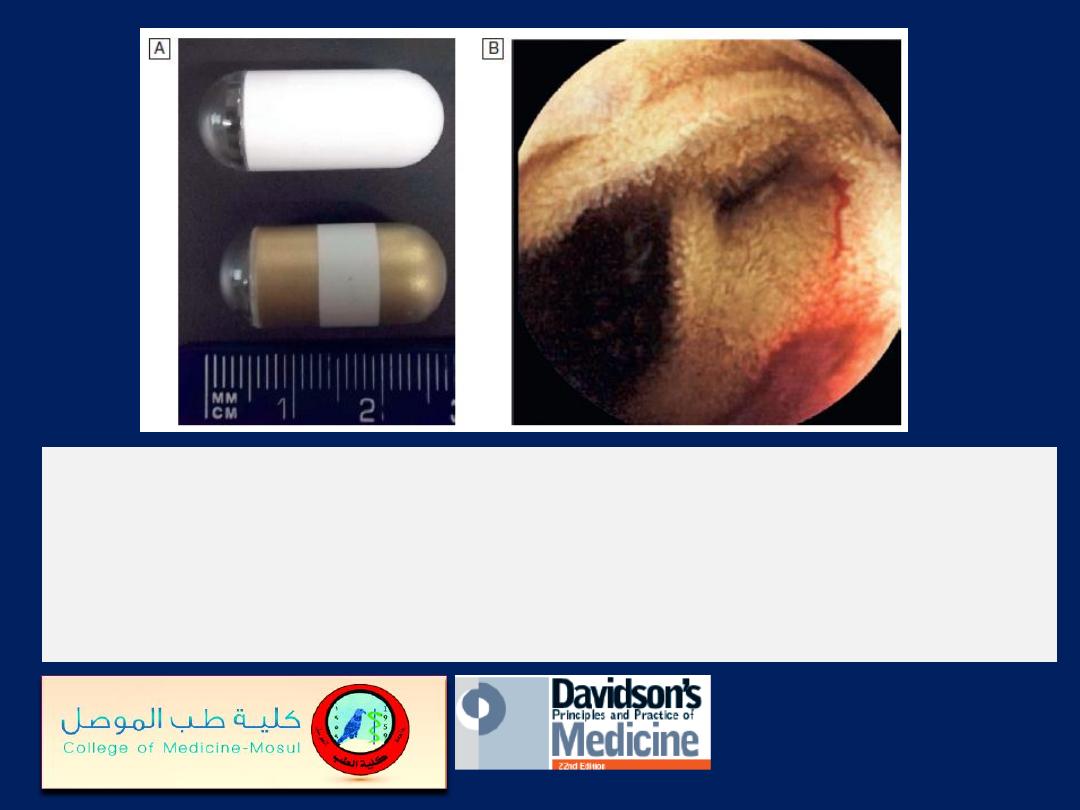
Wireless capsule endoscopy.
A
Examples of capsules.
B
Capsule endoscopy image of bleeding jejunal vascular
malformation.
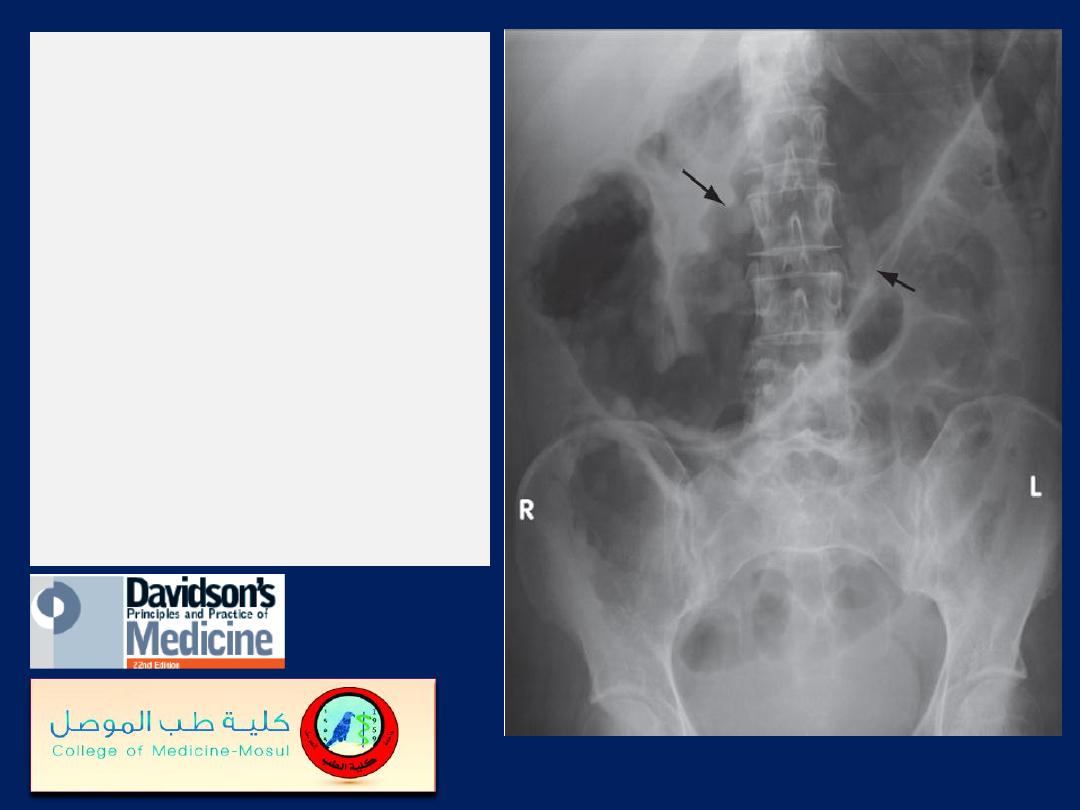
Plain abdominal X-
ray
showing a grossly
dilated colon due to
severe ulcerative
colitis.
There is also marked
mucosal oedema and
‘thumb-printing’
(arrows).
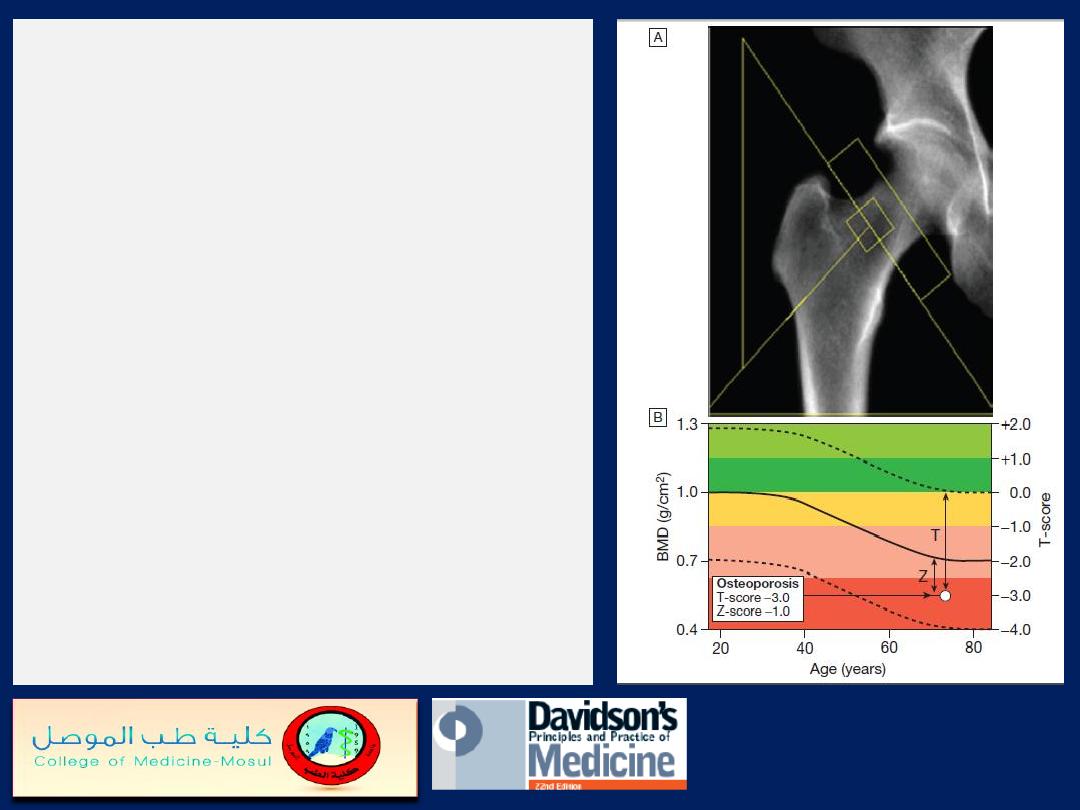
Typical output from a dual energy X-
ray absorptiometry (DEXA) scanner
.
A
DEXA scan of the hip.
B
Bone mineral density (BMD) values
plotted in g/cm2 (left axis) and as the
T-score values (right axis). The solid
line represents the population average
plotted against age, and the
interrupted lines are ± 2 standard
deviations from the average. The
patient shown, aged 72, has an
osteoporotic T-score of
−3.0 but a
Z-score of
−1.0, which is within the
‘normal range’ for that age, reflecting
the fact that bone is lost with age.
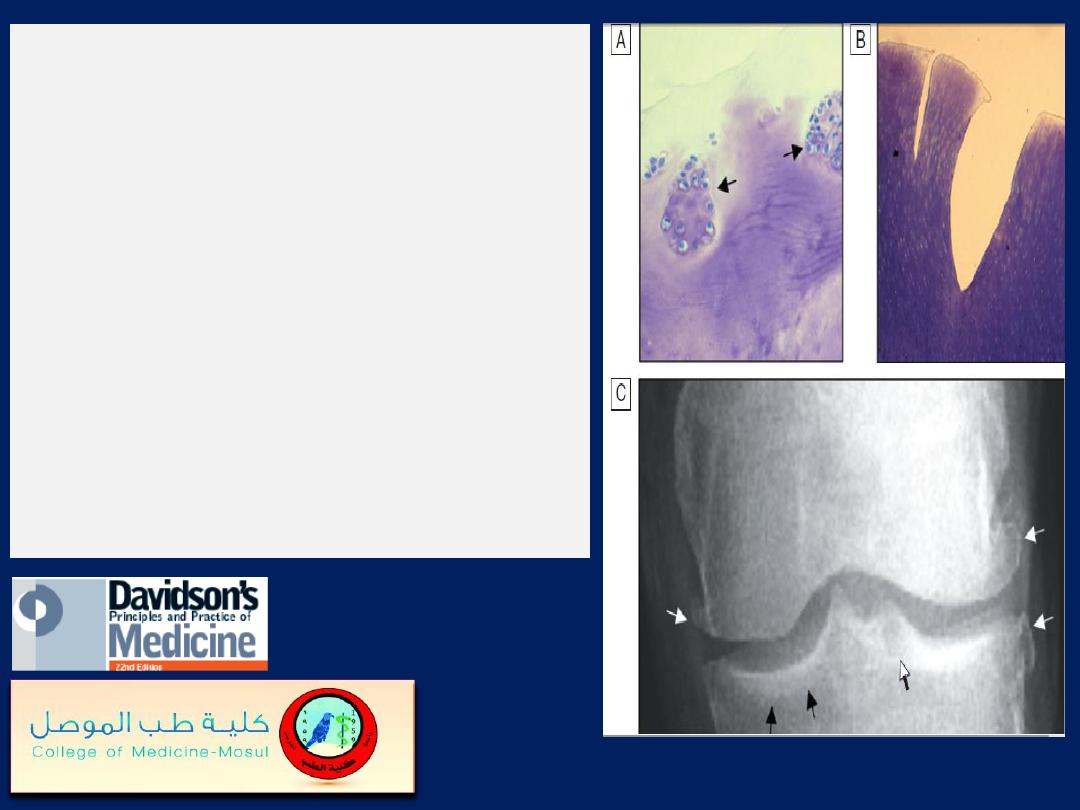
Pathological changes in
osteoarthritis.
A
Abnormal nests of proliferating
chondrocytes (arrows) interspersed
with matrix devoid of normal
chondrocytes
.
B
Fibrillation of cartilage in OA.
C
Radiograph of knee joint affected
by OA, showing osteophytes at joint
margin (white arrows), subchondral
sclerosis (black arrows) and
subchondral cyst (open arrow).
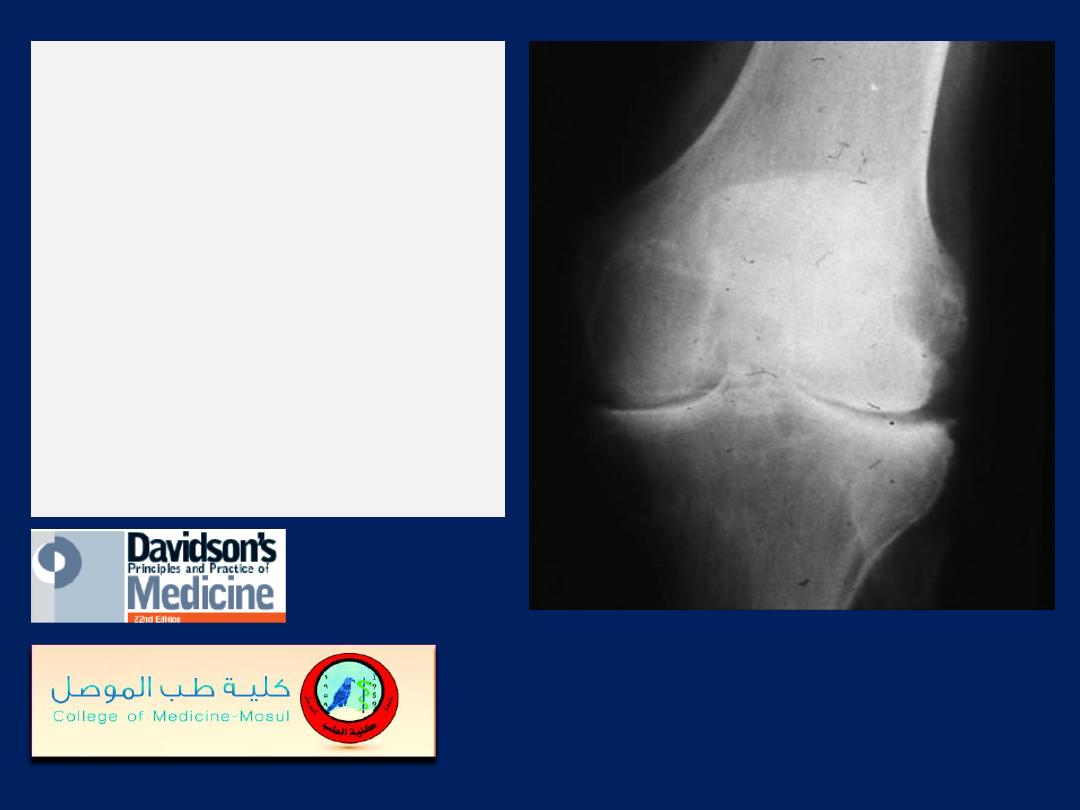
X-ray appearances in
knee osteoarthritis.
There is almost
complete loss of joint
space affecting both
compartments,
and sclerosis of
subchondral bone.
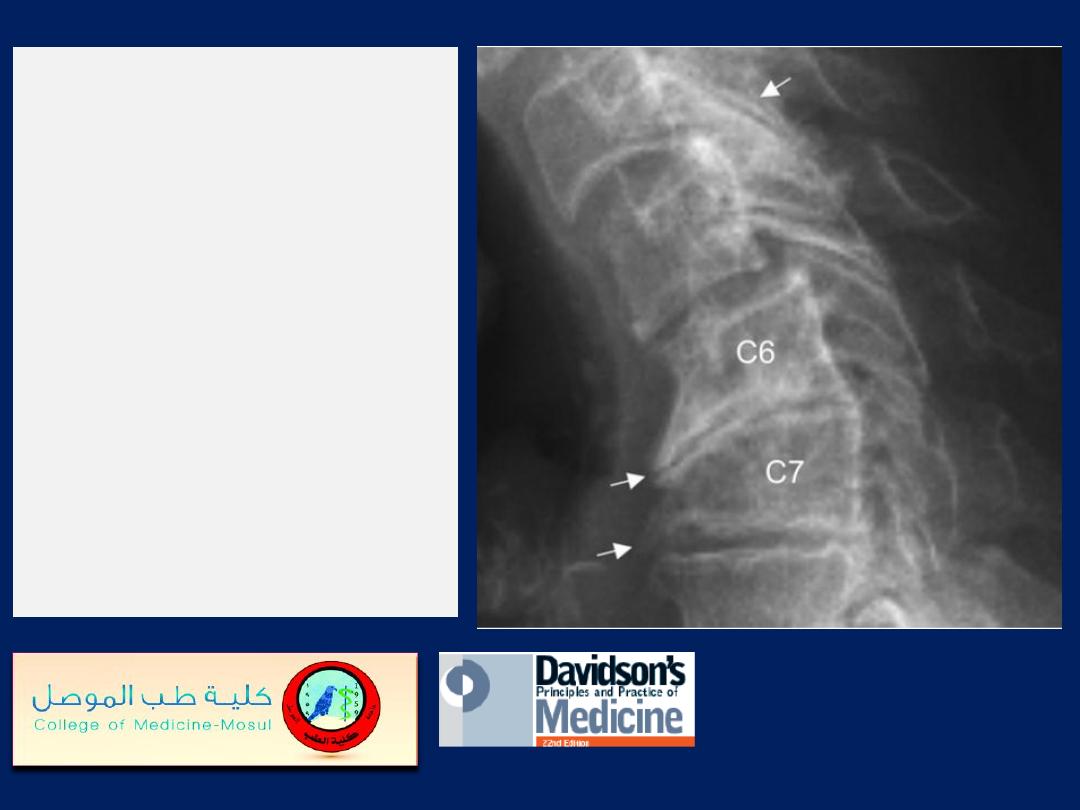
X-ray of spine showing
typical changes of
osteoarthritis.
Cervical
spondylosis showing disc
space narrowing
between C6 and C7,
osteophytes at the
anterior vertebral body
margins (arrows) and
osteosclerosis at the
apophyseal joints.
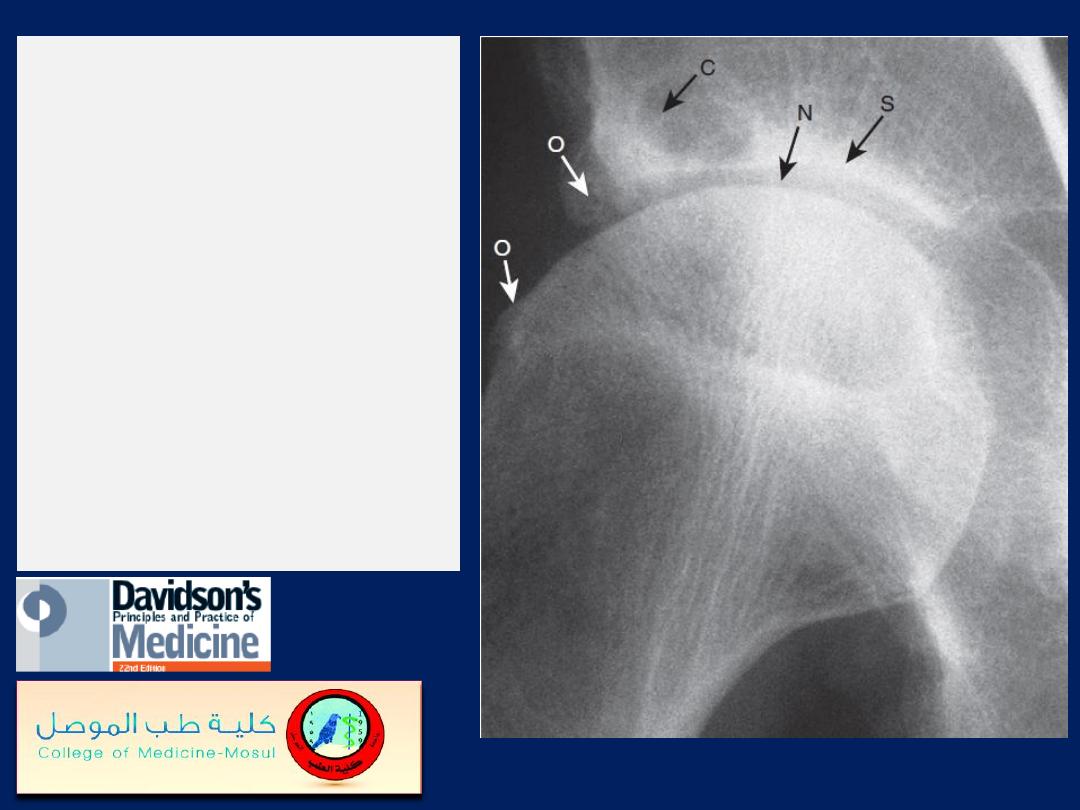
X-ray of hip
showing changes of
osteoarthritis
.
Note the superior
joint space narrowing
(N), subchondral
sclerosis (S), marginal
osteophytes (white
arrows) and cysts (C).
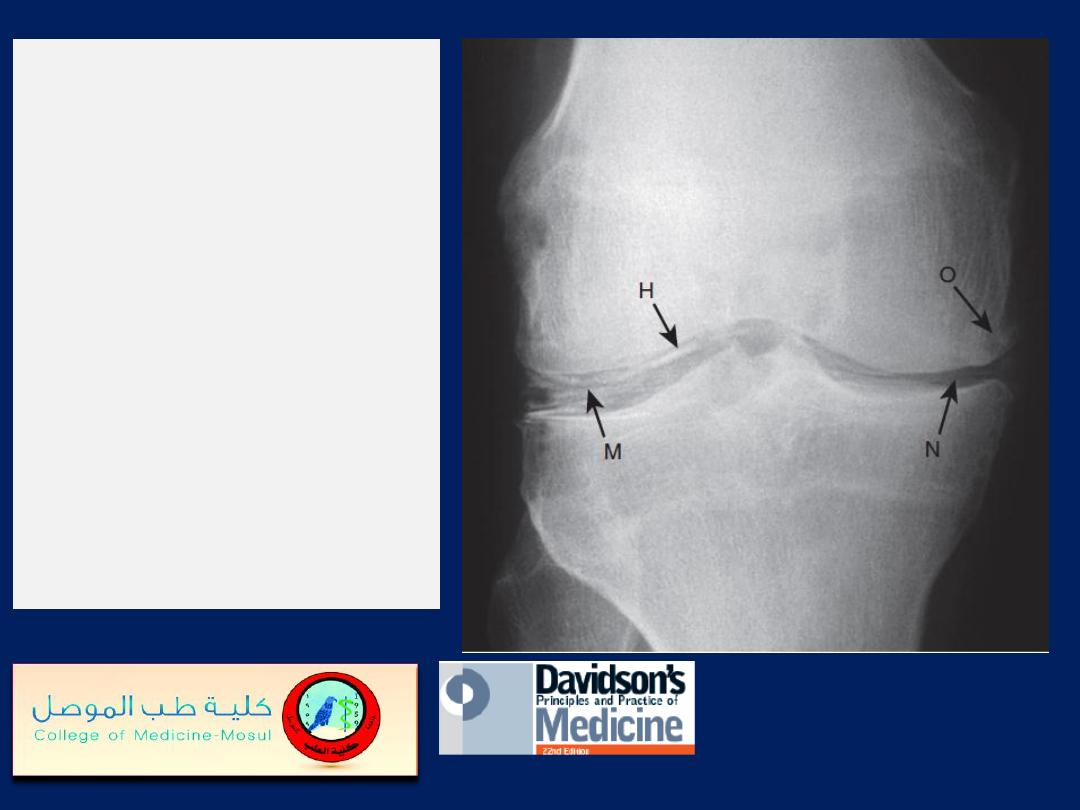
Chondrocalcinosis of
the knee
. The X-ray
shows calcification of
the fibrocartilaginous
menisci (M) and
articular hyaline
cartilage (H). There is
also narrowing (N) and
osteophyte (O) of the
medial tibio-femoral
compartment
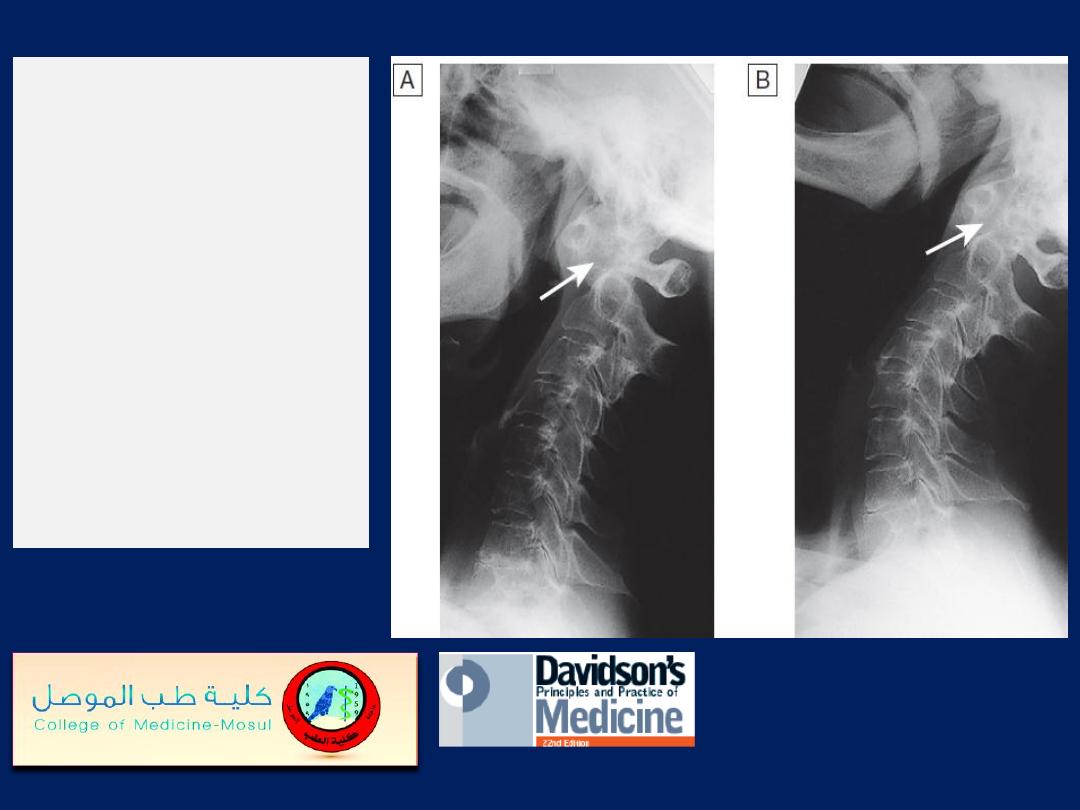
Subluxation of
cervical spine.
A
Flexion, showing
widening of the space
(arrow) between the
odontoid peg of the
axis (behind) and the
anterior arch of the
atlas (in front).
B
Extension, showing
reduction in this space.
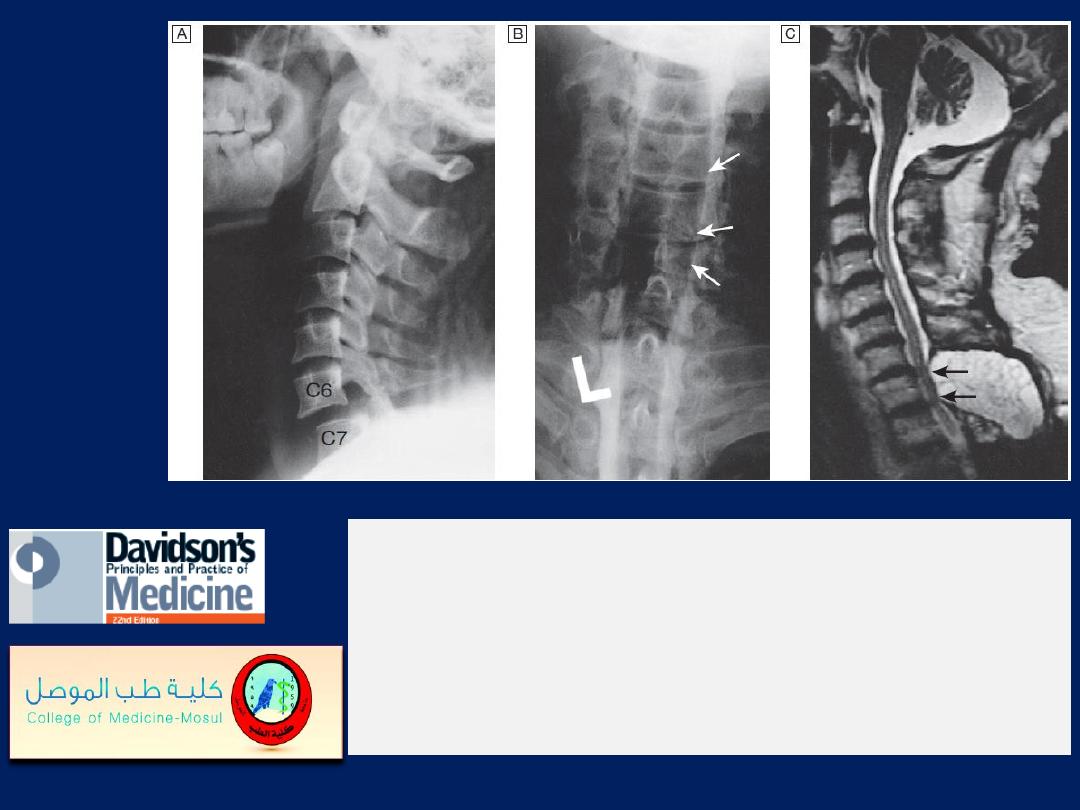
Imaging the cervical spine.
A
Lateral X-ray showing bilateral C6/7 facet dislocation.
B
Myelogram showing widening of cervical cord due to
astrocytoma (arrows).
C
MRI showing posterior epidural compression from
metastasis to the posterior arch of T1 (arrows).
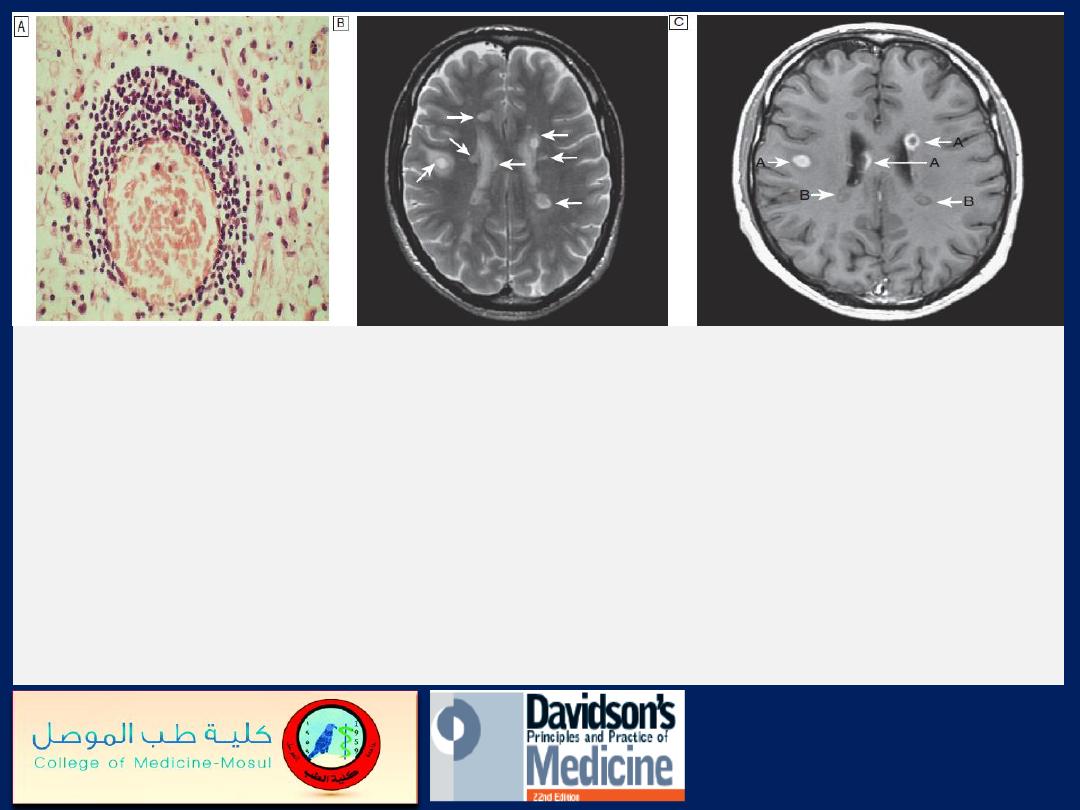
Multiple sclerosis
. A
Photomicrograph from demyelinating plaque,
showing perivascular cuffing of blood vessel by lymphocytes.
B
Brain
MRI in multiple sclerosis. Multiple high-signal lesions (arrows) seen
particularly in the paraventricular region on T2 image.
C
In T1 image
with gadolinium enhancement, recent lesions (A arrows) show
enhancement, suggesting active inflammation (enhancement persists for
4 weeks); older lesions (B arrows) show no enhancement but low signal,
suggesting gliosis.
Multiple sclerosis:
demyelinating lesion in
cervical
spinal cord, high-signal
T2 images (arrow).
A Sagittal plane.
B Axial plane.
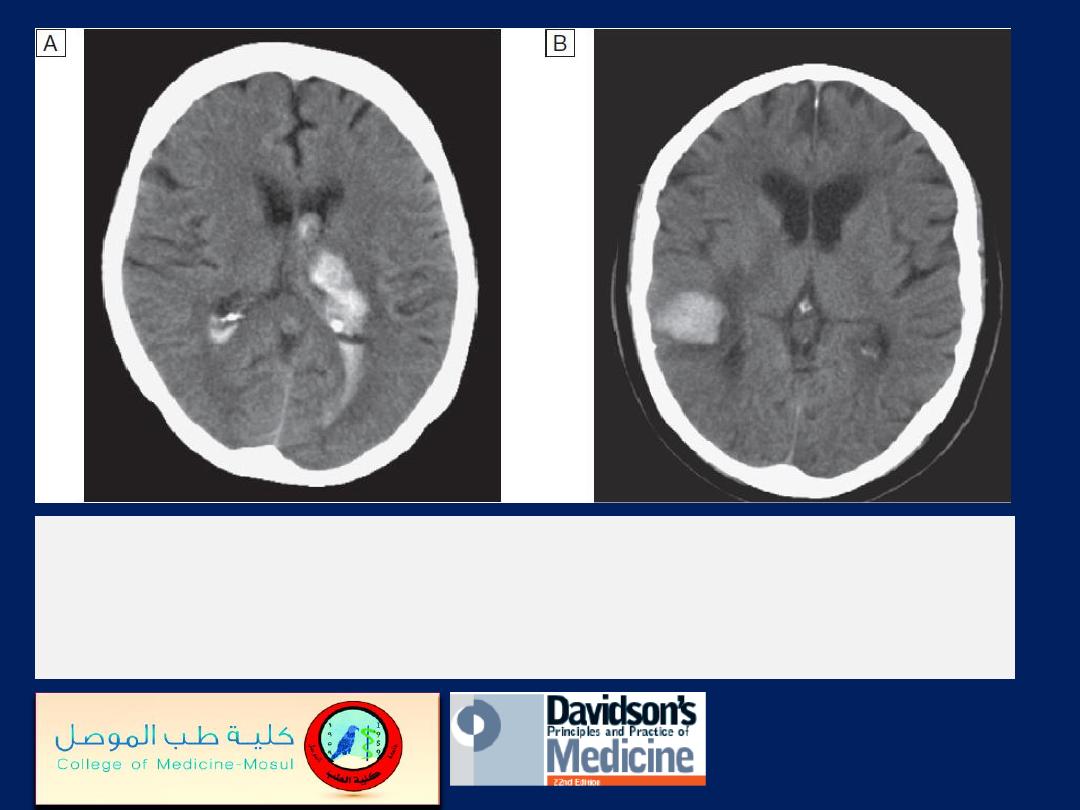
CT scans showing intracerebral haemorrhage.
A
Basal ganglia haemorrhage with intraventricular
extension
.
B
Small cortical haemorrhage.
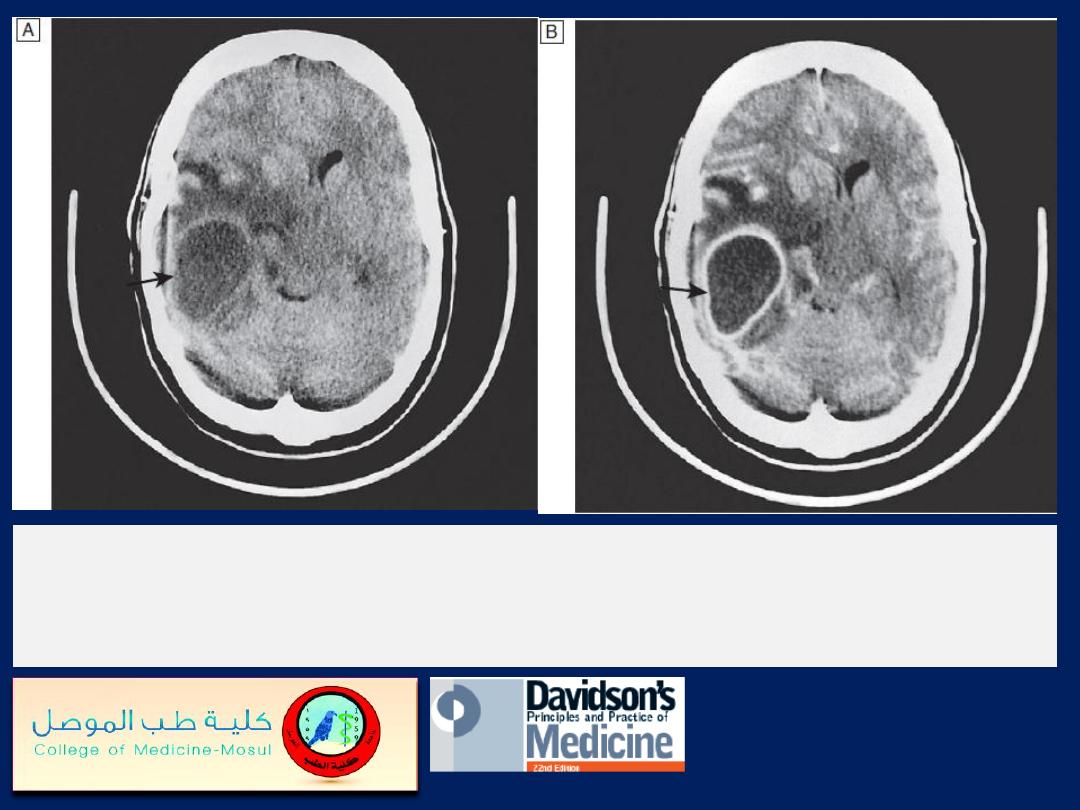
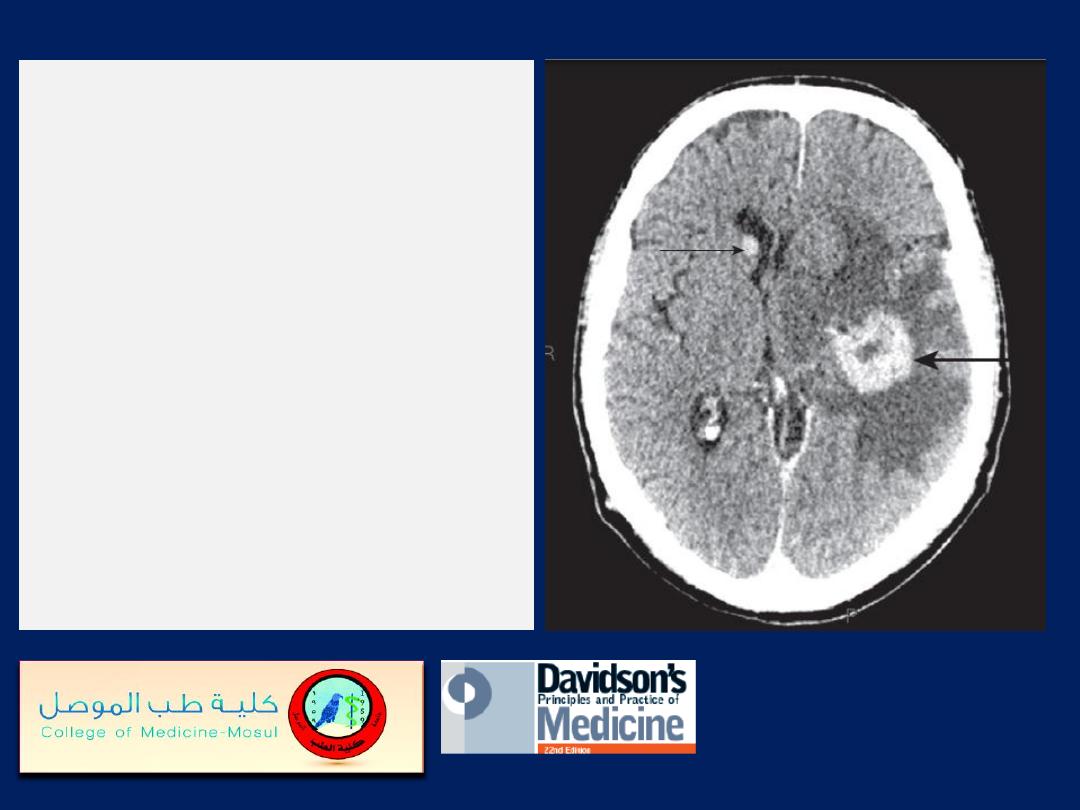
Right temporal cerebral abscess
(arrows), with surrounding oedema
and midline shift to the left.
A
Unenhanced CT image.
B
Contrast-enhanced CT image.
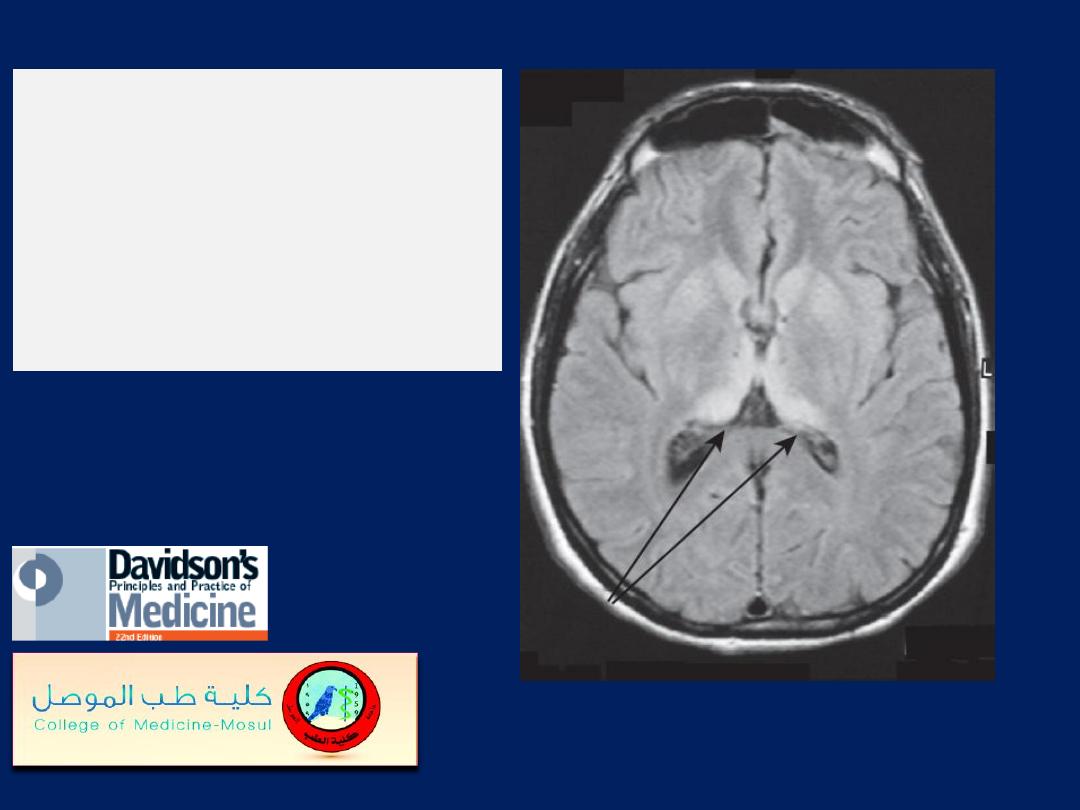
MRI in variant
Creutzfeldt–Jakob
disease. Arrows
indicate bilateral
pulvinar hyperintensity.
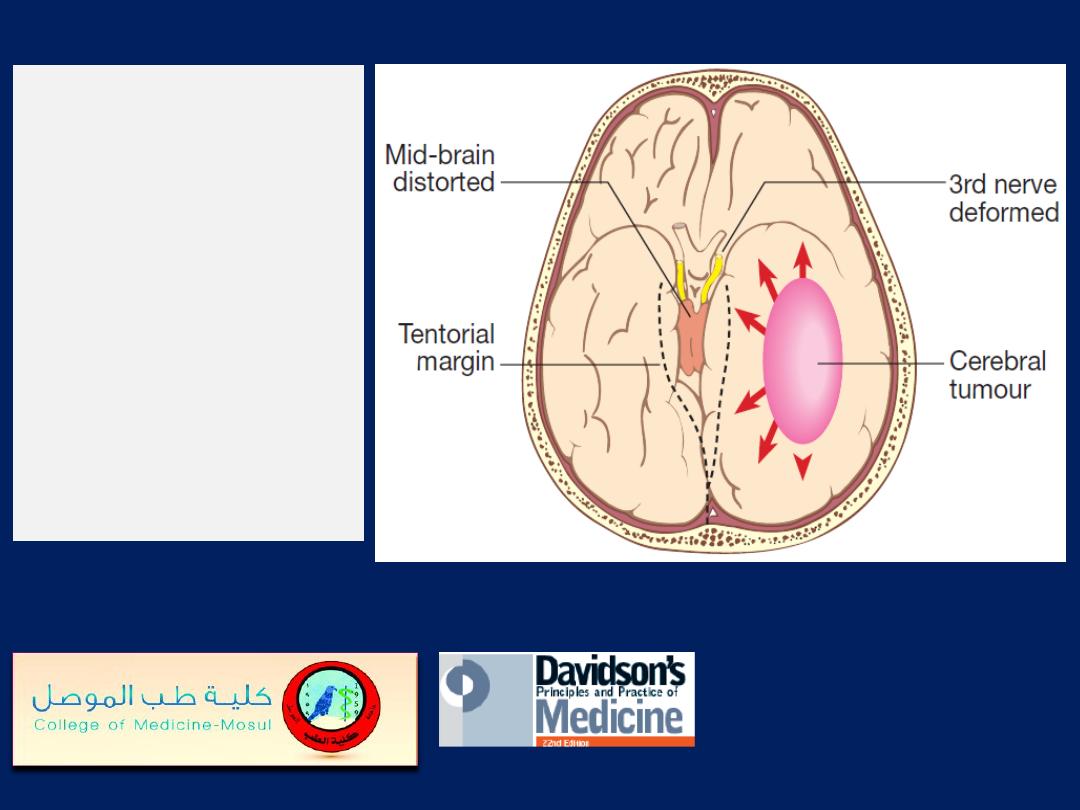
Cerebral tumour
displacing
medial temporal
lobe and
causing pressure
on the mid-brain
and 3rd cranial
nerve.
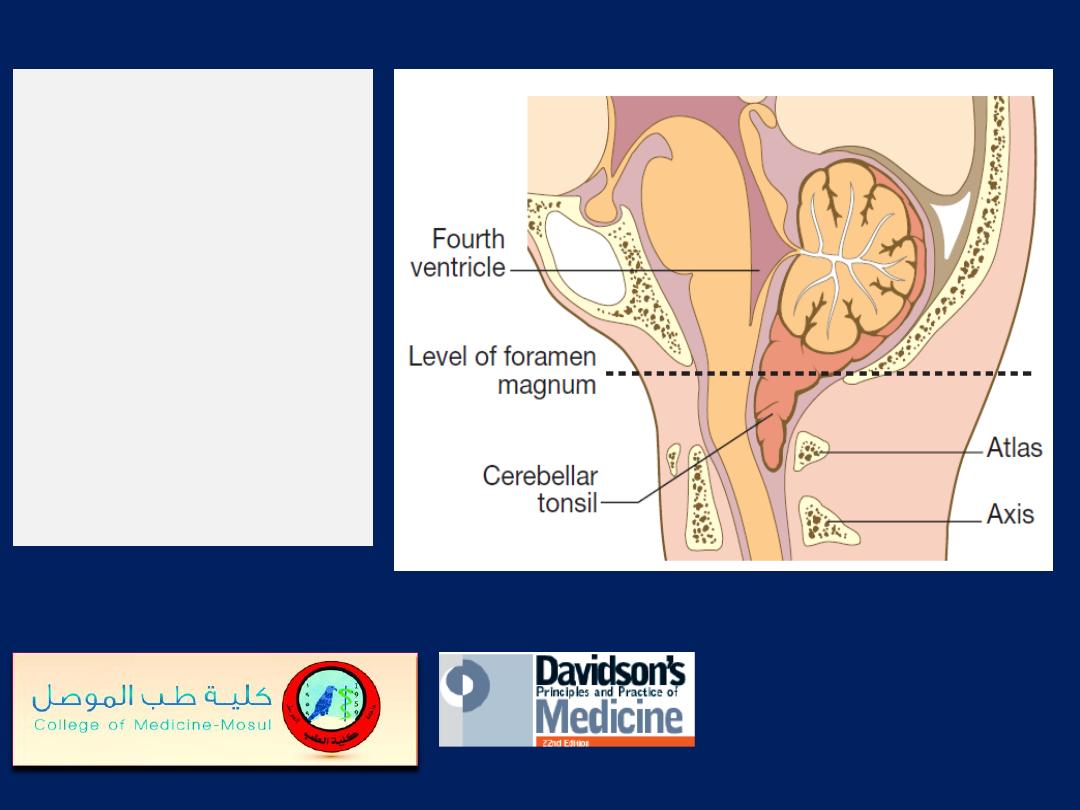
Tonsillar cone.
Downward
displacement of
the cerebellar
tonsils below the
level of the
foramen
magnum.
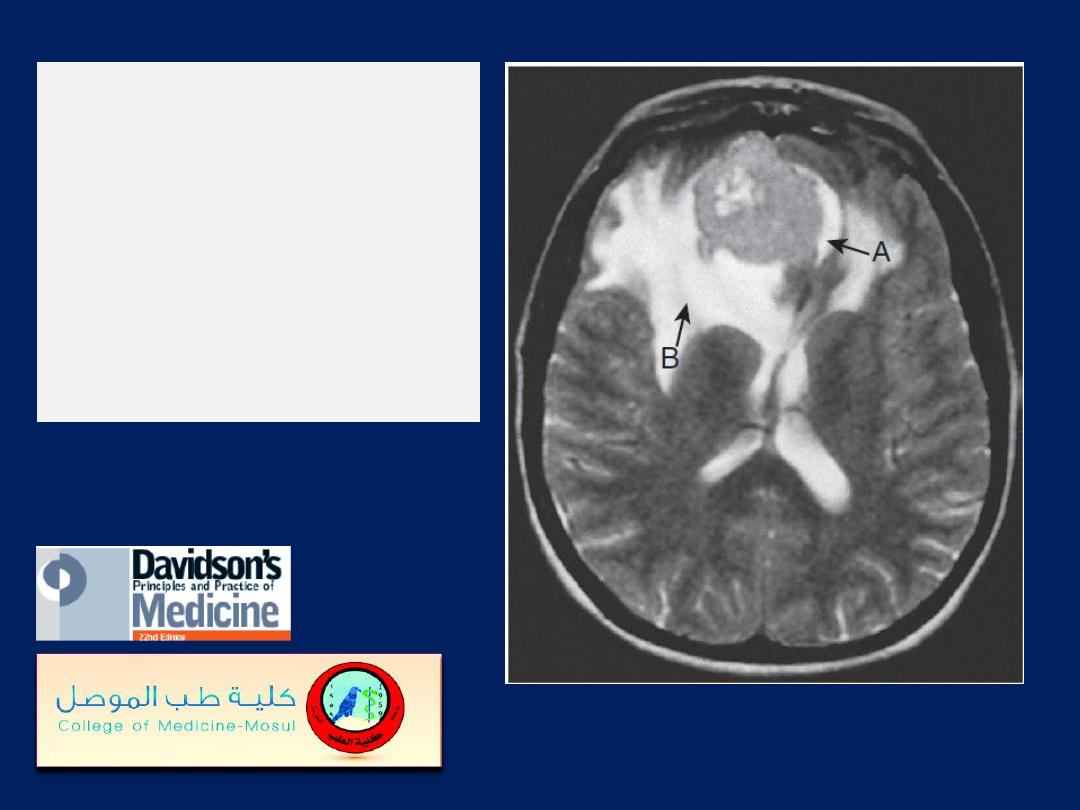
MRI showing
a meningioma
in the
frontal lobe
(arrow A) with
associated oedema
(arrow B).
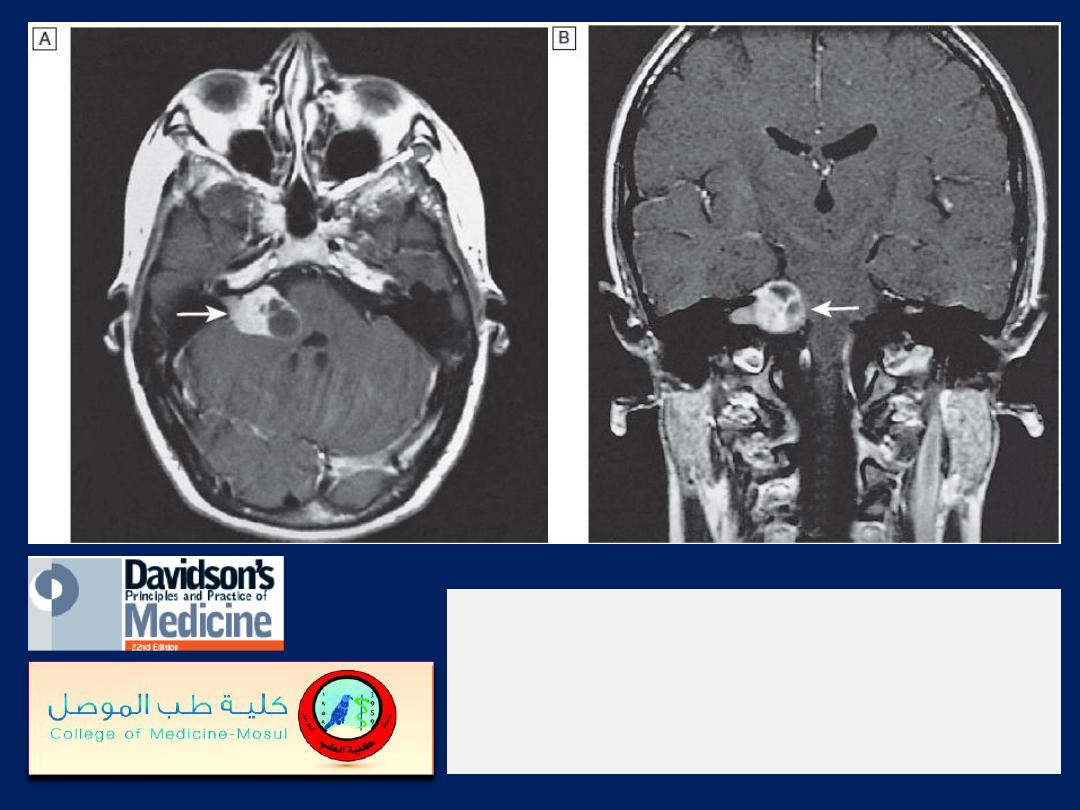
MRI of an acoustic neuroma
(arrows) in
the posterior fossa compressing the
brainstem.
A Axial image. B Coronal image.
Contrast-enhanced CT head
showing a large
metastasis within the left
hemisphere (large arrow).
There is surrounding cerebral
oedema, and a smaller
metastasis (small arrow)
within the wall of the right
lateral ventricle.
The primary lesion was a
lung carcinoma.
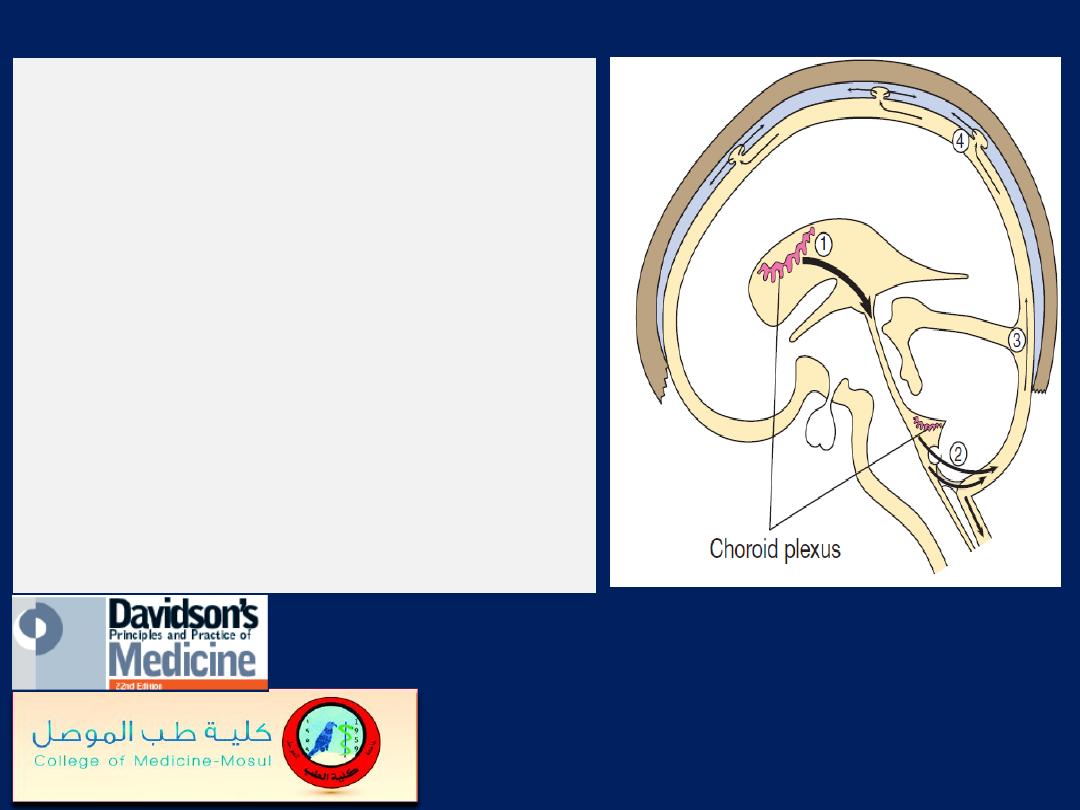
The circulation of cerebrospinal fluid.
(1)
CSF is synthesised in the choroid
plexus of the ventricles, and flows from
the lateral and third ventricles through
the aqueduct to the fourth ventricle.
(2)
At the foramina of Luschka and
Magendie it exits the brain, flowing
over the hemispheres
(3)
and down around the spinal cord
and roots in the subarachnoid space.
(4)
It is then absorbed into the dural
venous sinuses via the arachnoid villi.
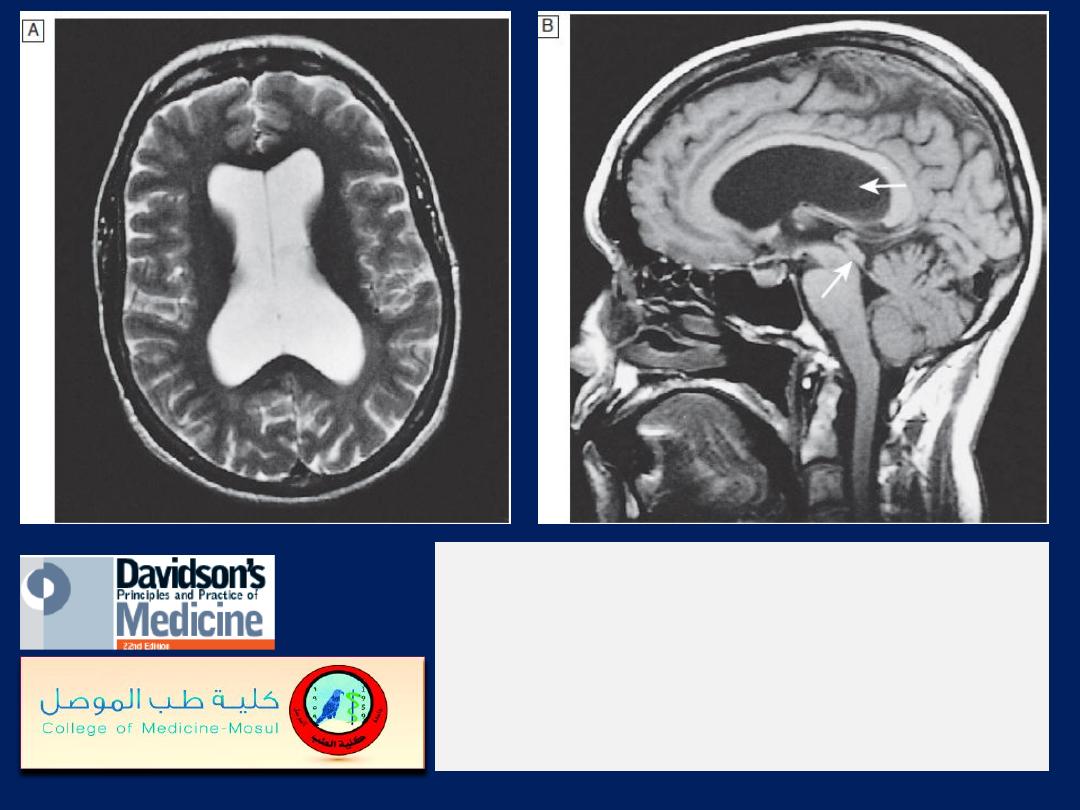
MRI of hydrocephalus
due to aqueduct stenosis.
A
Axial T2-weighted image (CSF appears white):
note the dilated lateral ventricles.
B
Sagittal T2-weighted image (CSF appears
black): note the dilated ventricles (top arrow) and
narrowed aqueduct (bottom arrow).
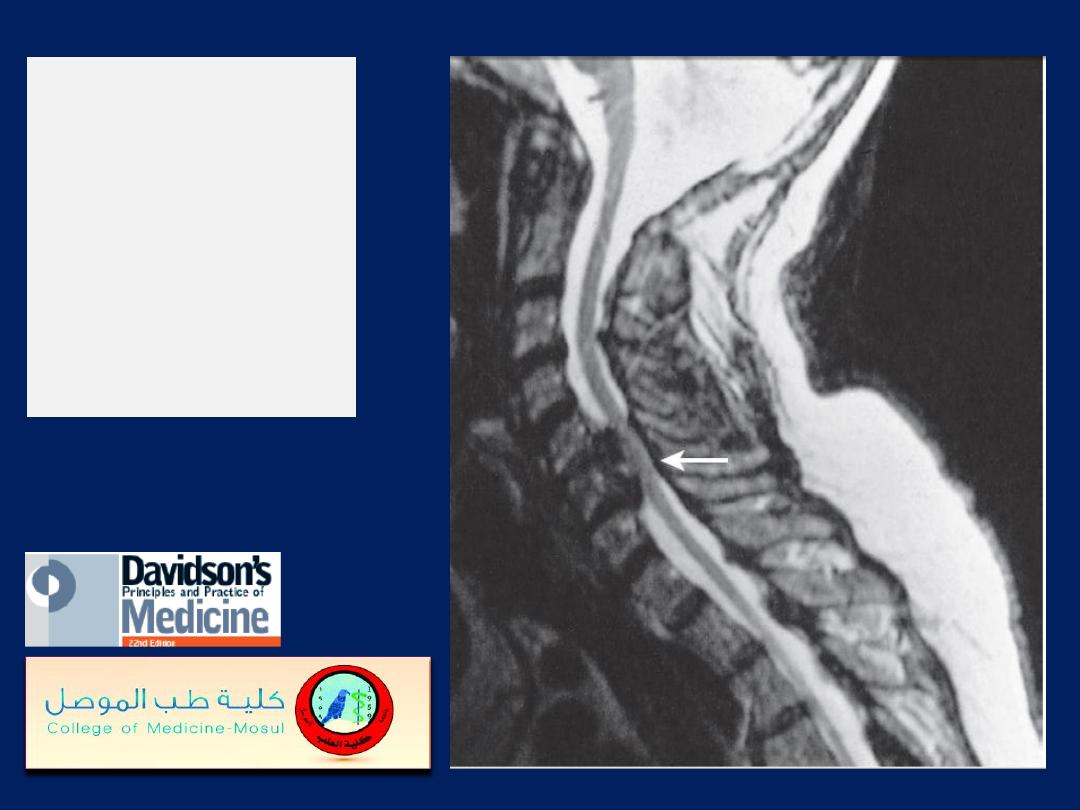
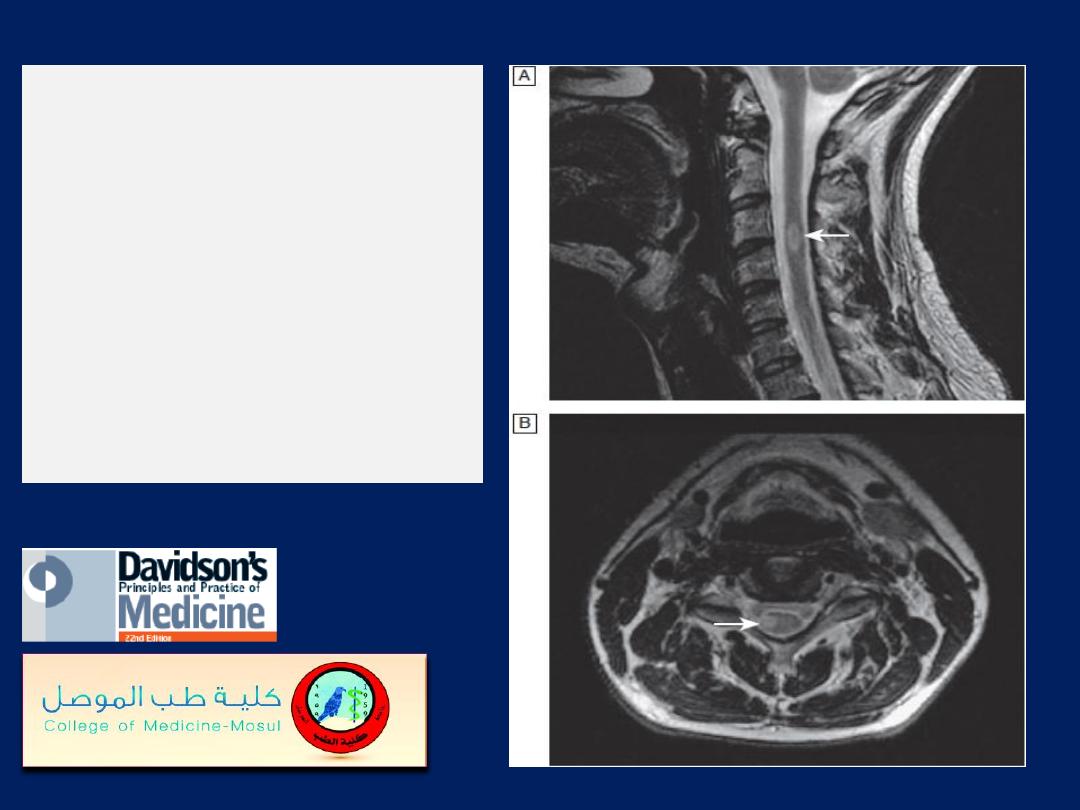
MRI showing
cervical cord
compression
(arrow) in
cervical
spondylosis.