
ESTIMATION

Objectives
By the end of this lecture you will be able to:
1. Define estimation & confidence level
2. List the types of estimation
3. Compute the estimated parameters

STATISTICAL INFERENCE
• It is the procedure where
inference about a population is
made on the basis of the results
obtained from a sample drawn
from that population

STATISTICAL INFERENCE
• This can be achieved by :
Hypothesis testing
Estimation: Point estimation
Interval estimation

Estimation
• If the
mean and the variance
of a
normal distribution are
known
, then
the probabilities of various events can
be determined.
• But almost always these values are
not known
, and we have to estimate
these
numerical
values
from
information of a simple random
sample

Estimation
• The
process
of
estimation
involves calculating from the data
of a sample , some “statistic”
which is an approximation of the
corresponding “parameter” of the
population from which the sample
was drawn

POINT ESTIMATION
• It is a
single
numerical value
obtained from a random sample
used to
estimate the corresponding
population parameter
_
• Sample
mean (X)
is the best point
estimate for
population mean(µ
)

POINT ESTIMATION
• Sample
standard deviation (s)
is the
best point estimate for
population
standard deviation (σ )
~
• Sample
proportion ( P)
is the best point
estimator for
population proportion (P)

• But, there is always a sort of sampling error
that can be measured by the
Standard Error
of the mean
which relates to the precision
of the estimated mean
• Because of sampling variation we can not
say that the exact parameter value is some
specific number, but we
can determine a
range of values within which we are
confident the unknown parameter lies

INTERVAL ESTIMATION
• It consists of
two
numerical
values defining an
interval within
which
lies
the
unknown
parameter we want to estimate
with a specified degree of
confidence

INTERVAL ESTIMATION
• The values depend on the
confidence
level which is equal to 1-α
(
α is the
probability of error)
• The interval estimate may be expressed
as:
Estimator ± Reliability coefficient X
standard error
INTERVAL ESTIMATION
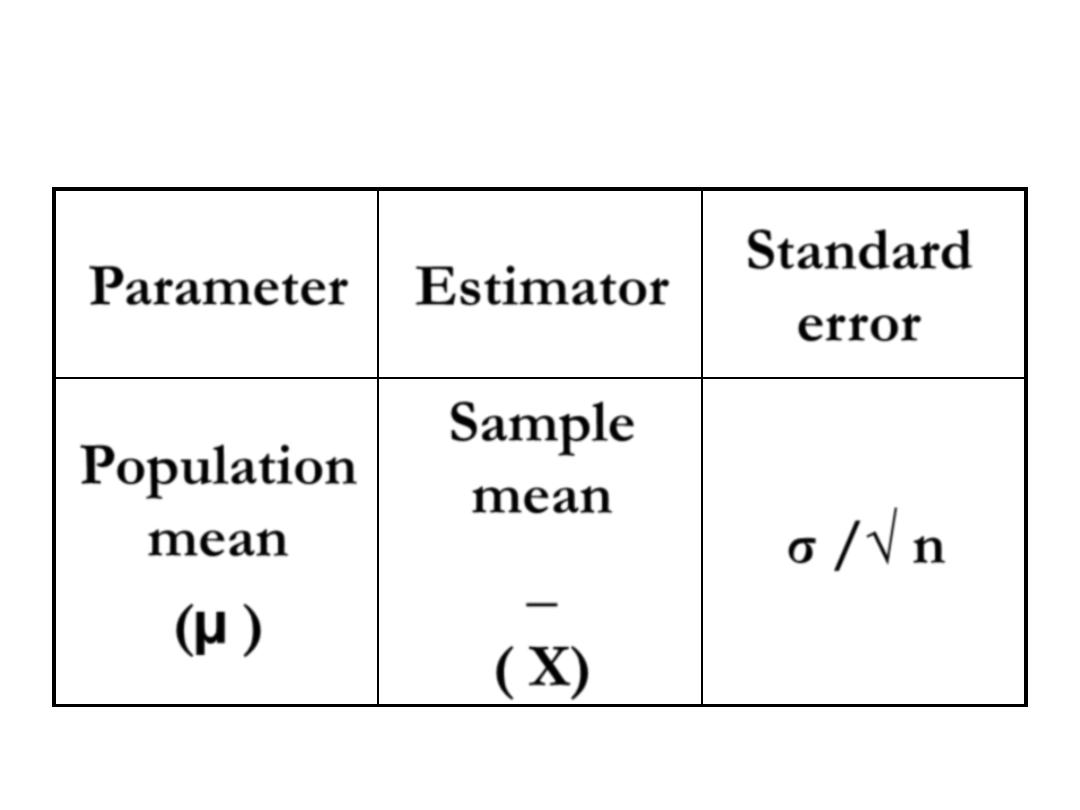
Standard
error
Estimator
Parameter
σ /√ n
Sample
mean
_
( X)
Population
mean
(µ )
INTERVAL ESTIMATION
Standard error
Estimator
Parameter
√(σ
2
1
/n
1
)
+
(σ
2
2
/n
2
)
Difference
between two
sample
means
_ _
( X
1
-X
2
)
Difference
between two
population
means
(µ
1
-µ
2
)
INTERVAL ESTIMATION
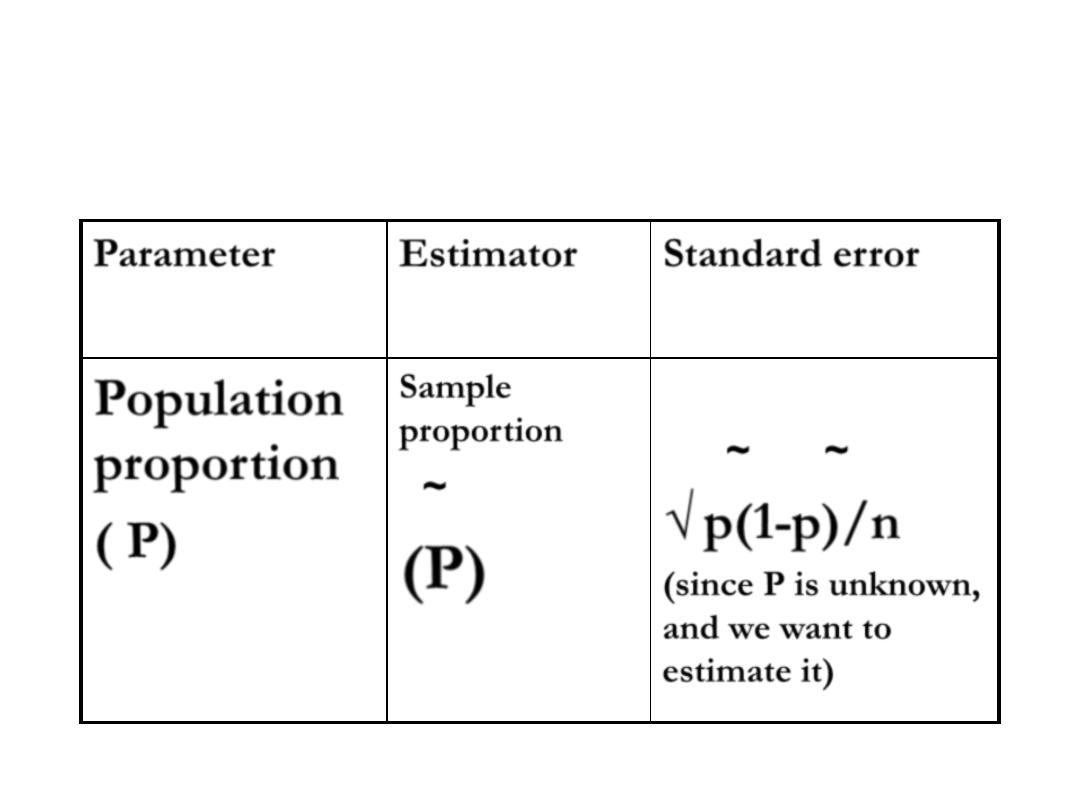
Standard error
Estimator
Parameter
~ ~
√
p(1-p)/n
(since P is unknown,
and we want to
estimate it)
Sample
proportion
~
(P)
Population
proportion
( P)
INTERVAL ESTIMATION
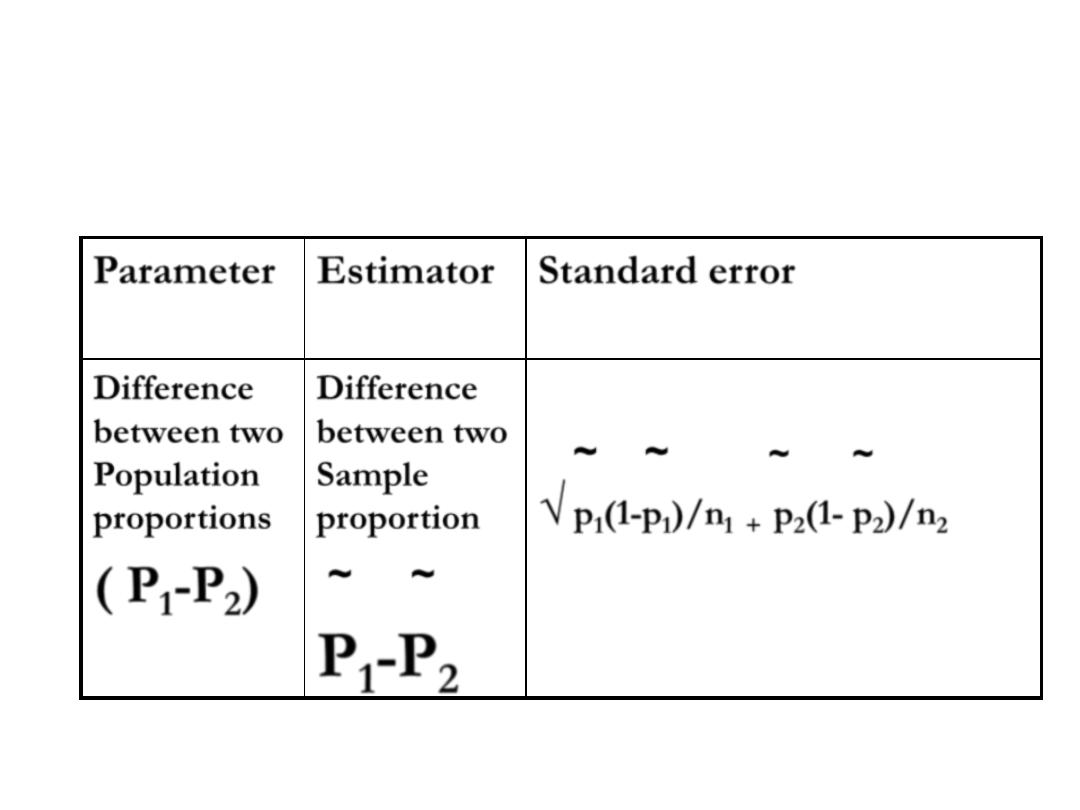
Standard error
Estimator
Parameter
~
~ ~
~
√
p
1
(1-p
1
)/n
1
+
p
2
(1- p
2
)/n
2
Difference
between two
Sample
proportion
~ ~
P
1
-P
2
Difference
between two
Population
proportions
( P
1
-P
2
)
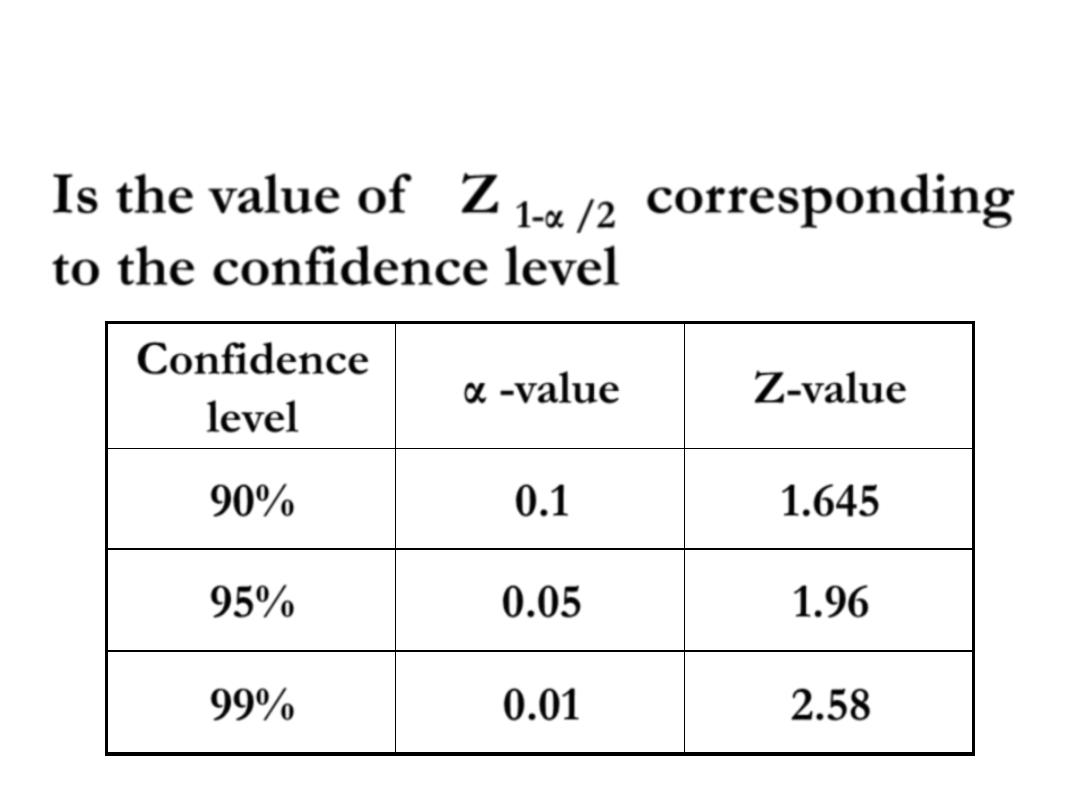
Reliability Coefficient
Z-value
α -value
Confidence
level
1.645
0.1
90%
1.96
0.05
95%
2.58
0.01
99%
Is the
value of Z
1-α /2
corresponding
to the confidence level

Confidence Interval
• The Confidence Interval is
central and
symmetric
around the sample mean ,
so that there is
(α/2 %)
chance that the
parameter is more than the upper limit,
and (α/2 % ) chance that it is less than
the lower limit

The
width of the interval
estimation is
increased
by:
•
Increasing confidence level
(i.e.:
decreasing alpha
value)
•
Decreasing sample size

Confidence level can shade the light on the
following information:
1.The
range
within which the true value of the
estimated parameter lies
2.The statistical significance of a difference ( in
population means or proportions).
If the
ZERO value is included in the interval
of
such differences( i.e.: the range lies between a
negative value and a positive value), then we can
state that there is
no statistically significant
difference
between the two population values
(parameters),
although
the
sample
values
(statistics) showed a difference

3.The sample size.
A
narrow interval indicates a “large”
sample
size, while a wide interval
indicates a “small” sample size (with
fixed confidence level)