PROBABILITY
DISTRIBUTION
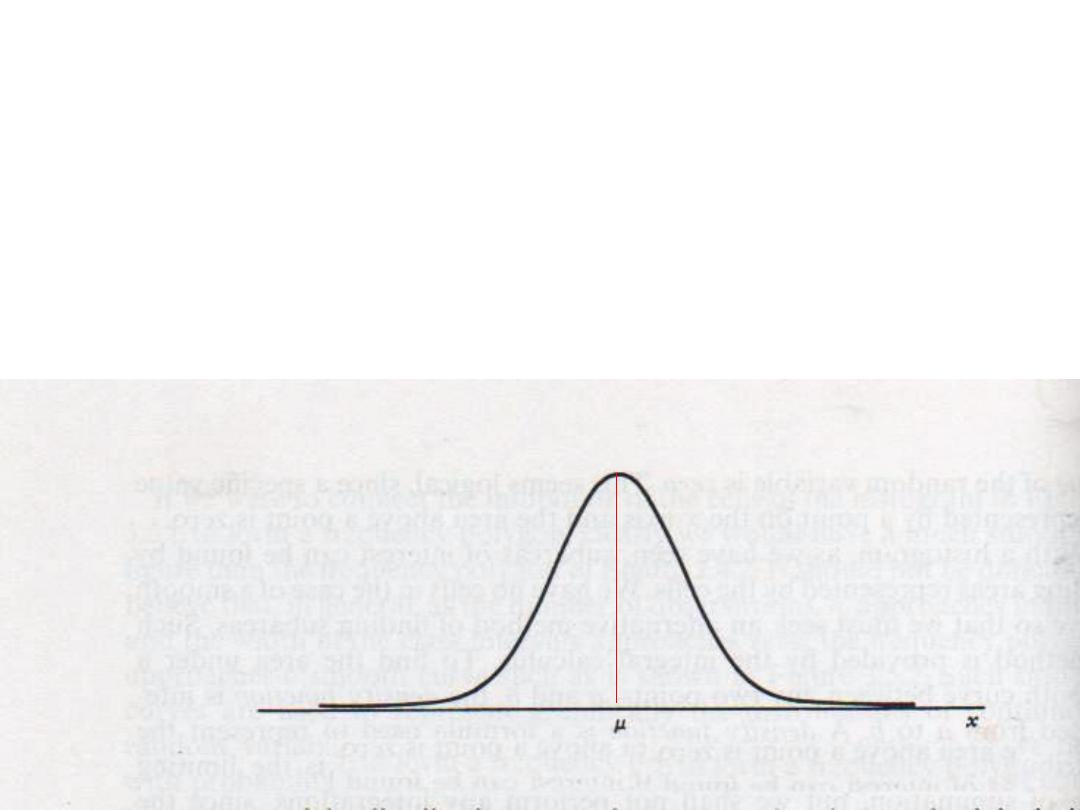
Probability distribution of
a continuous variable
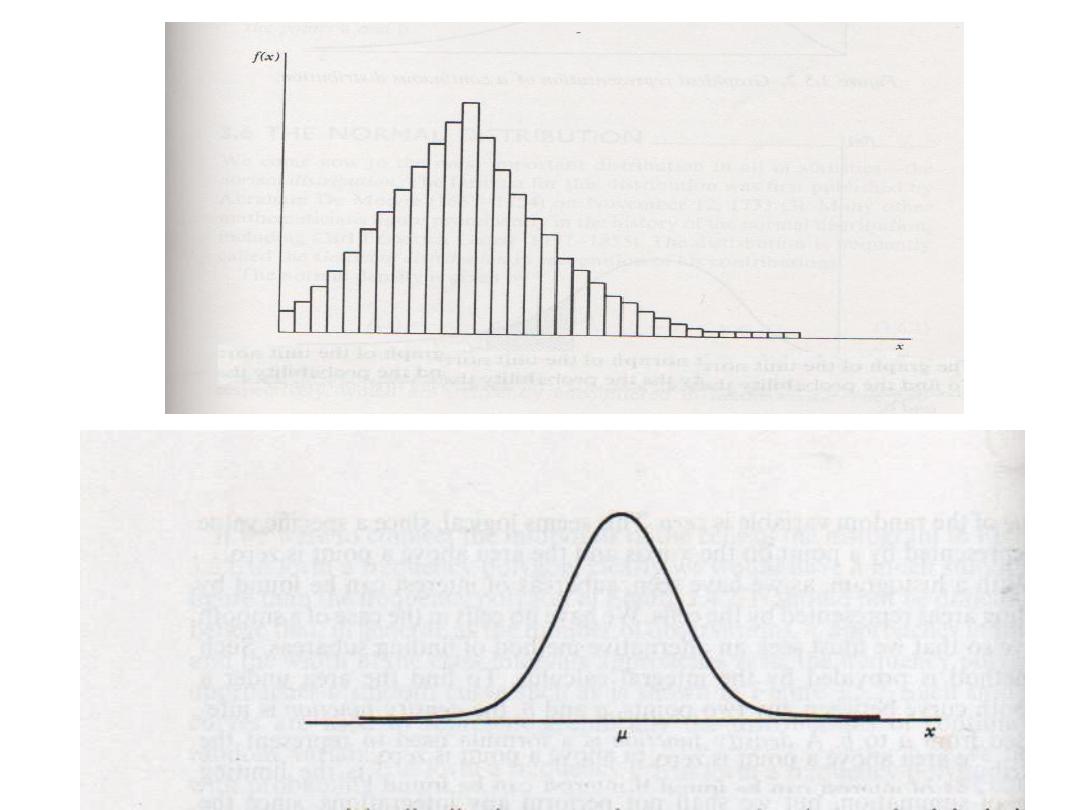
The Normal Distribution
“Gaussian Distribution
”
• Is a theoretical model that has been found to fit many
naturally occurring phenomena.
• It is the most important distribution in statistics
• The parameters in this distribution are the:
• Population mean (µ) as a measure of central tendency
• Population standard deviation (σ) as a measure of
dispersion
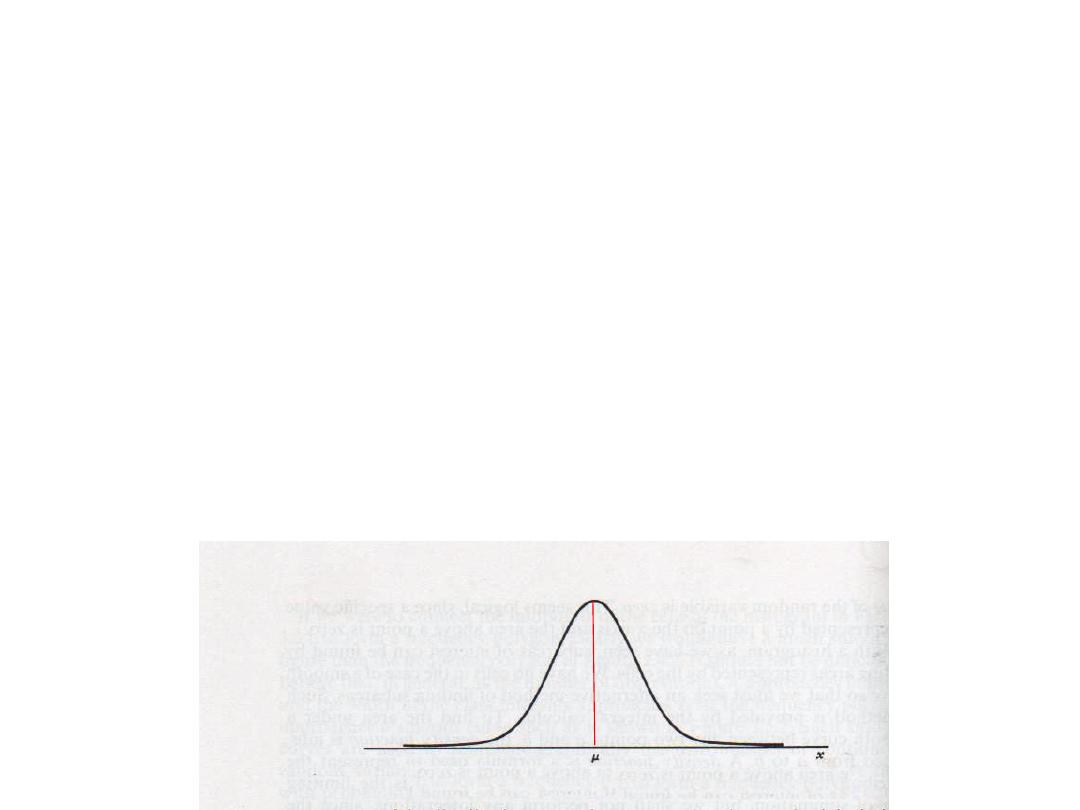
The Normal Distribution
“Gaussian Distribution”
• It is used for continuous variables
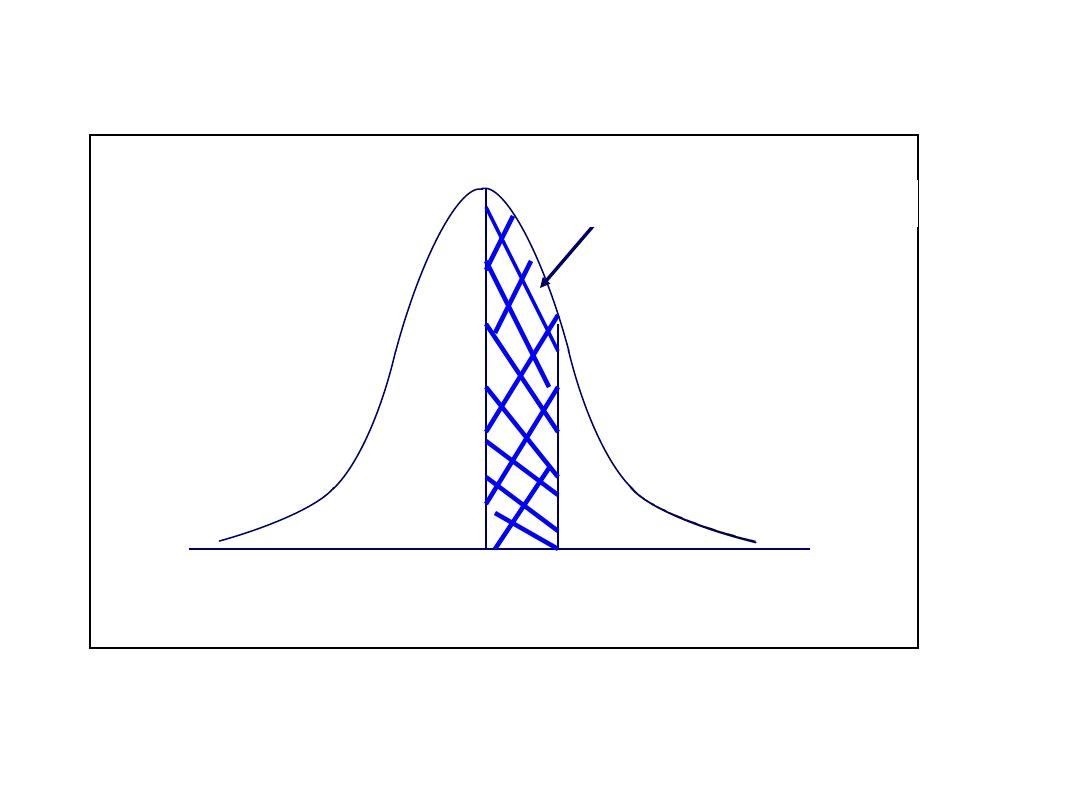
• The curve is symmetric around the mean
• The total area under the curve equal one
• The mean, median, and the mode are equal
Mean=Median=Mode
Total P=1
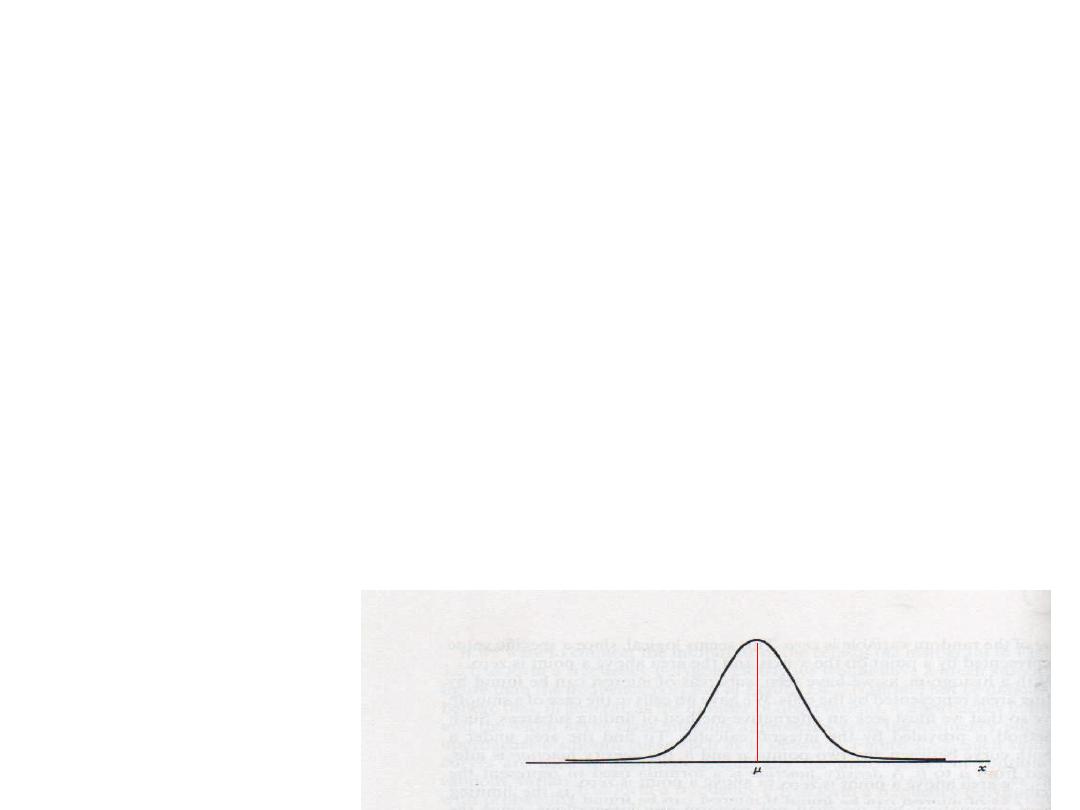
The Normal Distribution
“Gaussian Distribution”
• 50% of the area under the curve is on the right
side of the curve and the other 50% is on its
left
50%
50%
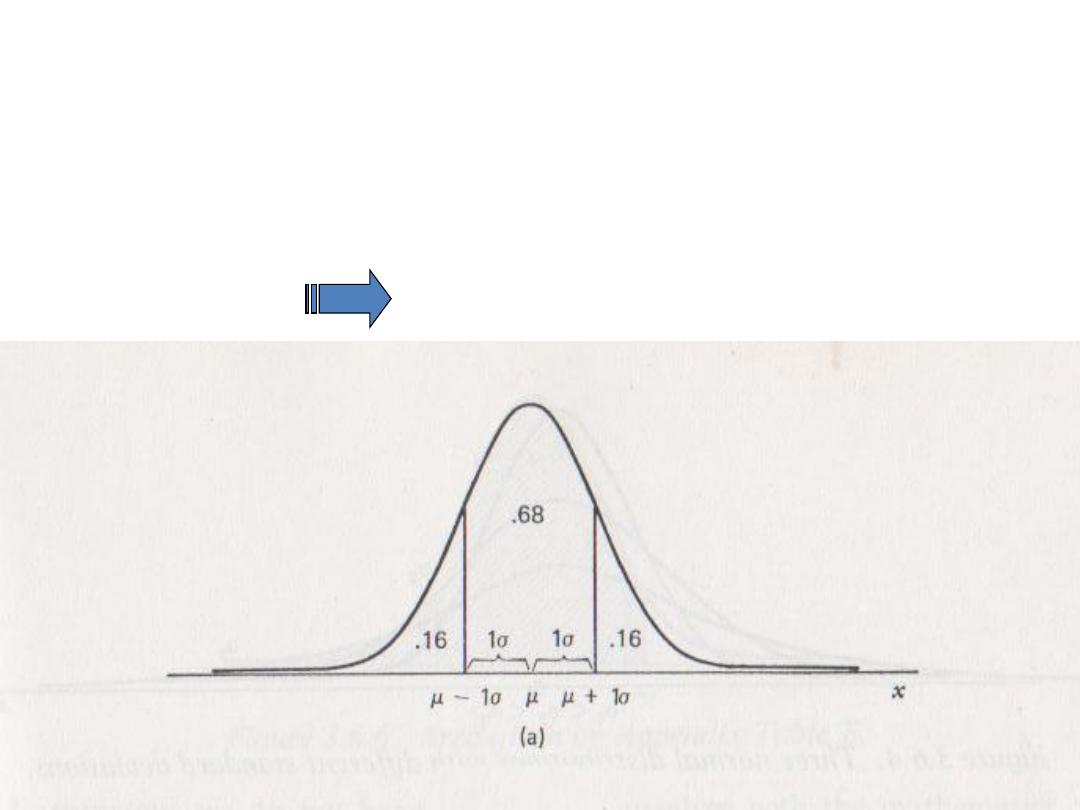
The Normal Distribution
“Gaussian Distribution”
• µ ± 1 σ 68% of the area
The Normal Distribution
“Gaussian Distribution”
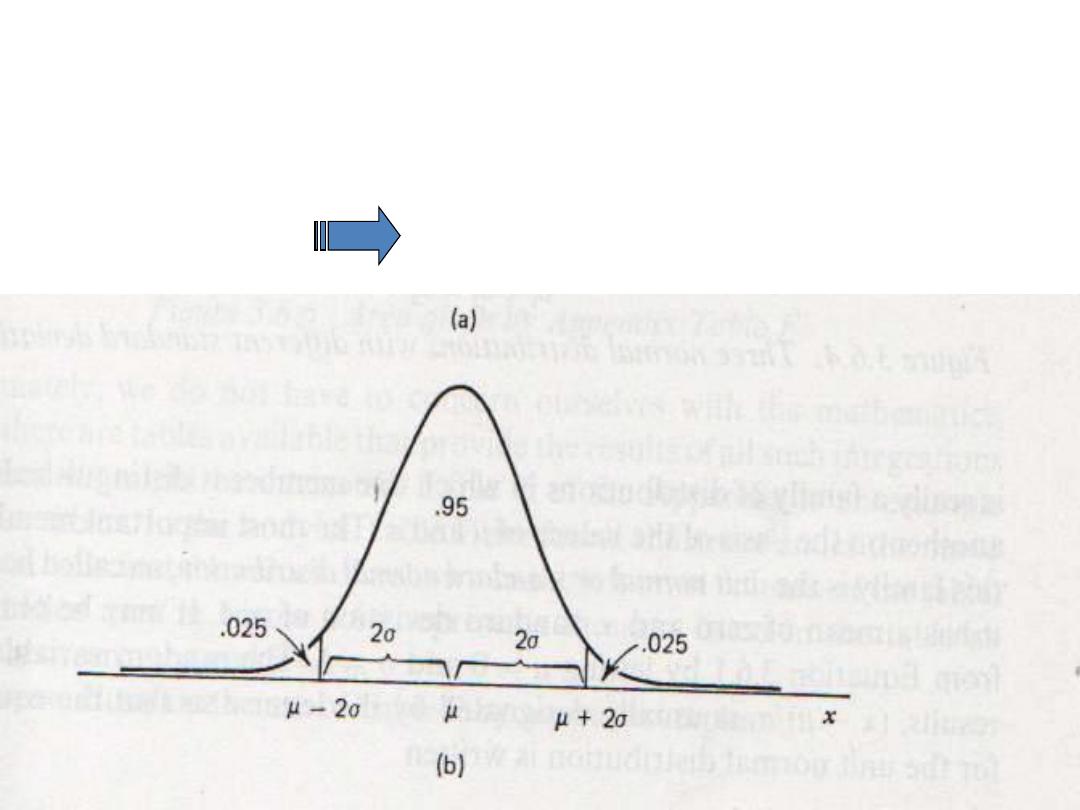
• µ ± 2 σ 95% of the area
The Normal Distribution
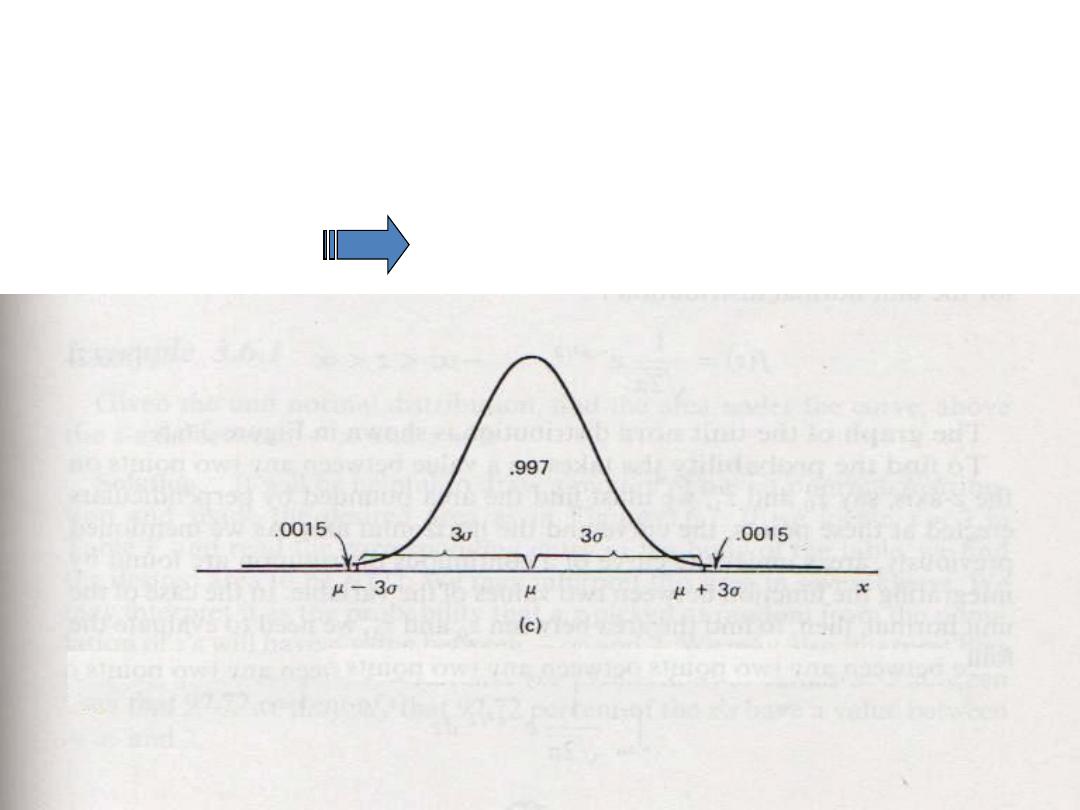
“Gaussian Distribution”
• µ ± 3 σ 99.7% of the area
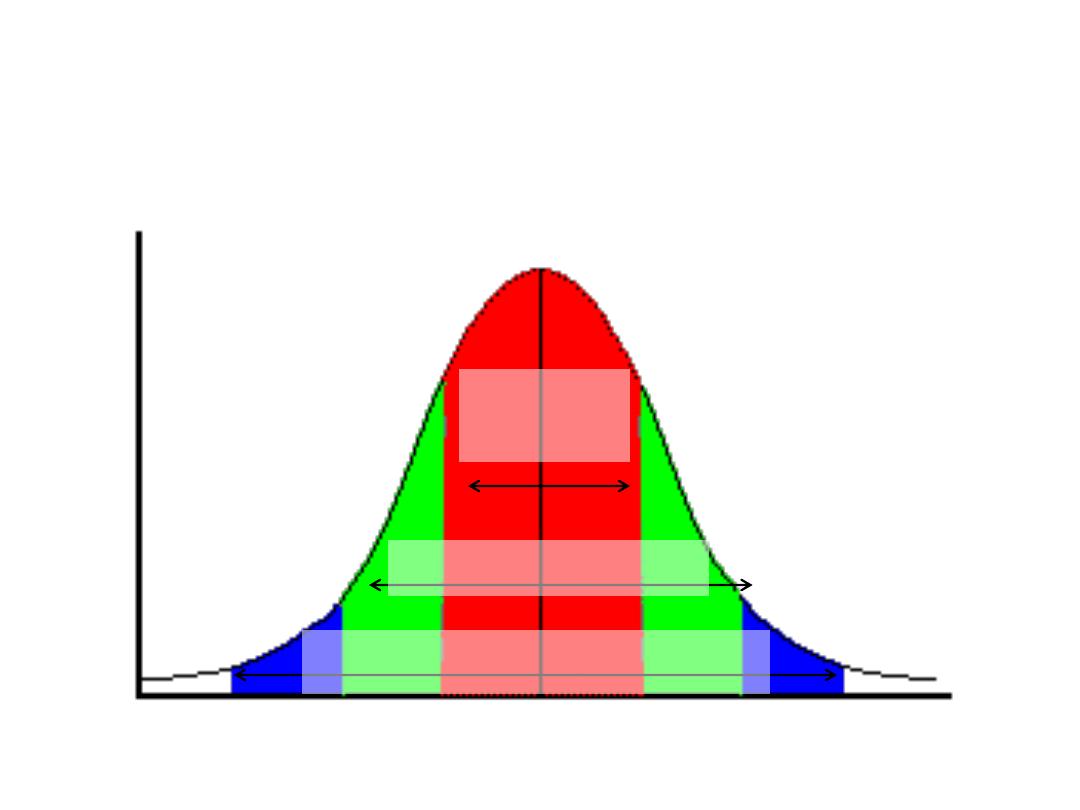
68% of
the data
95% of the data
99.7% of the data
The Normal Distribution
“Gaussian Distribution”
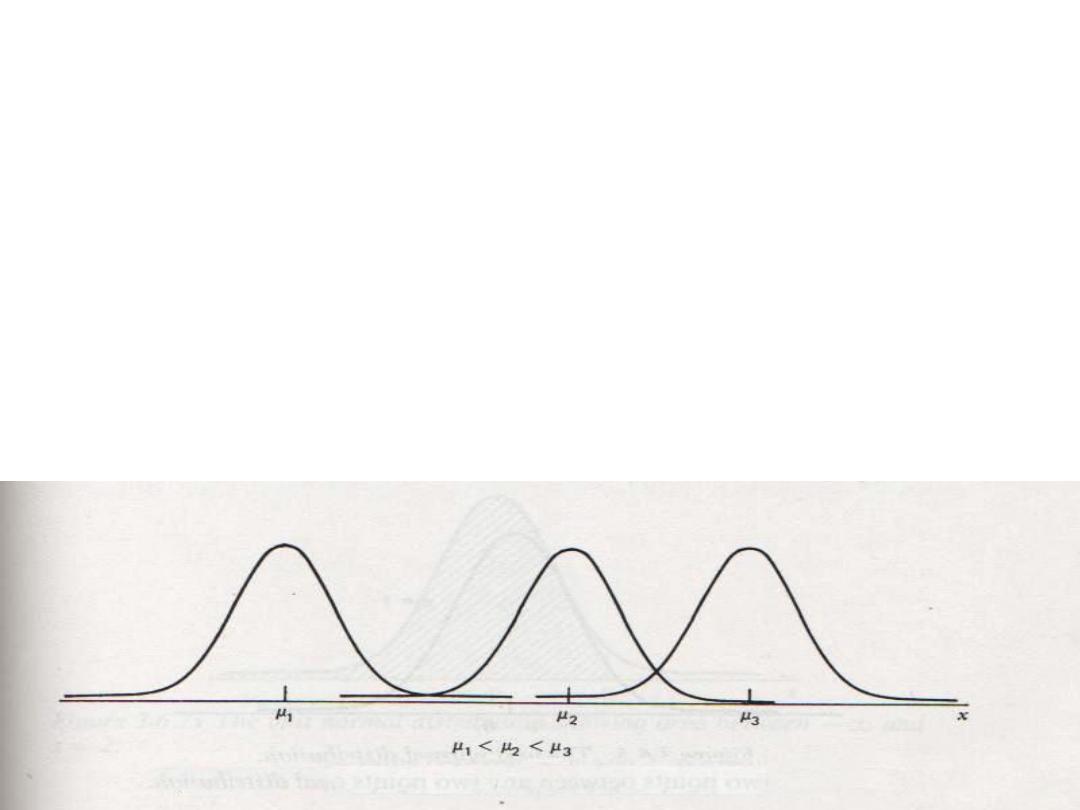
• Different values of
µ
will
shift the graph of the distribution
along the X axis
• With fixed (σ) any change in (µ) will not change the shape of
the curve, but it will be shifted to:
the right ( when µ is increased)
or to the left (when µ is decreased)
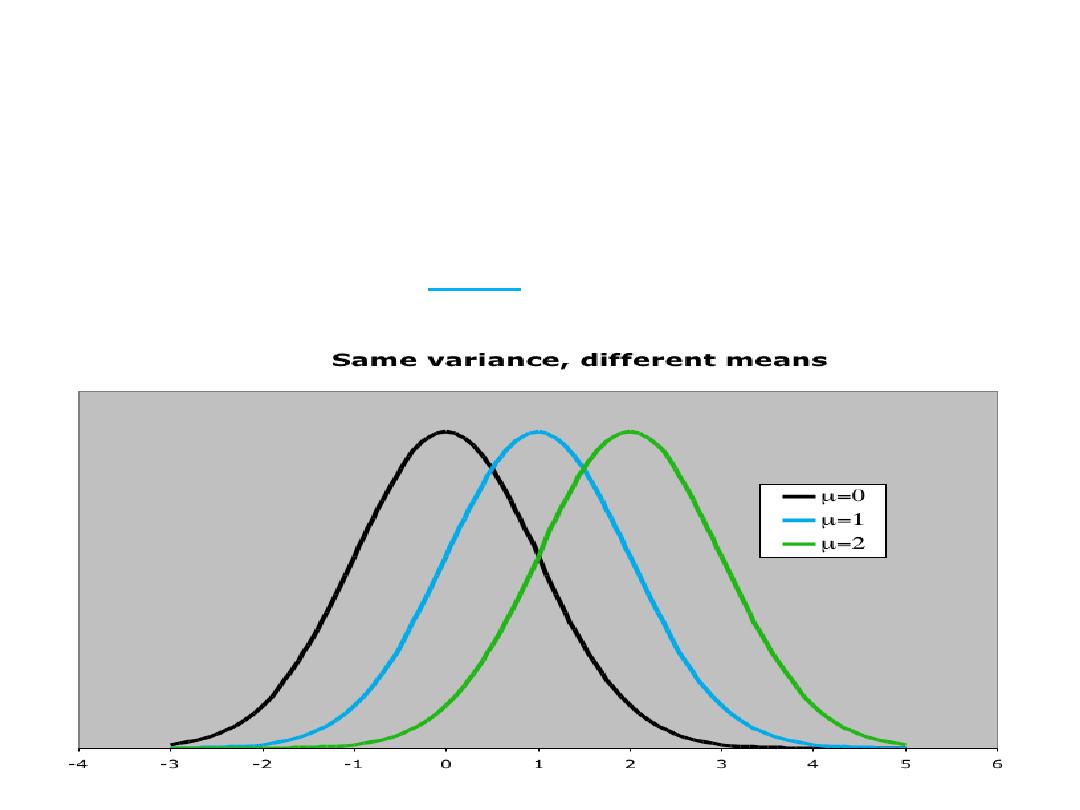
Normal Distribution…
The normal distribution is described by two parameters:
its mean and its standard deviation
Increasing the mean shifts the curve to the right
8.11
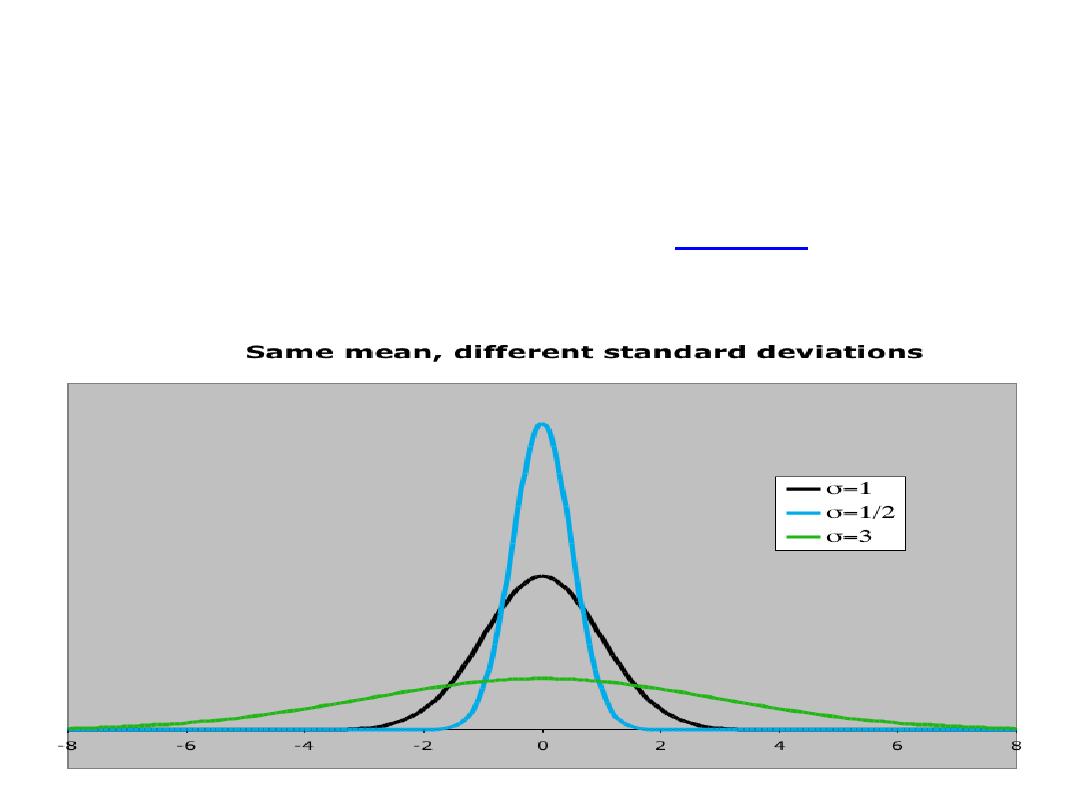
The Normal Distribution
“Gaussian Distribution”
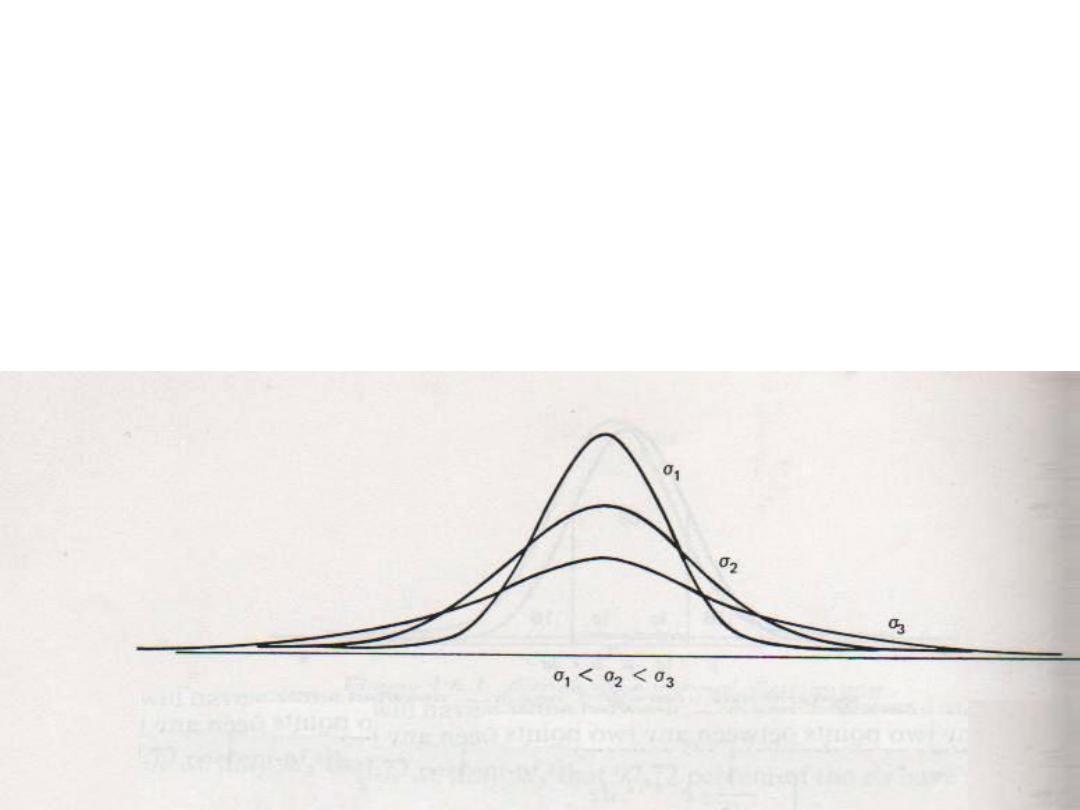
• Different values of (σ) determine the degree of flatness or
peakedness of the graph of the distribution
• When (σ) is increased the curve will be more flat
• When (σ) is decreased the curve will be more peaked

The Normal Distribution
“Gaussian Distribution”
• Different values of
(σ)
determine the degree
of flatness or peakedness of the graph of the
distribution
• When
(σ)
is increased the curve will be more
flat
• When
(σ)
is decreased the curve will be
more peaked
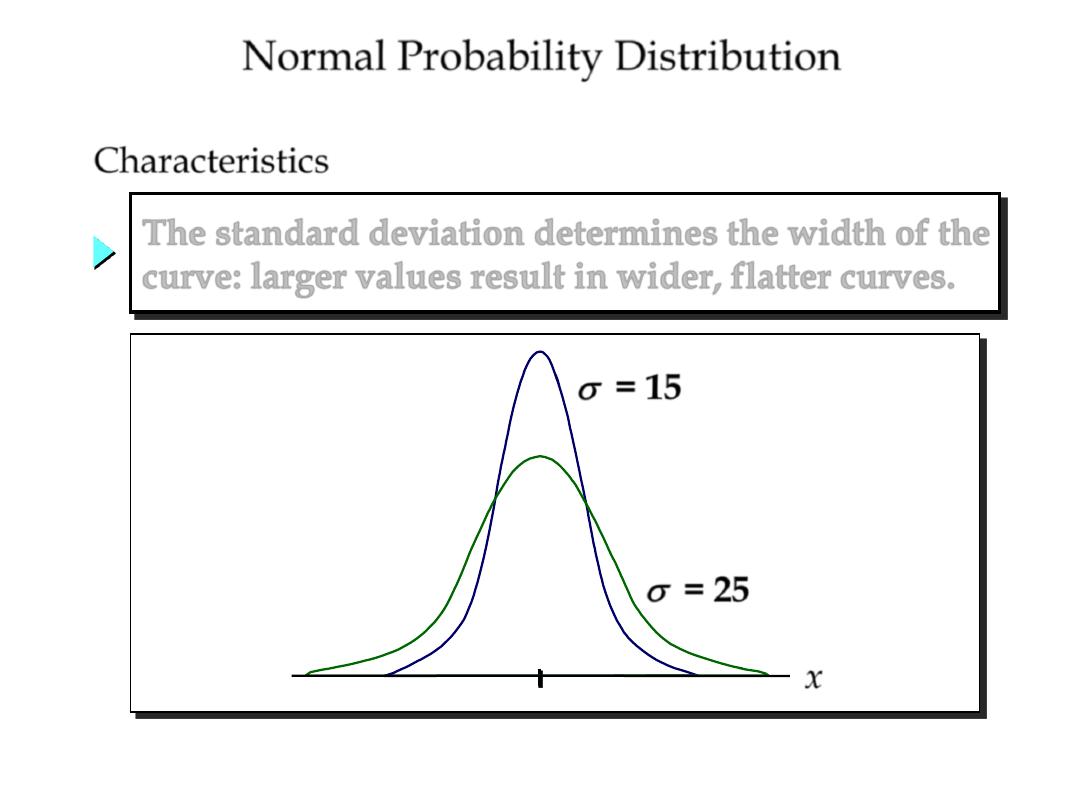
Normal Probability Distribution
Characteristics
s
= 15
s
= 25
The standard deviation determines the width of the
curve: larger values result in wider, flatter curves.
x
Normal Distribution
The normal distribution is described by two parameters:
its mean and its standard deviation.
Increasing the standard deviation “flattens” the curve
8.15
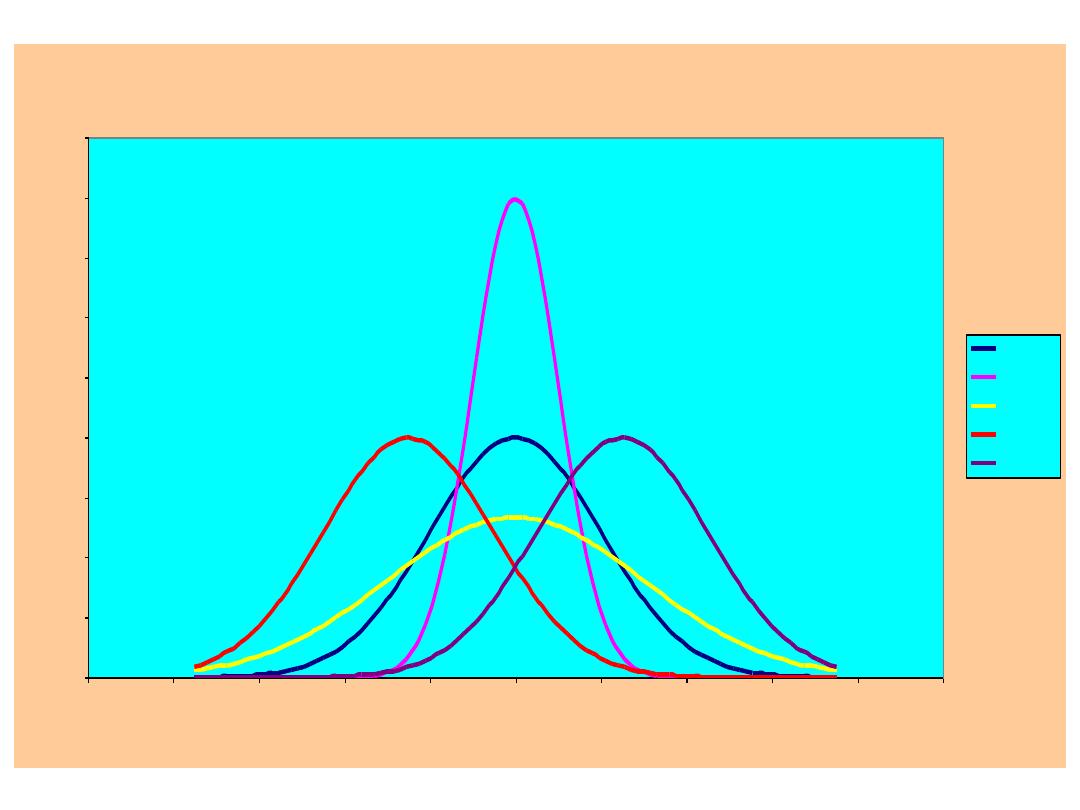
Normal Densities
0
0.005
0.01
0.015
0.02
0.025
0.03
0.035
0.04
0.045
0
20
40
60
80
100
120
140
160
180
200
y
f
(
y
)
N(100,400)
N(100,100)
N(100,900)
N(75,400)
N(125,400)
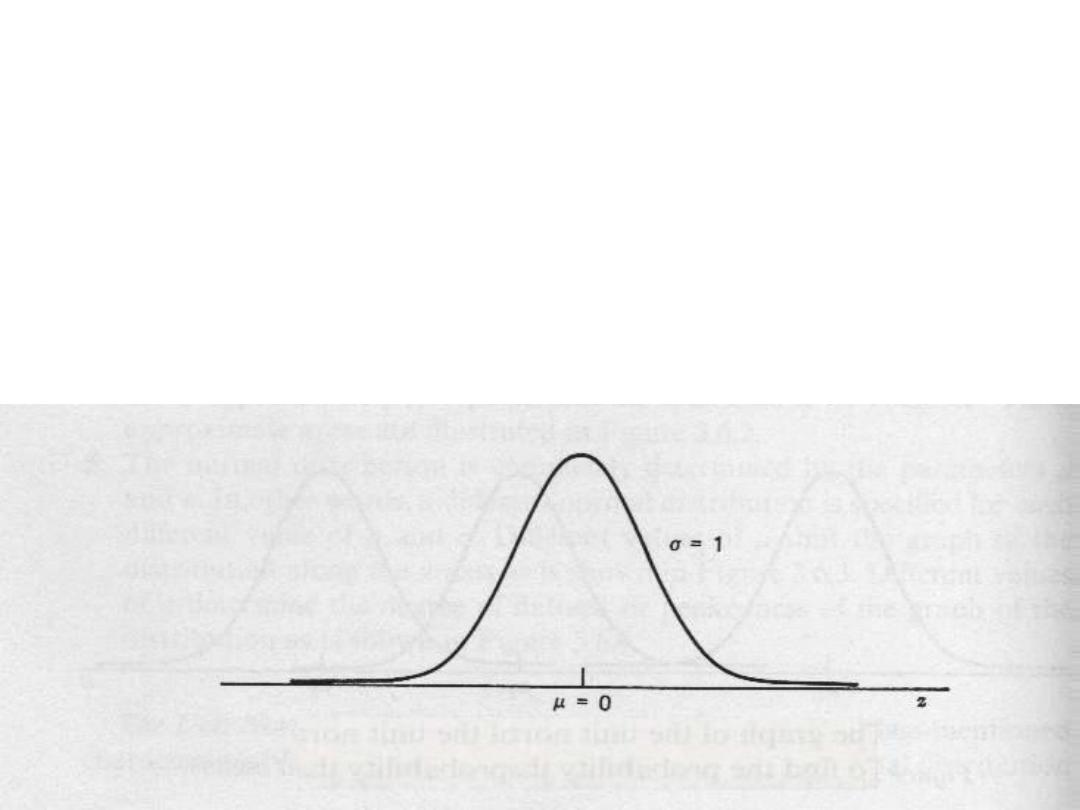
The unit normal , or the Standard normal
distribution
X- µ
Z= ---------
σ
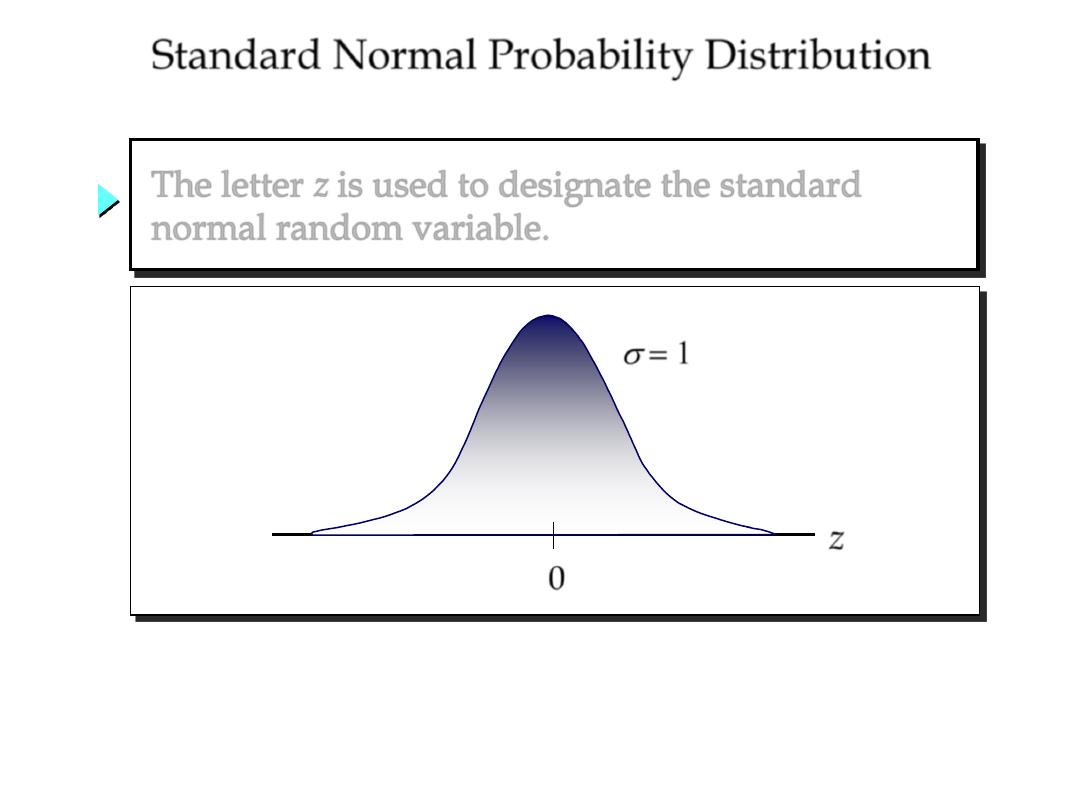
s
= 1
0
z
The letter z is used to designate the standard
normal random variable.
Standard Normal Probability Distribution
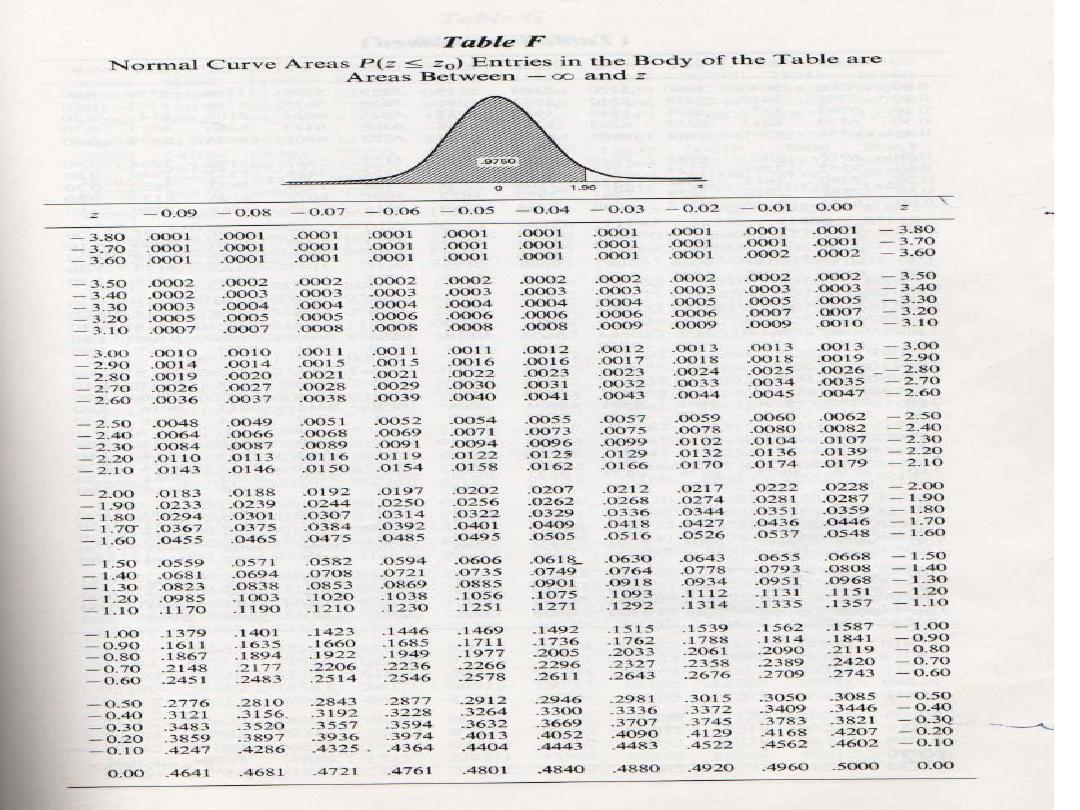
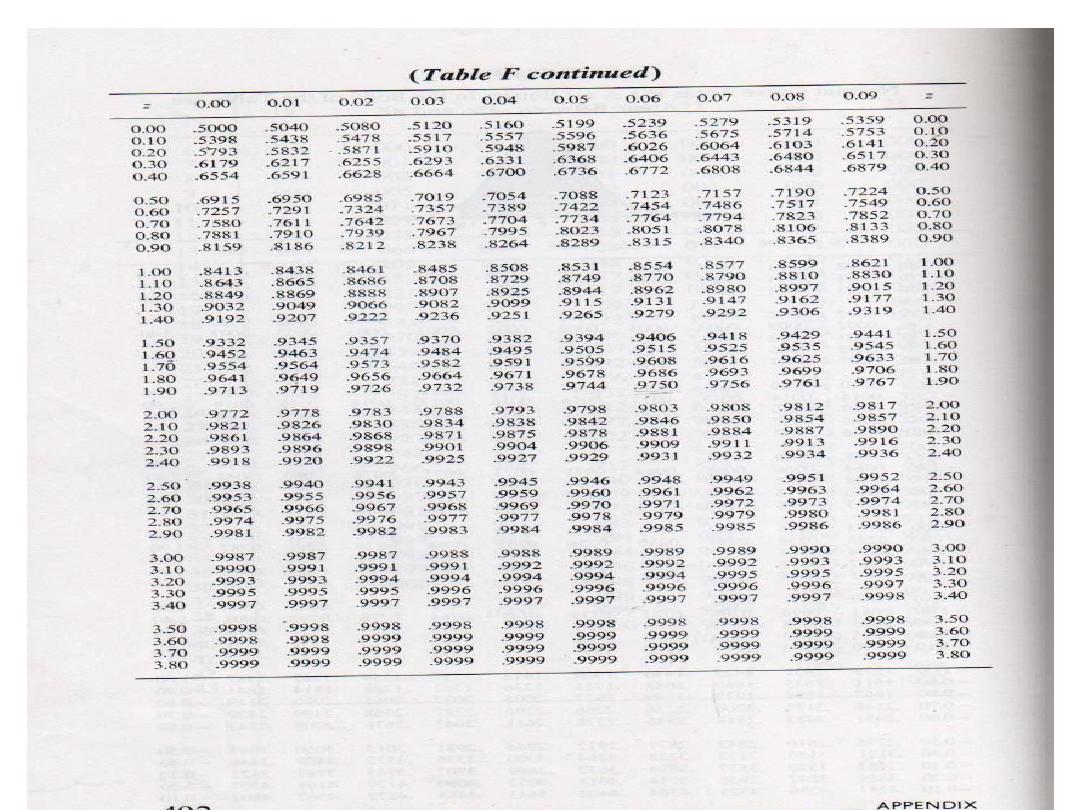
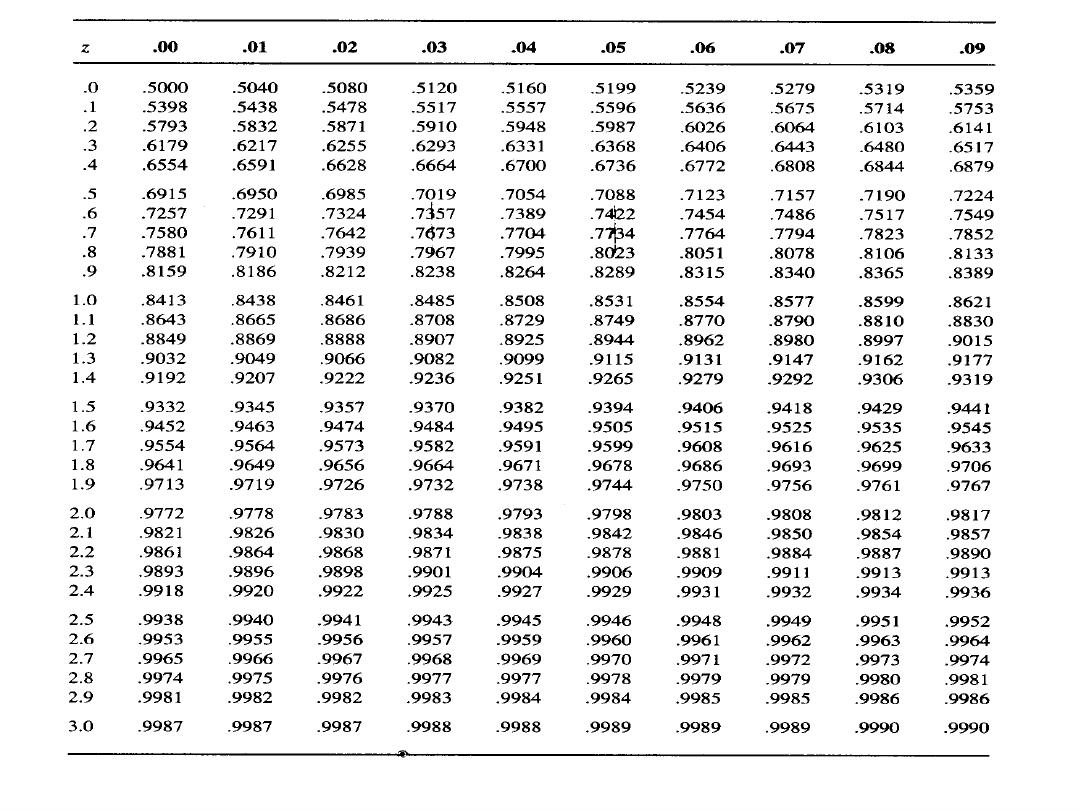
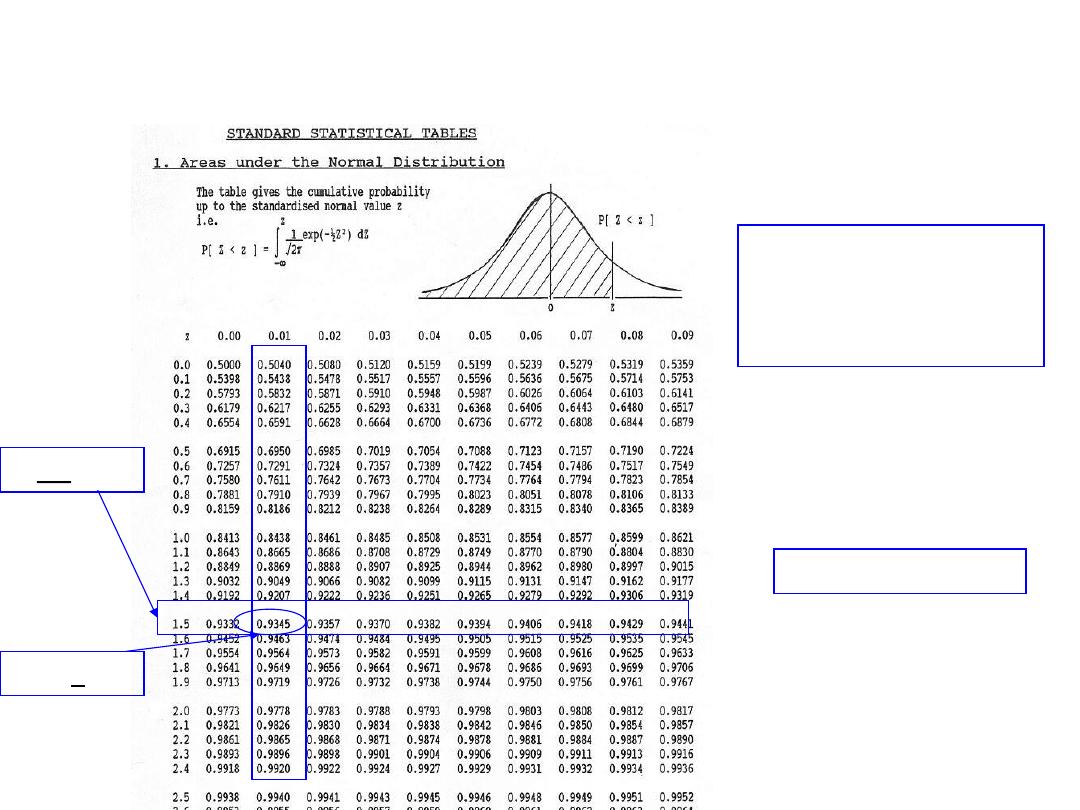
Calculating probabilities in standard normal table
What is the area to the
left of Z=1.51 in a
standard normal curve?
Z=1.51
Z=1.51
Area is 93.45%
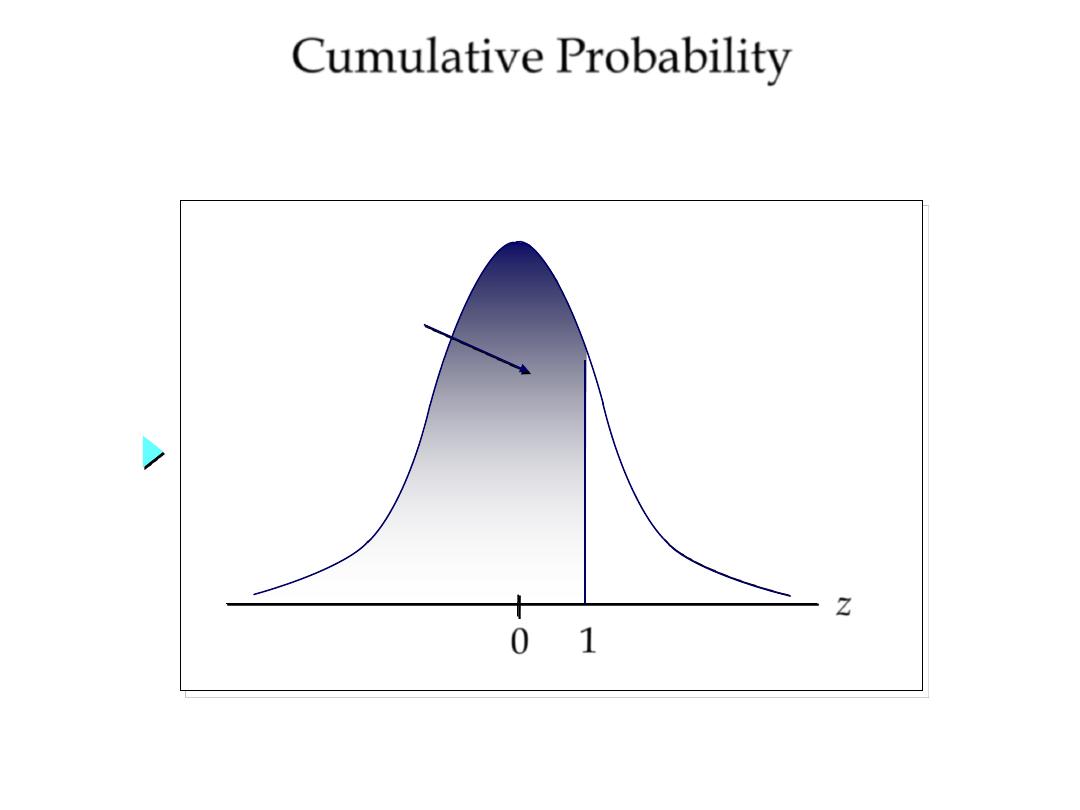
Cumulative Probability
0 1
z
)
1
(
z
P
Probability that z ≤ 1 is the area under the curve to
the left of 1.
Exercise 1
2.46
A. What is P(z ≤2.46)?
B. What is P(z ≥2.46)?
Answer:
A. 0.9931
B. 1-0.9931=.0069
z
Exercise 2
)
29
.
1
(
1
)
29
.
1
(
=
z
P
z
P
-1.29
A. What is P(z ≤-1.29)?
B. What is P(z ≥-1.29)?
Answer:
A. 1-.9015=.0985
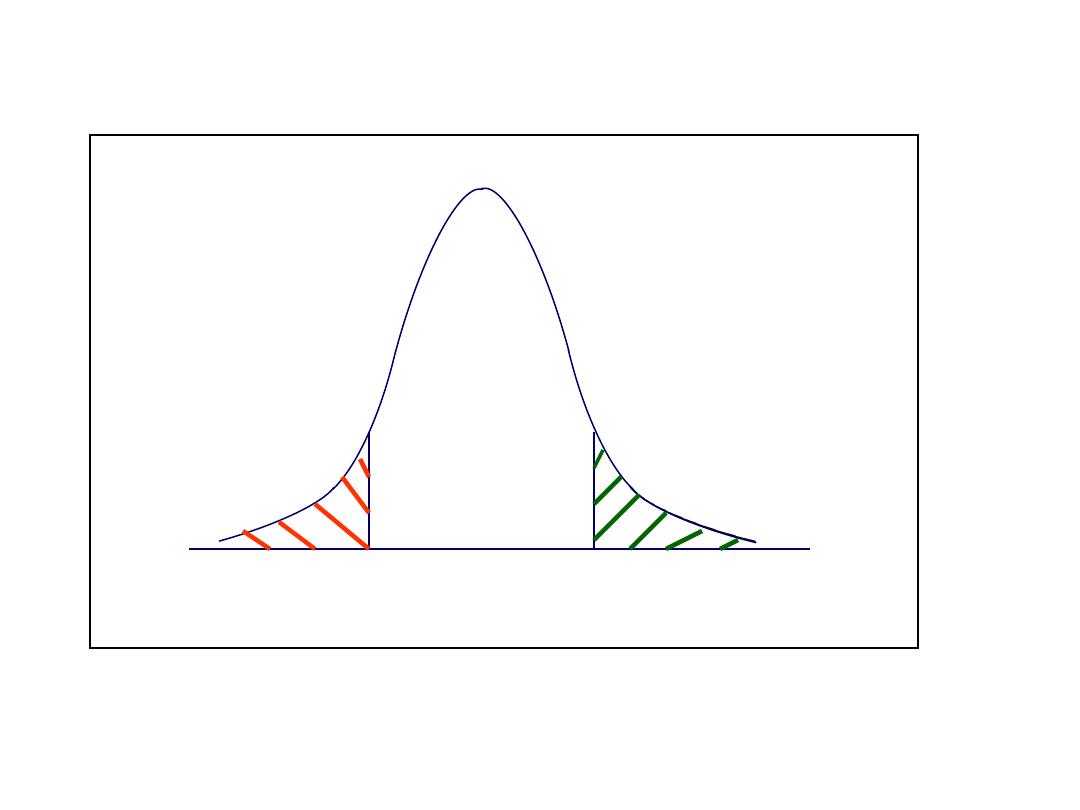
B. 0.9015
Note that, because of the symmetry, the area to the left of -1.29 is the
same as the area to the right of 1.29
1.29
Red-shaded
area is
equal to
green-
shaded
area
Note that:
z
Exercise 3
3413
.
5000
.
8413
.
)
0
(
)
1
(
)
1
00
(.
=
=
=
z
P
z
P
z
P
0
What is P(.00 ≤ z ≤1.00)?
1
.00 ≤ z ≤1.00)=.3413
z