
Community
Lect. 3
Total lect. 10
T-test
Dr. Jawad Al-Deewan
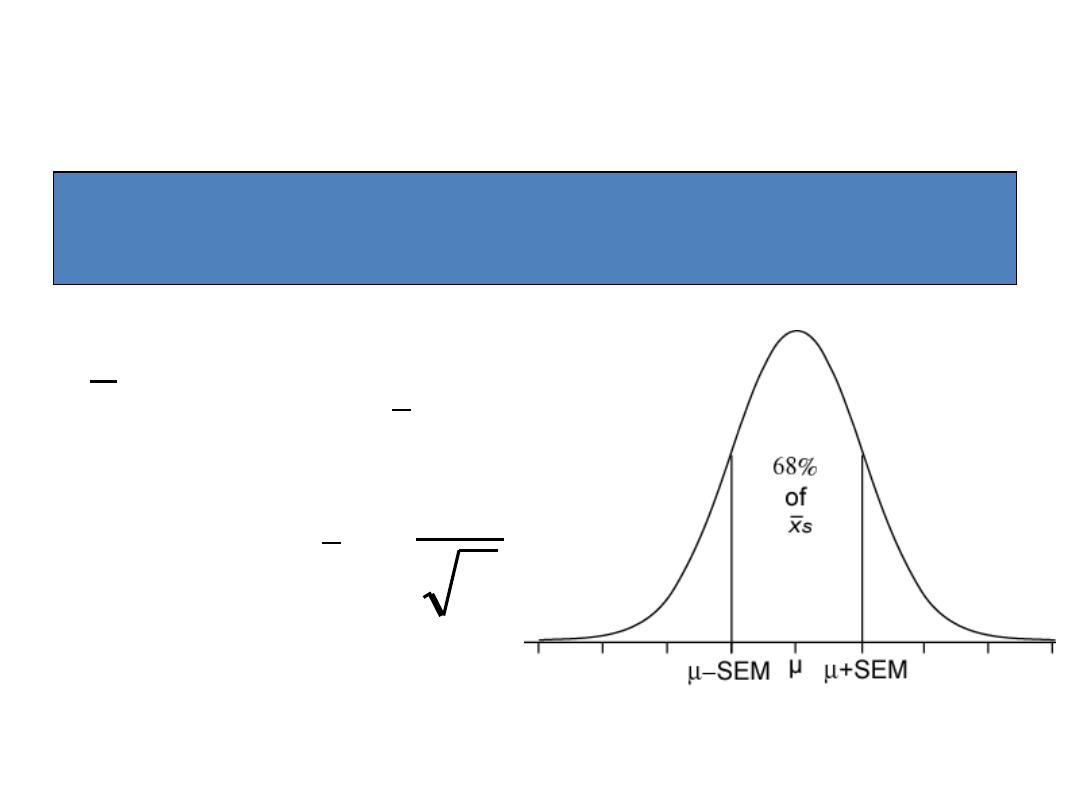
Sampling Distributions of a Mean
The sampling distributions of a mean (SDM)
describes the behavior of a sampling mean
n
SE
SE
N
x
x
x
where
,
~

Example: two-sample t-test
• In 1980, some researchers reported that “men have
more mathematical ability than women” as
evidenced by the 1979 SAT’s, where a sample of 30
random male adolescents had a mean score ± 1
standard deviation of 436±77 and 30 random female
adolescents scored lower: 416±81 (genders were
similar in educational backgrounds, socio-economic
status, and age). Do you agree with the authors’
conclusions?

Data Summary
n
Sample
Mean
Sample
Standard
Deviation
Group 1:
women
30
416
81
Group 2:
men
30
436
77

Two-sample t-test
1. Define your hypotheses (null, alternative)
H
0
: ♂-♀ math = 0
Ha: ♂-♀ math ≠ 0 [two-sided]
Two-sample t-test
2. Specify your null distribution:
F and M have similar standard
deviations/variances, so make a “pooled”
estimate of variance.
6245
58
81
)
29
(
77
)
29
(
2
)
1
(
)
1
(
2
2
2
2
2
m
n
s
m
s
n
s
f
m
p
)
30
6245
30
6245
,
0
(
~
58
30
30
T
F
M
4
.
20
30
6245
30
6245

Two-sample t-test
4. Calculate the p-value of what you observed
98
.
4
.
20
0
20
58
T
0.3311563454
5. Do not reject null! No evidence that men are better
in math ;)

9
Compare the Computed Test Statistic
Against a Tabled Value
If |t
c
| > |t
α
| Reject H
0
If p value < α Reject H
0

Available data
• For a portion of the study, a pair of doctors were
shown the same set of tumor pictures. The volume
of the tumor was measured by two separate
physicians under similar conditions.
• Question of interest: Did the measurements from the
two physicians significantly differ?
• If not, then there would be no evidence that the
volume measurements change based on physician.
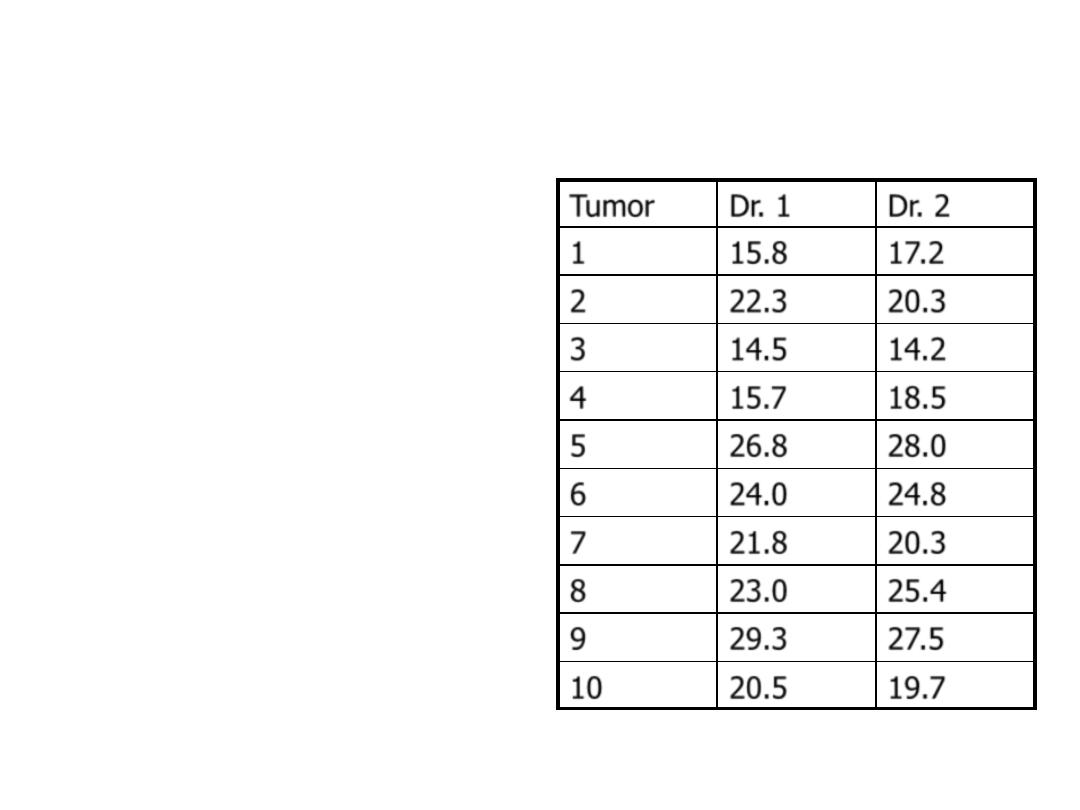
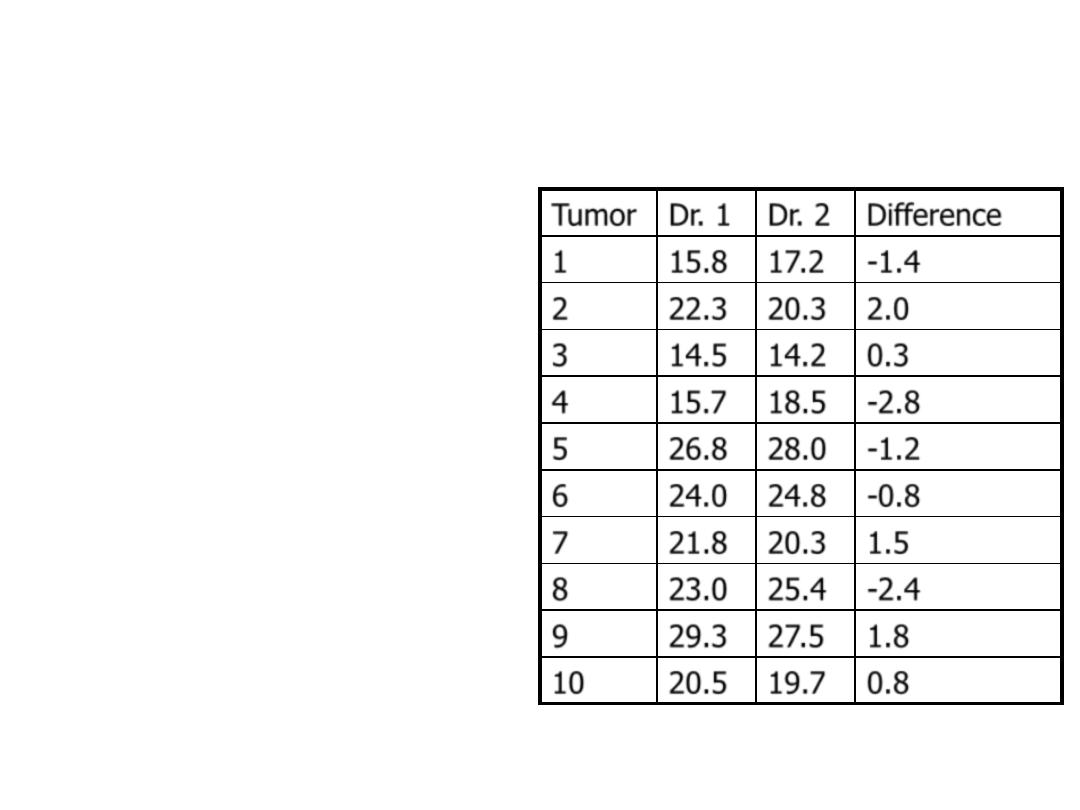
• 20 scans were measured
by each physician (10 are
shown here)
• Measurements in cm
3
• What can you say about
these samples?
– Two measurement on the
same person
– They are related so we
must account for this
– Much research in statistics
deals with how to handle
correlated data, but in this
case it is pretty easy
Tumor
Dr. 1
Dr. 2
1
15.8
17.2
2
22.3
20.3
3
14.5
14.2
4
15.7
18.5
5
26.8
28.0
6
24.0
24.8
7
21.8
20.3
8
23.0
25.4
9
29.3
27.5
10
20.5
19.7
Dependent sample
• We can measure the effect
of the treatment in each
person by taking the
difference
• Instead of having two
samples, we can consider
our dataset to be one
sample of differences
– Just like the one sample
problem
Tumor Dr. 1 Dr. 2 Difference
1
15.8 17.2 -1.4
2
22.3 20.3 2.0
3
14.5 14.2 0.3
4
15.7 18.5 -2.8
5
26.8 28.0 -1.2
6
24.0 24.8 -0.8
7
21.8 20.3 1.5
8
23.0 25.4 -2.4
9
29.3 27.5 1.8
10
20.5 19.7 0.8
i
i
i
x
x
d
2
1

Differences
• Volume from Dr. 1
– Population mean:
– Sample mean:
• Volume from Dr. 2
– Population mean:
– Sample mean:
• Difference
– Population mean:
– Sample mean:
1
x
2
x
n
d
d
n
i
i
1
2
1
2
1

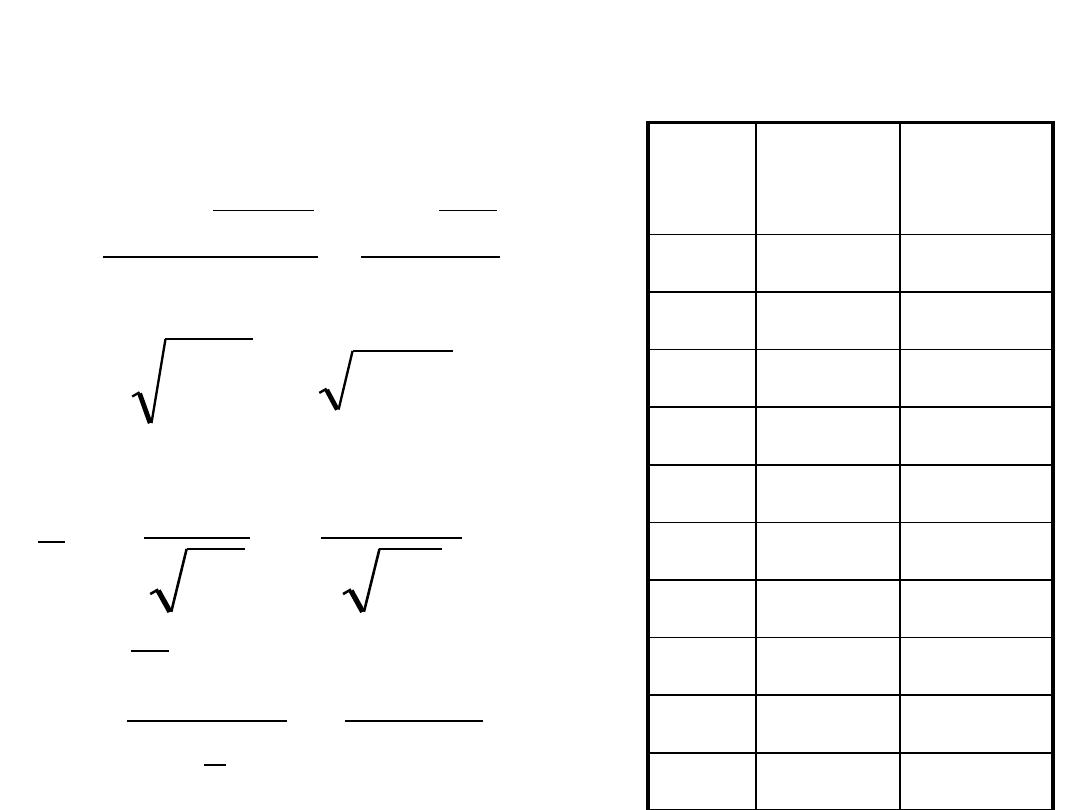
Distribution of differences
• Assuming d
i
’s are normally distributed, can use t-
distribution with n-1 dof where n is the number of
differences
• Standard deviation of differences
• Test statistic acts just like one sample
n
s
d
t
d
1
1
2
n
d
d
s
n
i
i
d

Paired t-test
1) Null hypothesis: No difference between physicians effect
2) Two dependent samples; alpha=0.05
3) Test statistic: t-statistic with dof
4) p-value=0.53
5) Fail to reject null hypothesis
6) Conclusion: there is no evidence of a difference in tumor
volume measurement based on physician
0
:
2
1
2
1
0
dr
dr
dr
dr
H
646
.
0
20
66
.
1
24
.
0
n
s
d
t
d

A researcher investigate whether children exhibit
a higher number of aggressive acts after watching
a violent television show. The number of
aggressive acts for the same 10 participants
before and after watching the show are as
follows:
(a) Subtracting before-scores from after-scores,
what are H
0
and H
a
? (b) Compute t
obt
. (c) With
a
=
.05, what is t
crit
? (d) What should the researcher
conclude about this relationship? (e) Compute
the appropriate confidence interval. (f) If you
want to understand children’s aggression, how
important is it to consider whether they watch
violent television shows?
After Before
5
4
6
6
4
3
4
2
7
4
3
1
2
0
1
0
4
5
3
2

Difference Scores
After Before D
5
4
5-4=+1
6
6
6-6=0
4
3
4-3=+1
4
2
4-2=+2
7
4
7-4=+3
3
1
3-1=+2
2
0
2-0=+2
1
0
1-0=+1
4
5
4-5=-1
3
2
3-2=+1
Difference scores can be
calculated by subtracting before-
after or after-before. The same
answer will be obtained (opposite
sign though). I personally choose
the order which creates the
fewest negative numbers. When
we interpret the results we need
to be careful to remember the
order we used.

(a) Subtracting before-
scores from after-scores,
what are H
0
and H
a
?
H
0
:
H
a
:
9-4a
After Before D
5
4
5-4=+1
6
6
6-6=0
4
3
4-3=+1
4
2
4-2=+2
7
4
7-4=+3
3
1
3-1=+2
2
0
2-0=+2
1
0
1-0=+1
4
5
4-5=-1
3
2
3-2=+1
0
D
0
D
(b) Compute t
obt
.
S
D = 1+0+1+2+3+2+2+1+-1+1=12
S
D
2
= 1
2
+ 0
2
+ 1
2
+ 2
2
+ 3
2
+ 2
2
+ 2
2
+
1
2
+ -1
2
+ 1
2
= 26
N = 10
After Before D
5
4
5-4=+1
6
6
6-6=0
4
3
4-3=+1
4
2
4-2=+2
7
4
7-4=+3
3
1
3-1=+2
2
0
2-0=+2
1
0
1-0=+1
4
5
4-5=-1
3
2
3-2=+1
2
.
1
10
12
S
N
D
D
(b) Compute t
obt
.
After Before D
5
4
5-4=+1
6
6
6-6=0
4
3
4-3=+1
4
2
4-2=+2
7
4
7-4=+3
3
1
3-1=+2
2
0
2-0=+2
1
0
1-0=+1
4
5
4-5=-1
3
2
3-2=+1
29
.
1
1
10
10
12
26
1
)
(
2
2
2
2
S
S
N
N
D
D
s
D
135
.
1
29
.
1
2
D
D
s
s
359
.
10
135
.
1
N
s
s
D
D
34
.
3
359
.
0
2
.
1
D
D
obt
s
D
t
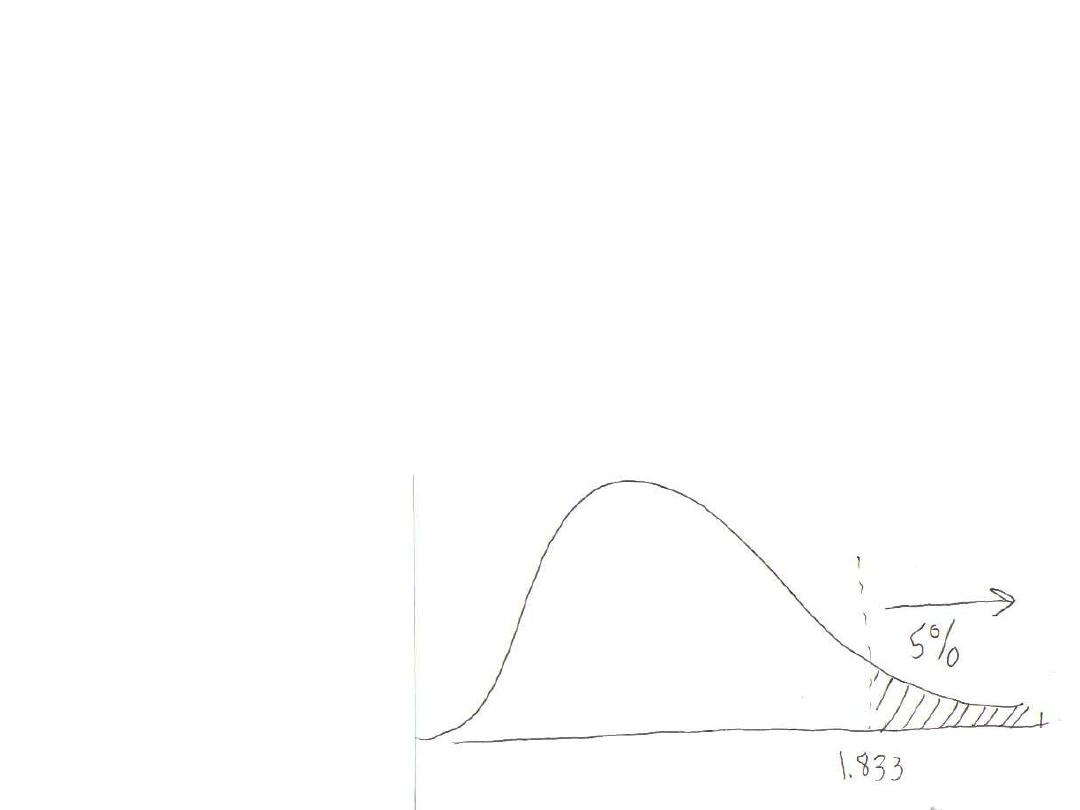
(c) With
a
= .05, what is t
crit
?
n
D
= 10
df = n – 1 = 9
Researcher predicts higher aggressive acts after
watching violence, therefore, this is a one-tailed
test.
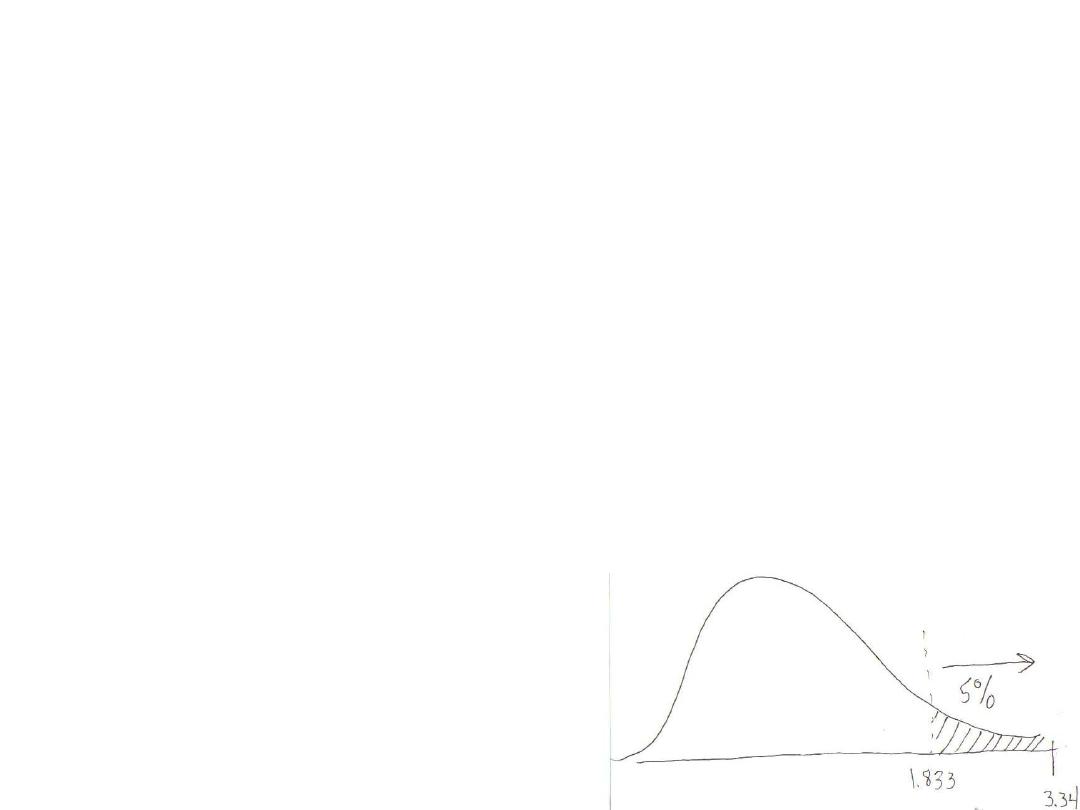
t
crit
(9)
a
=.05
= +1.833
(d) What should the researcher conclude about this
relationship?
Since the t
obt
is in the tail created by t
crit
, we reject H
0
and
conclude the results are significant. In the population,
children exhibit more aggressive acts after watching the show
(with
about 3.9) than they do before the show (with
about 2.7).