1
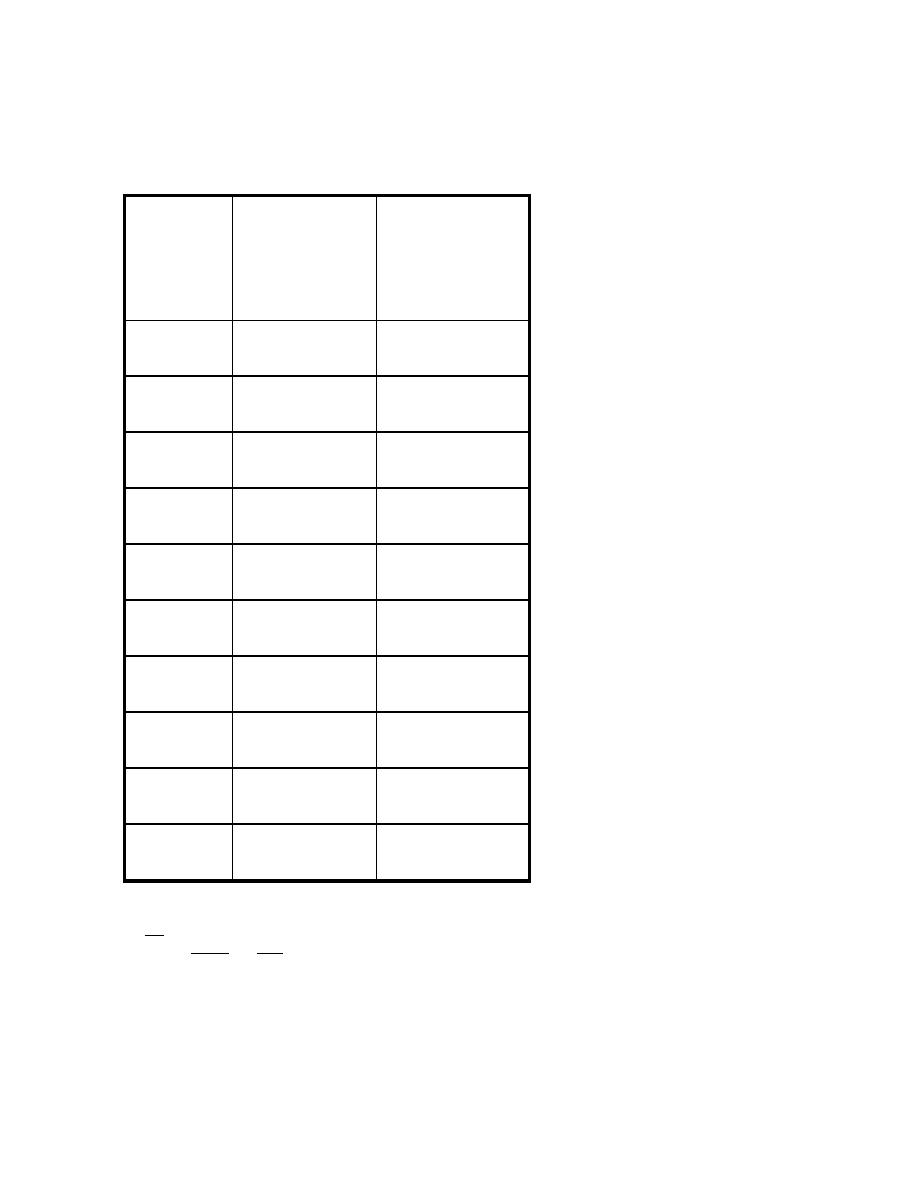
Group I
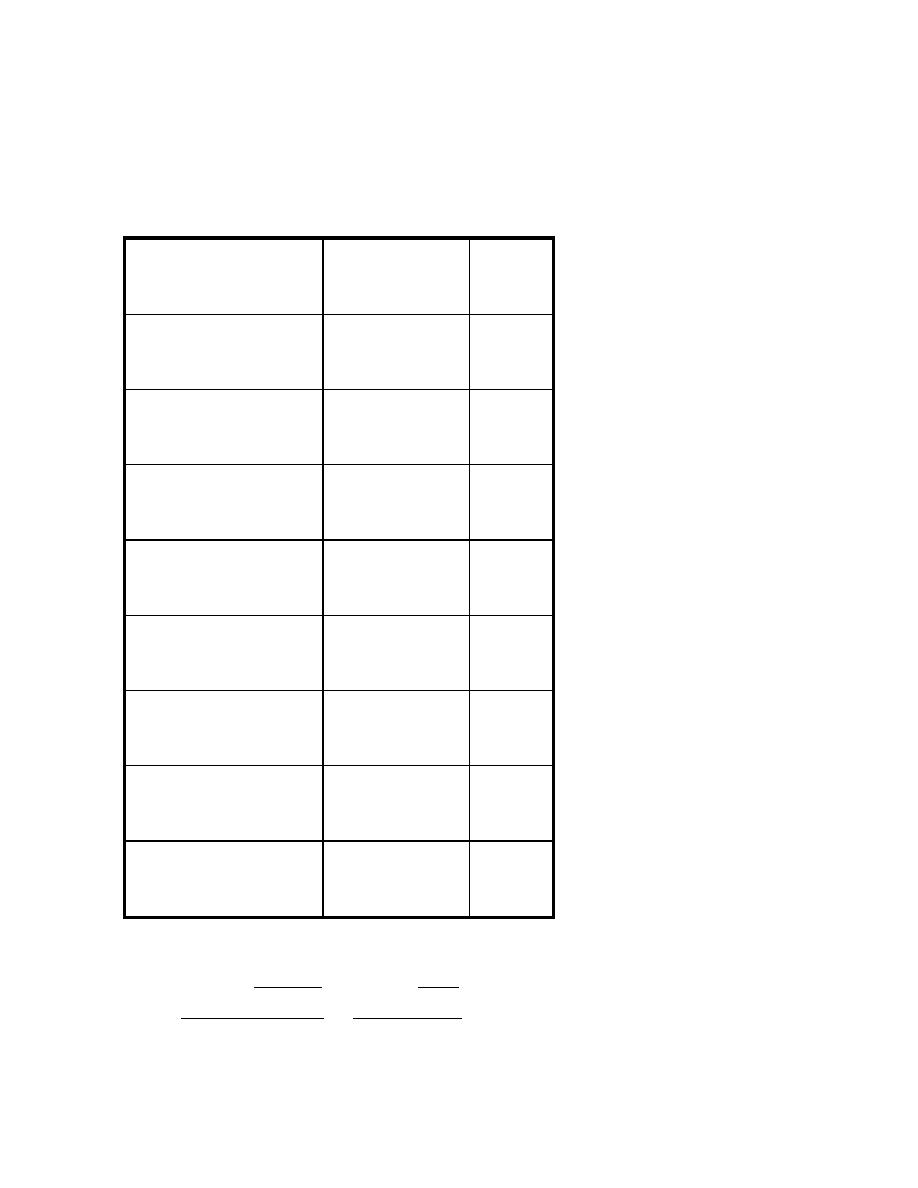
Subtracting before-scores from after-scores
After
Before
D
5
4
5-4=+1
6
6
6-6=0
4
3
4-3=+1
4
2
4-2=+2
7
4
7-4=+3
3
1
3-1=+2
2
0
2-0=+2
1
0
1-0=+1
4
5
4-5=-1
3
2
3-2=+1
2
.
1
10
12
N
D
D
2
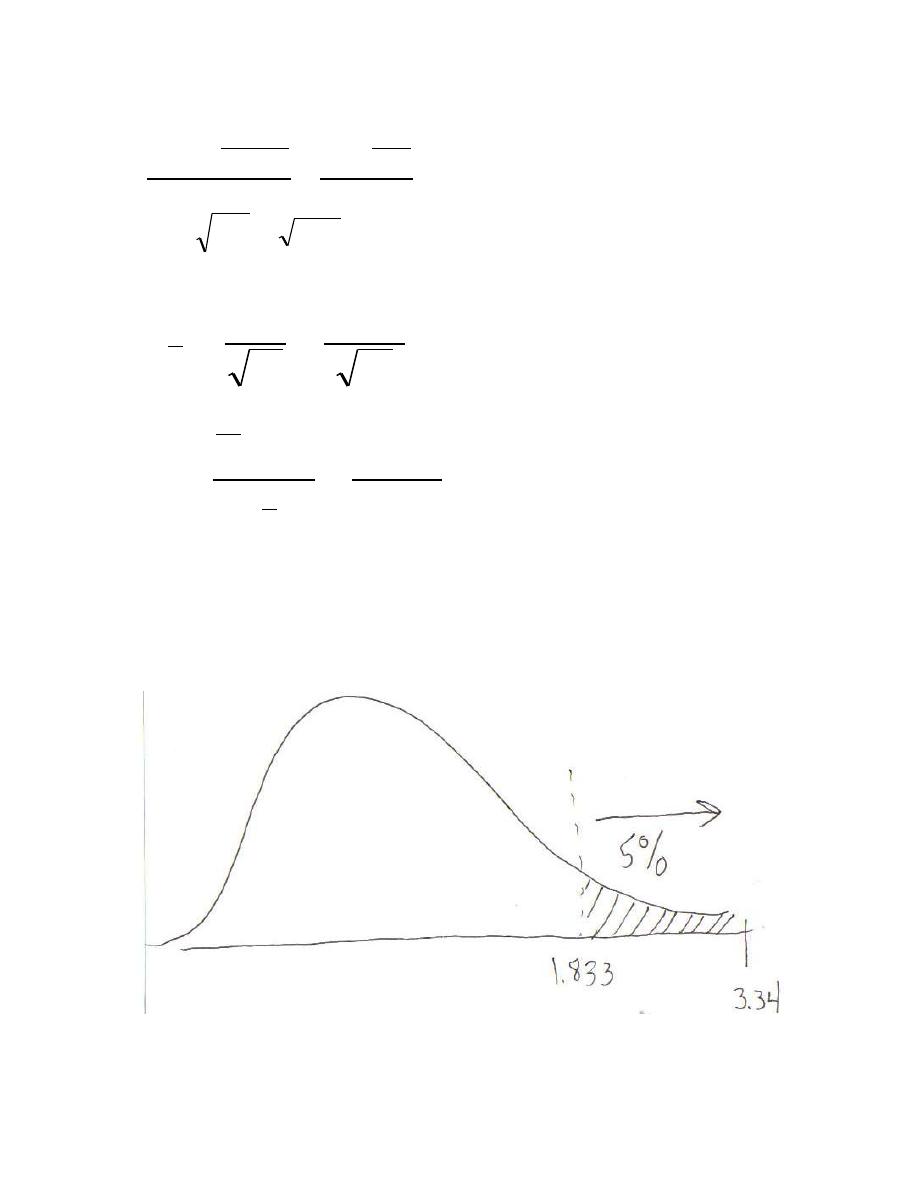
Researcher predicts higher aggressive acts after watching violence,
therefore, this is a one-tailed test.
t
crit
(9)
a=.05
= +1.833
29
.
1
1
10
10
12
26
1
)
(
2
2
2
2
N
N
D
D
s
D
135
.
1
29
.
1
2
D
D
s
s
359
.
10
135
.
1
N
s
s
D
D
34
.
3
359
.
0
2
.
1
D
D
obt
s
D
t
t
obt
means t
calc
i.e.
calculated t

3
Since the t
obt
is in the tail created by t
crit
, we reject H
0
and conclude the
results are significant. In the population, children exhibit more aggressive
acts after watching the show (with m about 3.9) than they do before the
show (with m about 2.7).
4
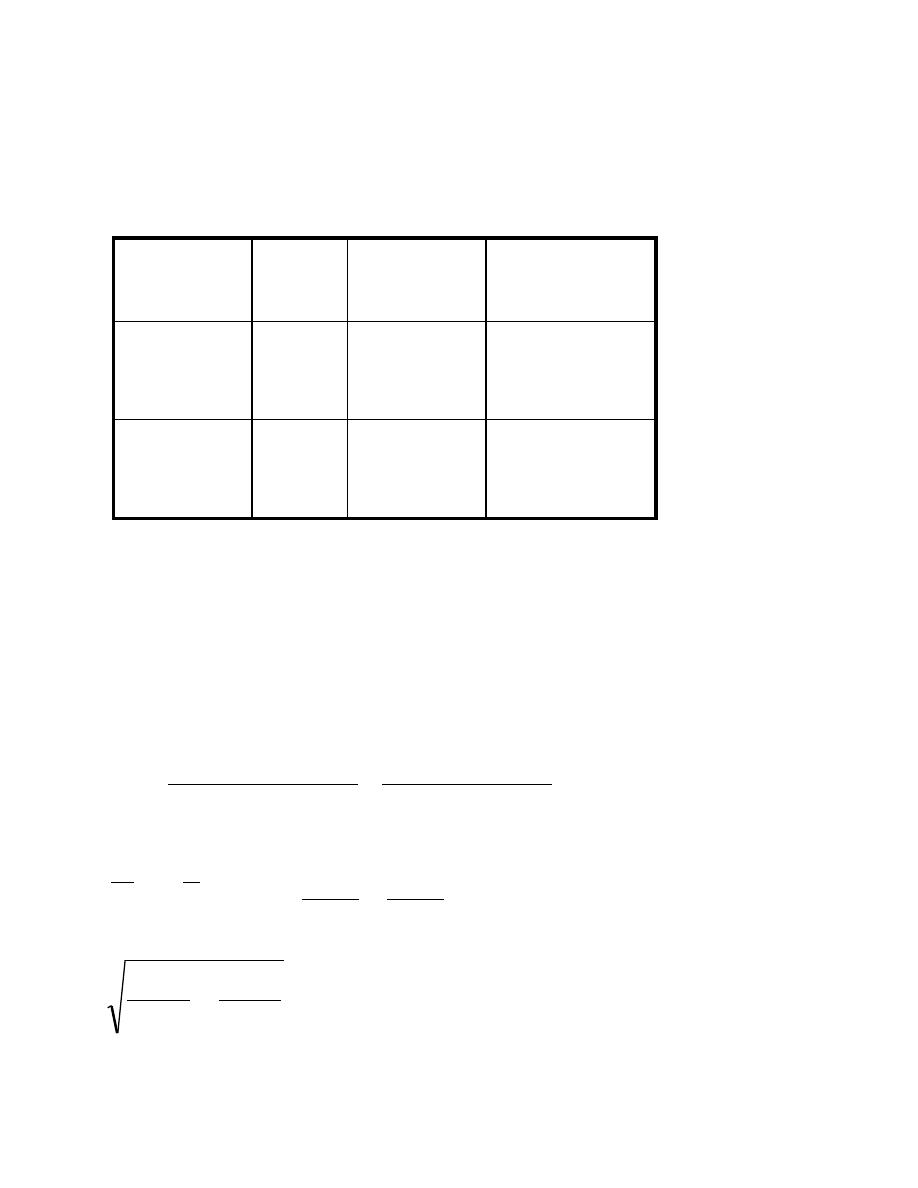
Group II
Data summary
n
Sample Mean Sample Standard
Deviation
Group 1:
women
30
416
81
Group 2:
men
30
436
77
H
0
: ♂-♀ math SAT = 0
Ha: ♂-♀ math SAT ≠ 0 [two-sided]
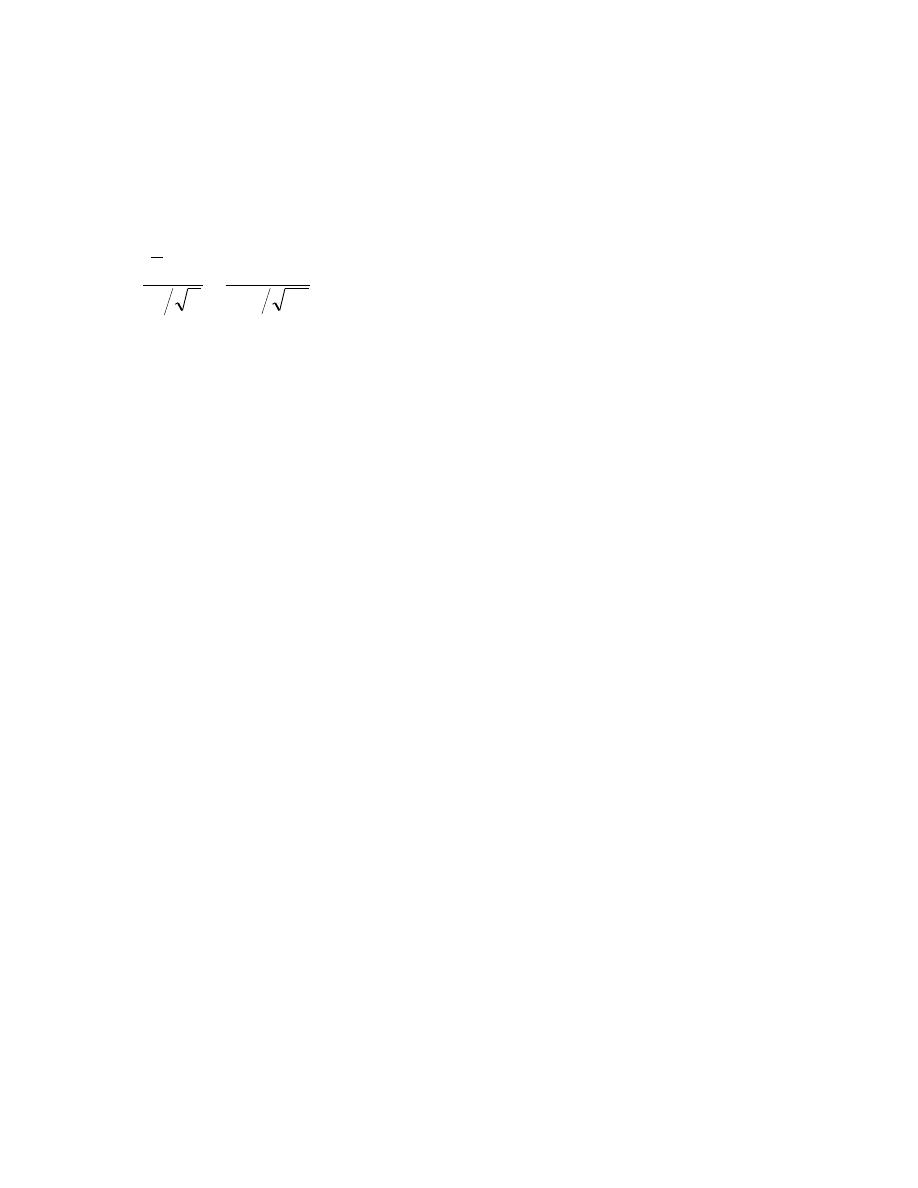
F and M have similar standard deviations/variances, so make a “pooled”
estimate of variance.
6245
58
81
)
29
(
77
)
29
(
2
)
1
(
)
1
(
2
2
2
2
2
m
n
s
m
s
n
s
f
m
p
)
30
6245
30
6245
,
0
(
~
58
30
30
T
F
M
4
.
20
30
6245
30
6245

5
P = 0.3311563454
Do not reject null! No evidence that men are better in math ;)
98
.
4
.
20
0
20
58
T
6
Group III
H
0
: µ
dr1
= µ
dr2
H
a
: µ
dr1
≠ µ
dr2
1) Fail to reject null hypothesis
2) Conclusion: there is no evidence of a difference in tumor volume
measurement based on physician
646
.
0
20
66
.
1
24
.
0
n
s
d
t
d
7
Group IV
H
0
: µ
D
= 0
H
a
: µ
D
≠ 0
Younger
Older
D
10
18
8
11
17
6
18
19
1
12
16
4
15
15
0
13
19
6
19
13
-6
15
20
5
29
.
20
1
8
8
24
214
1
)
(
2
2
2
2
N
N
D
D
s
D
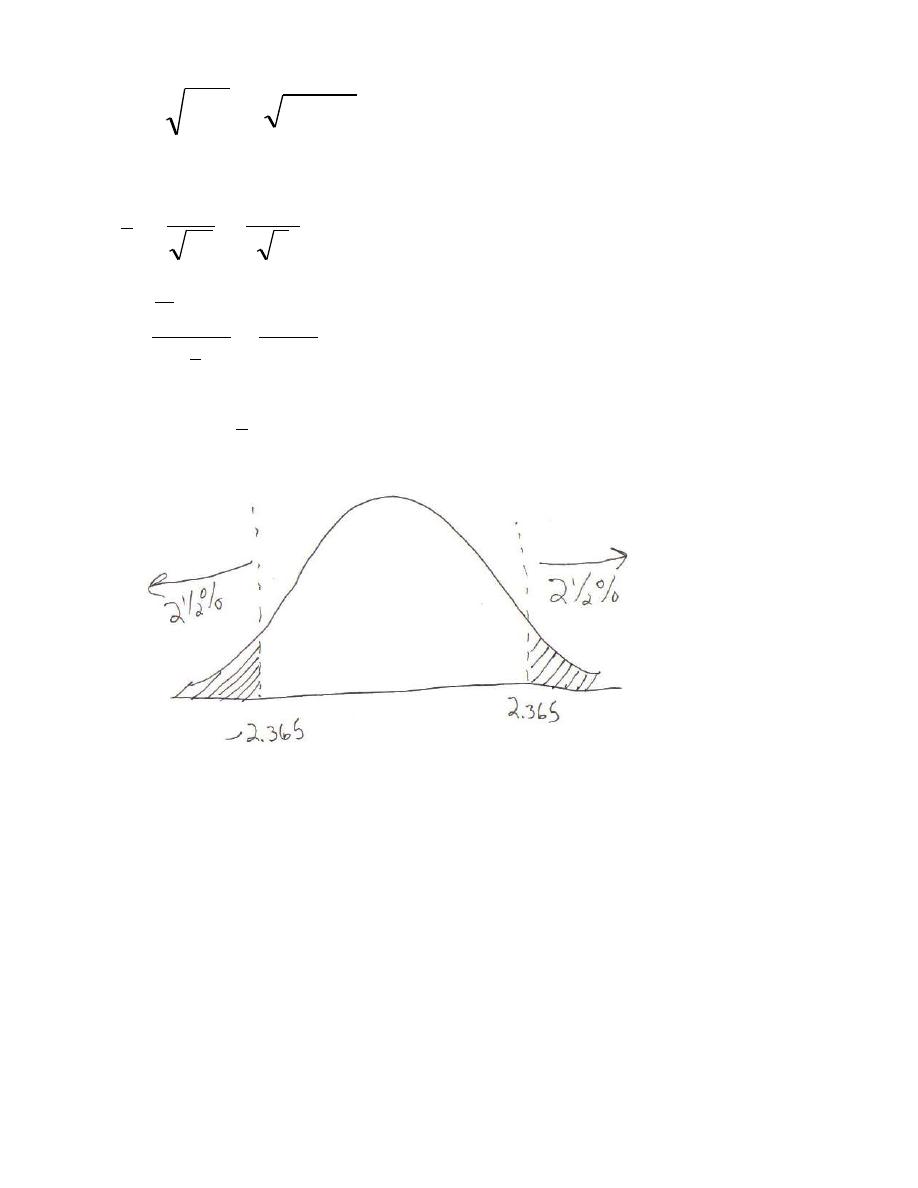
8
t
crit
(7)
a=.05
= +2.365
The researcher did not predict whether older or younger siblings would be
more extraverted, therefore, this is a two-tailed test.
Since the t
obt
does not fall in the regions of rejection created by t
crit
, we
conclude the results are not significant, we have no evidence of a
relationship. In the population, neither older nor younger brothers are
significantly more extraverted than the other.
50
.
4
29
.
20
2
D
D
s
s
592
.
1
8
50
.
4
N
s
s
D
D
88
.
1
592
.
1
0
3
D
D
obt
s
D
t

9