1
In a study on a random sample of 200 adults the serum lipid profile was
assessed. In addition a questionnaire format gathered information about Type of
fat used for frying, obesity status classified by BMI (body mass index), the risk
score and Frequency of eating Cholesterol/fat rich diet.
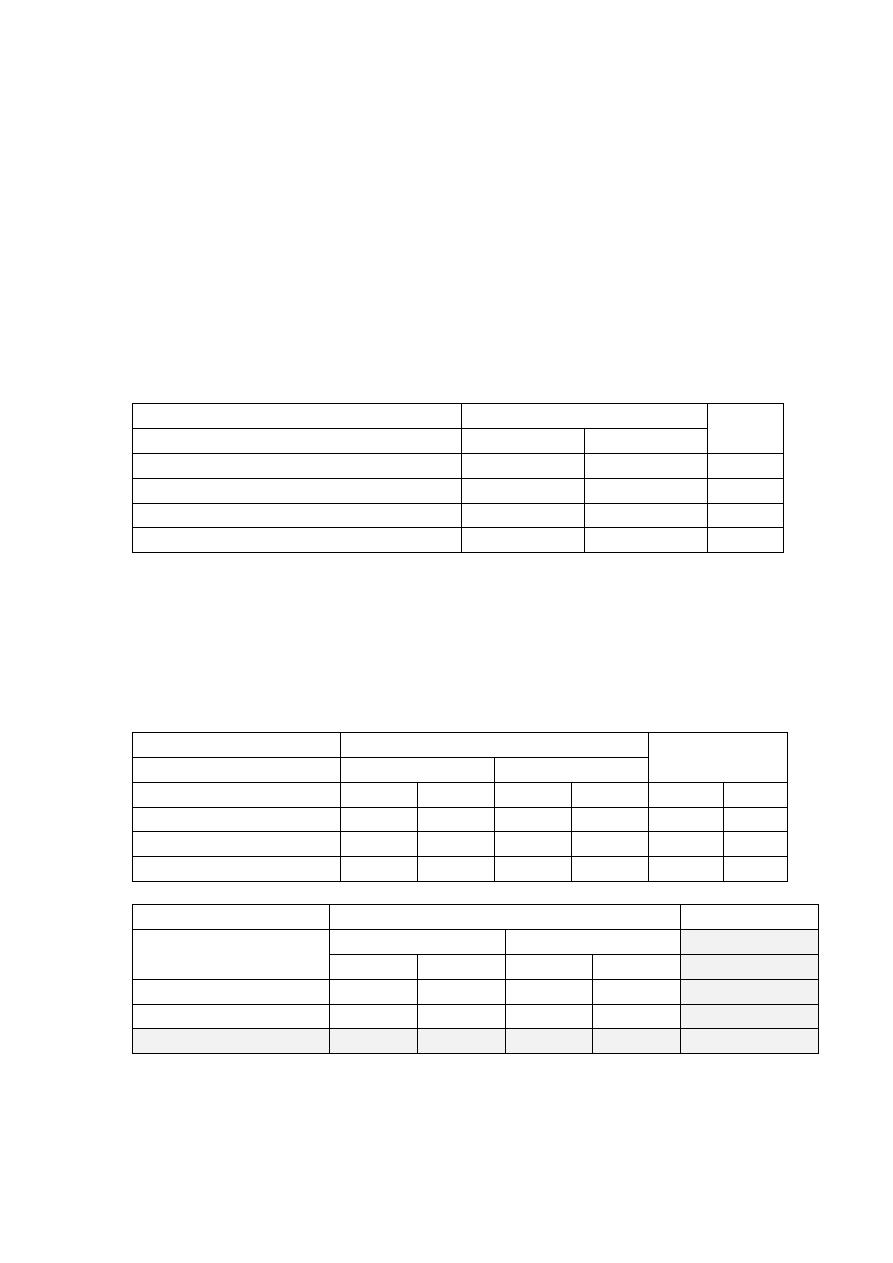
Q1) The type of fat used for frying was classified as plant oil only or others
(mixed) type of fat. A total of 46 persons reported using plant oil only,
while 154 reported using others (mixed) type of fat for frying. Among
subjects using plant oil only, 25 had an abnormal lipid profile, while among
those in the second category, 125 had an abnormal lipid profile. Is there an
association between type of oil used for frying and having an abnormal
serum lipid profile?
Lipid profile
Total
Normal
Abnormal
Type of fat used for frying
plant oil only
21
25
46
others(mixed)
29
125
154
Total
50
150
200
null hypothesis (H
o
): No association between type of fat used for frying and
having an abnormal lipid profile.
alternative hypothesis (H
a
): there is an association between type of fat used for
frying and having an abnormal lipid profile.
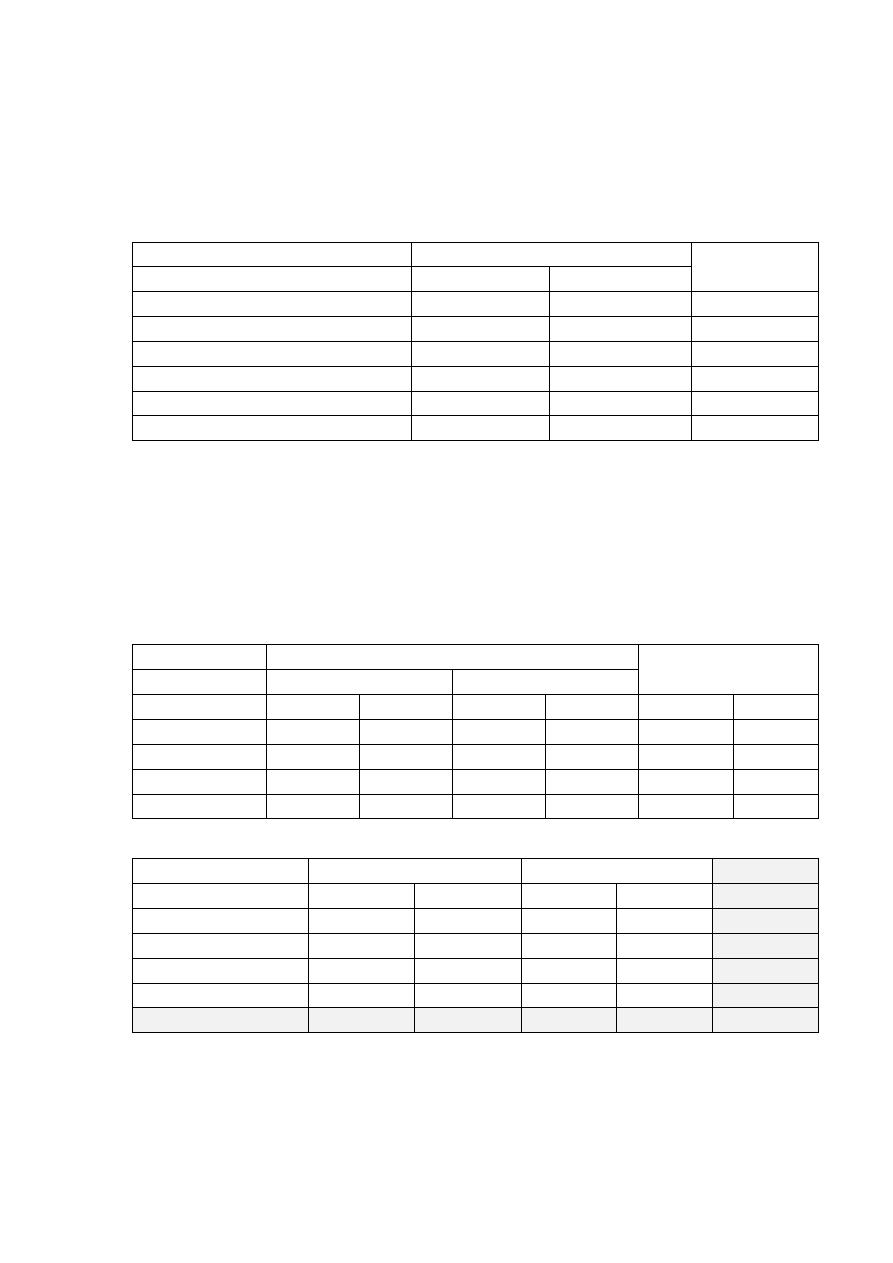
Lipid profile
Total
Normal
Abnormal
N
%
N
%
N
%
Type of fat used for frying
plant oil only
21
45.7
25
54.3
46
100
others(mixed)
29
18.8
125
81.2
154
100
Lipid profile
Type of fat used for
frying
Normal
Abnormal
Total
Observed Expected Observed Expected
Observed
plant oil only
21
(A)
11.5
(B)
25
34.5
46
(C)
others(mixed)
29
38.5
125
115.5
154
Total
50
(D)
50
150
150
200
(E)
Expected frequency (B) for cell (A) = (C x D) / E

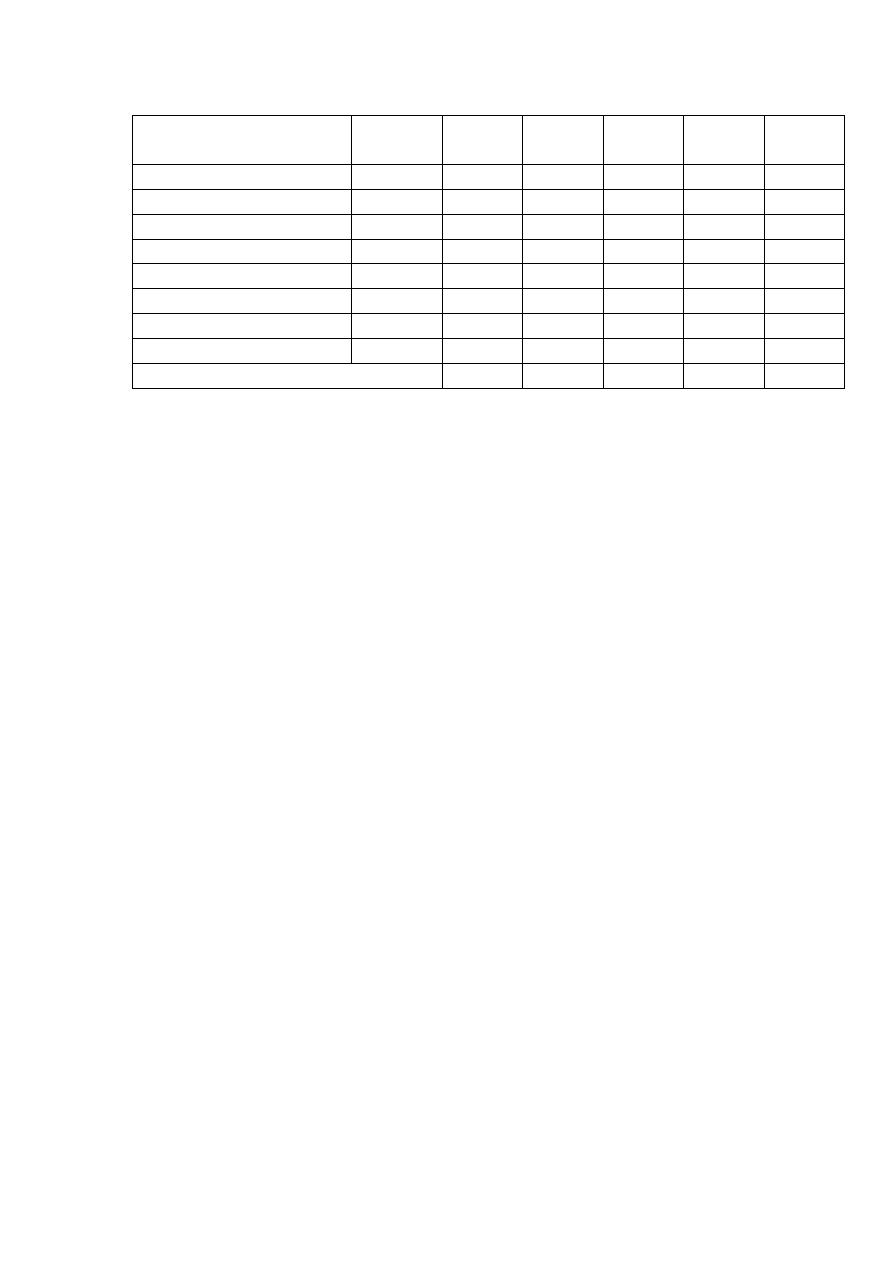
2
Type of fat used for
frying
Lipid
profile
Observed Expected
O - E
(O-E)
2
|(O-E)
2
/E|
plant oil only
Normal
21
11.5
9.5
90.3
7.8
plant oil only
Abnormal
25
34.5
-9.5
90.3
2.6
others(mixed)
Normal
29
38.5
-9.5
90.3
2.3
others(mixed)
Abnormal
125
115.5
9.5
90.3
0.8
Total Calculated χ
2
13.6
df = (r-1) x (c-1) = (2-1) x (2-1) = 1
Tabulated (Decision rule) CHI-SQUARE test (df=1 and α=0.05) =3.84
Calculated (Test statistic) χ
2
> tabulated (Decision rule) χ
2
Reject null hypothesis in favor of the alternative hypothesis
There is a statistically significant association between the 2 variables
3
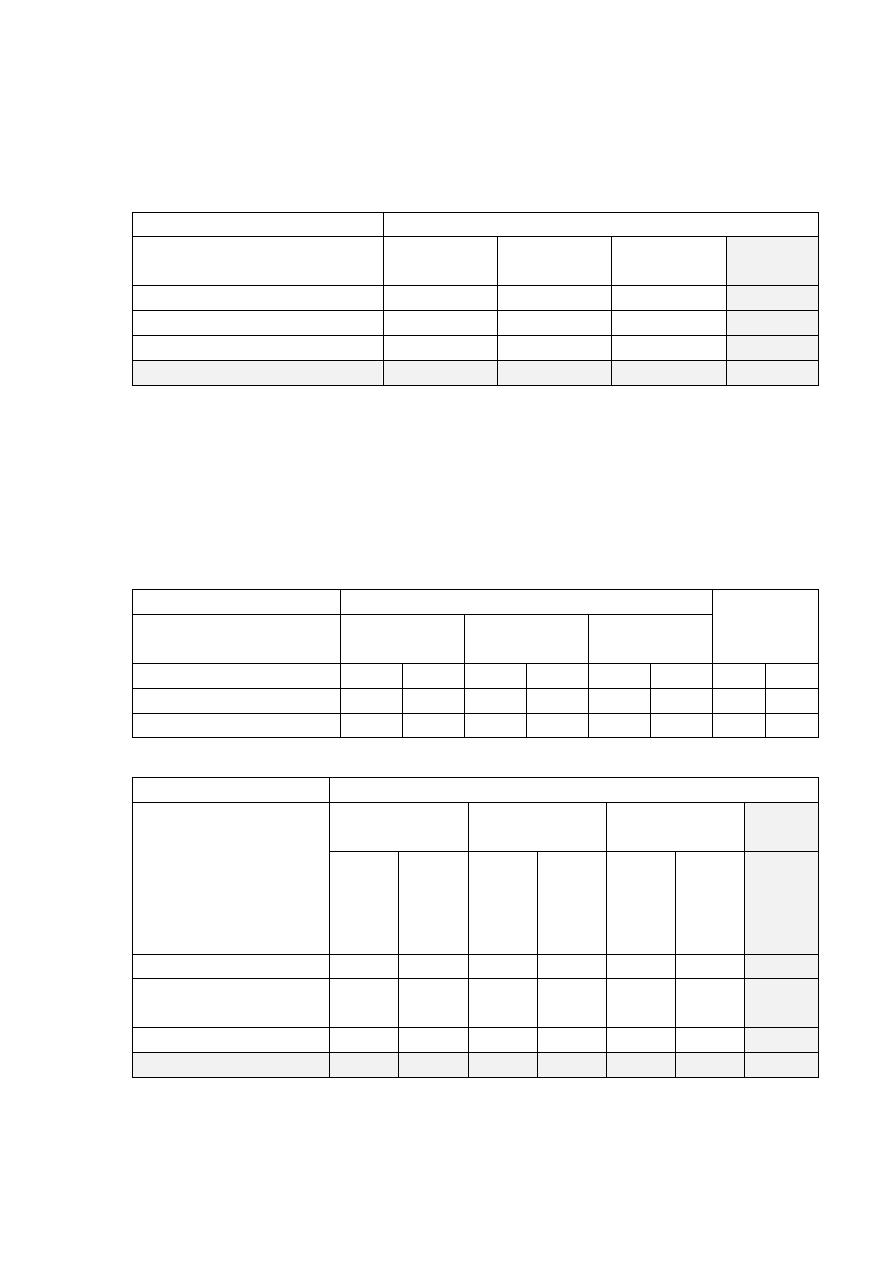
Q2) The Risk score was classified into 4 categories (No risk, (1-2) risk factors,
(3-4) risk factors and 5+ risk factors). The table below shows the cross-
tabulation between risk score categories and serum lipid profile assessment.
Is there an association between risk score and having abnormal lipid
profile?
Lipid profile
Total
Normal
Abnormal
Risk score
No risk
13
14
27
(1-2) risk factors
16
36
52
(3-4) risk factors
17
51
68
5+ risk factors
4
49
53
Total
50
150
200
null hypothesis (H
o
): No association between risk score and having an abnormal
lipid profile.
alternative hypothesis (H
a
): there is an association between risk score and having
an abnormal lipid profile.
Lipid profile
Total
Normal
Abnormal
Risk score
N
%
N
%
N
%
No risk
13
48.1
14
51.9
27
100
(1-2) risk factors
16
30.8
36
69.2
52
100
(3-4) risk factors
17
25
51
75
68
100
5+ risk factors
4
7.5
49
92.5
53
100
Normal
Abnormal
Total
Risk score
Observed
Expected Observed Expected Observed
No risk
13
6.8
14
20.3
27
(1-2) risk factors
16
13
36
39
52
(3-4) risk factors
17
17
51
51
68
5+ risk factors
4
(A)
13.3
(B)
49
39.8
53
(C)
Total
50
(D)
50.1
150
150.1
200
(E)
Expected frequency (B) for cell (A) = (C x D) / E
4
Risk score
Lipid
profile
Observed Expected
O - E
(O-E)
2
|(O-E)
2
/E|
No risk
Normal
13
6.8
6.2
38.4
5.7
No risk
Abnormal
14
20.3
-6.3
39.7
2.0
(1-2) risk factors
Normal
16
13
3
9.0
0.7
(1-2) risk factors
Abnormal
36
39
-3
9.0
0.2
(3-4) risk factors
Normal
17
17
0
0.0
0.0
(3-4) risk factors
Abnormal
51
51
0
0.0
0.0
5+ risk factors
Normal
4
13.3
-9.3
86.5
6.5
5+ risk factors
Abnormal
49
39.8
9.2
84.6
2.1
Total Calculated Chi-square
17.2
df = (r-1) x (c-1) = (4-1) x (2-1) = 3
Tabulated (Decision rule) CHI-SQUARE test (df=3 and α=0.05) = 7.8
Calculated (Test statistic) χ
2
> tabulated (Decision rule) χ
2
Reject null hypothesis in favor of the alternative hypothesis
There is a statistically significant association between the 2 variables
5
Q3) The table below shows the cross-tabulation between the frequency of eating
Cholesterol/fat rich diet and obesity assessed by BMI. Does the data
provided supports an association between frequency of eating
Cholesterol/fat rich diet and obesity.
BMI (Kg/m
2
)-categories
Frequency of eating
Cholesterol/fat rich diet
Acceptable
(<25)
Overweight
(25-29.9)
Obese (30+)
Total
Negative
34
20
3
57
Positive, but less frequent
11
50
15
76
Positive, daily
6
23
38
67
Total
51
93
56
200
null hypothesis (H
o
): No association between frequency of eating cholesterol/fat
rich diet and BMI
alternative hypothesis (H
a
): there is an association between frequency of eating
cholesterol/fat rich diet and BMI
BMI (Kg/m
2
)-categories
Total
Frequency of eating
Cholesterol/fat rich diet
Acceptable
(<25)
Overweight
(25-29.9)
Obese (30+)
Negative
34
59.6
20
35.1
3
5.3
57
100
Positive, but less frequent
11
14.5
50
65.8
15
19.7
76
100
Positive, daily
6
9
23
34.3
38
56.7
67
100
BMI (Kg/m
2
)-categories
Frequency of eating
Cholesterol/fat rich diet
Acceptable
(<25)
Overweight
(25-29.9)
Obese (30+)
Total
O
bs
erv
ed
Ex
pe
cted
O
bs
erv
ed
Ex
pe
cted
O
bs
erv
ed
Ex
pe
cted
O
bs
erv
ed
Negative
34
14.5
20
(A)
26.5
(B)
3
16
57
(C)
Positive, but less
frequent
11
19.4
50
35.3
15
21.3
76
Positive, daily
6
17.1
23
31.2
38
18.8
67
Total
51
51
93
(D)
93
56
56.1
200
(E)
Expected frequency (B) for cell (A) = (C x D) / E
6
Frequency of eating
Cholesterol/fat rich diet
BMI (Kg/m
2
)-
categories
O
bs
erv
ed
Ex
pe
cted
O - E (O-E)
2
|(O
-E)
2
/E|
Negative
Acceptable (<25)
34
14.5 19.5 380.3 26.2
Negative
Overweight (25-29.9) 20
26.5
-6.5
42.3
1.6
Negative
Obese (30+)
3
16
-13
169.0 10.6
Positive, but less frequent Acceptable (<25)
11
19.4
-8.4
70.6
3.6
Positive, but less frequent Overweight (25-29.9) 50
35.3 14.7 216.1
6.1
Positive, but less frequent Obese (30+)
15
21.3
-6.3
39.7
1.9
Positive, daily
Acceptable (<25)
6
17.1 -11.1 123.2
7.2
Positive, daily
Overweight (25-29.9) 23
31.2
-8.2
67.2
2.2
Positive, daily
Obese (30+)
38
18.8 19.2 368.6 19.6
Total Calculated Chi-square
52.7
df = (r-1) x (c-1) = (3-1) x (3-1) = 4
Tabulated (Decision rule) CHI-SQUARE test (df=3 and α=0.05) = 9.5
Calculated (Test statistic) χ
2
> tabulated (Decision rule) χ
2
Reject null hypothesis in favor of the alternative hypothesis
There is a statistically significant association between the 2 variables