
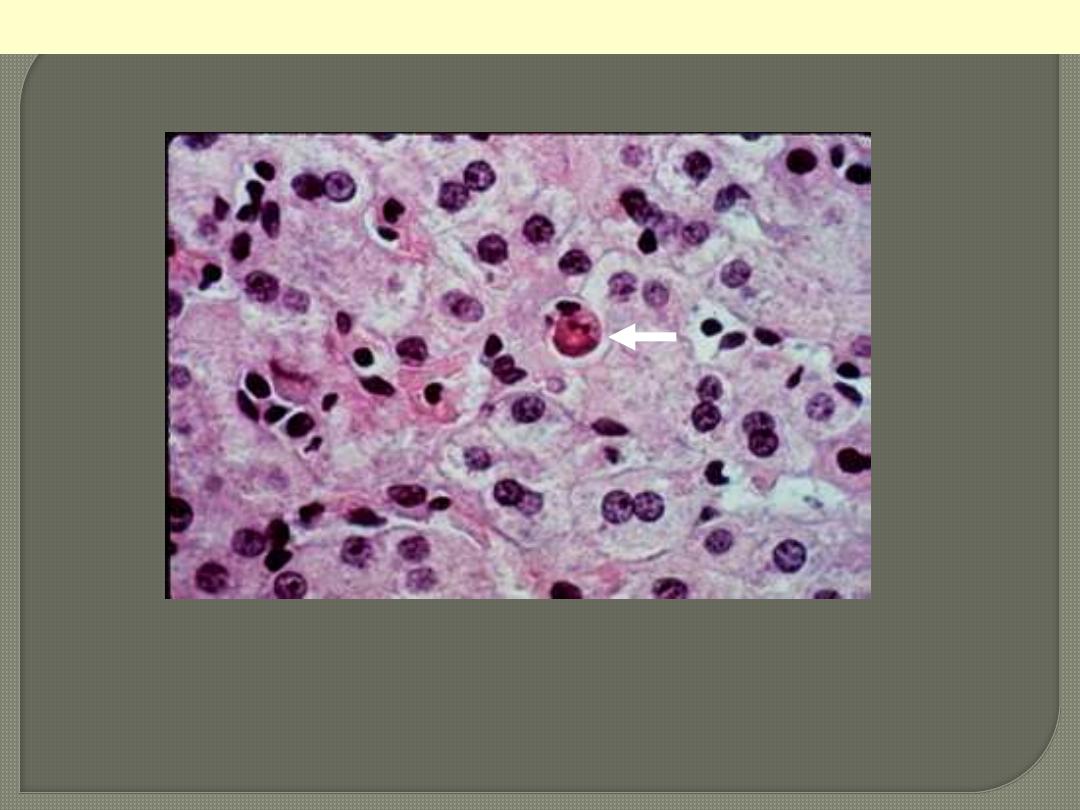
The cell is reduced in size and contains brightly eosinophilic cytoplasm and a condensed nucleus.
Apoptosis of a liver cell in viral hepatitis
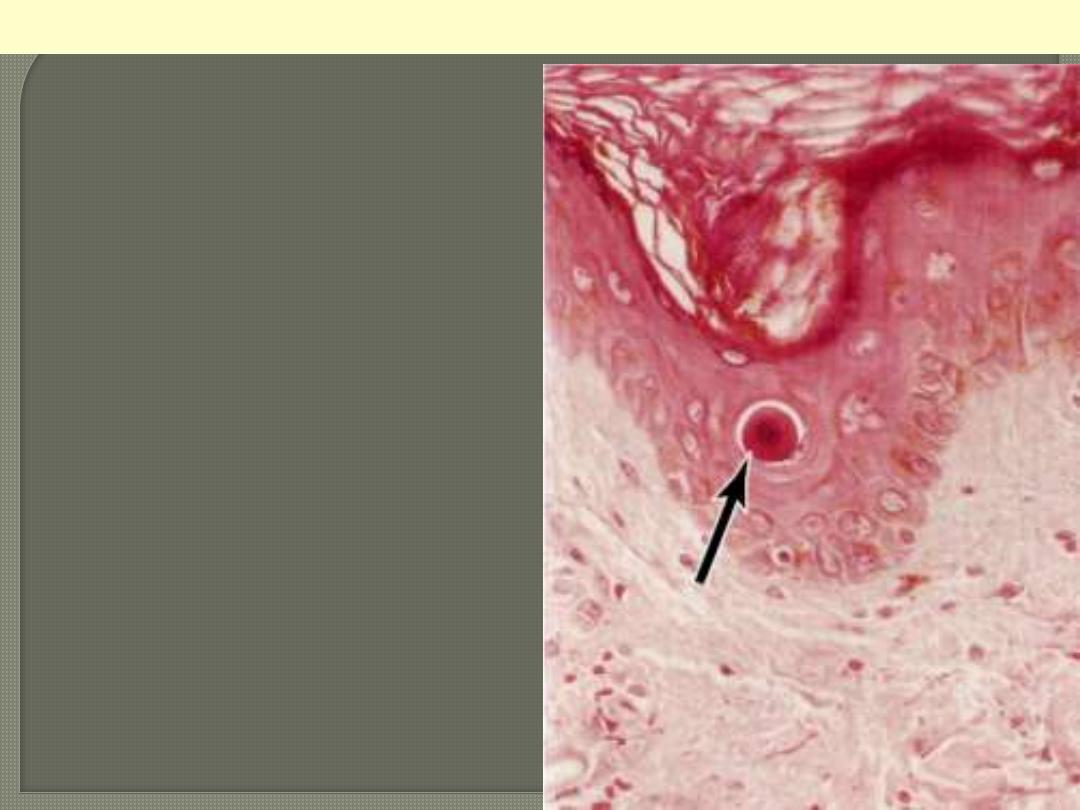
Apoptosis of epidermal keratinocyte
The cytoplasm is intensely esoniphilic (pinkish)
and the nucleus condensed (pyknotic)

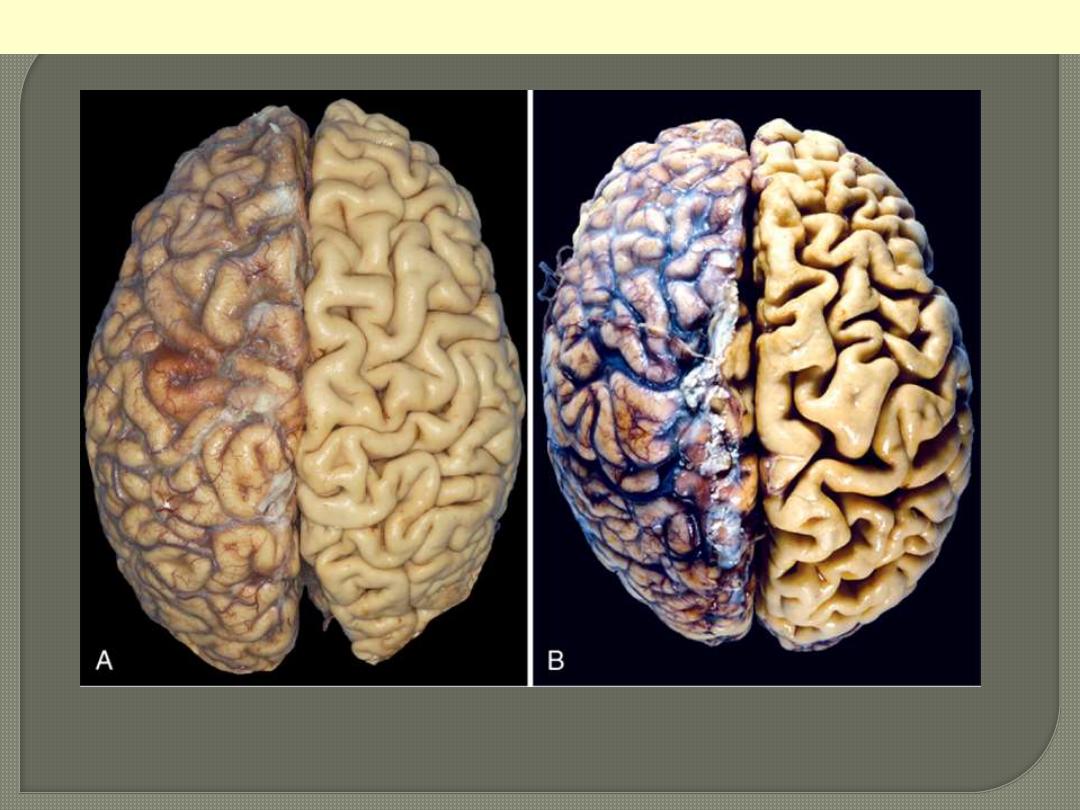
A, Normal brain of a young adult. B, Atrophy of the brain in an 82-year-old male with atherosclerotic
disease. Atrophy of the brain is due to aging and reduced blood supply. Note that loss of brain
substance narrows the gyri and widens the sulci. The meninges have been stripped from the right half
of each specimen to reveal the surface of the brain.
Brain atrophy
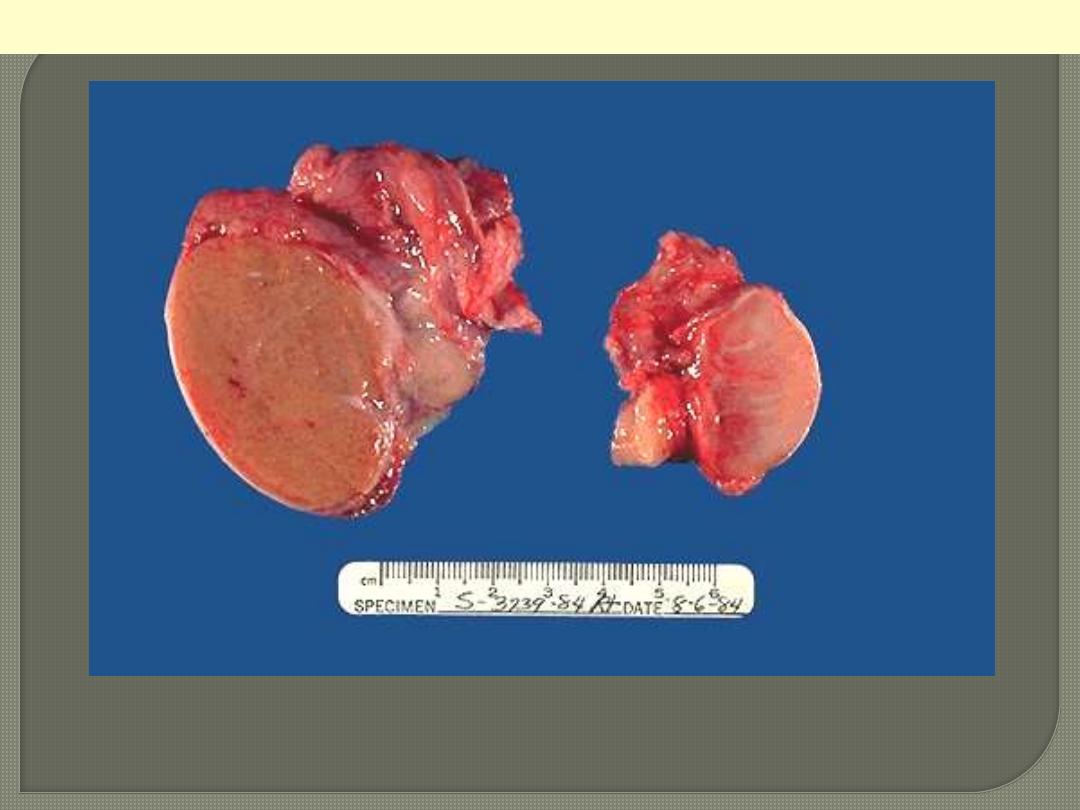
On the left is a normal testis. On the right is a testis that has undergone atrophy. Bilateral atrophy may
occur with a variety of conditions including chronic alcoholism, hypopituitarism, atherosclerosis,
chemotherapy or radiation, and severe prolonged illness. A cryptorchid testis will also be atrophic.
Testicular atrophy
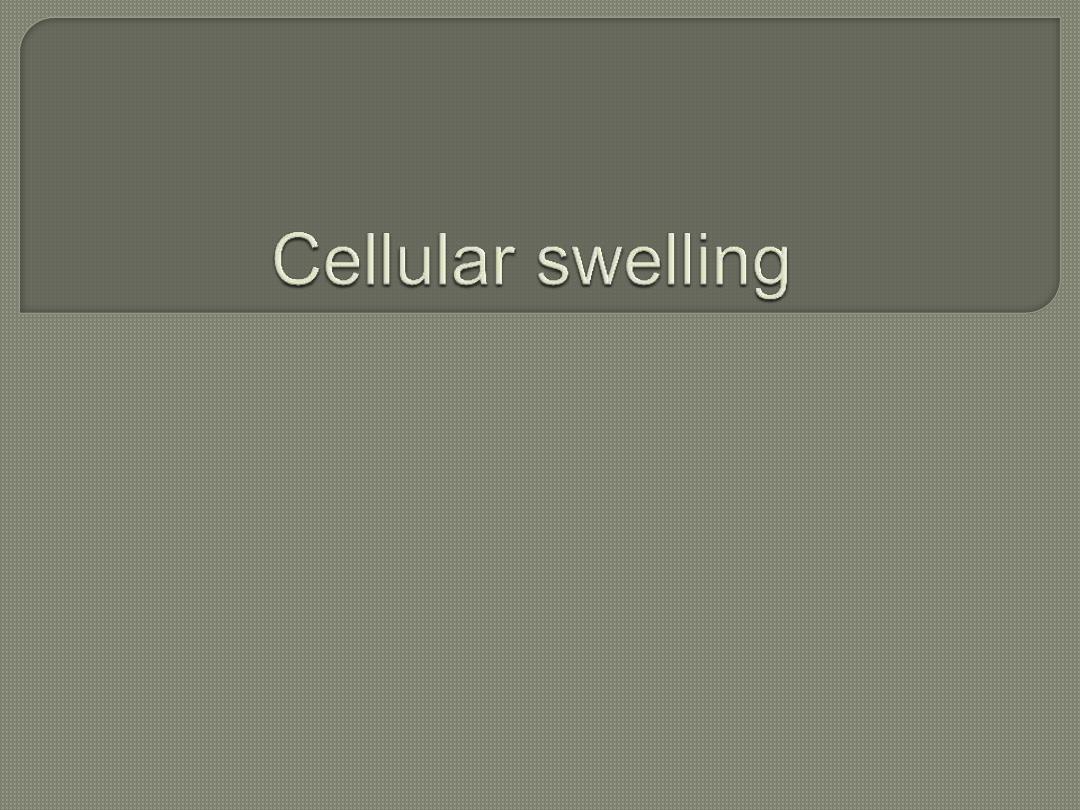
The affected hepatocytes are distended by accumulated water that imparts cytoplasmic pallor.
Cellular swelling (hydropic change)
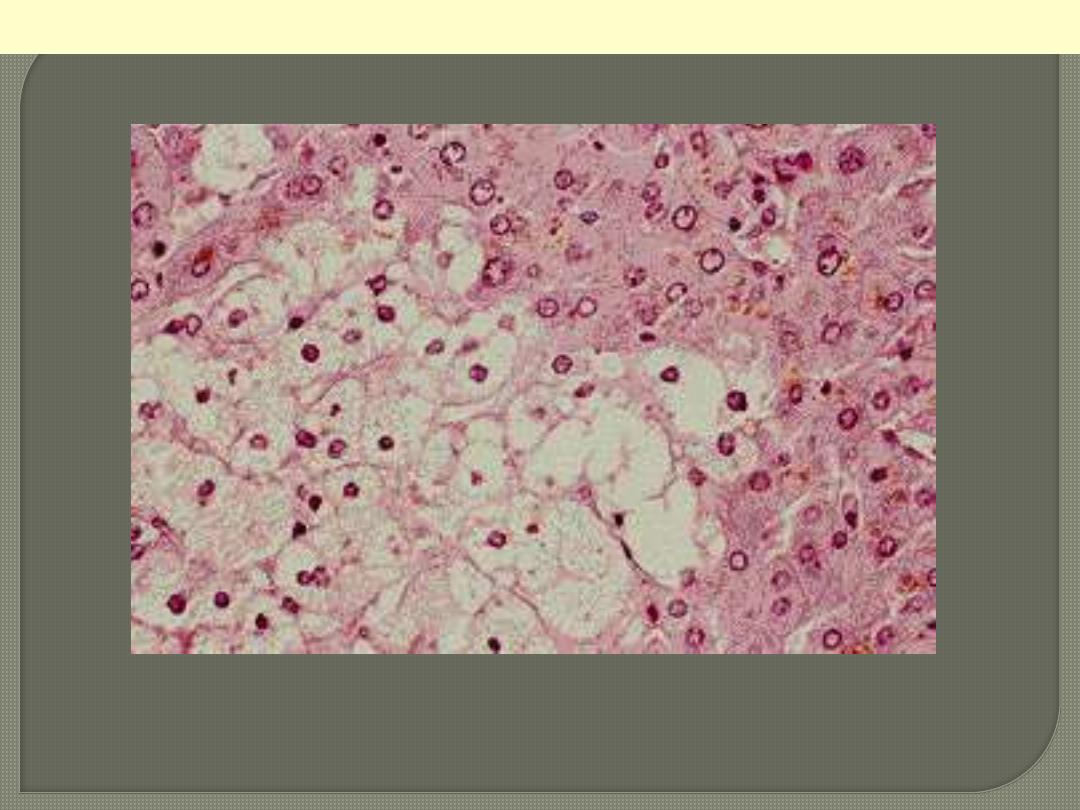
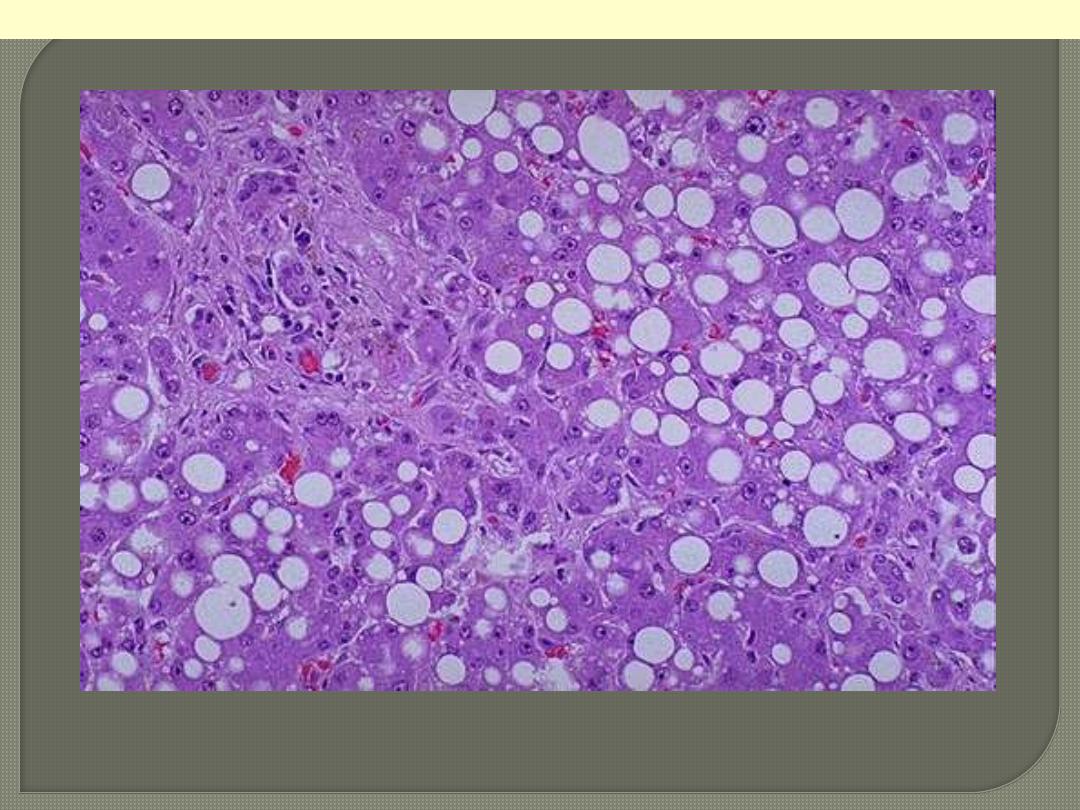
In the early stages: small fat vacuoles around the nucleus but with progression these coalesce into a
large clear space that displaces the nucleus to the periphery (macrovesicular steatosis).

Fatty change liver
Macrovesicular steatosis a higher power of previous figure.

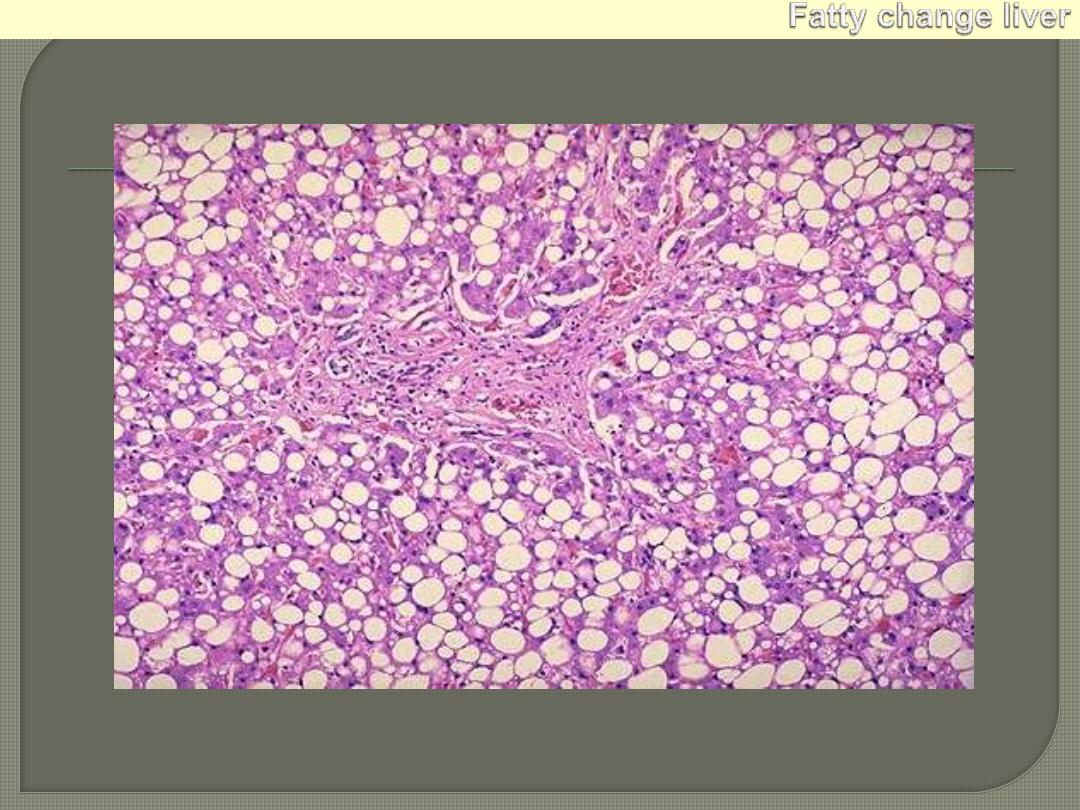
This is cardiac hypertrophy. The number of myocardial fibers never increases, but their size can
increase in response to an increased workload, leading to the marked thickening of the left ventricle in
this patient with hypertension. Note: normal Lt. ventricular wall thickness is 1.2 cm. to 1.5 cm
Lt. ventricular hypertrophy
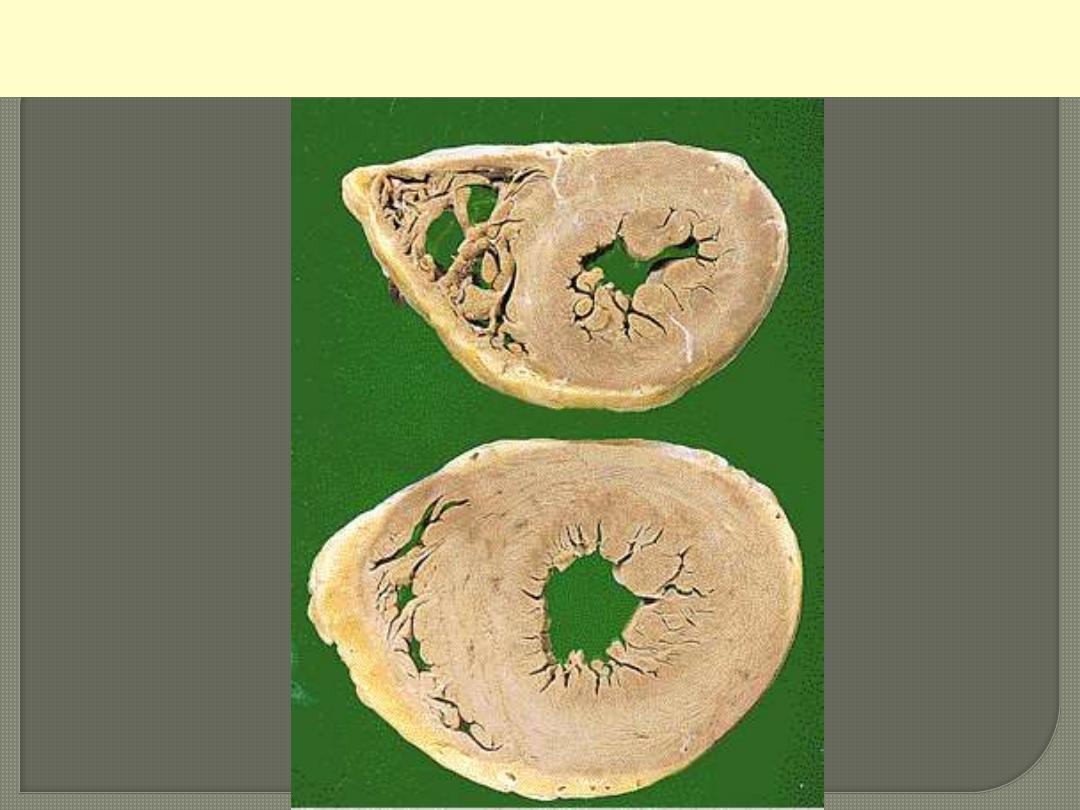
Comparison between normal heart (above) & hypertrophied heart
(below)
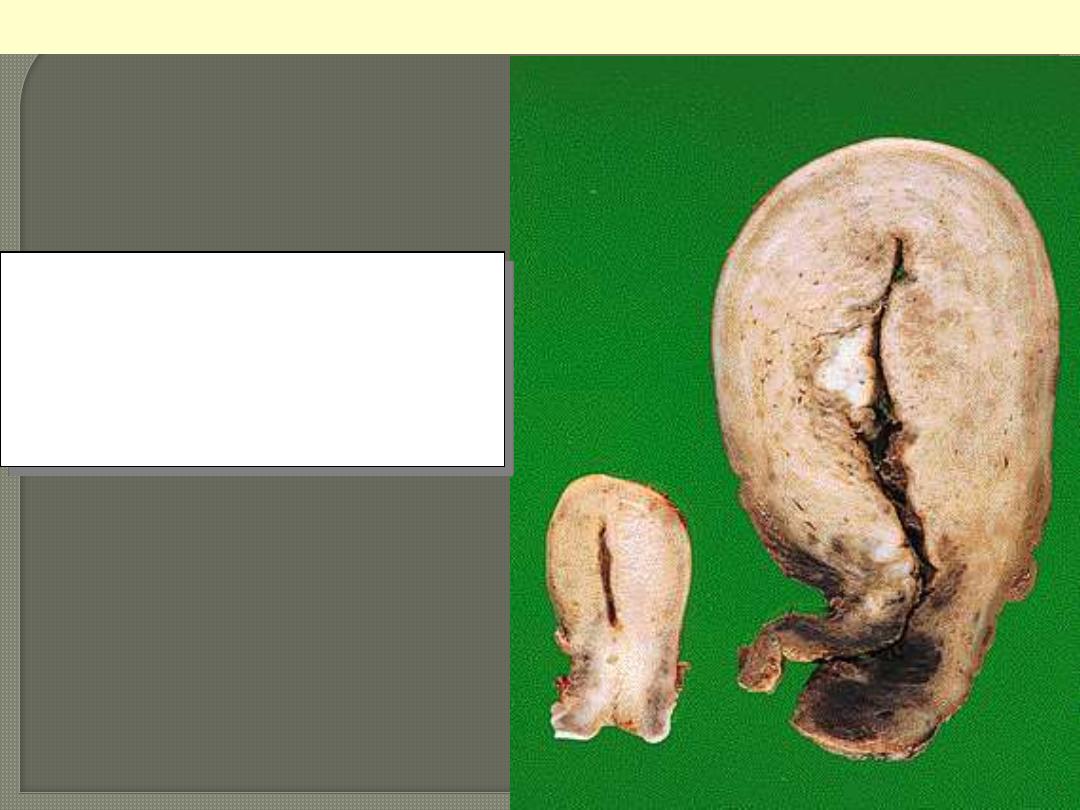
Uterine hypertrophy in pregnancy
On the left is a normal uterus showing the
normal mass of smooth muscle in its wall. On
the right is a uterus from a pregnant women,
in which the striking increase in mass of
smooth muscle is evident. At cellular level this
is due to both hyperplasia and hypertrophy of
uterine smooth muscle.
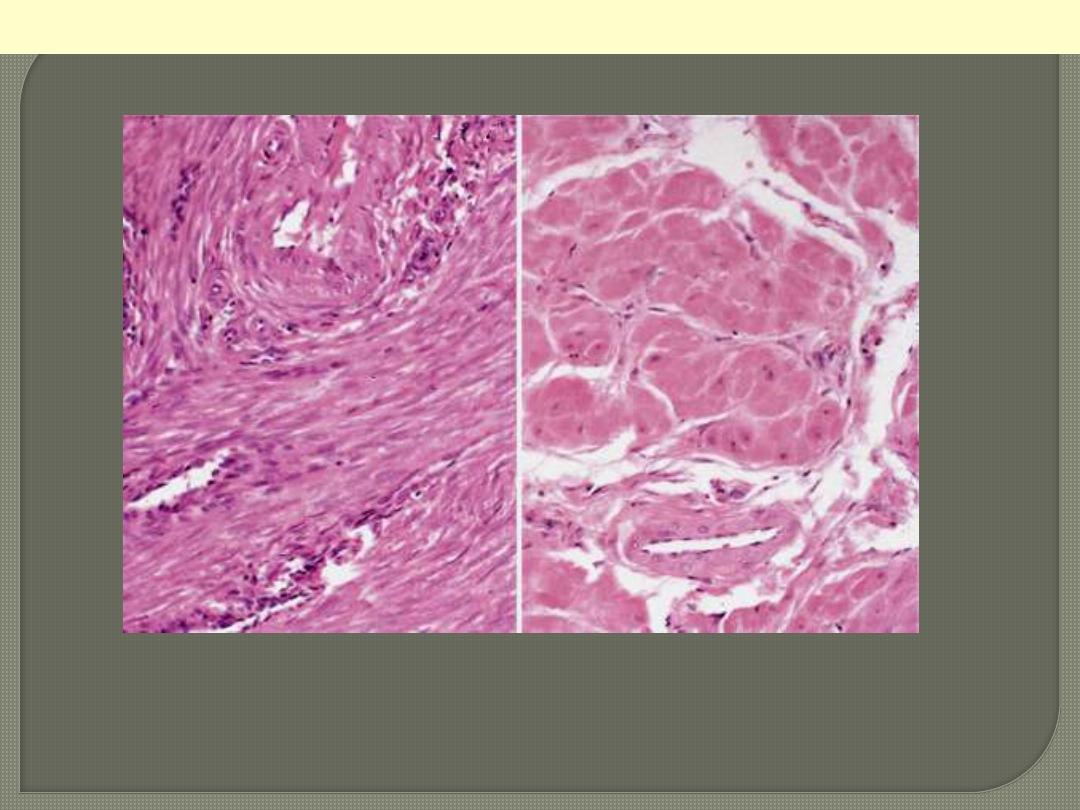
Lt. small spindle-shaped uterine smooth muscle cells from a normal uterus. Compare this with (Rt)
large, plump hypertrophied smooth muscle cells from a gravid uterus (same magnification).
Normal Vs hypertrophied uterine smooth muscle cells

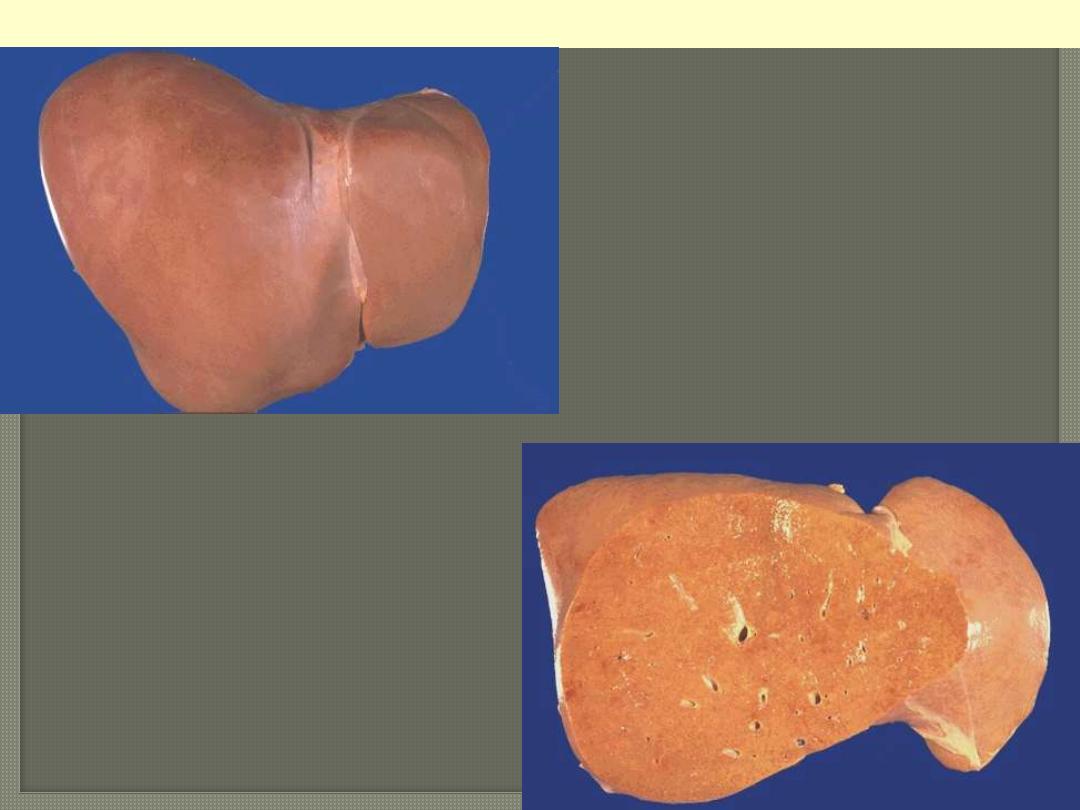
Fatty change liver
Normal
Fatty change
Severe fatty change liver
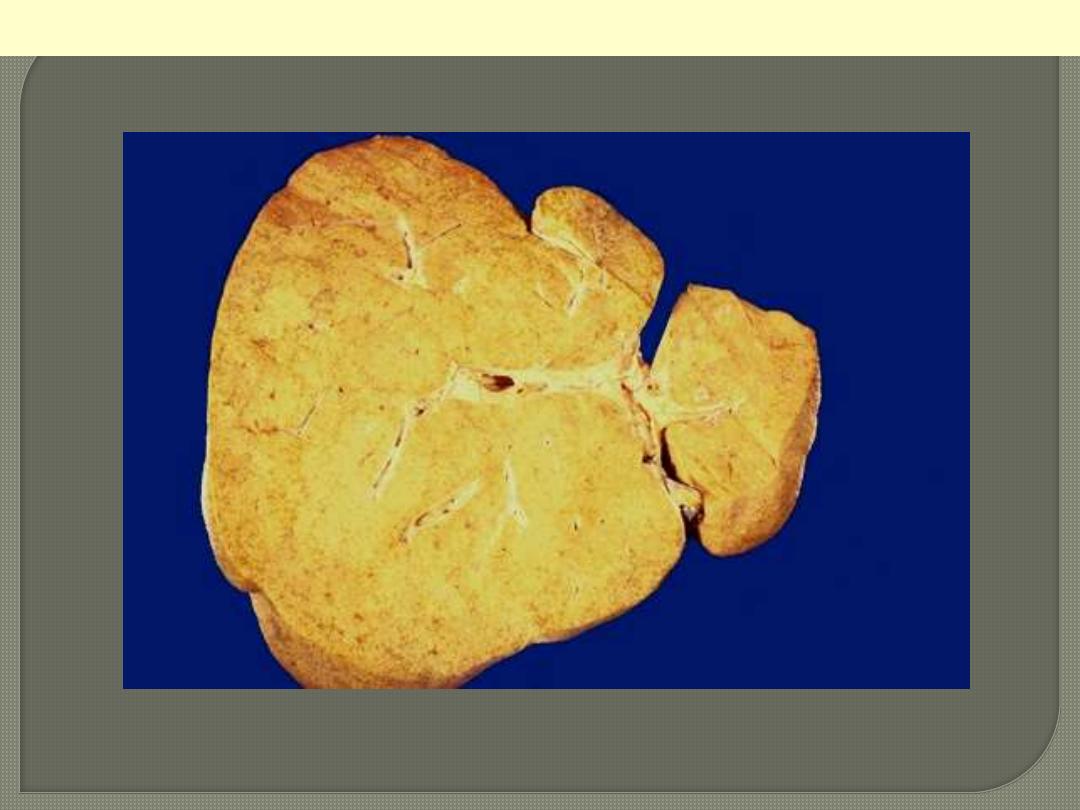
In the liver mild fatty change shows no gross changes, but with progressive accumulation, the organ
enlarges and become increasingly yellow, soft and greasy to touch.

In the early stages: small fat vacuoles around the nucleus but with progression these coalesce into a
large clear space that displaces the nucleus to the periphery (macrovesicular steatosis).
Fatty change liver
Macrovesicular steatosis a higher power of previous figure.
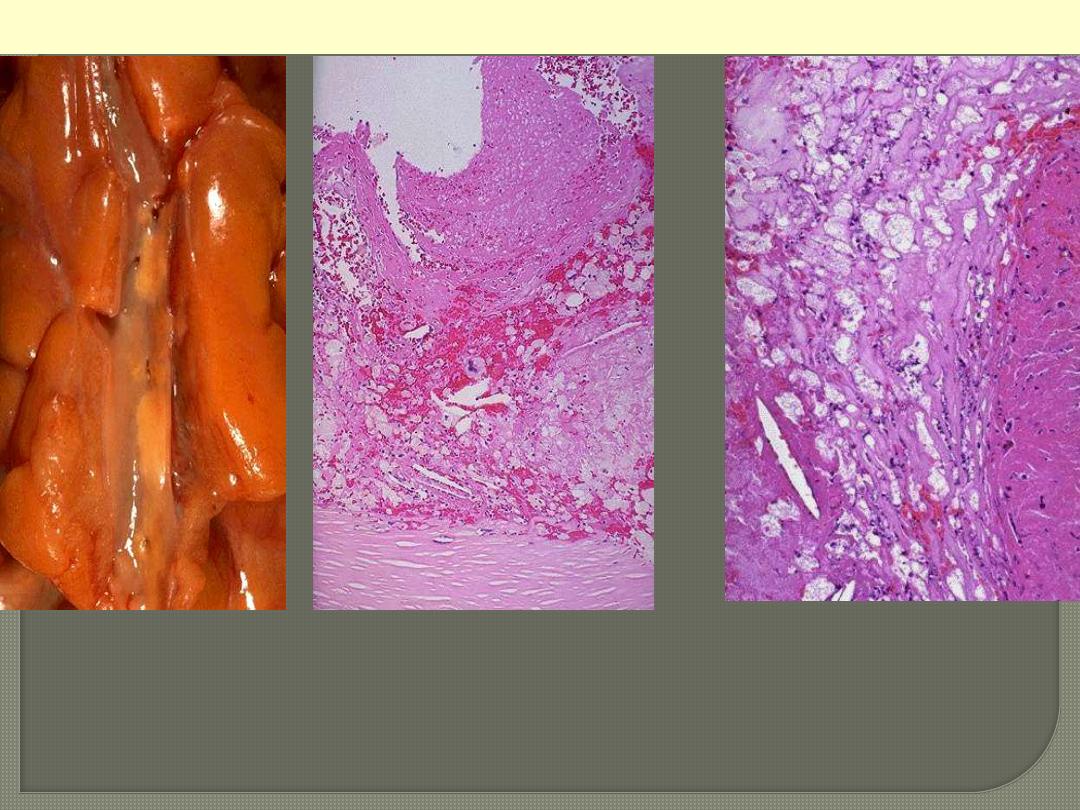
Rt. A coronary artery has been opened longitudinally; it is surrounded by epicardial fat. This coronary shows
occasional yellow-tan lipid plaque and no narrowing.
Middle: the lumen of the artery is at the top, and the band of smooth muscle at the bottom is the atrophic media. The
intima is enormously thickened, by the presence of amorphous material containing large numbers of cholesterol
crystals (the unstained clefts). There are many foamy (lipid-filled) macrophages.
Lt. This high magnification of the atheroma shows numerous foam cells and an occasional cholesterol cleft.
Coronary atherosclerosis
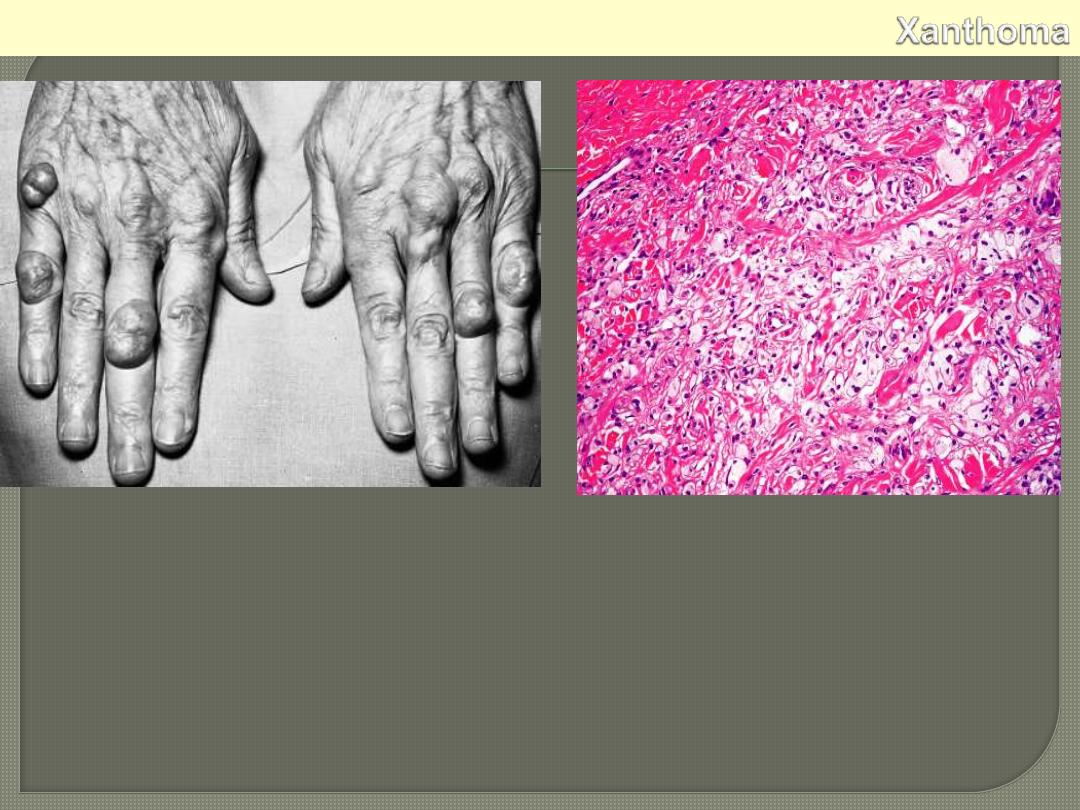
Cutaneous xanthoma showing ill-defined
collection of foamy macrophages in the dermis.
Xanthoma tuberosum multiplex in patient with
hypercholesterolemia.
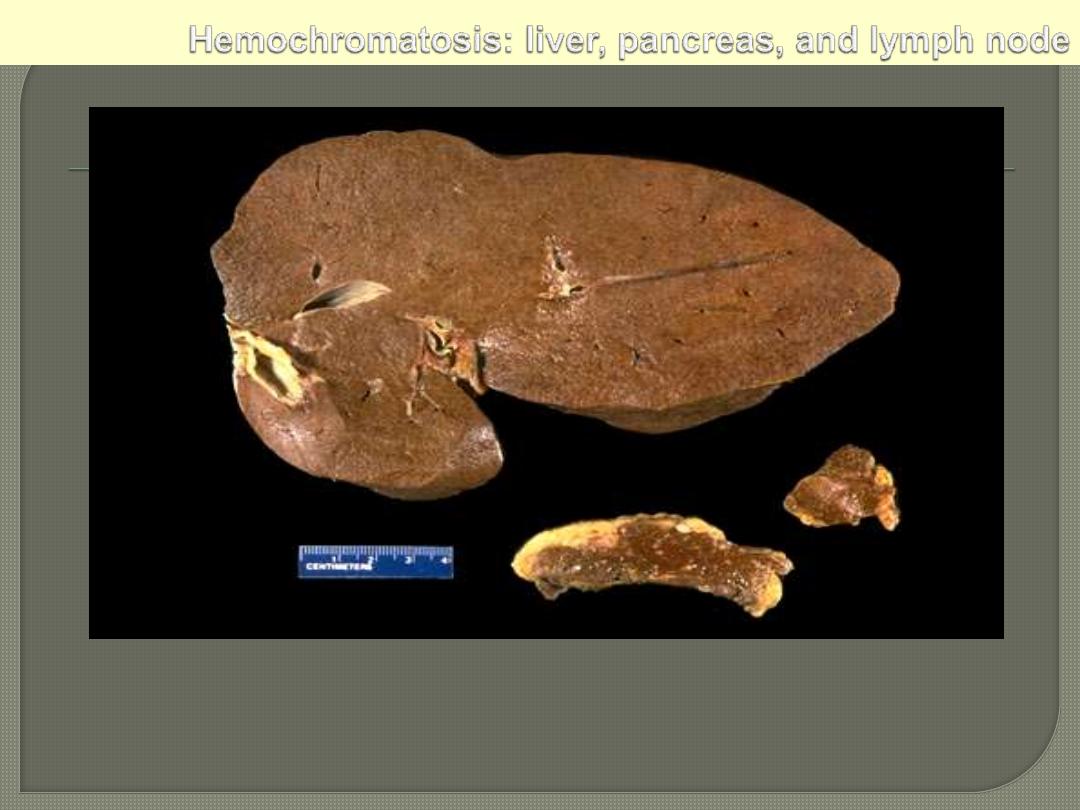
The dark brown color of the liver, as well as the pancreas (bottom center) and lymph nodes (bottom
right) on sectioning is due to extensive iron deposition in a middle-aged man with hereditary
hemochromatosis.
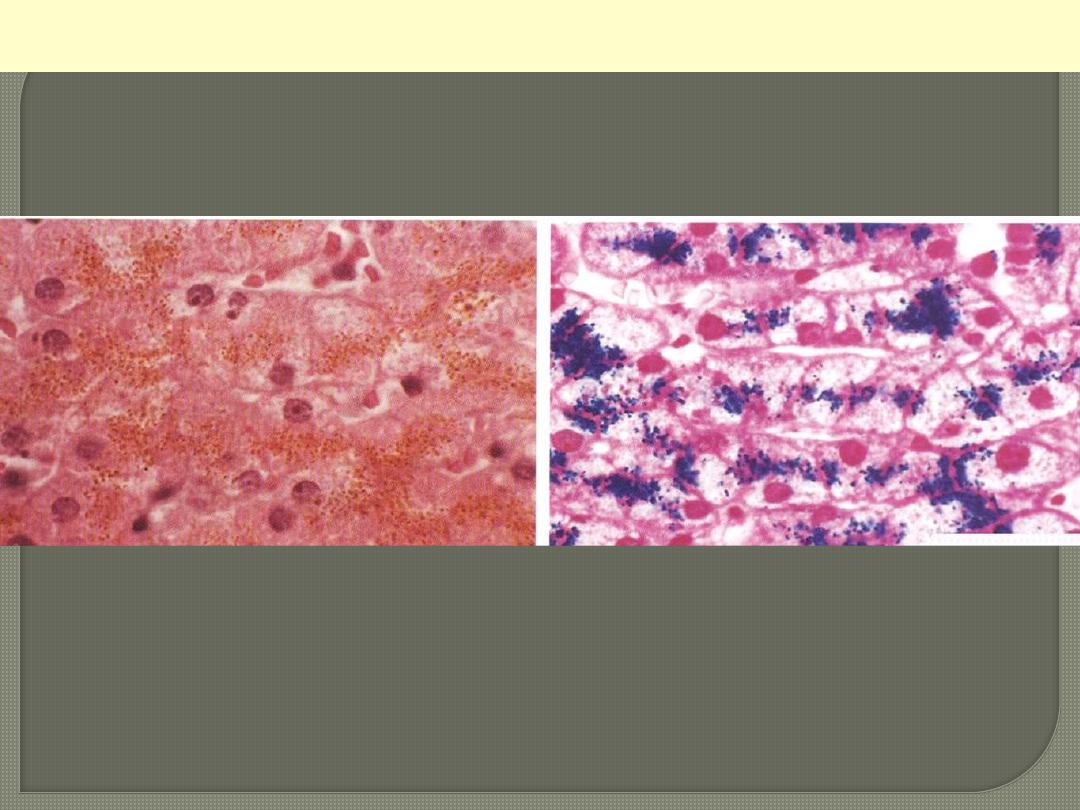
Hemosiderin granules liver cells
Rt: H&E stained section showing hemosiderin as yellow-brown finely granular pigment within
hepatocytes.
Lt.: same section stained with an iron stain (Prussian blue); the hemosiderin granules are deep blue.
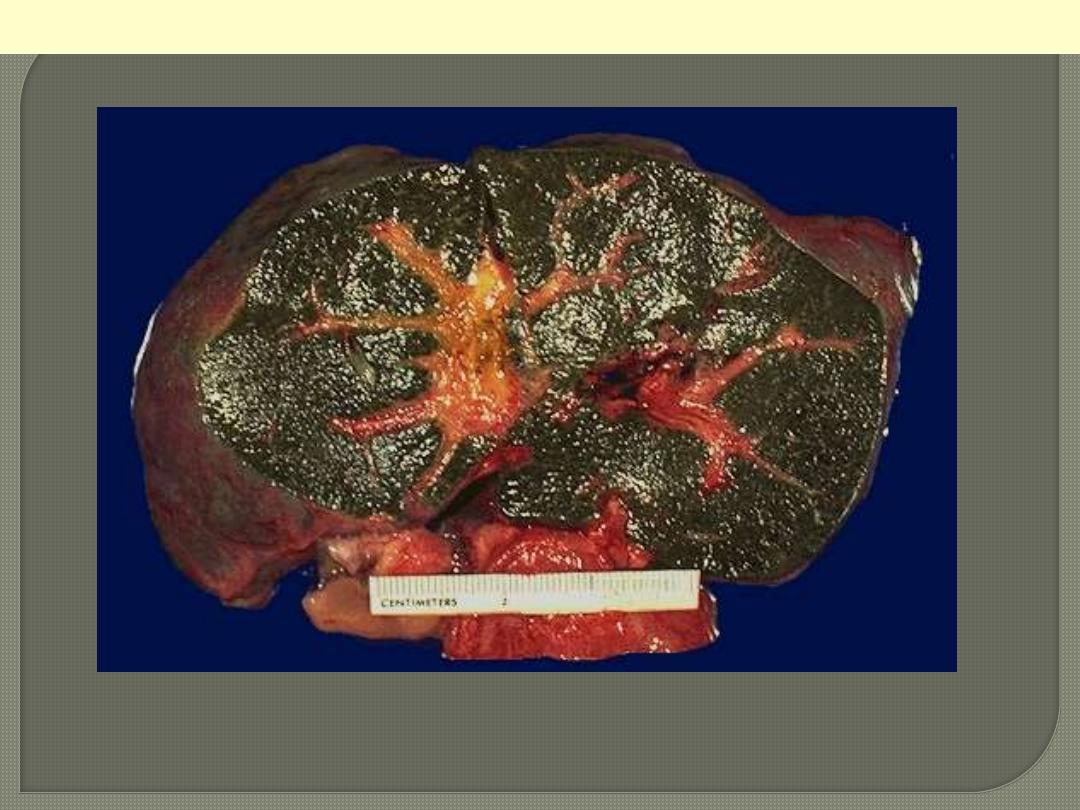
This 3-month-old child died with extrahepatic biliary atresia, a disease in which there is inflammation
with stricture of hepatic or common bile ducts. The dark green color comes from formalin acting on
bile bigments in the liver from marked cholestasis, turning bilrubin to biliverdin.
Bile-stained liver

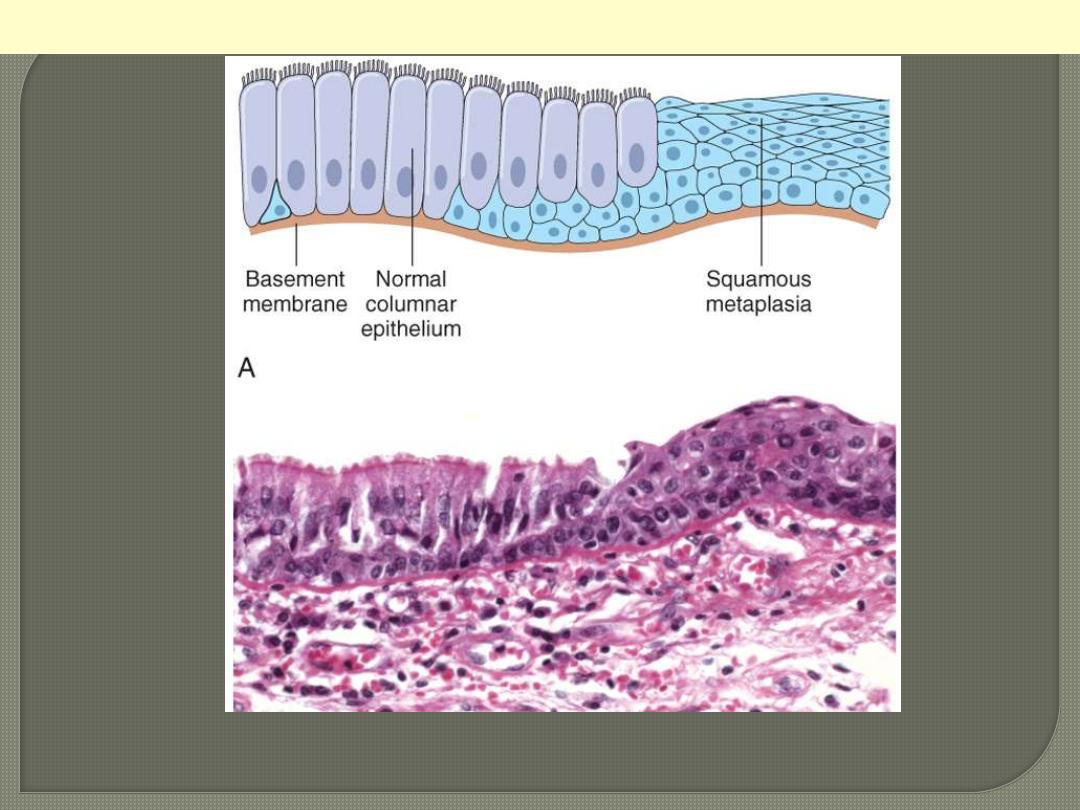
Metaplasia of normal columnar (left) to squamous epithelium (right) in a bronchus, shown (above)
schematically and (down) histologically.
Epithelial Metaplasia
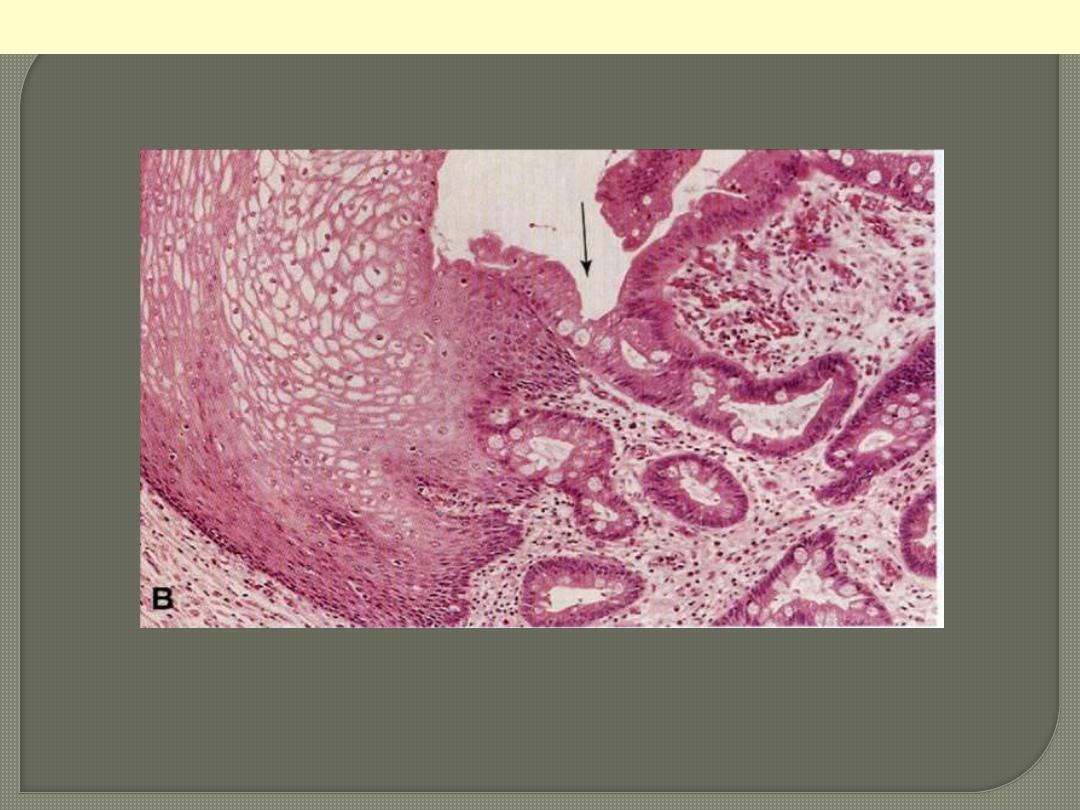
Metaplastic transformation (arrow) of the normal esophageal stratified squamous epithelium (Lt) to
mature columnar epithelium (Barrett esophagus)
Columnar (intestinal) metaplasia esophagus

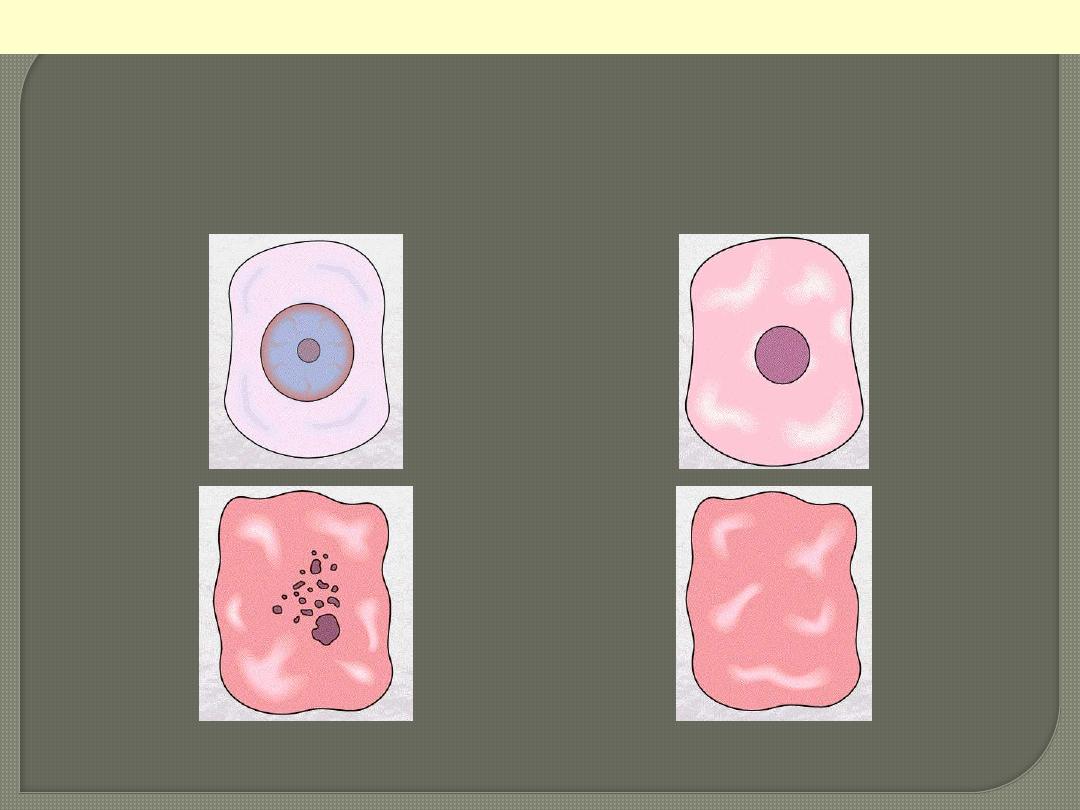
normal
pyknosis
karyorrhexis
karyolysis
Cell necrosis: Nuclear changes
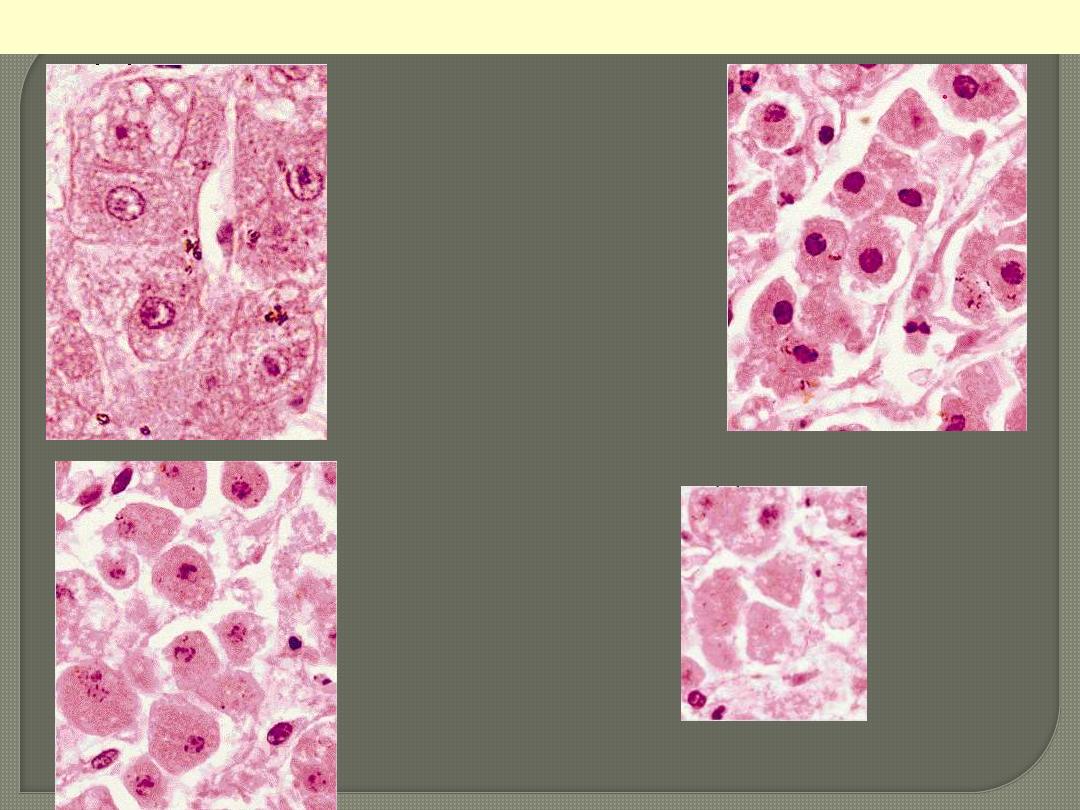
Liver cell necrosis: Nuclear changes
normal
pyknosis
karyorrhexis
karyolysis
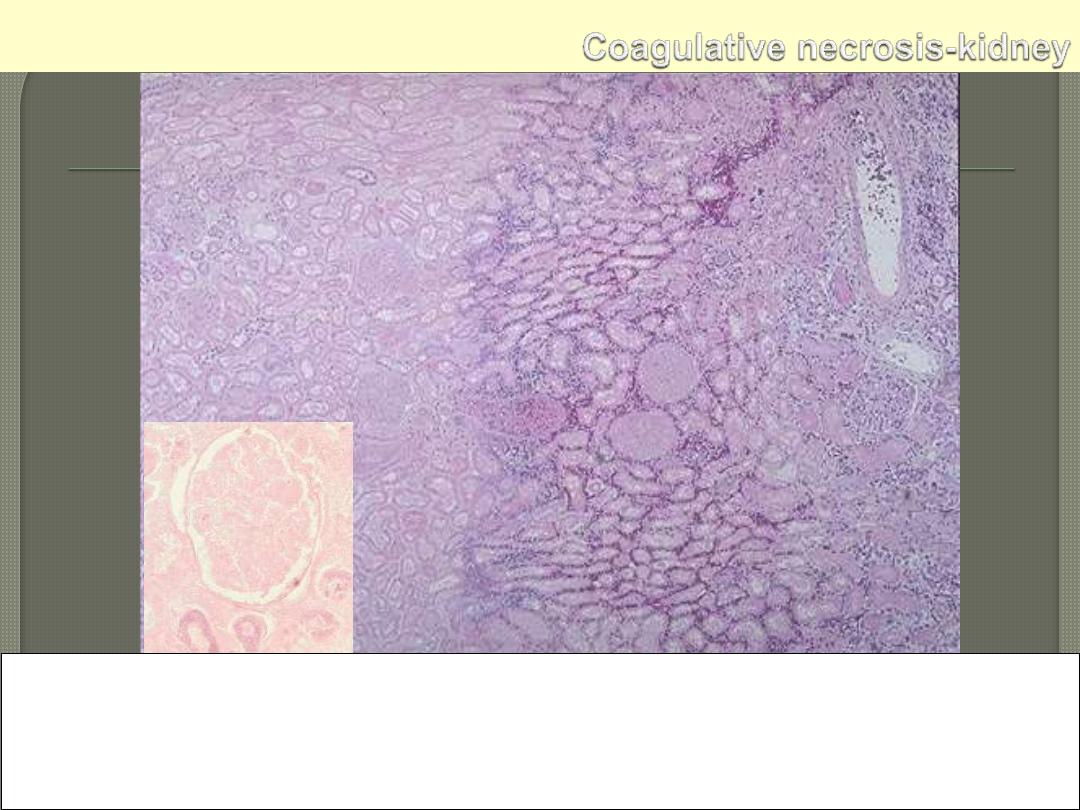
Microscopically, the renal cortex has undergone anoxic injury at the left so that the cells appear pale
and ghost-like. There is a hemorrhagic zone in the middle where the cells are dying or have not quite
died, and then normal renal parenchyma at the far right. This is an example of coagulative necrosis
Within the area of necrosis (Lt) the outlines of tubules and glomeruli are still preserved but fine
structural details are lost (inset)
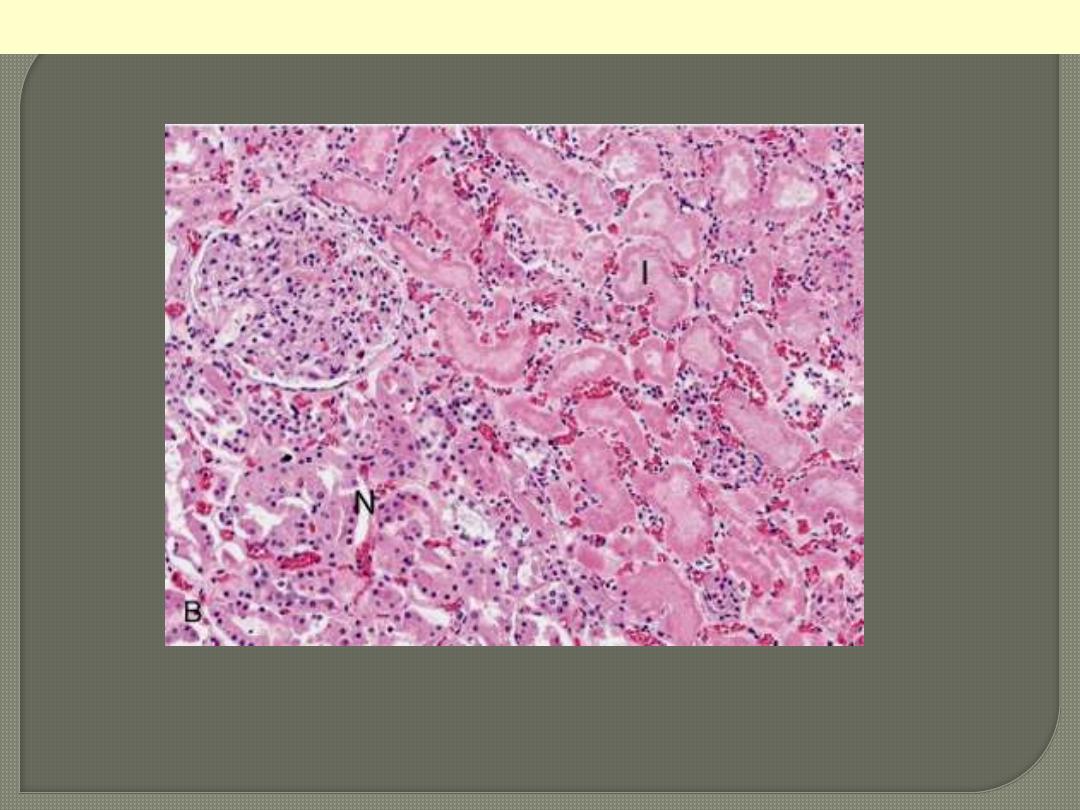
Microscopic view of the edge of the infarct, with normal kidney (N) and necrotic cells in the infarct (I).
The necrotic cells show preserved outlines with loss of nuclei, and an inflammatory infiltrate is present
(difficult to discern at this magnification).
Coagulative necrosis Kidney
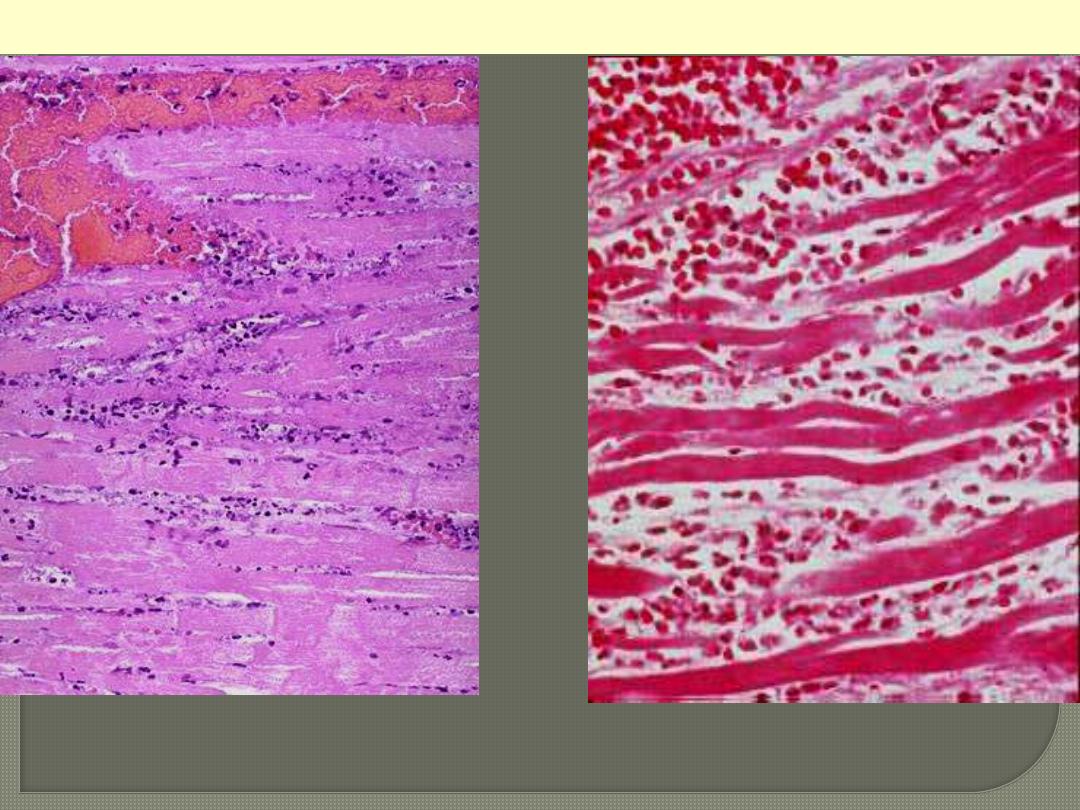
The necrotic myocytes are intensely eosinophilic with loss of both cross striations & nuclei. The outlines
of individual fibres are still maintained. There are inflammatory cells infiltration & RBCs in-between
the necrotic fibers.
Coagulative necrosis myocardium
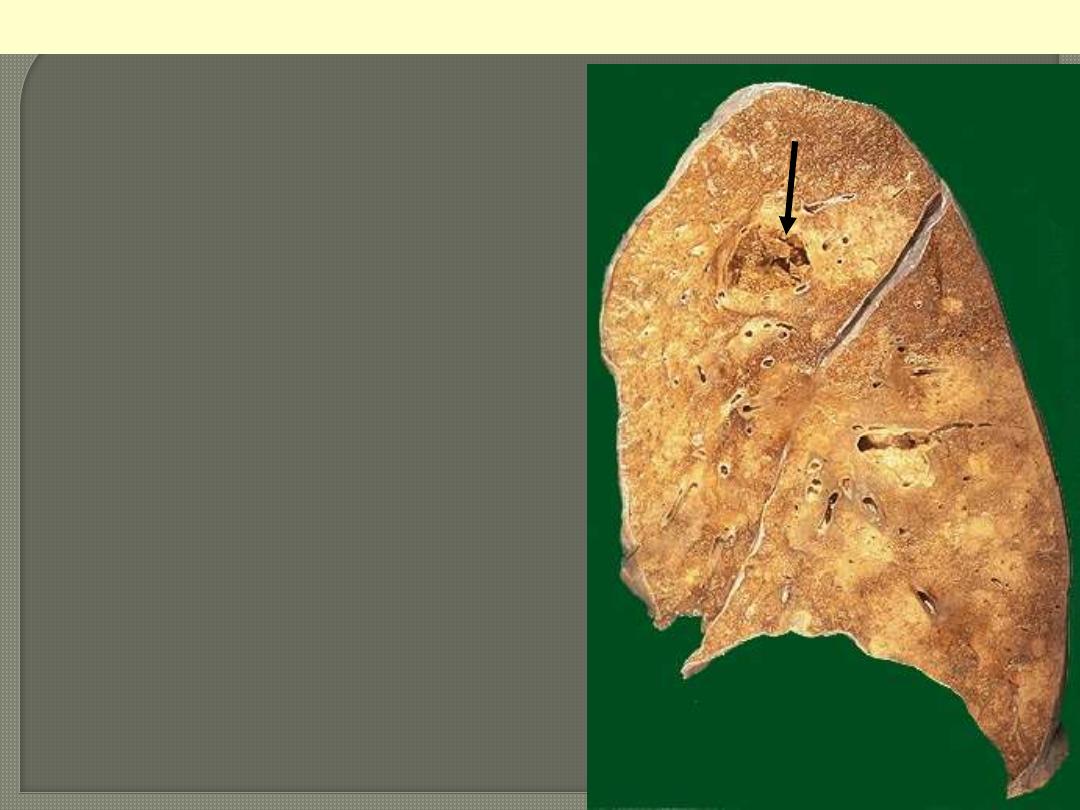
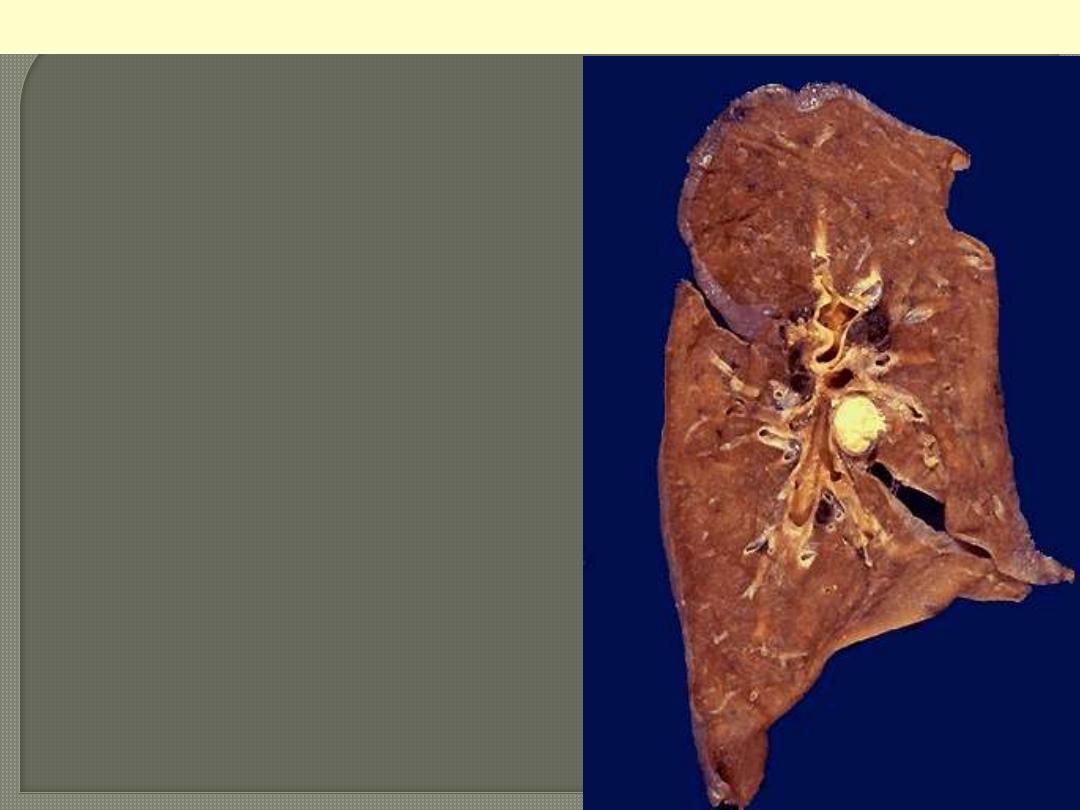
This is an example of liquefactive necrosis. There
is confluent bronchopneumonia (scattered pale
areas) complicated by abscess formation, which is
seen here as a cystic cavity (arrow). The
contained pus poured off during the sectioning of
the lung tissue.
Lung abscess
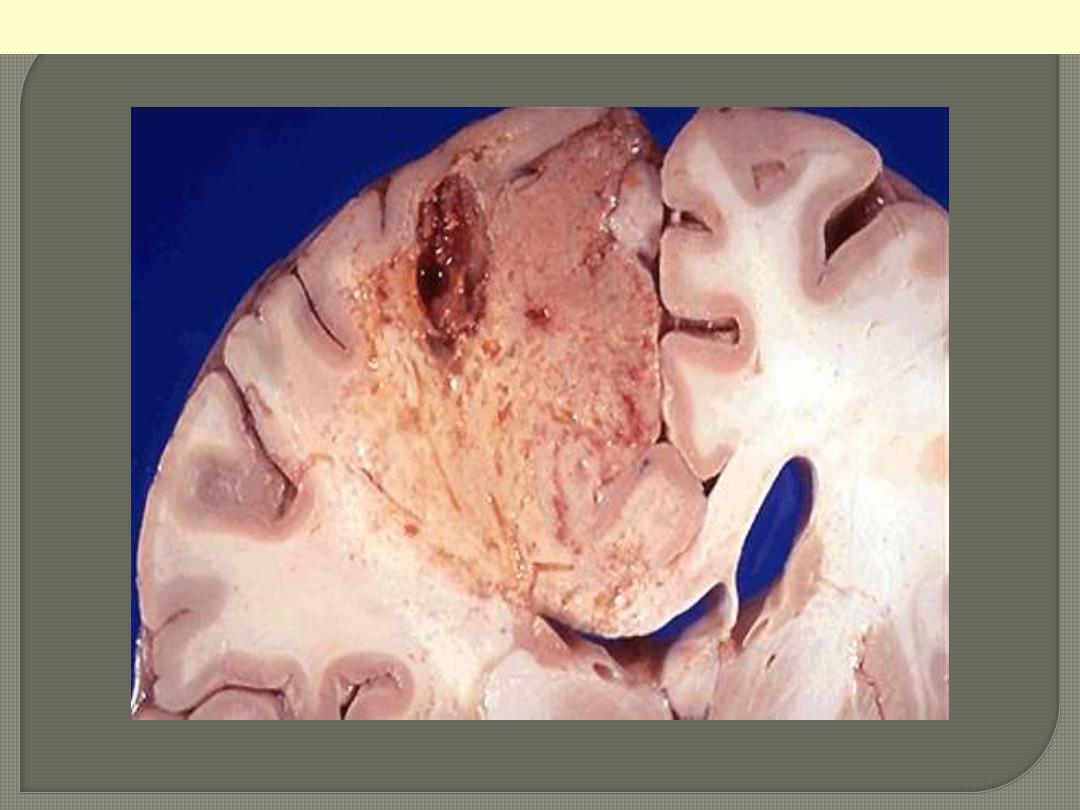
This is an example of liquefactive necrosis; the affected area is wedge-shaped, pale, soft & cystic.
Brain infarction
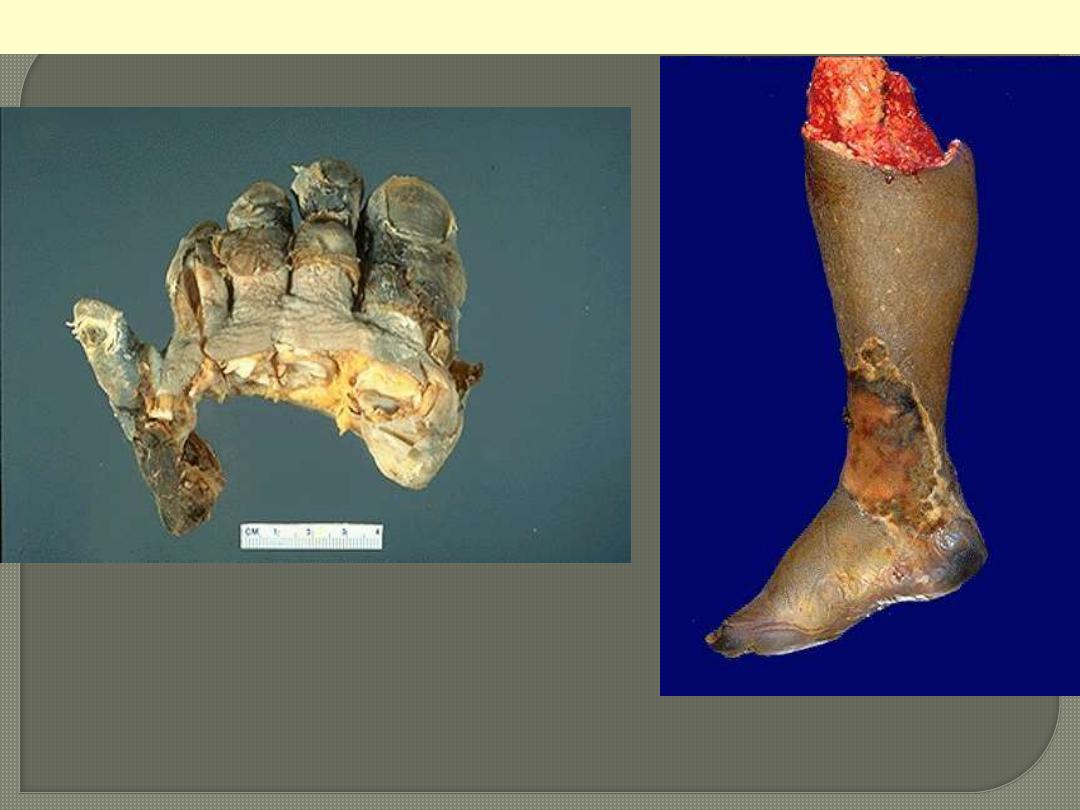
Dry gangrene
Ganagrene of lower limb
Wet gangrene
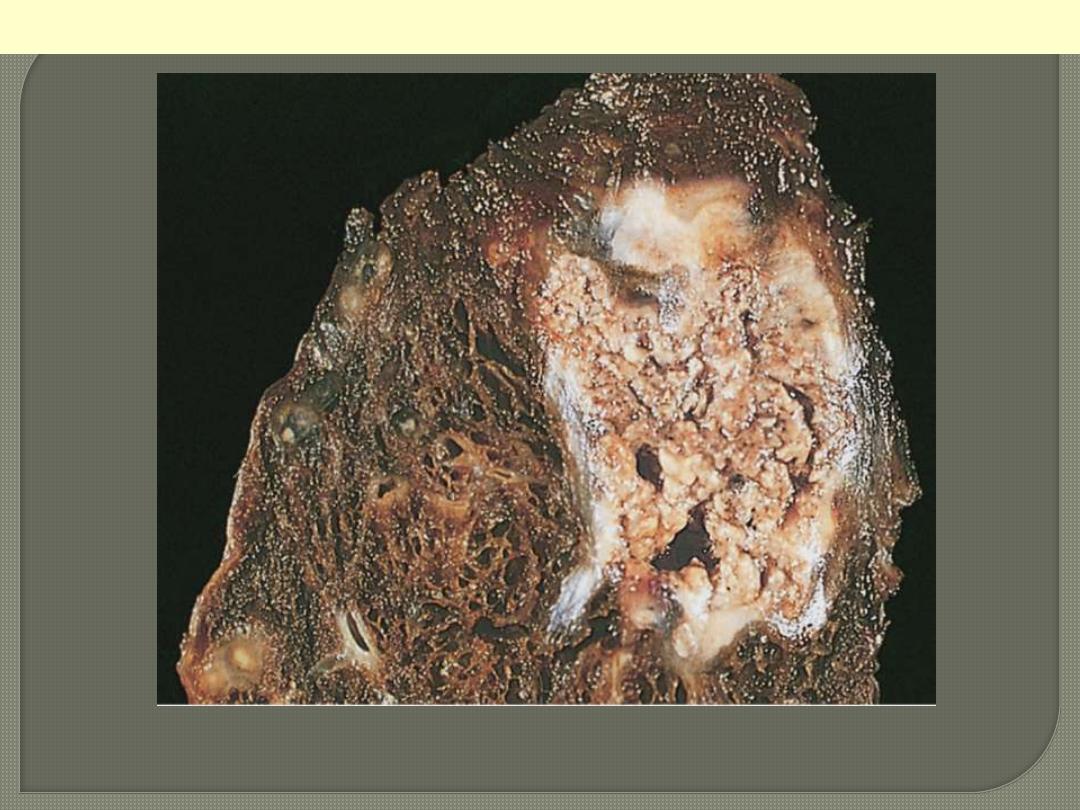
A tuberculous lung with a large area of caseous necrosis containing yellow-white and cheesy debris.
Caseous necrosis
This is the gross appearance of caseous necrosis
in a hilar lymph node infected with
tuberculosis. The node has a cheesy yellow to
white appearance. Caseous necrosis is really
just a combination of coagulative and
liquefactive necroses
Caseous necrosis
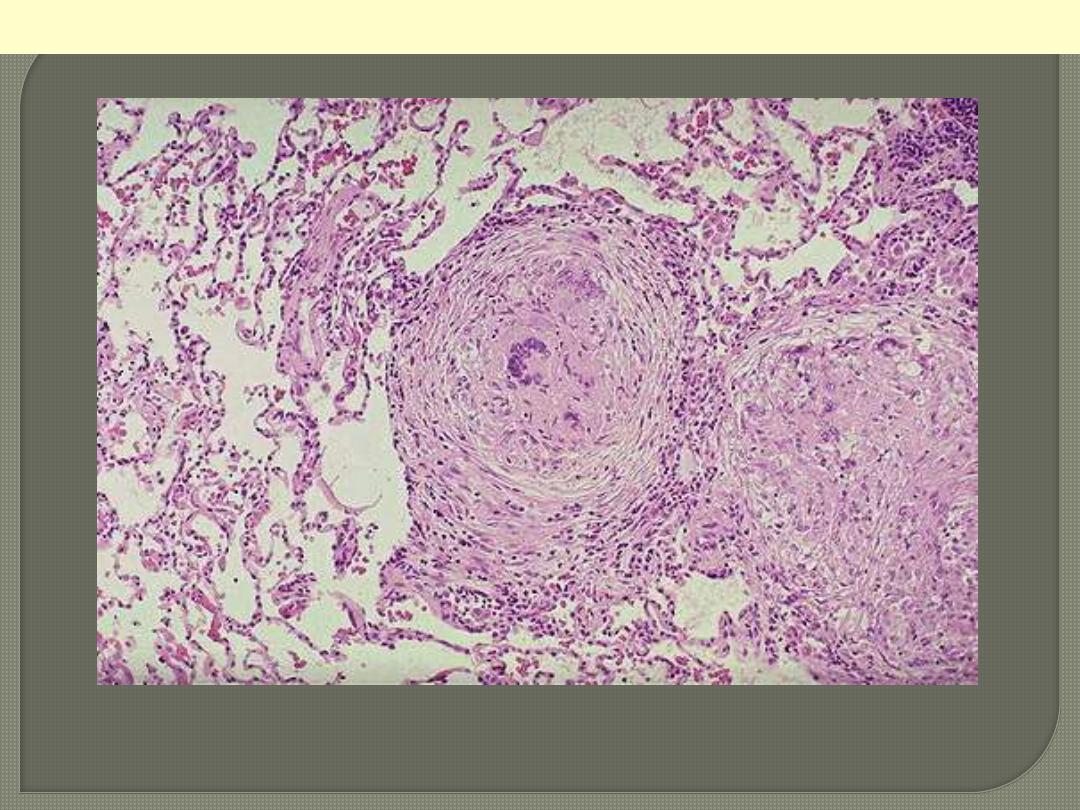
TB granulomas lung
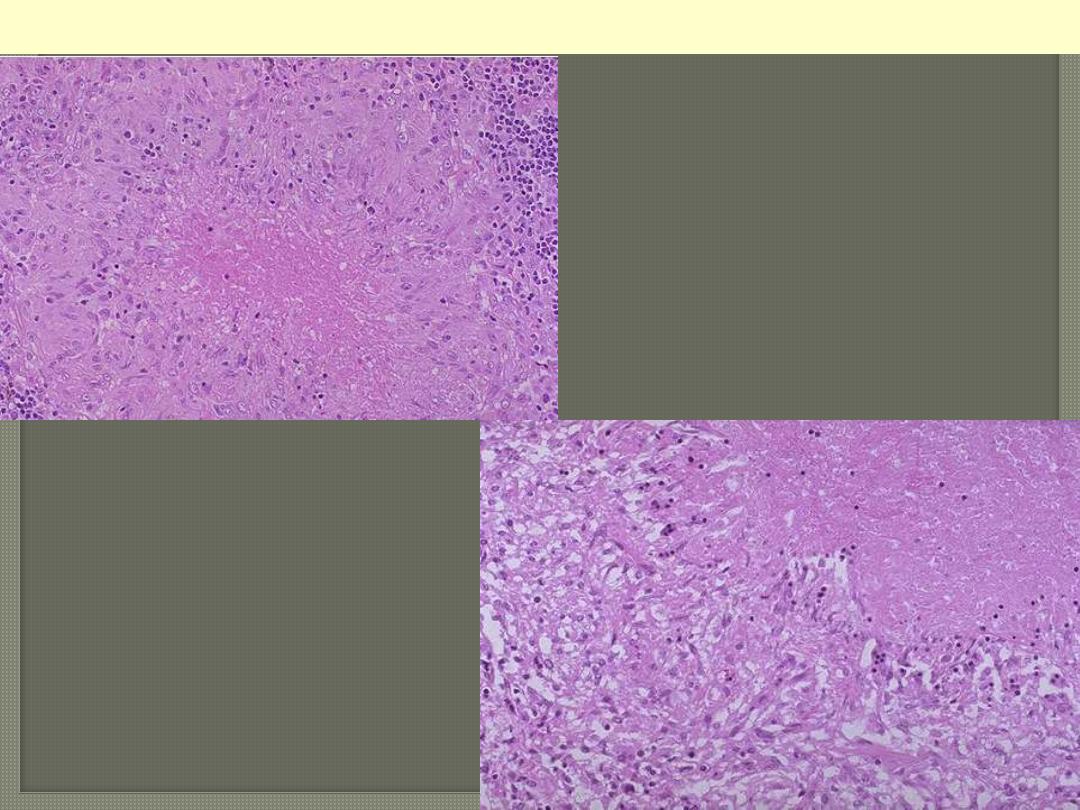
Microscopically, caseous necrosis is
characterized by amorphous (acellular),
granular pink areas of necrosis, as seen here at
the upper Lt, surrounded by a granulomatous
inflammatory process. The lower Rt. Photo is a
close up view
Caseating TB granuloma
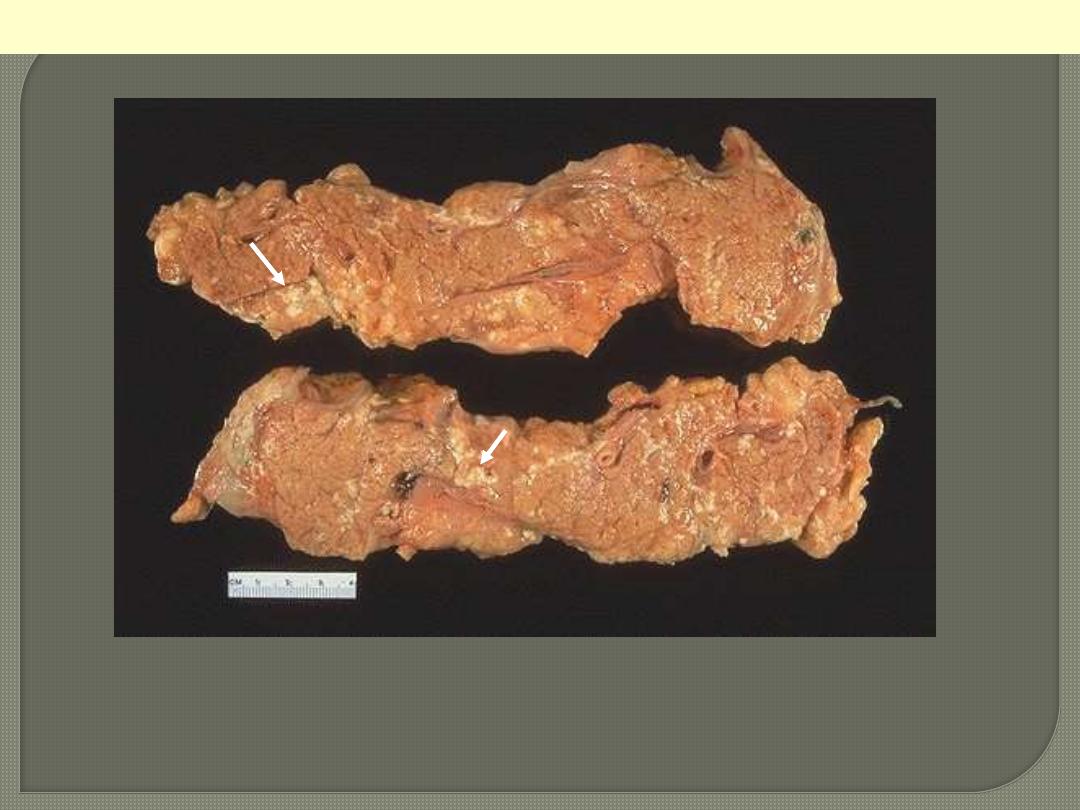
Injury to the pancreatic acini leads to release of powerful enzymes which damage fat through lipases;
these liberate fatty acids which complex with calcium leading to the production of soaps, and these
appear grossly as the soft, chalky white areas seen here on the cut surfaces.
Fat necrosis of acute pancreatitis
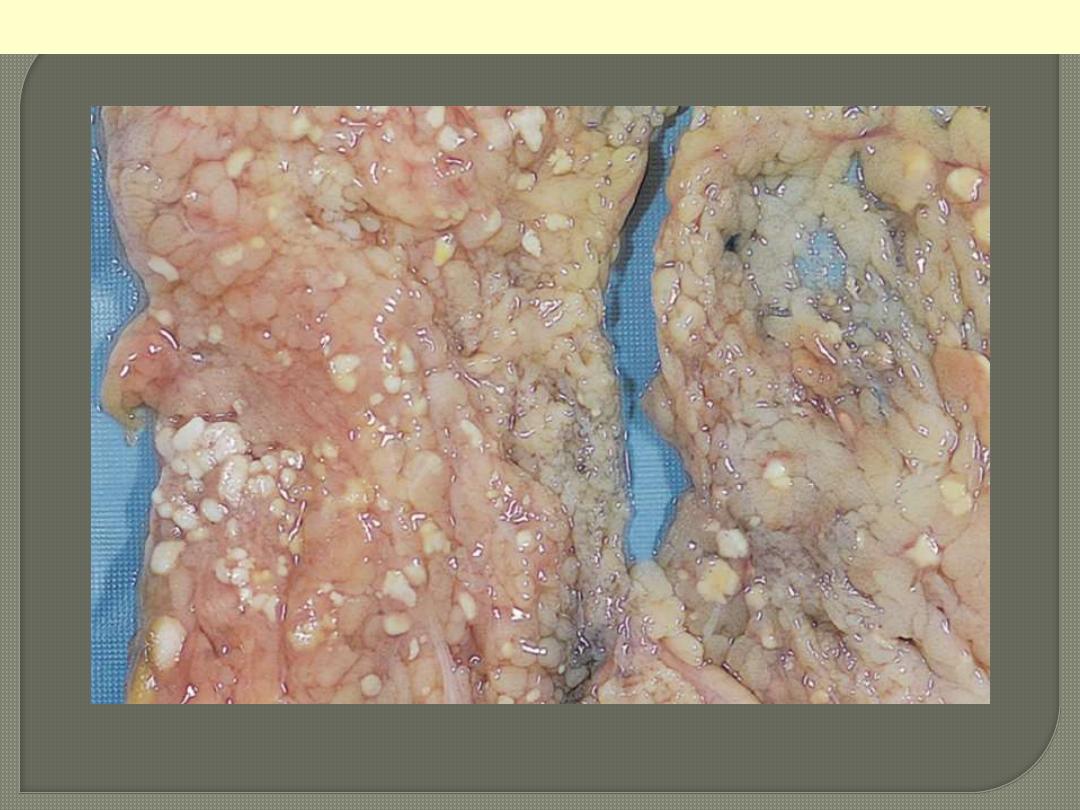
The areas of white chalky deposits represent foci of fat necrosis with calcium soap formation
(saponification) at sites of lipid breakdown in the mesentery.
Fat necrosis in acute pancreatitis.
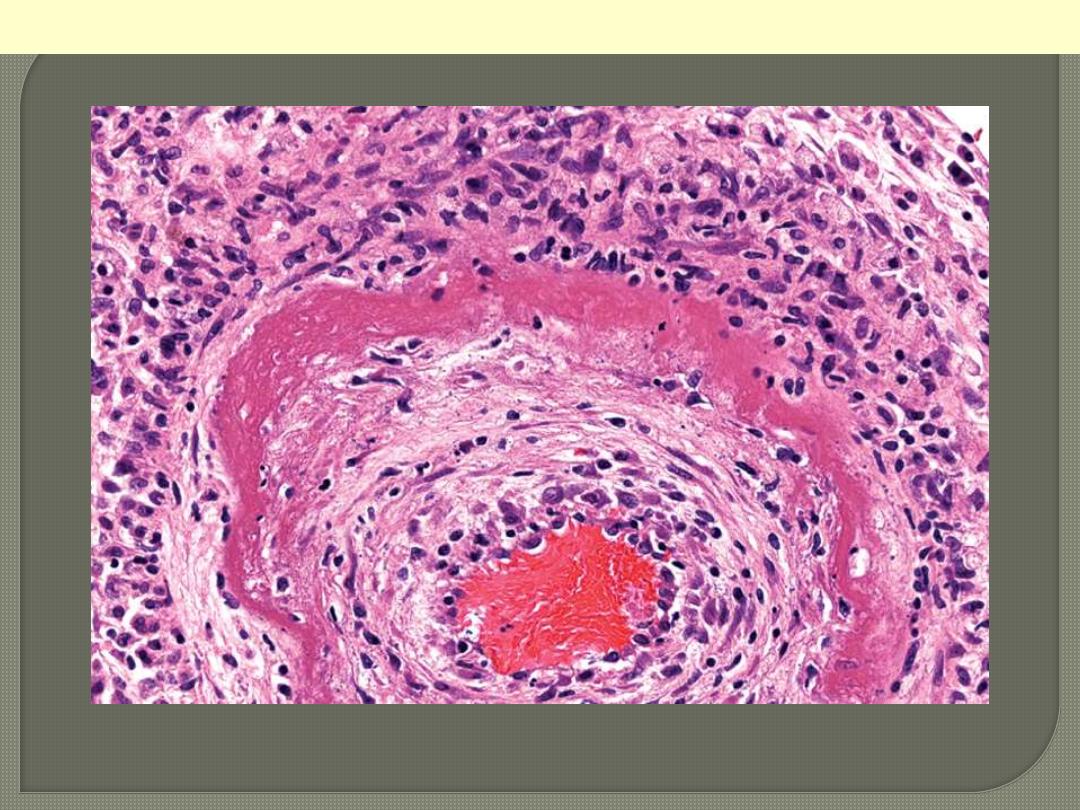
The wall of the artery shows a circumferential bright pink area of necrosis with protein deposition and
inflammation (dark nuclei of neutrophils).
Fibrinoid necrosis of an artery in polyarteritis nodosa.