Vital
statistics

Definition
By vital statistics we refer to data collected from ongoing recording, or
registration, of all "vital events"-births, deaths and fetal deaths,
marriages and divorces.
Tools and techniques used to evaluate the health status of the
community. In such a context the community may be thought of as a
complex living organism for which the public health team is the
physician and the vital statistics are the signs and investigations used
for the evaluation

The physician is responsible for filling the certificates of death, birth and
fetal death. The legal responsibility for registration of vital events is
centralized in the government.
The registration of birth and death is an excellent source of data since it
is advantageous to the individual and family. Proof of birth is required to
obtain a passport and for school entrance. Death certificates are
needed for receipt of veterans and social security benefits.

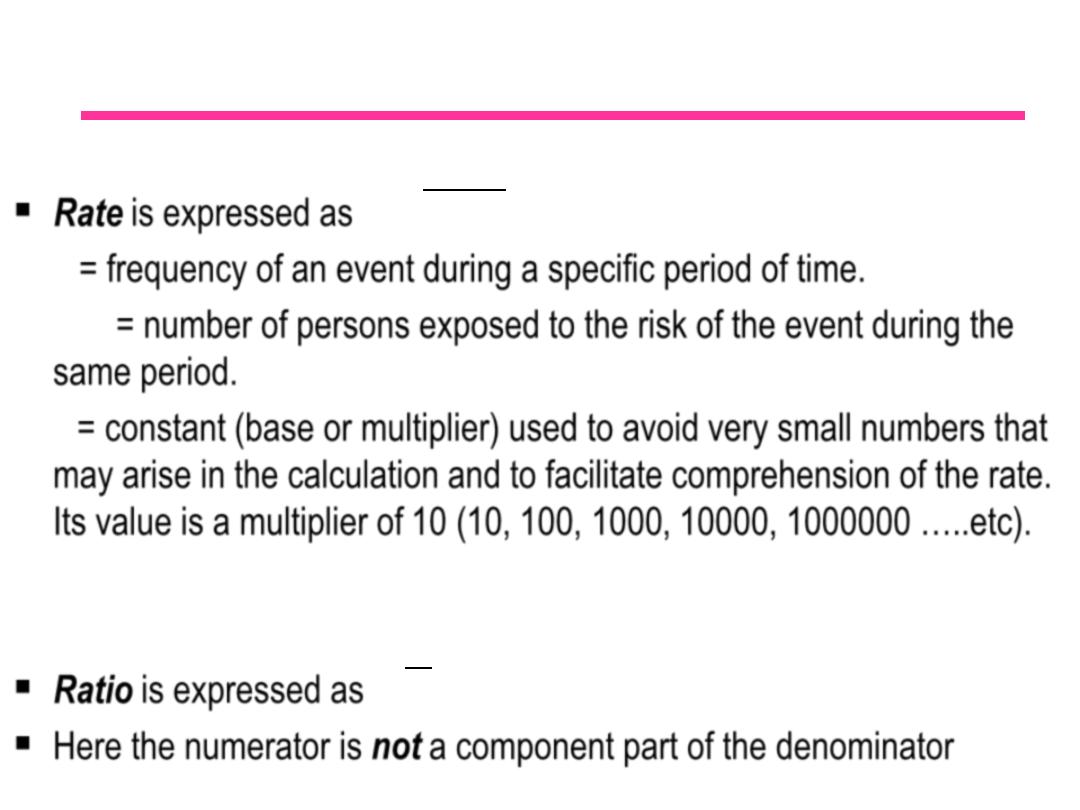
Rate
is expressed as
a = frequency of an event during a specific period of time.
a+b = number of persons exposed to the risk of the event during the
same period.
k = constant (base or multiplier) used to avoid very small numbers that
may arise in the calculation and to facilitate comprehension of the rate.
Its value is a multiplier of 10 (10, 100, 1000, 10000, 1000000 …..etc).
Ratio
is expressed as
Here the numerator is
not
a component part of the denominator
k
b
a
a
k
b
a

Death rates and ratios
1. Crude death rate = Number of deaths during a year x k
Average (mid year) population
2. Specific death rate =
Number of deaths in a specific subgroup (during a year) x k
Average (mid year) population for the specific subgroup
Subgroups may be distinguished on the basis of age, sex and race
Number of deaths from a particular
3. Cause specific death rate = cause or diagnosis (during a year) x k
Average (mid year) population

Death rates and ratios
4. Cause of death ratio =
Number of deaths from a particular cause or diagnosis (during a year) x k
Total number of deaths (from all causes) during a year
Useful in listing the 10 leading causes of death in a population and thus one
can assess the relative importance of each cause of death.
5. Proportional mortality ratio = Number of deaths in a particular subgroup x k
Total number of deaths

Death rates and ratios
6. Adjusted or standardized death rates: it takes into account the population
structure (age, sex or gender) and its effect on overall death rate. Useful in
comparing between two populations or the same population over time.
7. Maternal mortality rate = Deaths from puerperal causes (during a year) x k
Number of live births during the year

Limitations of maternal mortality rate
Fetal deaths are not included in the denominator, which results in
an inflated rate, since a mother can die from a puerperal cause
without producing a live birth.
A maternal death can be counted only once, although twins or
larger multiple births may have occurred, resulting in
underestimation of rate.
Number of live births is used in the denominator instead of total
number of pregnancies, the at risk population, which one has no
mean of accurately assessing it.

Other definitions
Puerperal causes:
deaths that can be ascribed to some phase of
child bearing
Live birth:
A complete expulsion or extraction from its mother of a
product of human conception, irrespective of the duration of
pregnancy, which after expulsion or extraction, breaths, or shows any
other evidence of life such as beating of the heart, pulsation of the
umbilical cord, or definite movement of voluntary muscles, whether or
not the umbilical cord has been cut or the placenta is attached. (WHO
1950)

Death rates and ratios
8. Infant mortality rate =
Number of deaths under 1 year of age (during a year) x k
Number of live births during the year
Limitations of this rate:
Many infants who die in a given calendar year were born during the
previous year, and similarly many children born in a given calendar
year will die during the following year. In a population with stable birth
rate, this does not pose a serious problem. One way to adjust for this
problem is to allocate the infant deaths to the calendar year they
were born before computing the rate.

Death rates and ratios
9. Neonatal mortality rate =
Number of deaths under 28 days of age (during a year) x k
Number of live births during the year
10. Fetal death rate = Number of fetal deaths (during a year) x k
Number of live births + number of fetal
deaths in the same year
Number of fetal deaths (>28 weeks of gestation) +
11. Perinatal death rate =infant deaths under 7 days of age (during a year) x k
Number of live births + Number of fetal deaths
(>28 weeks of gestation) in the same year
This combination is justified, since fetal deaths occurring during late pregnancy and neonatal
deaths have the same underlying causes.

Death rates and ratios
Fetal death:
Death prior to complete expulsion or extraction from its
mother of a product of human conception, irrespective of the duration of
pregnancy, the death is indicated by the fact that after such expulsion or
extraction the fetus does not breath or shows any other evidence of life
such as beating of the heart, pulsation of the umbilical cord, or definite
movement of voluntary muscles. (WHO 1950)
Some states specifies the length of gestation in defining fetal death: a
stated or presumed gestation period of 20 weeks or more is necessary
for definition of a fetal death.

Measures
of
fertility

Fertility
refers to actual bearing of children
Fecundity
refers to the capacity to bear children
1. Crude birth rate = Number of live births (during a year) x k
Average (mid year) population
2. General fertility rate = Number of live births (during a year) x k
Total number of women of child bearing age
Number of live births to women
3. Age-specific fertility rate = of a certain age (during a year) x k
Total number of women of the
specified age

4.
Total fertility rate:
Computed by multiplying the age specific
fertility rate of a specific age group by the width of age interval and
then summing the results for all age groups (reproductive years). If
the specific rates are calculated per 1000 (k = 1000), the resulting
figure is an estimate of the number of children a cohort of 1000
women would have if, during their reproductive years, they
reproduced at rates represented by the age specific fertility rates.
5. Standardized fertility rate
(age adjusted general fertility rate):
The age structure of a population affects the general fertility rate,
therefore it is better to control for the confounding effect of age
before making comparisons between populations.

Exercise
The table below contains data from Georgia Natality Vital Statistics report,
2000. Compute the age specific fertility rate, general fertility rate, age adjusted
general fertility rate and total fertility rate.
US population (year
2000)
Number of live births
to women of specified
age group
Number of women in
population
Age group
(years)
20,528,072
396
296,114
(10-14)
20,219,890
17,915
286,463
(15-19)
18,964,001
36,512
285,733
(20-24)
19,381,336
35,206
316,000
(25-29)
20,512,388
27,168
326,709
(30-34)
22,706,664
12,685
350,943
(35-39)
60,119,815
2,404
887,104
(40-54)
182,432,166
132,286
2,749,066
Total

Exercise
The following 2000 data were reported for the Clayton County (Georgia) Health
District. Compute the crude death rate, race specific death rates for white and
black, infant mortality rate, neonatal mortality rate, fetal death rate, cause of death
ratio for malignant neoplasms and major cardiovascular diseases .
Black
White
Total
Age group (years)
121,927
89,741
236,517
Total population
2,494
1,629
4,350
Total live births
32
8
41
Fetal deaths
Deaths
446
898
1,366
All ages
28
13
41
Under 1 year
18
6
24
Under 28 days
Cause of death
85
212
303
Malignant neoplasm
136
329
471
Major cardiovascular disease
