Dr. Ahmed Sameer Alnuaimi
MBChB, MSc, PhD Epidemiology

Learning Objectives:
1. Understand counts, ratios, proportions, and
rates.
2. Define, calculate, and interpret incidence.
3. Understand the use of person-time
denominators.
4. Distinguish between cumulative incidence and
incidence rate.
5. Define, calculate, and interpret prevalence.

Learning Objectives (cont.):
7. Distinguish between point and period
prevalence.
8. List special types of incidence and prevalence
measures.
9. Describe the interrelationship between
incidence, prevalence, and duration of
disease.
10.Differentiate the use of incidence and
prevalence measures.
Measures of health status convey information about
the occurrence of disease. They include:
Counts
Proportions
Ratios
Rates
Quantitative Measures of Health Status
Measurement
of rate
Comparison
of rate
Epidemiology

• Simplest / most frequently performed measure in
epidemiology
• Refers to the number of cases of a disease or
other health phenomenon being studied
• Useful for allocation of health resources (at the
policy level of MOH)
• Limited usefulness for epidemiologic purposes
without knowing size of the source population.
Counts

Counts
– Limited Interpretation
New Cases Reporting
Location
of Disease
Period
Population
City A
20
1998 100
City B
100
1998
1000
Annual Rate of Occurrence
City A:
20 / 100
= 0.2
City B:
100 / 1000 = 0.1

Persons included in the numerator are
always
included
in the denominator:
A
Proportion:
--------
A + B
In epidemiology, tells us the fraction of the
population that is affected.
Proportions

Proportions - Example
A
B
Total (A + B)
# persons with
hypertension
# persons
without
hypertension
Total study
population
1,400
9,650
11,050
P (hypertensive) = A / (A + B) = (1,400 / 11,050)
= 0.127 = 12.7%

Numerical value of a proportion: 0 to 1
Linked to probability theory (i.e. risk of developing
disease)
For ease of usage, can multiply a proportion by
100 to get a percentage. Or use another power of
10 multiplier (constant)
Proportions-the role of constant

Like a proportion, is a fraction,
BUT
without a
specified relationship between the numerator and
denominator
Example: Occurrence of Major Depression
Female cases = 240 240
---------------------------- = ------ = 2:1 female to male
Male cases = 120
120
Ratios

A proportion in which
TIME
forms part of the
definition
Epidemiologic rates contain the following
elements:
•
disease frequency (in the numerator)
•
unit size of population
•
time period during which an event occurs
Rates

A) Events related to the population
Mortality rate
Morbidity rate
Age-specific rates of disease
Birth rates
Infant mortality rates
Perinatal mortality rates
Neonatal mortality rates
Two common types of rates

Case-specific fatality rates
Operative mortality
Still births
B) Events related to total number of events

Calculate crude annual death rate in the US:
Annual death count
Crude death rate = ----------------------------- x constant
Reference population
(during midpoint of year)
Death count in U.S. during 1990: 2,148,463
U.S. population on June 30, 1990: 248,709,873
2,148,463
Crude death rate = -------------- x 1,000 = 8.6 per 1,000
248,709,873
Rates
– Example

Classification of rates:
There are 2 major types of rates used in
epidemiology:
1.
Prevalence rate
2.
Incidence rate

Prevalence rate
Provides a snap shot of disease or health event.
There are 2 types of prevalence rates:
1.
Point prevalence rate: Proportion of individuals in
a specified population at risk who have the
disease of interest at a given point in time.
2.
Period prevalence rate: Proportion of individuals
in a specified population at risk who have the
disease of interest over a specified period of
time.

Incidence rate
Incidence rate is the basic measure of risk. Like
prevalence is of 2 types:
1.
Cumulative incidence rate: Number of new cases
of disease occurring over a specified period of
time in a population at risk (disease-free or
condition-free) at the beginning of the interval.
2.
Incidence density: Number of new cases of
disease occurring over a specified period of time
in a population at risk throughout the interval.

The numerator (number of new cases or events)
does not differ between the two types of incidence
rate. However, the denominator differs in incidence
density because it takes account:
Subjects lost to follow up during the time frame
(migration, death, lost interest in the study)
Subjects who had the disease (like influenza)
once and will not have it again in the same
season (not at risk any more).
Subjects who came to observation after the start
of study.

Incidence Density
No. new cases of disease during a given period
= -------------------------------------------------------------
Total
“
person-time
” of observation
Since the number of cases is
divided by a measure of time of
observation, rather than people,
this helps address the problem of
losses to follow up
.

Person-Time
Person
Follow-up Time on Study
Person Yrs.
1
<---------------------------------->
2
2
<---------------------------------Died
2
3
<---------------Event
1
4
<---------------------------------------------------->
3
5
<---------------------------------->
2
1995
1996
1997
1998
Jan.
Jan.
Jan.
Jan.
Study Period:
3 Years
Study Participants:
5
Person Years of Observation:
10
Average Duration of Follow-Up:
2.0 Years

1 case
Incidence Density = ------------ = 1 case /10 person-years
10 years
Where as,
1 case
Cumulative Incidence = -------------- = 0.20 = 20.0%
5 persons
Incidence Rate-Calculation
1.
Incidence is generally used for acutely acquired
diseases, prevalence is used for more permanent
states, conditions or attributes of ill-health.
2.
Incidence is more important when thinking of etiology
of the disorder (since it measures the risk),
prevalence when thinking of societal burden of the
disorder including the costs and resources consumed
as a result of the disorder.
3.
Incidence always requires a duration, prevalence
may or may not.
4.
Incidence generally requires an initial disease-free
interval before counting starts.
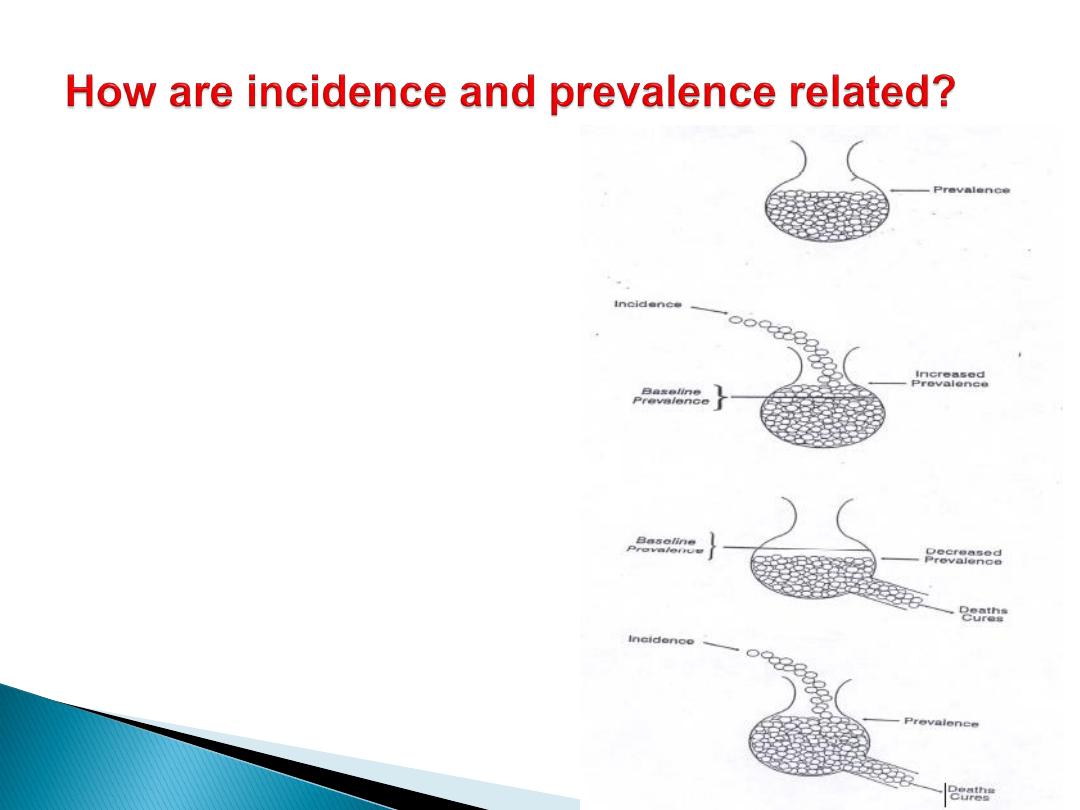
WHEN (the steady state is in
effect). Incidence rate (I) and
duration of disease (D) has
been constant over time.
I x D = P / (1
– P)
P = (I x D) / (1 + (I x D))
If the prevalence (P) of
disease is low (i.e. < 0.10)
then
P = I x D

Because, in the formula:
P = I x D
D
is related to : -
The subject’s health condition
- Access to care
- Availability of treatment
- Social support
- The severity of disease
So prevalent cases reflect factors related to the
incidence of disease (
Etiological factors
), AND
factors related to the duration of disease (
Prognostic
factors
). Thus, they are not adequate for studies
trying to elucidate Disease Etiology.

What disease has a high incidence and low
prevalence?
What conditions have a high prevalence and low
incidence?
What condition has low incidence and low
prevalence?
What condition has high incidence and high
prevalence?

Lecture Notes in Epidemiology and Public
Health Medicine, 5th edition. Farmer R,
Lawrenson R. Blackwell Publishing, 2004.
Oxford Textbook of Public health, 4th
edition. Detels R, McEwen J, Beaglehole R,
Tanaka H. Oxford Medical Publications, 2002.
References