
Measures of Associations and
Public Health Impact
Dr Faris Al Lami
MBChB MSc PhD FFPH
College of Medicine, Baghdad
University

Objectives
•Describe measures of association (Relative
risk and odds ratio) and their use
•Describe measures of Public Health Impact
(attributable risk, attributable risk percent,
population attributable risk percent, and
vaccine efficacy) and their uses

" Every epidemiologic study
can be summarized
in a 2-by-2 table."

Standard Two-by-Two Table
Ill
Well
Total
Risk
Exposed
a
b
H
1
a /H
1
Unexposed
c
d
H
0
c / H
0
Total
V
1
V
0
T or N

Measures of Association
• Quantify the relationship between an "exposure"
and outcome of interest
• Quantify the difference in occurrence of disease or
death between two groups of people who differ on
"exposure"
• Types of measures:
- RATIOS: relative risk, rate ratio, odds ratio
- DIFFERENCE: attributable risk
• Compare “
observed”to “
expected”

COHORT STUDIES
Disease
Total
Presen
t
Absent
Exposure
present
a
b
a+b
absent
c
d
c+d
Total
a +c
b+d
N

R elative R isk ( R R)
Incidence among exposed
Relative Risk (RR)=----------------------------------------
Incidence among non-exposed
a / a+ b
R R =-------------
c/ c+ d

NHANES I Follow-up Study
•Original enrollment 1971- 1975
•Follow-up
1982 - 1984
•Complete follow-up on:
-
Enrolled
Alive at F/U
−Male diabetics
189
89
−Male nondiabetics
3151
2340
−Total
3340
2429
who were ages 40-77
years at enrollment
Ref: Kleinman J, et al.
Am J Epidemiol 1988; 128:389-401.

NHANES I Follow-up Study
Dead Alive
Total
% Dead
Diabetic
100
89
189
52.9%
Nondiabetic
811
2340
3151
25.7%
Total
911
2429
3340
27.3%

Risk Calculations from
NHANES Follow-up Study
§
Deaths in diabetic men
100 deaths
189 men at start of follow-up period
Risk = 100/189 = 0.529 = 52.9%
§
Deaths in nondiabetic men
811 deaths
3151 men at start of follow-up period
Risk = 811/3151 = 0.257 = 25.7%
Ref: Kleinman J, et al.
Am J Epidemiol 1988; 128:389-401.

R isk R atio / Relative Risk
Risk in "exposed" group
Risk in "unexposed" group
EXAMPLE:
Relative risk of death among diabetic men vs.
nondiabetic men
RR = 100/189 =
0.529 =
2.1
811/3151
0.257

Template for Describing Risk
Ratio
•The { exposed group} is { RR} times as likely
to have { the outcome} as the { unexposed
group}.
•Example:
{ Diabetic men} were { 2.1} times as likely to
{ die during the follow-up period} as were
{ non-diabetic men}.

Questions about Risk Ratio
Risk in "exposed" group
Risk in "unexposed" group
§
What does RR > 1 mean?
§
What does RR = 1 mean?
§
What does RR < 1 mean?
CASE-CONTR OL STUDIES
Disease
Total
Present
Absent
Exposure
Present
a
b
a+b
Absent
c
d
c+d
Total
a +c
b+d
N

Measure of Association between Exposure and
Outcome in Case-Control –2-by-2 Table
Case
Exposed
a
Unexposed
c
V
1
Control
b
d
V
2
Odds R atio = ( a/c) / ( b/d) =
ad / bc

Example
Cigarette
Smoking
Lung Cancer
Cases
Control
Yes
70
30
No
30
70
Total
100
100

ad
70 x 70
Odds Ratio= ------------=-----------------= 5.4
bc
30 x 30
= OR
(1± z/√x2)
95% CI =5.4 1± 1.96/ √32
= 3.1- 9.6

Template for Describing Odds Ratio?
•From exposure to disease
The {exposed group} had {OR} times the odds
of having {the outcome} as the {unexposed
group}.
•From disease to exposure
Cases had { OR} times the odds of being
exposed than did controls.
•Do not use OR when you can calculate RR.

Comments about Odds Ratio
§
Preferred measure of association for case-
control study (Risk Ratio, Rate Ratio cannot
be calculated from case-control study)
§
Approximates Risk Ratio when disease is
rare
§
Always further from 1.0 than risk ratio,
especially if disease is NOT rare

Measures of
Public Health Impact

Measures of Public Health Impact
•Places exposure–disease associations in public
health perspective
•Quantifies expected reduction in disease
occurrence if harmful exposure could be
eliminated,
OR
•Quantifies actual reduction in disease
occurrence attributable to beneficial
(protective) exposure

Measures of Public Health Impact
For harmful exposures
- Risk difference (attributable risk, excess risk)
- Attributable risk percent
- Population attributable risk percent
For beneficial (protective) exposures
- Prevented fraction among the exposed
(vaccine efficacy)

Measures of Association vs. Impact
§
Measures of association (RR, OR)
describe the strength of association
between exposure and disease (more
relevant for causality)
§
Measures of impact (AR% , PAR% ) put
the association in a public health
perspective

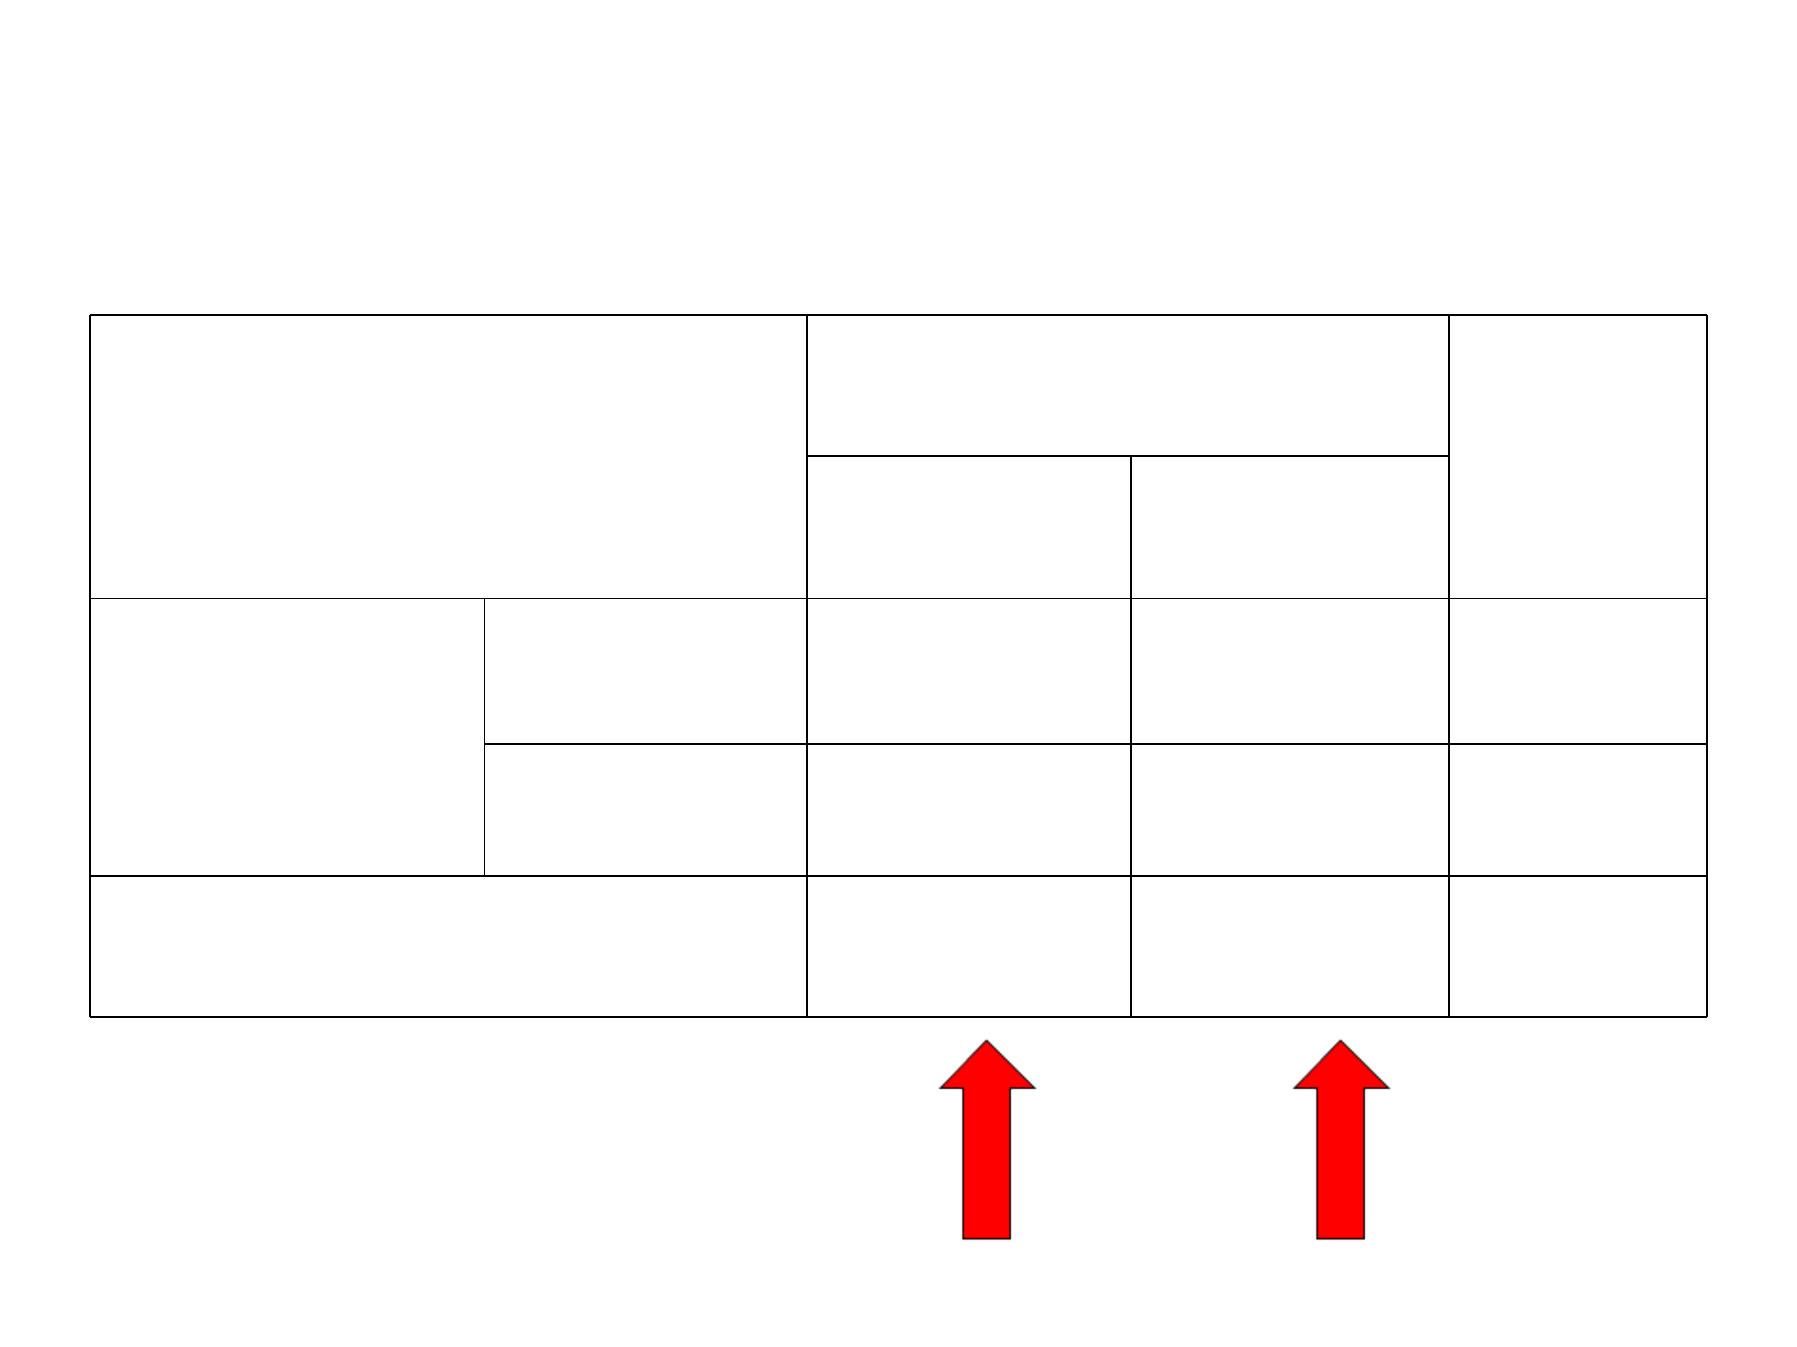
NHANES Follow-up Study
Dead Alive
Total
% Dead
Diabetic
100
89
189
52.9%
Nondiabetic
811
2340
3151
25.7%
Total
911
2429
3340
27.3%
Ref: Kleinman J, et al.
Am J Epidemiol 1988; 128:389-401.
NHANES Follow-up Study
Ref: Kleinman J, et al.
Am J Epidemiol 1988; 128:389-401.

Risk Difference
= "Excess risk"
= Attributable risk
= Risk in exposed −Risk in unexposed
EXAMPLE:
Excess risk of death among diabetic men vs.
nondiabetic men
0.529 - 0.257 = 0.272=
27.2%
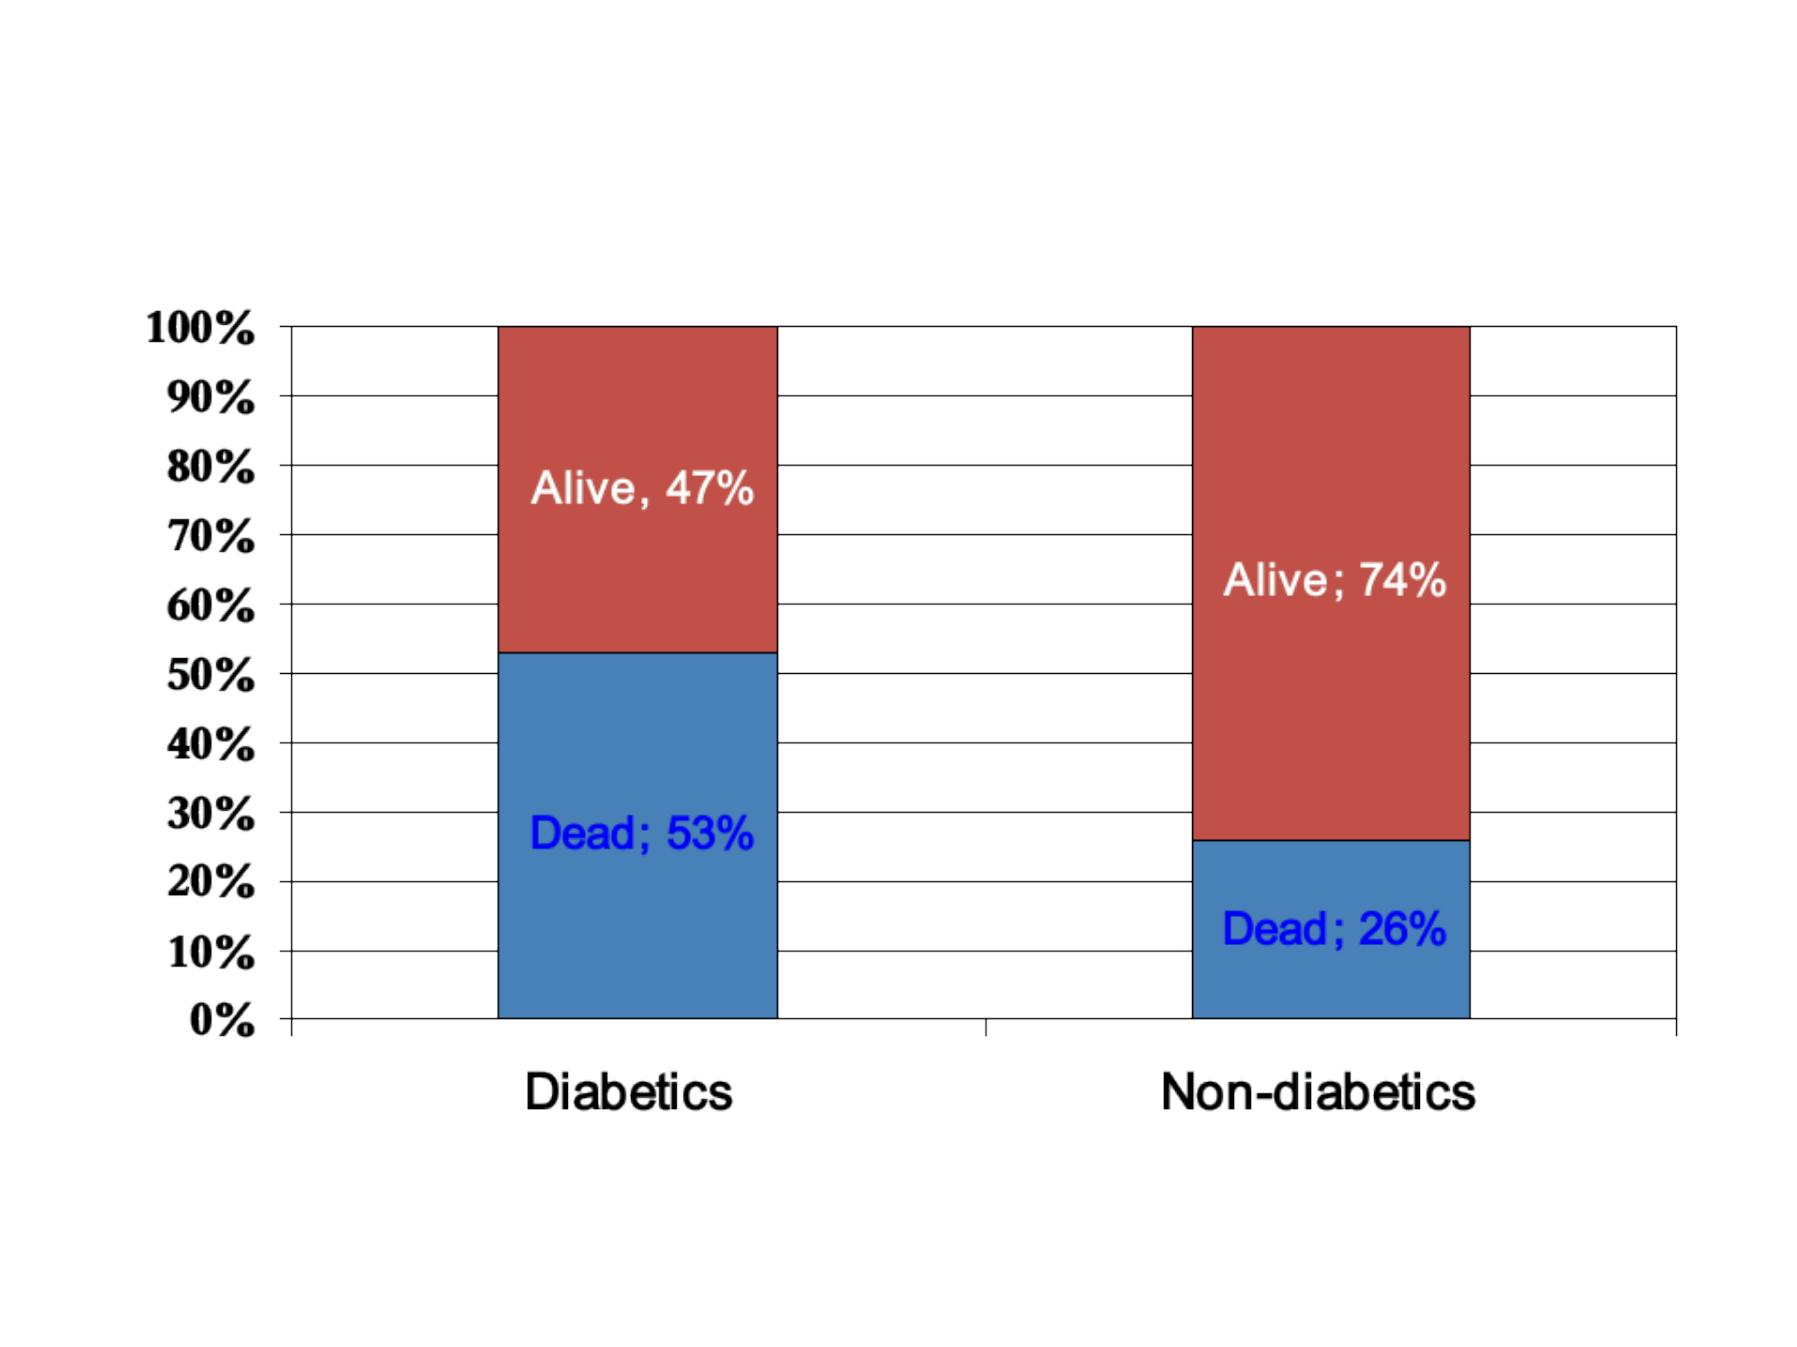
NHANES Follow-up Study
Unexpected
Dead 27%

Attributable R isk Percent
Also called
Attributable fraction (proportion) among the exposed
Etiologic fraction among the exposed
Risk in exposed –Risk in unexposed
Risk in exposed
EXAMPLE:
ARP for deaths among diabetic vs. nondiabetic men
= (0.529 - 0.257)/0.529 = 0.272/0.529 = 51.4%
"About half of the deaths among diabetic men may be attributed
to their diabetes."
ARP =
x 100
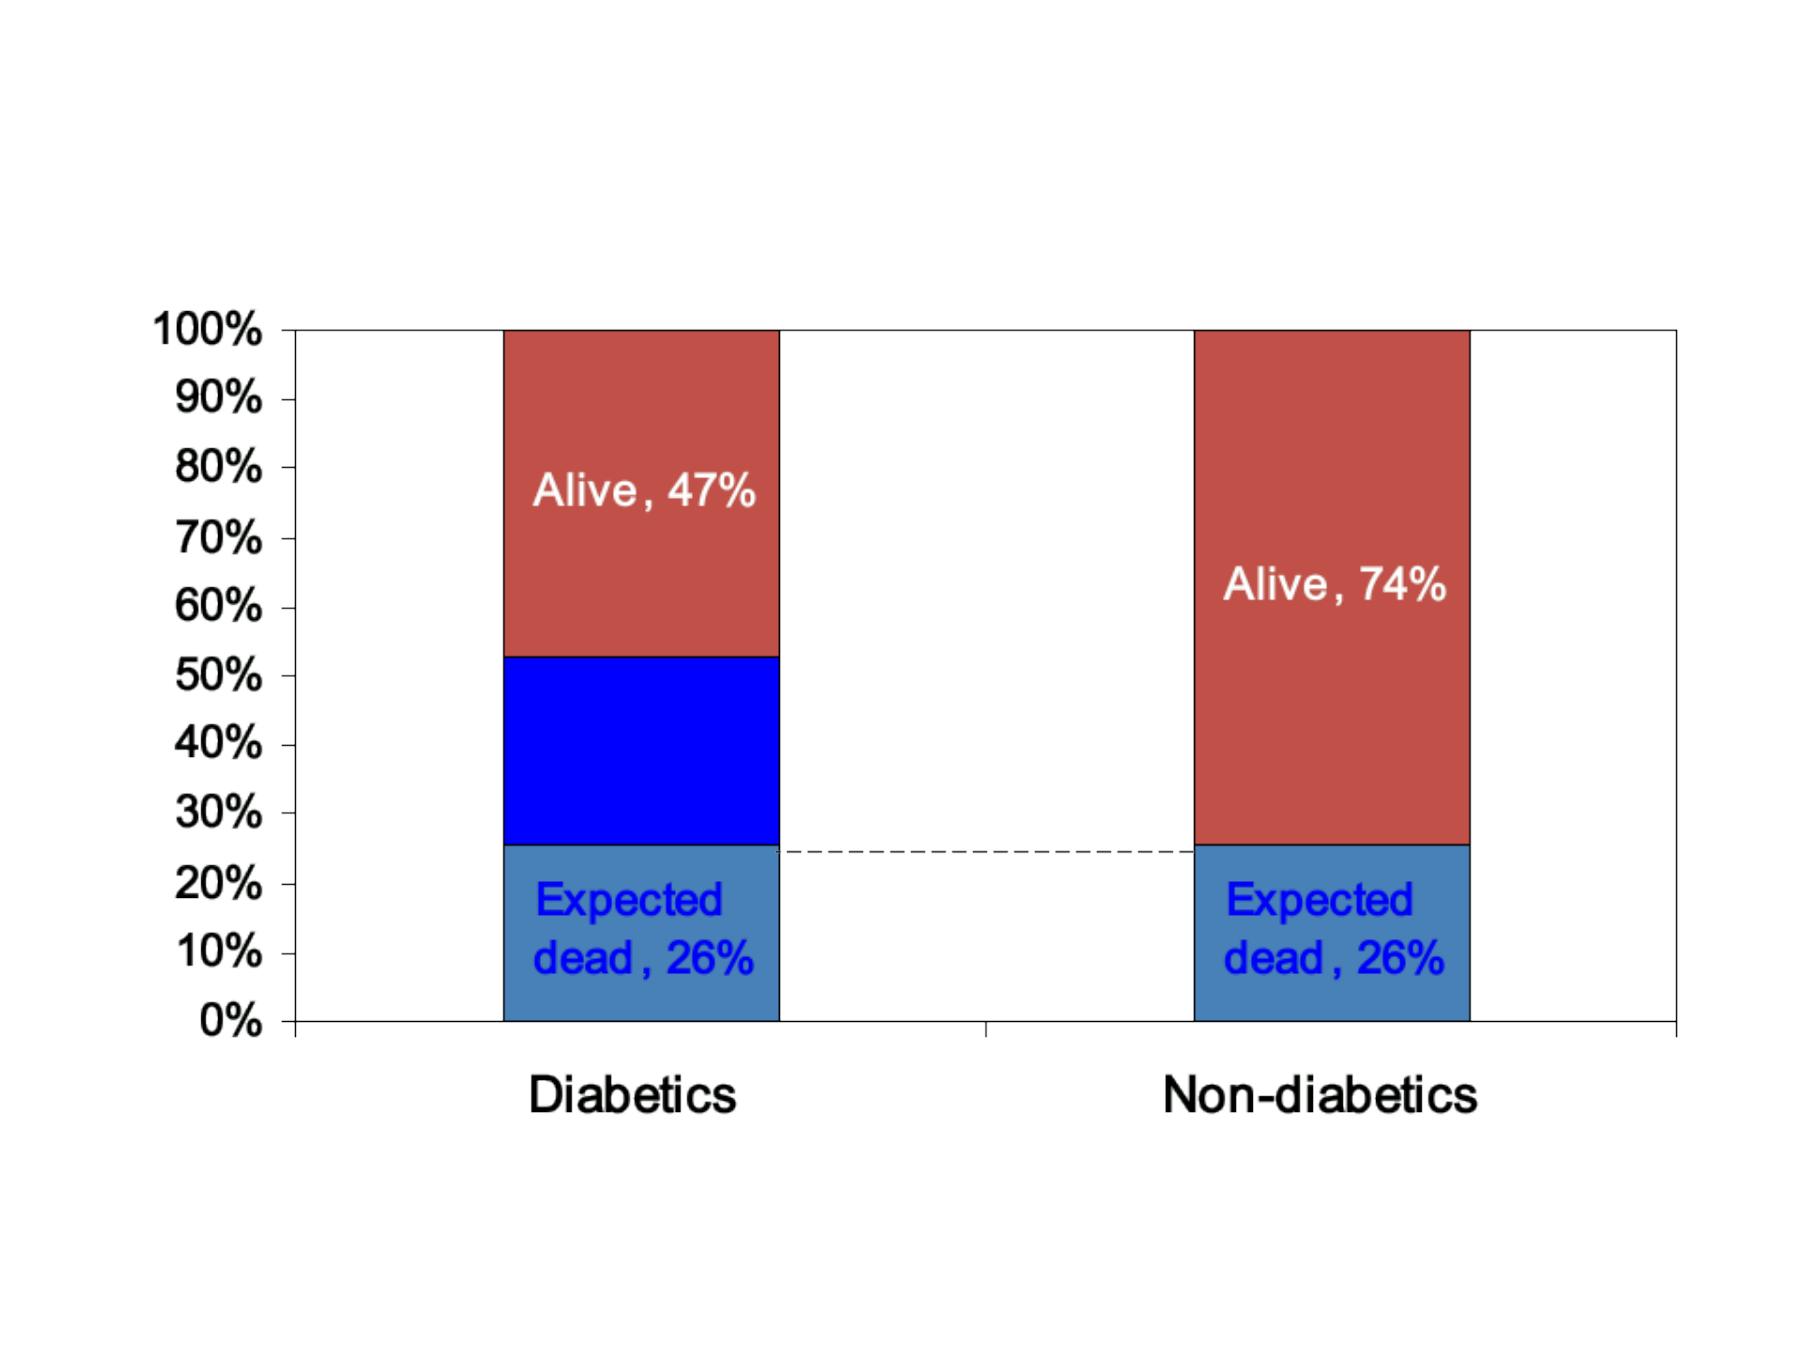
NHANES Follow-up Study
Unexpected
Dead
Population Attributable Risk Percent
Also called
- Population attributable fraction (proportion)
- Population etiologic fraction
Risk in population –Risk in unexposed
Risk in population
PARP =
x 100

Population Attributable Risk Percent
EXAMPLE:
PARP for deaths attributable to diabetes in men
Risk in the Population = 911/3340 = 0.273 = 27.3%
Risk in the unexposed =811/3151= 0.257 = 25.7%
PARP = (0.273 - 0.257)/0.273 X 100%
= 0.016/0.273 X 100% =
5.9%
"About 6% of the deaths among all men in the
study may be attributed to diabetes."

ARP vs. PARP
• Use
attributable risk percent
when your focus is
on those exposed
“
What proportion of lung cancer among smokers is
attributable to their smoking?”
• Use
population attributable risk percent
when
your focus is on the whole population
“
If we could eliminate smoking from the community, what
decline would we expect to see overall in lung cancer
occurrence?”

Prevented Fraction in the Exposed
( Vaccine Efficacy)
R isk in unexposed group - R isk in exposed group
R isk in unexposed group
= 1 –risk ratio

Measles by Vaccination Status, Texarkana,
1970
Measles
Well
Total
Risk (%)
Vaccinated
27
6,323
6,350
0.42
Not vaccinated
512
4,323
4,835
10.59
Total
539
10,646
11,185
4.82
R R =
0.040
, VE = 1 −R R =
0.960 = 96.0%
0.04
0.96 = 96.0%
“
Measles vaccination was associated with a 96% reduction in
cases of measles among children who had received measles
vaccine.”
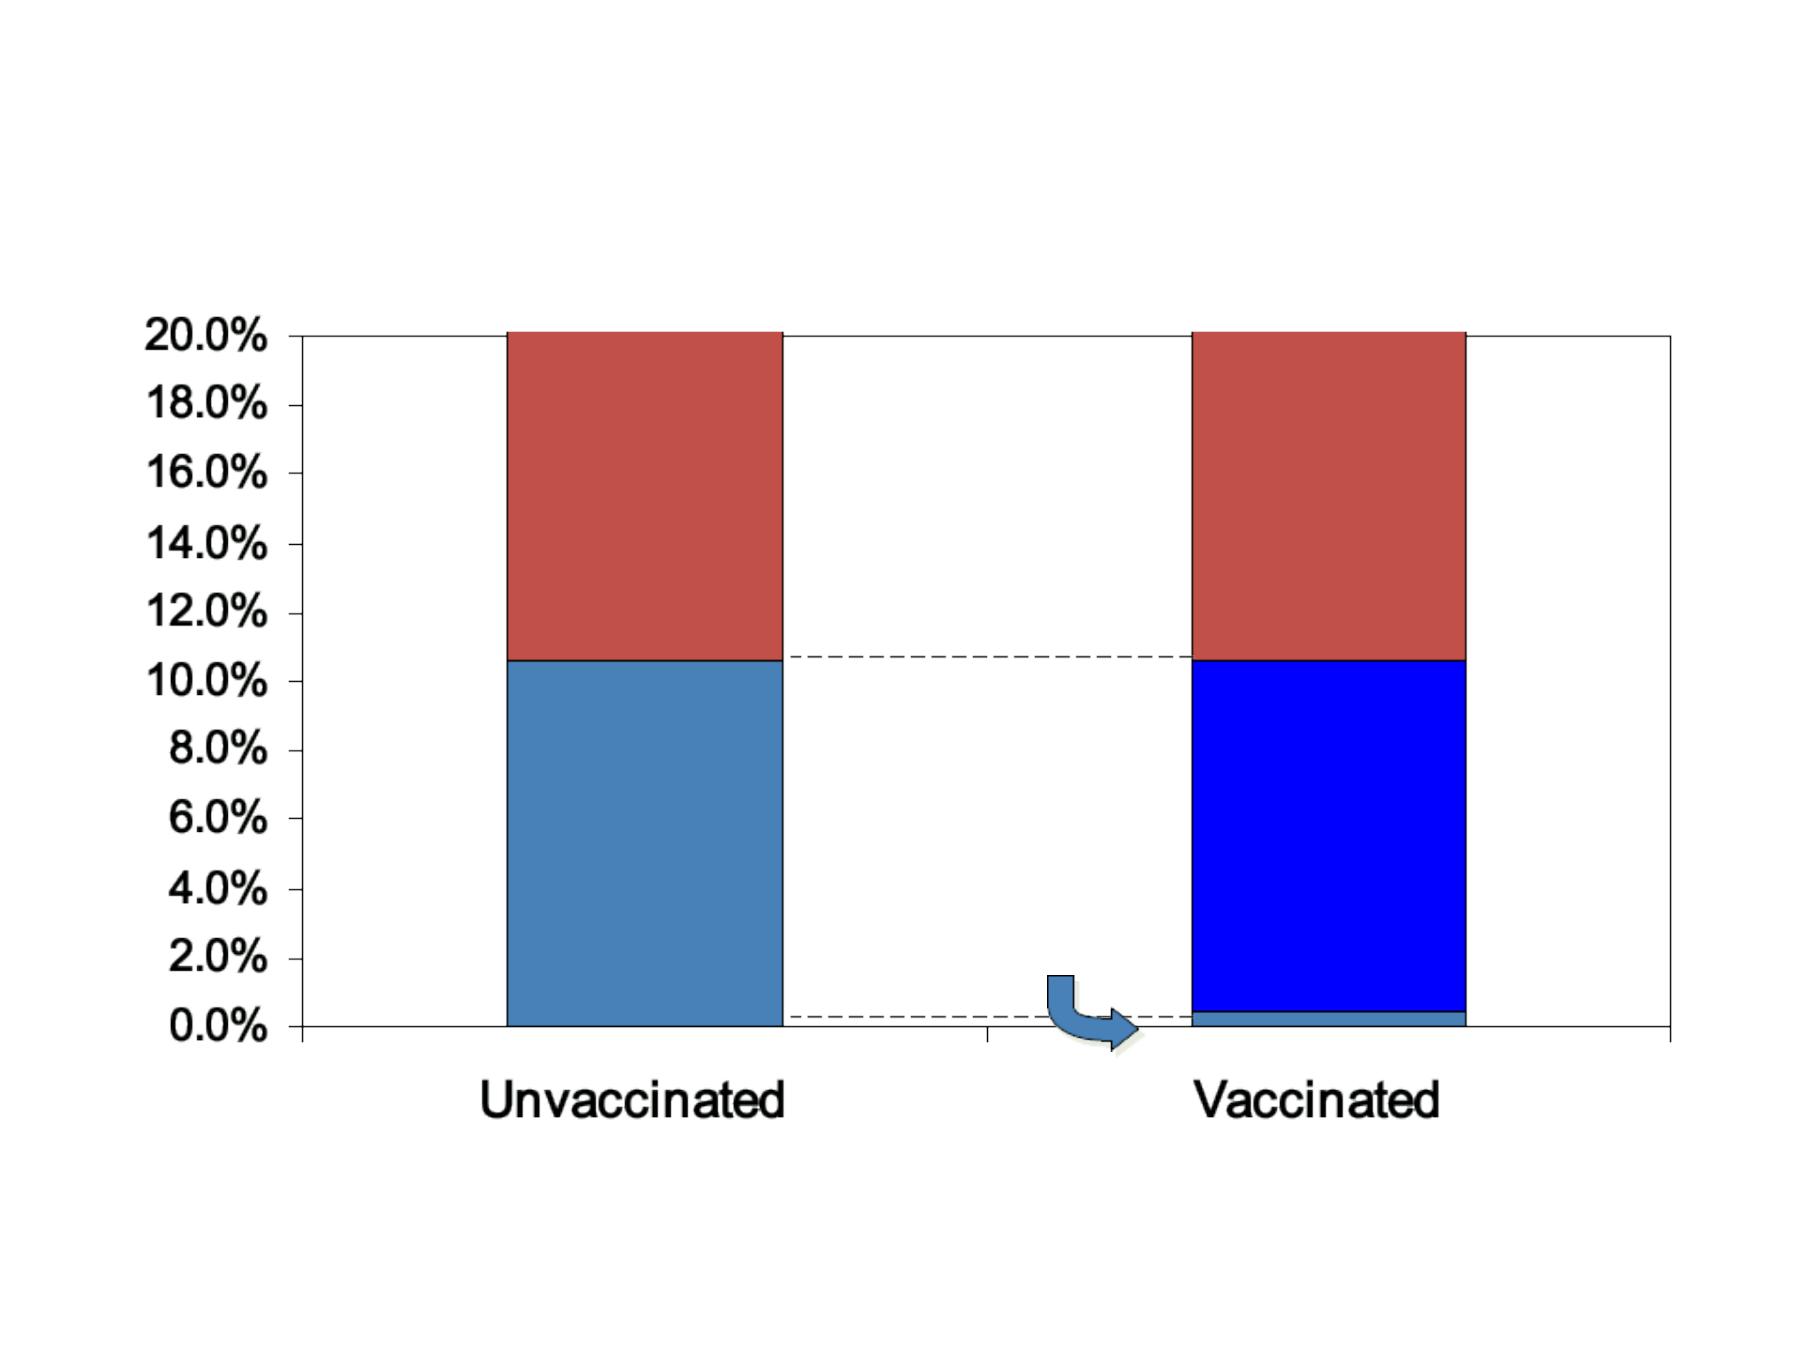
Measles by Vaccination Status, Texarkana, 1970
Vaccine-
attributable
Non-cases
Unvacc’
d
C ases
Vaccinated
C ases

Linear correlation coefficient (r)
•
Measures the linear correlation between two
quantitative variables measured on an interval/ ratio
scale..
•
Useful in assessing the direction and strength of linear
association
•
Pearson’
s coefficient is used when both variables are
normally distributed
•
Spearman’
s coefficient is used when one of the variables
is non-normally distributed.
-
-
1
1
<
<
r
r
<
<
+
+
1
1
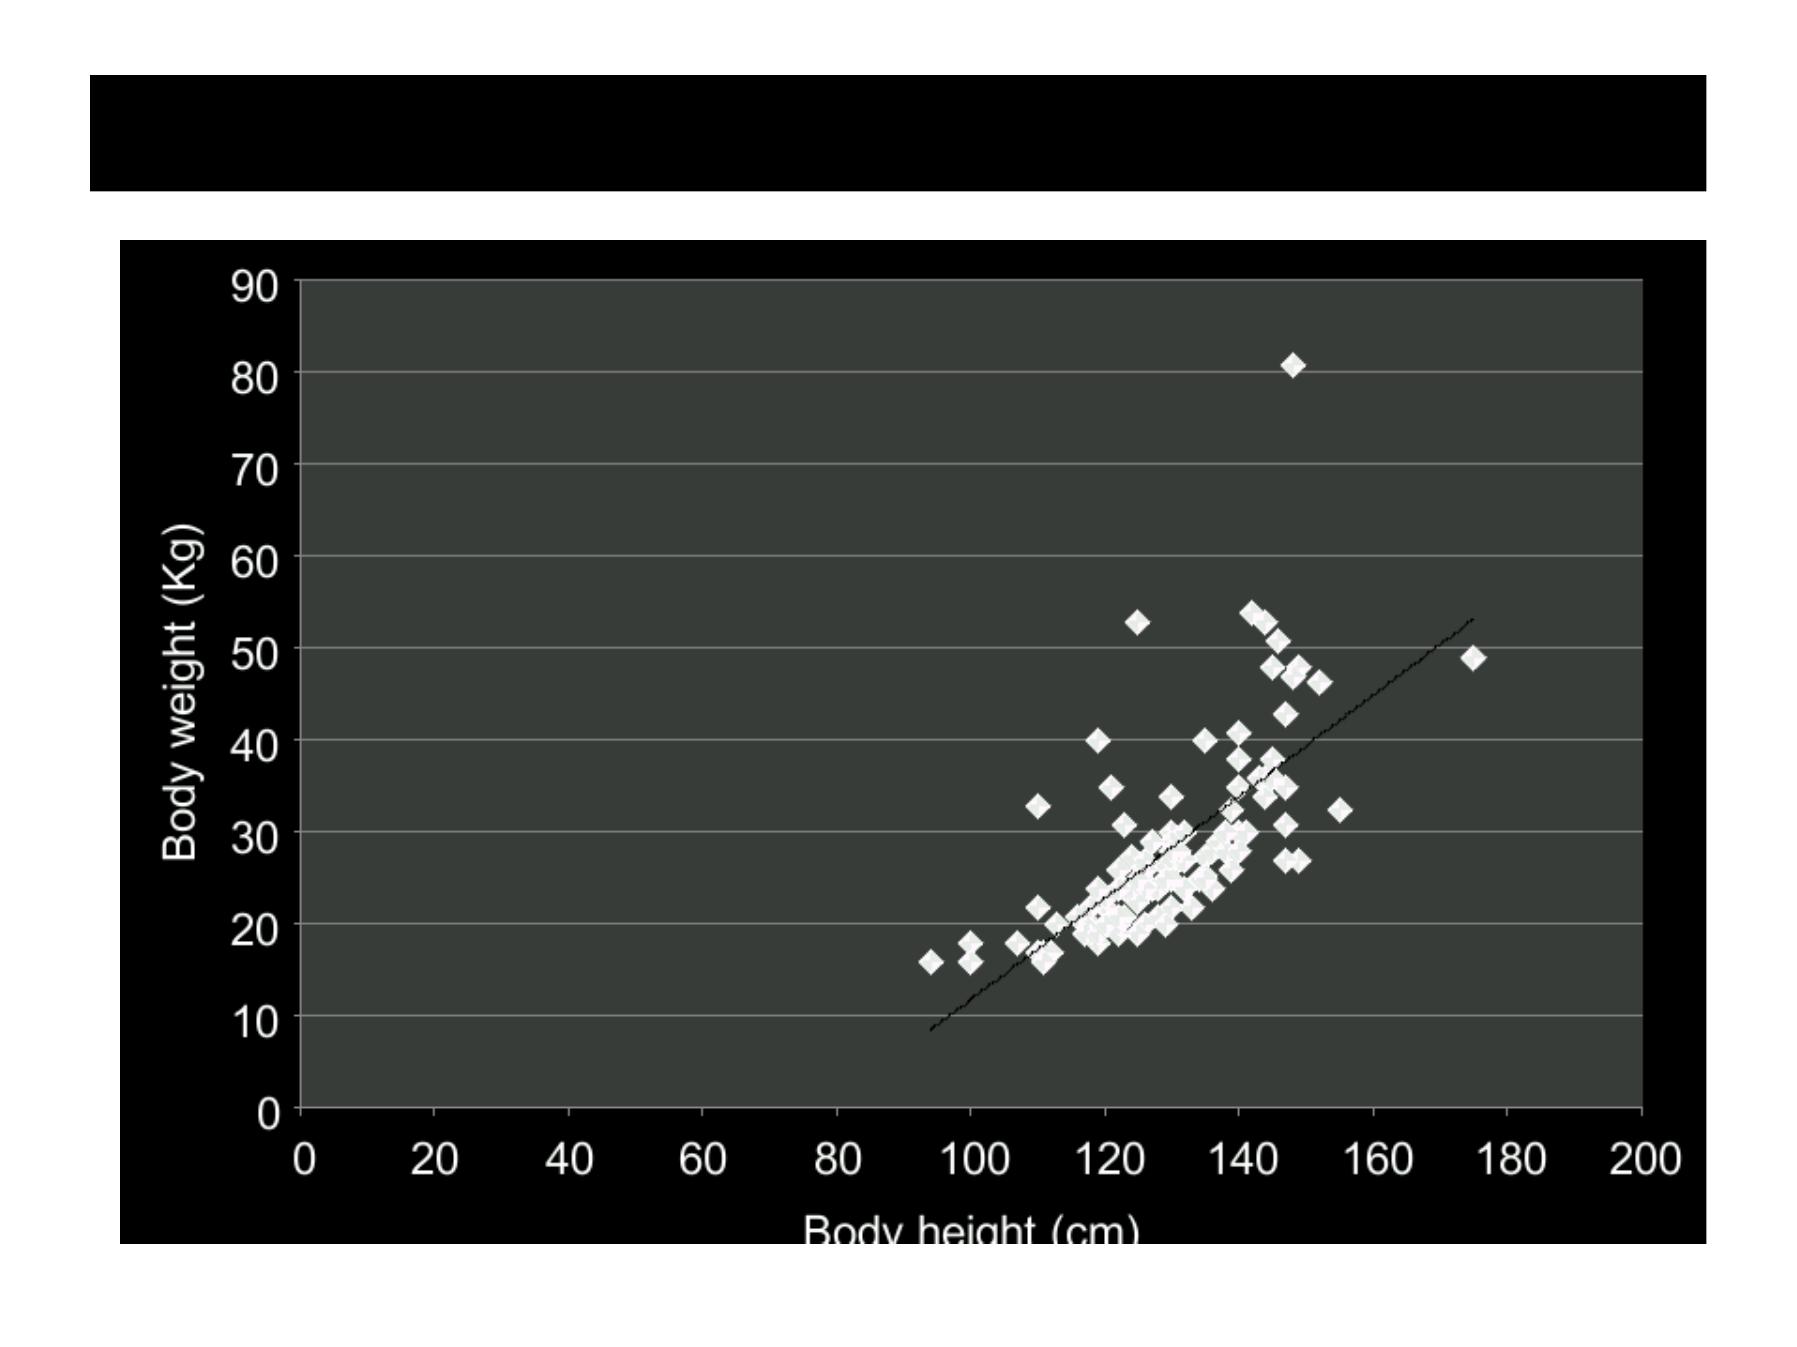
Linear correlation coefficient (r)
Scatter diagram with fitted regression line (r=0.81)
Regression coefficient
•
Measures the amount of variation expected in the
outcome (dependent) variable in response to an increase
of one unit of the independent variable.
R
R
e
e
g
g
r
r
e
e
s
s
s
s
i
i
o
o
n
n
e
e
q
q
u
u
a
a
t
t
i
i
o
o
n
n
:
:
Y
Y
=
=
a
a
+
+
β
β
X
X
Where
Y
Y
is the dependent variable,
a
a
is the intercept,
β
β
is
the regression coefficient and
X
X
is the independent
variable.
•
Both correlation and regression models complement the
picture for the strength of association between an
independent and dependent quantitative variable.

Conclusion
§
Measures of association (RR, OR) describe the
strength of association between exposure and
disease (more relevant for causality)
§
Use risk ratio for standard cohort study
§
Use odds ratio for case-control study
§
Odds ratio only approximates risk ratio when
disease is rare
§
Measures of impact (AR% , PAR% ) put the
association in a public health perspective

Q?