Growth & Development In Children
ByDr. Athal Lukman Humo

The goal of pediatric care is to optimize the growth and development of each child. Pediatricians need to understand normal growth, development, and behavior in order to monitor children's progress, identify delays or abnormalities in development, obtain needed services, and counsel parents.
All who care for children must be familiar with normal patterns of growth and development so that they can recognize abnormal variations.

Periodically monitoring each child for the normal progression of growth and development & screening for abnormalities are important means of accomplishing this goal.

We often hear people refer to children’s growth and development. Are ―growth and ―development‖ the same thing? What does each of these terms mean?


Growth refers to an increase in physical size of the whole body or any of its parts.
It is simply a quantitative change in the child’s body, such as: height, weight, head circumference, and body mass index. These size changes can easily be measured.Growth
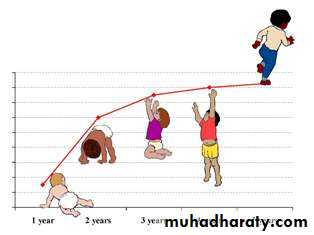
Development typically refers to an increase in function of processes related to body and mind. There is increase in complexity (a change from simple to more complex) Involves a progression in acquiring more refined knowledge, behavior, and skills. The sequence is basically the same for all children, however the rate varies.It is a qualitative change in the child’s functioning.
It can be measured through observation.

Development

Principles of Growth & Development
Continuous processPredictable Sequence
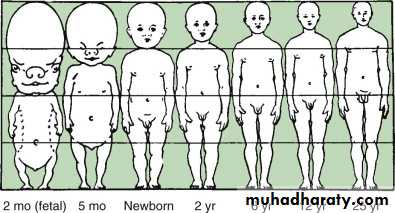
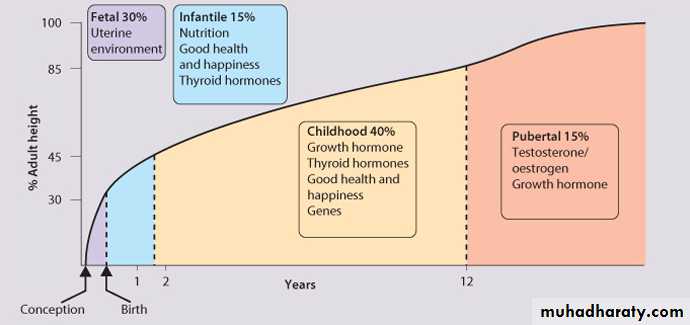
Don’t progress at the same rate (↑ periods of GR in early childhood and adolescents & ↓ periods of GR in middle childhood)Not all body parts grow in the same rate at the same time, body proportions follow a predictable sequence of changes with development. The head and trunk are relatively large at birth, with progressive lengthening of the limbs throughout development, particularly during puberty.
• The lower body segment is defined as the length from the symphysis pubis to the floor, and the upper body segment is the height minus the lower body segment.
• The ratio of upper body segment divided by lower body segment (U/L ratio) equals approximately 1.7 at birth, 1.3 at 3 yr of age, and 1 after 7 yr of age. Higher U/L ratios are characteristic of short-limb dwarfism or bone disorders, such as rickets


:
Each child grows in his/her own unique way, there is wide individuals differences in growth pattern .
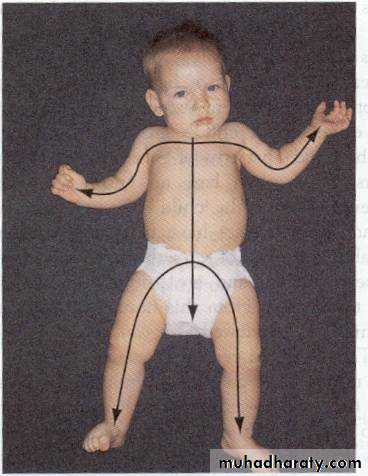
G & D proceed in regular related directions :
• Cephalo-caudal(head down to toes)• Proximodistal (center of the body to the peripheral)

Development proceeds from general to specific responses. e.g. react to stimuli with whole body and gradually learns to give specfic responses

Growth does not continue throghout life, it stops when maturity has been attained. While development continues throughout life and is progressive .
• GROWTH
May or may not bring development e.g. a child may grow fat but by becoming fat no functional improvement may take place
Development
It is also possible without growth.e.g. a child may gain height, weight or size but can have functional improvement in other aspects
Factors affecting growth and development:
HereditaryEnvironmental factors
Combined


Heredity
EnvironmentCOMBINED


Assessment of Growth & Development
• Assessment of growth & development will provide insight into the general well being of the child & it include:• Assessment of physical growth-anthropometric measurments
• Skeletal assessment.• Tissue growth assessment
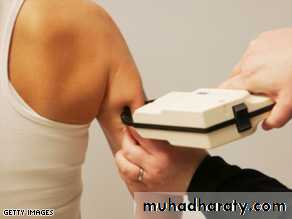
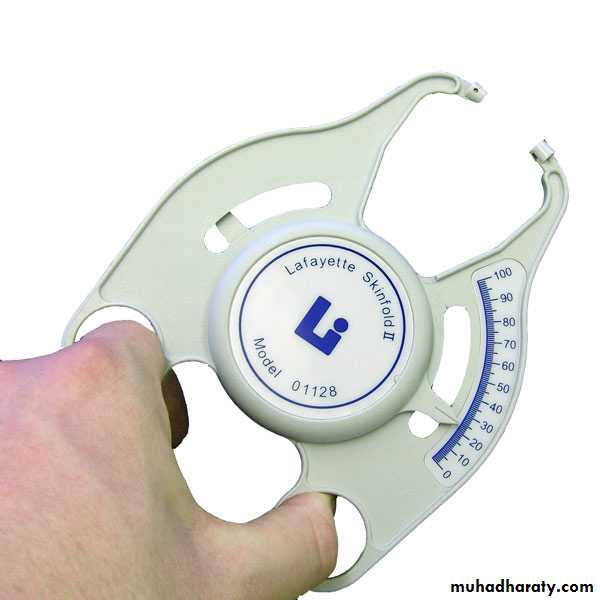
SC fat- by skin fold callipers or by soft tissue radiography
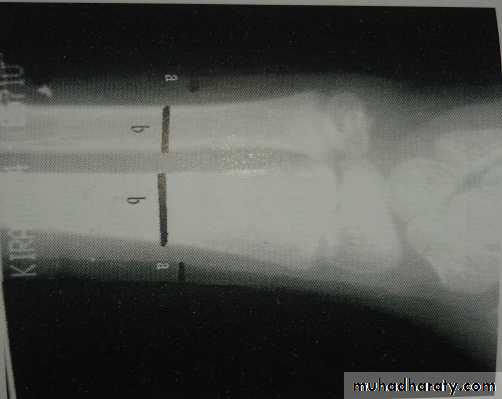
Bone growth- by measuring bone width on wrist radiography
Muscle mass- using soft tissue radiography to distinguish muscle mass from SC fat & bone width.
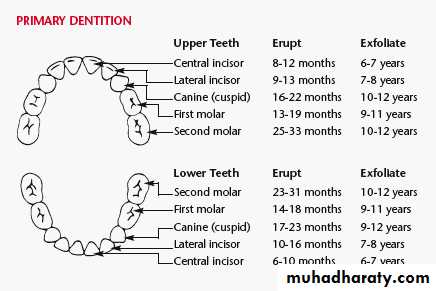
• Assessment of dental development-by counting the number of teeth erupted
• Developmental assessment: it is useful to subdivide early childhood development into four functional skill:
Gross motor
Fine motor &vision
Speech, language & hearing
Social, emotional & behavior
Assessment of growth & development
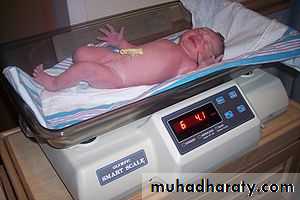
Assessment of physical growthWeight
• newborn's weight may initially decrease 10% below birth weight in the 1st wk as a result of excretion of excess extravascular fluid and limited nutritional intake. Nutrition improves as colostrum is replaced by higher-fat breast milk, as infants learn to latch on and suck more efficiently, and as mothers become more comfortable with feeding techniques.
• Infants regain or exceed birth weight by 2 wk of age and should grow at approximately 30 g/day during the 1st mo. This is the period of fastest postnatal growth.
• The child will:
• Average weights:At birth → 3.5 kg
At 1 yr → 10 kgAt 5 yr → 20 kg
At 10 yr → 30 kg
• Daily weight gain:
20-30 g for first 3-4 mo15-20 g for rest of the first yr
• Average annual weight gain: 5 lb between 2 yr and puberty .
Each 1 kg = 2.2 pounds (Ib)
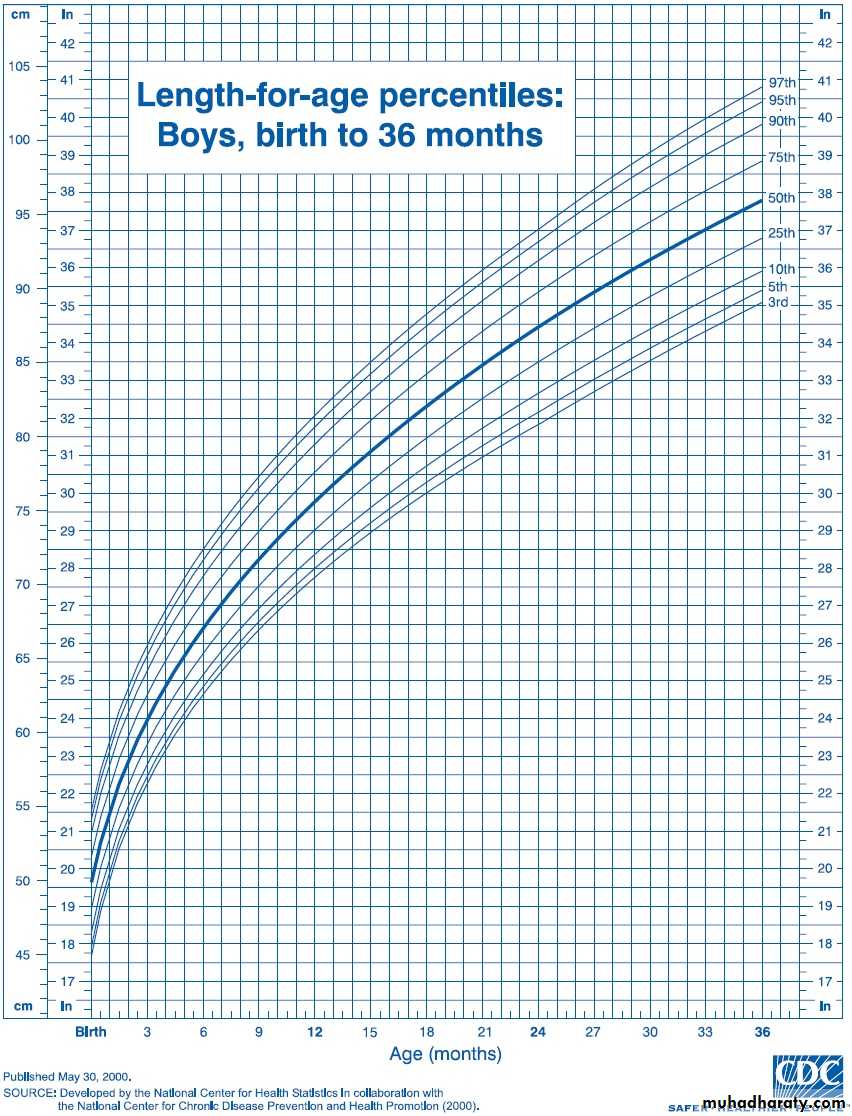
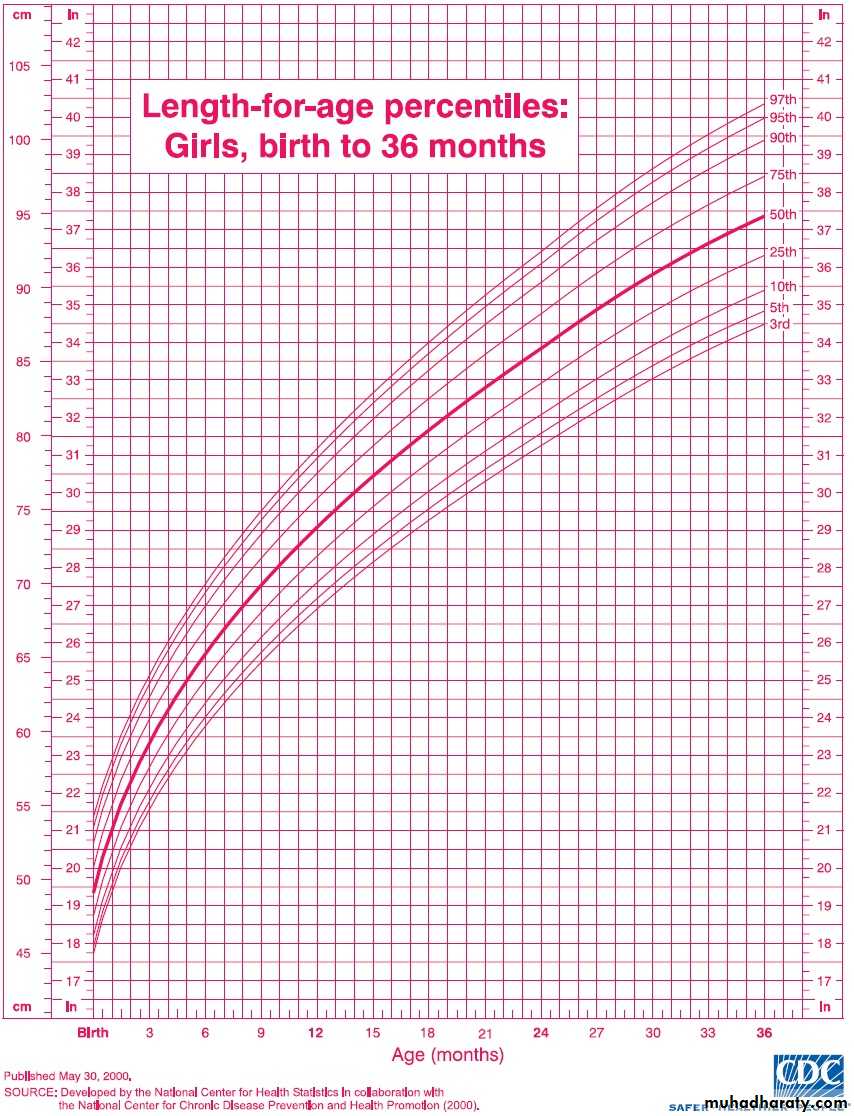
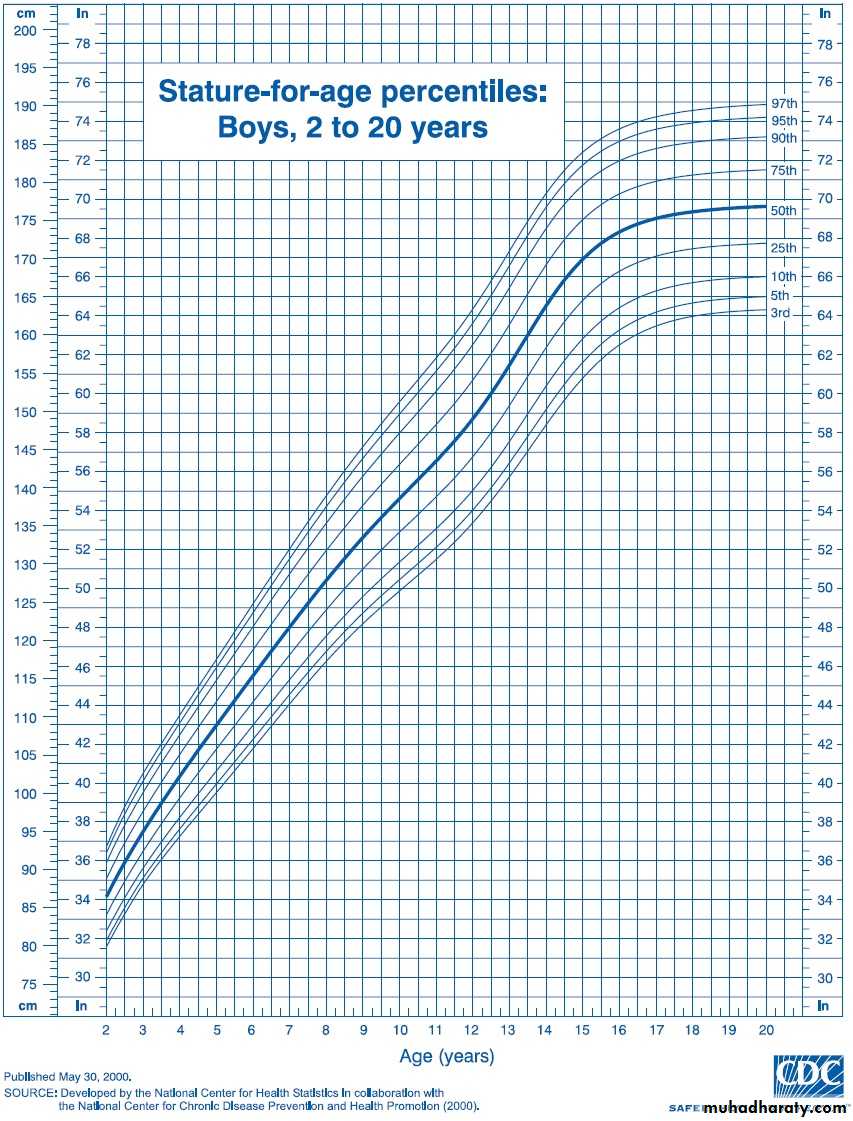
Average length: 50 cm at birth, 75 cm at 1 yrBody ht. increases by about 50% at the end of 1st yr than it was at birth, 75% at 2nd yr and 100% at 4th yr.
At age 4 yr the average child is 100 cm tall (double birth length)
Average annual height increase:
5-7 cm between age 4 yr and puberty
Height
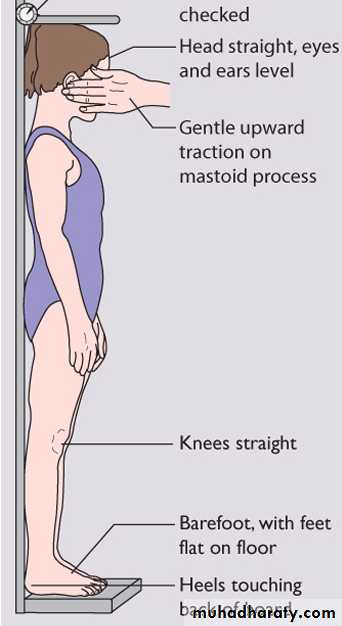

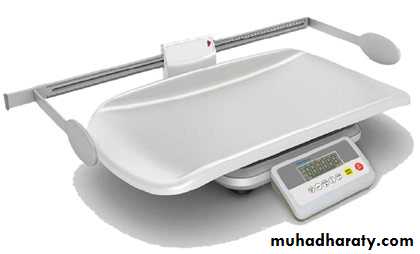
Measuring height accurately in children.
Measuring length in infants and youngFormulas for Approximate Average Height and Weight of Normal Infants and Children

Age Wt (Kg)
3–12 mo Age(mo)+9/2
1–6 yr Age (yr) × 2 + 8
7–12 yr Age(yr)×7-5/2

Age Ht (cm)
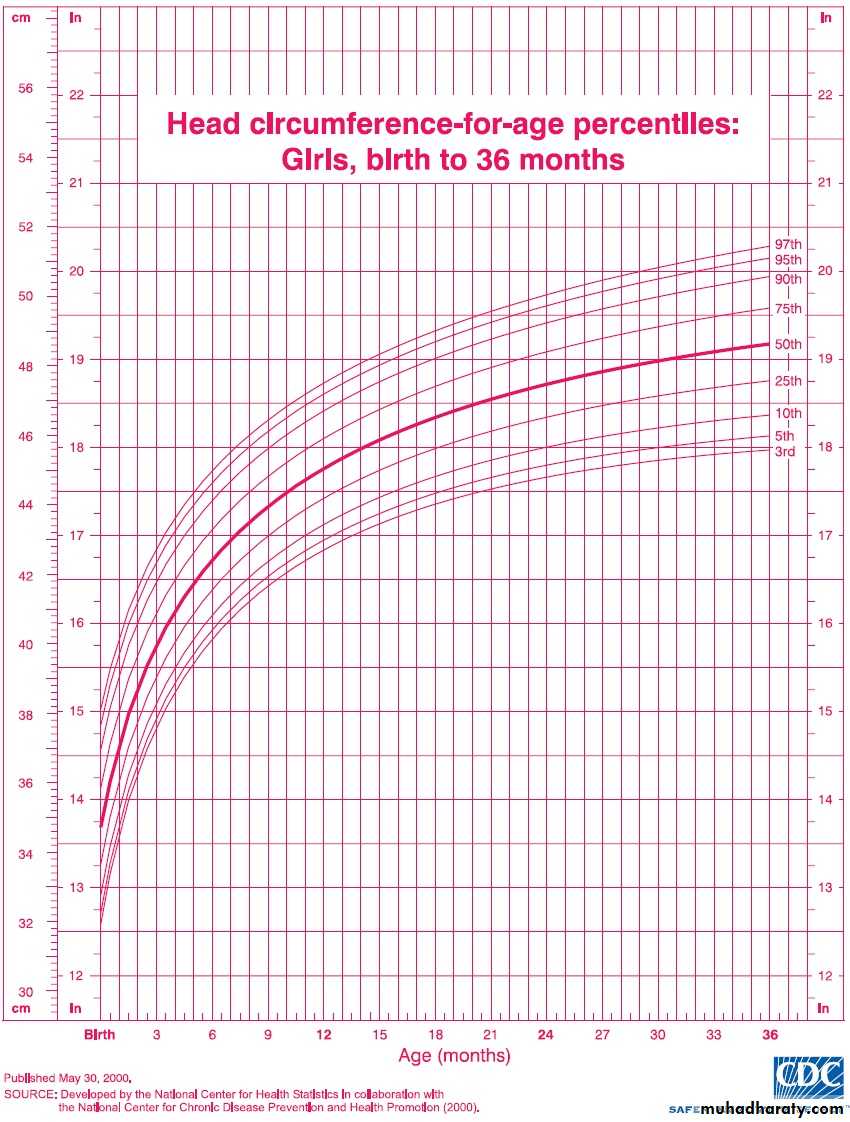
2–12 yr Age (yr) × 6 + 77OFC
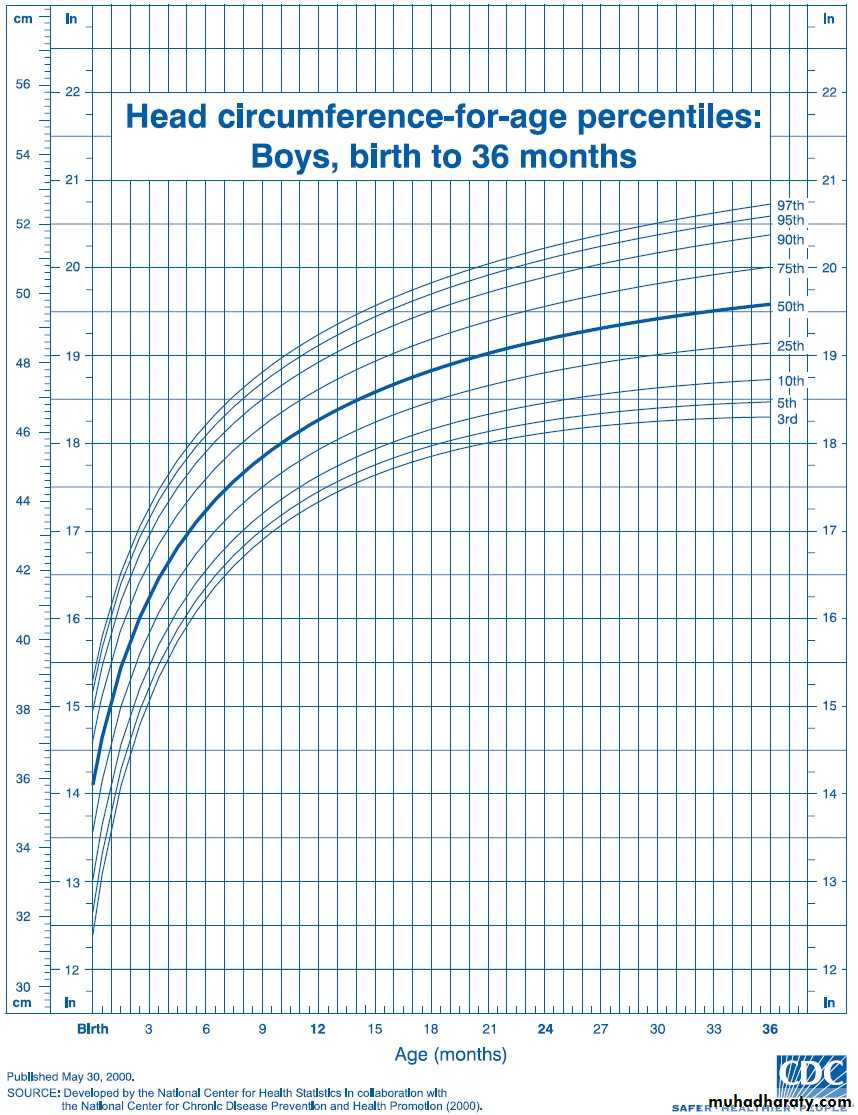
OccipitoFrontal Circumference (OFC): measured from the supraorbital ridge in front to the farthest point of the occiput in back.
Average HC: 35 cm at birth (13.5 inches)
HC increases: 1 cm/mo for first yr2 cm/mo ----- 1st 3mo
1 cm/ mo ----- 2nd 3mo
0.5cm/mo for the next 6 mo
10 cm for rest of life.

BMI
The Body mass index BMI is defined as body weight in kilograms divided by height in meters squared.The BMI is an index for classifying adiposity and is recommended as a screening tool for children and adolescents to determine whether an individual is:
Overweight: BMI above the 95th percentile for age
At risk for being overweight: BMI between the 85th and 95th percentile for age
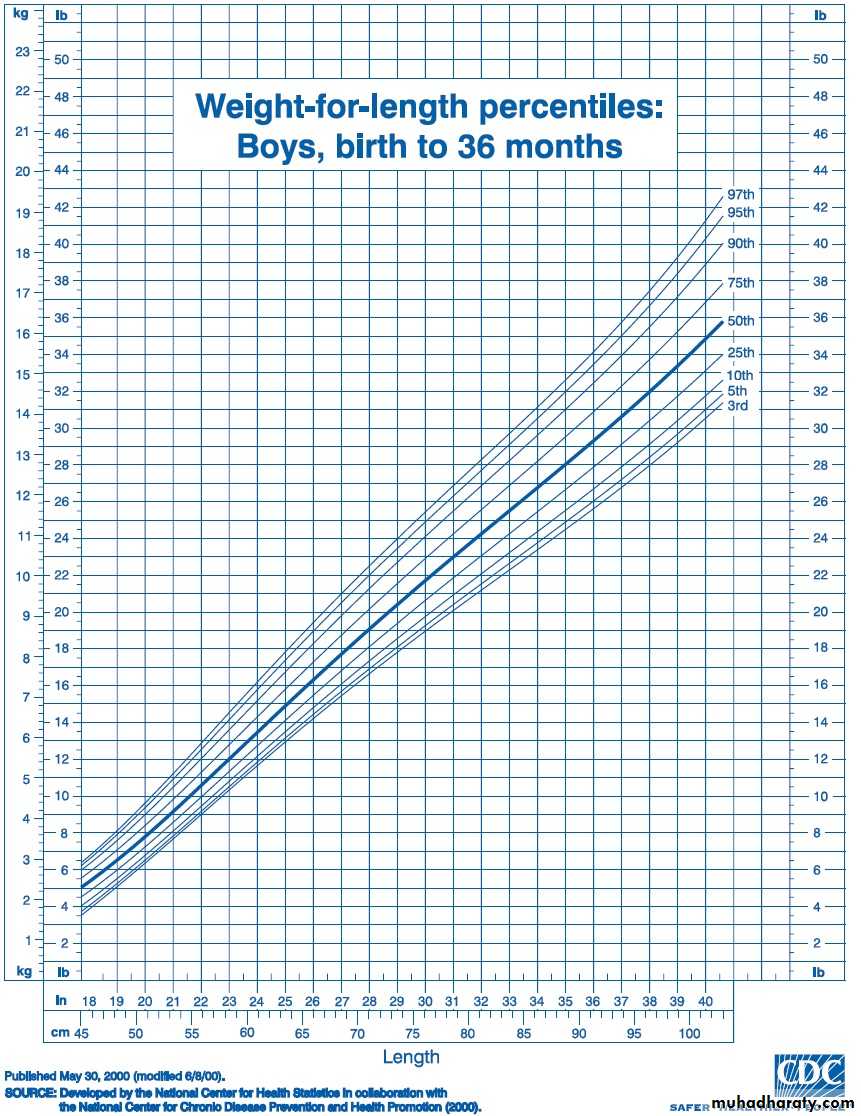
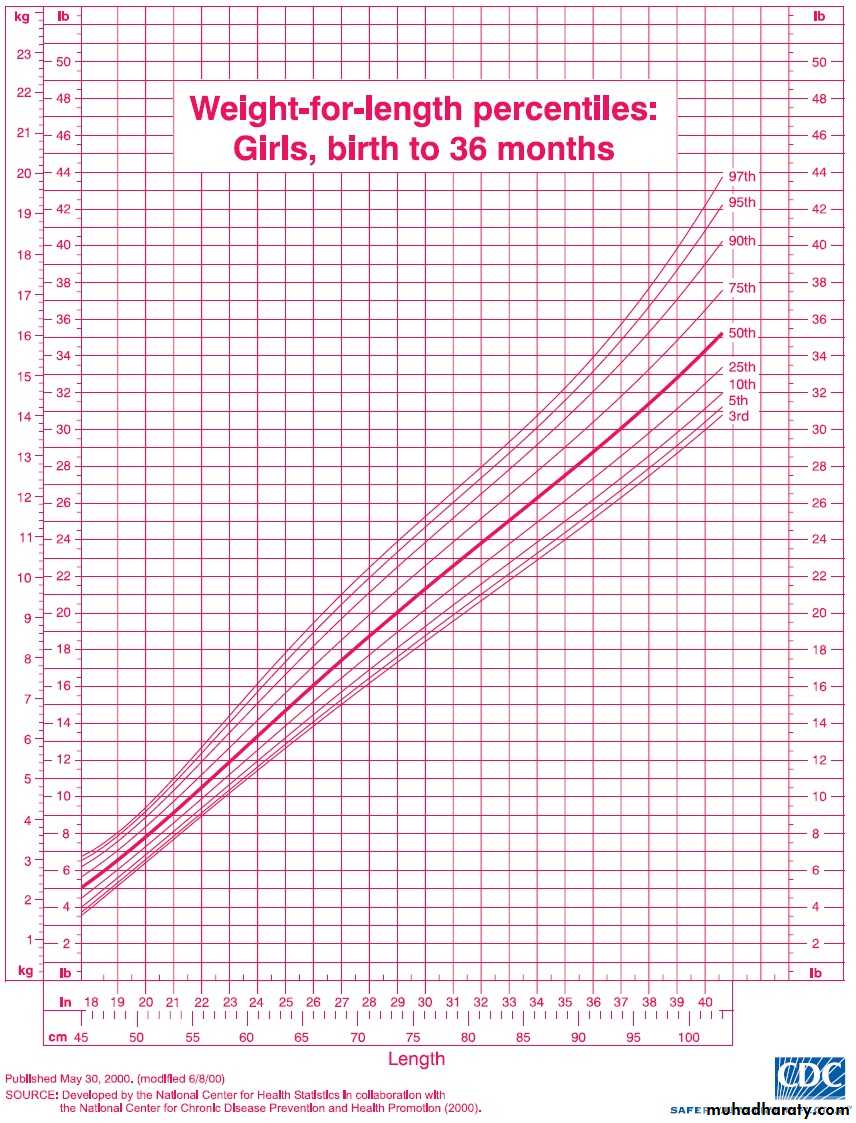
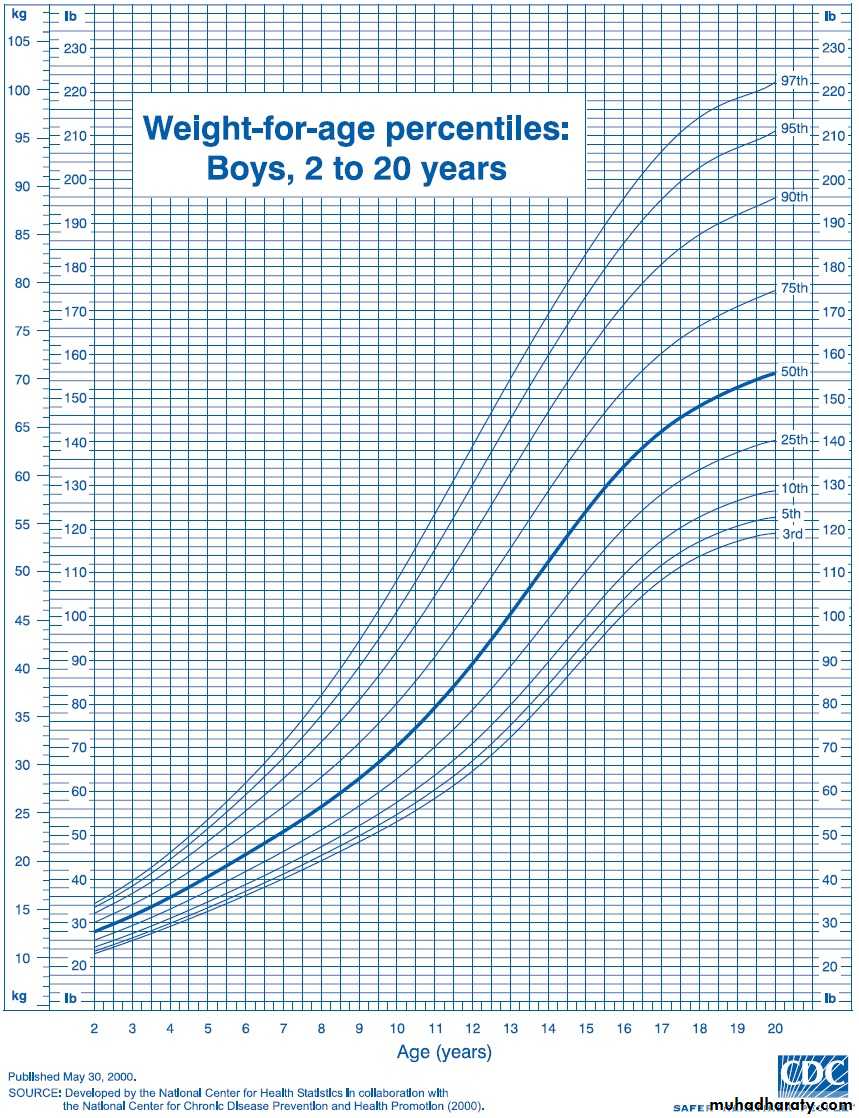
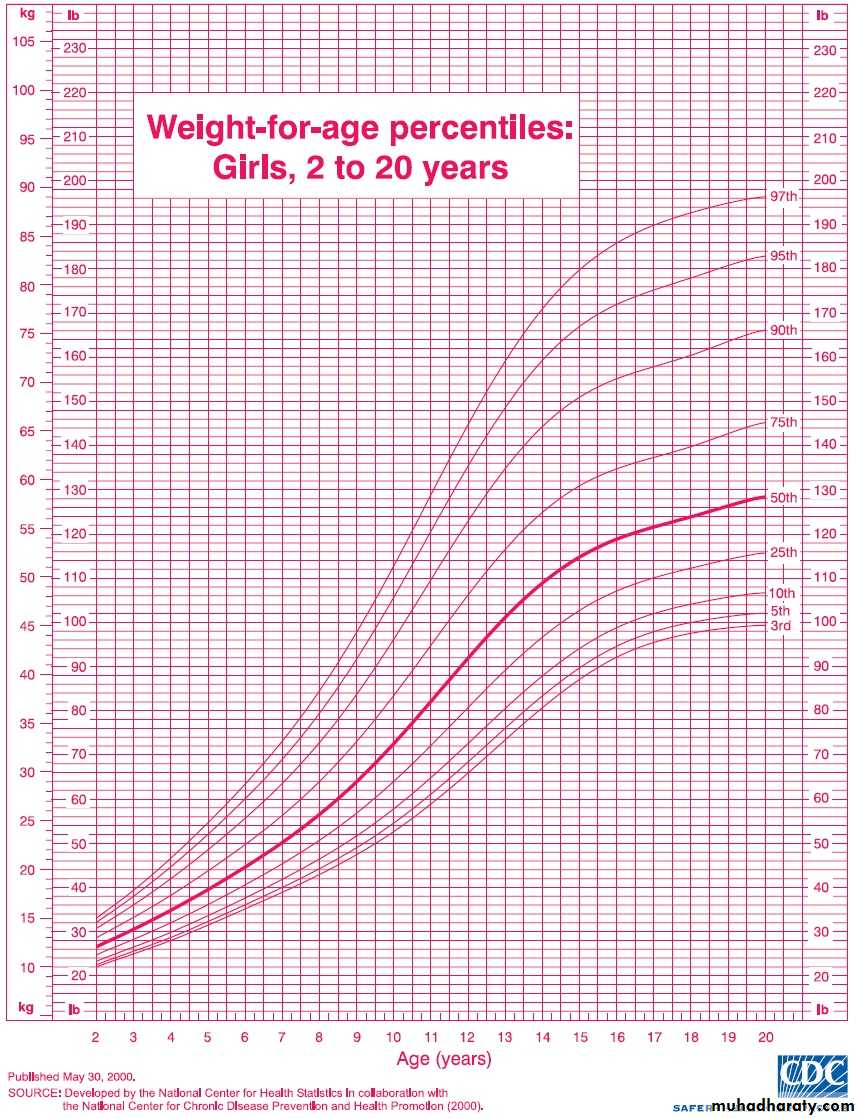
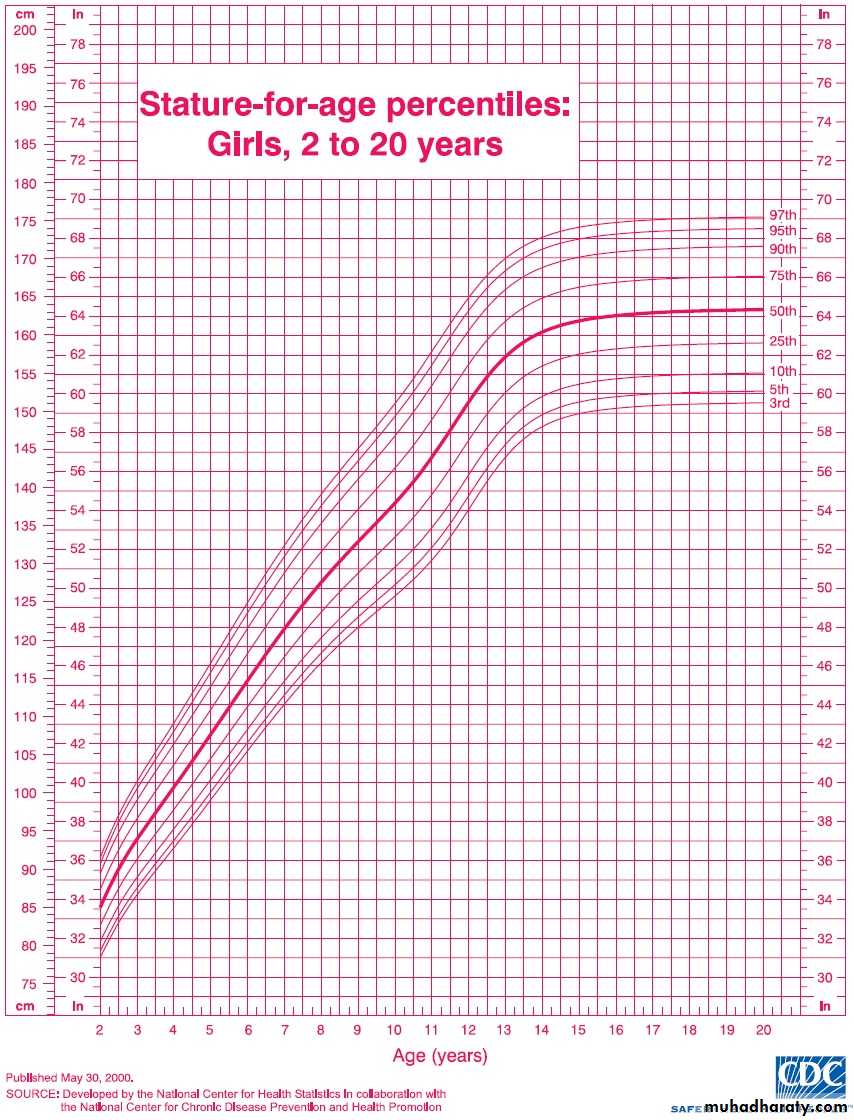
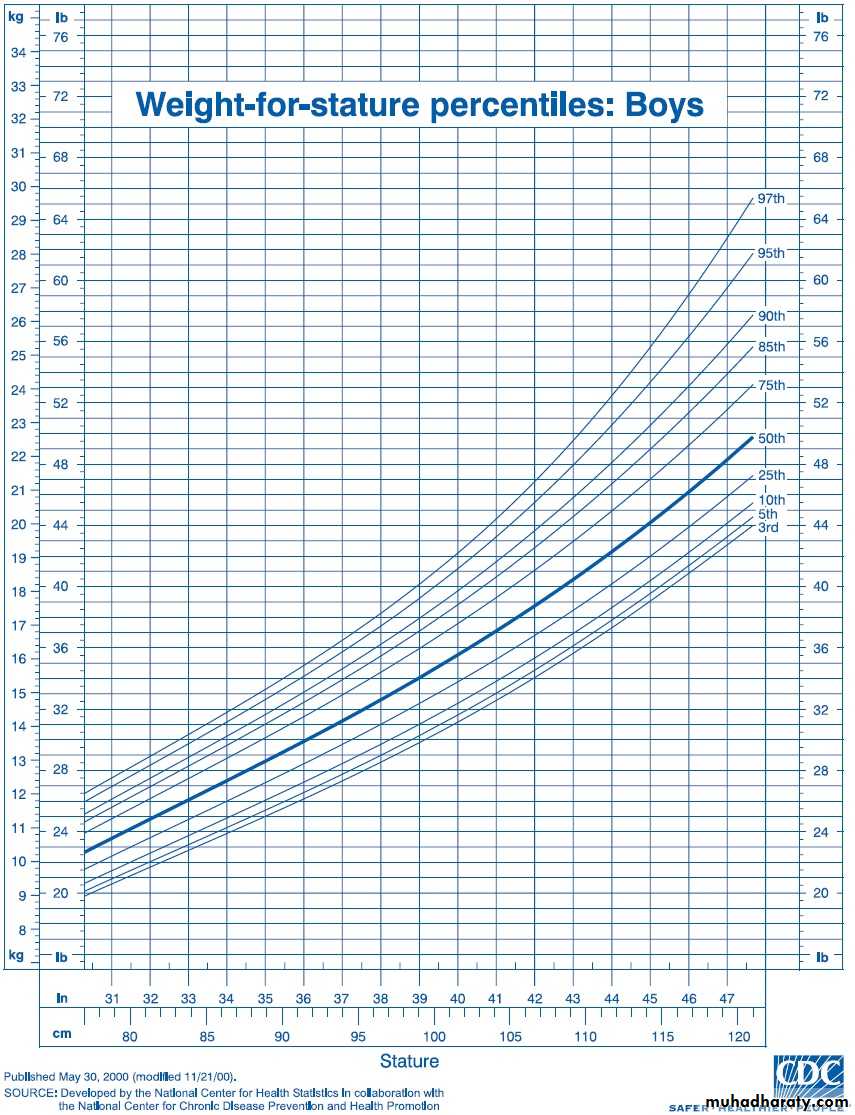
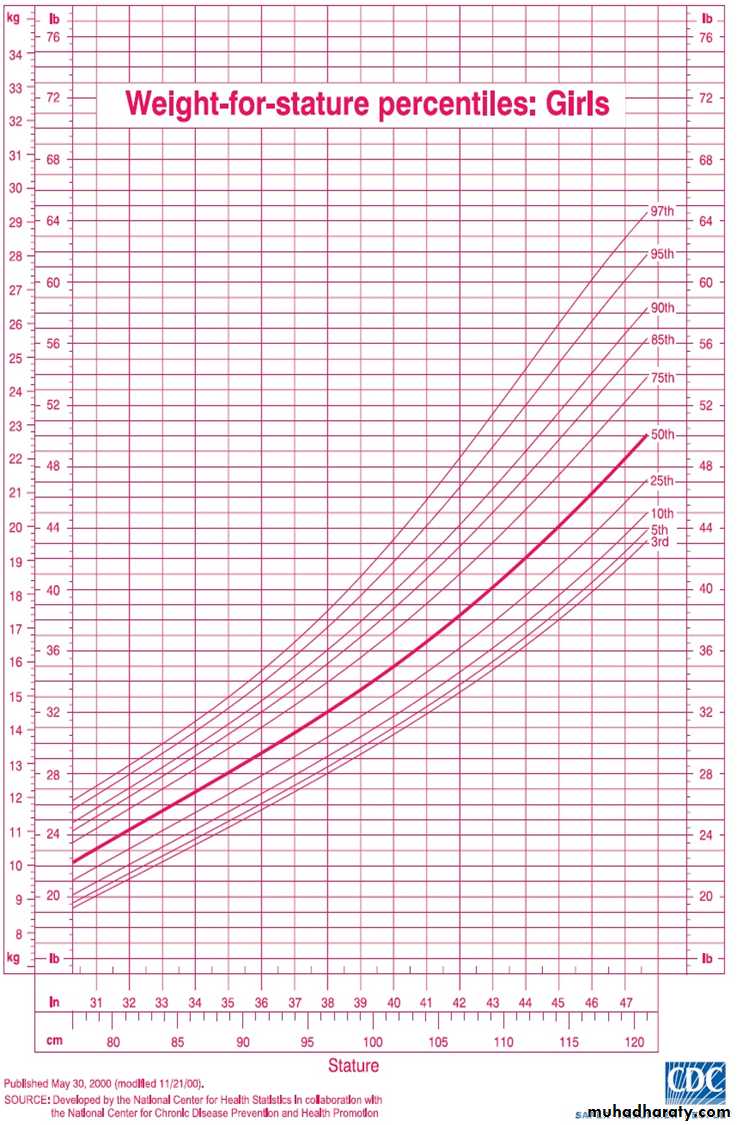
CDC charts
Growth is assessed by plotting accurate measurements on growth charts (Centers for Disease Control ”CDC” charts) and comparing each set of measurements with previous measurements.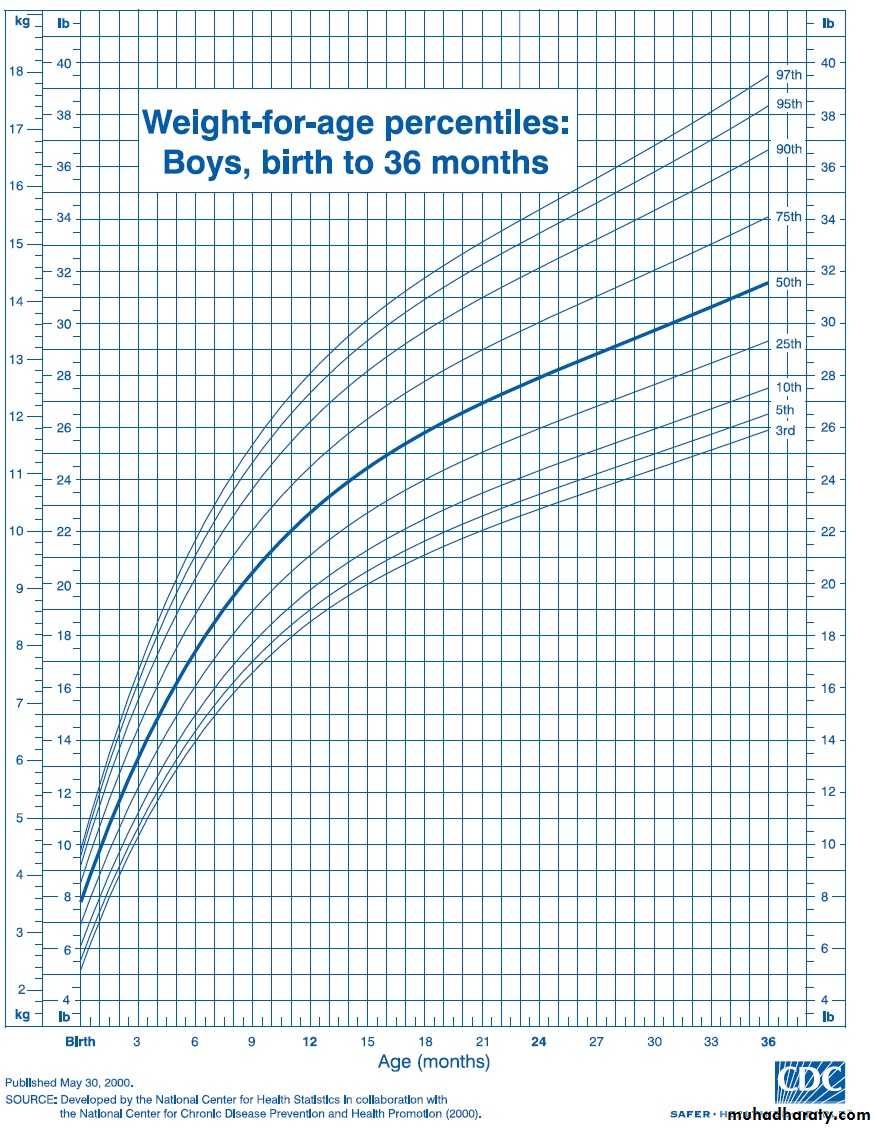
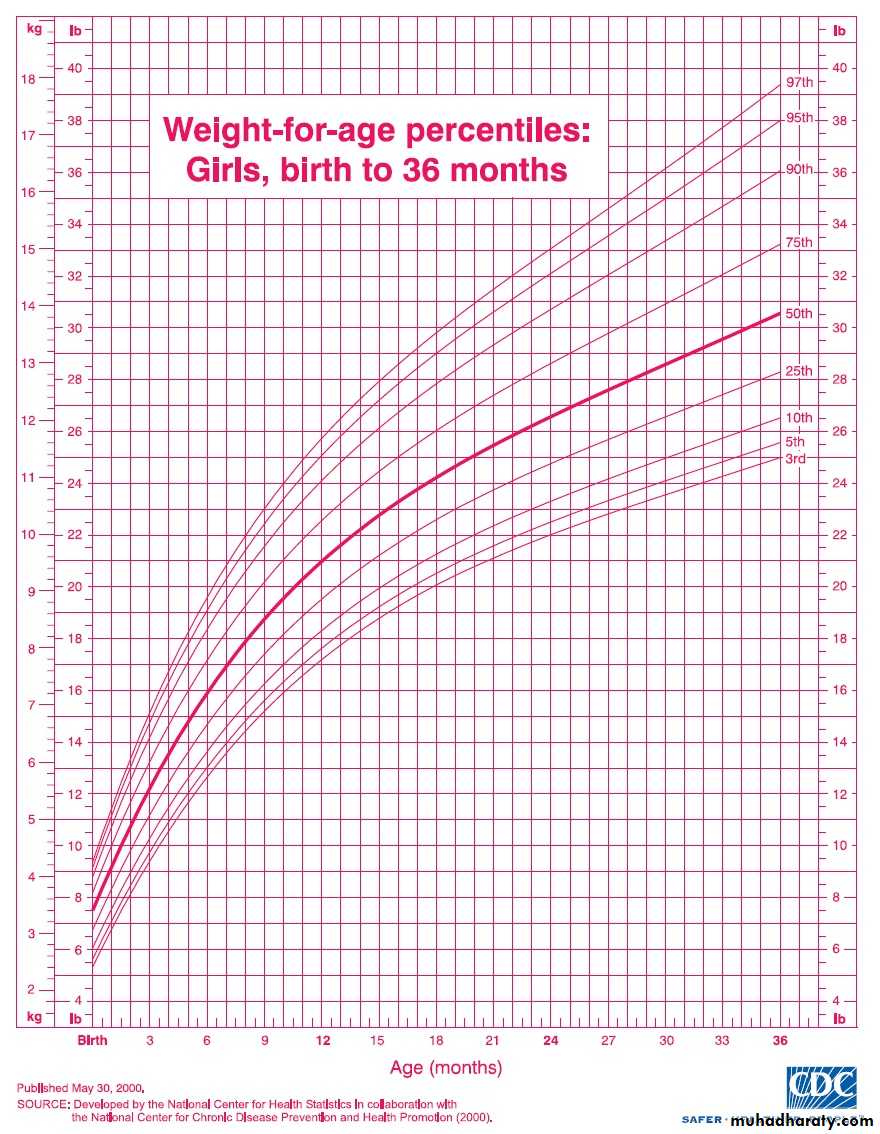
Separate growth charts are available for:
very low birth weight infants (weight <1500 g)Turner syndrome
Down syndromeachondroplasia
other dysmorphology syndromes.
What does "percentile" mean
• Percentiles rank the position of an individual by indicating what percent of the reference population the individual would equal or exceed
E.g. If your 8-month-old son is in the 5th percentile for weight, that means 5% of 8-month-old boys weigh the same as or less than your baby, and 95% weigh more.
If your baby is in the 50th percentile(median) for length, that means he falls right in the middle and is average length for baby boys his age.
Median: is value above & bellow which 50% of the observations lie.

Analysis of Growth Patterns
It is important to correct for various factors in plotting and interpreting growth charts:For premature infants, overdiagnosis of growth failure can be avoided by using growth charts developed specifically for this population.
While VLBW infants may continue to show catch-up growth through early school age, most achieve weight catch-up during the second year and height catch-up by 2.5 yr of age
For children with particularly tall or short parents, there is a risk of overdiagnosing growth disorders if parental height is not taken into account or, conversely, of underdiagnosing growth disorders if parental height is accepted uncritically as the explanation.
mid-parental height is calculated as follows:
Boys: [ Paternal height + Maternal height ] + 6.5
Girls: [ Paternal height + Maternal height ] _ 6.5
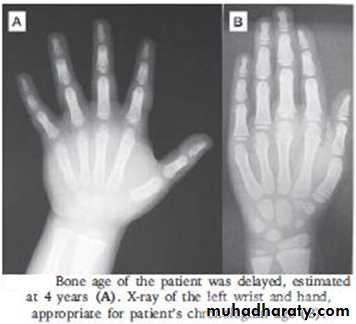
Assesment of Skeletal Growth
An x-ray is taken of the left hand and wrist for the appearance of centers of ossification, it be the same as the chronological age if the child progress normally.In conditions such as hypothyrodism, malnutrition, constitutional delay of growth & puberty & growth hormone deficiency, bone age is delayed.
Skeletal age may be advanced in thyrotoxicosis and precocious puberty.
Assesment of Tissue growth
The forearm X-ray plates used for centers of ossification can used to measure the width of bone, muscle & subcutaneous fat.Subcutaneous fat under the skin of triceps, infrascapular area can be measured with skin fold calipers

Assessment of dental development
Dentition assessed by counting the number of erupted teeth.Deciduous teeth are present from age 6 mo-2yr, and permanent teeth from 6-13 yr.